


-
Chinese wolfberry (Lycium barbarum L.) has been cultivated in China for more than 500 years. Fruit, root bark, and young leaves of this plant have both medicinal and nutritional values[1,2]. As of 2020, more than half of the commercial production of Chinese wolfberry in China comes from the Ningxia region. Furthermore, Chinese wolfberry is an important cash crop in the Ningxia region and generates substantial amounts of household income. Irrigation and fertilizer are two key factors that determine the quantity and quality of the yield of Chinese wolfberry[3]. The average irrigation water utilization efficiency in Ningxia region is only 0.47 which is lower than the country average[4]. The central region of Ningxia in the northwestern China is a typical arid region with an average annual evaporation of 7−8 times the annual precipitation. Therefore, water shortage for agriculture is a huge challenge for developing agricultural production in this region.
With the expansion of Chinese wolfberry cultivation in Ningxia and a decreasing amount of water from the Yellow River, optimization of irrigation, and fertilizer management schemes for Chinese wolfberry production became decisive. Further, improving the irrigation and fertilizer use efficiency is a key issue that needs to be urgently addressed to sustain Chinese wolfberry production. To this end, drip irrigation along with plastic mulching is beneficial to conserving soil moisture, reducing evapotranspiration, and effectively saving water in the arid regions such as central Ningxia[5]. Several studies showed that drip irrigation coupled with plastic mulching increased the yield and water use efficiency of Chinese wolfberry compared to drip irrigation without mulching[6,7].
Water is an essential input for Chinese wolfberry production and many studies showed that sustainable irrigation methods could increase the production and water use efficiency[8,9]. Moreover, Du et al.[10] reported that drip irrigation combined with mulching saved 42% to 60% of the water consumption of Chinese wolfberry compared to traditional border irrigation. When the irrigation quota was 277.5 mm during the growing season of Chinese wolfberry, water use efficiency and dry fruit yield could reach an optimal value. The irrigation quota above 229 mm has decreased the yield of Chinese wolfberry which expresses that excessive irrigation is not conducive to the growth and development of Chinese wolfberry[11]. Ma & Tian[5] reported that the plant height, crown width, chlorophyll, and photosynthetic rate were the highest, and the yield per hectare was 11.6% higher for treatment with film mulching than without mulching for a Chinese wolfberry variety. Sun et al.[12] concluded that drip irrigation under mulch decreased the water and fertilizer consumption by 35%~42% and 20%, respectively, while increasing the yield of Chinese wolfberry by 11.5% compared to border irrigation. Zhang et al.[13] further reported that saving direct labor economy reached CNY¥900 ha−1, and the comprehensive benefit increased by CNY¥3,000 ha−1. In addition, reducing the irrigation quota could minimize the soil salinization which is an important issue in arid regions.
Fertilizer is another key factor which determines the growth and yield of Chinese wolfberry[14]. Chinese wolfberry is a fertilizer-responsive crop and its yield increases with the application of synthetic fertilizers. Dry fruit yield of Chinese wolfberry was within the range of 1,847 to 2,575 kg·ha−1 when the N, P, and K fertilization ratio was 6.6:1.8:3.5[15]. Wu & Zhang[16] reported that under three different soil fertility conditions, fertilizer formulations increased leaf dry weight, leaf area, and chlorophyll content, as well as improved the yield and quality of Chinese wolfberry. Among them, fertilizer formulation with high nitrogen, medium phosphorus, and low potassium had the highest yield and 100-grain weight of Chinese wolfberry. Similarly, Zhang et al.[17] also found that formula mixed chemical fertilizers (N : P2O5 : K2O = 1:0.75:0.5) could improve the yield and quality of Chinese wolfberry, and soil quality compared to conventional chemical fertilizers. Similar findings were reported for similar crops such as tomato, brinjal, black pepper, and strawberry[18−22].
The interaction of irrigation and fertilizer could have better effects on agronomic performances of Chinese wolfberry and resource use efficiencies than the individual effect[23,24]. A combination of irrigation and fertilization could effectively improve the water and fertilizer utilization rates in crops[17,25]. Similar interaction effect of irrigation and fertilizer applications were reported for other horticultural crops namely, apple[26], cherry tomato[27], and mango[8]. Liu & Li[28] established a water and fertilizer production function to predict the yield of Chinese wolfberry using a binary quadratic polynomial regression model and found that medium irrigation (5,010 m3·ha−1) and medium fertilizer (607.50 kg·ha−1) is the optimal application level of irrigation and fertilizer, respectively. This study showed that the influence of irrigation amount on the yield of Chinese wolfberry was greater than the amount of fertilizer, but an excessive amount of fertilizer and irrigation was not conducive to the increase of the yield of Chinese wolfberry. All these studies showed that only the correct combination of irrigation and fertilization could ensure the yield and quality of Chinese wolfberry.
The effect of a single factor such as irrigation, fertilization, and mulching method on agronomic performances of Chinese wolfberry and resource use efficiency was investigated in previous studies. Nonetheless, studies on the interaction effect of water and fertilizer on the growth, yield, and resource use efficiency of Chinese wolfberry are very limited. However, the optimum level of water and fertilizer would enhance productivity and resource use efficiency in Chinese wolfberry, especially in the resource-poor arid regions, and the optimum level could only be quantified by evaluating the interaction effects. Hence, the objective of this study was to determine the optimum level of water and compound fertilizer (i.e., N-P-K inclusive) by evaluating the interaction effects of water and fertilizers on the resource use efficiencies and fruit yield of drip-fertigated Chinese wolfberry. Further, this study aims to provide a reference for optimal resource allocation for effective water and nutrient management of Chinese wolfberry in arid regions.
-
Field experiments were conducted during the Chinese wolfberry growing seasons (April−September) in 2018 and 2019. The experiments were located at the RunDe Chinese wolfberry plantation in Hexi town, Tongxin County, WuZhong City, Ningxia Province, China (36°58'48" N, 105°54'24" E, altitude 1,240 m amsl). This region belongs to an arid zone with a typical continental monsoon climate. The average annual precipitation is around 145−280 mm which is received mostly in July through September. The average annual temperature is recorded at 8.8 °C, while the mean annual sunshine duration amounts to 2,983 h. The frost-free period spans approximately 150 d, with an effective accumulated temperature (calculated by summing the daily temperatures when the daily mean temperature exceeds 10 °C) reaching around 3,397 °C. The drought index is measured at 8.4, and the groundwater depth is determined to be more than 30 m. A decagon micro meteorological monitoring station was installed in an open place 10 m away from the experimental location to monitor meteorological variables. The effective rainfall (≥ 5 mm) during the experimental period was 149 and 155 mm in 2018 and 2019, respectively. The changes in weather variables of daily mean air temperature, rainfall, and reference crop evapotranspiration during the growth period of Chinese wolfberry from 2018 to 2019 are shown in Fig. 1. During the whole growth period of the crop, the temperature and precipitation reached a peak in June to July, and the precipitation was mainly confined to June–September (Fig. 1a). In addition, the variation of reference crop evapotranspiration was similar to that of the temperature (Fig. 1b). In the same period, the reference crop evapotranspiration in 2019 exceeded that of 2018, and the inter-annual variation was inconsistent or irregular.
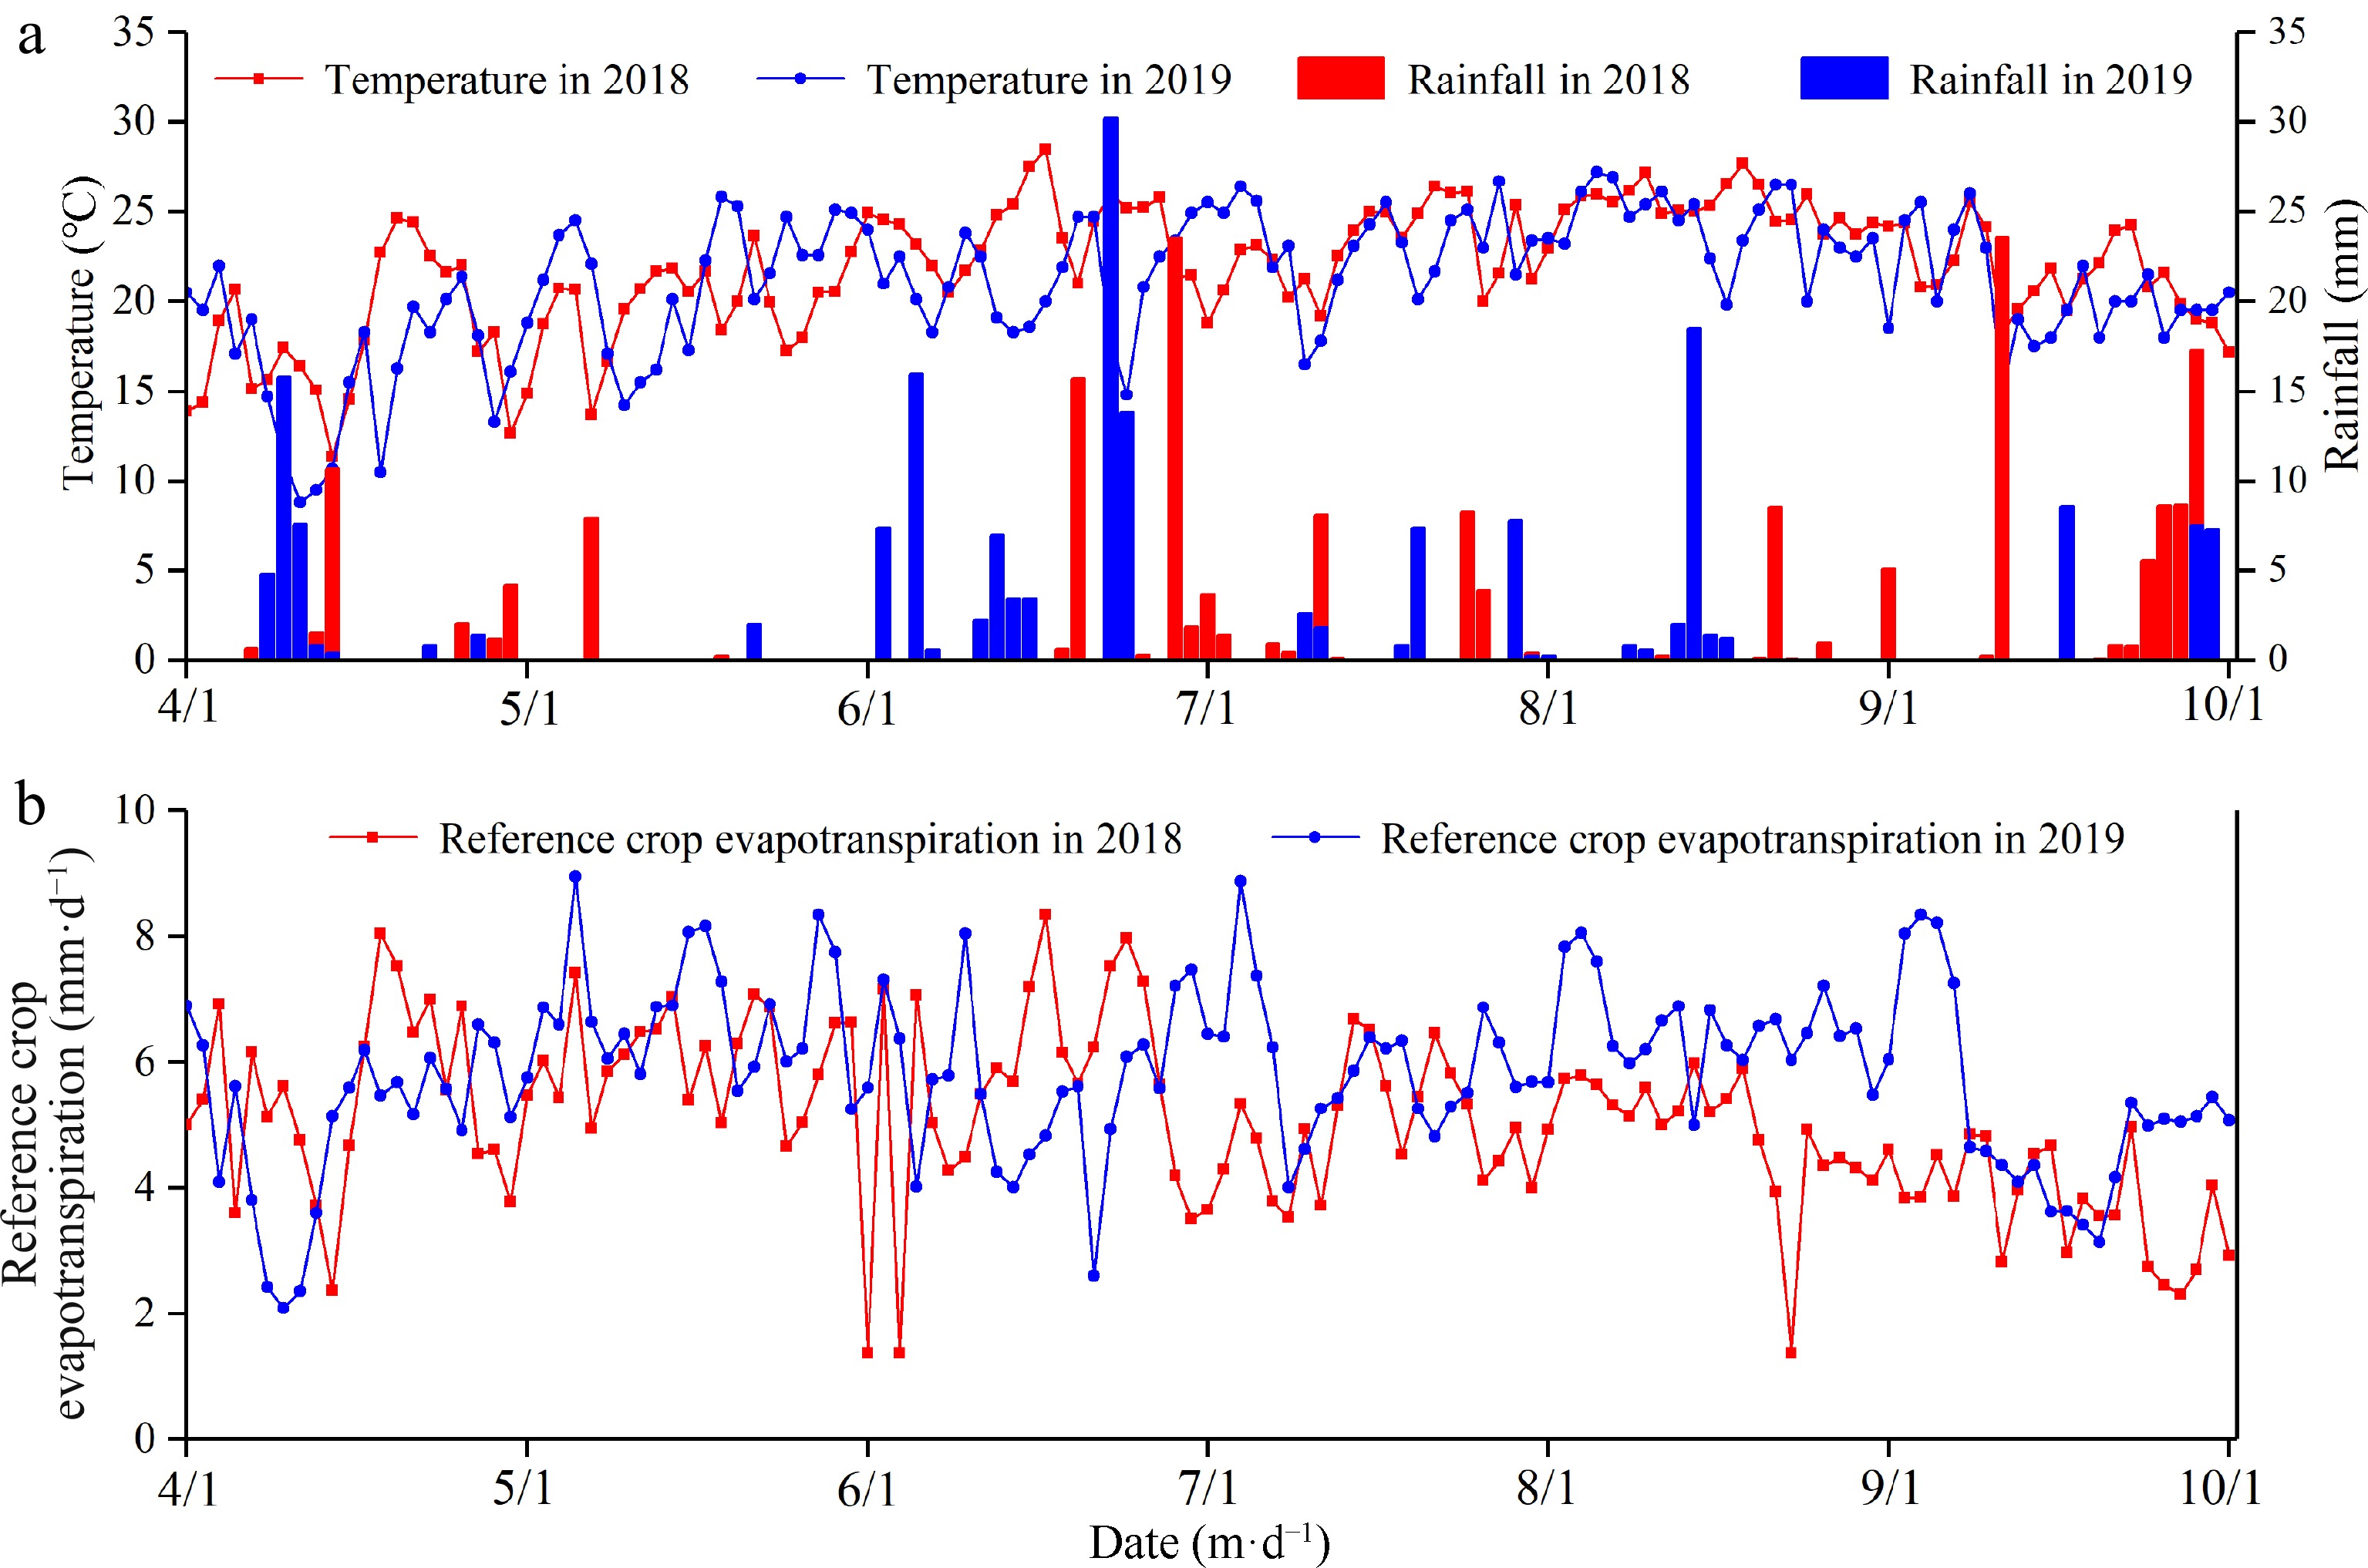
Figure 1.
(a) Daily rainfall and daily mean temperature, and (b) reference crop evapotranspiration (ET0) during the study period in 2018 and 2019.
The physicochemical properties of soil in the experimental field are shown in Table 1. The soil in this region is generally silt loam in texture and most of them are saline-alkaline soils. There were no substantial variations in the measured soil chemical properties across the experimental years. The soil was low in terms of soil carbon and other nutrients, representing most of the marginal soils in the arid regions.
Table 1. Soil physicochemical properties of the experimental site during the study period.
Year pH Organic
matter
(g·kg−1)Total
N
(g·kg−1)Available
N
(mg·kg−1)Available
P
(mg·kg−1)Available
K
(mg·kg−1)Total
salt
(g·kg−1)2018 8.27 9.77 0.41 13.7 4.87 112 2.22 2019 8.25 9.95 0.47 14.2 5.64 91 2.09 Experimental design and treatment combinations
-
A popular variety 'Ningqi No.7' of Chinese wolfberry crop at the 4-year maturity stage was selected for this study and the crops were already established in a 75 and 300 cm spacing (Fig. 2). A 60 cm wide plastic film strip was laid on the cropping line to mulch the soil. Nearly 240 cm of intercrop space was uncovered and exposed to the environment (Fig. 2). A drip irrigation pipe with 16 mm inner diameter was used for irrigation and it was kept 5 cm away from the Chinese wolfberry tree (Fig. 2). The average discharge rate of the pipe was 3.0 L·h−1 and the amount of irrigation is controlled by an electronic water meter mounted on a drip irrigation pipe. Spring irrigation and winter irrigations were 300 and 450 m3·ha−1, respectively.
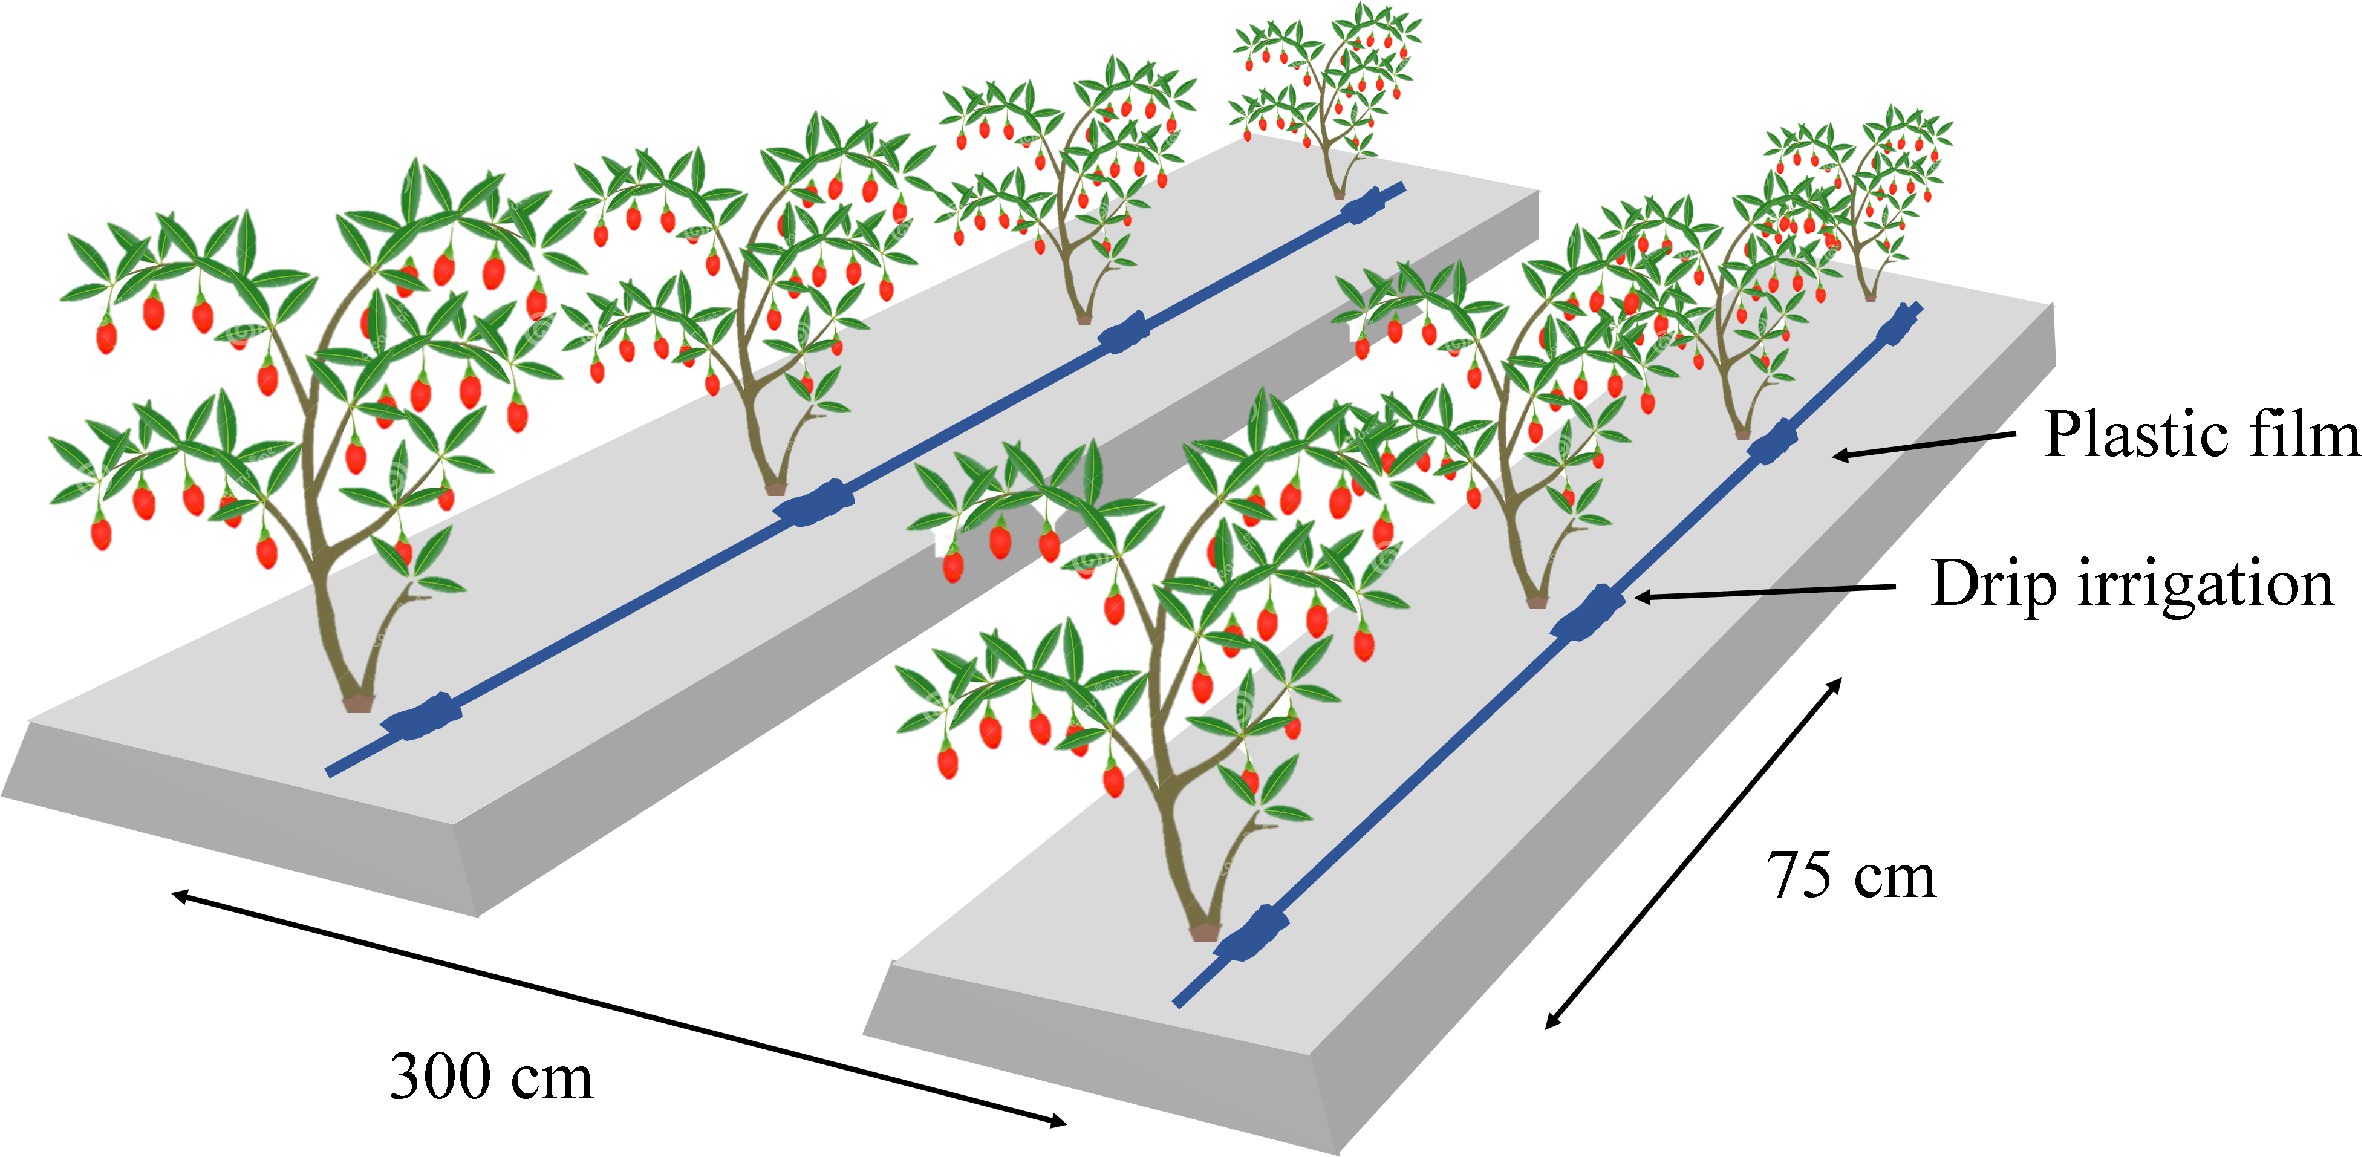
Figure 2.
The layout of the plants, spacing, and drip irrigation used in the field experiments.
Three levels of drip irrigation and three levels of fertilization were arranged in a randomized complete two-factor factorial block design and each treatment was replicated three times. The irrigation levels were selected considering the historical precipitation and evapotranspiration of the study area. Three levels of drip irrigation were applied based on reference crop evapotranspiration (ET0), which were low irrigation (65% ET0, W1), medium irrigation (85% ET0, W2), and high irrigation (105% ET0, W3) as presented in Table 2. In this study, the application of fertilizer treatments involved the application of a compound fertilizer which consisted of a combination of all three N-P-K fertilizers. Three levels of N-P2O5-K2O fertilizer treatments were 135-45-90 (F1), 180-60-120 (F2), and 225-75-150 (F3) kg·ha−1. Each treatment plot had a row of ten Chinese wolfberry trees.
Table 2. Irrigation scheduling of Chinese wolfberry during the two years of experiments.
Year Growth stage Irrigation
date (m/d)Number of irrigation Irrigation (mm) Low (W1) Medium (W2) High (W3) 2018 Spring slightly growing stage 5/4 1 17.8 23.3 28.8 Flowering stage 5/17 2 22.6 29.6 36.5 6/2 3 26.3 34.5 42.6 Fruit ripening stage 6/19 4 39.3 51.4 63.5 7/5 5 30.6 40.0 49.5 7/21 6 26.7 34.9 43.1 Deciduous stage 8/4 7 24.3 31.7 39.2 Total 187.6 245.4 303.2 2019 Spring slightly growing stage 5/5 1 18.3 24.0 29.6 Flowering stage 5/19 2 24.5 32.1 39.2 6/4 3 38.7 50.7 62.6 Fruit ripening stage 6/20 4 35.2 46.1 56.9 7/3 5 30.3 39.6 48.9 7/13 6 27.4 35.8 44.2 Deciduous stage 8/5 7 25.7 33.6 41.5 Total 200.1 261.9 322.9 Fertilizers namely urea (N 46%), superphosphate (P2O5 44%), and potassium chloride (K2O 60%) were applied a total of seven times to the fields at different growth stages of the crop. The fertilizer was fertigated with drip irrigation at the middle stage in each irrigation event. The supply of fertilizer for different growth stages were; 20% at the spring slightly growing stage (one time), 20% at the flowering stage (two times equal application), 50% at the fruit ripening stage (three times equal application), and 10% at the deciduous stage (one time). Separate differential pressure tanks with 13 L capacity were used to set up fertigation of each treatment plot.
Measurements and calculations
Growth measurements
-
The plant height and leaf area of Chinese wolfberry were measured for three trees from each plot which were randomly selected in each measurement. The plant height was measured using a meter stick for three replicates and the average value of each growth stage was calculated. A portable leaf area meter (CI-202, CID Bioscience, Camas, WA, USA) was used to measure the leaf area. Three sample plants were calibrated in each plot, and the maximum leaf area of the sample plants at each growth stage was taken as the leaf area value of the plot.
Yield measurements
-
Chinese wolfberry crops bear fruit for two seasons namely summer and autumn. Generally, the quality and yield of autumn fruits are relatively low and therefore, the yield of summer fruits was only considered in this study. The yield can be categorized into dry fruit yield and fresh fruit yield, with dry fruit being more convenient for preservation and transportation compared to fresh fruit. Hence, this study adopts dry fruit yield as the standard for evaluation. Summer fruits were harvested in late June (first pick), early July (second pick), mid-July (third pick), late July (fourth pick), and early August (fifth pick). A total of 10 Chinese wolfberry trees were harvested from each treatment plot in both years. The harvested fruits were subjected to gradient drying under the following combinations of temperature and time; 40 °C - 2 h, 45 °C - 15 h, 55 °C - 15 h and 65 °C - 6 h. The dried weight of 100 grains for a plot was repeated and the maximum value of the mean was taken as the weight of 100-grain Chinese wolfberry.
Water consumption and water use efficiency
-
Water consumption was calculated based on the water balance equation (Eqn 1)[29].
$ ET=I+P+U-R-D-\Delta W $ (1) where, ET is evapotranspiration (mm), I is irrigation amount (mm), P is rainfall (mm), U is groundwater recharge (mm), R is runoff (mm), D is deep percolation (mm), and
$ \Delta W $ $ ET=I+P-\Delta W $ (2) The irrigation amount was calculated based on the reference crop evapotranspiration (ET0) using the Penman-Monteith equation[30].
Water use efficiency (WUE) was calculated based on Badr et al.[25] as follows,
$ W U E=Y/ET $ (3) where, WUE is water use efficiency (kg·m−3), Y is dry fruit yield (kg·ha−1) and ET is evapotranspiration (mm).
Partial factor productivity of fertilizer (PFP)
-
The partial factor productivity of fertilizer was calculated as proposed by Ierna et al.[31] using the following formula,
$ P F P=Y/{F}_{T} $ (4) where, PFP is partial factor productivity of fertilizer (kg·kg−1), Y is yield (kg·ha−1) and FT is the total amount of N-P2O5-K2O fertilizer (kg·ha−1).
Economic benefit (E)
-
The economic benefit was calculated using a simple benefit-cost analysis as shown in Eqn 5.
$ E={G}_{w}-{W}_{w}-{F}_{w}-{H}_{w}-{O}_{w} $ (5) where, E is Economic benefits (CNY¥·ha−1), Gw is the gross profit, Ww is the water fee, Fw is the fertilizer cost, Hw is the harvesting cost, and Ow is other costs (pesticides, weeding, etc.).
Data analysis
-
The data were analyzed using the analysis of variance (ANOVA) procedure for the factorial experiments and mean separation was performed using least significance differences (LSD) at the 5% level. The SPSS 19.0 software (Chicago, IL, USA) was used in statistical analysis and the Matlab (Version 2016b, Natick, MA, USA) was used to calculate the evaluation values. The Origin (Version 2018, Irvine, CA, USA) was used for graphical visualization.
-
In both years, plant height was significantly (p < 0.05) affected by irrigation, but not significantly influenced by fertilization. Although the interaction of irrigation and fertilizer was not significant on plant height in 2018, it was significant (p < 0.05) in 2019 (Table 3). The plant height showed an unclear relationship with fertilization rate under the same level of irrigation in both years (Fig 3). Similarly, the relationship between plant height and irrigation level was random at the same fertilizer application level for both years (Fig 3). It is because of the synergistic effect of water and fertilization on plant height from the measured data, as shown in Table 3. Under the same irrigation and fertilization level, the average plant height in 2018 was 2%−12% higher than that in 2019.
Table 3. Level of significance of growth parameters and yield under different irrigation and fertilizer treatments in 2018 and 2019.
Treatment Plant height Leaf area Yield 2018 2019 2018 2019 2018 2019 Level of significance Irrigation * * * ** * * Fertilization ns ns ns * * ns Irrigation × fertilization ns * ns ns ** ** * means significant at the 0.05 probability level, ** means significant at the 0.01 probability level, and ns means non-significant. 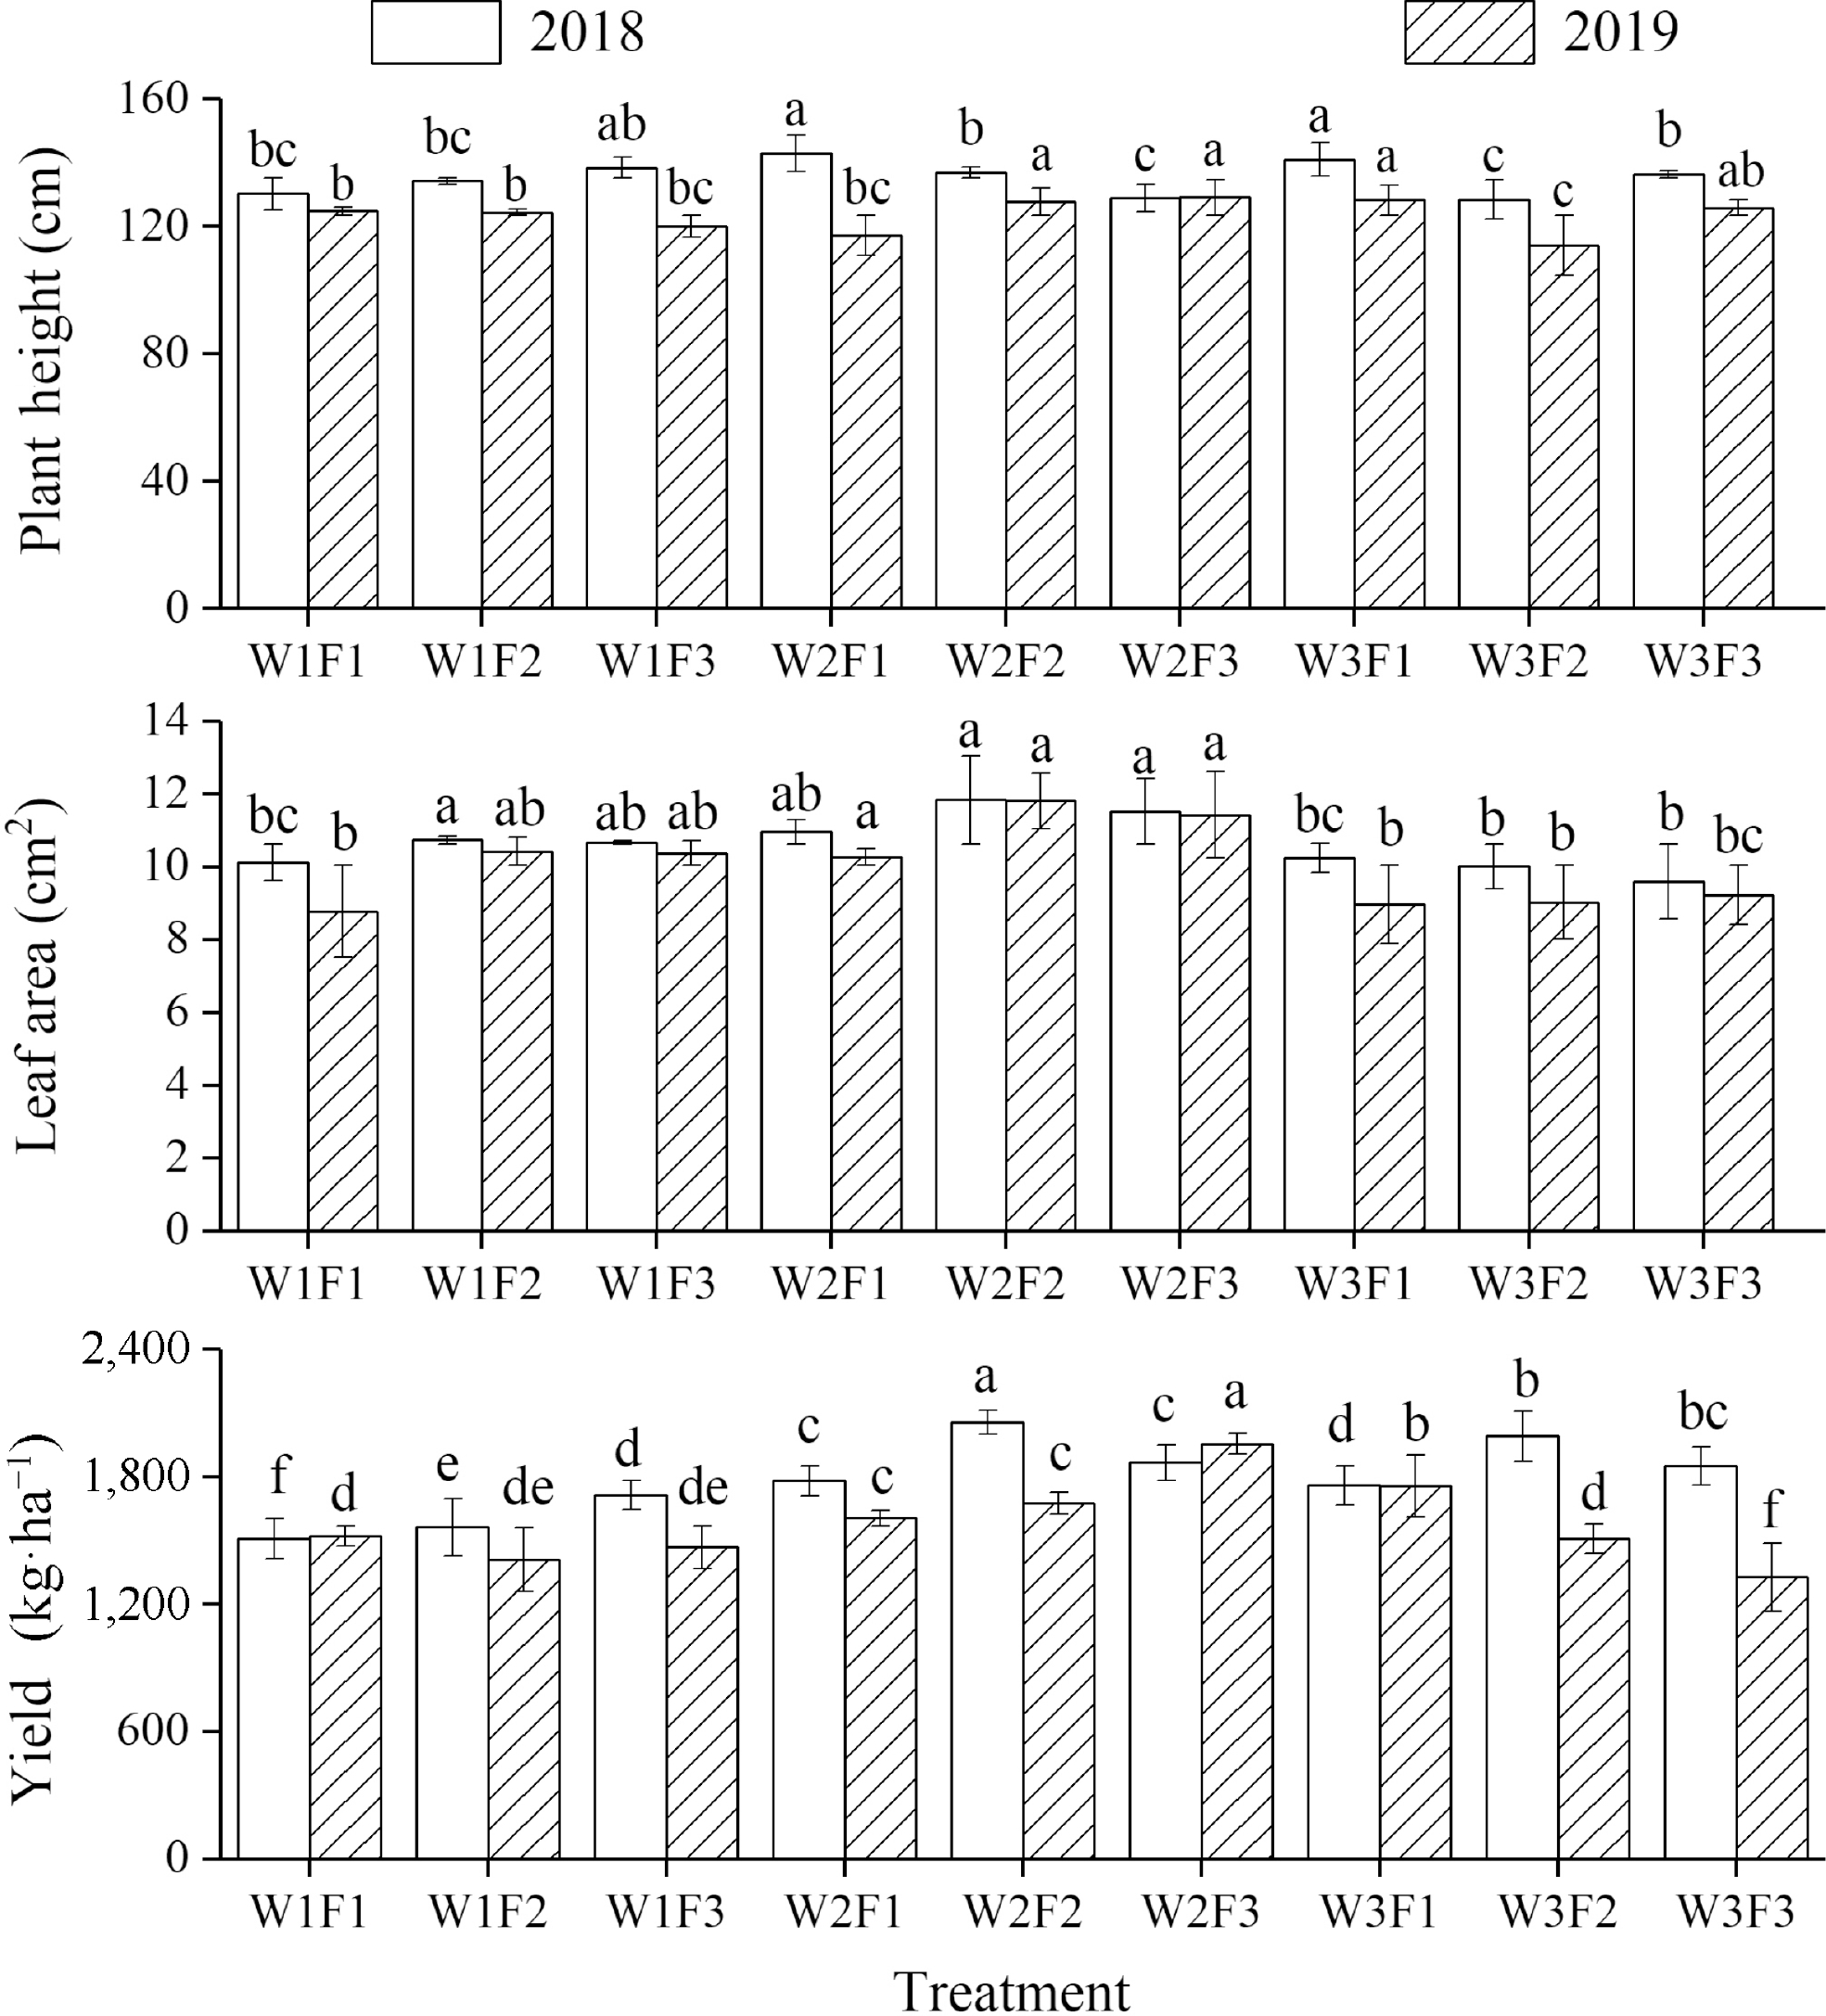
Figure 3.
Effects of different irrigation and fertilizer treatments on plant height, leaf area, and yield in 2018 and 2019. Error bars show the standard error (n = 3). Different letters on top of the bar indicate a significant difference for the means at p < 0.05 according to the LSD test.
The interaction effect of irrigation and fertilization was not significant on the leaf area in both years. Irrigation exhibited a significant effect (p < 0.05) on the leaf area in 2018 and it was strongly significant (p < 0.01) in 2019. Fertilization did not significantly influence leaf area in 2018 but it was significant in 2019 (Table 3). Generally, the leaf area was smaller in 2019 than the previous year (Fig. 3). This could be due to dryer weather in 2019 compared to the year 2018, which appears to decrease the leaf area.
In both years, irrigation and fertilization had a strong significant interaction effect on yield (p < 0.01) (Table 3). At low-level irrigation (65% ET0, W1), the yield of Chinese wolfberry significantly (p < 0.05) increased with the increasing fertilization rate in 2018. The lowest yield (1,506 kg·ha−1) in 2018 was recorded for W1F1 treatment whereas the highest yield (2,056 kg·ha−1) was observed for W2F2 treatment. At the irrigation level of W2, the yield increased first and then decreased with increasing fertilizer application, and the highest yield (2,356 kg·ha−1) was received for W2F2 treatment in 2018 (Fig. 3). At the W1 irrigation level, the yield was not significantly different between different fertilizer treatments for 2019. The W3F3 treatment provided the lowest yield (1,325 kg·ha−1) while the highest was observed in the W2F3 treatment (1,954 kg·ha−1) in 2019. Under the high irrigation regime (105% ET0, W3), increasing fertilizer levels decreased the yield significantly (p < 0.05) (Fig. 3). For F1 and F2 fertilization levels, the yield significantly increased (p < 0.05) initially and declined thereafter with increasing irrigation levels in 2018 (Fig. 3). Nevertheless, this trend was not seen in the F3 treatment. For F2 and F3 fertilizer application levels, increasing irrigation levels significantly (p < 0.05) increased the yield initially and then significantly (p < 0.05) decreased during the year 2019 (Fig. 3). For the same year, yield significantly (p < 0.05) increased with increasing irrigation levels for F1 fertilizer treatment.
In general, the W3F1 treatment showed the highest plant height in both years and the leaf area was highest for W1F2, W1F3, W2F1, W2F2, and W2F3 treatment combinations over the two years. However, the highest yield was obtained with W2F2 and W2F3 treatments in 2018 and 1019, respectively (Fig. 3).
Overall, under the same irrigation and fertilization regime, the changes in leaf area and yield were similar. However, the changes in plant height of Chinese wolfberry were not uniform. In 2018, the yield of Chinese wolfberry reached the highest under the medium irrigation-fertilizer regime (W2F2), while in 2019, the highest yield was obtained under the medium irrigation and high fertilization (W2F3). Accordingly, the medium irrigation level could be the key to obtaining high yield in Chinese wolfberry. Furthermore, the interaction effect of irrigation and fertilization was highly significant on yield than plant height and leaf area (Table 3).
Water use efficiency (WUE) and partial factor productivity (PFP) of fertilizer
-
Water use efficiency (WUE) was significantly (p < 0.05) influenced by irrigation in 2019 and it was strongly significant (p < 0.01) in 2018 (Table 4). Fertilization had no significant effect on WUE in 2019, and conversely, it showed a significant effect in 2018 (p < 0.05). The interaction of irrigation and fertilization had a significant effect on WUE in both years. The highest WUE (0.55 kg·m−3) was attained for W2F2 treatment, and it was 40%−41% higher than the lowest values (W3F1 and W3F3) in 2018. The highest WUE value in 2019 was recorded for the W2F3 treatment (0.39 kg·m−3) and it was 41 % greater than the lowest value obtained for the W3F3 treatment (Table 4).
Table 4. Treatment effects on water use efficiency (kg·m−3) and partial factor productivity of fertilizer (kg·kg−1).
Treatment Water use efficiency
(kg·m−3)Partial factor
productivity of
fertilizer (kg·kg−1)2018 2019 2018 2019 W1F1 0.42d 0.34b 5.58b 4.89b W1F2 0.43c 0.31cd 4.40cd 3.36cd W1F3 0.47b 0.33bc 4.34d 3.24d W2F1 0.42d 0.32c 6.59a 5.2a W2F2 0.55a 0.31cd 6.55a 3.82c W2F3 0.44c 0.39a 4.78c 4.5b W3F1 0.37ef 0.32c 6.52a 5.76a W3F2 0.42d 0.27d 5.55b 3.63c W3F3 0.39e 0.23e 4.75c 2.89e Level of significance Irrigation ** * * * Fertilization * ns ** ** Irrigation × fertilization * * * * Means with different letters are significantly different (p < 0.05) based on the LSD test. * Means significant at the 0.05 probability level, ** means significant at the 0.01 probability level, and ns means non-significant. The interaction effect of irrigation and fertilization was significant (p < 0.05) in PFP during both years (Table 4). The maximum values for PFP were recorded with W2F1, W2F2, and W3F1 treatments in 2018 and the corresponding PFP values were 6.59, 6.55, and 6.52 kg·kg−1, respectively. The lowest values in 2018 were observed for W1F2, and W1F3 treatments which were 4.40 and 4.34 kg·kg−1, respectively. At a higher level of irrigation (W3), PFP decreased with increasing fertilizer application rate in 2018 (Table 4).
In 2019, the maximum values for PFP were 5.2 and 5.76 kg·kg−1 for W2F1 and W3F1 treatments, respectively. The W1F3 treatment exhibited the lowest PFP value (3.24 kg·kg−1) in 2019. In the same year, the irrigation levels W1 and W3 showed a similar trend on PFP to that of 2018 with increasing fertilization levels (Table 4).
In general, under W1 and W2 irrigation levels, PFP decreased with increasing fertilizer application rates. Furthermore, under the low fertilization level (F1), PFP increased with increasing level of irrigation. The PFP reached the minimum value at W3F3 for the year 2019, which could be an indication that the yield of Chinese wolfberry can be retarded under the high level of irrigation and fertilization.
Economic benefits
-
At present, Chinese wolfberry cultivation provides an annual comprehensive output value of 13 billion RMB and an average annual income of CNY¥13,500 to 195,000 ha−1[32]. The effect of different irrigation and fertilization treatments on economic benefits in 2018 and 2019 were estimated and presented in Table 5. The economic benefits in 2018 and 2019 were between CNY¥155,596 ha−1 (W1F1) to CNY¥218,001 ha−1 (W2F2), and CNY¥132,423 ha−1 (W3F3) to CNY¥205,199 ha−1 (W2F3), respectively. In 2018 and 2019, the highest economic benefits were higher by 28.5% and 35.5% compared to the lowest economic benefits, respectively. This result indicates that a higher level of irrigation and fertilization do not always maximize the economic benefits, thus emphasizing the requirement for an optimum level of irrigation and fertilizer management for Chinese wolfberry production.
Table 5. Effects of different irrigation and fertilization treatments on economic benefits.
Treatment Water fee
(CNY¥ ha−1)Fertilizer cost
(CNY¥ ha−1)Harvesting cost
(CNY¥ ha−1)Other costs
(CNY¥ ha−1)Gross profit
(CNY¥ ha−1)Economic benefits
(CNY¥ ha−1)2018 2019 2018 2019 2018 2019 2018 2019 2018 2019 2018 2019 W1F1 500 534 2,878 6,778 6,847 15,000 180,752 182,584 155,596 157,325 W1F2 500 534 3,838 7,027 6,344 15,000 187,375 169,178 161,010 143,462 W1F3 500 534 4,797 7,706 6,606 15,000 205,499 176,150 177,496 149,213 W2F1 654 698 2,878 8,010 7,218 15,000 213,607 192,474 187,065 166,680 W2F2 654 698 3838 9,253 7,536 15,000 246,746 200,947 218,001 173,875 W2F3 654 698 4,797 8,397 8,793 15,000 223,925 234,487 195,077 205,199 W3F1 808 862 2,878 7,917 7,900 15,000 211,108 210,656 184,505 184,016 W3F2 808 862 3,838 8,958 6,785 15,000 238,883 180,940 210,279 154,455 W3F3 808 862 4,797 8,330 5,964 15,000 222,120 159,046 193,185 132,423 The water fee is the smallest proportion of the total expenditure and the cost difference of the water fee between treatments is also small. The low cost of water fees and considerable economic losses in cutting down irrigation levels are the major reasons for the lack of interest by farmers in water saving. Suboptimal or super-optimal application of water and fertilizer not only affect the economic return but also waste a very competitive resource like water.
Interaction effect of water and fertilizer on yield, WUE, PFP, and economic benefits
-
Farmers cultivating Chinese wolfberry aim at high economic return and it is usually considered that a high water and fertilizer input would increase the economic return. However, the results of this study showed that higher irrigation and fertilization levels increased the yield of Chinese wolfberry only up to a certain extent, usually referred to as an optimum level of input. Application beyond this level has led to economic loss, and reduction of water use efficiency and PFP. Moreover, excessive use of chemical fertilizer deteriorates the soil health, increases fertilizer loss to the environment, causing soil and water pollution, and eventually affecting the sustainability of agriculture[14]. Water use efficiency, economic benefits and ecologically sound crop production are the keys to sustainable agricultural development in arid regions. Therefore, the Chinese wolfberry yield, WUE, PFP, and economic benefits were selected as targeting variables for the optimization process of relevant inputs.
Based on the least square method, four binary quadratic regression equations were established, considering irrigation and fertilizer levels as the independent variables and Chinese wolfberry yield, WUE, PFP, and economic benefits as the dependent variables (Table 6). In addition, the amount of irrigation and fertilization were calculated when the above dependent variables were maximized (Table 7).
Table 6. Regression equations between irrigation and fertilization inputs and yield, WUE, PFP and economic benefits.
Dependent variable/Y Regression equation R2 P Yield/Y1 Y1 = −4120.2737 + 37.5905I + 5.7081Y − 0.0628I2 − 0.0031F2 − 0.0129IF
0.67 * (0.037) WUE/Y2 Y2 = −0.7415 + 0.007I + 0.0018F − 0.000013I2 − 0.00000144F2 − 0.000003IF
0.63 * (0.043) PFP/Y3 Y3 = −3.233 + 0.122I − 0.0325F − 0.0002I2 + 0.000047F2 − 0.000043IF
0.74 * (0.029) Economic benefits/Y4 Y4 = −490877.3168 + 4339.0072I + 648.5543F − 7.2545I2 − 0.3537F2 − 1.4897IF
0.67 * (0.038) I and F represent the amounts of irrigation and fertilization, respectively. * Means significant at the 0.05 probability level. Table 7. The optimum level of irrigation and fertilization for maximum yield, WUE, PFP, and economic benefits.
Dependent variable/Y Maximum value of dependent variable Irrigation
amount
(mm)Fertilization
(N-P2O5-K2O)
(kg·ha−1)Yield/Y1 1859.74 259.7 192-64-128 WUE/Y2 0.42 225.5 204-68-136 PFP/Y3 6.31 269.5 135-45-90 Economic benefits/Y4 195,101.33 261.5 183-61-122 It is difficult to obtain the maximum yield, WUE, PFP, and economic benefits simultaneously. When the amount of irrigation and fertilization (N-P2O5-K2O) were 259.7 mm and 192-64-128 kg·ha−1, respectively, the Chinese wolfberry yield reached the maximum of 1,859.74 kg·ha−1. The WUE reached the maximum of 0.42 kg·m−3 at the amount of irrigation and fertilization (N-P2O5-K2O) of 225.5 mm and 204-68-136 kg·ha−1, respectively. The greatest PFP (6.3 kg·kg−1) was achieved at 269.5 mm and 135-45-90 kg·ha−1 irrigation and fertilization (N-P2O5-K2O) levels, respectively. The maximum economic benefit of CNY¥195,101 ha−1 was achieved with the irrigation and fertilization application of 261.5 mm and 183-61-122 kg·ha−1 of (N-P2O5-K2O), respectively. The irrigation amount at the time of the highest economic benefit was 0.67% higher than that at the time of the highest yield, and the corresponding fertilizer application amount was 4.86% lower than that at the time of the highest yield.
The WUE reached the maximum at a 13.8% lower irrigation amount and 10 % higher fertilization rate than the maximum economic benefit point. The amount of irrigation and fertilization rate was higher than 3% and 26.3%, respectively, for the highest PFP compared to the highest economic benefits.
The interaction effect of irrigation and fertilization inputs on yield, WUE, and economic benefits showed a downward convex shape, while the PFP decreased with increasing fertilization application (Fig. 4). The maxima of yield, WUE, and economic benefits were reached at similar levels of irrigation and fertilization, however, input values to maximize the PFP differs greatly from the other three indicators. Ecological sustainability, water and fertilizer savings are the goals of our multi-objective optimization problem to achieve high yield and high economic benefits. A comprehensive evaluation method by combining the entropy weight method and the Technique for Order Preference by Similarity to Ideal Solution (TOPSIS) was established to evaluate each irrigation and fertilization treatment in 2018 and 2019, as shown in Fig. 5.
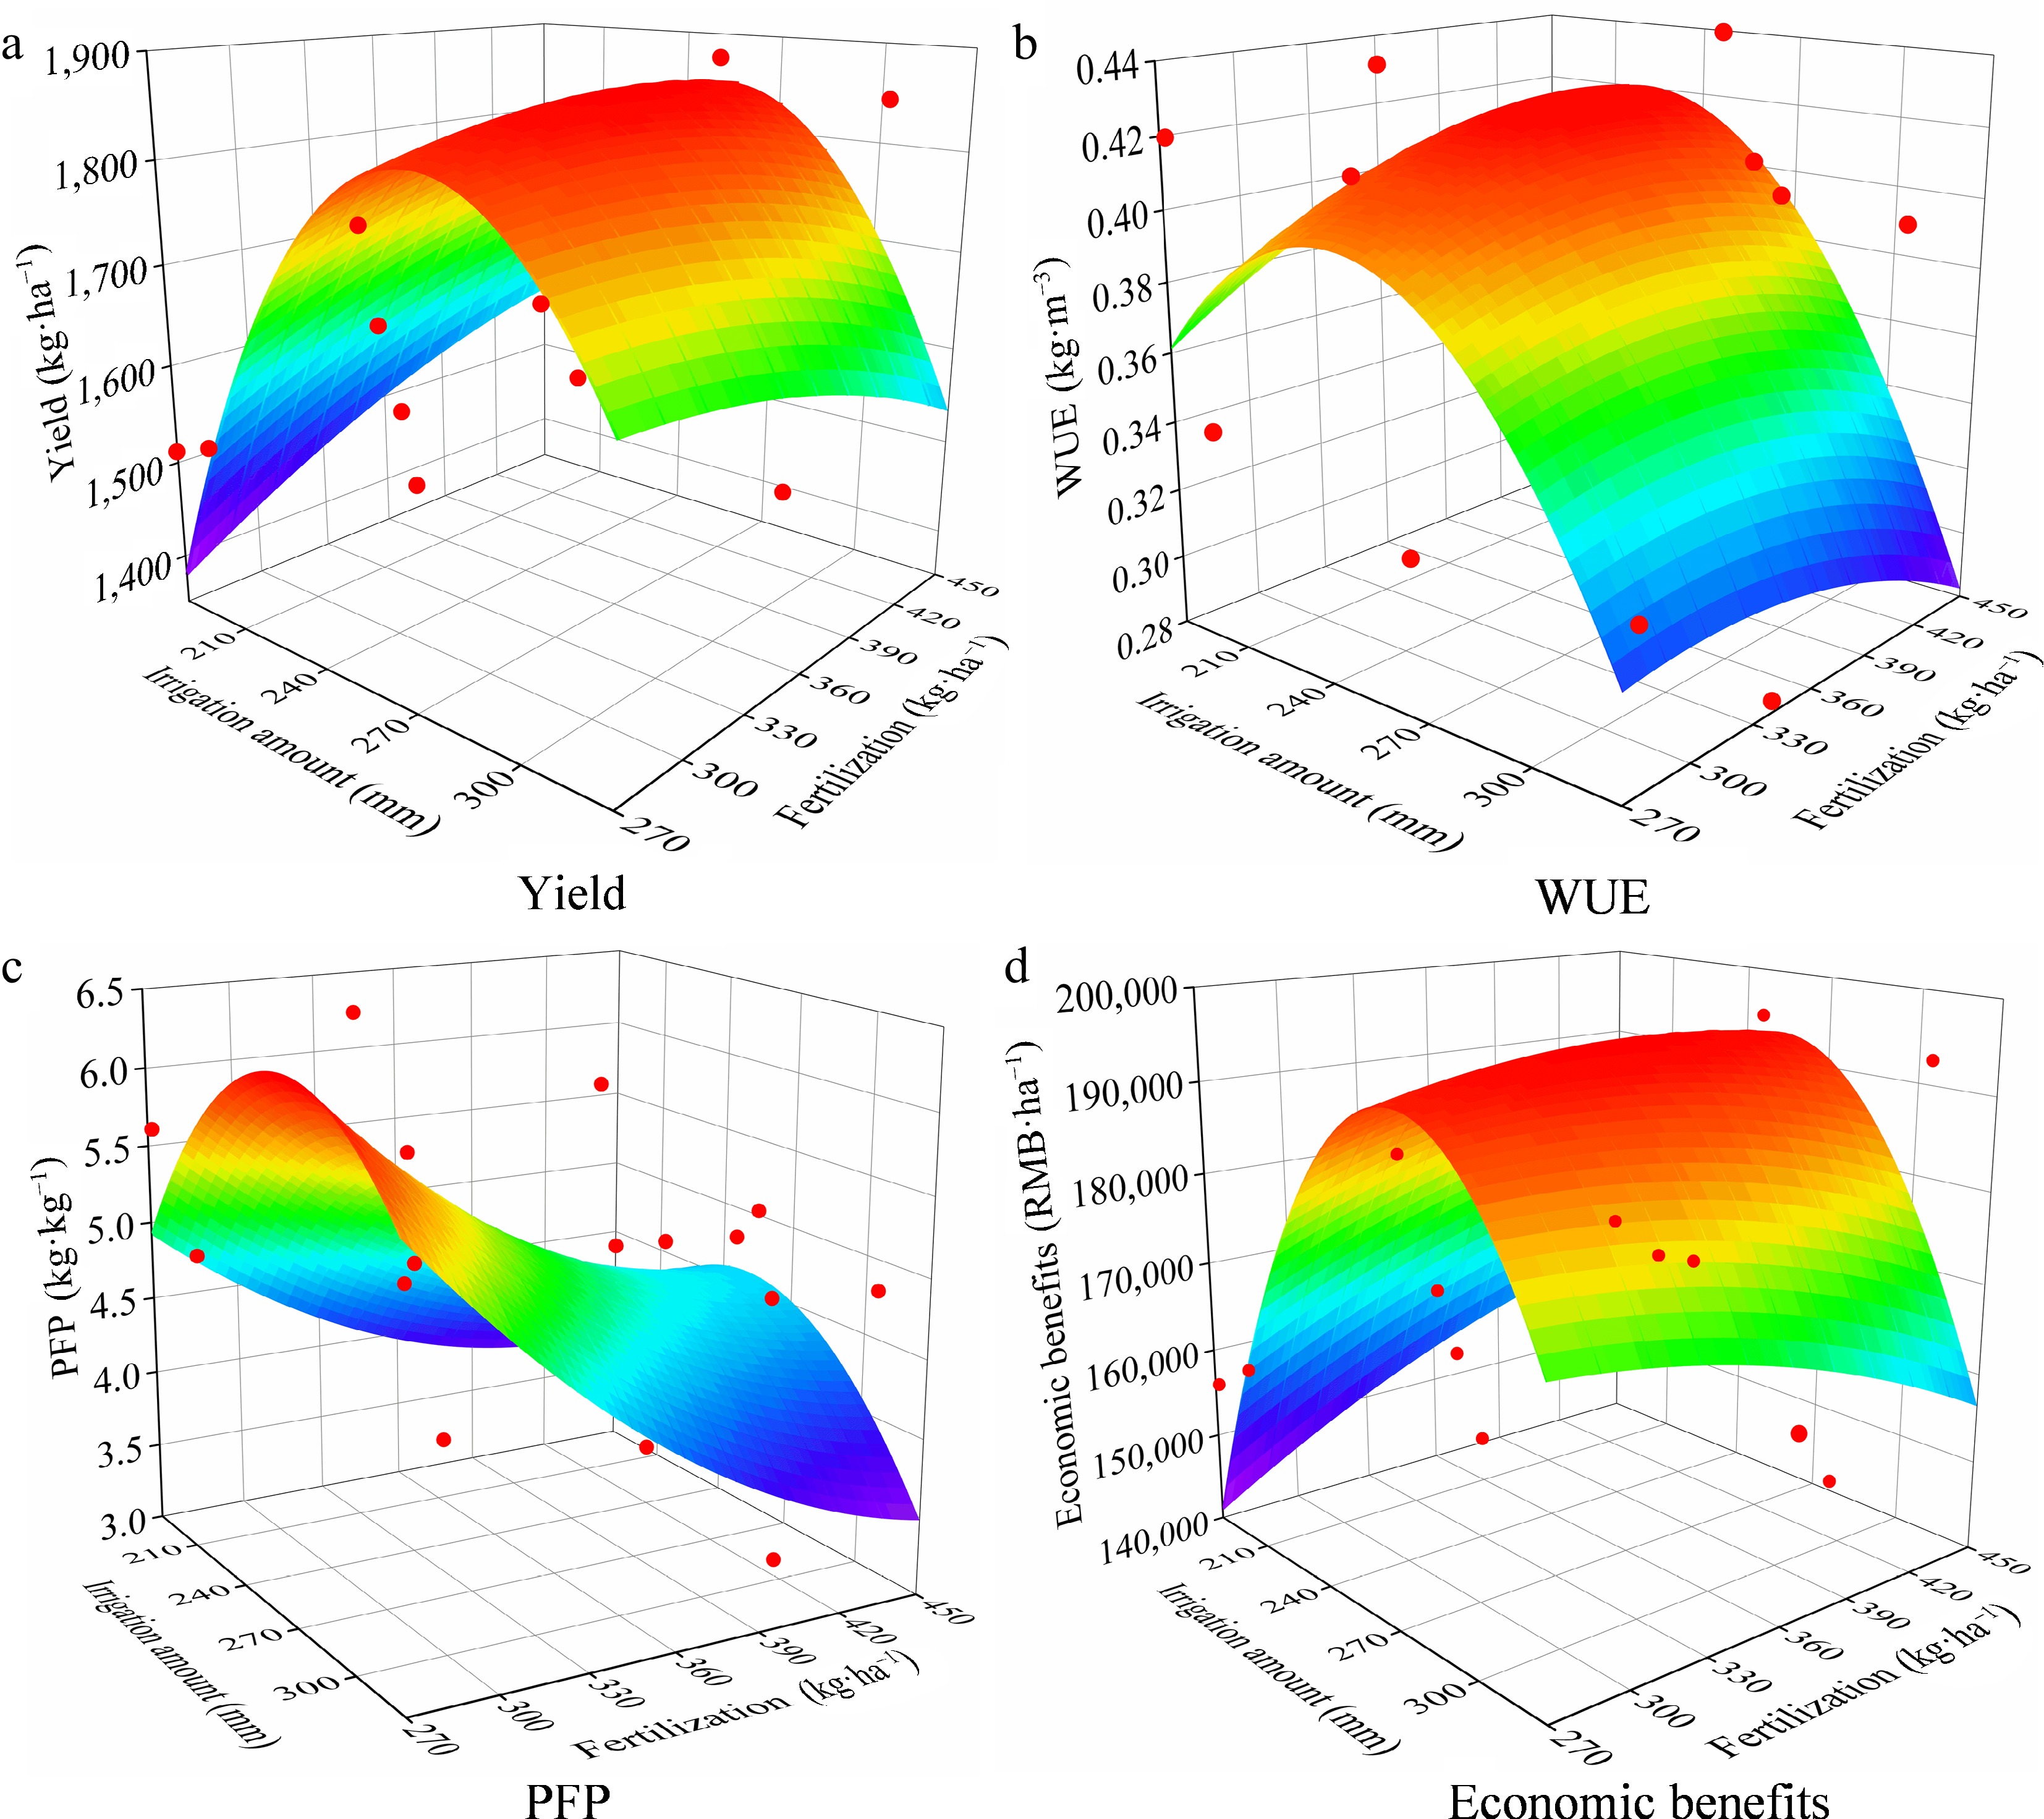
Figure 4.
Relationship of (a) yield, (b) water use efficiency (WUE), (c) partial factor productivity (PFP) and (d) economic benefits with the amount of irrigation and fertilization (N-P2O5-K2O) during the two years. The red dots in the figure represent the measured experimental data during 2018 to 2019.
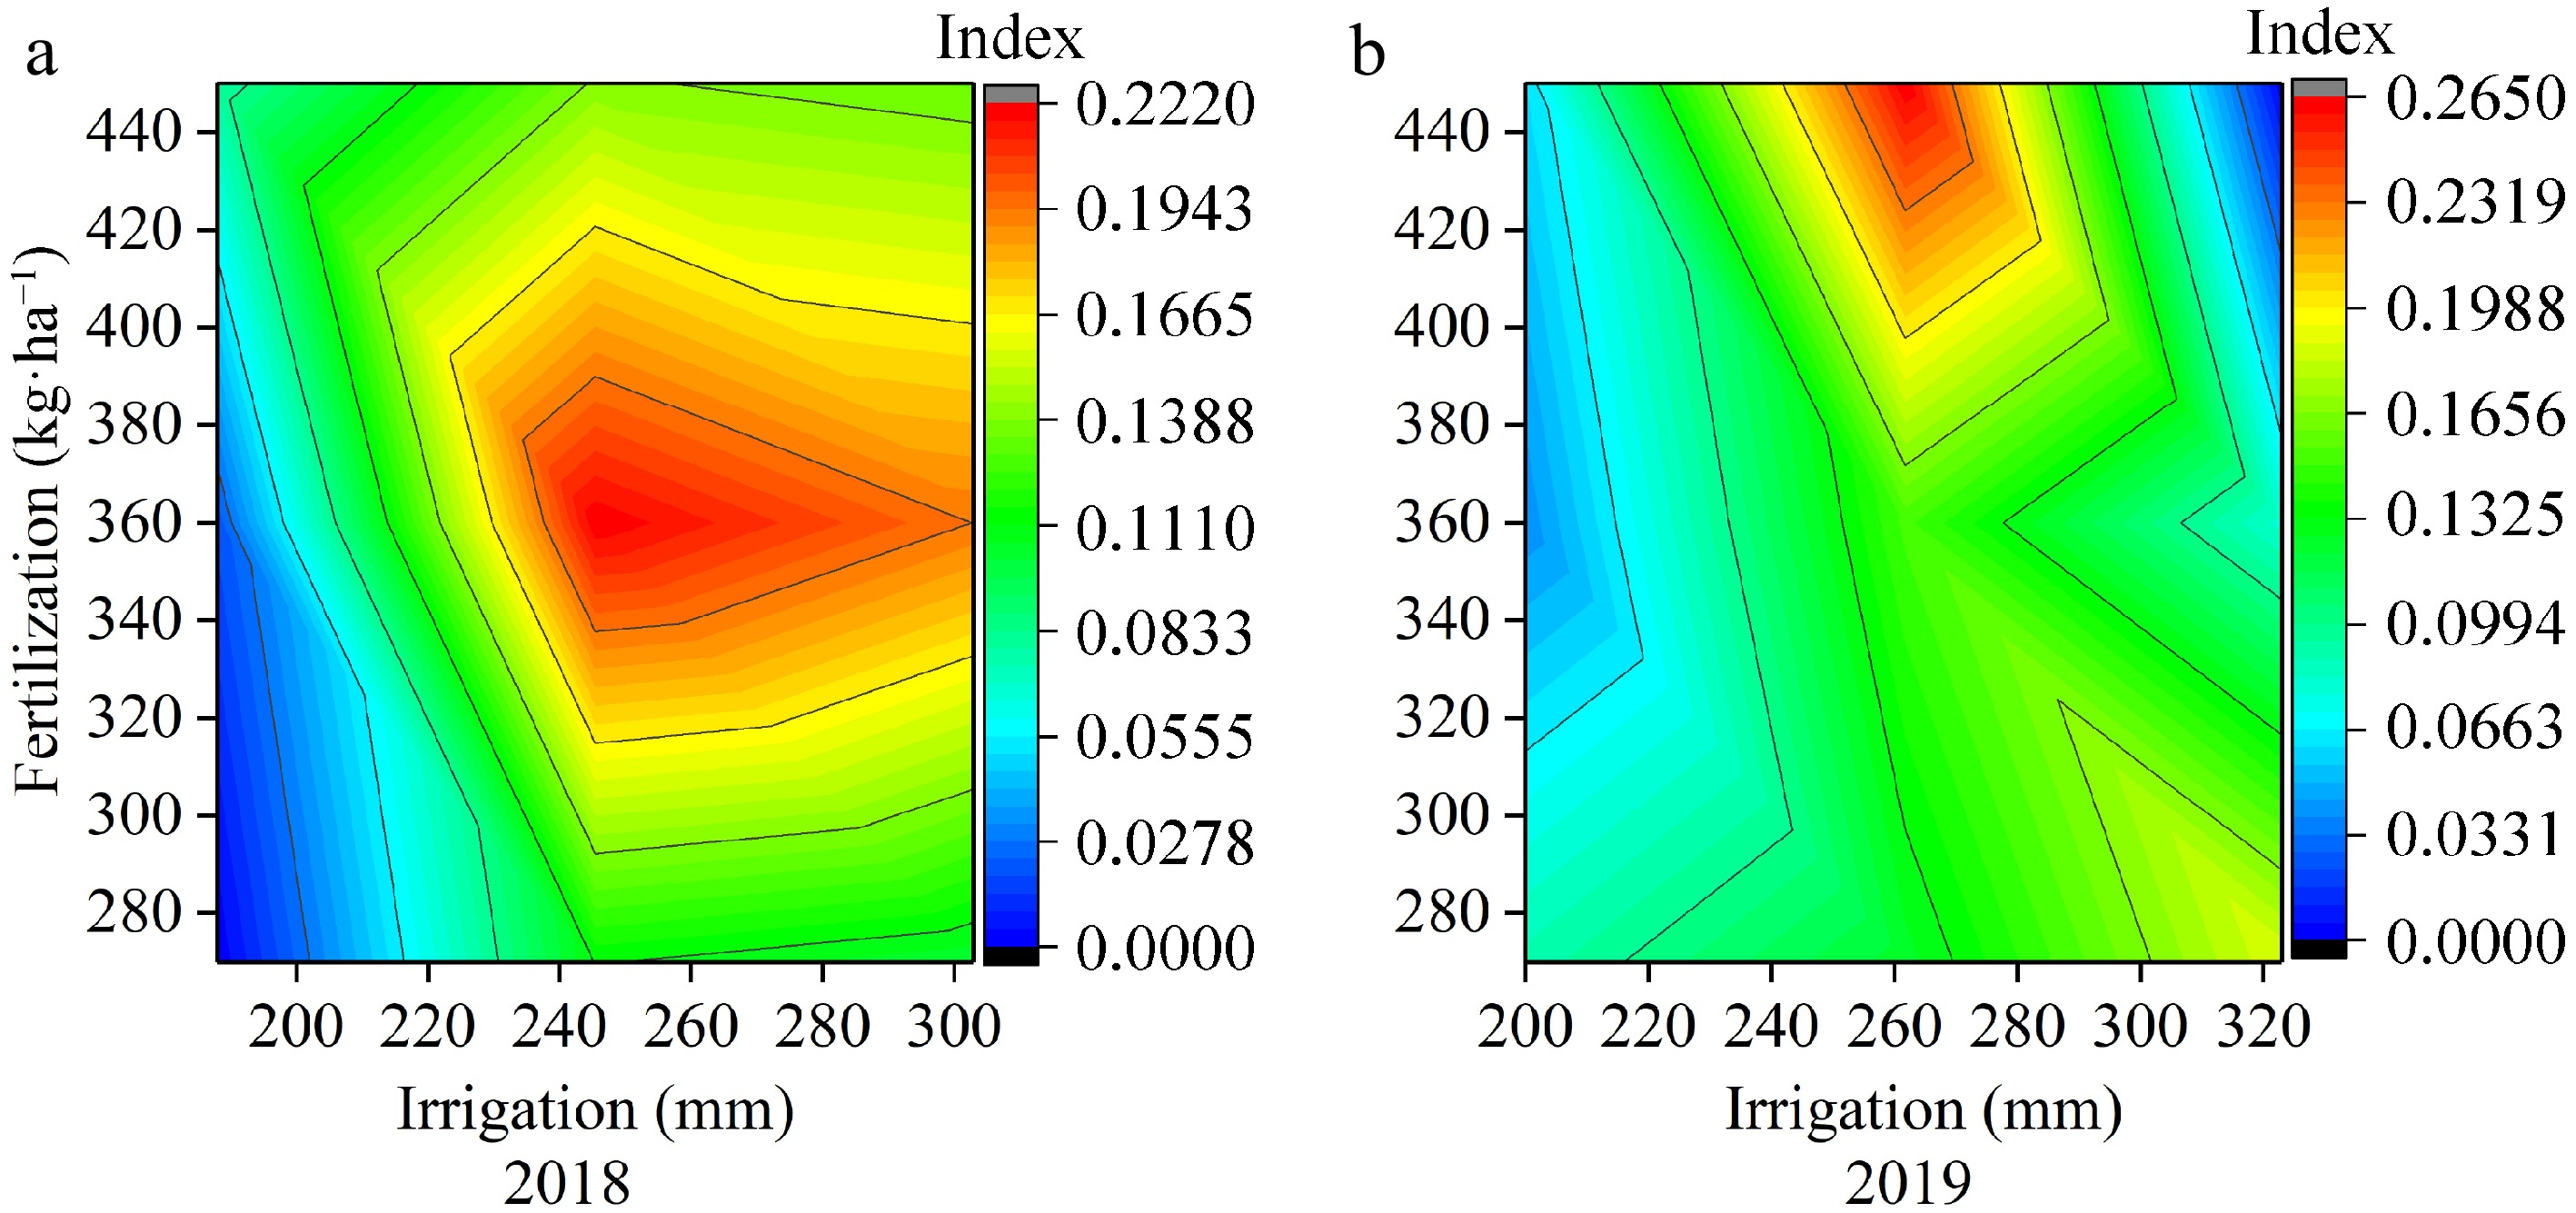
Figure 5.
Effects of irrigation and fertilization on comprehensive evaluation index for (a) 2018, and (b) 2019.
It can be found that the maximum index value appeared in the medium level of irrigation and fertilization region in 2018 and a medium level of irrigation and high level of fertilization region in 2019. This observation is consistent with the irrigation and fertilization level reflected by the measured data in these two years. To have an overlapping area in the maximum value of comprehensive evaluation indicators in both years, 90% of the maximum value of comprehensive evaluation indicators was determined as acceptable regions. According to this, when the irrigation range was 252 to 262 mm and the fertilization range was 185-62-123 to 200-67-133 kg·ha−1, the Chinese wolfberry yield, WUE, PFP, and economic benefits reached above 90% of their maxima concurrently.
-
Plant height and leaf area are commonly used as growth parameters of Chinese wolfberry[33]. Yin et al.[34] reported that plant height was significantly affected by irrigation, thus increasing irrigation level was beneficial for the growth of Chinese wolfberry. However, the effect of fertilizer on plant height was not significant as it also accumulated with tree age, and therefore, fertilizer amount in two years may not change the plant height significantly[35]. The results of this study are consistent with previous findings where irrigation had a significant effect on plant height, while fertilizer application had no significant effect on the plant height of Chinese wolfberry.
Leaf plays an important role in photosynthesis and transpiration, thus the leaf size has a great influence on the growth and the yield formation[4]. It was reported that the leaf area increased first and then decreased with the increasing irrigation and fertilizer levels[36,37] which is similar to the findings of this study. The interaction effect of irrigation and fertilization did not significantly influence the leaf area. Irrigation levels significantly influenced the leaf area which was also noticed in other studies[3,38,39].
It was found that the interaction effect of water and fertilizer considerably influences the Chinese wolfberry yield. In both years, suboptimal and excess application of irrigation reduced the yield whereas a high level of fertilization did not result in the highest yield. This could be because Chinese wolfberry is a perennial plant that used up a larger portion of the absorbed nutrients for vegetative growth rather than for the conversion of reproductive growth[40]. Under high irrigation levels, nutrient leaching beyond the root zone may have decreased plant available nutrients and eventually results in a lower yield[5]. However, insufficient irrigation retards the plant growth decreases the leaf area and lowers the photosynthetic efficiency which is not conducive to high yield. Dai et al.[41] also confirmed that water shortage reduced the production of the crop. The results showed that Chinese wolfberry yield was lower in 2019 (1,954 kg·ha−1) than in 2018 (2,056 kg·ha−1). The possible reason for this is that the evapotranspiration in 2019 was higher than that in 2018 while the precipitation remains almost the same, which could have decreased the soil moisture availability to the plants and ultimately reduced the yield[42]. Therefore, the optimum level of irrigation and fertilization could increase the agronomic performances and provide the highest yield[43].
Effects of different levels of irrigation, and fertilizers on WUE, PFP and economic benefits
-
The interaction of irrigation and fertilizer was significant in WUE which showed a good agreement with previous studies[44,45]. In general, the WUE showed a parabolic relationship with increasing irrigation and fertilization wherein irrigation had a stronger relationship than fertilization. The maximum WUE was achieved with medium level of irrigation and medium fertilizer treatment in 2018 whereas under medium level irrigation and high fertilizer level in 2019. At a high level of irrigation, the WUE decreased with increasing fertilization. High irrigation level often induces the leaching losses of nutrients, especially N, possibly the reason for this observation. At the same level of irrigation, the WUE of high fertilization level was generally higher than that of a low fertilization level[46]. Likewise, Eissa et al.[47] reported that 28%−42% increase in WUE with higher levels of N (240 kg·ha−1) as compared to the lower level (120 kg·ha−1) in wheat. This is because fertilizer improves growth and yield in some crops and improving WUE, while excessive fertilization will affect the absorption of nutrients by Chinese wolfberry, resulting in excessive soil nutrients and reduced WUE. Improved WUE could be achieved through the proper application of N and P fertilizer was documented in several studies such as Li et al.[48] and Wei et al.[49].
Meanwhile, previous studies showed that PFP decreases with the increase of fertilization, and increases initially and then decreases with the increase of irrigation[35,50] which is in agreement with the results of this study as well. In this experiment, the PFP values corresponding to the highest yield treatments (i.e., W2F2 in 2018, W2F3 in 2019) were 0.61% lower than the highest PFP values in 2018, and 21.88% lower than in 2019. These results showed that a low level of fertilization yielded higher PFP, but didn't meet the production requirements. However, excessive nitrogen fertilization promotes vegetative growth and impedes the supply of nutrients to reproductive components of the crop, leading to yield reduction[51]. Several studies showed that higher levels of nutrient application failed to support high yield. For example, Okebalama et a.l[52] pointed out that P fertilizer had a greater effect on corn grain yield than N fertilizer and P fertilizer should be supplied not exceeding the critical level of 60 kg·ha−1 (in Plinthic Acrisol) and 90 kg·ha−1 (in Gleyic Plinthic Acrisol) for optimum maize yield. Trujillo Marín et al.[27] reported that a 30% N application rate increased the yield of fresh fruit by 32.9%, and increased nitrogen accumulation by 9.0% compared to a 70% N application rate in tomato. Moradi et al.[53] found that 60 kg·ha−1 gave the highest yield of rice than the other two levels of N application rates; 40 and 60 kg·ha−1. All these findings support the results of this study that either low or high nutrient application is not conducive for high yield.
The ultimate aim of the farmers is to gain high economic return which influences the viability of the farming. The economic benefits of medium level irrigation (W2) 17.7% (2018), 17.6% (2019), and 2% (2018), 13.7% (2019) times higher than low and high irrigation levels, respectively. At the same level of irrigation, economic benefits increased initially and then decreased with increasing fertilization. Therefore, this study emphasizes that increasing either irrigation or fertilization beyond the optimal level decreased the economic benefits[41,42,54,55]. Considering the cost of inputs, cutting down the fertilizer cost is more beneficial than reducing the expenditure on water. However, saving water is also equally important on the basis of environmental protection. Therefore, it is necessary to seek an irrigation and fertilization management scheme that can ensure not only the efficient management of irrigation and fertilizer but also take into account economic benefits in both water-deficient and non-water-deficient areas.
Interaction effects of irrigation and fertilizer on Chinese wolfberry production and optimum management strategy
-
The interaction effect of irrigation and fertilizer was significant on WUE and PFP and was strongly significant on the yield. Obviously, the interaction of water and fertilizer is the effective method to improve the comprehensive benefits of Chinese wolfberry[5]. This study developed appropriate relationship models between inputs (irrigation and fertilization) and yield, WUE, PFP, and economic benefits by combining the quadratic polynomial stepwise regression, and spatial analysis method. The solution of the models showed that no irrigation and fertilizer management scheme maximized all indicators. Similar observations were reported in other studies[56,57]. In addition, the entropy weight method was combined with TOPSIS to comprehensively evaluate all the treatments for the two years of experiment. Few studies have shown that appropriate adjustment of the confidence interval can solve the problem of comprehensive benefits[56,58].
Therefore, a 90% confidence interval was set as an acceptable range in this study to maximize the yield, WUE, PFP, and economic benefits. More than 90% of the maximum values were achieved at the irrigation range of 252−262 mm and the N-P2O5-K2O fertilization range of 185-62-123 to 200-67-133 kg·ha−1 without spring and winter irrigation. The irrigation and N-P-K fertilizer application amount of local Chinese wolfberry park are 300 mm and 396-166-225 kg·ha−1 respectively, and the annual income is CNY¥13,000 ha−1. If the irrigation and fertilizer management scheme proposed in this study is adopted, it could save water by 13%−16%, N-P2O5-K2O fertilizer by 50%-60%-41% to 53%-63%-45% and increase economic benefits by about 8%.
-
Lack of appropriate irrigation and fertilizer management is one of the deeply rooted issues in Chinese Wolfberry cultivation in northwest China. This study attempts to find the optimal irrigation and fertilization level based on yield, WUE, PFP, and economic benefits for Chinese Wolfberry over a two-year field experiment. None of the treatment combinations provided the maximum values for yield, WUE, PFP, and economic benefits. The WUE decreased with increasing irrigation level. The WUE with low irrigation level (65% ET0) and medium irrigation level (85% ET0) were all higher than that of high irrigation levels (105% ET0) in both years. With increasing fertilization, PFP showed a decreasing trend. Both low (65% ET0), and high (105% ET0) irrigation levels were not conducive to the effective utilization of fertilizer. The irrigation and fertilizer schemes corresponding to the maximum yield and economic benefits in 2018 and 2019 were medium irrigation levels (85% ET0) with medium and high fertilizer treatments, respectively.
The least square method, multiple regression, and comprehensive evaluation of a multi-objective optimization problem revealed that the yield and economic benefits do not decrease, when the irrigation range was 252−262 mm and the N-P2O5-K2O fertilization range was 185-62-123~200-67-133 kg·ha−1. At this application level, yield, WUE, PFP, and economic benefits of Chinese wolfberry reached 90% of the maximum value, which would maximize the comprehensive benefit. The finding of this study is of importance in providing the baseline of irrigation and fertilization levels for farmers cultivating Chinese wolfberry in the northwest China and other regions with similar soil and climate characteristics. Nevertheless, further studies may be required to validate the findings of this research across different geographical regions.
-
The authors confirm contribution to the paper as follows: study conception and design: Deng Z, Yin J; data collection: Deng Z, Wu J, Zhang H; data curation: Deng Z, Yin J, Eeswaran R, Abhiram G; analysis and interpretation of results: Deng Z, Yin J, Eeswaran R, Abhiram G; draft manuscript preparation: Deng Z; writing – review & editing: Yin J, Eeswaran R, Abhiram G; fund acquisition & supervision: Yin J. All authors reviewed the results and approved the final version of the manuscript.
-
All data generated or analyzed during this study are included in this published article.
This work was financially supported by the First-class Subject Project at Ningxia University (Grant No. NXYLXK2017A03), and the talent plan of Ningxia youth 'support project' in 2017.
-
The authors declare that they have no conflict of interest.
- Copyright: © 2024 by the author(s). Published by Maximum Academic Press, Fayetteville, GA. This article is an open access article distributed under Creative Commons Attribution License (CC BY 4.0), visit https://creativecommons.org/licenses/by/4.0/.
-
About this article
Cite this article
Deng Z, Yin J, Eeswaran R, Gunaratnam A, Wu J, et al. 2024. Interacting effects of water and compound fertilizer on the resource use efficiencies and fruit yield of drip-fertigated Chinese wolfberry (Lycium barbarum L.). Technology in Horticulture 4: e019 doi: 10.48130/tihort-0024-0016 

Interacting effects of water and compound fertilizer on the resource use efficiencies and fruit yield of drip-fertigated Chinese wolfberry (Lycium barbarum L.)
- Received: 11 June 2024
- Revised: 01 August 2024
- Accepted: 05 August 2024
- Published online: 28 August 2024
Abstract: Chinese wolfberry (Lycium barbarum L.) is an important cash crop in the Ningxia region of China, but water scarcity, low water use efficiency (WUE) and fertilizer use efficiency (FUE) have limited the growth of its production. Field experiments were conducted in central Ningxia (China) during 2018−2019 to investigate the interaction effects of irrigation and fertilizer levels on agronomic performances (AP), WUE, partial fertilizer productivity (PFP), and economic benefits (EB). The optimal range of irrigation and fertilizer inputs was determined using multiple regression, the entropy weight method, and the Technique for Order Preference by Similarity to Ideal Solution (TOPSIS) coupling comprehensive evaluation method. Three drip irrigation levels were designated as a percentage of reference crop evapotranspiration (ETo); low (65% ET0: W1), medium (85% ET0: W2) and high (105% ET0: W3). Three N-P2O5-K2O compound fertilization levels (kg·ha−1) were selected as low (135-45-90: F1), medium (180-60-120: F2) and high (225-75-150: F3). Results showed that AP, WUE, PFP, and EB increased initially and then decreased with increasing levels of irrigation under the same fertilization levels. The PFP decreased with increasing fertilization levels and the lowest PFP was observed at high fertilizer (F3) application level. The above parameters reached the maximum value under medium irrigation. By establishing the multi-objective optimization model, it was found that 252−262 mm of irrigation and 185-62-123~200-67-133 kg·ha−1 of N-P2O5-K2O fertilization level offers more than 90% of yield, WUE, PFP, and EB simultaneously. The present results provide scientific insights into the resource optimization under drip-fertigation for Chinese wolfberry.