


-
Tomato (Solanum lycopersicum L.) is one of the most important horticultural crops in the Solanaceae family with numerous uses and health benefits. Tomato fruits are rich sources of minerals, vitamins (A, B, and C), antioxidant compounds (lycopene and ascorbic acid) and carotenoids (β-carotene) which are essential for the usual physiological activities of the human body[1]. Tomatoes are enjoyed in various forms: fresh fruits are commonly eaten in salads and sandwiches while processed varieties are consumed dried or in the form of pastes, sauces, soups and juices[2]. Its contributions to food and nutrition security has led to a rise in cultivation and consumption over the years[3]. Thus, it is imperative to preserve tomato biodiversity and also promote new germplasm with highly marketable values.
Collection, evaluation, and exploitation of different tomato genetic resources have become a necessity and precondition for successful breeding, considering the increase in the loss of global crop biodiversity. The diversity in crop species depends on mutation, recombination, selection, introduction, and genetic drift[4]. The continuous search for diversity in newly collected germplasm is a way of identifying desirable genes for future utilization in breeding programs. Genetic resources are important reservoirs for variability that can be exploited to enhance the genetic improvement of crops. Adequate characterization of gene bank accessions is therefore needed to facilitate the utilization of germplasm by end users.
The examination of genetic diversity within a crop species can be undertaken through various methodologies, including morphological or phenotypical, biochemical, and molecular markers[5]. Morphological characterization influenced by environmental factors offers insights into crop species based on their observable traits in field conditions and has proven effectives in examining genetic diversity in crops[6]. Morphological characterization of newly introduced accessions is a quick and inexpensive effective method for maintenance and utilization of genetic resources[7]. A similar method was found suitable for detailed accession characterization in this study.
With the availability of diverse tomato varieties, both qualitative and quantitative traits have been successfully used to study diversity in tomato[2]. In the past, tomato producers, consumers, and breeders were mainly concerned about the yield and phenotypic appeal of the fruit. However, for sustainable improvement and production of elite tomato, the genetic background and breeding values of newly collected tomato accessions should be investigated not only for morphological or agronomic traits, but also for nutritional parameters which has become essential in the identification of the best parental combinations[8]. The physico-chemical properties of the tomato fruits are valuable for the selection of superior genotypes with improved quality and flavor.
To ensure the success of a breeding program, it is imperative to establish a robust pre-breeding gene pool, which will facilitate the generation of genetic recombinants for future selection[9]. Building such a gene pool necessitates thorough characterization of germplasm harboring traits of breeding significance. The approach used in this study provides an opportunity to identify variability among new collections of tomato accessions and identify superior accessions for breeding improved quantitative traits. Thus, the objectives of this study are to (i) assess the variability in agronomic and physico-chemical traits of tomato accessions, and (ii) identify complementary parents with high-quality fruits that can be utilized in tomato improvement programs.
-
A total of 25 genotypes consisting of 23 accessions collected from the genetic resources unit of the National Horticultural Research Institute (NIHORT), Ibadan, Nigeria, and two traditional varieties used as local checks (Table 1) were evaluated at the Teaching and Research Farm of Ladoke Akintola University of Technology, Ogbomoso (8°10'N, 4°10'E, and altitude 341 m above sea level). Tomato seeds were sown in perforated nursery trays filled with sterilized soil and grown for three weeks in the greenhouse. All plant protection measures and cultural practices were observed during the nursery growth period. Seedlings were later transplanted to the open field in a single row plot (one row per single bed) that was 4 m long with a spacing of 0.5 m between rows and 0.5 m between plants within a row. The beds were 1 m apart. The seedlings were arranged in a 5 × 5 α-lattice design with three replications. The recommended dose of N, P2O5, and K2O, fertilizers in the form of urea (46% N), single super phosphate (16% P2O5), and murate of potash (60% K2O) was applied three weeks after transplanting. The plants were supported with trellises to prevent lodging and reduce the risk of fruit loss due to diseases and pests. Weeding was manually performed every two weeks. To protect the leaves from pests that cause defoliation, plants were treated with the pyrethroid insecticide Cymbush, which contains cypermethrin. The insecticide was applied at 2, 6, and 9 weeks after transplanting, using a knapsack sprayer at a rate of 450 mL of active ingredient per 100 L of water per hectare. Throughout the experiment, no disease infestations were observed. Data collection was conducted on five randomly selected plants per plot for each accession per replicate. Other field management activities, including staking, weeding, and pest protection, were carried out during the crop's growth period.
Table 1. Tomato accessions and local checks evaluated in the study.
S/N Accession Local name Collection source Growth habit 1 NHTO-0199 Dan Biu Maiduguri, Borno state Semi-determinate 2 NHTO-0239 UC Funtua, Katsina state Indeterminate 3 NHTO-0259 Tomato Babura, Jigawa state Indeterminate 4 NHTO-0264 Tomato Babura, Jigawa state Indeterminate 5 NHTO-0340 Tima Kano state Indeterminate 6 NHTO-0342 Tomato Babura, Jigawa state Semi-determinate 7 NHTO-0346 Ex-Babura Babura, Jigawa state Indeterminate 8 NHTO-0350 Tomato Makarfi, Kaduna state Indeterminate 9 NHTO-0351 Dan Batanas Makarfi, Kaduna state Determinate 10 NHTO-0352 Dan India Makarfi, Kaduna state Indeterminate 11 NHTO-0353 Tomato Bauchi State Semi-determinate 12 NHTO-0368 Dan Gombe Dadin kowa, Gombe state Semi-determinate 13 NHTO-0388 Heinz 2274 Kano state Semi-determinate 14 NHTO-0389 Tomato Maiduguri, Borno state Indeterminate 15 NHTO-0390 Girafto Babura, Jigawa state Semi-determinate 16 NHTO-0400 Bakin iri Bomo, Zaria state Indeterminate 17 NHTO-0568 Dan Gombe Dadin kowa, Gombe state Determinate 18 NHTO-0569 Dan Baga Maiduguri, Borno state Indeterminate 19 NHTO-0570 Tomato Makarfi, Kaduna state Determinate 20 NHTO-0571 Tomato Makarfi, Kaduna state Semi-determinate 21 NHTO-0572 Dan Syria Maiduguri, Borno state Semi-determinate 22 NHTO-0573 Dallaji Bauchi state Indeterminate 23 NHTO-0574 Tomato Maiduguri, Borno state Determinate 24 LC CHK-Y Tomato Yoruba Ogbomoso, Oyo State Semi-determinate 25 LC CHK-H Timo Hausa Ogbomoso, Oyo State Semi-determinate NHTO = NIHORT Tomato; LC CHK-H = Local check-Hausa; LC CHK-Y = Local check-Yoruba. Data collection for agronomic traits and physico-chemical assessments
-
The International Plant Genetic Resources Institute[10] tomato descriptors were considered in collecting data in the field as well as in the laboratory. Quantitative agronomic data were collected on number of branches (NOB), number of days to flowering (DTF), number of days to maturity (DTM), fruit length (FL), fruit width (FWD), number of flowers per cluster (NFPC), number of fruits per cluster (FPC), plant height (PH), number of days to first harvest (DTH), number of fruits per plot (FPP) and fruit weight per plot (TFW). Days to flowering was recorded as the number of days from sowing to when 50% of the plants in each plot had flowered. Manual branch counting was used to determine the number of branches, days to maturity was recorded from sowing until 50% of plants had at least one ripened fruit. Fruit length and width were measured at physiological maturity. Fruit length was recorded from stem end to blossom end using a meter rule (cm) while fruit width was recorded at the largest diameter of cross-sectioned fruits using a digital calipers-515 (cm). The total number of fruits per plot was determined at physiological maturity and a digital weighing machine was used to obtain the total fruit weight per plot.
For physico-chemical parameters, tomatoes were harvested at red ripe stage on five plants per genotype. Total soluble solids (TSS) content which gives information on the percentage of sugars present in the tomato juice was measured using a digital refractometer (Model, PAL-Tea, ATAGO, Tokyo, Japan), and the results were expressed as °Brix in accordance with the Association of Official Analytical Chemists[11] methods at room temperature. The fruit juice pH was determined using a pH meter and the titratable acidity was determined following the method of AOAC and expressed in percentage. Simple sugars such as ascorbic acid (vitamin C) and carotenoids (β-carotene and lycopene) were also analyzed according to standard laboratory procedures and expressed in mg 100 g−1. All analyses were done in triplicate for each representative fruit sample at the Product Development Laboratory of NIHORT.
Statistical data analysis
-
All collected data was entered into Microsoft Excel 2019 before analysis. Analysis of variance (ANOVA) was performed with the General Linear Model (GLM) procedure in Statistical Analysis System (SAS) software version 9.4[12] to examine differences among the accessions. To avoid Type I error rates across multiple comparisons, Tukey's honestly significant difference (HSD) test was applied to determine trait means significant differences among the evaluated accessions at 5% probability level using the R statistical software.
The linear model used in this study was:
$ {y}_{ij}=\mu +{b}_{j}+{\alpha }_{i}+{e}_{ij} $ To examine the proportion of the total variance of a trait that is due to genetic differences among the tomato accessions, repeatability was computed. The GLM procedure of SAS was used to estimate the variances and the repeatability of the traits was computed only for all the agronomic traits measured. The Rank summation index (RSI) of Mulumba & Mock[13] was used to rank the performance of the tomato accessions based on four selected economically important traits (number of fruits per plot, fruit weight per plot, β-carotene, and lycopene). The accessions were ranked for these traits and the rankings were then combined to create an index for each accession. The accession with the lowest RSI value was considered the best, while the one with the highest RSI value had poor performance.[14] Principal Component Analysis (PCA) was performed to determine the traits that account for most of the variations among the accessions using R statistical software (version 4.2.2) and was plotted using the package 'FactoMineR'. The PCs with Eigenvalues > 1 were selected[15] and the first two PCs which explained maximum total variations were plotted on a two-dimensional plot for all the accessions. For the grouping of similar accessions based on agronomic and physico-chemical traits, cluster analysis was computed. Distinct clusters were established using Ward's coefficient of agglomerative hierarchical clustering in R statistical software version 4.2.2[16]. Pearson's correlation analysis was computed to determine associations among all traits measured using the 'metan' package in R[17].
-
The tomato leaves and fruits showed a large range of phenotypic variation among the 23 accessions and two traditional varieties used as checks (Fig. 1). In addition to obvious differences in leaf and fruit shapes, results from analysis of variance revealed that the accessions showed significantly (p < 0.001, p < 0.01, and p < 0.05) different mean squares for all the measured agronomic and physico-chemical traits (Table 2). Coefficients of variation (CV) were below 20% for most of the measured traits but appeared excessively high (21%−80%) for numbers of branches, flowers per cluster, fruit per cluster, fruit per plot, plant height, and fruit weight. The low CV observed for most traits implies the precision of the experiment and reliability of the data collection procedure. The magnitude of the coefficient of determination (R2) was high (70%−99%) for all traits measured, indicating the reliability of the statistical analysis to capture variability among the tomato accessions. Repeatability estimates for agronomic traits ranged from 0.39 (fruit length) to 0.66 (number of branches). Only the latter trait showed high magnitude as other traits had moderate estimates which is an indication of the effects of the test environment on the performance of the tomato accessions.
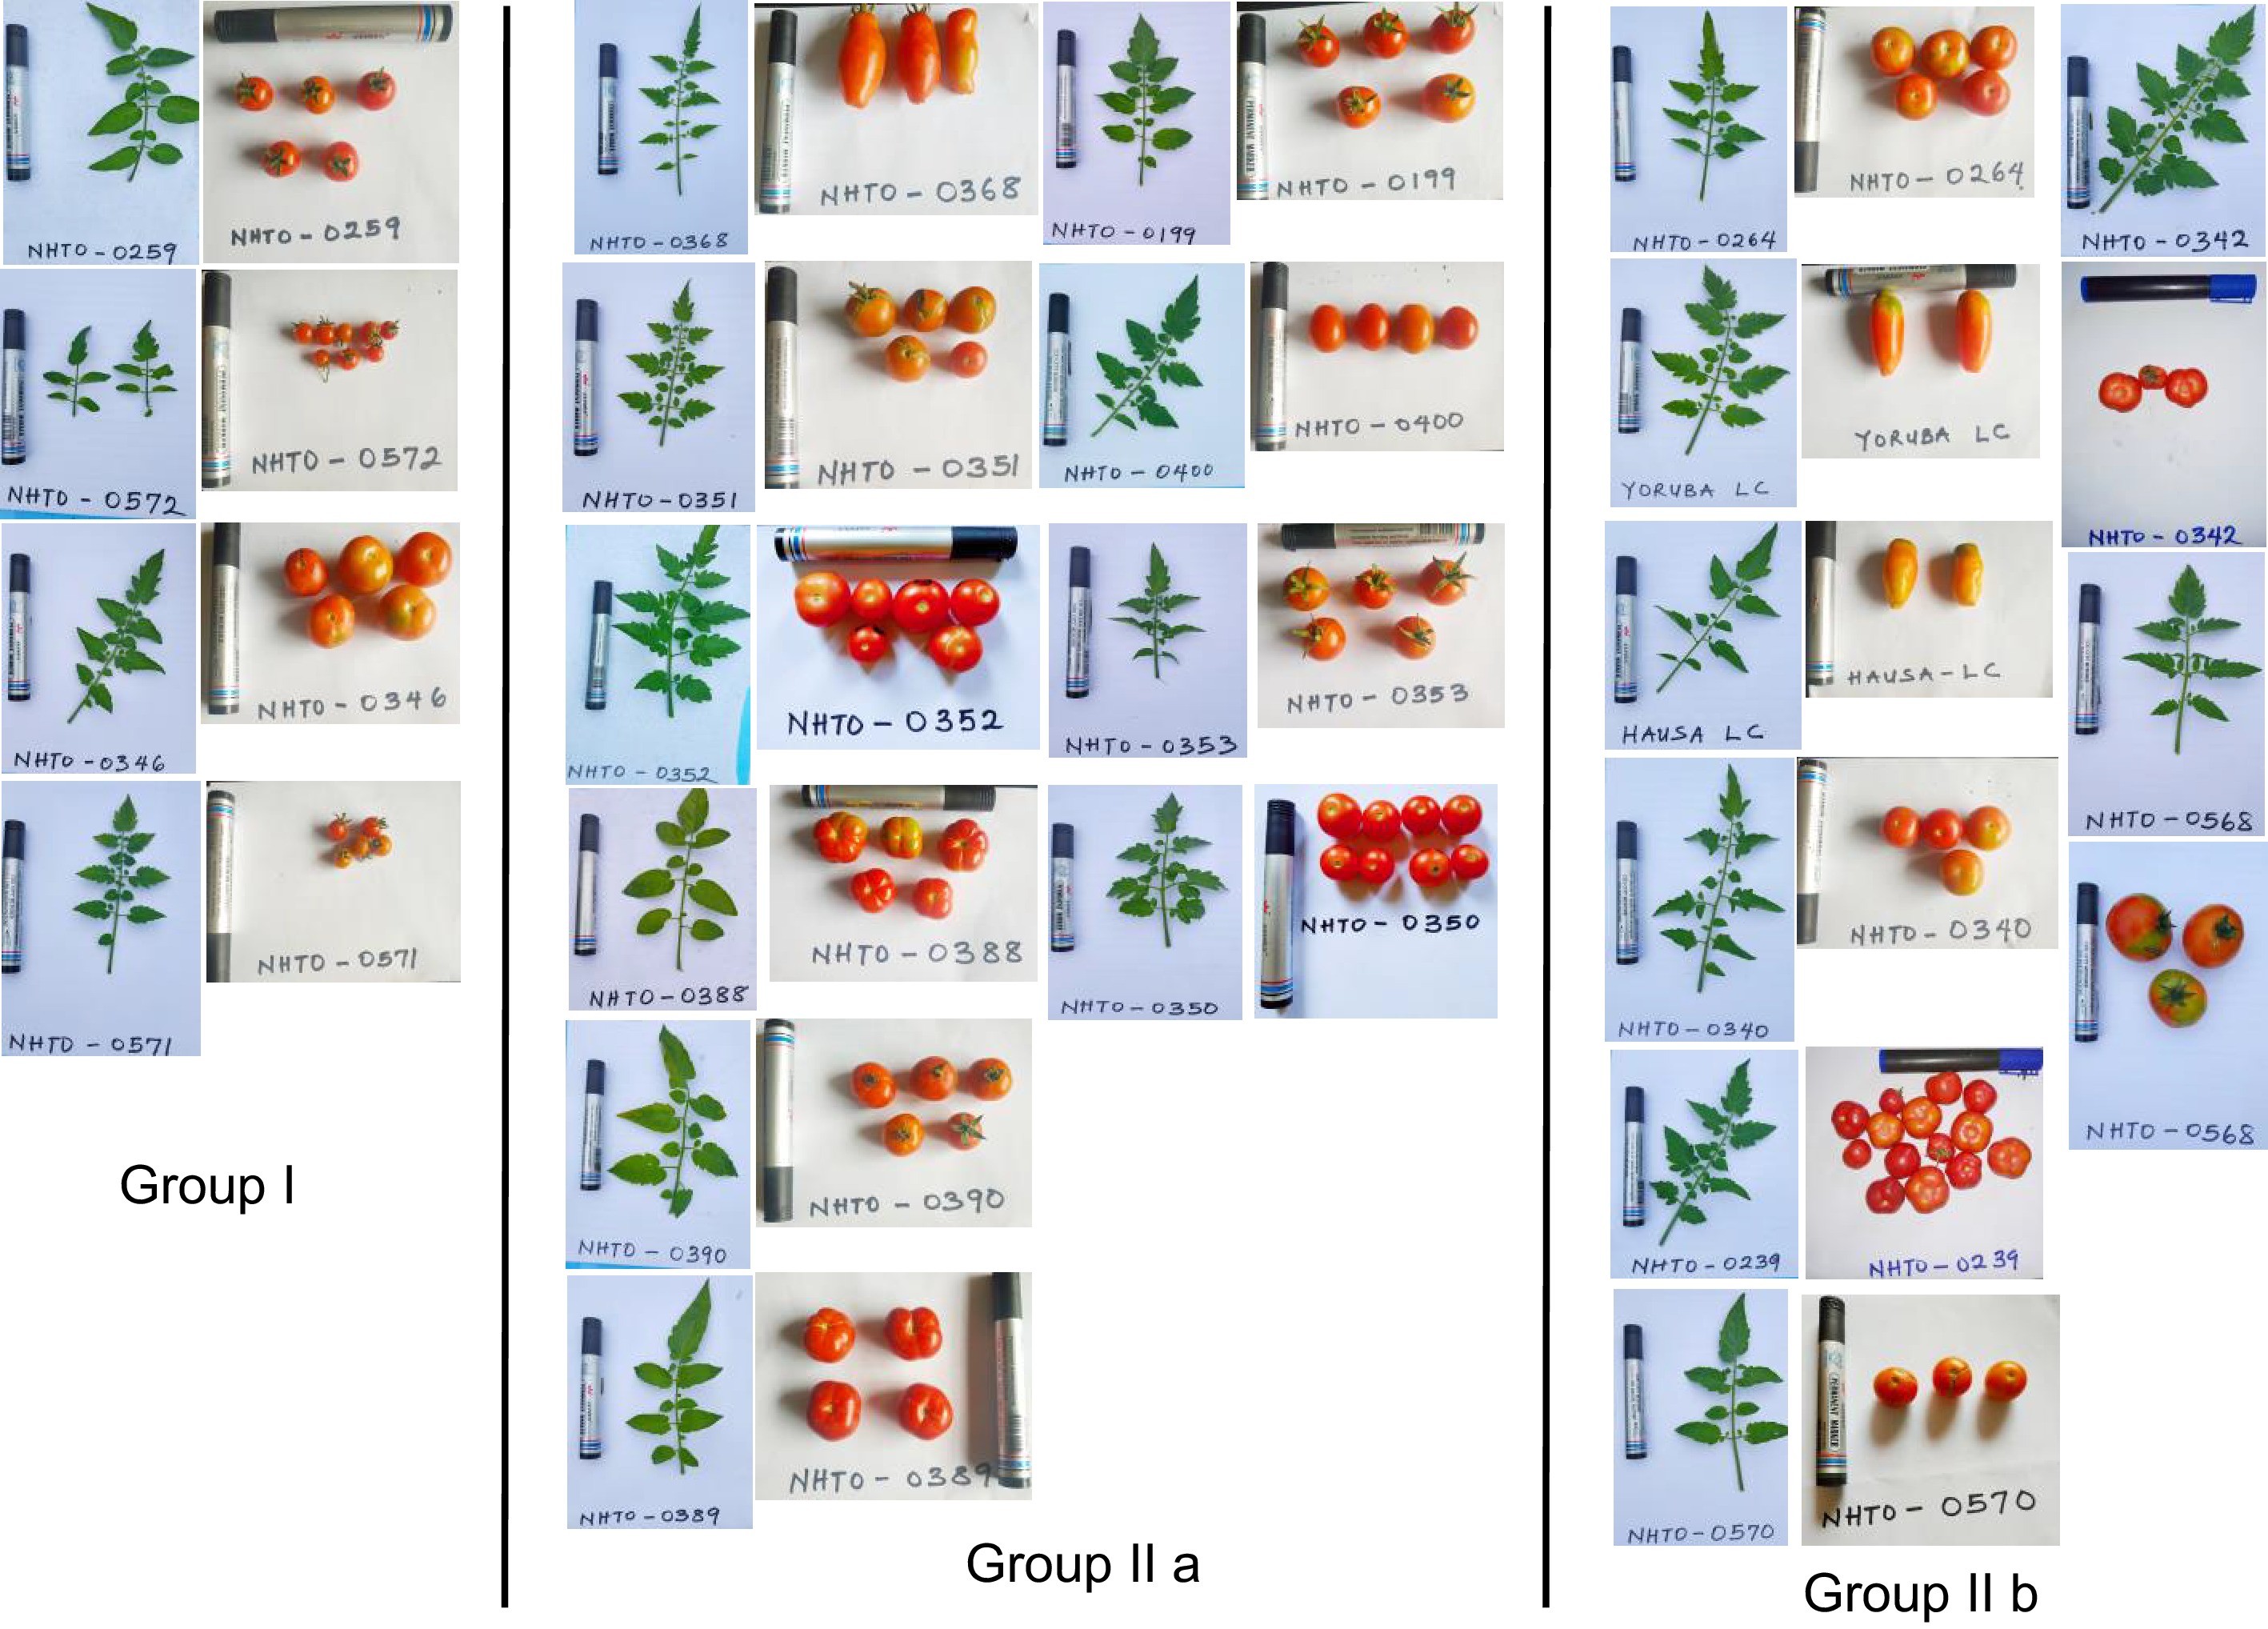
Figure 1.
Tomato accession diversity of leaf and fruit morphology within each distinct cluster. Each accession's leaf and fruit are accompanied by the accession name.
Table 2. Mean squares of agronomic and physico-chemical traits of the tomato accessions evaluated.
Source df No. of branches No. of
days to
flowering (d)No. of
days to
maturity (d)Fruit length (cm) Fruit
width
(cm)No. of
flowers
per
clusterNo. of
fruits
per clusterPlant height (cm) No. of days
to first
harvest (d)No. of
fruits
per plotFruit weight
per plot (kg)Vitamin C (mg
100 g−1)β-carotene (mg 100 g−1) Lycopene (mg
100 g−1)Titratable acidity (%) Fruit juice pH Total soluble solids (°Brix) Replication (Rep) 2 39.52** 24.16 86.44 0.82 0.67* 0.65 2.28 116.76 10.33 9,268.93 1.42 0.44 0.02** 2.22*** 0.03 0.01*** 0.00 Block (Rep) 12 10.66 38.87 47.36 0.10 0.09 1.57 1.96 353.90* 28.50 4,766.78 3.65 0.32 0.01 0.18 0.02 0.00 0.03*** Accession 24 12.42* 106.19*** 223.06** 3.55*** 1.11*** 3.72*** 3.58*** 651.85*** 154.51*** 36,185.35*** 8.73*** 13.67*** 1.10*** 297.40*** 0.36*** 0.22*** 0.06*** Error 36 6.01 28.29 73.73 0.30 0.17 1.33 1.40 166.38 46.2 5,525.12 1.80 0.31 0.01 0.23 0.02 0.00 0.01 CV (%) 31.27 13.49 11.44 18.42 14.53 28.64 21.95 21.05 9.03 80.10 54.04 5.33 4.06 3.09 6.25 0.59 1.53 R2 (%) 75 78 73 91 85 73 70 78 76 84 79 97 99 99 94 99 95 Repeatability 0.66 0.51 0.55 0.39 0.44 0.57 0.59 0.50 0.53 0.44 0.47 − − − − − − *, **, *** significant at 0.05, 0.01 and 0.001 probability levels, respectively. CV = coefficient of variation, R2 = coefficient of determination. The significant differences among accessions for all measured traits enabled grouping into different classes and the identification of outstanding accessions. The Tukey's HSD separated the trait means into two classes for the numbers of branches, days to maturity, flowers per cluster, plant height, and number of days to first harvest (Supplemental Table S1). The other measured agronomic and nutritional traits were separated into three or more classes and the means having 'a' were considered the best. The greatest magnitude of variation was observed in the number of fruits per plot which varied from 10 (NHTO-0568) to 476 (NHTO-0259), followed by plant height in the range of 34.3 (NHTO-0568) to 93.7 cm (NHTO-0259). The number of branches varied from 4 (NHTO-0351) to 13 (NHTO-0572), number of days to flowering ranged from 30 (NHTO-0389) to 55 d (NHTO-0569), number of days to maturity was between 65 (NHTO-0350) to 98 d (NHTO-0574), fruit length varied from 1.2 (NHTO-0572) to 5.8 cm (NHTO-0368), fruit width ranged from 1.3 (NHTO-0572) to 4.1 cm (NHTO-0568), number of flowers per cluster was between 2 (NHTO-0570) and 7 (NHTO-0259), the number of fruits per cluster was between 4 (LC CHK-H) and 8 (NHTO-0572), number of days to first harvest ranged from 68 (NHTO-0350) to 97 d (NHTO-0569) and fruit weight per plot varied from 0.3 (NHTO-0569) to 6.5 kg (NHTO-0199). The grand mean values were 7.8 for number of branches, 39 d for number of days to flowering, 75 d for number of days to maturity, 3.0 cm for fruit length, 2.8 cm for fruit width, 4.0 for number of flowers per cluster, 5.4 for number of fruits per cluster, 61.3 cm for plant height, 75 d for number of days to first harvest, 92.8 for number of fruits per plot and 2.5 kg for fruit weight per plot.
In comparison to the traditional varieties used as checks, the two checks (LC CHK-Y and LC CHK-H) evaluated in this study were comparable with the tomato accessions for most traits. Only one accession (NHTO-0568) with a fruit width of 4.1 cm was significantly (p < 0.05) different from the checks (Supplemental Table S1). NHTO-0569 took significantly longer days (97 d) to harvesting. The number of fruits per plot of NHTO-0259 and NHTO-0572 were significantly (p < 0.05) different from the checks. The fruit weight of NHTO-0199 surpasses that of the LC CHK-H significantly (p < 0.05) and out-yielded the best check (LC CHK-Y) by 59%.
Furthermore, the potential of the fruit quality determines their utilization in value addition industries. Considering the nutritional profile of the evaluated tomato accessions, a higher value in total soluble solids content (5.4 °Brix) was found in NHTO-0332 (Supplemental Table S2). The lowest value was recorded in NHTO-0368 (4.5 °Brix). Higher value in titratable acidity (3.0%) which surpasses the checks significantly (p < 0.05) was observed in NHTO-0199 while the lowest value (1.6%) was recorded in NHTO-0353. The pH showed the ideal range, ranging from 2.4 (NHTO-0389) to 4.1 (NHTO-0573). Three accessions (NHTO-0573, NHTO-0574 and NHTO-0569) had significant (p < 0.05) higher pH values than the checks. The lycopene content varied from 5 mg 100 g−1 (NHTO-0389) to 38 mg 100 g−1 (NHTO-0568). Only NHTO-0568 and NHTO-0351 were higher in lycopene (the compound providing the red color to the fruits) than the superior check (LC CHK-H) which has 32.4 mg 100 g−1 lycopene content. A higher value in β-carotene content (3.4 mg 100 g−1) was found in NHTO-0350. The lowest value was recorded in NHTO-0390 (0.8 mg 100 g−1). About 30% of the accessions notably; NHTO-0350, NHTO-0400, NHTO-0352, NHTO-0571, NHTO-0340, NHTO-0346 and NHTO-0388 had significantly (p < 0.05) higher β-carotene content (precursor of vitamin A) than the checks. The vitamin C content varied from 7.7 mg 100 g−1 (NHTO-0346) to 14.0 mg 100 g−1 (NHTO-0353) and was at par with the checks. The grand mean values were 10.4 mg 100 g−1 for vitamin C, 1.8 mg 100 g−1 for β-carotene, 15.4 mg 100 g−1 for lycopene, 2.2% for titratable acidity, 3.4 for fruit juice pH and 5.0 °Brix for total soluble solids.
Additionally, the tomato accessions performance was ranked based on four economic traits namely: number of fruits per plot, fruit weight, β-carotene, and lycopene content of the tomato fruits. The accessions were ranked for each of these traits and the ranks for each trait were summed up to obtain an index for each accession. The best accession had the least RSI value (20), whereas the worst one had the highest RSI value (93). The top five accessions with high fruit yield and quality were NHTO-0352, NHTO-0350, NHTO-0199, NHTO-0351, and NHTO-0346 (Table 3). However, NHTO-0353 ranked first based on the number of desirable 'a's it had across all agronomic andphysico-chemical traits, according to Tukey's HSD ranking. NHTO-0199, NHTO-0346, NHTO-0350, and NHTO-0352 identi-fied as superior by RSI, ranked second, as well as NHTO-0259, NHTO-0340, NHTO-0353, NHTO-0400, and NHTO-0573 indicating adaptability to the test environment.
Table 3. Fruit yield and quality of top and bottom five tomato accessions based on Rank Summation Index.
Accession Fruit weight per plot (kg) Number of fruits per plot β-carotene (mg
100 g−1)Lycopene (mg
100 g−1)Rank Summation Index Top 5 NHTO-0352 4.2 80.5 2.8 30.3 20 NHTO-0350 3.3 65.7 3.4 9.2 32 NHTO-0199 6.5 92.0 1.5 8.6 35 NHTO-0351 2.3 71.1 1.8 34.7 35 NHTO-0346 2.8 159.8 2.2 8.4 37 Mean of Top 5 3.8 93.8 2.3 18.2 Grand mean 2.5 92.8 1.8 15.4 Selection differential (%) 53.3 1.1 31.5 18.2 Bottom 5 NHTO-0342 1.8 38.2 1.6 5.5 69 NHTO-0389 0.7 91.3 1.3 4.9 74 NHTO-0569 0.3 14.8 1.6 9.4 74 NHTO-0573 0.5 11.9 1.6 6.6 77 NHTO-0574 0.3 15.0 0.9 5.3 93 Mean of bottom 5 0.7 34.3 1.4 6.3 Grand mean 2.5 92.8 1.8 15.4 Selection differential (%) −71.8 −63.1 −21.8 −58.9 Multivariate analysis of tomato accessions
-
The correlogram illustrates the strength and direction of the linear relationships between pairs of traits (Fig. 2). The number of fruits per cluster had a linear positive strong and significant (p < 0.01) relationships with number of flowers per cluster (r = 0.55) and number of fruits per plot (r = 0.72). Similarly, the number of branches had a linear positive strong and significant (p < 0.01) relationships with number of flowers per cluster (r = 0.60), number of fruits per plot (r = 0.64) and plant height (r = 0.60). The number of fruits per cluster and the number of fruits per plot have a statistically significant linear relationship (r = 0.74, p < 0.001), but a negative correlation with fruit width (r = −0.64). The number of fruits per plot had a strong positive and significant correlations with fruit width (r = 0.71) and plant height (r = 0.52). Plant height had a negative and significant correlations with fruit width (r = −0.63), number of days to first harvest (r = −0.57), number of days to maturity (r = −0.69), number of days to flowering (r = −0.60) and fruit juice pH (r = −0.65). On the other hand, plant height and total fruit weight per plot have a positive significant linear relationship (r = 0.54, p < 0.01). Total fruit weight per plot had a negative and significant correlations with number of days to first harvest (r = −0.60) and number of days to maturity (r = −0.64). The number of days to flowering had a strong positive and significant association with the number of days to maturity (r = 0.84) and number of days to first harvest (r = 0.79). The number of days to maturity and number of days to first harvest have a statistically strong significant linear relationship (r = 0.93, p < 0.001). Total fruit weight per plot was negatively correlated with number of days to first harvest (r = −0.48). Similarly, the number of days to first harvest has a negative and significant association with number of fruits per plot (r = −0.29). Considering the physico-chemical properties measured, vitamin C had a positive association with fruit length (r = 0.59, p < 0.01) and lycopene (r = 0.60, p < 0.01). Fruit juice pH had a positive and significant (p < 0.001) association with number of days to flowering (r = 0.70), number of days to maturity (r = 0.68) and number of days to first harvest (r = 0.64). The number of fruits per plot had a negative and significant association with vitamin C (r = −0.36). Vitamin C had a positive and significant correlation with lycopene (r = 0.57) but a negative correlation with β-carotene (r = −0.27). β-carotene showed a negative and significant association with titratable acidity (r = −0.33).
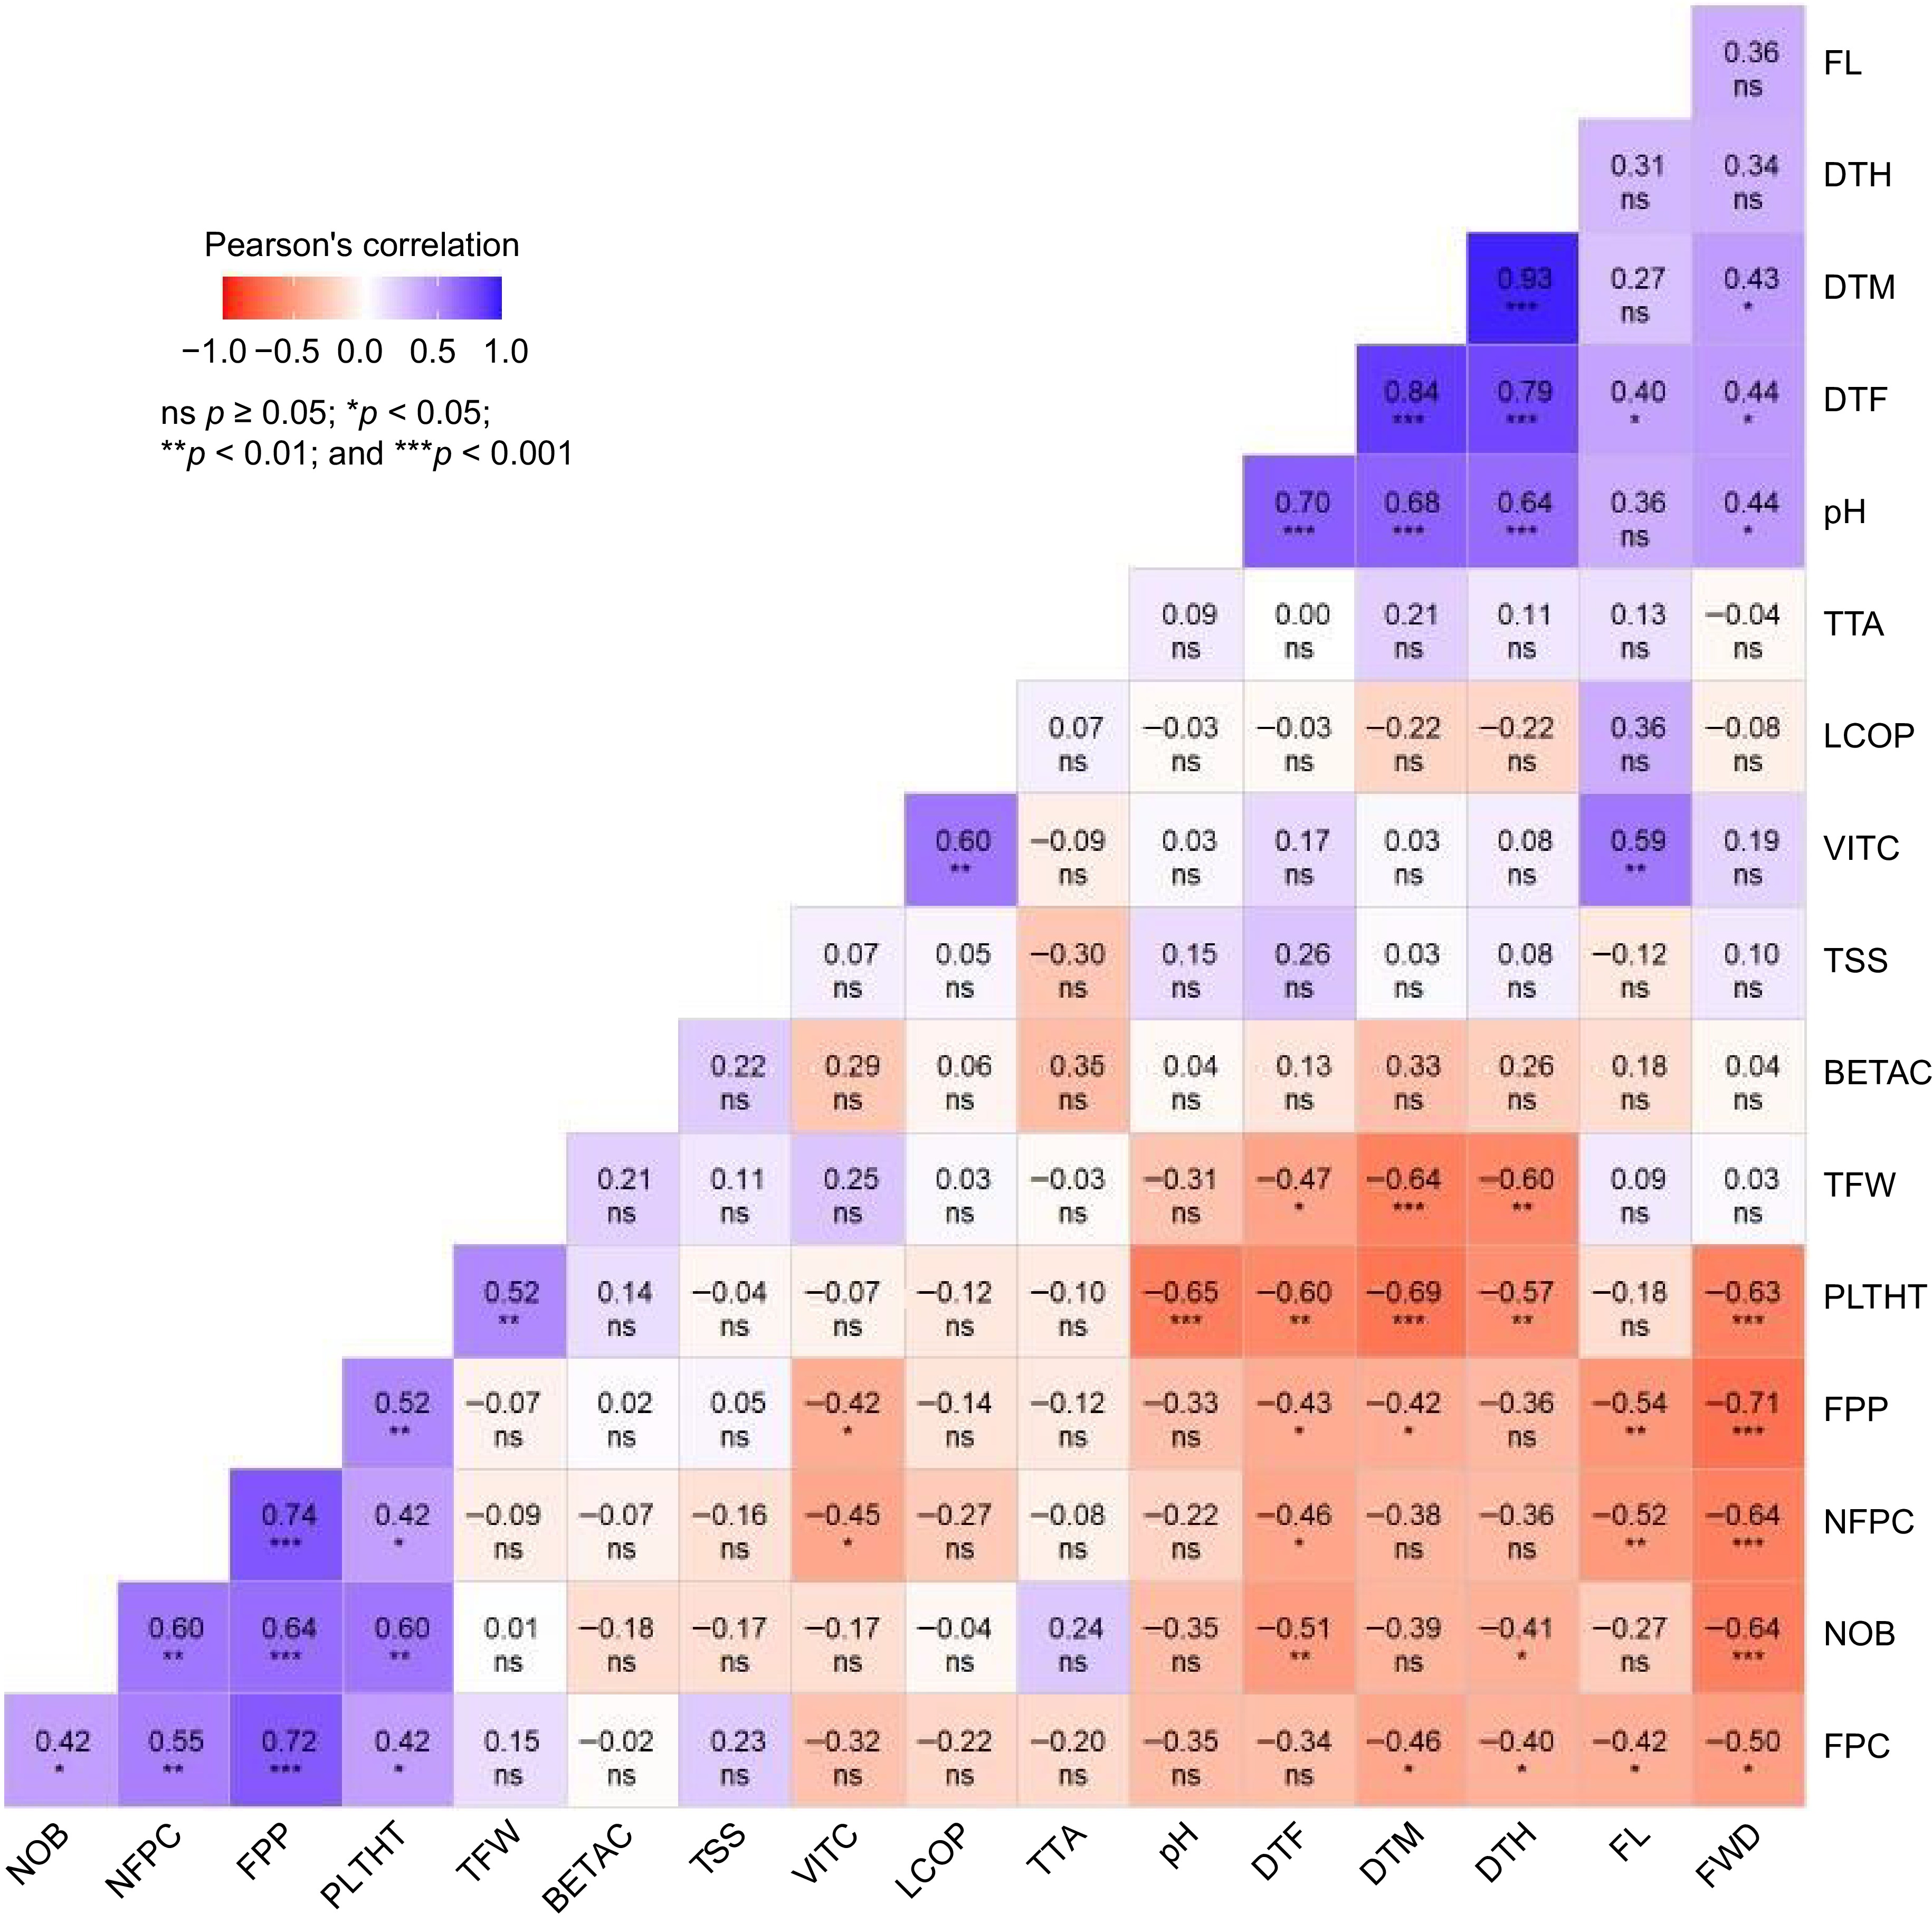
Figure 2.
Correlogram showing the relationship between average values of agronomic and physico-chemical traits of tomato accessions. Dark blue denotes a high negative correlation, whereas dark red represents a high positive correlation. The cell value denotes correlation coefficient (r) values. NOB = number of branches, DTF = number of days to flowering (d), DTM = number of days to maturity (d), FL = fruit length (cm), FWD = fruit width (cm), FPC = number of fruits per cluster, NFPC = number of flowers per cluster, PLTHT = plant height (cm), TFW = total fruit weight per plot (kg), DTH = number of days to first harvest (d), FPP = number of fruits per plot, VITC = vitamin C (mg 100 g−1), BETAC = β-carotene (mg 100 g−1), LCOP = lycopene (mg 100 g−1), TTA = titratable acidity (%), TSS = total soluble solid (°Brix), pH = fruit juice pH. *,**,*** significant at 0.05, 0.01 and 0.001 probability levels, respectively. ns = nonsignificant.
Principal component analysis (PCA) was based on the measured agronomic and physico-chemical traits (Supplemental Table S3). The first four principal components (PCs) with eigenvalues > 1 accounted for approximately 73% of the total variation among the accessions. The first and second PCs explained 37% and 16% of the total variation among the accessions, respectively. The proportion of variance explained by the third PC was 12% and the fourth PC accounted for 8% of the total variation. The PCs loading visualized by the PCA biplot shows the contributions of the measured traits to PC1 and PC2 (Fig. 3). The vectors of fruit width, fruit juice pH, total soluble solid, titratable acidity number of days to first harvest, flowering, and maturity points in the direction of PC1. The strength of vectors of these traits denotes a strong positive influence on PC1. Conversely, the vectors of number of branches, plant height, number of fruits per plot and fruits per cluster points to the negative side of PC1, indicating a strong negative influence on PC1. Vitamin C, fruit length, total fruit weight per plot, β-carotene, and lycopene had a strong influence on PC2. Besides, the color gradient shows the contribution of each trait to the PCs. The traits with vector of lighter blue color indicates higher contributions to the PCA model while the traits with a vector of darker blue color indicates lower contributions. In agreement with Pearson's correlation coefficients illustrated in Fig. 2, vectors of numbers of days to flowering, maturity, first harvest, and fruit juice pH pointing in the same direction with acute angles indicate a positive correlation among them. Likewise, the clustering of the vectors of numbers of branches, fruits per cluster, flowers per cluster and fruits per plot suggest a positive correlation among them. On the other hand, the vector of fruit width pointing in the opposite directions of the numbers of branches, fruits per cluster, flowers per cluster, and fruits per plot with obtuse angles suggest negative correlations. Superimposing the accessions on the trait plots (Fig. 3, biplot on the left) showed that NHTO-0569 is unique for late flowering and harvesting combination while NHTO-0259 was superior in numbers of fruits per cluster and fruits per plot. Similarly, NHTO-0572 is unique for numbers of branches and flowers per cluster in agreement with Supplemental Table S1.
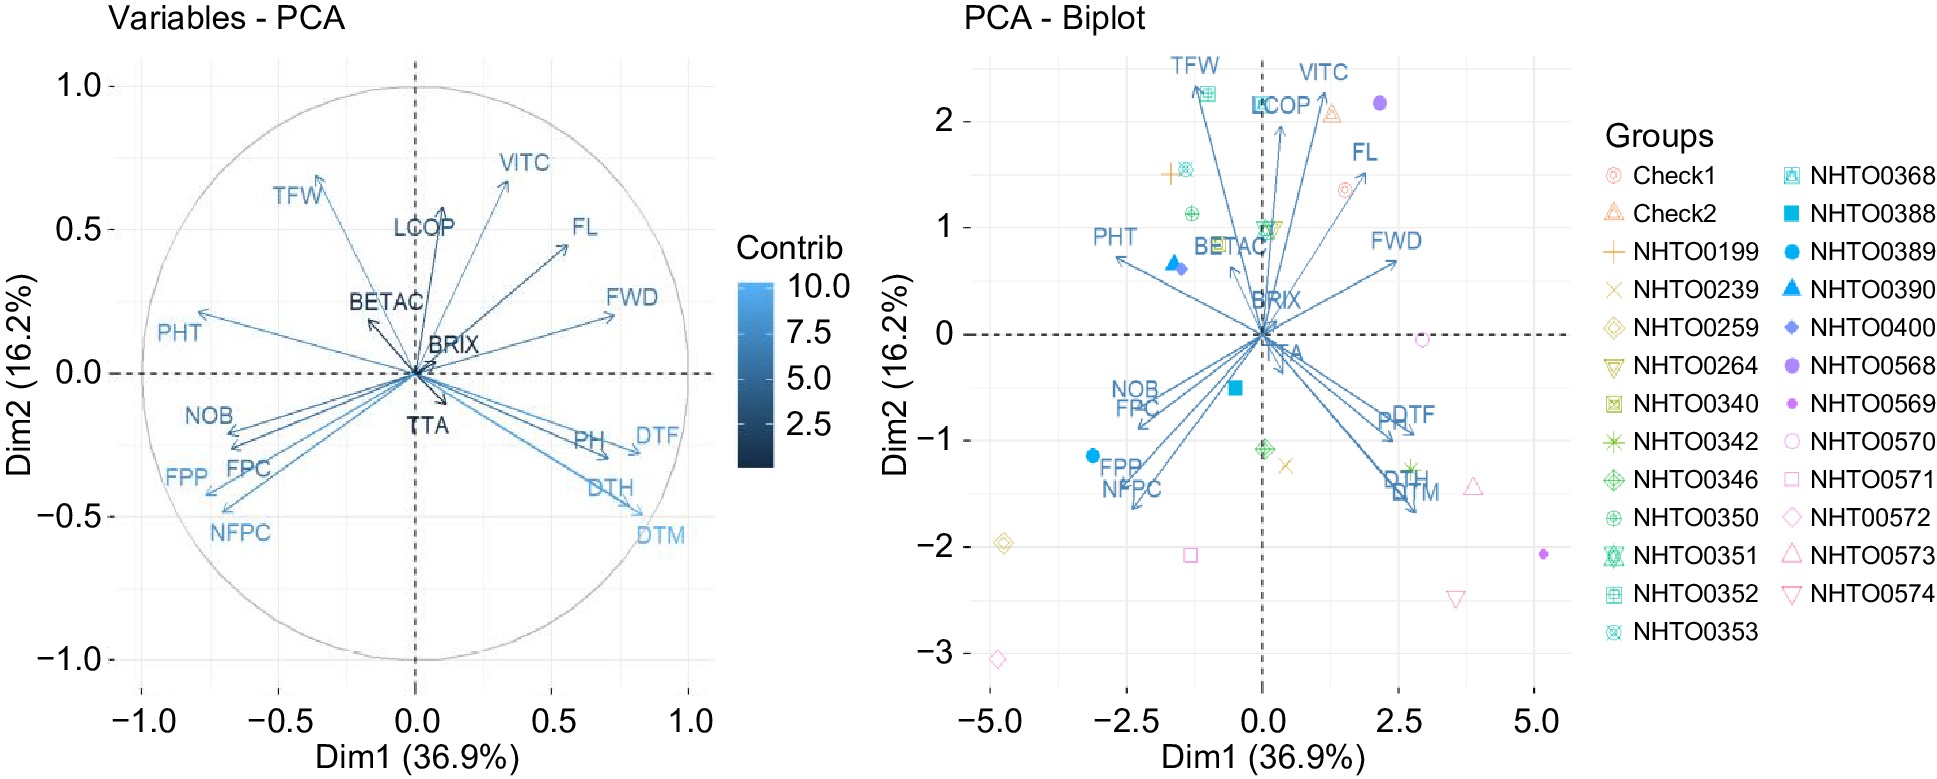
Figure 3.
A two-dimensional principal component analysis (PCA) showing the relationships among the 17 agronomic and physico-chemical traits and the 25 tomato accessions and checks evaluated. The first two components, PC1 (37%) and PC2 (16%) explaining the highest variance were plotted on the x-axis and y-axis, respectively. The arrows indicate traits contributing to the respective PCs and the correlation between traits can be determined by the close arrow proximity. NOB = number of branches, DTF = number of days to flowering (d), DTM = number of days to maturity (d), FL = fruit length (cm), FWD = fruit width (cm), FPC = number of fruits per cluster, NFPC = number of flowers per cluster, PHT = plant height (cm), TFW = total fruit weight per plot (kg), DTH = number of days to first harvest (d), FPP = number of fruits per plot, VITC = vitamin C (mg 100 g−1), BETAC = β-carotene (mg 100 g−1), LCOP = lycopene (mg 100 g−1), TTA = titratable acidity (%), TSS = total soluble solid (°Brix), PH = fruit juice pH.
The heatmap and dendrogram provided additional support to the PCA by arranging the measured traits into distinct clusters based on their correlation. The dendrogram represents similarity in the performance of the accessions based on the selected traits, showing diversity among the tomato accessions. The tomato accessions were classified into two main groups. Cluster I consisted of four accessions and cluster II had 21 accessions which was further divided into two sub-clusters (II 'a' and II 'b'). The first sub-cluster (II 'a') had 10 accessions including the accessions identified by RSI as superior for the number of fruits per plot, fruit weight, lycopene, and β-carotene while Cluster II 'b' comprises 11 accessions including the checks. Accessions that were tall with high numbers of fruits per cluster, flowers per cluster, fruits per plot, and branches clustered together (Figs 1 & 4). The four accessions in cluster I, had traits associated with fruit yield in common (number of fruits per plot). The accessions in cluster II 'a' and II 'b' had few traits in common and differed for other traits. Traits of the accessions in cluster II 'a' were a high count of branches, tall plants, high fruit weight per plot, and considerable physico-chemical traits. The accessions in this cluster strike a balance between agronomic traits and tomato fruit nutritional quality. The accessions in cluster II 'b' were either elongated or round, late flowering, late maturing and late harvesting with a substantial amount of lycopene and vitamin C content.
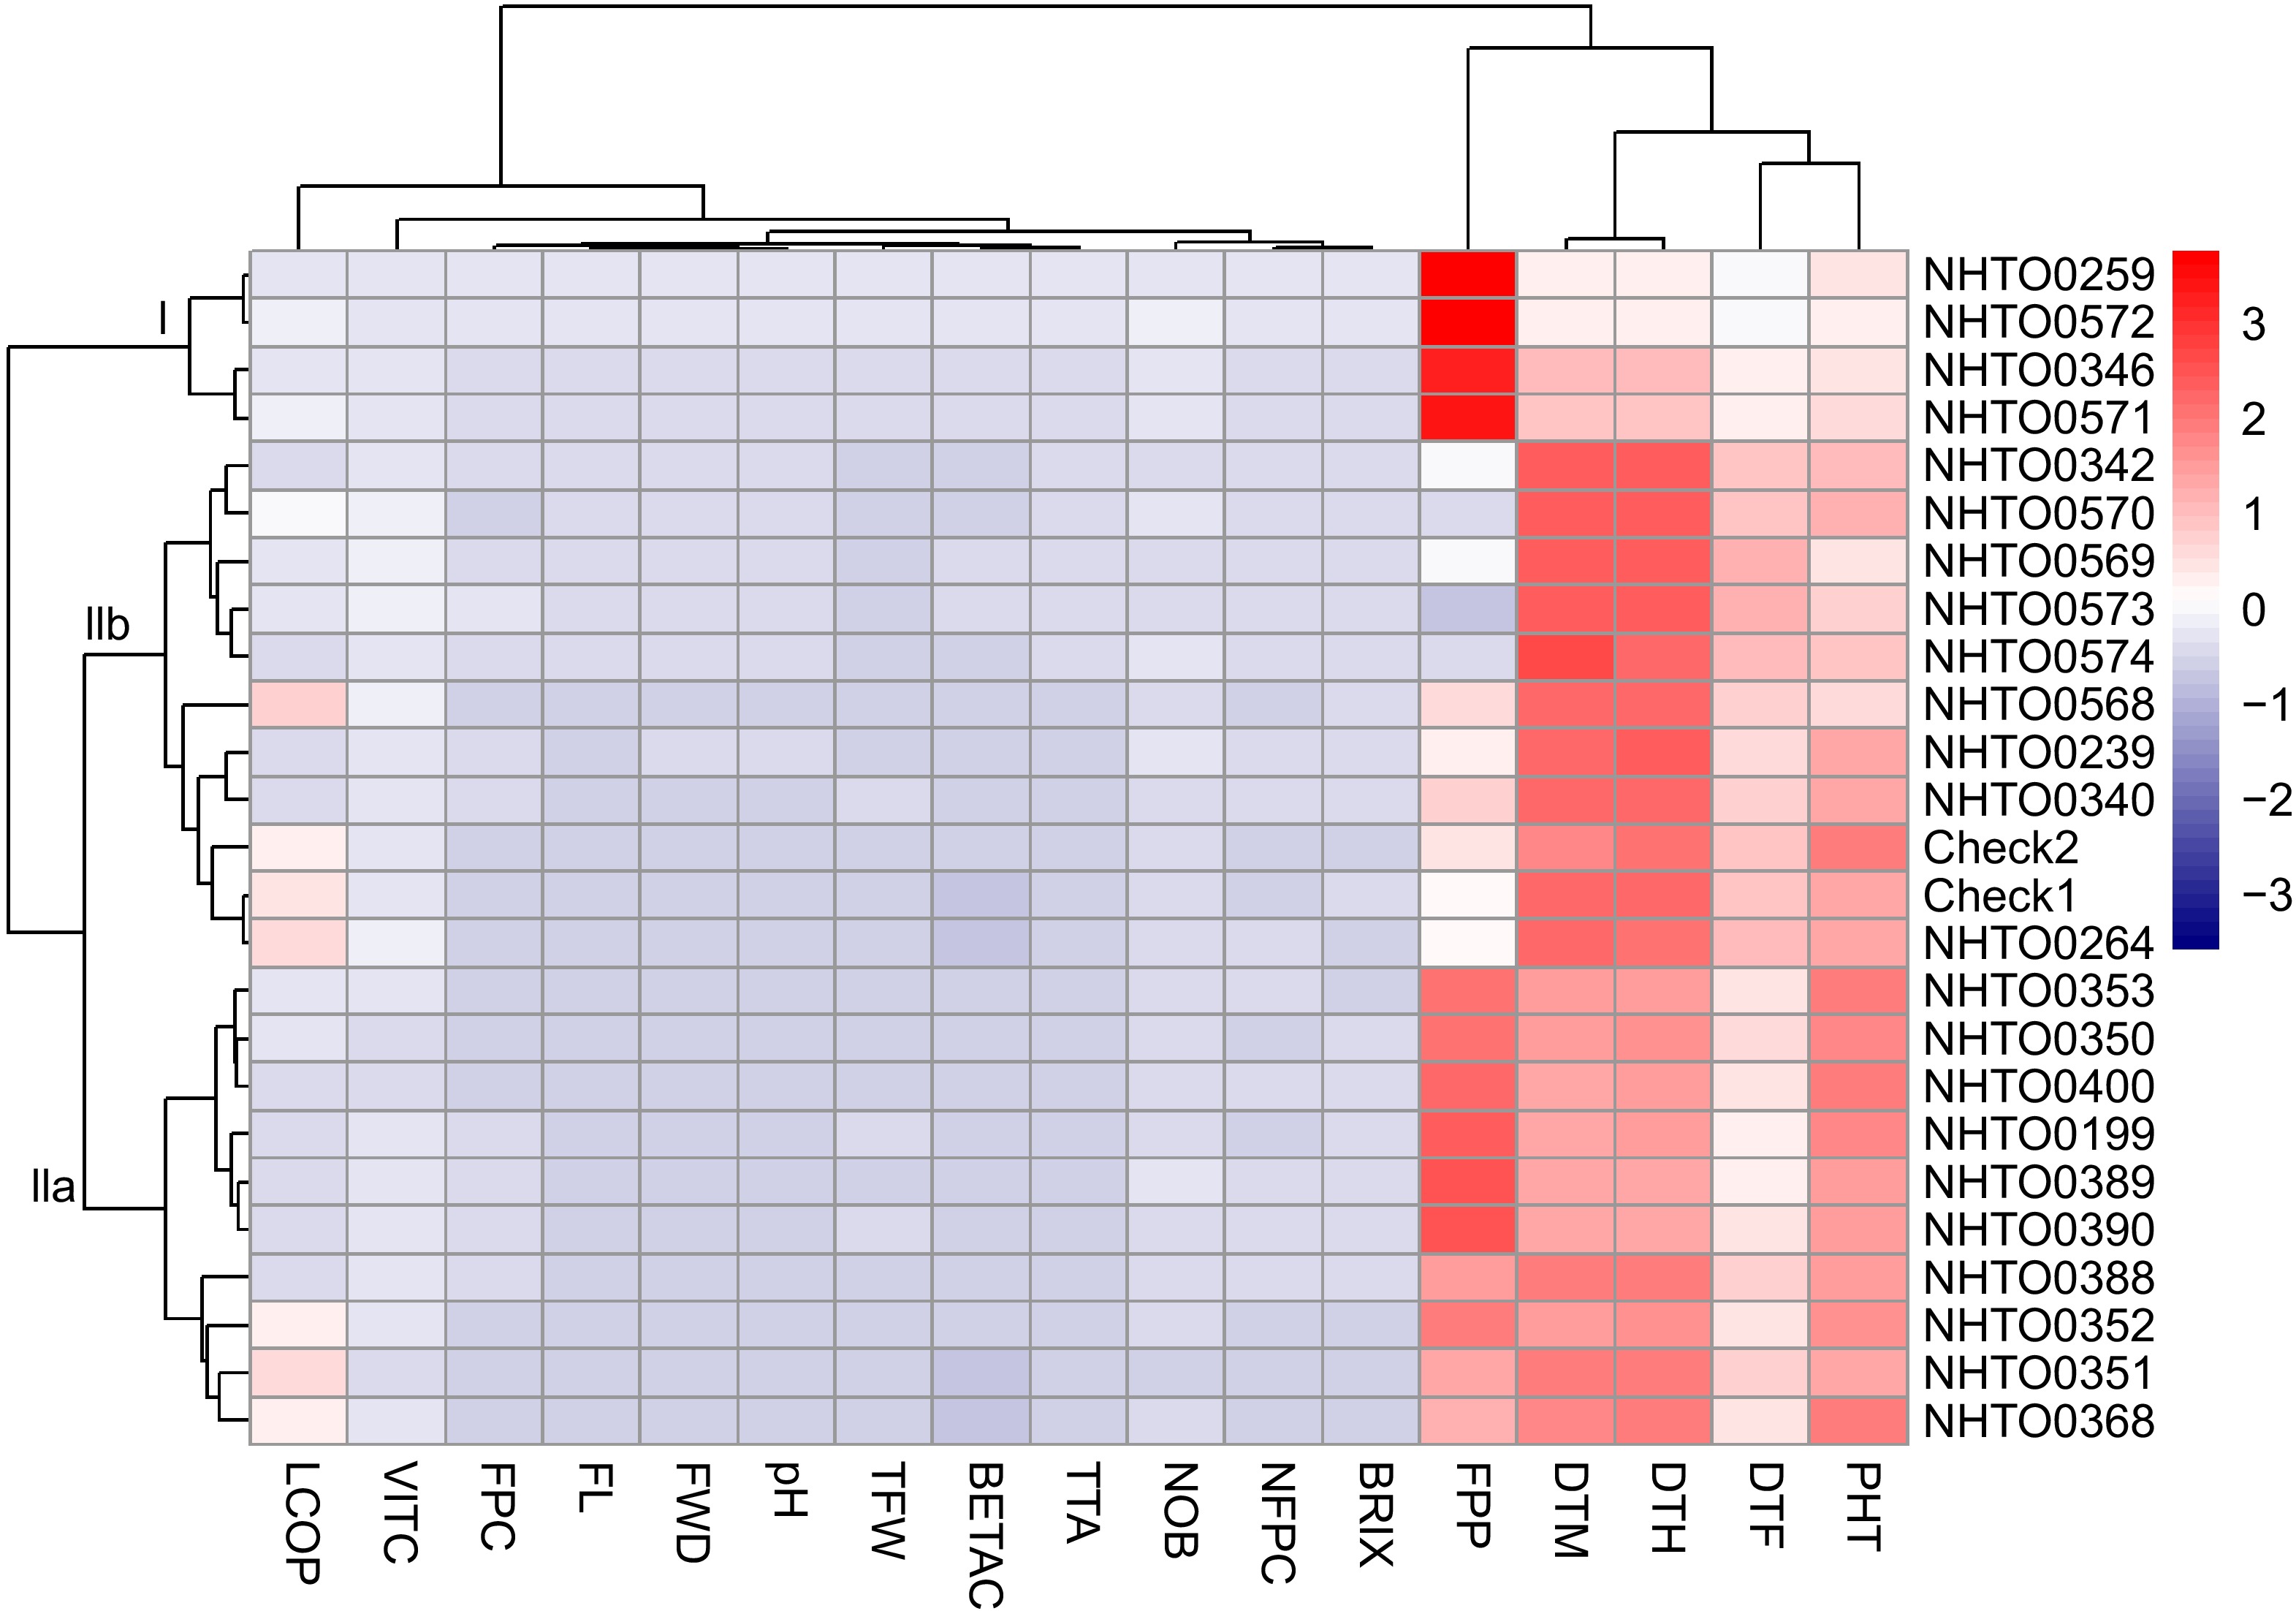
Figure 4.
Hierarchical clustering and heatmap of tomato accessions and checks based on the scaled values of the measured traits. Each row represents an accessions, and each column indicates a measured trait. Accessions are clustered based on their measured traits, and the traits groups are clustered based on their correlation. The traits that are clustered together have a high positive correlation. Cells with red and blue colours have high and low relative appearances, respectively. NOB = number of branches, DTF = number of days to flowering (d), DTM = number of days to maturity (d), FL = fruit length (cm), FWD = fruit width (cm), FPC = number of fruits per cluster, NFPC = number of flowers per cluster, PHT = plant height (cm), TFW = total fruit weight per plot (kg), DTH = number of days to first harvest (d), FPP = number of fruits per plot, VITC = vitamin C (mg 100 g−1), BETAC = β-carotene (mg 100 g−1), LCOP = lycopene (mg 100 g−1), TTA = titratable acidity (%), TSS = total soluble solid (°Brix), pH = fruit juice pH.
-
The efficacy of genetic resources in breeding depends on its capacity to boost productivity and diversity. To promote newly collected germplasm and identify novel source of traits; evaluation and characterization becomes essential for appropriate utilization in varietal development[3]. The 23 tomato accessions and two traditional varieties evaluated in this study performed differently in the same environment. The tomato leaves displayed slight variations in size, shape, and serration patterns. Based on leaf morphology, 88% of the accessions had regular leaves with serrated edges, while 12% had large, broad, and smooth edges (potato leaves). The tomato fruits fell into categories of flattened/ribbed, round, and elongated types. The traditional varieties were mainly elongated types, as they are well-suited to the local climate, and soil conditions, and the yield recorded by farmers also contribute to their popularity. Significant differences observed among the accessions for all measured traits indicates that selection of superior accessions in relation to fruit yield and physico-chemical traits for further improvement is realistic. This result corroborates the reports of Kumar et al.[18] & Tembe et al.[19] who reported significant variation in days to maturity, the number of fruits per plant and average fruit weight among tomato accessions evaluated. The variability observed among the tomato accessions may be attributed to their genetic make-up in consensus with previous studies[7,20] and this variability can be exploited for developing improved varieties for peculiar horticultural traits.
Regarding the time it takes for the accessions to reach flowering, fruiting, and fruit maturity among the accessions, the findings of this study exceeded those reported by Chávez-Servia et al.[21], who focused on tomato accession characterization. However, they were lower than the values reported by Fanedoul et al.[22], though they aligned with the findings of Kathimba et al.[23]. The association between earliness and maturity was further highlighted in this study because NHTO-0569 flowered latest (55 d) and also took the longest to mature (97 d). The variations in agronomic performance among the tomato accessions is mainly attributed to their genetic composition, aligning with the findings of Shah et al.[24]. The performance of some accessions were significantly superior to the traditional varieties used as check for majority of the traits measured. Some accessions were comparable to the checks for few agronomic traits, vitamin C, total soluble solid, and titratable acidity. This indicates that the evaluated accessions can be utilized for increasing the genetic potential of tomato to earn financial profits. Few accessions combines superiority for diverse traits; NHTO-0572 was outstanding for numbers of branches and flowers per cluster, likewise NHTO-0259, was outstanding for plant height, numbers of fruits per cluster and fruits per plot. NHTO-0568 had wide fruits with high lycopene content and NHTO-0199 with the highest fruit weight had 59% yield advantage over the best check (LC CHK-Y) with the high titratable acidity. Hence, these accessions have potential to meet the demand for improved fruit yield.
Carotenoids, vitamins, and antioxidant content of tomato fruits are of interest because of their nutritional value which offer health benefits to the consumers[25]. Variations in the physico-chemical traits among the accessions could stem from factors such as the genetic makeup of the accessions, the environmental conditions, or the stage of ripeness when harvested[26]. The vitamin C (antioxidant) contents in the fruits of the evaluated accessions were similar to the report of Shah et al.[24]. The lycopene content range observed in the assessed accessions exceeded the report of Srivalli et al.[27], who noted a range of 4.1 to 5.5 mg 100 g−1. The lycopene content in the evaluated accessions surpassed that of β-carotene, affirming the predominance of lycopene over β-carotene in red tomato fruits, as noted by Viskelis et al.[28]. The amounts of β-carotene in the evaluated accessions were comparable to the report of Agarwal & Rao[29]. The high (4.5−5.4 °Brix) total soluble solid (indicator for fruit sweetness) content of the accessions evaluated depict their suitability for the preparation of processed products. The present results confirmed that smaller tomato fruits had high concentrations of total soluble solid. The variation in total soluble solid content among these accessions was similar to the findings of Ali et al.[30] & Hossain et al.[31], who reported total soluble solid ranging from 3.7 to 5.4 °Brix in tomato varieties. The fruit juice pH was below 4.2 for all the accessions indicating their suitability for fresh consumption and industrial processing. According to Tigist et al.[32] a pH value below 4.5 is desirable in tomato, because it halts the proliferation of microorganisms. It is important to mention that the fruits with high titratable acidity which depicts higher flavour also had a lower pH which is desirable because low pH eliminates the risk of pathogen growth (Bacillus coagulans) in tomato fruits[33]. Furthermore, accessions NHTO-0352, NHTO-0350, NHTO-0199, NHTO-0351, and NHTO-0346 were identified as outstanding for combinations of agronomic and physico-chemical parameters.
For direct and indirect selection towards genetic improvement of crops, correlation analysis is inevitable. In this study, the correlation coefficient between traits ranged from weak, moderate and strong positives to negatives. The highest positive and significant correlation coefficient observed was between the number of days to maturity and the number of days to first harvest followed by number of days to flowering and number of days to maturity, number of flowers per cluster and number of fruits per plot which has similar direction and strength with number of fruits per cluster and number of fruits per plot. The days to flowering determines either earliness or lateness of an accession and it has been reported to be closely associated with the maturity of the tomato accession[23]. As both traits tend to increase together, this strong correlations implies the potential for improving both traits simultaneously. Conversely, significant negative correlations were noted between the number of fruits per plot and fruit width, the number of fruits per plot and fruit length, while a positive correlation was observed with plant height. This implies that fruit yield is influenced by the interaction of multiple traits, with tall plants exhibiting a greater number of fruits per plot compared to short plants. This relationship could be attributed to the taller plants' capability to capture more light energy, which is crucial for efficient photosynthesis and subsequent partitioning towards fruit production. The correlations among these traits may save breeding time as easily measurable traits could be useful in selection[34].
The PCA identified four PCs explaining 73% of the total variations observed. The traits that mostly responsible for variation in the tomato accessions were outlined. The phenological stages of tomato, which influence productivity, contributed to the observed variations. Key traits driving these variations included the number of days to flowering, maturity, and first harvest, along with fruit width, plant height, number of fruits per plot, fruit weight, lycopene and vitamin C contents. Most of these traits were associated with PC1 and PC2. Notably, PC1 and PC2, accounting for 37% and 16% of the variation, respectively, made the most significant contributions to the overall variance in this study. Hence, these highly discriminating traits may be considered as descriptors for phenotypic characterization of tomato germplasm. The current findings align with those of Chernet et al.[35], who identified six PCs, collectively explaining 83% of the total variation.
The cluster analysis grouped the 23 tomato accessions and two traditional varieties used as checks into distinct clusters. Grouping into different clusters was associated with their shared similarities in agronomic and physico-chemical traits. The pattern of clusters revealed that the phenotypic diversity was not associated with the collection source because some accessions collected from the same source were grouped in different clusters. These findings are supported by the findings of Hussain et al.[36] & Kiran et al.[37]. It is important to mention that four accessions out of the top five identified by RSI were all grouped together. Therefore, simultaneous improvement in fruit yield, titratable acidity, total soluble solid, lycopene, Vitamin C, and β-carotene contents could be possible by selecting promising parental lines from the diverse clusters. Parental line selected from these dissimilar clusters will vary in the number of favourable alleles for a specific trait; hence hybridization will exploit heterosis to produce desired (high-yielding and quality) allelic recombinants[38]. Therefore, the heat map analysis effectively grouped tomato accessions according to their trait expression patterns. In contrast, PCA facilitated the plotting of trait relationships and the identification of accessions based on the trends in trait combinations.
-
The performance of the agronomic and physico-chemical traits of the evaluated tomato accessions varied. Accessions NHTO-0352, NHTO-0350, NHTO-0199, NHTO-0351, and NHTO-0346 stood out for their exceptional performance for fruit yield and physico-chemical traits. The strong correlations among traits gave valuable insights into the associations among the measured agronomic and physico-chemical traits. The strength of correlated traits would help in improvement of more than one trait at a time. The PCA and heatmap clustering analyses sheds light on how various growth, physiological, and phenological traits impact tomato fruit yield and physico-chemical traits. The clustering of the accessions was majorly based on genetic relatedness. The degree of similarity and divergence observed among the tomato accessions is essential for selection and hybridization plan in tomato breeding programmes. These results present useful genetic variations for tomato breeding programmes. However, the yield and quality traits of tomato are highly influenced by the environment. The superior accessions identified in this study will be subjected to multi-environment evaluation for confirmation of fruit yield and quality potentials.
-
The authors confirm contribution to the paper as follows: study conception and design: Olayinka AO, Ibitoye DO; data collection: Olayinka AO, Ibitoye DO; analysis and interpretation of results: Olayinka AO, Aderibigbe OR; draft manuscript preparation: Olayinka AO. All authors reviewed the results and approved the final version of the manuscript.
-
The datasets generated during and/or analyzed during the current study are available from the corresponding author on reasonable request.
-
We appreciate the genetic resources unit of National Horticultural Research Institute, (NIHORT) Ibadan, Nigeria for providing the tomato accessions used in this study. We are grateful to the students of the Department of Crop Production and Soil Science, Faculty of Agricultural Sciences, Ladoke Akintola University of Technology, Ogbomoso, Nigeria, for their technical assistance.
-
The authors declare that they have no conflict of interest.
- Supplemental Table S1 Mean performance for agronomic traits of tomato accessions and the checks evaluated.
- Supplemental Table S2 Mean performance of the evaluated tomato accessions and the checks for physico-chemical traits.
- Supplemental Table S3 Principal component analysis of the contributions of agronomic and physico-chemical traits to total variation among the tomato accession and checks evaluated.
- Copyright: © 2024 by the author(s). Published by Maximum Academic Press, Fayetteville, GA. This article is an open access article distributed under Creative Commons Attribution License (CC BY 4.0), visit https://creativecommons.org/licenses/by/4.0/.
-
About this article
Cite this article
Olayinka AO, lbitoye DO, Aderibigbe OR. 2024. Unveiling phenotypic diversity among tomato (Solanum lycopersicum L.) accessions: a comprehensive analysis of agronomic and physico-chemical traits. Technology in Horticulture 4: e021 doi: 10.48130/tihort-0024-0018 

Unveiling phenotypic diversity among tomato (Solanum lycopersicum L.) accessions: a comprehensive analysis of agronomic and physico-chemical traits
- Received: 14 May 2024
- Revised: 10 August 2024
- Accepted: 22 August 2024
- Published online: 12 September 2024
Abstract: The rising significance of tomato (Solanum lycopersicum L.) in human diet necessitates the continuous search for genotypes with favorable alleles for agronomic and nutritional properties from untapped genetic diversity. In this study, the phenotypic diversity of tomato accessions was assessed for agronomic and physico-chemical traits to identify accessions with potential horticultural traits that can be utilized in tomato improvement programs. A set of 23 accessions collected from the National Horticultural Research Institute (NIHORT), Ibadan, Nigeria, and two traditional varieties used as checks were evaluated in a 5 × 5 α-lattice design with three replicates at the Teaching and Research Farm of Ladoke Akintola University of Technology, Ogbomoso, Nigeria in the main cropping season of 2021. Data collected includes six physico-chemical parameters and 11 agronomic traits. Analysis of variance showed that accessions varied significantly (p < 0.001) for all of the traits measured. Wide variations were observed for some traits suggesting a considerable level of diversity among the accessions. Accession NHTO-0199, with the highest fruit weight, had a 59% yield advantage over the best traditional variety. The first two principal components accounted for 53% of the total variation among the tomato accessions. The patterns of variation were described by the phenological stages of flowering, fructifying, fruit maturation, plant height, fruit yield components, lycopene, and vitamin C content of the fruits. The cluster analysis delineated the accessions into three distinct clusters and hybridization between clusters may generate desired allelic combinations useful for developing unique variety. The following top five accessions: NHTO-0352, NHTO-0350, NHTO-0199, NHTO-0351, and NHTO-0346 had outstanding performances for fruit yield and physico-chemical traits based on Rank Summation Index. These superior accessions can be advanced for further improvement and may be used as sources of traits in crosses to develop new breeding lines.
-
Key words:
- Characterization /
- Horticulture /
- Germplasm /
- Variation /
- Breeding /
- Nutritional composition