


-
Kudzu (Pueraria montana var. lobata (Ohwi) Maesen & S. M. Almeida) (2n = 2x = 22) is a semi-woody, perennial liana, that belongs to the Leguminosae family and is widely distributed throughout Asia, including China, Japan, Korea and other regions in Southeast Asia, as well as in North and South America. As an economic crop, it contains puerarin and other functional components and is used in the production of both pharmaceuticals and health foods. Pueraria montana var. thomsonii is another variety that shows higher starch content and thus is called starch kudzu. The roots of both P. montana var. lobata and P. montana var. thomsonii have been long used for treating fever, toxicosis, indigestion, and liver damage from alcohol abuse in traditional Chinese medicine[1], which was recorded in The Divine Husbandman's Classic of Materia Medica (Shen Nong Ben Cao Jing) compiled in the Eastern Han Dynasty (25−250 AD). China is probably the origin and distribution center of Pueraria species; however, for a long time, the identification and the breeding of germplasm resources has not received enough attention. Guangxi is a hotspot of Pueraria genetic resources in China. Kudzu is a traditional crop cultivated in Guangxi, with abundant germplasm resources at elevations of 100−199 m[2]. At present, the cultivation area of kudzu and starch kudzu in Guangxi accounts for 20% of the whole country[3]. However, the genetic diversity and core germplasm of the Pueraria species in Guangxi are not well understood.
With the development of urban society and excessive mining, many germplasm resources are facing the risk of loss or extinction. Genetic diversity provides a basis for the improvement of the crop for different desirable traits, evolutionary capability, species survival, management of germplasm collections, and breeding programs[4−6]. Therefore, it is necessary to fully understand the genetic diversity and genetic information of Pueraria core germplasm resources of the representative individuals, which can protect key genetic resources and shorten the breeding process[7,8]. Most recently, RAPD (random amplified polymorphic DNA), ISSR (inter-simple sequence repeat), SRAP (sequence-related amplified polymorphic), SCoT (start condon targeted polymorphism), and SSR (simple sequence repeats) markers have been used to analyze the genetic diversity in Pueraria[3,9−14]. Genic-SSRs have the most advantages among these five markers because of the more comprehensive genetic information in the genome[15,16]. Genic-SSRs were used to evaluate the diversity of Pueraria, however, the population is just 44 lines[17]. Although genetic analysis of Pueraria on some accessions of Pueraria or some germplasm resources in Guangxi has been done[3], the core germplasm resource and the overall evaluation on the genetic diversity has not yet been systematically evaluated.
Lack of systematic study of the genetic diversity and the core germplasm resource seriously restricts its efficient management, conservation and further utilization[5]. In the present study, 272 individuals of Pueraria collected in Guangxi were used to estimate the extent of genetic diversity and construct the core germplasm. The findings of this study will be utilized for conservation and management of genetic resources in Guangxi, association mapping, and traits-based kudzu breeding.
-
A total of 272 individuals of Pueraria were collected in Guangxi from September 2017 to April 2019 (Supplemental Table S1). Three to five fresh young leaves of each accession were collected and immediately frozen in liquid nitrogen and stored at −80 °C until DNA isolation.
Total genomic DNA was extracted from young leaf tissue of individual representative plants of each accession using a Plant DNA Isolation Reagent Kit (TaKaRa, Dalian, China). We measured the concentration and purity of the total DNA using both 1% agarose gel electrophoresis and a Nanodrop instrument (UV-2700). The total DNA extracts were stored at −20 °C until required for experiments.
SSR genotyping
-
The final concentration of DNA was adjusted to 50 ng/μl for PCR reaction. Based on the transcriptome of P. montana var. lobata, 28 SSR primers were designed and scored in six Pueraria collections from 229 SSRs[17]. Ultimately, 23 polymorphic markers were chosen for genetic diversity analysis (Table 1). SSR amplification was carried out in a thermal cycler by Bio-Rad (MyCycler TM), in a final volume of 20 μl containing: 100 ng of genomic DNA, 10 μl of Taq DNA polymerase mix (TaKaRa, Dalian, China), and 10 μM each, forward and reverse non-fluorescent primers. The program used for PCR amplification was as follows: initial denaturation at 94 °C for 5 min; 30 cycles of denaturation at 94 °C for the 30 s, annealing at 50 °C for 30 s, extension at 72 °C for 30 s, and a final extension at 72 °C for 10 min. Amplified products were separated in 6% non-denaturing polyacrylamide gel electrophoresis (PAGE). The SSR markers amplified at sizes between 100 and 400 bp were converted into '0' and '1' codes denoting 'absence' and 'presence', respectively.
Table 1. Amplification results and polymorphism information of 23 SSR primers.
No. Primer name Sequences (5'-3') Total number
of landsNumber of
polymorphic bandsPolymorphism
rate (%)1 PtSSR36 Fw: CTGAGTCTCTGCAAAGCCCA 10 10 100 Rv: TGTCACTGTGCTCCAACTCC 2 PtSSR98 Fw: CATTCGGACCTCCATACCCG 11 10 90.9 Rv: CCGCATCCAACCCTGATCAA 3 PtSSR99 Fw: GCTTTCCGCTGCTACCATTC 7 7 100 Rv: GCAACCCCAATGCTTCACAG 4 PtSSR104 Fw: CACCCTCCCACCACTACAAC 3 3 100 Rv: GCAATGTCCTCCTCAGCTGT 5 PtSSR108 Fw: AGCGTGCCCAACTCAGTTAA 3 3 100 Rv: CGACGGAGAAGGAGGGAATG 6 PtSSR109 Fw: CAACCTGGCTTCTGTTGTGC 5 4 80 Rv: CTCTGAAACGCTGGGCAATG 7 PtSSR121 Fw: ACACTCAACACTCCACCACC 3 2 66.67 Rv: AGGGTTTCCACCTTGAACCG 8 PtSSR122 Fw: GGGGTTTCTTCTCGGCTGAA 11 11 100 Rv: CACCCCCTTCACGCTTCATA 9 PtSSR130 Fw: ATCAGTGTCTACGTGGGGGA 5 4 80 Rv: CACTGCAGCCACAACAACAT 10 PtSSR135 Fw: GATCCGCACCCTATCTGTGG 8 8 100 Rv: CTGCGACAGCTCCGATCTTA 11 PtSSR144 Fw: TGTTGCTTTGAACACTAACATGCT 3 3 100 Rv: TGCCCTTGTCAGACACAACA 12 PtSSR155 Fw: TTCAACATTCCCCCAACCCC 2 2 100 Rv: AAGAAGAGGAACACCAGGCC 13 PtSSR168 Fw: GATCCCACCCACCACTTCTG 5 5 100 Rv: GGCTCTAGTTCTGGTGCTGG 14 PtSSR172 Fw:TCTCCAAAACAAGAAGGAAACTCC 4 3 75 Rv: TCTTTCCTCTTCTGGTATCCCA 15 PtSSR174 Fw: CAAAGAAGAAGCAGCCGCAG 6 6 100 Rv: GTCAATCCCGAAGCACTTGC 16 PtSSR175 Fw: CTGAGTCTCTGCAAAGCCCA 7 7 100 Rv: TGTCACTGTGCTCCAACTCC 17 PtSSR186 Fw: TGTTGCTTTGAACACTAACATGCT 4 4 100 Rv: TGCCCTTGTCAGACACAACA 18 PtSSR187 Fw: TGTTGCTTTGAACACTAACATGCT 4 4 100 Rv: TGCCCTTGTCAGACACAACA 19 PtSSR190 Fw: AACTGCAGGAGGAGCATGAC 5 5 100 Rv: GAGCCTCCAGGTTCTTGTCC 20 PtSSR191 Fw: GGAAGCATTGCGGTTTGGTT 3 3 100 Rv: TCACATCACATGCTGCCACT 21 PtSSR196 Fw: GCAAGAACCTGTGCTCCTCT 3 2 66.67 Rv: TGCCAATGCCATTGTGGTTG 22 PtSSR201 Fw: GCCTCTTCCAGCGAGAACTT 4 4 100 Rv: TGATCCTCCCCAACAAGCTG 23 PtSSR222 Fw: TGTGCAAGAAGGATGGGTGA 2 2 100 Rv: GGTTGCATTCGGAAGCAACA Total 118 112 Avarage 5.13 4.87 94.91 Statistical analysis
-
For each SSR locus, Popgene32 version 1.32 was used to analyze the gene frequency, number of allele (Na), effective number of alleles (Ne), polymorphic loci, Nei's genetic distance (D), Shannon–Weaver diversity index (I), Homogeneity test index (H) and gene flow (Nm).
Genetic structure was inferred by STRUCTURE version 2.3.1[18]. The number of genetic clusters (K) was set from 1 to 20 with a burn-in period of 50000 steps followed by a run with 100000 iterations. Twenty independent runs were undertaken for each K value. Later, three replicates of the analysis were implemented in CLUMPP software[19]. The mean posterior probabilities [Lnp(D)] values of each K were calculated according to Pritchard et al., along with ∆K[18,20] to explore the optimum number of clusters (K). The most likely number of clusters was determined using a structure harvester (
http://taylor0.biology.ucla.edu/structureHarvester/ )[21]. Cluster analysis by the unweighted pair group method with arithmetic mean (UPGMA) based on the jaccard method was also developed using the NTSYS-pc 2.10e software[22]. A principal component analysis (PCA) was performed using NTSYS 2.10.The core collection was developed employing software Core hunter in R package[23]. To assess the core germplasm set, maximum Shannon's diversity index was estimated.
-
Encoding binary digit format for genotyping sequence format to exploit the utility of potential core SSRs to fingerprint Pueraria accessions. The utilization efficiency and 23 primers information are shown in Table 1 & Supplemental Fig. S1. A total of 118 alleles were detected among 272 Pueraria individuals, leading to a mean number of alleles per locus of 5.13 (ranging from two for PsSSR155 and PtSSR222, to 11 for PtSSR98 and PtSSR122). A total of 112 polymorphic alleles (94.91%) was identified with an average of 4.87 effective alleles per locus. Among the 118 alleles, 11 (9.3%) were rare alleles with frequency less than 1% and four of them were found to be only once in one individual. The average of the observed number of alleles (Na) and the effective number of alleles (Ne) were 1.9492 and 1.2841, respectively.
Population genetic diversity
-
The population-level genetic diversity of the Pueraria accessions under study is presented in Table 2. Nei's gene diversity ranged from 0 to 0.5 and Shannon's information index (I) ranged from 0 to 0.6931 across all 23 SSR loci with an average of 0.1778 and 0.2858, respectively. The average value of total expected heterozygosity (Ht) and Nm were recorded at 0.1841 and 1.7690, respectively.
Table 2. Genetic characteristics for 112 polymorphic microsatellite loci in 272 individuals of Pueraria species in the present study.
Locus Sample size Na Ne h I Ht Hs Gst Nm 36-1 272 2 1.0112 0.011 0.0344 0.0129 0.0128 0.0066 75.8301 36-2 272 2 1.0112 0.011 0.0344 0.0129 0.0128 0.0066 75.8301 36-3 272 2 1.0463 0.0443 0.1082 0.0517 0.0503 0.0273 17.8197 36-4 272 2 1.0074 0.0074 0.0244 0.0086 0.0086 0.0043 114.4978 36-5 272 2 1.1017 0.0923 0.1941 0.1063 0.1007 0.0531 8.9206 36-6 272 2 1.0843 0.0778 0.1696 0.0905 0.086 0.0499 9.5227 36-7 272 2 1.2654 0.2098 0.3650 0.2394 0.2025 0.1541 2.7446 36-8 272 2 1.9322 0.4824 0.6755 0.4915 0.4157 0.1543 2.7395 36-9 272 2 1.034 0.0329 0.0849 0.0309 0.0308 0.0032 156.1603 36-10 272 2 1.0074 0.0074 0.0244 0.0086 0.0086 0.0043 114.4978 98-1 272 2 1.0188 0.0184 0.0527 0.0216 0.0213 0.011 44.8945 98-2 272 2 1.1442 0.126 0.2473 0.145 0.1336 0.0786 5.8651 98-3 272 2 1.1499 0.1304 0.2539 0.1509 0.1374 0.0895 5.0838 98-4 272 2 1.0584 0.0552 0.1291 0.0634 0.0616 0.0275 17.6531 98-5 272 2 1.0383 0.0369 0.0933 0.0431 0.0421 0.0225 21.6887 98-6 272 2 1.0383 0.0369 0.0933 0.0431 0.0421 0.0225 21.6887 98-7 272 2 1.0671 0.0629 0.1433 0.0733 0.0704 0.0396 12.1273 98-8 272 2 1.0671 0.0629 0.1433 0.0733 0.0704 0.0396 12.1273 98-9 272 2 1.16 0.1379 0.2652 0.1595 0.1442 0.0957 4.7224 98-10 272 1 1.0000 0.0000 0.0000 0 0 98-11 272 2 1.0149 0.0147 0.0436 0.0161 0.016 0.003 166.8934 99-1 272 2 1.0188 0.0184 0.0527 0.0216 0.0213 0.011 44.8945 99-2 272 2 1.0615 0.058 0.1343 0.0592 0.0592 0.0007 711.3620 99-3 272 2 1.288 0.2236 0.3830 0.2029 0.1857 0.0849 5.3899 99-4 272 2 1.2065 0.1712 0.3129 0.1855 0.1781 0.04 12.0065 99-5 272 2 1.14 0.1228 0.2424 0.1422 0.1304 0.0835 5.4886 99-6 272 2 1.3643 0.267 0.4375 0.2622 0.261 0.0043 114.6222 99-7 272 2 1.5399 0.3506 0.5353 0.3448 0.3421 0.0076 65.5416 104-1 272 2 1.034 0.0329 0.0850 0.0352 0.0351 0.0039 128.2046 104-2 272 2 1.9558 0.4887 0.6818 0.4964 0.3986 0.1969 2.0392 104-3 272 2 1.9992 0.4998 0.6929 0.4957 0.3738 0.2459 1.5335 108-1 272 2 1.6292 0.3862 0.5746 0.393 0.3882 0.0122 40.3512 108-2 272 2 1.4728 0.321 0.5016 0.3331 0.3234 0.0292 16.6414 108-3 272 2 1.6831 0.4058 0.5958 0.3972 0.3883 0.0223 21.9303 109-1 272 2 1.2934 0.2269 0.3872 0.2568 0.2167 0.1562 2.7010 109-2 272 2 1.0149 0.0147 0.0436 0.0161 0.016 0.003 166.8934 109-3 272 2 1.2934 0.2269 0.3872 0.2568 0.2167 0.1562 2.7010 109-4 272 2 1.0149 0.0147 0.0436 0.0161 0.016 0.003 166.8934 109-5 272 1 1 0 0.0000 0 0 121-1 272 2 1.0753 0.07 0.1561 0.0805 0.0775 0.0374 12.8581 121-2 272 2 1.0753 0.07 0.1561 0.0805 0.0775 0.0374 12.8581 121-3 272 1 1 0 0.0000 0 0 122-1 272 2 1.0304 0.0295 0.0778 0.0345 0.0339 0.0179 27.4911 122-2 272 2 1.1351 0.119 0.2367 0.1379 0.1268 0.0805 5.7097 122-3 272 2 1.0304 0.0295 0.0778 0.0345 0.0339 0.0179 27.4911 122-4 272 2 1.0887 0.0815 0.1760 0.0948 0.0898 0.0525 9.0192 122-5 272 2 1.0887 0.0815 0.1760 0.0948 0.0898 0.0525 9.0192 122-6 272 2 1.0671 0.0629 0.1433 0.0733 0.0704 0.0396 12.1273 122-7 272 2 1.0343 0.0332 0.0856 0.0388 0.038 0.0202 24.2677 122-8 272 2 1.4253 0.2984 0.4752 0.2929 0.2912 0.0058 85.4766 122-9 272 2 1.0037 0.0037 0.0134 0.0043 0.0043 0.0022 230.4989 122-10 272 2 1.5187 0.3415 0.5250 0.3673 0.3146 0.1435 2.9847 122-11 272 2 1.2973 0.2291 0.3902 0.2608 0.2152 0.1748 2.3604 130-1 272 2 1.2025 0.1684 0.3090 0.194 0.1703 0.1221 3.5945 130-2 272 2 1.2025 0.1684 0.3090 0.194 0.1703 0.1221 3.5945 130-3 272 2 1.0383 0.0369 0.0933 0.0431 0.0421 0.0225 21.6887 130-4 272 2 1.0383 0.0369 0.0933 0.0431 0.0421 0.0225 21.6887 130-5 272 1 1 0 0.0000 0 0 135-1 272 2 1.0149 0.0147 0.0438 0.0172 0.0171 0.0088 56.4956 135-2 272 2 1.0587 0.0554 0.1296 0.0647 0.0624 0.0346 13.9494 135-3 272 2 1.3477 0.258 0.4264 0.2931 0.2295 0.2171 1.8032 135-4 272 2 1.0111 0.011 0.0343 0.0118 0.0118 0.0013 397.0141 135-5 272 2 1.3127 0.2382 0.4017 0.2716 0.219 0.1934 2.0859 135-6 272 2 1.0149 0.0147 0.0436 0.0161 0.016 0.003 166.8934 135-7 272 2 1.7785 0.4377 0.6295 0.4706 0.1885 0.5994 0.3341 135-8 272 2 1.9656 0.4913 0.6844 0.4999 0.1558 0.6884 0.2263 144-1 272 2 1.0343 0.0332 0.0856 0.0388 0.038 0.0202 24.2677 144-2 272 2 1.9251 0.4805 0.6736 0.479 0.4776 0.0029 174.8282 144-3 272 2 1.6998 0.4117 0.6020 0.3877 0.3213 0.1713 2.4193 155-1 272 2 1.0698 0.0652 0.1475 0.0687 0.0684 0.0049 101.9746 155-2 272 2 1.2483 0.1989 0.3507 0.2281 0.1936 0.1512 2.8079 168-1 272 2 1.501 0.3338 0.5162 0.3124 0.2825 0.0956 4.7296 168-2 272 2 1.9254 0.4806 0.6736 0.4892 0.4321 0.1166 3.7876 168-3 272 2 1.5113 0.3383 0.5214 0.3181 0.2904 0.0869 5.2557 168-4 272 2 1.9569 0.489 0.6821 0.4954 0.4328 0.1262 3.4613 168-5 272 2 1.0074 0.0073 0.0243 0.0075 0.0075 0.0001 2000.0000 172-1 272 2 1.2368 0.1915 0.3407 0.2198 0.1882 0.1438 2.9771 172-2 272 2 1.0112 0.011 0.0344 0.0129 0.0128 0.0066 75.8301 172-3 272 1 1 0 0.0000 0 0 172-4 272 2 1.0037 0.0037 0.0134 0.0032 0.0032 0.0016 310.4992 174-1 272 2 1.0074 0.0074 0.0244 0.0086 0.0086 0.0043 114.4978 174-2 272 2 1.074 0.0689 0.1542 0.0741 0.0734 0.0099 50.0991 174-3 272 2 1.1249 0.111 0.2241 0.1278 0.1192 0.0669 6.9725 174-4 272 2 1.0037 0.0037 0.0134 0.0043 0.0043 0.0022 230.4989 174-5 272 2 1.7565 0.4307 0.6221 0.4621 0.2446 0.4706 0.5625 174-6 272 2 1.9722 0.4929 0.6861 0.5 0.2054 0.5892 0.3486 175-1 272 2 1.0074 0.0074 0.0244 0.0086 0.0086 0.0043 114.4978 175-2 272 2 1.0932 0.0852 0.1823 0.0991 0.0937 0.0552 8.5594 175-3 272 2 1.0074 0.0074 0.0244 0.0086 0.0086 0.0043 114.4978 175-4 272 2 1.2069 0.1714 0.3132 0.1965 0.1735 0.117 3.7725 175-5 272 2 1.8504 0.4596 0.6522 0.4769 0.3654 0.2337 1.6394 175-6 272 2 1.7047 0.4134 0.6038 0.39 0.3252 0.1659 2.5132 175-7 272 2 1.0301 0.0292 0.0771 0.0298 0.0298 0.0003 1480.2742 186-1 272 2 1.0421 0.0404 0.1005 0.0462 0.0453 0.0181 27.1466 186-2 272 2 1.7726 0.4359 0.6276 0.4059 0.2739 0.3252 1.0373 186-3 272 2 1.7848 0.4397 0.6316 0.4698 0.2325 0.5051 0.4899 186-4 272 2 1.6977 0.411 0.6013 0.3808 0.2793 0.2664 1.3765 187-1 272 2 1.042 0.0403 0.1002 0.0449 0.0444 0.0122 40.4142 187-2 272 2 1.7641 0.4331 0.6247 0.4021 0.2655 0.3397 0.9718 187-3 272 2 1.875 0.4667 0.6594 0.4905 0.1571 0.6796 0.2357 187-4 272 2 1.6636 0.3989 0.5883 0.3687 0.2779 0.2465 1.5286 190-1 272 2 1.0993 0.0903 0.1908 0.0833 0.082 0.0164 29.9125 190-2 272 2 1.046 0.044 0.1076 0.0385 0.0377 0.02 24.4900 190-3 272 2 1.1535 0.1331 0.2580 0.1211 0.1166 0.037 13.0124 190-4 272 2 1.6024 0.3759 0.5634 0.4076 0.2996 0.2651 1.3862 190-5 272 2 1.9999 0.5 0.6931 0.4956 0.323 0.3483 0.9354 191-1 272 2 1.9284 0.4814 0.6745 0.498 0.1126 0.7738 0.1462 191-2 272 2 1.6789 0.4044 0.5942 0.3708 0.2541 0.3146 1.0893 191-3 272 2 1.1641 0.141 0.2696 0.1261 0.1192 0.0552 8.5656 196-1 272 2 1.2295 0.1867 0.3342 0.2136 0.1856 0.1312 3.3100 196-2 272 2 1.0074 0.0074 0.0244 0.0086 0.0086 0.0043 114.4978 196-3 272 1 1 0 0.0000 0 0 201-1 272 2 1.0037 0.0037 0.0134 0.0043 0.0043 0.0022 230.4989 201-2 272 2 1.9978 0.4995 0.6926 0.4989 0.3531 0.2923 1.2103 201-3 272 2 1.404 0.2877 0.4625 0.3224 0.2509 0.2219 1.7536 201-4 272 2 1.4033 0.2874 0.4621 0.2798 0.2768 0.011 45.0326 222-1 272 2 1.3039 0.233 0.3951 0.2651 0.2176 0.1791 2.2910 222-2 272 2 1.7711 0.4354 0.6271 0.4617 0.3031 0.3435 0.9556 Mean 272 1.9492 1.2841 0.1778 0.2858 0.1841 0.1435 0.2204 1.7690 St. Dev 0.2206 0.3277 0.1741 0.2397 0.0305 0.0166 Na = Observed number of alleles; Ne = Effective number of alleles[56]; h = Nei's (1973) gene diversity; I = Shannon's Information index[57]; Gst = coefficient of gene differentiation; Nm = estimate of gene flow from Gst or Gcs. E.g., Nm = 0.5(1 - Gst)/Gst; Ht = Total expected heterozygosity; Hs = the average expected heterozygosity within subpopulations. Genetic structure analysis
-
The clustering analyses using STRUCTURE under the admixture model suggested the optimum K was two by STRUCTURE HARVEST[21], which divided all sampled individuals into two groups. Correspondingly, the highest of adhoc measure (∆K) analysis[20] gave a sharp peak at K = 2 (Fig. 1). Hence, the true number of groups were considered as two (Pop1 and Pop2). The accessions with a probability of more 80% were considered as pure and assigned to corresponding subgroups while less than 80% were categorized as admixture (Fig. 1). Among 272 genotypes, 259 were pure and 13 Pueraria accessions were admixture. With evidence for several admixtures within cluster I (code_collection number: 30_JCJ-30, 32_JCJ-32, 196_GL-32, 197_GL-33) or cluster II (code_collection number: 12_YZ-12, 26_LC-26, 27_LC-27, 28_HJ-28, 113_GP-21, 149_BS-13, 160_BS-24, 195_GL-31, 270_Y10), subpopulation P1 showed 152 pure (97.5%) and four admixed (2.5%) landraces, P2 had 107 pure (92.2%) and 9 (7.8%) admixed landraces. In addition, all of the 272 individuals could be clustered into one of four groups when K = 4 (Fig. 1). However, within each of the four closely related groups, a few individuals always contained an admixture of introgressed genetic material from another accession.
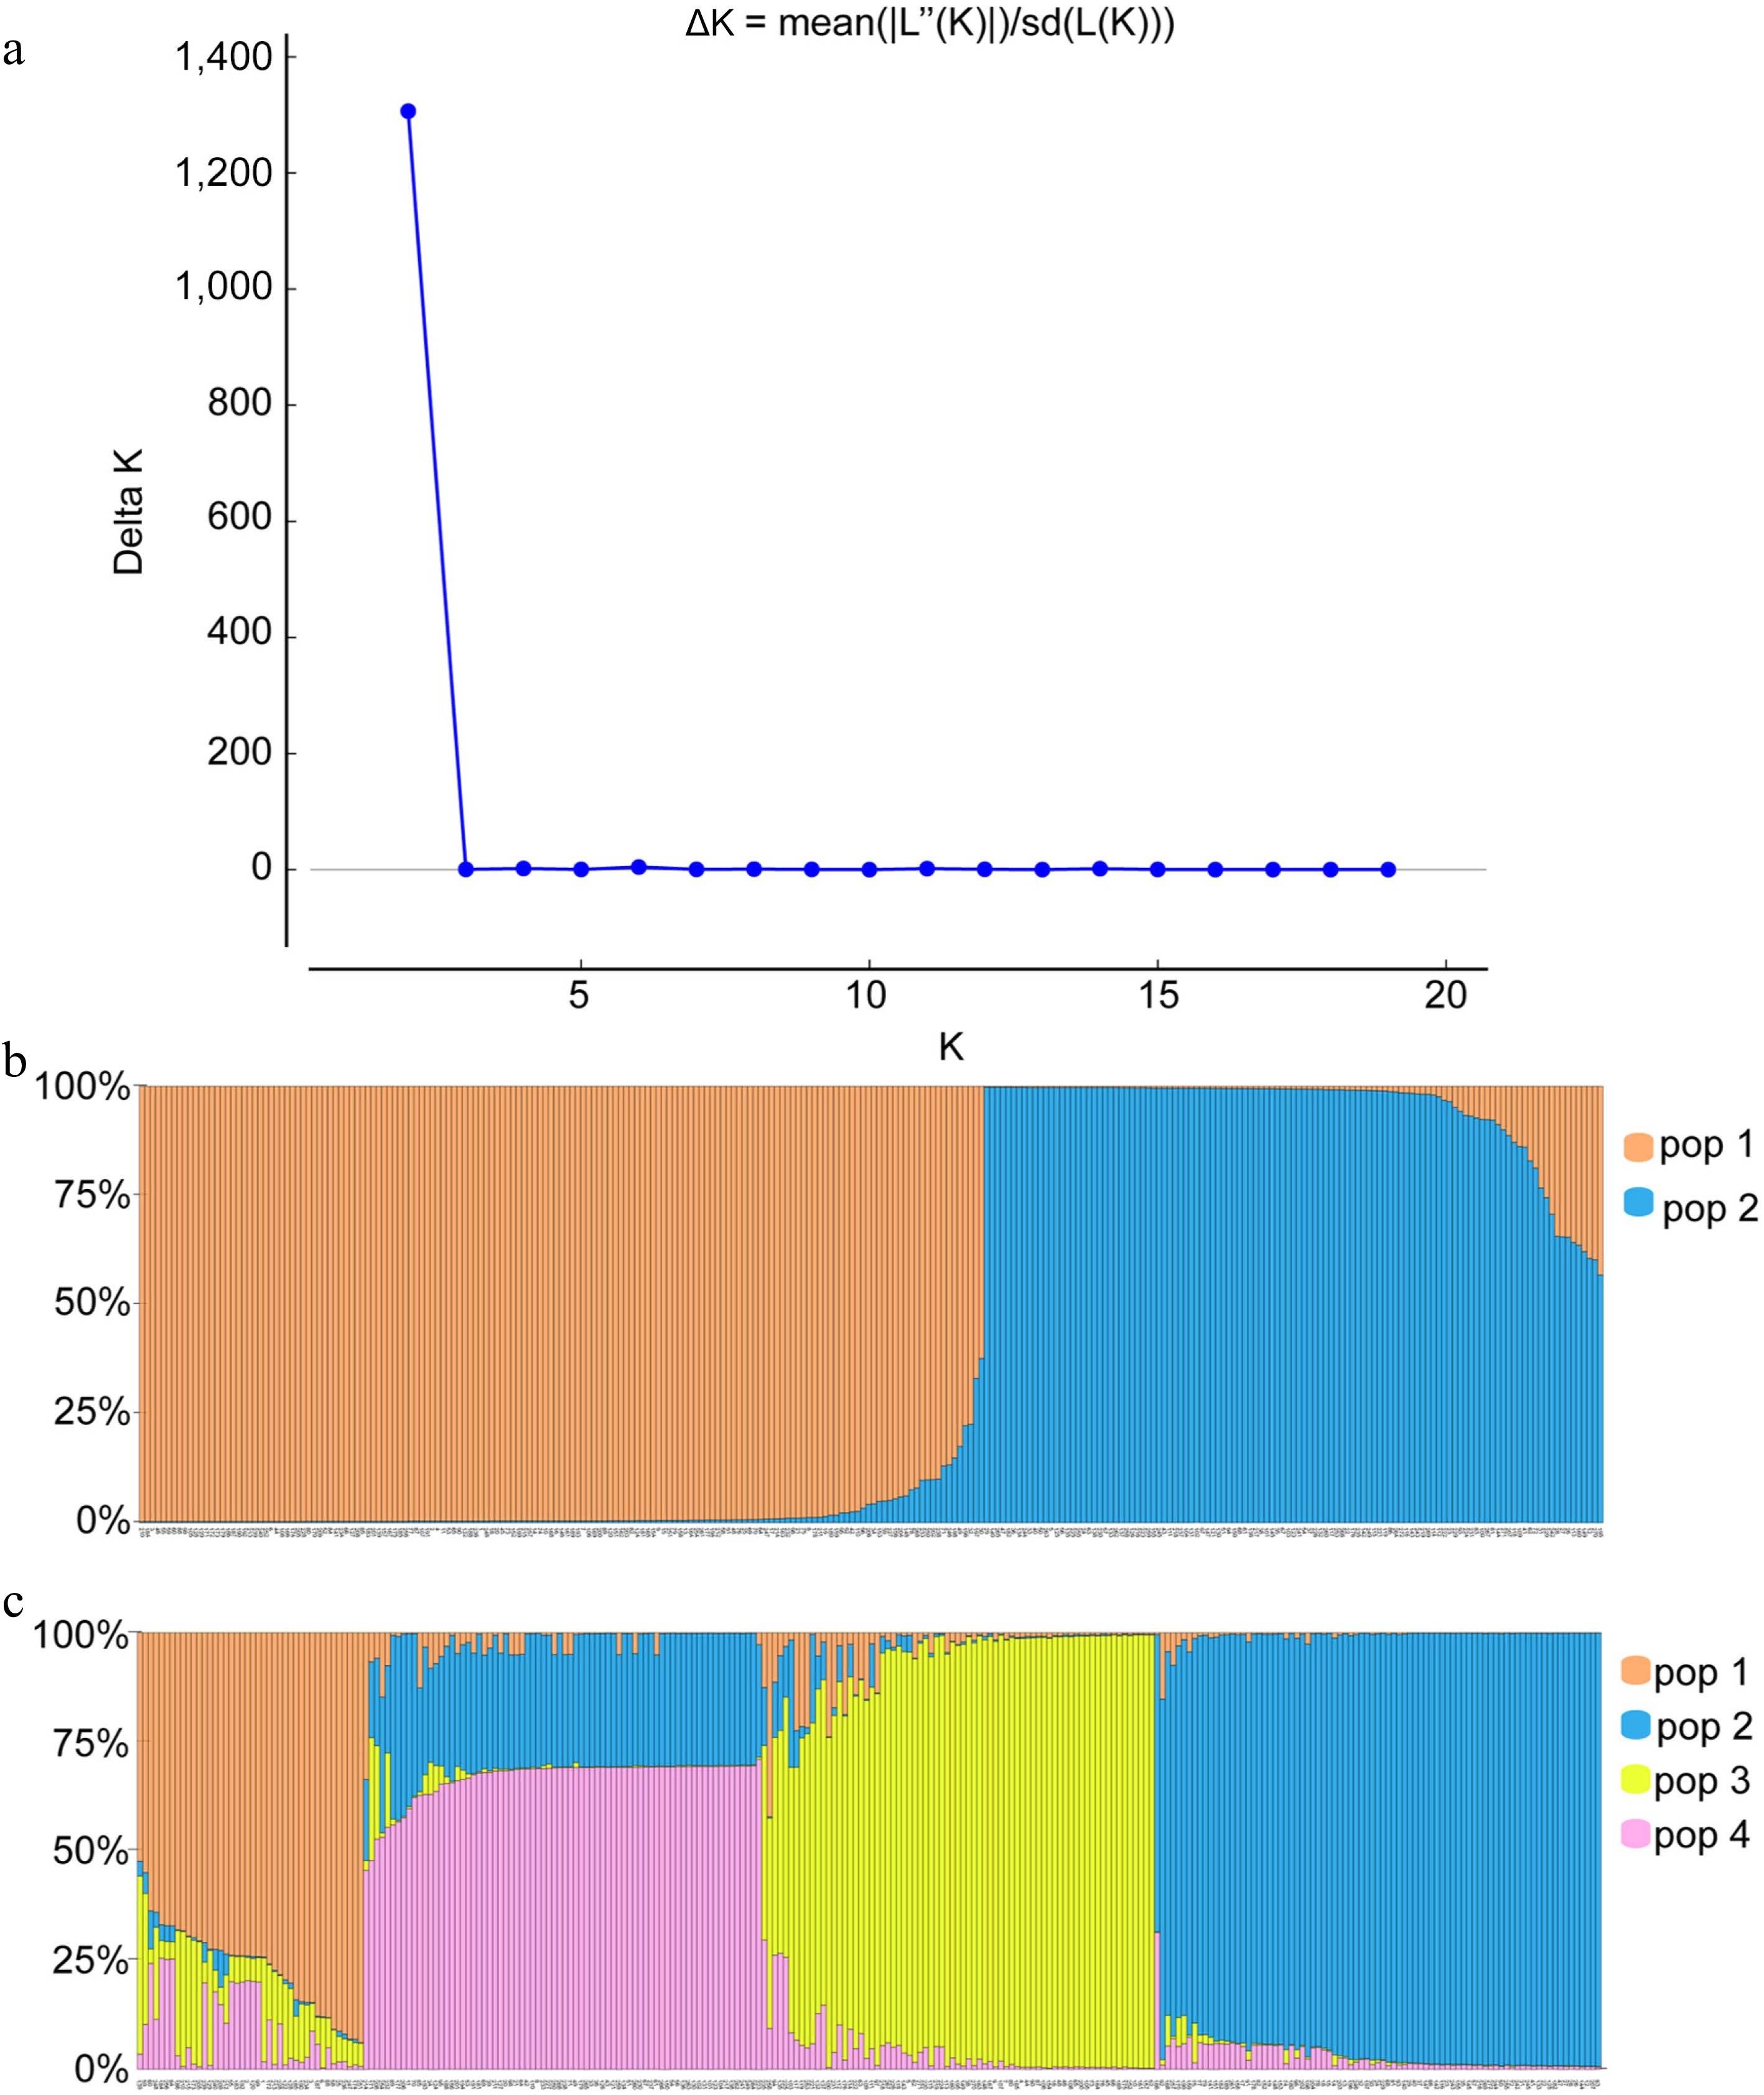
Figure 1.
Bar plots of all 272 individuals from Pueraria germplasm grouped into two or four genetic clusters with assignment probabilities obtained from STRUCTURE analyses of polymorphisms at 23 simple sequence repeat loci. (a) Distribution of delta K = 1−20. (b), (c) Histogram of the STRUCTURE assignment test when K = 2 or K = 4, respectively. The number represents the code in Supplemental Table S1.
Cluster analysis and Principal Component Analyses (PCA)
-
Although there was no clear demarcation in the clustering pattern in the present study, the UPGMA dendrogram (Fig. 2) showed that all the accessions were divided into two main clusters at 0.378 similarity coefficient, which showed similar results to structure analysis. Furthermore, 272 accessions were divided into four main clusters at 0.684 similarity coefficient. The minimum similarity is 0.587 for most other accessions (Fig. 2). There was no distinctive trend of accessions in these two clusters according to their place of origin (Fig. 3). For instance, accessions from Longzhou county of Chongzuo (LZ-9 to LZ-13), were covered within these two clusters with no evident bias.
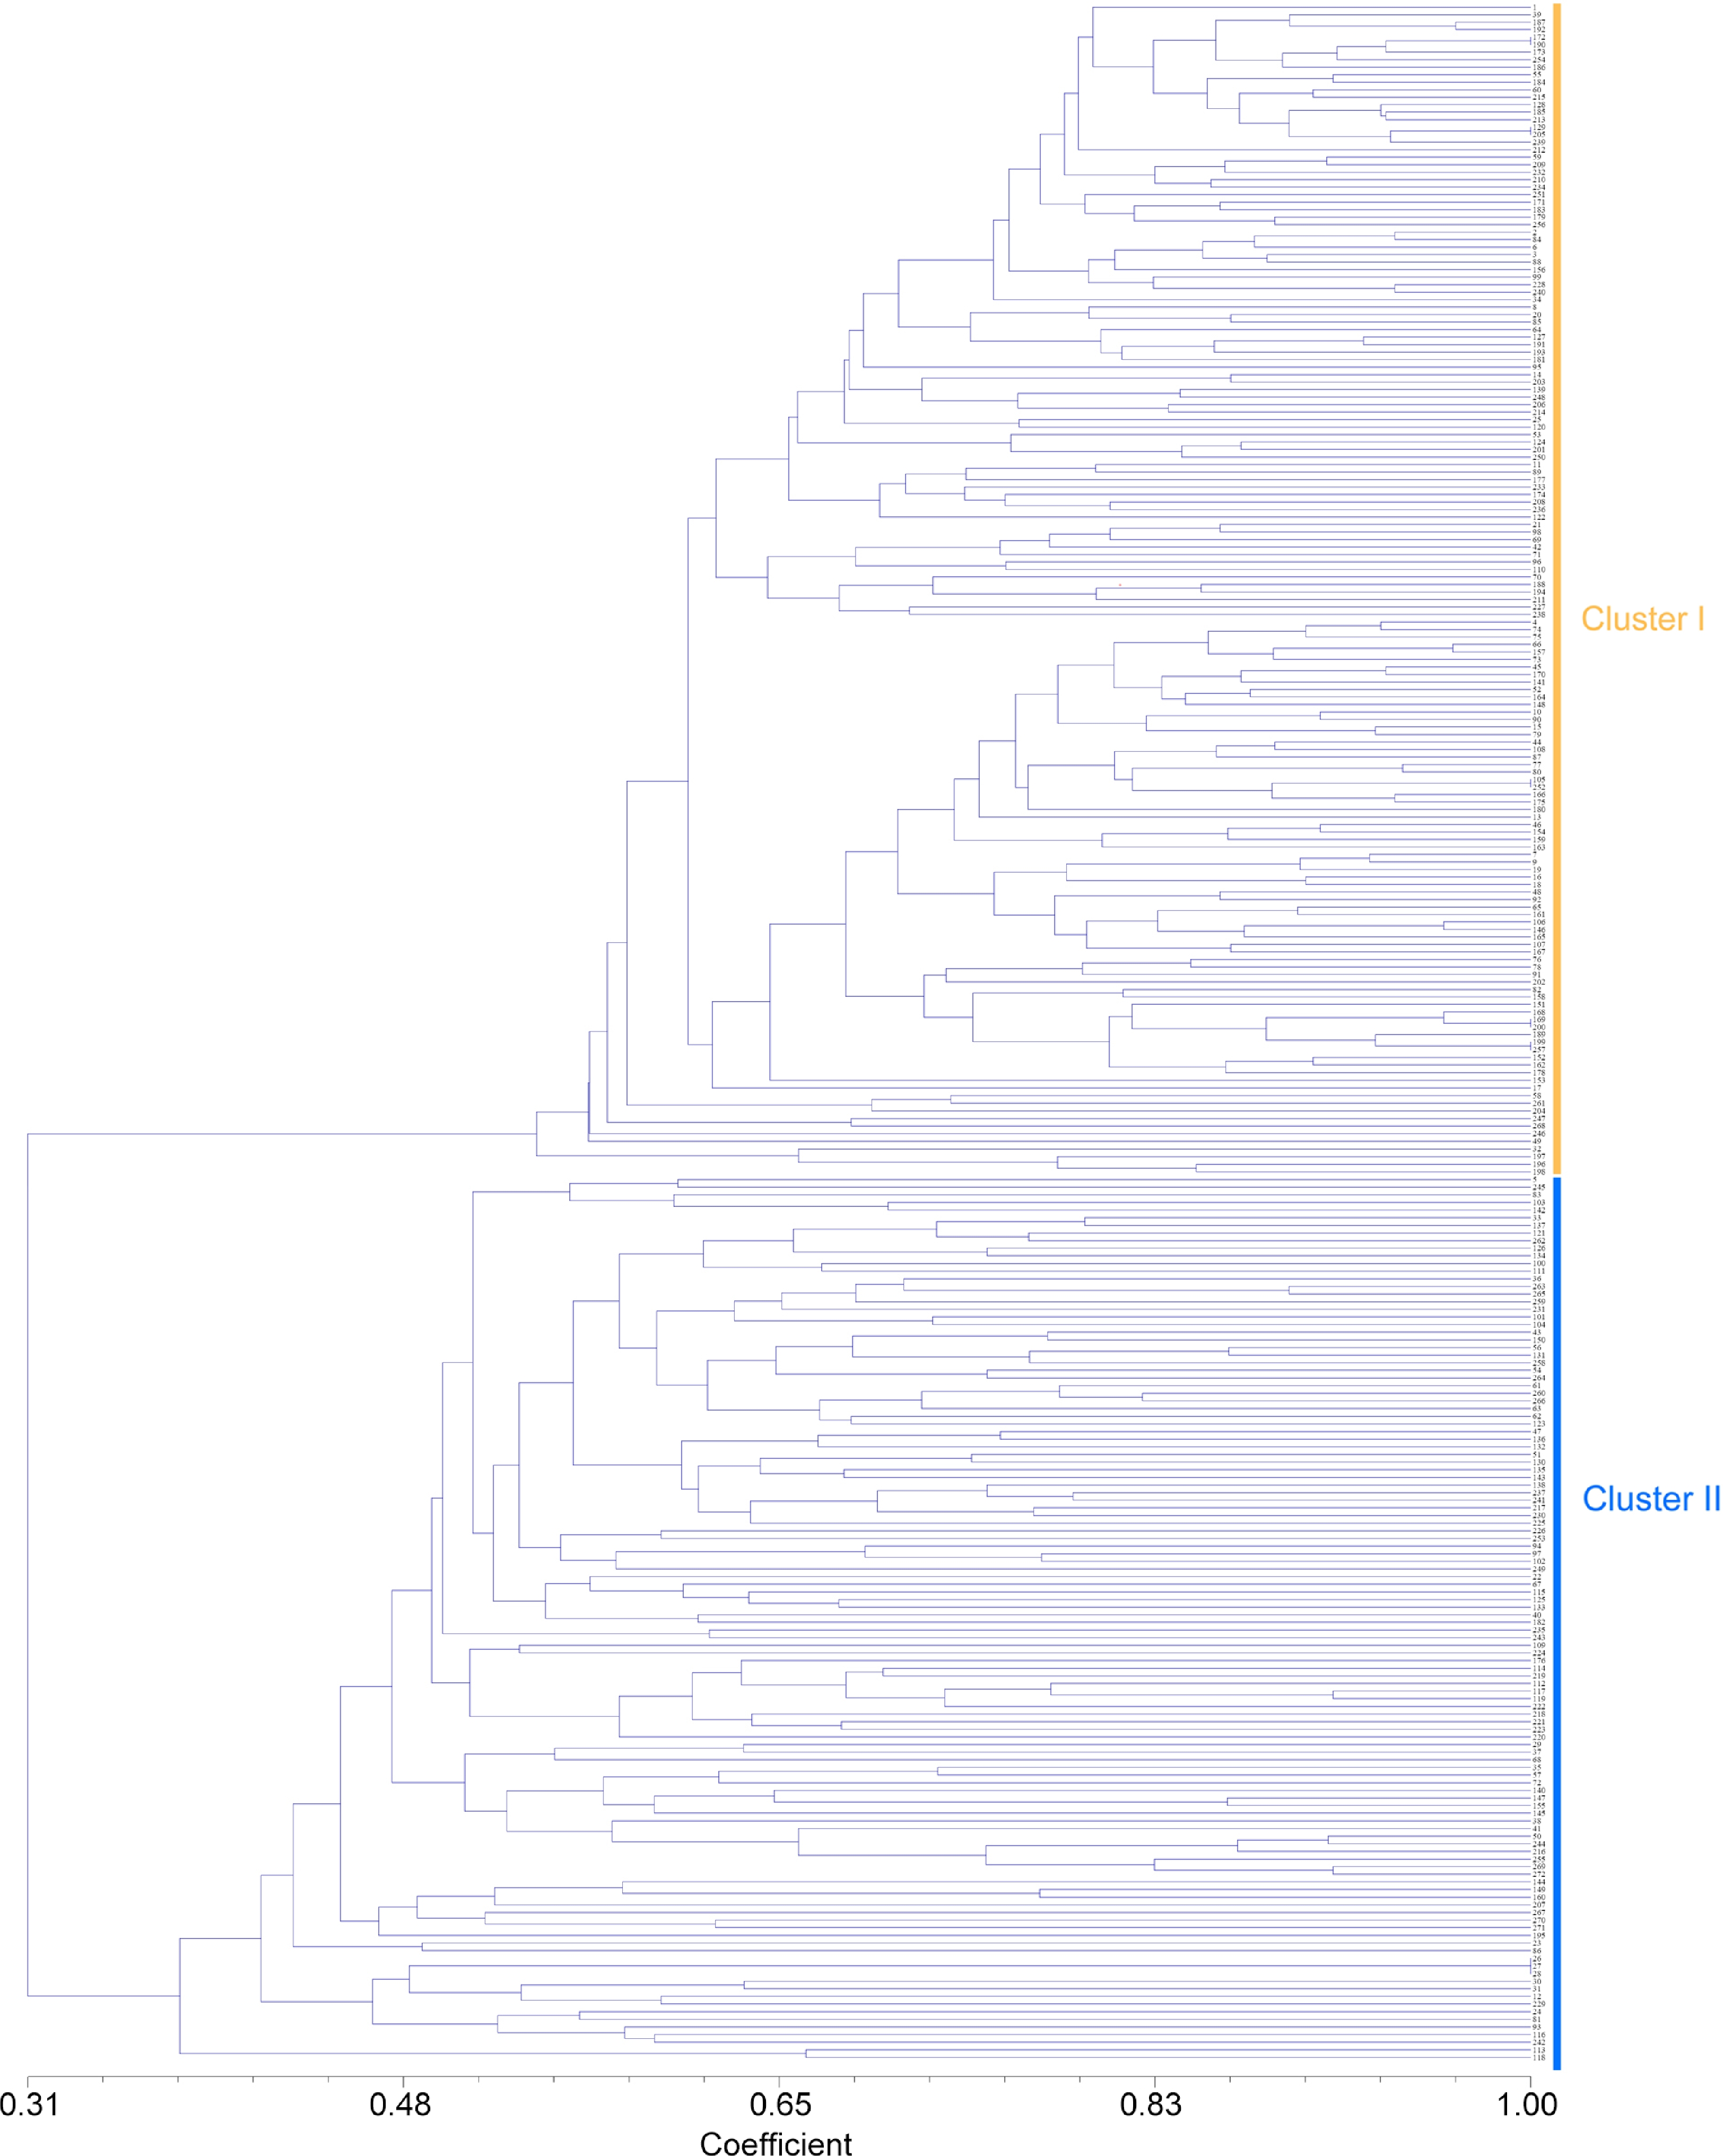
Figure 2.
Cluster diagram based on jaccard by UPGMA analysis calculated from alleles derived from 272 Pueraria accessions. The number represents the code in Supplemental Table S1.
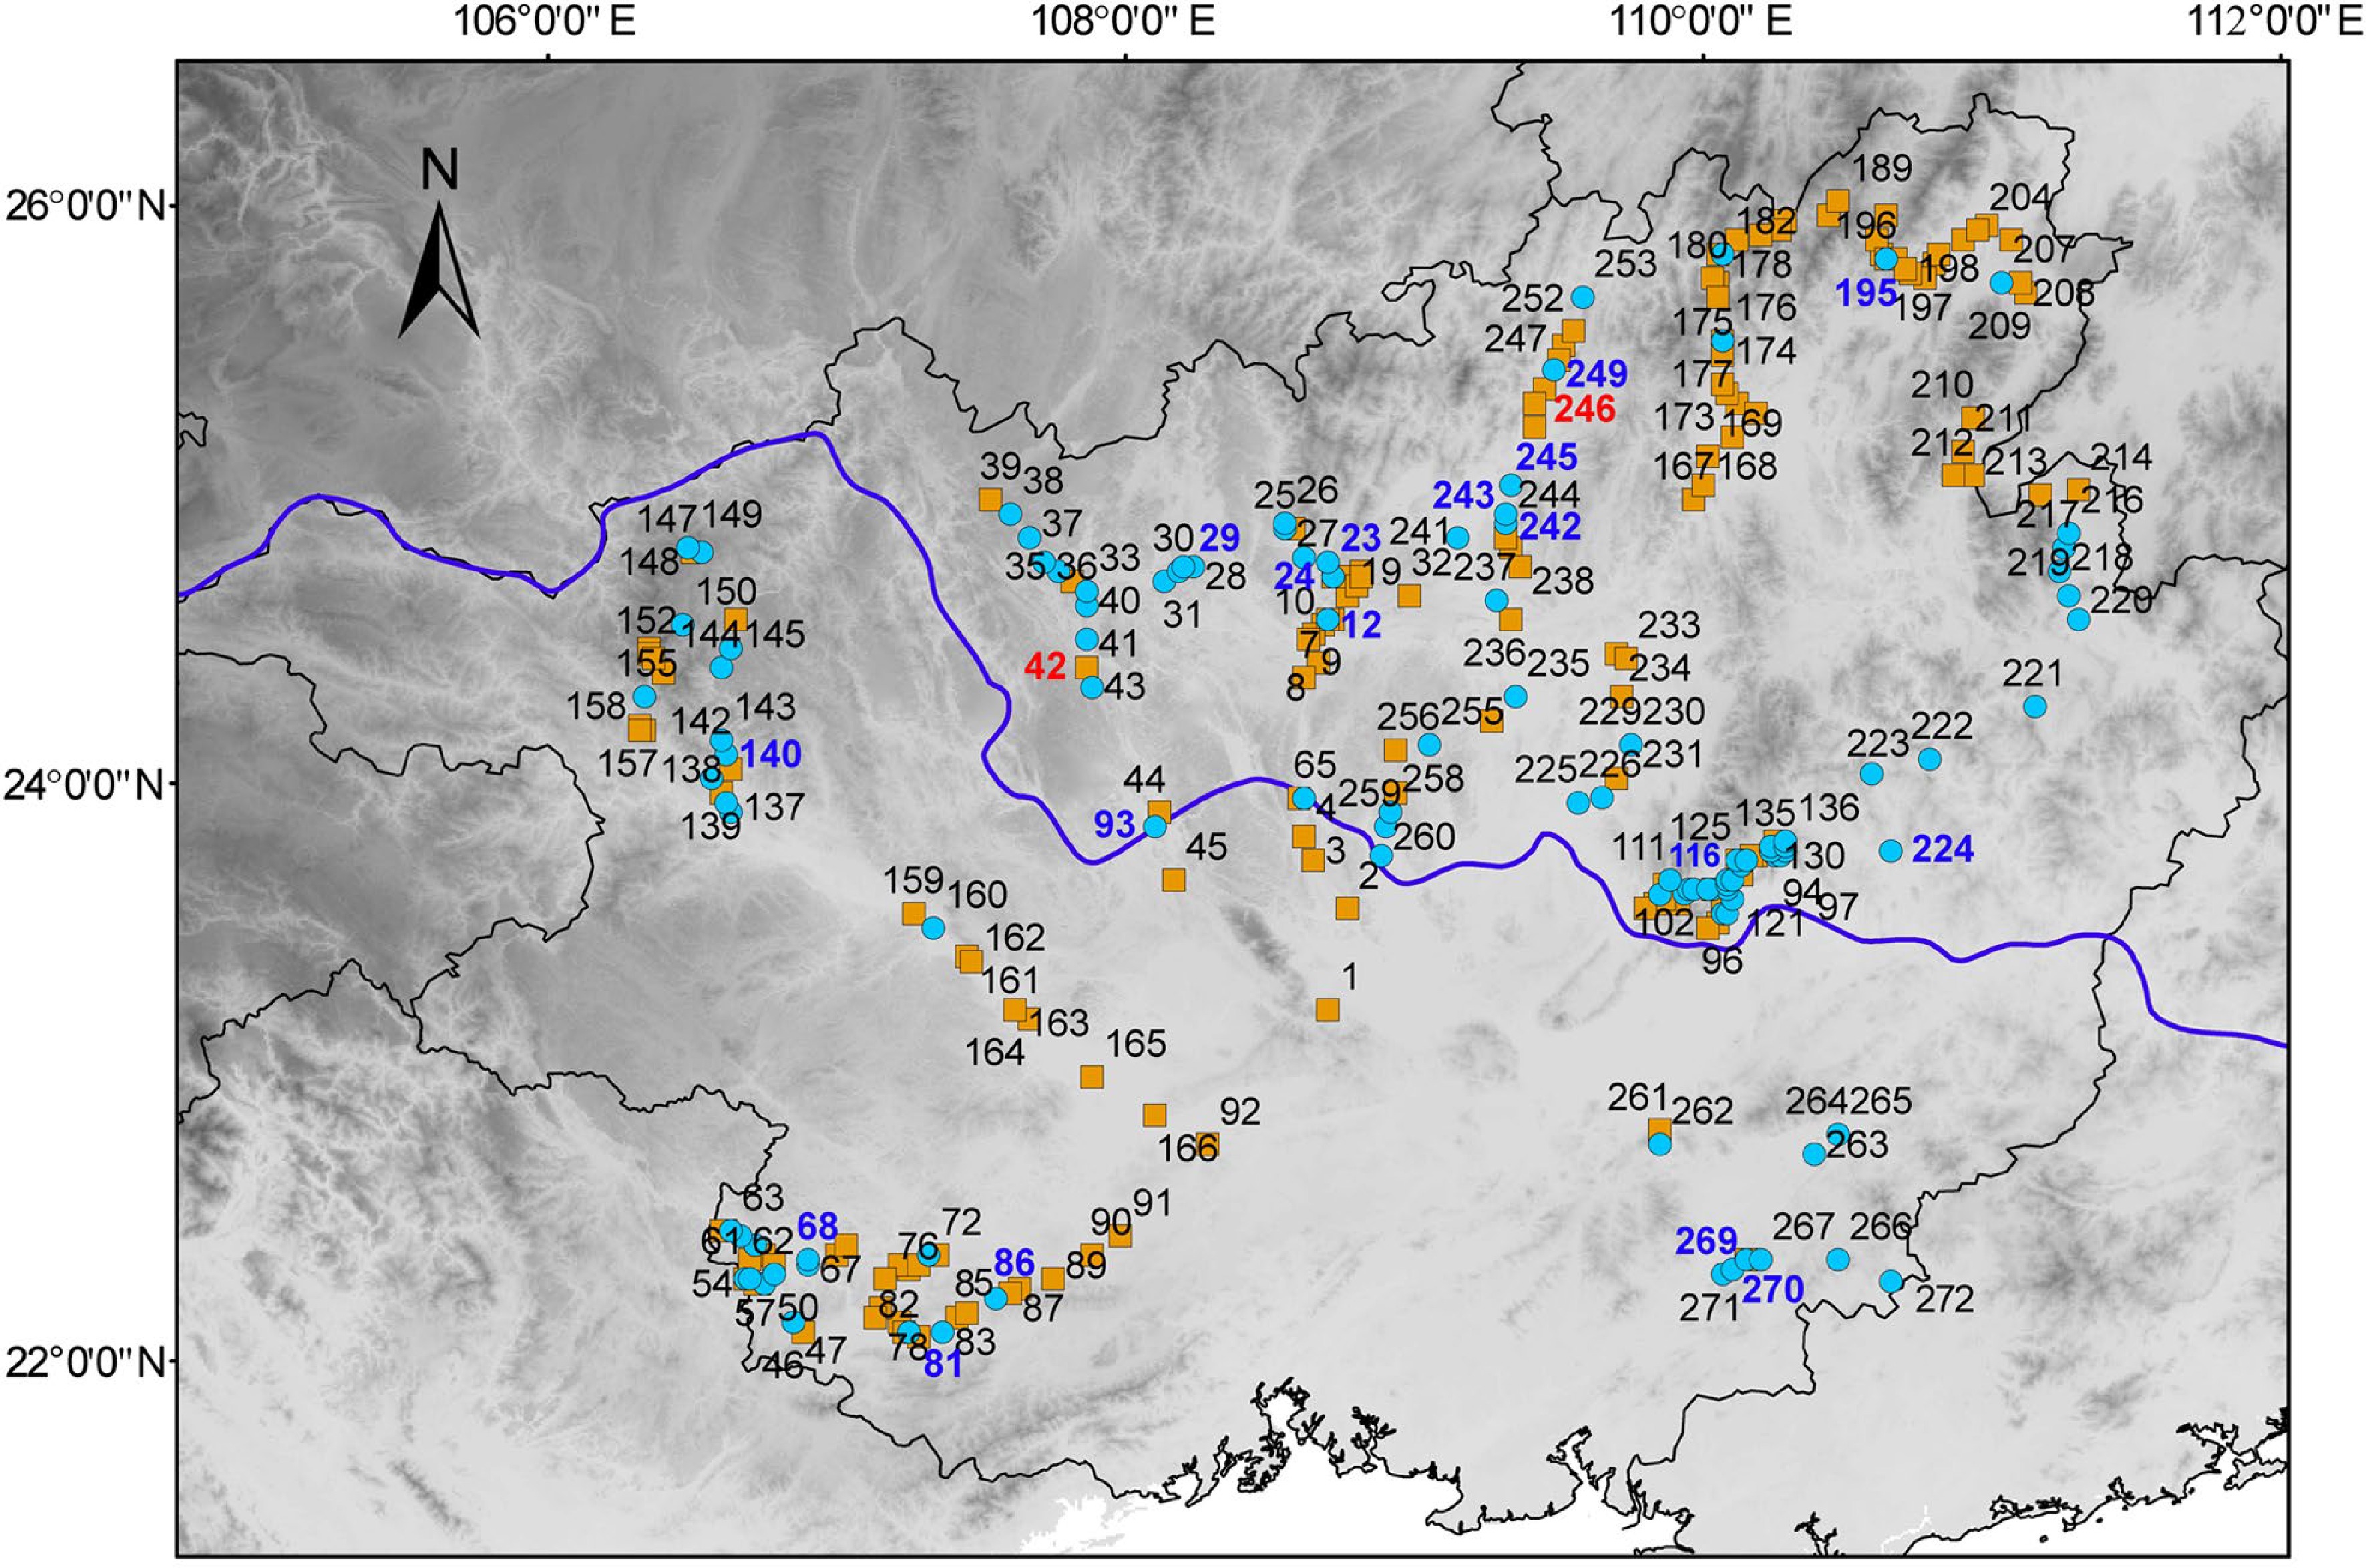
Figure 3.
Geographical distribution of the accessions collected in Guangxi. The number represents the code in Supplemental Table S1. The red and blue numbers represent two clusters of the 20 accessions of core germplasms. The orange squares represent the accessions of Cluster I and blue circles represent the accessions of Cluster II.
The PCA categorized all the accessions undertaken into two groups, which was in line with the results of UPGMA based phylogenetic tree and model-based STRUCTURE analysis. The first two axes of differentiation explained 89% of the total variation. The first coordinate explained 40% of the variation and the second coordinate explained 49% of the variation (Fig. 4). The results of PCA indicated that the genetic distance does not show a relationship with geographical distribution in this study.
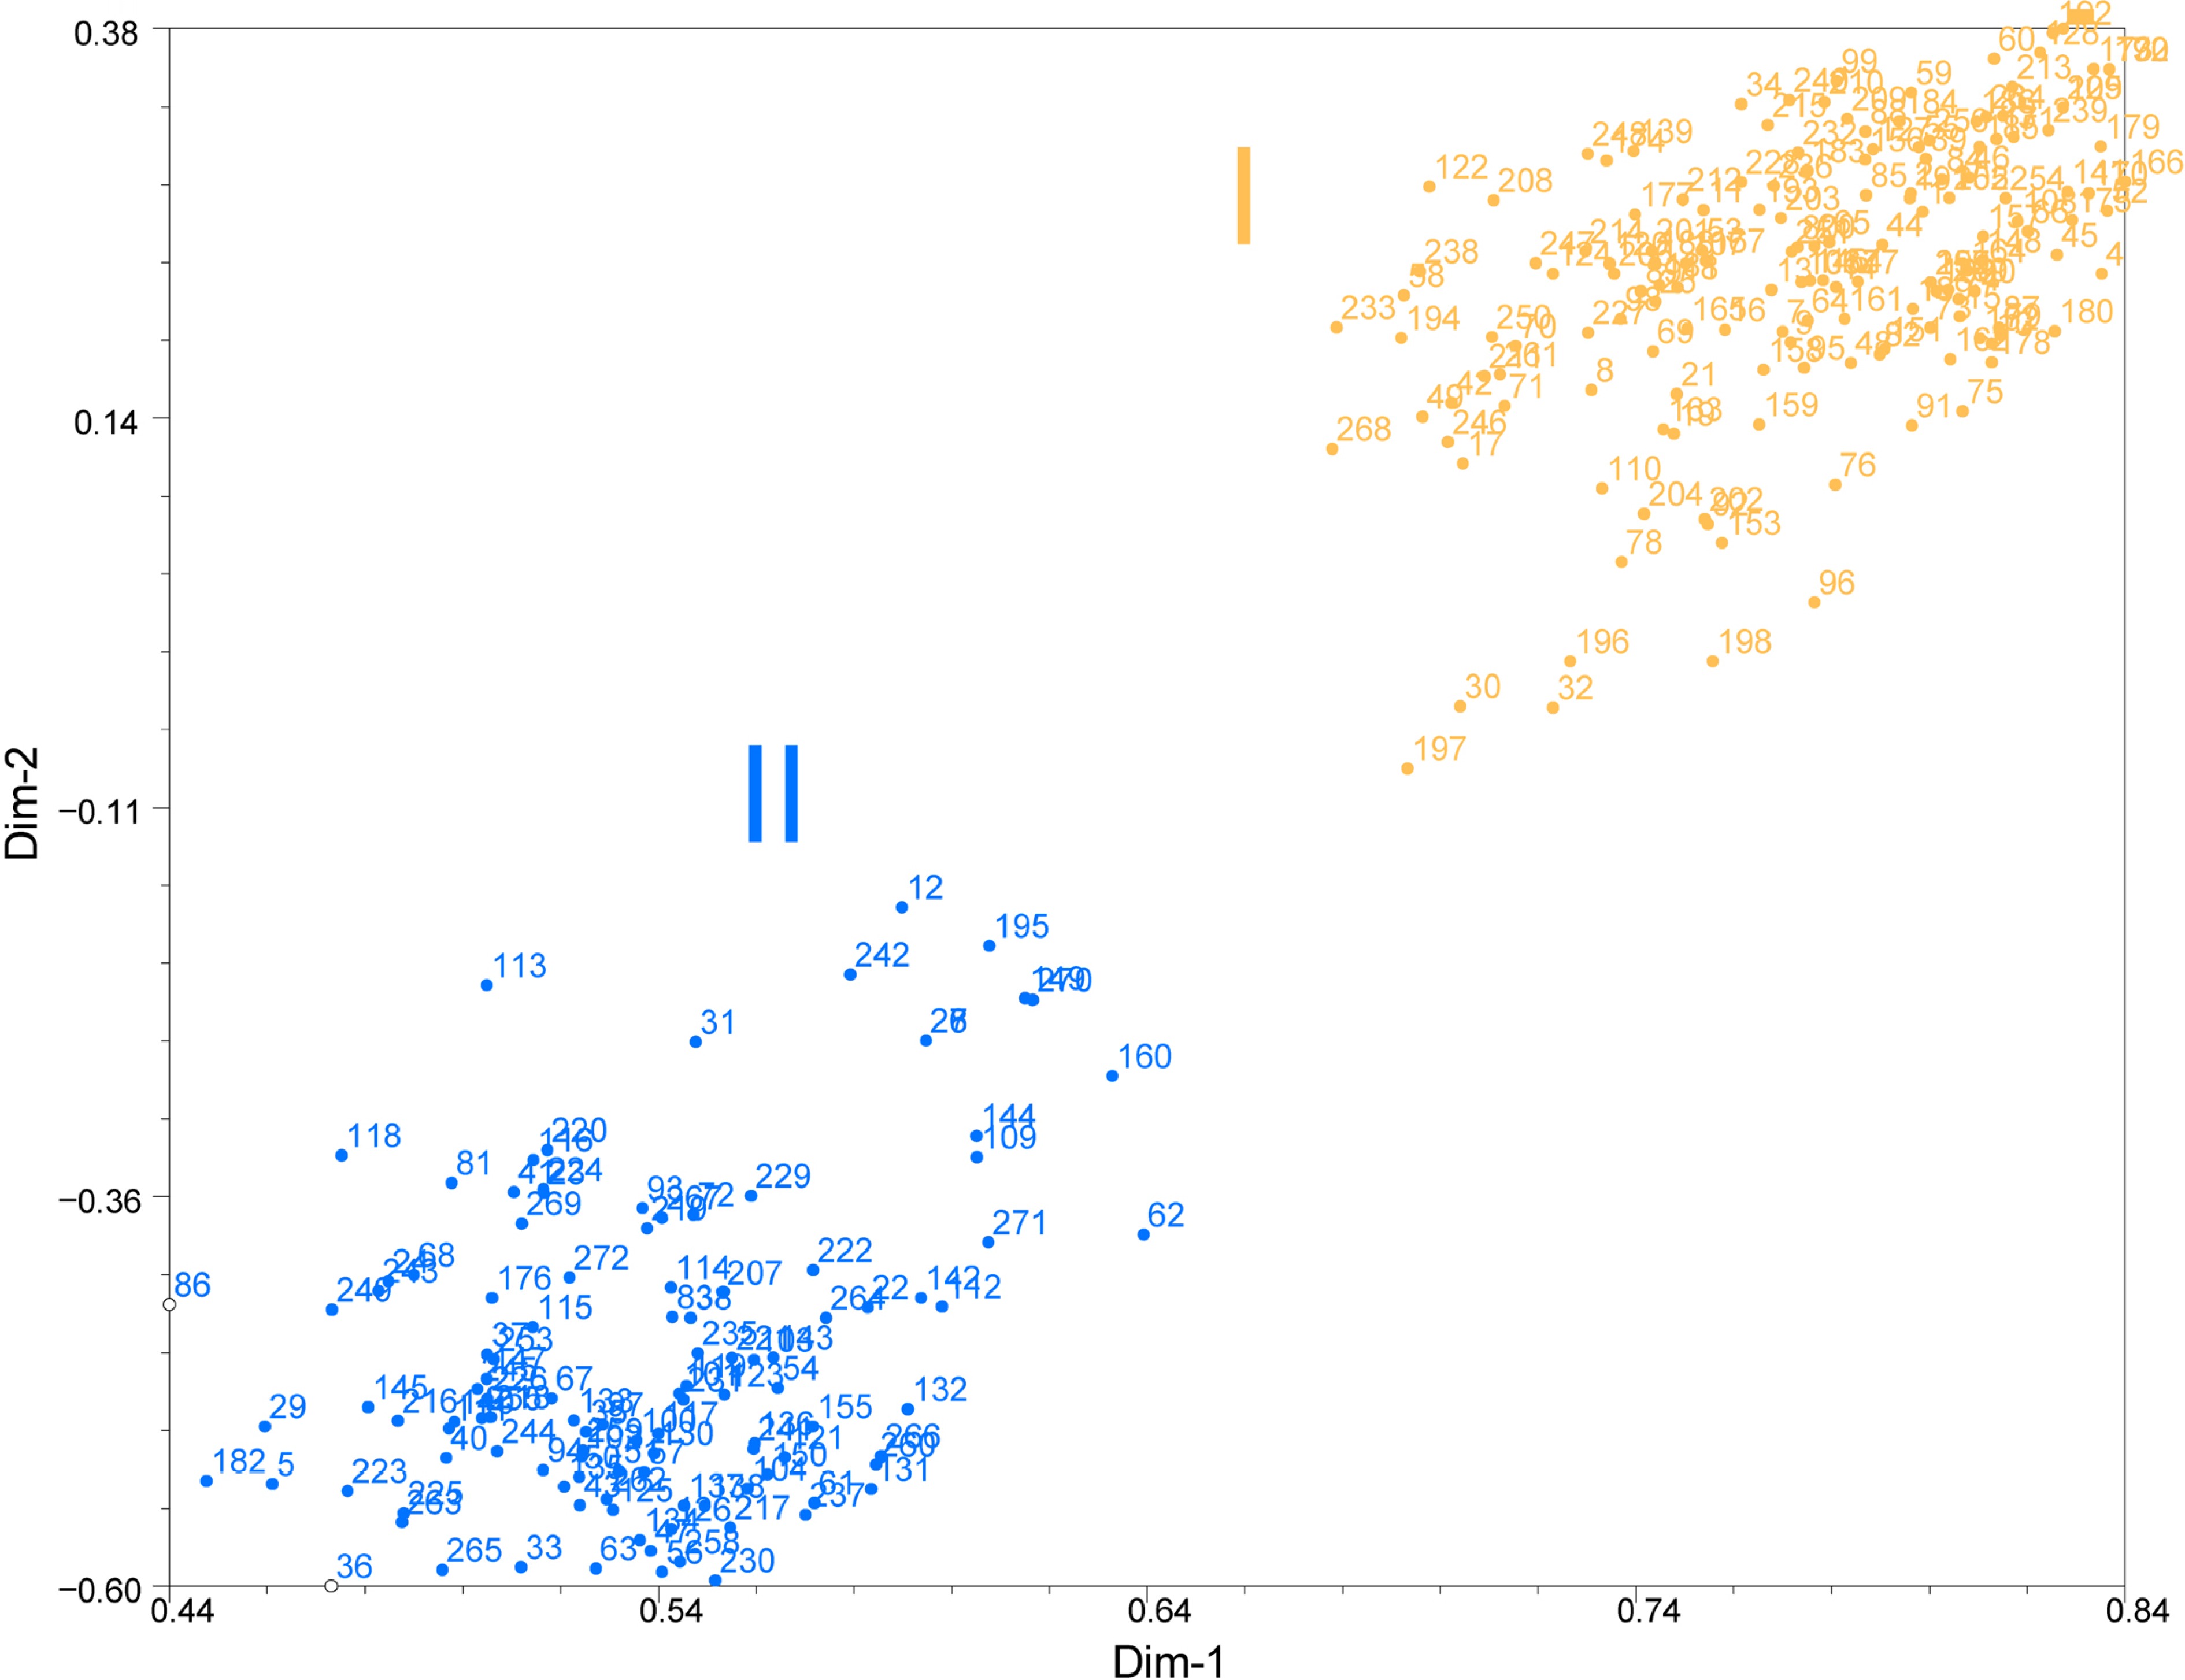
Figure 4.
PCA of Pueraria accessions based on dissimilarity matrix (Jaccard). The number represents the code in Supplemental Table S1. The number represent 272 accessions of Pueraria. The orange circles represent the accessions of Cluster I and blue circles represent the accessions of Cluster II.
Extraction of a core collection
-
One hundred and five SSR alleles found in this study could be represented by a core collection of 20 Pueraria accessions with 7.35% sampling proportion (Table 3, Supplemental Fig. S2). When the core selection capacity reached 20, the allele number was 105, so it captured close to 93.75% (105/112) of the total polymorphic loci. The average of the value of Na, Ne, h, I was 1.8898, 1.3716, 0.2359, and 0.3727, respectively. Based on the dendrogram, the germplasm accessions could be divided into two main groups. The value of genetic similarity indices among 20 Pueraria germplasm accessions varied between 0.31 and 0.60, which indicates that there was a relatedly narrow genetic variation within the different Pueraria accessions belonging to the diverse geographic locations across the Guangxi region (Fig. 5). In addition, our COREFINDER analysis highlighted that 10% of the entire core collection was represented by the Pueraria accessions grouped in Cluster I, while Cluster II contribute to the core collection at 90%.
Table 3. Summary of the extraction of a core collection.
Sampling proportion Sample number Na Ne h I Number of polymorphic loci Percentage of polymorphic loci Percentage of total loci 5% 14 1.8644 ± 0.3438 1.3839 ± 0.3116 0.2413 ± 0.1639 0.3778 ± 0.2243 102 91.07% 86.44% 7.00% 19 1.8644 ± 0.3438 1.3779 ± 0.3123 0.2381 ± 0.1635 0.3736 ± 0.2242 102 91.07% 86.44% 7.35% 20 1.8898 ± 0.3144 1.3716 ± 0.3084 0.2359 ± 0.1598 0.3727 ± 0.2170 105 93.75% 88.98% 7.70% 21 1.8983 ± 0.3035 1.3658 ± 0.3063 0.2333 ± 0.1580 0.3702 ± 0.2139 106 94.64% 89.83% 8% 22 1.8983 ± 0.3035 1.3655 ± 0.3049 0.2333 ± 0.1581 0.3699 ± 0.2145 106 94.64% 89.83% 10% 27 1.8983 ± 0.3035 1.3577 ± 0.2991 0.2297 ± 0.1575 0.3648 ± 0.2154 106 94.64% 89.83% 15% 41 1.9068 ± 0.2920 1.3451 ± 0.3055 0.2208 ± 0.1613 0.3518 ± 0.2203 107 95.54% 90.68% 20% 54 1.9237 ± 0.2666 1.3384 ± 0.3106 0.2161 ± 0.1621 0.3459 ± 0.2195 109 97.32% 92.37% 30% 82 1.9322 ± 0.2525 1.3204 ± 0.3052 0.2060 ± 0.1625 0.3314 ± 0.2217 110 98.21% 93.22% 40% 109 1.9407 ± 0.2372 1.3180 ± 0.3158 0.2024 ± 0.1664 0.3249 ± 0.2272 111 99.11% 94.07% 50% 136 1.9322 ± 0.2525 1.3146 ± 0.3273 0.1980 ± 0.1703 0.3171 ± 0.2327 110 98.21% 93.22% 100% 272 1.9492 ± 0.2206 1.2841 ± 0.3277 0.1778 ± 0.1741 0.2858 ± 0.2397 112 94.92% Na = Observed number of alleles; Ne = Effective number of alleles[56]; h = Nei's (1973) gene diversity; I = Shannon's Information index[57]. 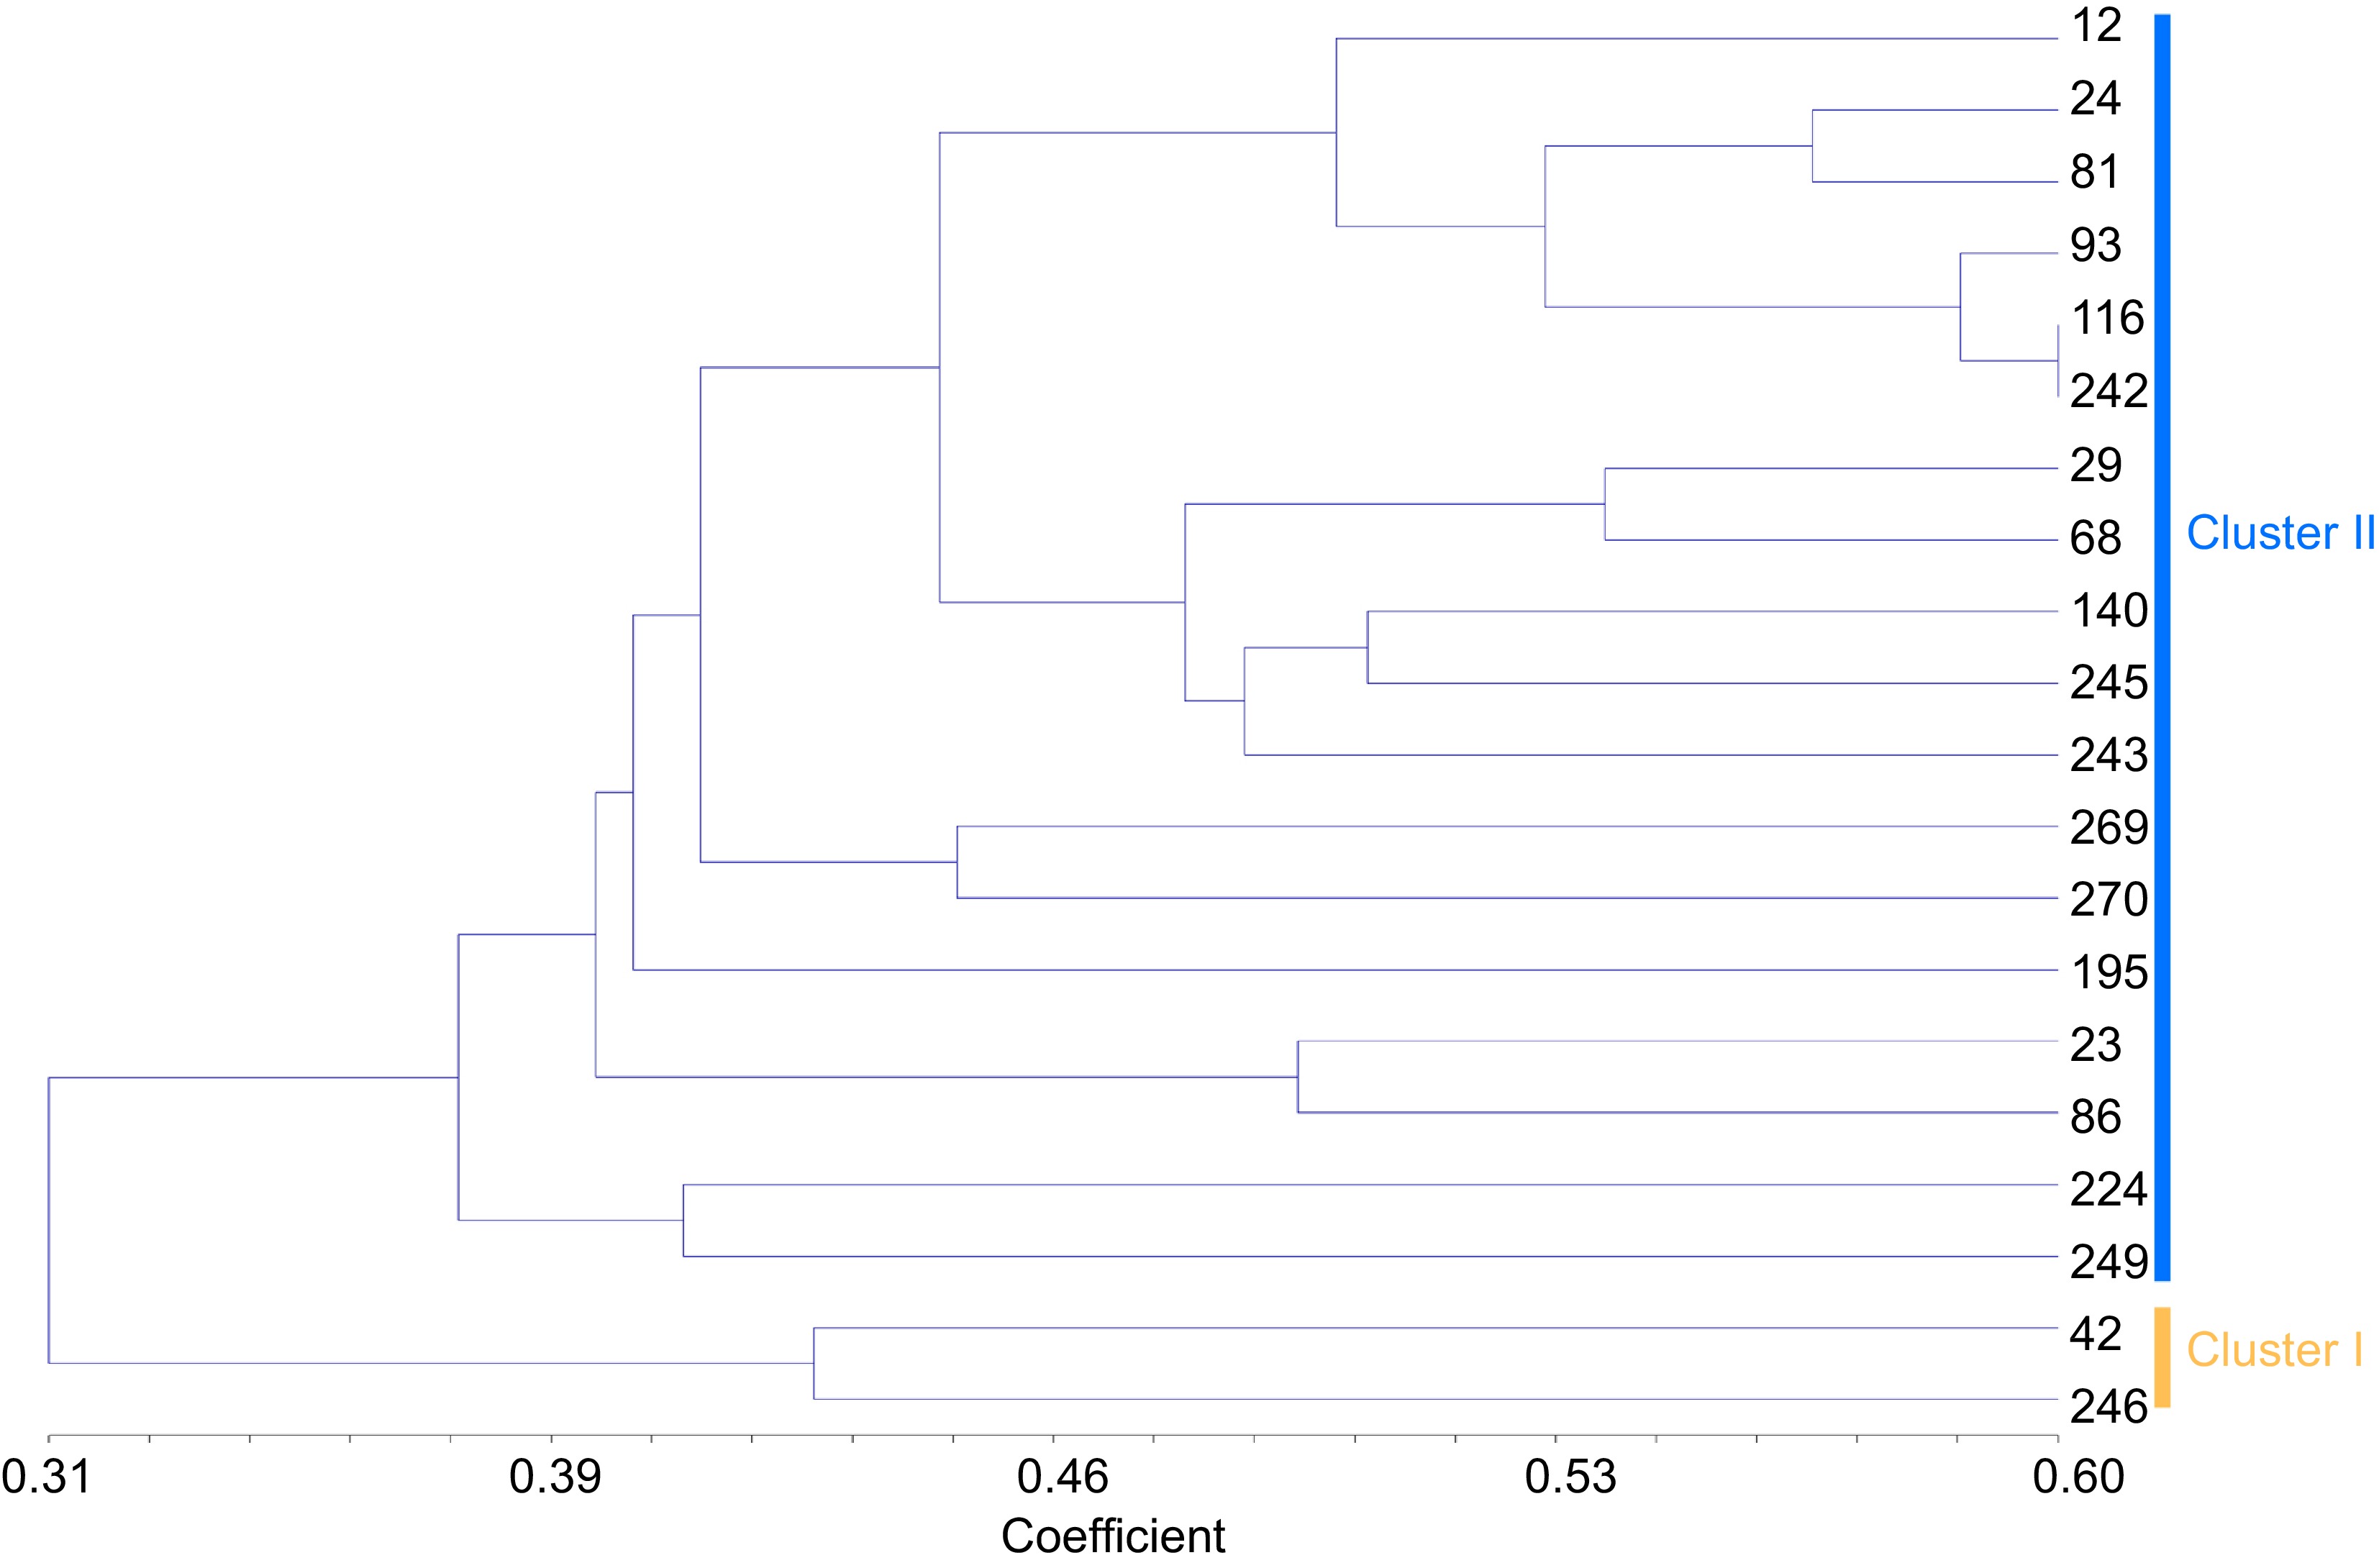
Figure 5.
Cluster diagram based on jaccard by UPGMA analysis calculated from alleles derived from 20 Pueraria accessions of core germplasm. The number represents the code in Supplemental Table S1.
-
We detected a total of 118 alleles with 23 SSRs segregating in the 272 Pueraria accessions in Guangxi, with an average of 5.13 alleles per locus. This value is higher than the number of alleles per SSR locus reported in a previous study with the 28 SSRs in the 44 Pueraria accessions from Guangxi[17]. This suggests that expanding the sample size is a powerful strategy for the analysis of genetic diversity in Pueraria germplasm in Guangxi. The number of effective alleles per locus (4.87) obtained in the Guangxi Pueraria accessions appears to be higher than the number of effective alleles per SSR locus found in 184 Pueraria accessions from Jiangxi (1.4503) and other crops, such as the value of 2.26 reported in rice[24], 3.17 in olive[25], but lower than the values of 5[26] or 7.2 in maize[27]. The results also showed that SSR allelic diversity of Pueraria germplasm was moderate (Na = 1.9492, Ne = 1.2841, h = 0.1778). Zhou et al.[14] reported an average of Ne = 1.4503 and h = 0.2865 in a collection of 184 Pueraria accessions from Jiangxi. The number of markers and individuals, the sexual propagules and type of plant material, the population size may be responsible for the level of polymorphism and discrimination power.
Genetic diversity of Pueraria germplasm
-
The overall clustering patterns generated by the STRUCTURE and PCA did not clearly distinguish the sampling areas, which is consistent with the previous results[10,13,17,28]. Few admixtures (13/272) were also detected due to shared ancestry during the breeding process, which is also observed in hybrid rice[29]. Pueraria resources have a low level of genetic differentiation (Nm = 1.7690). The degree of genetic differentiation among populations may decrease due to the existence of large gene flow (Nm > 1). The low genetic differentiation indicated that geographical isolation may not restrict gene exchange among Pueraria species populations in Guangxi. It is susceptible to external factors even though there was a certain correlation between genetic variation and geographical distribution based on RAPD in several studies[12,30,31]. As a result, it is thought that Pueraria species has been cultivated and utilized for a long period in Guangxi since native cultivars of Pueraria still exist in the major regions, which is similar to Perilla in Korea[32]. The selection by humans could be responsible for this clustering pattern and moderate genetic diversity.
Our results revealed that Pueraria accessions display moderate genetic variation throughout Guangxi, while the UPGMA dendrogram showed that 272 accessions were divided into two main clusters with 37.8% genetic similarity, four main clusters with 68.4% genetic similarity. However, previous studies revealed that Pueraria accessions or species possessed from moderate to the high level of genetic diversity with high clonal reproduction and perennial[3,14,17,28,30,33−37]. The inconsistencies observed, except for various taxon sampling and markers, could have originated from the following: 1) the populations were found by sexual propagules could contribute to the maintenance of high genetic variation in clonal populations regardless of recruitment of sexual offspring[38]; 2) introductions from across its multiple native populations into novel habitats from seed stock[37]; 3) clonal populations with fewer genotypes still maintain higher genetic diversity at each locus[39].
Moreover, Pueraria species, as strictly self-pollinating and clonally persisting clumps plants, have considered heterozygosity (Table 2), like many clonal plants, e.g. Castanea dentata[40] and Musa balbisiana[41]. Our results showed that relatively low Ht (0.1841) and Hs (0.1435), which suggest that accessions were inbred due to little outcrossing during maintenance[42]. Moreover, we could not rule out a case that the existence of ancient clonality and the somatic mutation, which accumulates genetic variation within clonally persisting clumps may account for some of the heterozygosity, especially given rapid mutation of SSR fingerprints.
Implications for utilization of core germplasm resources in Guangxi
-
Core germplasm plays a key role in the conservation, management, and utilization of germplasm resources, which is critical for the development of plant breeding. Individuals reflecting genetic information can be selected to build the core germplasm resources. China is the center of distribution of Pueraria, with a long history of growing Pueraria species. However, fewer excellent Pueraria germplasm have been established due to artificial over-mining, lack of conservation, and management of resources. Previous researchers have shown that a sampling proportion between 5% and 30% is enough to include at least 80% of the alleles representing the genetic diversity of the entire collection[43,44]. According to dynamic extracted results, our results revealed that when the samples collected reached 7.35% (20/272) of Pueraria accessions accounted for 105 alleles, accounting for approximately 93.75% of all alleles loci. Interestingly, the retention value of Pueraria core collection genetic diversity was lower than the allele retention values of 100%, 100%, and 97.5% in rosewood, licorice, and eggplant, with sampling ratios reaching 12.4%[45], 16.84%[46] and 12.03%[47], respectively. Pueraria species are abundant in Guangxi, especially in Tengxian and Wuzhou[2]. The most likely reason was that the breeding of a majority of Pueraria accessions in Guangxi was still from layering breeding and self-crossing, and lacked extensive gene exchanges from cross-breeding, which led to a decrease in the ratio of the core collection. Our findings will be useful in breeding programs for the introgression of noble alleles into modern cultivars by exploiting natural genetic variation existing in Pueraria genetic resources. Combined with the analysis of phenotypic diversity (e.g. puerarin, starches) of Pueraria species, we may detect the important polymorphic loci associated with the traits based on correlation analysis, which could provide a foundation for developing the molecular marker-assisted breeding or detection of target genes soon[7].
Meanwhile, the genetic clusters were not consistent with species delimitation and geographic distribution. For instance, accession number 140 and 68 classified as P. montana var. montana, shares a close relationship with three numbers P. montana var. lobata accessions (29, 243, and 245). Pueraria plants were introduced from different regions, which may result in a certain degree of inconsistency between actual germplasm sources and clustering results[17]. Furthermore, this also implies the complex evolutionary history with the human process blur the relationship among these species.
Complex genetic relationships among Pueraria species
-
Molecular marker based on SSR can help exploiting and utilizing plant variety resources reliably without the appraiser and environmental factors[48]. The present results include new clues in genetic relationships among Pueraria species based on SSR markers, that is moderate genetic variation and low genetic differentiation play a key role in the species delimitation of Pueraria. Pueraria DC. (Fabaceae, Phaseoleae) comprises ca. 20 species, occurring in tropical and East Asia. Eight species and two varieties have been recorded in China[49], with four groups or three sections as infrageneric classification based on morphological traits[50,51]. However, molecular studies have revealed that Pueraria is not a monophyletic group[52,53]. For example, taxonomically kudzu (P. montana var. lobata) is placed under the genus Pueraria. Pueraria montana var. thomsonii and P. montana var. lobata were treated as varieties for P. montana in flora of China. However, the phylogenetic relationship and classification among these three species are still confused based on various molecular markers and sampling taxon[54,55]. Thus, molecular markers for germplasm identification of kudzu or even Pueraria species may be limited. A wider taxon sampling with higher resolution genetic markers would increase confidence for the phylogenetic relationship among Pueraria species, efforts that are currently underway.
-
In this study, we used 23 pairs of simple sequence repeat primers to evaluate the genetic diversity and construct core germplasm of the 272 individuals of Pueraria species in Guangxi. Our results revealed that Pueraria accessions display moderate genetic variation throughout Guangxi. There was a non-significant relationship between genetic distance and geographical distance. The results could provide the basis for the breeding program of Pueraria. We consider the SSR markers to be a useful tool for both genetic diversity and the core germplasm of Pueraria.
-
The authors confirm contribution to the paper as follows: study conception and design: Yan H; data collection: Cao S, Zeng W, Wu Z; analysis and interpretation of results: Shi P, Zhou Y, Shang X; draft manuscript preparation: Xiao L, Zhou Y. All authors reviewed the results and approved the final version of the manuscript.
-
The datasets generated during and/or analyzed during the current study are available from the corresponding author on reasonable request.
This work was supported by the Guangxi Natural Science Foundation Project (2021JJB130122, 2023GXNSFBA026297, 2021GXNSFBA220026), the National Natural Science Foundation of China (82204563, 31960420), the Guangxi Key R&D Program Project (Guike AB22080090), the Technology Development Project funded from Guangxi Academy of Agricultural Sciences Science (GXAAS) (Guinongke 2023JZ10), and the Special Project for Basic Scientific Research of Guangxi Academy of Agricultural Sciences (Guinongke 2021YT057).
-
The authors declare that they have no conflict of interest.
-
accompanies this paper at (https://www.maxapress.com/article/doi/10.48130/tp-0024-0012)
-
Received 30 November 2023; Accepted 14 March 2024; Published online 23 April 2024
-
272 individuals of Pueraria species in Guangxi were divided into two main clusters in all analysis.
118 alleles were identified and 112 alleles were polymorphic.
Overall genetic diversity was moderate.
A core collection of 20 Pueraria accessions was constructed when the samples collected reached 7.35% (20/272).
-
# Authors contributed equally: Pingli Shi, Yun Zhou
- Supplemental Table S1 Details of sample location of Pueraria species in the present study.
- Supplemental Fig. S1 SSR fingerprinting map analysis of Pueraria germplasms.
- Supplemental Fig. S2 SSR fingerprinting map analysis of 20 Pueraria accessions of core germplasms.
- Copyright: © 2024 by the author(s). Published by Maximum Academic Press on behalf of Hainan University. This article is an open access article distributed under Creative Commons Attribution License (CC BY 4.0), visit https://creativecommons.org/licenses/by/4.0/.
-
About this article
Cite this article
Shi P, Zhou Y, Shang X, Xiao L, Zeng W, et al. 2024. Assessment of genetic diversity and identification of core germplasm of Pueraria in Guangxi using SSR markers. Tropical Plants 3: e012 doi: 10.48130/tp-0024-0012 

Assessment of genetic diversity and identification of core germplasm of Pueraria in Guangxi using SSR markers
- Received: 30 November 2023
- Revised: 22 February 2024
- Accepted: 14 March 2024
- Published online: 23 April 2024
Abstract: Pueraria, extensively cultivated in Guangxi, China, stands as a pivotal commercial crop and a valuable supplement for human health. Despite its significance, the core germplasm and genetic diversity within Guangxi's Pueraria populations remain largely unexplored. This study delves into the genetic diversity of a comprehensive collection of 272 Pueraria germplasm accessions from Guangxi, utilizing 23 simple sequence repeat (SSR) markers. The average number of SSR alleles per locus was 5.13, ranging from 2 to 11, with four primers (PtSSR121, PtSSR196, PtSSR155, and PtSSR222) consistently producing at least two polymorphic bands, while PtSSR122 yielded an impressive 11 polymorphic bands. The analysis revealed 118 alleles, 112 of which were polymorphic. The average gene flow (Nm) was estimated at 1.7690, and the average predicted heterozygosity per location was 0.1841. Principal component and STRUCTURE cluster analyses corroborated the division of the 272 accessions into two main clusters. However, no significant statistical correlation was observed between geographic and genetic distances. The study identified a moderate level of genetic diversity. A core collection comprising 20 Pueraria accessions that encompass 105 alleles was proposed. These findings provide a theoretical basis for the strategic conservation of Pueraria's genetic resources, laying the groundwork for future breeding programs.
-
Key words:
- Pueraria /
- Genetic diversity /
- Core germplasm /
- Simple sequence repeat (SSR)