


-
Urban Green Spaces (UGS) refer to open spaces located within the urban area, with vegetation intentionally planted or inherited from pre-urbanization natural vegetation, either by design or left in its natural state[1]. These green spaces include parks, gardens, urban forests, green belts, grassed streets, and historically inherited informal green areas[2]. As a crucial component of the urban landscape, UGS offer a diverse range of ecosystem services, such as providing habitats for urban wildlife, preventing soil erosion[3,4]. Beyond these ecological functions, UGS also promote physical activity by providing recreational spaces and creating appealing outdoor environments, thereby promoting psychological well-being and reducing stress, heart rate, blood pressure, as well as the incidence of chronic conditions including obesity, asthma, and diabetes[5,6]. Furthermore, the presence of UGS can enhance the aesthetic and cultural values of urban spaces[7], mitigate noise and dust pollution[8]. In short, the development of urban green spaces is paramount for human well-being and urban sustainability[9,10]. They create a pleasant living environment for urban residents, not only offering spaces for leisure and recreation[10] but also contributing to the ecological balance and health of the urban ecosystem[11].
In recent years, many cities have formulated plans to increase their UGS[12]. For example, both Los Angeles and Washington, DC (USA) have committed to planting a million trees within their respective borders over the coming decade[13]. Increasing UGS and maintaining existing UGS are crucial for the quality of life and the health of ecosystems. This is particularly vital in regions experiencing rapid urbanization, such as China, which is witnessing a particularly swift increase in the proportion of urban residents surpassing the global average[14].
While there has been a global increase in UGS planning in recent years, it cannot fully account for the recent establishment or long-term distribution patterns of UGS. Within urban areas, the distribution of UGS is the result of various factors, including the choices of businesses and residents, as well as the local demand for infrastructure and economic development. To better explain the distribution patterns of UGS, the Legacy Effect Hypothesis posits that the spatial distribution of vegetation cover in urban landscapes is significantly influenced by the historical legacy of past land use[15−18]. Typically, areas with older urban housing and historical urban development are interpreted to have more vegetation, reflecting the long-term trajectories of management practices[19]. In such situations, the extended temporal succession and longer development periods allows more time for trees to reach their full size[17,19,20]. In conjunction with this, the Land Use Hypothesis proposes that different land use types exhibit distinct patterns of land utilization[21,22]. It focuses on how management decisions in various land use categories, such as residential and transportation zones, impact the quantity and types of land use[23]. This hypothesis emphasizes that the land management decisions in different domains have consequential and significant effects on the overall patterns of urban land utilization[24,25].
In recent years, research on UGS has made significant advancements through the application of remote sensing technology[26−28]. The study of UGS relies on obtaining Earth surface imagery data from satellites or aircraft, providing abundant information that illustrates the distribution of UGS under different land use types[29,30]. This approach is instrumental in assessing the temporal and spatial changes in urban UGS[31], revealing the impact of urban land use transitions on the richness and distribution of UGS[27,30,32]. Furthermore, studies that integrate remote sensing assessments with socio-economic variables have found a close correlation between these changes and fluctuations in socio-economic factors, such as historical building patterns, property prices, and population density[33,34]. Therefore, the application of remote sensing technology to understand the distribution patterns of UGS provides robust support for a deeper understanding of land use and heritage effects.
In this study, we employed remote sensing image to assess the distribution and changes of UGS land use in the primary developed areas and Urban Functional Units (UFUs) of the tropical coastal city of Haikou, China. The objectives of our research were twofold: (1) Explore the changes of UGS and land use in Haikou city from 2016 to 2020, and (2) to investigate whether UFUs types, construction age, housing price, and population density could explain the changes in UGS land use in Haikou during the period from 2016 to 2020. The research findings have the potential to contribute to the planning of UGS and land use in other similar cities.
-
Hainan province is an island located 18 km off the south coast of the Chinese mainland (Fig. 1). Haikou, situated at (19°31′32″−20°04′52″ N, 110°07′22″−110°42′32″ E), serves as the capital city of Hainan Province, China. It is a typical tropical city and the main port hub[35,36] for the Chinese mainland's Belt and Road trade and infrastructure initiative. The city covers a total area of 3126.83 km2 (
www.haikou.gov.cn ). With a permanent resident population of 2.87 million (http://www.haikou.gov.cn ), Haikou holds significance as the cultural, political, economic, and transportation center of Hainan province. Geographically, Haikou is positioned with the Qiongzhou Strait in the north, Huancheng Expressway in the south, Nandu River in the east, and Crater Road in the west. For the purposes of our study, we specifically divided Haikou's urban core from its surrounding suburbs and rural areas. This differentiation ensures that the studied region exhibits typical urban land use characteristics, as highlighted in research by Wang et al.[37].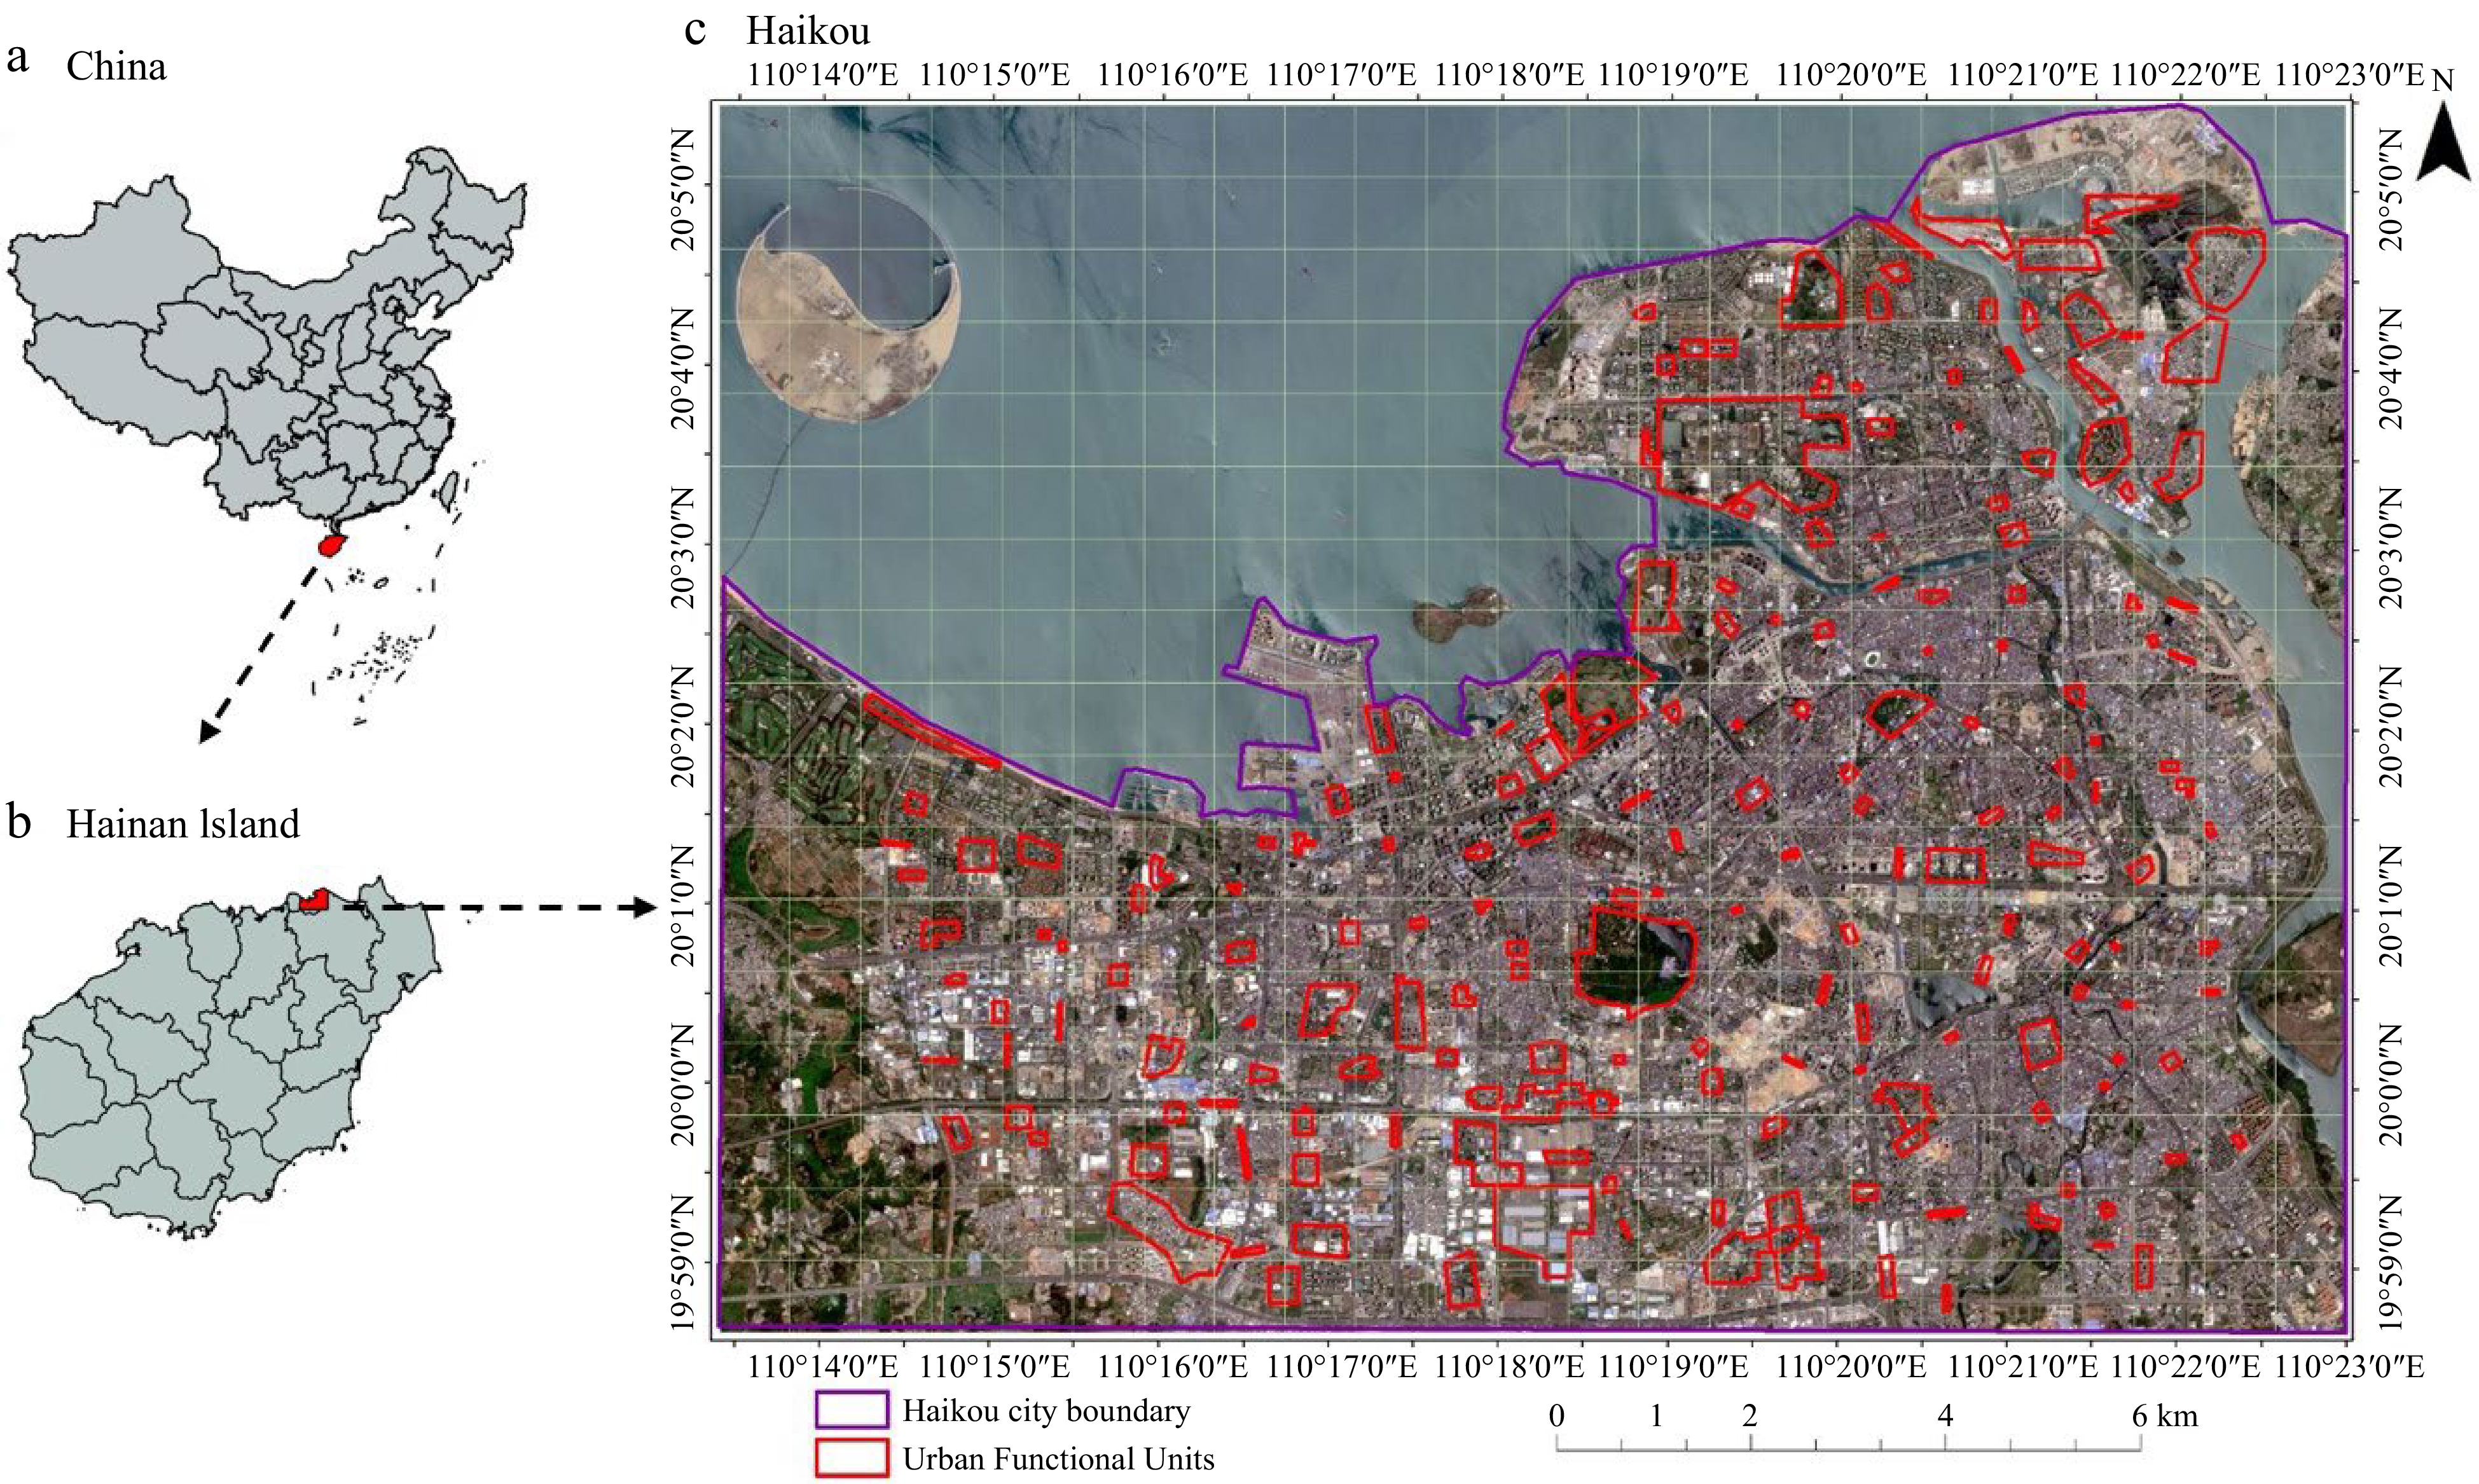
Figure 1.
(a) Map of China indicating the location of Hainan. (b) Map of Hainan indicating the assessment areas for UGS drivers. (c) Satellite map of Haikou (
www.google.com/maps ) displaying the 190 urban functional units (UFUs, red boundaries) surveyed within the Haikou study region (purple line).Sampling design classification of Urban Functional Units (UFUs)
-
Urban Functional Units (UFUs) represent different land use types and tend to encompass different strategies for generating and maintaining green space, i.e. greening strategies[38]. Examples of UFU types include parks, residential areas, and universities or colleges[39,40]. In this study, we divided Haikou into five first-level UFUs based on the urban forest effect model[37] and the 2018 China basic urban land use type map[41]. These first-level categories were public service areas, industrial and commercial areas, residential areas, leisure and entertainment areas, and transportation areas. The secondary UFUs were divided into 15 units, including government agencies, universities, primary and secondary schools, research institutes, industries, hospitals, hotels, industrial and commercial offices, supermarkets, low-density residential areas, high-density residential areas, parks, museums, roads, and car parking lots[37,42,43] (Table 1).
Table 1. The number of primary and secondary urban functional units (UFUs) sampled in Haikou.
Primary UFUs Secondary UFUs Polygons included Public affairs service districts Governmental Agencies 18 Colleges/universities 7 Primary/Middle Schools 18 Research institutes 4 Hospitals 12 Industry and business districts Industry 12 Hotels 11 Industrial offices 9 Supermarkets 3 Residential districts Low-density residential areas
(lower than six stories)5 High-density residential areas (higher than six stories) 43 Recreation and leisure districts Parks 7 Museums 5 Transportation Main/secondary roads 28 Bus parking 5 Undeveloped land Wetland 3 Total 190 After selecting the study area, the city was divided into uniformly sized kilometer grids. To ensure a standardized urban sampling approach, a grid sampling method was employed. Subsequently, we conducted purposive sampling of UFUs[38]. This approach was chosen over random sampling to avoid the abandonment of certain sampling points, such as those located on impermeable surfaces with abundant water bodies. Additionally, randomly selected areas often exhibit large areas of impermeable surfaces or water coverage, rendering sampling either impossible or meaningless. Therefore, we adopted Wang et al.'s purposive sampling method[38], taking a comprehensive consideration of all UFU types within the grids to ensure the representativeness of all sampled points in the city. This sampling method combines uniformity and representativeness of samples, providing a better overall picture of the fundamental characteristics of UGS.
We used two scenes of cloud-free SPOT 5 (Satellite Pour l'Observation de la Terre) photos of the Haikou metropolitan region (north of the Haikou West Line) from the year 2016. According to the probability theory of double-density mosaic stratified sampling, which suggests a 3:1 sampling density in metropolitan regions and suburbs[44], these pictures were split into 190 grids of 1 km × 1 km[37,45]. We chose 190 UFUs inside each city based on the American Urban forestry categorization to ensure that all sampling locations were similarly represented.
Socioeconomic variables
-
We determined the age of the building by calculating the number of years since the UFU was initially constructed. For example, if the UFU was established in 2000, a building constructed in 2016 would be 16 years old and a building built in 2020 would be 20 years old. We determine the age of construction of each UFU in three ways. First, we determined the construction time of the UFUs through reliable online resources such as the UFU's website. If this data could not be located, we interviewed the property management personnel of each UFU to determine the completion time of the UFUs. In the end, if we did not find them, we analyzed Sentinel satellite imagery from different time periods to determine when the UFUs was built. We defined the age of the UFUs as the construction age[42]. Housing price data were obtained through the official Anjuke website (
https://beijing.anjuke.com ), with query times of 2016 and 2020. If the UFU was not residential, we used the average housing prices of residential areas near that UFUs as the price of that UFUs. To determine the population (P) of each UFUs, we use the following formula:P = R × S × U × F
Where, R is the number of residential buildings in the UFUs from aerial photos and field visits, S the number of floors per building, U the number of residential units (households), and F the average number of people per household based on the 2020 China National Census (2.62 people/households). Finally, we calculated population density (person/km2) as P/A, where A is the area covered by each UFUs[46].
Data processing
-
To analyze land-use changes in the study area, we obtained cloud-free Level-1C (L1C) image products from Sentinel-2A for the years 2016 and 2020. The images taken on May 7, 2020 (L1C_T49QDB_A016546_20200507T032046) and June 2, 2016 (S2A_OPER_MSI_L1C_SGS_20160602T032443_20160602T082637_A004934_T49QDB_N02_02_01) were selected and downloaded from the European Space Agency's (ESA) website (
https://dataspace.copernicus.eu/ ). These images were the only available option with dates and cloud-free conditions closest to the field survey application. The subsequent digital processing steps included pre-processing, classification, post-processing, and post-classification. These steps involved mapping, validation, and analysis of the changes in the mapping outputs.Image pre-processing
-
We used radiometric and atmospheric correction. The images were pre-processed using the European Space Agency's (ESA) processor Sen2Cor in a semi-automatic processing model. SRTM was used as the digital elevation model (DEM), and the plots were depicted using ArcGIS 10.8 software. The images were composed of 13 spectral bands, including visible, near-infrared (NIR), red-edge, and short-wave infrared (SWIR), with spatial resolutions of 10, 20, and 60 m. With the aid of ArcGIS version 10.8 (ESRI, Redlands, CA, USA), the red-edge bands (bands 5, 6, 7), the near-infrared band (band 8A), and the shortwave infrared bands (bands 11 and 12) were resampled to 10-m spatial resolution.
Image classification
-
The study employed the support vector machine classification algorithm for the classification process, a pixel-based supervised image classification method. Training samples were obtained for each Landuse type based on fieldwork and personal knowledge of the research area. Sixty training samples of the region of interest were acquired separately for each image in Envi 5.5 software. To improve the accuracy of the classification, band compositions such as false-color infrared (bands 8, 4, 3), shortwave infrared (bands 11, 8A, 4), and false-color agriculture (bands 11, 8, 2) were used for the identification of different land cover types. False color infrared can identify differences in vegetation by separating the different shades, while shortwave infrared was used to classify built-up and barren areas[47] .
Land use and land cover change analysis
-
We generated Landuse thematic maps based on the five classes that best represented the study area. Landuses were built-up land, water, forest, grassland and bare land (Table 2). The area of each Landuse class was calculated, and a transition matrix of area changes in each of the two periods was created from the transition map output. The land use of an area and change assessment was based on the remote sensing data and the classification scheme. To show the change in the area, the transition matrix table[48] was used. By comparing the raster cells from the starting year (2016) with that of the end year (2020), the unaltered area and total change across classes were depicted. The rows correspond to the class values in the year 2020, while the column displays the starting year's data. The cross-tabulation of changes in the pixels of different classes was used to create the transition map.
Table 2. Land use land cover classes and definitions.
Classes Definition Built-up land Land under construction inside the city area or its surroundings; including buildings and construction sites. Forest land Forested areas, native or planted; composed of tall trees and a dense canopy. Water Any water body or water resource in the area, including the sea, rivers, streams, dams, and ponds. Grassland Natural or planted grassy areas dominated by graminoids and forbs. Bare land Any area of exposed soil. Found on sites under construction, underdeveloped roads, sandpits, or sand sources. Accuracy assessment
-
The classification map's accuracy was confirmed using data from both Google Earth and field inventory. Evaluation metrics included overall accuracy, user accuracy, and producer accuracy[49]. Overall accuracy measures the proportion of correctly classified pixels or objects, while user accuracy assesses the likelihood that a labeled pixel or object corresponds to its actual class on the ground. Producer accuracy, on the other hand, represents the probability of correctly classifying ground objects[49−51]. The calculation formula[51] is as follows:
$ Overall\; accuracy = \frac{{\displaystyle\sum\limits_{k = 1}^{k = 5} {{n_{kk}}} }}{n} $ (1) $ User\; accuracy = \frac{{\displaystyle\sum\limits_{k = 1}^{k = 5} {{n_{kk}}} }}{{{n_{ + k}}}} $ (2) $ Producer\; accuracy = \frac{{\displaystyle\sum\limits_{k = 1}^{k = 5} {{n_{kk}}} }}{{{n_{K + }}}} $ (3) Where n is the total number of images; nkk is the number of images correctly classified by type k; nk+ is the total number of type k in the reference data; and n+k is the total number of type k in the data to be evaluated.
Data analysis
-
We used Wilcoxon signed-rank tests to investigate differences in the proportion of the area was grassland, water, bare land, forest, building and green space in the UFUs between 2016 and 2020. Multiple regressions were used to determine the combined and individual effects of construction age, house price and population density on the proportion of water area, bare land area, forest area, grassland area and built-up area in each UFU. To satisfy the assumption of normal distribution, we log-transformed construction age, housing price, population density, water area, bare land area, forest area, grassland area, and built-up area, and all variables were standardized using z-scores before including them in the model. The Variance Inflation Factor (VIF) showed low levels of multicollinearity among predictors (VIF < 5). Additionally, Moran's I was implemented in the R package ape[52] to check for spatial autocorrelations in the residuals of the models and found none. To reject the null hypothesis, we selected three significance levels of p = 0.05 (or 95% confidence), p = 0.01 (or 99% confidence), and p = 0.001 (or 99.9% confidence) and performed all statistical procedures in R 4.0.4 (
https://cran.r-project.org/bin/windows/base/ )[53]. -
Table 3 illustrates the overall classification accuracy of land use for the years 2016 (85.71%) and 2020 (81.25%). These results affirm the appropriateness of utilizing classified remote sensing images for land-use change analysis. In both 2016 and 2020, the accuracy of producers in water bodies and bare land was 100%. For forested areas, the producer's accuracy was 75% in 2016 and decreased to 69% in 2020, reflecting a 6% decline. Grassland producer accuracy was 86% in 2016, dropping to 67% in 2020, indicating a 19% decrease. The producer accuracy for built-up areas was similar between 2016 (76%) and 2020 (74%). In both 2016 and 2020, the user's accuracy for both water bodies and built-up areas was 100%. The user's accuracy for bare land was 60% in 2016 and decreased to 50% in 2020, showing a 10% decline. The user's accuracy for forested areas was 90% in both 2016 and 2020. For grassland, the user's accuracy was 60% in 2016 and dropped to 40% in 2020.
Table 3. Summary of mapping accuracy assessment.
Landuse 2016 2020 Producer accuracy User accuracy Producer accuracy User accuracy Water 100% 100% 100% 100% Bare land 100% 60% 100% 50% Forest area 75% 90% 69% 90% Grassland 86% 60% 67% 40% Built-up land 76% 100% 74% 100% Overall accuracy 85.71% 81.25% Changes in land use in Haikou city
-
The largest change in land use was seen in the decrease in forest land, from 1,262.68 ha in 2016 to 776.75 ha in 2020, a decrease of 62.6%. Conversely, compared to 2016, the grassland area in 2020 increased by 346.62 ha. The bare land area decreased from 2,018.41 ha in 2016 to 1,908.29 ha in 2020, a decrease of 5.8%. Built-up land increased from 6,581.71 ha in 2016 to 6,871.92 ha in 2020. The water area decreased by just 3.7% from 1,157.58 ha in 2016 to 1,116.8 ha in 2020 (Fig. 2).
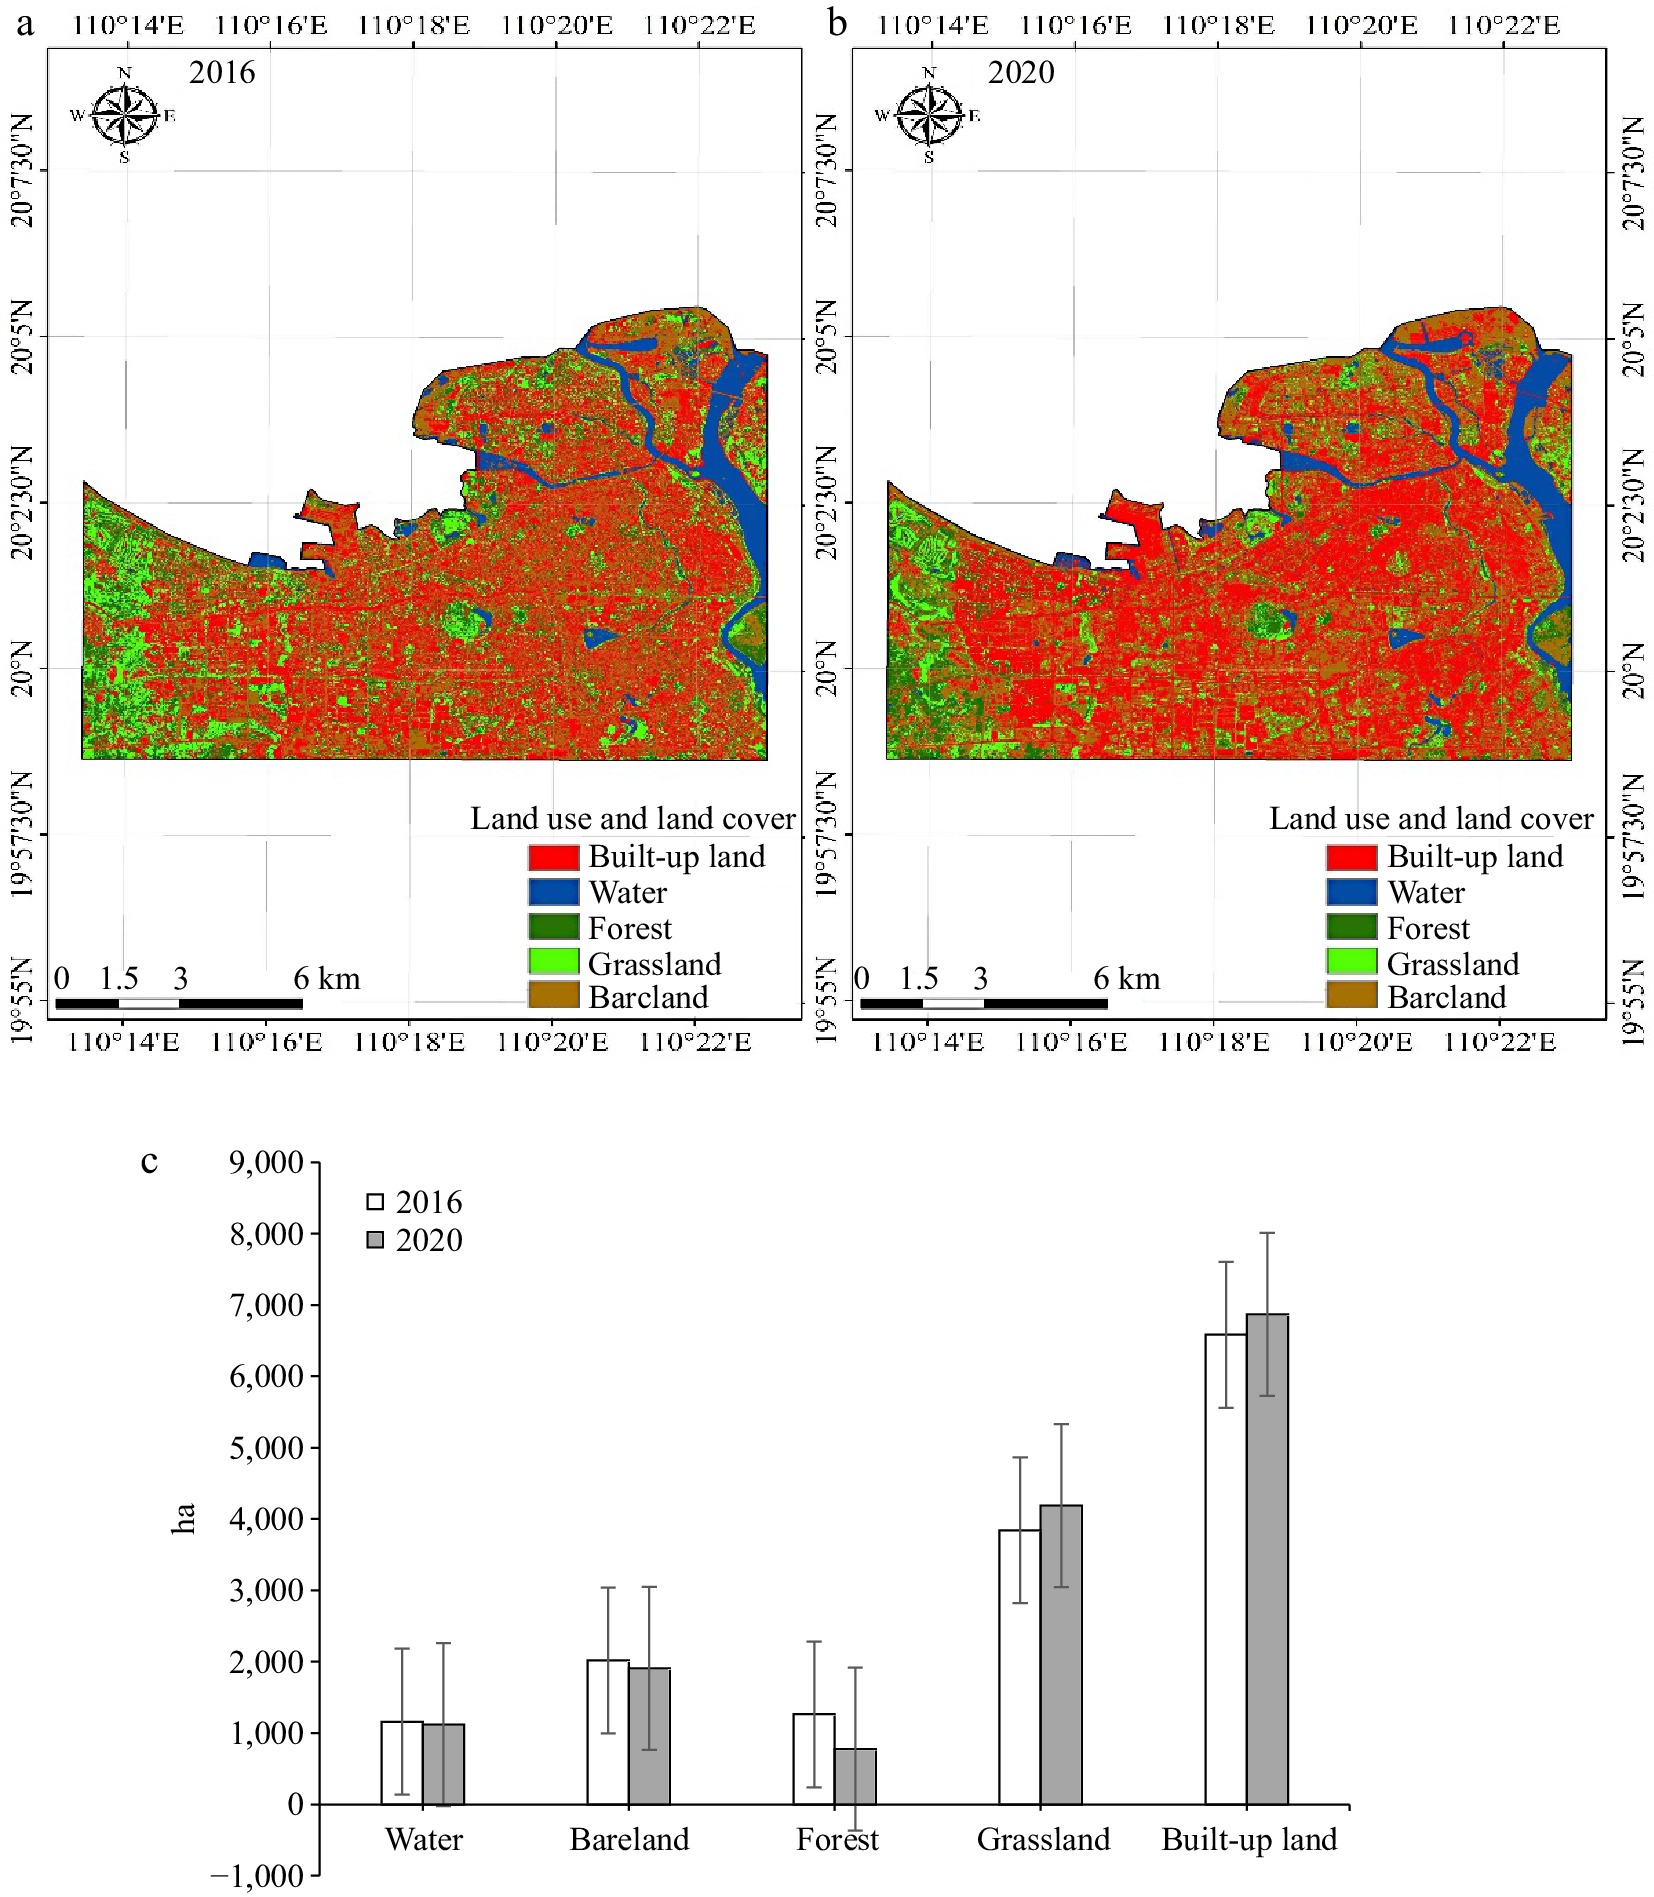
Figure 2.
Landuse of Haikou in (a) 2016 and (b) 2020 and (c) landuse change in Haikou City.
Changes in landuse in primary urban functional units (UFUs)
-
Landuse change varied greatly among different UFUs. Overall, the largest decline in forest area was in recreation and leisure districts, falling from 36.08% in 2016 to 30.37% in 2020. With the exception of industrial and business districts, the water area of all major UFUs decreased in 2020, with residential areas experiencing the largest percentage decline, from 5.45% in 2016 to 4.4% in 2020. In 2020, the proportion of grassland area in recreation and leisure districts was the largest (42.89%), and the percentage of grassland area in transportation units the smallest (20.49%). Compared with 2016, the proportion of built-up land area in industrial and business districts in 2020 increased by 4.28%, and the proportion of bare land area decreased by 2.19%. The largest decline in the percentage of total green space between 2016 and 2020 was seen in industrial and business districts (23.22%) (Fig. 3).
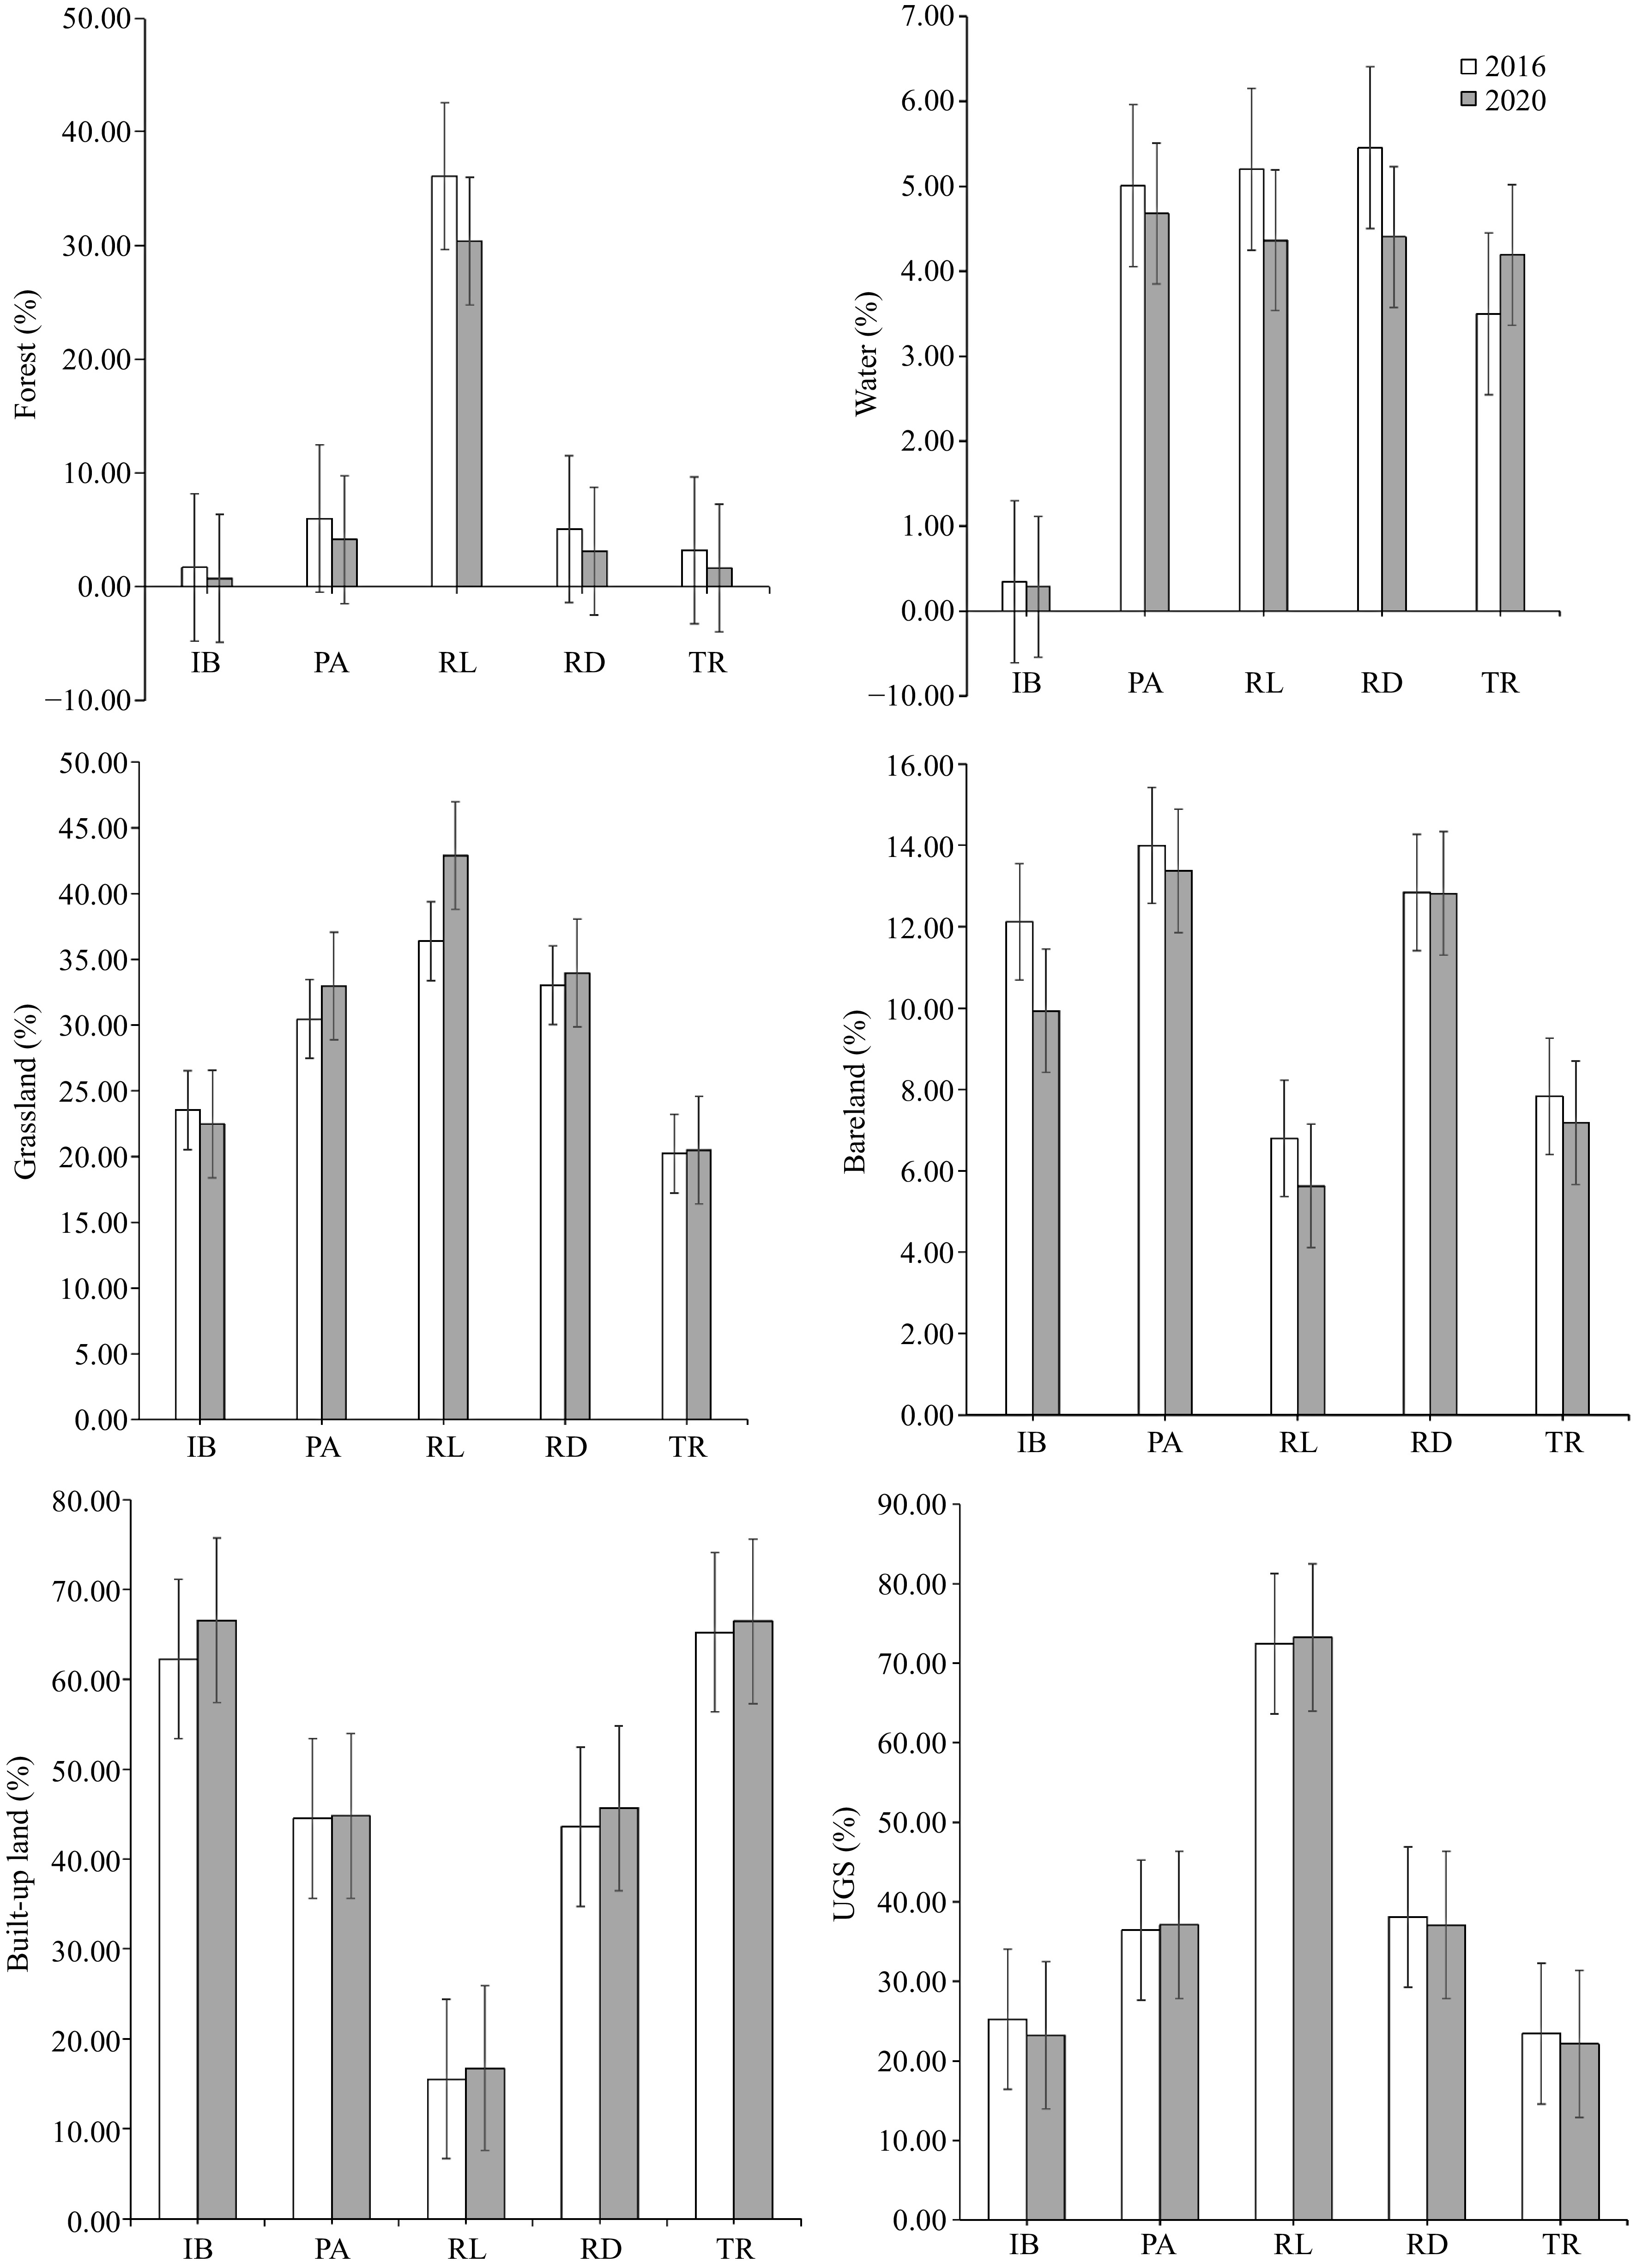
Figure 3.
Landuse and UGS in primary UFUs in Haikou in 2016 and 2020. Among them, IB: Industry and business districts, PA: Public affairs service districts, RL: Recreation and leisure districts, RD: Residential districts, TR: Transportation.
Changes in landuse in secondary urban functional units (UFUs)
-
In both 2016 (19.07 ± 26.84 hm2) and 2020 (18.99 ± 27.15 hm2), parks exhibited the highest area of UGS. Among the secondary UFUs, research institutes showed the most significant change in UGS (1.08 ± 0.71 hm2 in 2016 to 0.9 ± 1.08 hm2 in 2020). Analyzing land use changes during this period, the forested area within parks represented the largest proportion (Fig. 4). Notably, the most substantial alteration in grassland area in 2020 (0.89 ± 1.06 hm2) compared to 2016 (1.05 ± 0.71 hm2) was observed in research institutes. When examining the composition of land use from 2016 to 2020, water areas constituted the smallest proportion among UFUs, relative to forest, grassland, built-up land, and bare land (Supplemental Table S1, Figs 4 & 5). Throughout this period, hotels dominated the building land use category among secondary UFUs, while research institutions claimed the smallest share. On the other hand, primary and secondary schools accounted for the largest proportion of bare land (Supplemental Table S1, Figs 4 & 5).
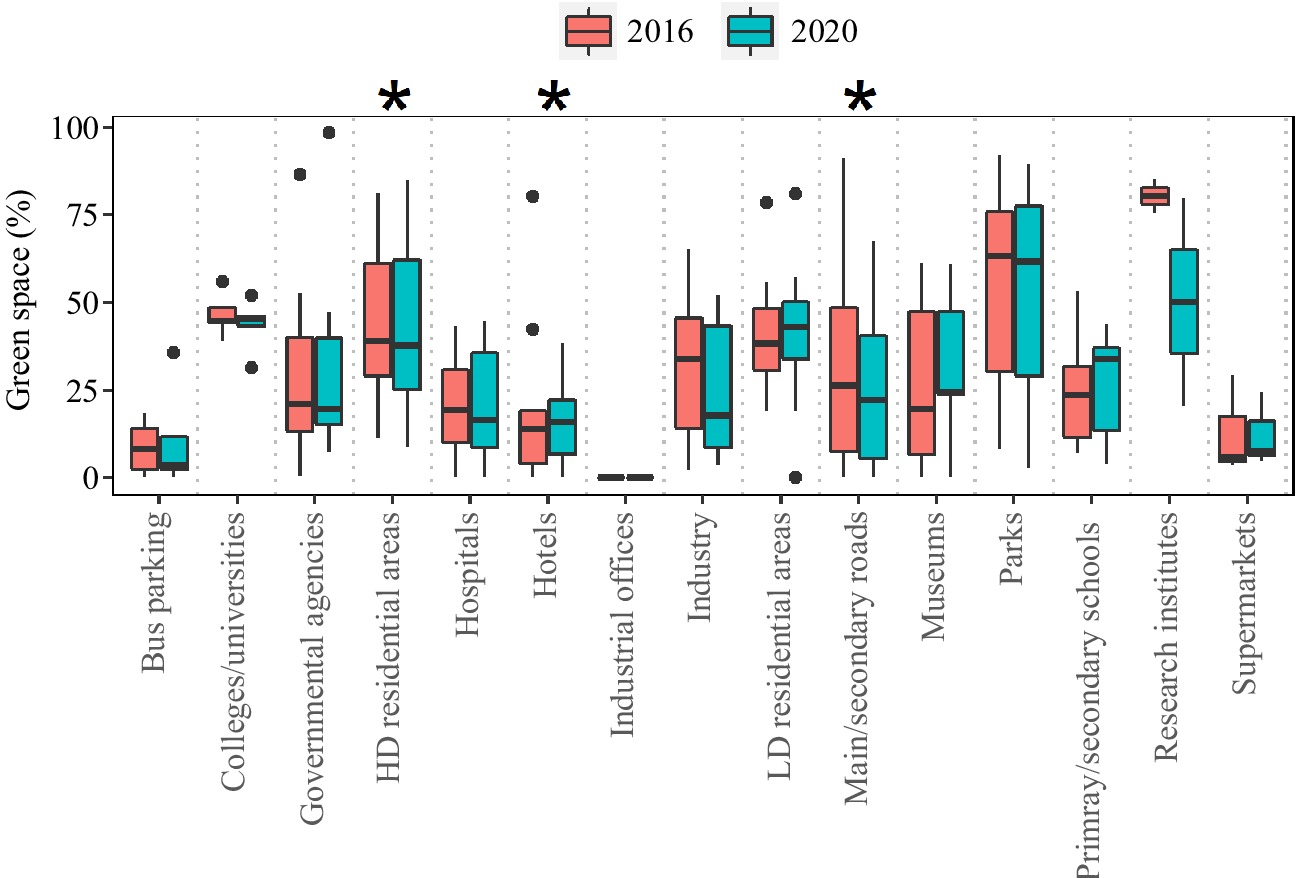
Figure 4.
Proportion of green space (area covered in vegetation) in secondary UFUs in 2016 and 2020 in Haikou city. * indicate significant differences between 2016 and 2020 based on Wilcoxon tests.
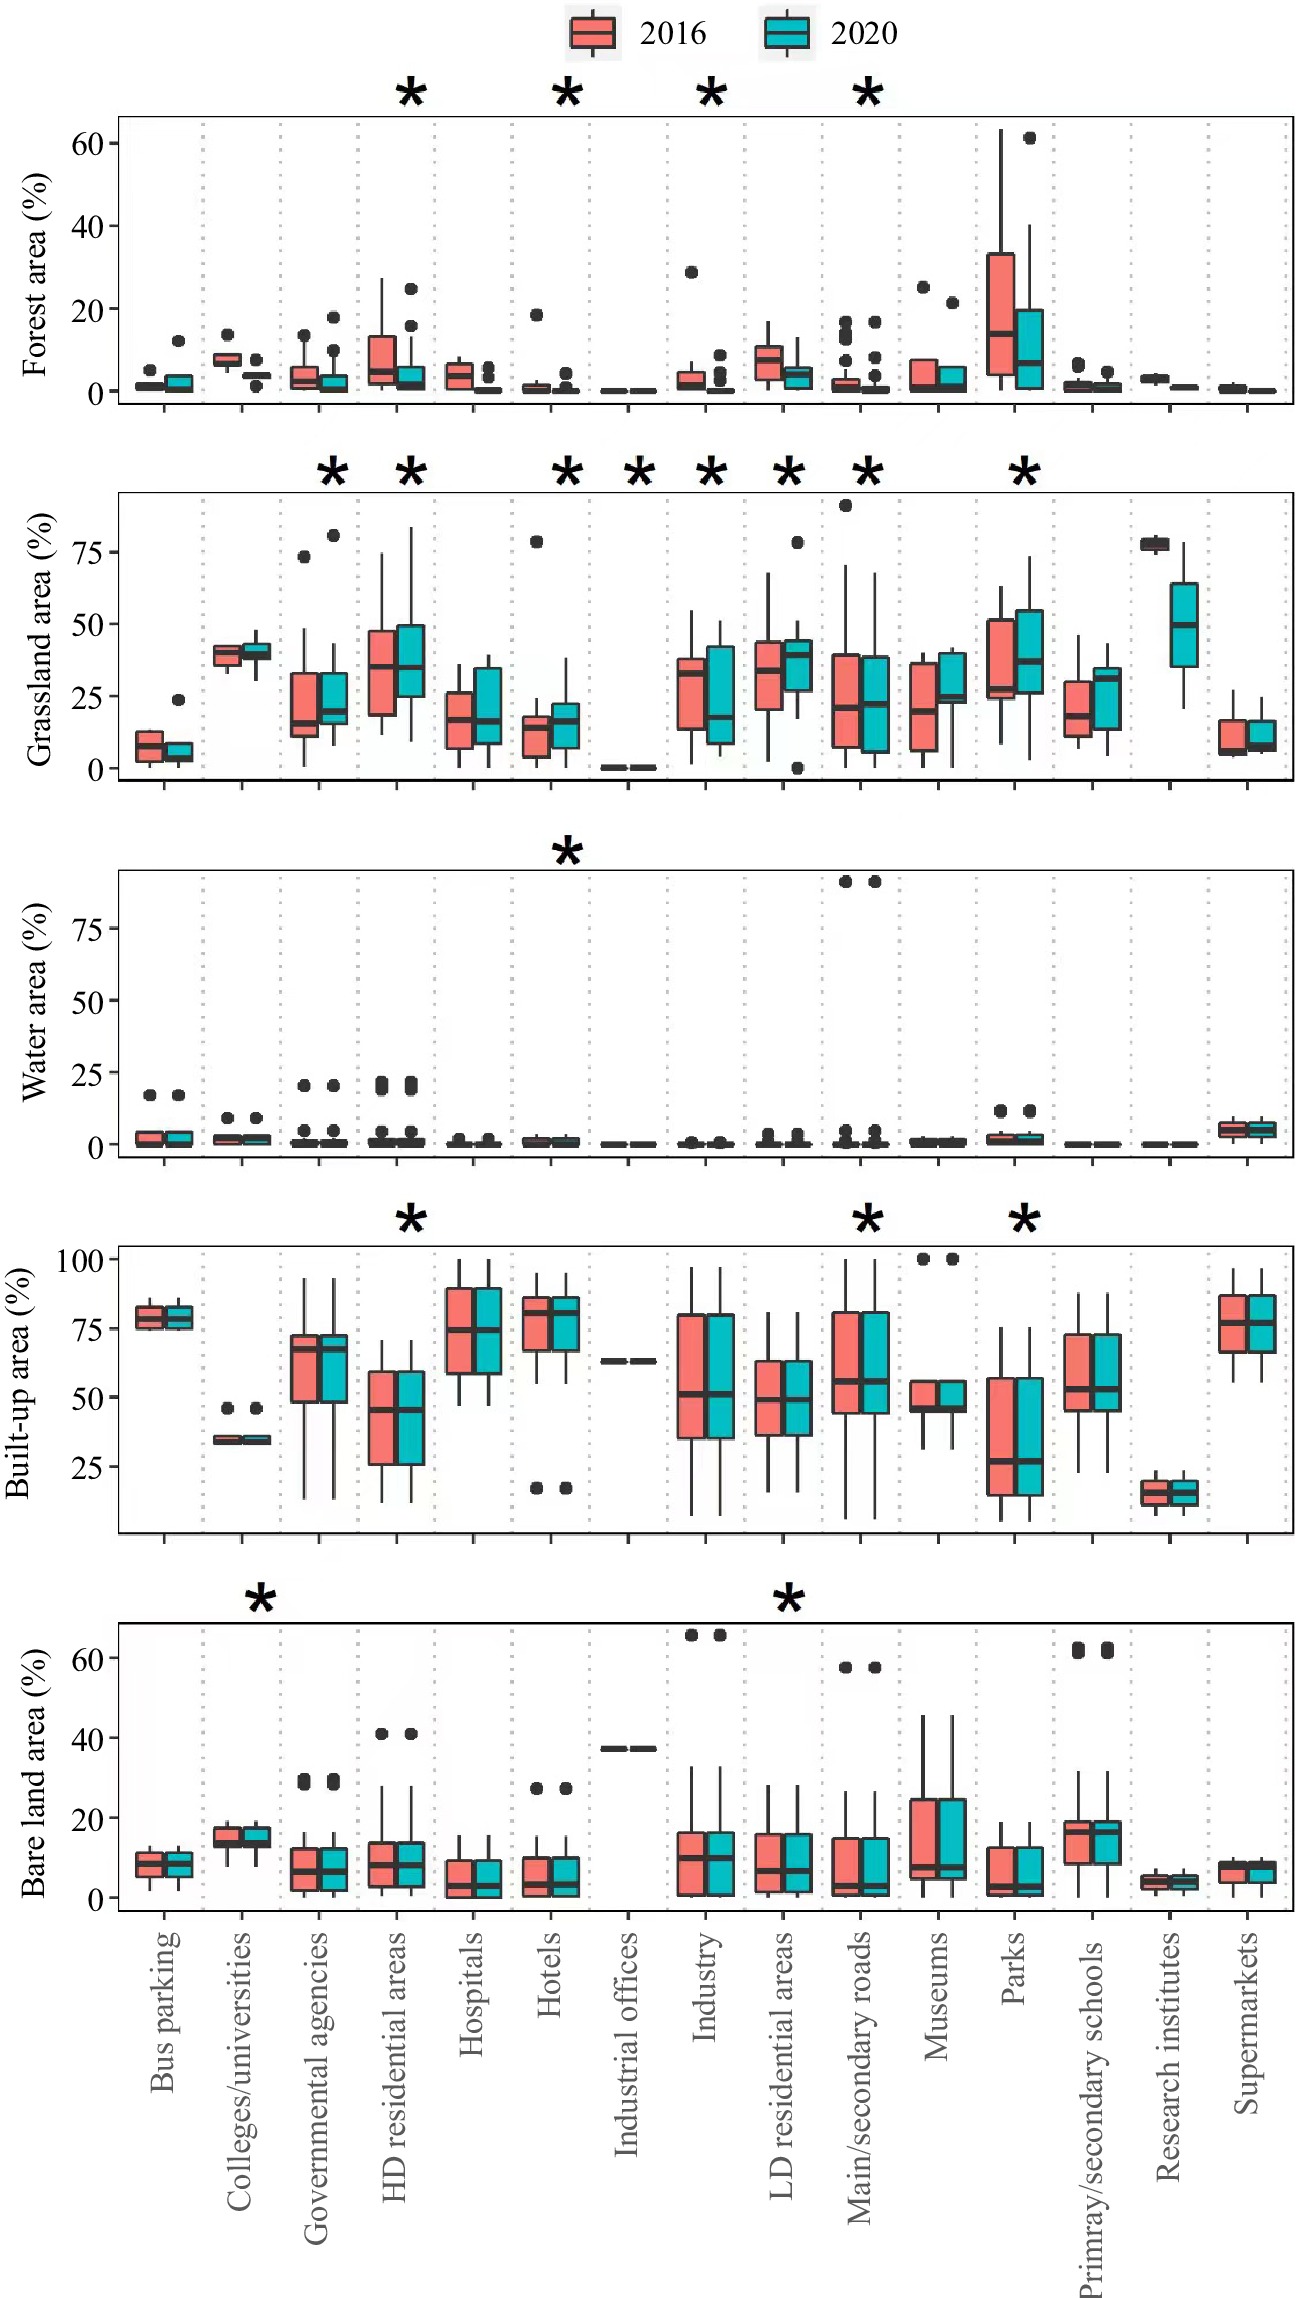
Figure 5.
Proportion of landuse in secondary UFUs in 2016 and 2020 in Haikou city. * indicate significant differences between 2016 and 2020 based on Wilcoxon tests.
Assessment of the potential drivers of Landuse
-
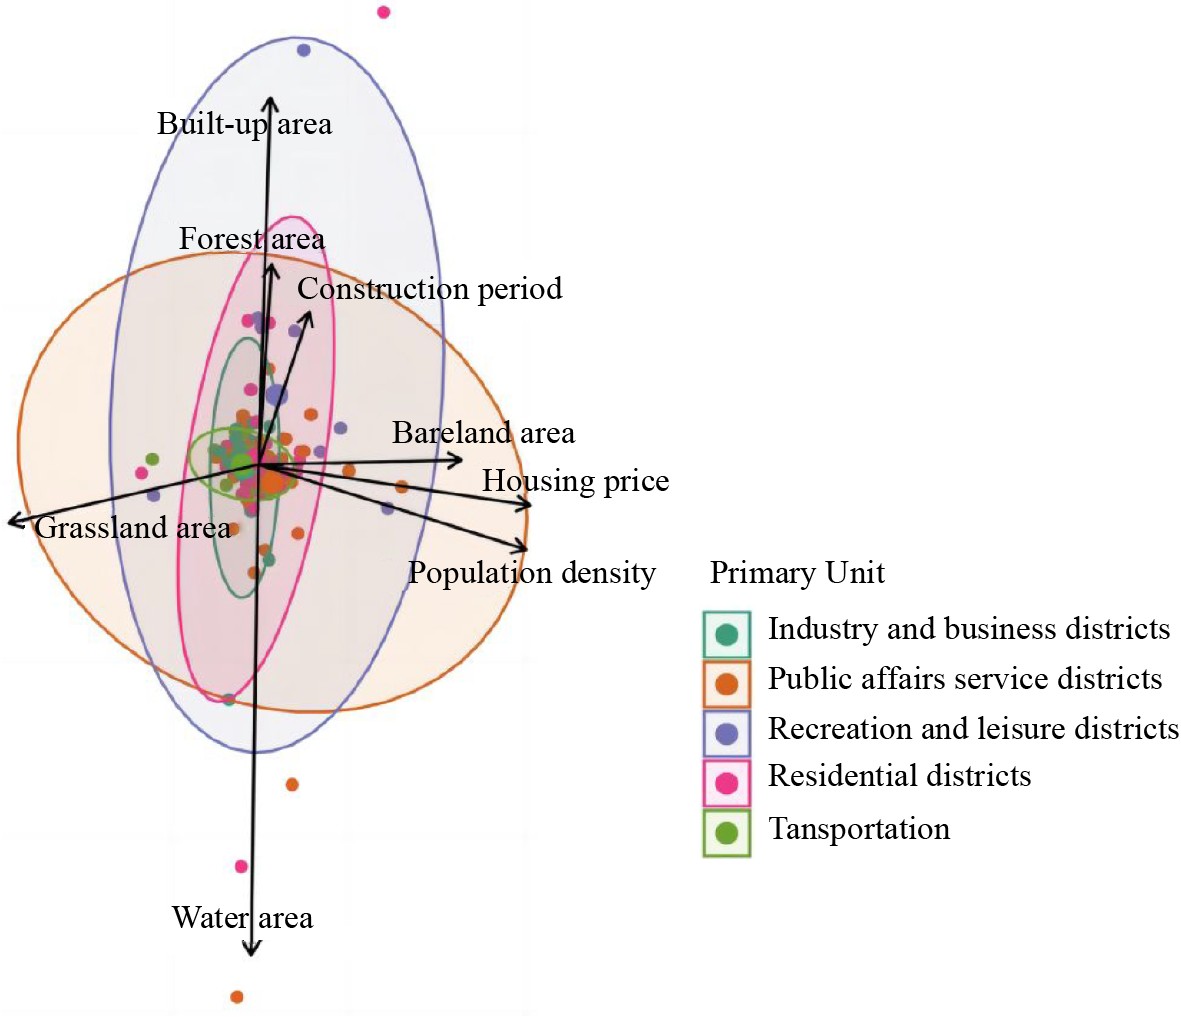
Here, we present results from multiple linear models that exhibited significant R2 values, and the strength and direction of relationships were inferred from the β coefficients (Table 4). It is noteworthy that the multivariate regression R-squared values for water area, bare land area, forest area, grassland area, and built-up area ranged from high to low (i.e., 0.921 or below). Construction age emerged as the strongest predictor for water area, bare land area, forest area, and grassland area in residential zones (β = −0.878 to 0.544). Additionally, construction age stood out as the most influential predictor for altering forest area in transportation zones (β = −0.534***). Housing prices were significant as the most potent predictor for bare land and grassland areas in public service zones (β = 0.635*** and −0.772***). Population density emerged as the strongest predictor for bare land area in industry and business zones (β = 0.384*) and also played a pivotal role in predicting grassland area in public service zones (β = −0.215**).
Table 4. Multivariate regression analysis results of Landuse area with construction age, housing prices, and population density in primary UFUs of Haikou City in 2020.
Land use and land cover Primary UFUs Construction age
(β coefficient, n = 190)Housing price
(β coefficient, n = 190)Population density
(β coefficient, n = 190)R2 Water area Industry and business −0.142 0.127 −0.098 0.052 Public service −0.000 −0.156 0.302 0.041 Recreation and leisure 0.019 −0.172 −0.136 0.058 Residential −0.612*** 0.018 −0.188 0.430*** Transportation 0.095 −0.107 0.099 0.033 Bare land area Industry and business 0.106 −0.253 0.384* 0.223 Public service 0.027 0.635*** 0.203 0.656*** Recreation and leisure 0.089 −0.038 −0.070 0.022 Residential 0.370* −0.073 0.162 0.172* Transportation −0.023 −0.025 0.239 0.056 Forest area Industry and business −0.087 0.487 −0.146 0.271* Public service 0.042 0.252 −0.252 0.027 Recreation and leisure 0.187 −0.176 −0.156 0.138 Residential 0.544*** −0.091 0.216 0.373*** Transportation −0.534** 0.034 −0.075 0.319* Grassland area Industry and business −0.241 0.195 −0.139 0.130 Public service −0.045 −0.772*** −0.215** 0.921*** Recreation and leisure 0.138 −0.442 0.092 0.228 Residential −0.878*** −0.074 −0.097 0.776*** Transportation 0.118 0.023 0.015 0.014 Built-up area Industry and business −0.022 −0.398* 0.023 0.161 Public service 0.099 0.139 −0.154 0.016 Recreation and leisure −0.111 0.181 0.126 0.088 Residential −0.009 0.314* −0.060 0.102 Transportation 0.205 −0.145 −0.116 0.074 Significance codes: * p < 0.05, ** p < 0.01, *** p < 0.001. -
From 2016 to 2020, significant changes occurred in the land cover of Haikou City, with a noticeable decrease in forest area, amounting to a total loss of 63% (Fig. 2). Moreover, the proportion of forest area in the major UFUs also experienced a decline (Fig. 3). All plants, especially trees, play a crucial role in air purification, dust suppression, and water conservation[54]. As forested areas decrease, ecosystem services such as air purification may diminish, potentially leading to negative impacts on human health[55,56]. Additionally, forested areas serve as natural habitats for many flora and fauna, thus their demise could lead to biodiversity loss[57]. Furthermore, the decline in forested areas may contribute to increased surface runoff, soil erosion, and alterations in local microclimates[58], thus negatively impacting the overall health of the urban ecosystem.
In addition, Haikou witnessed a 4.22% increase in the proportion of total built-up area, a 3.65% decrease in water area, and a 5.77% reduction in undeveloped land (Fig. 2). Land reclamation (or more accurately, converting shallow strait areas into land) has been carried out in recent years to facilitate real estate investments and developments, particularly in areas like the Haidian District near Haikou[59]. On one hand, land reclamation helps alleviate land supply-demand conflicts in coastal areas and expands opportunities for sustainable development[60,61]. On the other hand, it accelerates the loss of wetlands. Over the past 40 years, large-scale land reclamation in China has resulted in a cumulative loss of approximately 21,900 km2[62], equivalent to 50% of the total coastal wetland area nationwide[59].
During the period from 2016 to 2020, public parks showed the highest proportion of UGS, followed by research institutions and higher education institutions (Fig. 4). Universities are places with frequent incoming and outgoing traffic, often having an international character[63] and attracting students and faculty members from across the country or globe[64]. Such movement may unintentionally (or even intentionally) introduce plants into the local environment, such as seeds carried on shoes or clothing[65]. Moreover, due to people's preferences, universities tend to have a high UGS, as having disproportionately more plant enthusiasts among the faculty makes it easier to attract stronger attention to botany[65]. This attention may lead to an increase in plant collections. Additionally, students are more likely to study botany courses and collect plants at universities[65]. On college and university campuses, there have been notable initiatives observed at Qinghai Normal University (located in Xining, Qinghai, China) and Zhejiang University (located in Hangzhou, Zhejiang, China) that involve the planting, labeling with scientific names, and maintenance of tree species as part of their life sciences education programs. Both students and faculty are more likely to spend a considerable amount of time in green spaces, promoting the emerging societal ideology of building an ecological civilization (i.e., one that envisions harmonious nature and economy distinct from the concept of sustainable development)[66].
From 2016 to 2020, UGS in industrial and commercial areas experienced a significant decrease, likely due to increased development, potentially raising the land value[59,67]. Furthermore, UGS may be seen as an unnecessary cost, as they require varying levels of economic and managerial investment[68]. The funds required for the maintenance of UGS may be limited, especially during economic downturns[38,69]. To minimize these impacts, it is necessary to incorporate green building practices, promoting sustainable land use management[70], such as protecting open spaces and developing environmentally friendly transportation infrastructure[71]. During the study period, it was noted that water and undeveloped land were transformed into built-up land. Future urban policies should encourage urban greening under different land uses, increase ecological connectivity, and provide ecosystem services.
The driving factors of Landuse patterns in Haikou
-
In residential areas with older construction ages (i.e., old houses and urban development), there is a greater presence of forests. This phenomenon reflects the long-term trajectory of management practices and underscores the importance of considering legacy impacts[63]. Forests, as part of the landscape, inherit the legacy of past management, greening movements, and the ever-changing socio-economic conditions, all of which influence the development of communities and changes in people's behavior[72]. Historical decisions and urban planning practices adopted in the past have had a lasting impact on the current forest coverage patterns. In areas with older construction ages, trees have had more time to grow and mature[73]. Over time, urban vegetation gradually forms a more mature ecosystem[74]. Supporting this, Hainan Province is steadfastly committed to the construction of an ecological civilization. Since 1994, the Hainan provincial government has enacted policies prohibiting the logging of natural forests to protect endangered flora and fauna, preventing further destruction[75,76]. This commitment reflects proactive measures for ecological sustainability and biodiversity conservation, further demonstrating the impact of past policies on wooded areas in residential areas.
However, in traffic zones, a reverse legacy effect is observed. With the increasing age of traffic zone development, the quantity of forested areas tends to decrease. This may be attributed to the dynamic impact of traffic zone development on the quality of the urban ecosystem[77]. The primary function of traffic zones is to facilitate transportation, leading to a planning emphasis on transportation infrastructure such as roads and parking lots, rather than UGS[78,79]. Additionally, traffic zones are much more susceptible to environmental pollution and traffic noise. Moreover, areas with lower species diversity and higher fragmentation – highly typical of roads – are often less suitable for the survival of many species[78]. The main characteristics of roads, including high levels of anthropogenic interference and a lack of vegetation, have adverse effects on the local ecological environment[80]. The continuous flow of traffic and vehicle exhaust emissions further contribute to environmental pollution, leading to the destruction of natural habitats and a further decline in species diversity[81]. Furthermore, roads create physical barriers, hindering the movement of flora and fauna and limiting their ability to establish new populations[74]. There are also other factors that can influence transformations in urban forested areas, such as urban planning and green management[73].
Forests and grasslands tend to grow in alternate successions over time. This aligns with Creamer et al., who reported a negative correlation between forests and grasslands[82]. This trend is belived to arise from the ecological competition between trees and grasslands, with larger trees competing for light, water, and soil nutrients, thus hindering the full growth of grasslands[82,83]. As the number of trees increases, the shade cast by the canopy alters ground microclimatic conditions to some extent, reducing the viability of shade-sensitive herbaceous plants and consequently decreasing the extent of grasslands[84].
Another variable considered was the impact of housing prices. Although substantial, this effect is not always directly quantifiable. For instance, accurately measuring housing prices in public affairs service areas can be complex. Therefore, housing prices within public affairs service areas are influenced by the prices of nearby properties and are only suitable as indirect reference indicators. In contrast, residential areas can more accurately reflect the actual housing prices within a given region. With the rise in housing prices, there has been a corresponding expansion of built-up areas, accompanied by a reduction in UGS. Research indicates that in districts with higher housing prices, real estate developers increase land development and usage, sacrificing existing green areas in pursuit of higher profits[85,86]. Additionally, research has found that housing prices typically reflect the supply and demand dynamics of the real estate market[87]. High demand leads to the development of more residential areas in cities, and people are willing to pay higher prices to purchase homes[88]. Population density is also a crucial factor influencing the extent of grasslands. In the face of limited land resources, cities need to make efficient use of land and provide space for the increased population for residential, commercial, and infrastructure purposes[89,90]. For example, in Haikou City, more vertical buildings have been constructed to accommodate a larger population[91]. However, these activities still occupy significant amounts of land, reducing the grassland area. Studies from continental European cities show that grassland coverage decreases with an increase in population density[92]. Similar research in tropical Southeast Asia and Europe similarly indicates that cities with higher population densities have less grassland area[92,93].
-
With the establishment of an international free trade port, Haikou is undergoing a rapid process of urbanization. Developing cities should aim to protect and enhance both the quantity and quality of UGS, with a focus on strengthening their ecosystem services. Notably, the most significant changes in the proportion of UGS in Haikou occur in industrial and commercial areas. In contrast, parks and university campuses play a crucial role in maintaining stable UGS within the city. Furthermore, our research confirms previous observations that grassland area decreases with increasing population density; while the distribution of urban forestland in Haikou is associated with the combined effects of construction age and management predicted by the heritage effect hypothesis. Further work should address other factors within the urban context, such as cultural or UGS investment, to provide clear guidance on how to implement and manage UGS land use more effectively in the urban environment.
-
The authors confirm contribution to the paper as follows: study conception and design: Zhu M, Wang H; data collection: Guo L, Cui J; analysis and interpretation of result: Zhu M; draft manuscript preparation: Khokhar A; Writing and editing: Zhu M, Cubino J, Johnson J, Hughes A. All authors reviewed and approved the final version of the manuscript.
-
Data sharing is not applicable to this article as no datasets were generated or analyzed during the current study.
This study was supported by National Natural Science Foundation of China (32160273), the Project of Sanya Yazhou Bay Science and Technology City (SCKJ-JYRC-2022-83), open funding from East China Normal University (SHUES2021A08, SHUES2022A06), the PhD Scientific Researchand Innovation Foundation of Sanya Yazhou Bay Science and Technology City (HSPHDSRF-2023-12-010), and funding from the Collaborative Innovation Center of Nanfan and High-Efficiency Tropical Agriculture, Hainan University (XTCX2022NYB09). We thank the anonymous reviewers for their constructive comments on this manuscript.
-
The authors declare that they have no conflict of interest.
-
accompanies this paper at (https://www.maxapress.com/article/doi/10.48130/tp-0024-0011)
-
Received 23 November 2023; Accepted 4 March 2024; Published online 9 April 2024
-
We analyzed the distribution of land use in Haikou City and its driving factors through urban functional unit analysis.
The distribution of urban forests is related to both the construction age (as predicted by the legacy effect hypothesis) and the combined effect of human management.
The distribution of urban grasslands decreases with increasing population density.
- Supplemental Table S1 Landuse and UGS area(average ± standard deviation) in Secondary UFUs of Haikou City from 2016 to 2020.
- Copyright: © 2024 by the author(s). Published by Maximum Academic Press on behalf of Hainan University. This article is an open access article distributed under Creative Commons Attribution License (CC BY 4.0), visit https://creativecommons.org/licenses/by/4.0/.
-
About this article
Cite this article
Zhu MH, Cubino JP, Johnson JB, Cui JP, Khokhar AA, et al. 2024. The legacy effect and urban management planning driving changes in Urban Green Spaces land use in Haikou city, Hainan province: a comprehensive analysis. Tropical Plants 3: e011 doi: 10.48130/tp-0024-0011 

The legacy effect and urban management planning driving changes in Urban Green Spaces land use in Haikou city, Hainan province: a comprehensive analysis
- Received: 23 November 2023
- Revised: 09 February 2024
- Accepted: 04 March 2024
- Published online: 09 April 2024
Abstract: Urban Green Spaces provide extensive ecosystem services, benefiting both human and wildlife in urban areas, and improving the overall ecological health of cities. The impact of Urban Green Spaces can be measured through various indicators. This study combined remote sensing data and social surveys to investigate the distribution patterns and driving factors of Urban Green Spaces and land use in Haikou, a tropical coastal city in Hainan, China. We analyzed Sentinel-2A images between 2016 and 2020 to determine the land cover extent of Urban Green Spaces within Urban Functional Units. We also considered the socio-economic variables which drive valuable ecosystem services related to land use, as land-use decisions often overlook the value of these variables. During the study period, parks contained the highest proportion of Urban Green Spaces, while the most significant decline in Urban Green Spaces was observed in industrial and commercial areas. Additionally, population density was found to influence the distribution of grassland, while the distribution of urban forestland was related to the combined effects of construction age (as predicted by the heritage-effect hypothesis) and human management. The results highlight the crucial role played by parks and universities in maintaining stable green spaces in Haikou throughout the study period. These relationships can guide future land-use planning and inform the formulation and management of green space policies in the urban ecosystem.
-
Key words:
- Urban green spaces /
- Land use change /
- Socio-environmental /
- Heritage-effect hypothesis