METHOD   Open Access    

Methods for seedling identification of cucumber resistance to powdery mildew and its effect on the growth of cucumber seedlings

  • # Authors contributed equally: Jihong Tan, Liping Zhong

More Information
  • The severity of powdery mildew in cucumbers gravely impinges upon both yield and quality. In order to probe efficacious methods for early-stage resistance determination against powdery mildew in cucumbers, we utilized Xintai mici as an experimental subject and adopted a four-factor, three-level (L9(3)4) orthogonal experimental design. This design encompassed four factors: inoculation seedling age, inoculation concentration, inoculation method, and different hydration periods post-inoculation. Through this, we sifted and discerned the most optimal indoor method for early-stage resistance determination against powdery mildew in cucumbers. Concurrently, we studied the influence of different determination methods on the accumulation of cucumber plant biomass, chlorophyll content, and leaf photosynthetic parameters to delineate the impact patterns of powdery mildew on cucumber leaf photosynthetic traits. The results underscored that disease incidence amongst different treatments were minute, all exceeding 96.67%. In contrast to other treatments, T3 (inoculating a spore suspension of powdery mildew at a concentration of 106 per mL on one-true-leaf stage using the leaf-brushing method and maintaining hydration for 12 h post-inoculation) exhibited a rapid onset of disease, with a disease index reaching 89.03, thereby proving to be the most superior method for early-stage powdery mildew determination. Various determination methods wielded a significant influence on dry and fresh weight, chlorophyll content, and leaf photosynthetic activity of cucumber seedlings. Relative to other treatments, the net photosynthetic rate (Pn) of T3, T8, and T9 was significantly suppressed post-inoculation with powdery mildew, all lingering below 3 μmol/m2/s, while the transpiration rate (E), intercellular CO2 concentration (Ci), as well as the stomatal conductance (Gs), drastically declined, the decrease fell between 25%−80%. The relative chlorophyll content maintained at a lower level, ultimately leading to a significant reduction in the accumulation of dry matter. This demonstrates that powdery mildew can significantly stifle the growth of cucumber seedlings.
  • Sweet cherries (Prunus avium L.) are a major focus of agriculture in the Okanagan region of British Columbia (BC), Canada. A large portion of the cherries grown in BC are exported and undergo up to four weeks of storage during transportation before delivery and consumption[1]. In 2022, sweet cherries accounted for 11.6% of the revenue of exported fruit from Canada and have an export value of nearly CAD$130 million[2]. As such, sweet cherry is an important fruit with high commercial importance for Canada. Although the application of cold storage is a necessary postharvest tool to maintain fruit quality up to consumption, there are preharvest factors that impact quality after longer-term storage. The work of Serrano et al.[3] noted that the maturity stage at harvest determined the fruit quality of sweet cherries after storage. For this reason, producers use several parameters to establish the optimum time for harvesting. Producers have long used colour as a marker for maturity, yet the concept of fruit dry matter (DM) at harvest affecting post-storage quality has advanced[46]. In fact, Toivonen et al.[6] developed a predictive model for 'Lapins' sweet cherry DM content using a visible/near-infrared spectrometer and noted its potential application to other cultivars to provide a rapid and non-destructive means of determining DM linked to cherry fruit quality. If sweet cherries are harvested at the wrong time or stored improperly during transit the quality of the cherries at their final destination does not compare to that at the time of harvest. Therefore, it is of the utmost importance to harvest cherries at their optimal time to ensure quality retention. Cherry fruits have minimal reserve carbohydrates so respiration relies primarily upon organic acids[7]. Additionally, cherries have a high susceptibility to physical damage making them highly perishable, so it is imperative to store them properly to maintain their flavour profile and overall quality[811]. Lower respiration rates help to maintain higher titratable acidity (TA) levels, thereby retaining flavour quality[11,12]. Decreased respiration rates are achieved through low-temperature storage and shipping.

    Previous research linking cherry fruit maturity to flavour quality indicated early-harvested cherries with low soluble solids (SS) levels showed low consumer acceptance due to perceived low sweetness, while late-harvested cherries showed low consumer acceptance due to poor texture[13,14]. This information underscores the challenge growers face when determining picking date. Additionally, once cherries are harvested, quality changes occur which include changes in the balance of SS to TA levels. Previous work has shown that SS levels remain relatively constant while malic acid levels (the predominant acid in sweet cherries) decreased by 20% when stored for 4 d at 20 °C[8,14]. Further, SS, TA, and the SS/TA ratio are key parameters in defining flavour quality[15] and consumer acceptance[14] as SS and TA have been reported to be measures of the cherry fruit attributes of sweetness, and sourness, respectively. Additionally, the SS/TA ratio is regarded as an overall taste attribute determining sweet cherry acceptability[14,16,17].

    Depending on cultivar and growing location, SS values for sweet cherries have been reported to range from 12.3 to 23.7 °Brix[14]. Rootstock and storage conditions have also been reported to affect SS, TA, and SS/TA values[18]. Depending on rootstock, for 'Regina' sweet cherries, harvest SS values ranged from 14.8 to 16.6 °Brix and TA values ranged from 5.7 to 7.4 g·L−1, while SS values after storage ranged from 14.6 to 18.2 °Brix and TA values ranged from 4.4 to 6.0 g·L−1. The harvest SS/TA ratio ranged from 2.0 to 2.91 and the SS/TA ratio after storage ranged from 2.47 to 3.77 depending on rootstock. Based on sensory studies using various cherry cultivars and breeding selections to gauge flavour quality and consumer acceptance, the optimal SS/TA ratio was reported to be between 1.5 and 2.0, with SS values ranging between 17 and 19 °Brix[19].

    Unfortunately, members of British Columbia's sweet cherry industry have noted that while their cherries arrive at their export locations with good condition in terms of appearance (i.e. firm, shiny, with green stems), issues have been reported concerning flavour. Poor flavour has been associated with lower levels of TA and lower oxygen in the storage atmosphere. Our previous work noted that BC cherry growers tend to pick their cherries at lighter colours in an attempt to harvest the crop as soon as possible to avoid any weather or pest issues and achieve the highest yield possible[1]. Staccato (SC) is a late maturing economically important cultivar with little research data available. It has been reported that SC cherries have a respiration rate that is negatively correlated with colour when collected between a 2 to 6 colour level as determined with CTFIL (Centre Technique Interprofessionnel des Fruit et Legumes, Paris, France) colour chips[1], which have been typically used as a marker of maturity. For SC cultivars, data showed the lowest respiration levels with cherries harvested at CTFIL colour standards 4-5, and may potentially have better flavour quality retention due to these lower respiration rates[1]. The aim of the work was to: 1) examine indicators of maturity/readiness for harvest (colour, SS, DM, TA, and the ratio of soluble solids to titratable acidity (SS/TA)); and 2) determine whether colour at harvest or other parameters (SS, TA, SS/TA, and DM) better predict flavour quality retention after storage.

    Sweetheart (SH), Staccato (SC), and Sentennial (SL) sweet cherries were sourced from research plots located at the Summerland Research and Development Center (SuRDC, Summerland, BC, Canada) in the Okanagan Valley region of British Columbia over three growing seasons (2018, 2019, and 2021). In the 2018 growing season, two cherry cultivars (SH and SC were collected, in the 2019 growing season, in response to BC Cherry Association interest, three cherry cultivars (SH, SC, and SL) were collected. Due to COVID, data was not collected during the 2020 growing season. In the 2021 growing season, full data (SS, TA, DM, and respiration rate) was only collected on the SC cherry cultivar, while DM and respiration values at harvest were also collected for SH and SL cultivars.

    To collect fruit at different maturity levels, cherry fruits were collected at three different color levels using the CTFIL (Centre Technique Interprofessionnel des Fruit et Legumes, Paris, France) colour standard series at three harvest dates for each cultivar which corresponded to the 3-4, 4-5, and 5-6 colour levels.

    To collect environmental data, two trees were chosen in each orchard block and Onset HOBO (Bourne, MA, USA) temperature and humidity loggers were mounted in these trees as described by Ross et al.[1] and captured data at 10 min intervals. The temperature and humidity data were used to calculate average temperature (AT), average high temperature (AHT), average low temperature (ALT), and average relative humidity (ARH) for 28 d preceding the cherry harvest date.

    Cherries were generally harvested before 11:00 h on each harvest day. Harvested cherries were transported back to the lab for sorting, sampling, and storage. Upon arrival, cherries were placed into a walk-in cooler at 0.5 °C to mimic rapid hydro-cooling capabilities that the industry uses. In the afternoon of each harvest day, cherries were removed from the cooler and sorted following British Columbia Tree Fruits Company protocol: (i) size was greater than 25.4 mm (< 10.5 row size); (ii) stemless cherries were removed; and (iii) cherries with defects such as blemishes, splits, pitting, disease (rot, fungi), hail damage and insect damage were removed. Again, the colour of the cherries was assessed using the CTFIL colour standard series. Based on the harvest period, cherries were separated into different colour levels: 3-4, 4-5, and 5-6. For each colour category, quality assessments (DM, SS, TA, SS/TA ratio, firmness, size, stem pull force, stem shrivel, stem browning, pitting, and pebbling) were performed before and after storage.

    Maintaining the quality of sweet cherries undergoing long distance ocean container shipment (up to 28 d/4 weeks) is important for securing a successful export market for Canadian sweet cherries and for ensuring that current market demand is met[1]. For cherries to be marketable after storage, they must pass several quality attributes. Attributes of firmness, size, stem pull force, stem shrivel, stem browning, pitting, and pebbling were assessed using previously described methods[1,20] to assess fruit quality at harvest and after storage for 28 d at 0.5 °C, ideal refrigerated storage temperature, for all cherry cultivars, and also storage for 28 d at 3 °C, non-ideal refrigerated storage temperature, for SC cherries. The values of these parameters are provided in Supplementary Tables S1S6. As the focus of this work was to examine how maturity level at harvest influenced the flavour quality of SC, SH, and SL sweet cherry cultivars, SS, DM, TA, and respiration rate values were the focus for discussion. Respiration analysis was performed using methods described by Ross et al. on freshly harvested cherries[1]. Rates of CO2 production were expressed as mg CO2 kg−1·h−1.

    DM of the cherries was determined using a Felix F750 handheld spectrometer (Felix Instruments, Inc., Camas, WA, USA) loaded with a valid model developed at the Summerland Research and Development Centre for cherries[6]. DM was measured on 25 fruits that were randomly selected from each sample replicate (i.e. 50 cherries). For SS and TA analyses, the methods of Ross et al.[1,20] were used to test 25 fruits that were randomly selected from each sample replicate (i.e. 50 cherries). Briefly, de-stemmed cherries were transferred into a 15.2 cm × 22.9 cm polyethylene Ziplock bag. The bag was left partially open, and the cherries were pressed by hand to obtain juice. The juice was strained and collected into 60 mL polypropylene screw cap containers. The resulting filtrate was tested for SS (°Brix), and TA (g·L−1 malic acid). For SS determination, the refractive indices of the solutions were observed in °Brix temperature-corrected mode on a digital refractometer (Mettler-Toledo, Refracto 30PX, 13/02, LXC13237, Japan). An automated titrator (Metrohm 848 Tritrino Plus; Mississauga, ON, Canada) was used to measure the TA of 10 mL of the juice with 65 mL distilled water to an endpoint of 8.1 with 0.1 mol·L−1 NaOH.

    At each colour level (3-4, 4-5, or 5-6) 10 kg of cherry samples were cooled to either 0.5 or 3 °C (for SC in 2021) and then packed into cardboard boxes with a polyethylene liner, an absorbent pad, and an iButton (Thermodata, Whitewater, WI, USA), which measured temperatures experienced by the cherries in the cardboard boxes during storage. After 28 d, the same quality assessment tests were performed to see if values varied throughout storage time at each temperature.

    Statistical analysis was conducted using SAS Institute Inc. software version 9.3 (SAS Institute, Cary, NC, USA). Data were subjected to a four-way analysis of variance (ANOVA) using the SAS PROC GLM procedure. The four factors tested were colour level (3-4, 4-5, and 5-6), cultivar (SH, SC, and SL), growing year (2018, 2019, and 2021), and time (harvest or storage (0.5 °C)). The significance of the main effects and interaction of the four factors was determined using Type III sum of squares via the ANOVA test. Additionally, ANOVA using the SAS PROC GLM procedure was performed on data collected for SC cultivar in the 2021 growing year to assess the influence on storage temperature (0.5 and 3 °C) on quality parameters. Statistical significance was determined by least significant difference (LSD) Fisher's test at 5% significance level. Principal Component Analysis (PCA) was performed using SAS version 9.3 PROC PRINCOMP (SAS Institute Inc., Cary, NC, USA) on data collected from the three cultivars over the tested growing years at three colour levels (i.e., up to nine samples per cultivar) and 10 variables for each investigation. Variables included: AT, AHT, ALT, ARH, colour at harvest (ColourH), SS at harvest (SSH), SS after 28 d of storage at 0.5 °C (SS05), TA at harvest (TAH), TA after 28 d of storage at 0.5 °C (TA05), and DM of cherry fruit at harvest (DMH). Microsoft Excel was used to generate PCA plots from the data provided by SAS. Only data available for every growing year were included in the PCA. Correlation coefficients were determined using Pearson's correlation coefficient statistical function in Excel (version 2306, Microsoft, Redmond, WA, USA). Histograms and frequency data were generated using the statistical function in Excel (version 2306, Microsoft, Redmond, WA, USA). Dry matter bin sizes of 1.5% increments were used to present and analyze the histogram and frequency data.

    Tables 14 present data on flavour attributes via values of soluble solids (SS), titratable acidity (TA), SS/TA ratio, and dry matter (DM) as affected by cultivar, growing year, storage and colour level at harvest and after storage, respectively. The most influential parameters in sweet cherry flavour have been found to be SS, TA, and the SS/TA ratio[15]. Additionally, SS and TA values have been found to be related to DM values in kiwis[2124], apples[25], and cherries[6,26]. DM is a measure of solids which includes both soluble sugars and acids along with insoluble structural carbohydrates and starch. Crisosto et al.[4] proposed using DM as an additional quality parameter as DM was determined not to change during cold storage[22]. Toivonen et al.[6] have performed research linking dry matter measurements with sweet cherry quality. As cold storage is also used to maintain cherry quality, assessing DM at harvest and upon storage was of relevance, and a key aspect of this work was to examine how DM values relate to sweet cherry respiration rates and cherry quality parameters.

    Table 1.  Soluble solids values as affected by cultivar, growing year, storage, and colour level at harvest.
    Cultivar Colour level Soluble solids (SS, °Brix)
    2018 2019 2021
    Harvest Storage (0.5 °C) Harvest Storage (0.5 °C) Harvest Storage (0.5 °C) [3 °C]
    Sweetheart 3-4 18.1aA1 17.7aA1 18.1aA1 18.2aA1
    4-5 20.0bA1 19.8bA1 19.4bA1 18.8bA1
    5-6 21.9cA1* 21.1cA1* 19.9bA1* 19.6cA1*
    Staccato 3-4 17.2aA2 17.2aA1 17.1aA2 17.2aA1 18.8aA* 18.9aA*
    18.4a
    4-5 17.8aA2 17.9aA2 18.3bA23 18.1bA1 19.9bA* 18.6aB
    18.9ab
    5-6 20.2bA2 17.9aB2* 20.2cA1 20.3cA13 20.1bA 19.5aA
    19.7b
    Sentennial 3-4 18.1aA1 18.1aA1
    4-5 18.9bA13 18.5aA1
    5-6 20.8cA2 20.6bA23
    Main effects Significance F-value Degrees of freedom
    Cultivar p < 0.0001 36.90 2
    Colour level p < 0.0001 125.76 2
    Year p < 0.0001 9.26 2
    Time (harvest or storage at 0.5 °C) p = 0.0002 13.68 1
    Colour differences: within common time and cultivar, values followed by different lower case letters indicate significant differences (p ≤ 0.05); Cultivar differences: within common colour level and time, values followed by different numbers indicate significant differences (p ≤ 0.05); Growing year differences: within common time, colour level and cultivar, values followed by * indicate significant differences (p ≤ 0.05); Storage differences (Harvest versus 0.5 °C storage): within common cultivar, colour level and growing year, values followed by different uppercase letter indicate significant differences (p ≤ 0.05); Temperature differences: within Staccato cultivar at 28 d storage and at common colour level, bolded values indicate significant differences (p ≤ 0.05) between storage temperatures (0.5 °C vs 3 °C). (N.B. no bolded values appear in this table).
     | Show Table
    DownLoad: CSV
    Table 2.  Titratable acidity values as affected by cultivar, growing year, storage and colour level at harvest.
    Cultivar Colour level Titratable acidity (TA, g·L−1 malic acid)
    2018 2019 2021
    Harvest Storage (0.5 °C) Harvest Storage (0.5 °C) Harvest Storage (0.5 °C) [3 °C]
    Sweetheart 3-4 8.99aA1* 7.11aB1* 7.31aA1* 6.31aB1*
    4-5 9.55bA1* 7.57bB1* 7.14aA1* 6.13aB1*
    5-6 10.56cA1* 8.57cB1* 7.56aA1* 6.50aB1*
    Staccato 3-4 8.53aA2* 6.65aB2* 6.96aA1* 5.51aB2* 12.0aA* 10.5aB*
    9.7a
    4-5 8.87abA2* 7.04bB2* 7.30aA1* 6.21bB1* 12.8aA* 10.2aB*
    9.3a
    5-6 8.91bA2* 6.91abB2 7.18aA1* 6.46bB1 10.6bA* 9.5b*
    8.5b
    Sentennial 3-4 9.21acA2 7.60aB3
    4-5 9.33aA2 7.89aB2
    5-6 8.79bcA2 7.66aB2
    Main effects Significance F-value Degrees of freedom
    Cultivar p < 0.0001 193.58 2
    Colour level p = 0.0023 5.49 2
    Year p < 0.0001 1,007.20 2
    Time (harvest or storage at 0.5 °C) p < 0.0001 474.18 1
    Colour differences: within common time and cultivar, values followed by different lower case letters indicate significant differences (p ≤ 0.05); Cultivar differences: within common colour level and time, values followed by different numbers indicate significant differences (p ≤ 0.05); Growing year differences: within common time, colour level and cultivar, values followed by * indicate significant differences (p ≤ 0.05); Storage differences (Harvest versus 0.5 °C storage): within common cultivar, colour level and growing year, values followed by different uppercase letter indicate significant differences (p ≤ 0.05); Temperature differences: within Staccato cultivar at 28 d storage and at common colour level, bolded values indicate significant differences (p ≤ 0.05) between storage temperatures (0.5 °C vs 3 °C).
     | Show Table
    DownLoad: CSV
    Table 3.  Soluble solids to titratable acidity ratio values as affected by cultivar, growing year, storage and colour level at harvest.
    Cultivar Colour level Soluble solids to titratable acidity ratio (SS/TA)
    2018 2019 2021
    Harvest Storage (0.5 °C) Harvest Storage (0.5 °C) Harvest Storage (0.5 °C) [3 °C]
    Sweetheart 3-4 2.02a1A* 2.49a1B* 2.49a1A* 2.78a1B*
    4-5 2.09a1A* 2.61a1B* 2.71b1A* 3.06b1B*
    5-6 2.07a1A* 2.46a1B* 2.63b1A* 3.02b1B*
    Staccato 3-4 2.01a1A* 2.58a1B* 2.46a1A* 3.11a2B* 1.57aA* 1.79aB*
    1.89a
    4-5 2.0a1A* 2.54a1B* 2.51a2A* 2.91b1B* 1.55aA* 1.83aB*
    2.04a
    5-6 2.27b2A* 2.58a1B* 2.81b1A* 3.14a1B* 1.89bA* 2.06bB*
    2.32b
    Sentennial 3-4 1.97a2A 2.38a3B
    4-5 2.02a3A 2.34a2B
    5-6 2.37b2A 2.69b2B
    Main effects Significance F-value Degrees of freedom
    Cultivar p < 0.0001 94.79 2
    Colour level p < 0.0001 22.04 2
    Year p < 0.0001 361.13 2
    Time (harvest or storage at 0.5 °C) p < 0.0001 134.15 1
    Colour differences: within common time and cultivar, values followed by different lower case letters indicate significant differences (p ≤ 0.05); Cultivar differences: within common colour level and time, values followed by different numbers indicate significant differences (p ≤ 0.05); Growing year differences: within common time, colour level and cultivar, values followed by * indicate significant differences (p ≤ 0.05); Storage differences (Harvest versus 0.5 °C storage): within common cultivar, colour level and growing year, values followed by different uppercase letter indicate significant differences (p ≤ 0.05); Temperature differences: within Staccato cultivar at 28 d storage and at common colour level, bolded values indicate significant differences (p ≤ 0.05) between storage temperatures (0.5 °C vs 3 °C).
     | Show Table
    DownLoad: CSV
    Table 4.  Dry matter values as affected by cultivar, growing year, storage and colour level at harvest.
    Cultivar Colour level Dry matter (DM, %)
    2018 2019 2021
    Harvest Storage (0.5 °C) Harvest Storage (0.5 °C) Harvest Storage (0.5 °C) [3 °C]
    Sweetheart 3-4 20.9aA1* 20.6aA1* 18.6aA1* 18.6aA1* 22.1aA1*
    4-5 21.9bA1 22.0bA1* 19.9bA1* 19.8acA1* 22.5bA1
    5-6 25.2cA1* 23.5cB1* 21.1cA1* 20.6bcA1* 23.6cA1*
    Staccato 3-4 20.2aA1* 19.5aA2* 18.4aA2* 18.1aA23* 21.0aA2* 20.6aA*
    19.8a
    4-5 20.4aA2* 20.8bA2* 19.1aA1* 18.8aA2* 22.0bA2* 21.6bA*
    21.9b
    5-6 22.4bA2 22.3cA2 22.9bA2* 21.6bA23 23.0cA2 22.2bA
    22.4b
    Sentennial 3-4 18.2aA2 18.4aA13 20.5aA2*
    4-5 19.3bA1 18.8bA2 22.6bA12*
    5-6 22.9cA2 20.9bA13 23.5cA12
    Main effects Significance F-value Degrees of freedom
    Cultivar p < 0.0001 11.36 2
    Colour level p < 0.0001 130.99 2
    Year p < 0.0001 56.64 2
    Time (harvest or storage at 0.5 °C) Not significant, p = 0.0922 2.97 1
    Colour differences: within common time and cultivar, values followed by different lower case letters indicate significant differences (p ≤ 0.05); Cultivar differences: within common colour level and time, values followed by different numbers indicate significant differences (p ≤ 0.05); Growing year differences: within common time, colour level and cultivar, values followed by * indicate significant differences (p ≤ 0.05); Storage differences (Harvest versus 0.5 °C storage): within common cultivar, colour level and growing year, values followed by different uppercase letter indicate significant differences (p ≤ 0.05); Temperature differences: within Staccato cultivar at 28 d storage and at common colour level, bolded values indicate significant differences (p ≤ 0.05) between storage temperatures (0.5 °C vs 3 °C). (N.B. no bolded values appear in this table).
     | Show Table
    DownLoad: CSV

    Data in Table 1 shows the SS levels at each colour level for each sweet cherry cultivar. Overall, SH cherries at harvest had ranges of 18.1%−21.9% over the 2018 and 2019 growing seasons. SC cherries at harvest had levels between 17.1%−20.2% over the three growing years (2018, 2019, and 2021), while SL cherries at harvest had levels of 18.1%−20.8% in 2019. Statistical analysis showed that the main effects of Cultivar (p < 0.0001; F-value = 36.90; degrees of freedom (df) = 2), Colour (p < 0.0001; F-value = 125.76, df = 2), Time (p = 0.0007; F-value = 13.68; df = 1), and Year (p < 0.0001; F-value = 9.26; df = 2) were all significant. Additionally, the interactions of Cultivar * Year (p < 0.0001, F-value = 26.37; df = 1), Colour * Year (p < 0.0069; F-value = 4.19; df = 4), Cultivar * Colour * Year (p < 0.0003; F-value = 10.28; df = 2) and Colour * Time * Year (p < 0.0131; F-value = 3.67; df = 4) were all significant.

    With respect to growing year differences, in 2018, SS levels in SH were greater than those of SC at all colour levels. In 2019, again at the 3-4 colour level SC, cherries exhibited lower SS levels than SH and SL cherries. At the 4-5 colour level, SH cherries again showed higher SS levels compared to SC cherries. At the 5-6 colour level, SL cherries showed higher SS levels compared to SC and SH, while SC and SH cherries showed comparable SS levels at the 5-6 colour level. The SS values of SC cherries at 3-4 and 4-5 colour levels from the 2021 growing year were higher than values observed at the same colour levels in 2018 and 2019 growing year samples. There was no difference observed in SS levels of SC cherries at the 5-6 colour level between growing years. The data shows that colour level, cultivar, and growing year all affected SS levels.

    Within cultivars, for SH in the 2018 growing season, as colour level increased, SS level increased. An increase in SS as colour at harvest increased for SH cultivar was reported by Puniran et al.[27]. In the 2019 growing year for SH cherries and in the 2021 growing year for SC cherries, SS levels plateaued at the 4-5 colour level. For SC (2018 and 2019 growing year) and SL cherries (2019 growing year) as colour level increased, SS level increased. Ross et al.[1] reported this same trend for SC cultivar on data collected from 2015, 2016, and 2017 growing years. This data demonstrates the influence of growing conditions on SS levels.

    In general the SS levels at each colour level for each sweet cherry cultivar did not change over the 28 d storage at 0.5 °C. It should be noted that SC cherries from the 2018 growing year at the 5-6 colour level and SC cherries from the 2021 growing year at the 4-5 colour level did show a significant (p ≤ 0.05) decrease in soluble solids after 28 d of storage at 0.5 °C. SS values for 2018 SC cherries at the 5-6 colour level harvest was 20.2 °Brix, while SS values after 28 day storage at 0.5 °C was 17.9 °Brix. SS values for 2021 SC cherries at the 4-5 colour level harvest was 19.9 °Brix, while SS values after 28 d of storage at 0.5 °C was 18.6 °Brix. In 2021 the effect of storage temperature (0.5 °C vs 3 °C) was investigated. SS levels in the SC cherries at the different colour levels were not affected by the different storage temperatures. This result was consistent with other findings[1,8,14], which suggested that under typical low temperature storage conditions and proper shipping conditions, the change in flavour profiles were likely not due to major changes in SS levels. It is important to note that Alique et al.[8] found that while SS values were consistent, the levels of glucose and fructose decreased by 13% and 10%, respectively, after 4 d under ambient conditions. It may be worth investigating if under a lower temperature environment, the levels of key monosaccharides would remain constant or change.

    This moves the focus of flavour retention to TA values. Table 2 shows the TA levels at each colour level for each sweet cherry cultivar. Statistical analysis showed that the main effects of Cultivar (p < 0.0001; F-value = 193.58; df = 2), Colour (p = 0.0023; F-value = 5.49, df = 2), Time (p < 0.0001; F-value = 474.18; df = 1), and Year (p < 0.0001; F-value = 1007.20; df = 2) were all significant. The interactions of Cultivar * Colour (p < 0.001; F-value = 5.81; df = 4); Cultivar * Year (p < 0.0001; F-value = 19.9; df = 1); Colour * Time (p = 0.0431; F-value = 3.44; df = 2); Colour * Year (p < 0.0001; F-value = 18.01; df = 4); Time * Year (p < 0.0001; F-value = 17.21; df = 2); Cultivar * Colour * Year (p = 0.0009; F-value = 8.63; df = 2); Colour * Time * Year (p = 0.0127; F-value = 3.70; df = 4) were all significant.

    SH cherries at harvest had TA value ranges of 8.99−10.56 g·L−1 in 2018, and 7.31−7.56 g·L−1 in 2019. In 2018, the highest TA value was at the 5-6 colour level for SH cherries, while for the 2019 SH cherries there was no difference between colour levels for the TA values. After storage SH cherries at the various colour levels showed TA levels of 7.11−8.57 g·L−1 and 6.31−6.50 g·L−1 for 2018 and 2019, respectively. Again the stored 2018 SH cherries at the 5-6 colour level showed the highest TA values, while the TA values for the stored 2019 SH cherries were not affected by colour level. SC cherries at harvest showed TA value ranges of 8.53−8.91 g·L−1 in 2018, 6.96−7.18 g·L−1 in 2019, and 10.6−12.8 g·L−1 in 2021. After storage SC cherries had lower TA values at all colour levels for all growing years. In 2018, 2019, and 2021, TA values for SC cherries after storage ranged from 6.65–7.04 g·L−1, 5.51−6.46 g·L−1 and 8.5−10.5 g·L−1, respectively. In 2021, for the SC cherries, the higher storage temperature (3 °C) resulted in a greater loss of TA values for all colour levels compared to the lower temperature of 0.5 °C. SL cherries at harvest had TA levels of 8.79−9.33 g·L−1 in 2019 and after storage at 0.5 C, TA values ranged from 7.60−7.89 g·L−1, with the highest value of TA at the 4-5 colour level. Therefore for all cultivars over all growing years, TA values decreased upon storage, which was expected. The data from Table 2 shows the magnitude of the decrease in TA values after storage varied by growing year. Additionally, trends for differences of TA magnitude change with respect to cultivar and colour level were not obvious. The magnitude of the decrease in TA values between harvest and storage was higher for the SC cherries stored at 3 °C compared to those stored at 0.5 °C.

    Comparing the effect of colour level on TA level within cultivar for SH cherries, TA values increased as colour level at harvest increased in 2018, but the trend did not continue in 2019, possibly due to different growing conditions such as orchard temperature and relative humidity values, which will be further discussed. For SC cherries, TA values peaked at the 4-5 colour level for 2018 and 2021 growing years, but were not significantly different between colour levels in 2019 (p ≤ 0.05). In the 2019 growing year, SL cherries also had the highest TA values at the 4-5 colour level. Comparing the effect of cultivar on TA level within comparable colour level, 2018 harvest SH cherries showed higher TA values than SC cherries. In the 2018 growing year, upon storage and at comparable colour level, SH cherries again showed higher TA values than SC cherries. In the 2019 harvest, SC cherries exhibited the same TA values as SH cherries, while SL cherries had higher TA values than SC and SH. In the 2019 growing year SL cherries harvested at the 3-4 colour level showed greater TA values after storage compared to SH and SC cherries; SC cherries had the lowest TA values at this colour level. When harvested at the 4-5 and 5-6 colour levels, SL cherries had higher TA values upon storage compared to SH and SC cherries.

    The data suggests that different cultivars tend to peak TA values, which may be affected by growing conditions/growing year and maturity level/colour level. This is further supported by the work of Miloševic & Miloševic[28] that indicated TA levels of sour cherries are affected by level of ripeness. Puniran et al.[27] also indicted that finding where peak TA values occur at harvest can help negate the decrease in values that occurs during storage and therefore promote flavour quality retention.

    In 2021 the effect of storage temperature (0.5 °C vs 3 °C) was investigated as 0.5 °C represents ideal storage temperature while 3 °C represents a storage temperature where quality deterioration would be promoted, and may be a more realistic temperature experienced during overseas/export shipping (personal communication, Dr. Peter Toivonen, May, 2021). TA levels in the SC cherries harvested at the different colour levels were affected by the different storage temperature as seen in Table 2. At common colour level, SC cherries from the 2021 growing season stored at 3 °C showed lower TA values than samples stored at 0.5 °C. The SC cherries at the 5-6 colour level stored at 3 °C showed the lowest TA values upon storage. As higher TA values are associated with flavour quality[11,12], the SC cherries harvested at the 5-6 colour level and stored at 3 °C would show poorer flavour quality.

    Table 3 shows the SS/TA ratio values as affected by cultivar, growing year, storage and colour level at harvest. Statistical analysis showed that the main effects of Cultivar (p = 0.0001; F-value = 94.79; df = 2), Colour (p < 0.0001; F-value = 22.04; df = 2), Time (p < 0.0001; F-value = 134.15; df = 1), and Year (p < 0.0001; F-value = 361.13; df = 2) were all significant. The interactions of Cultivar * Colour (p = 0.0009; F-value = 5.91; df = 4) and Time * Year (p = 0.0059; F-value = 5.95; df = 2) were significant. The SS/TA ratio values over all cultivars, colour levels and growing years ranged from 1.55 to 2.81 at harvest and 1.79 to 3.14 after storage at 0.5 °C for 28 d. SC cherries in the 2021 growing year were tested to determine the effect of storage temperature (0.5 or 3 °C) on flavour quality. The SS/TA ratio for the 2021 SC cherries stored at 0.5 °C for 28 d ranged from 1.79 to 2.06 while the SS/TA ratio for the 2021 SC cherries stored at 3 °C for 28 d ranged from 1.89 to 2.32. SS/TA ratios for the 3 °C stored cherries at the 4-5 and 5-6 colour levels were significantly higher (p ≤ 0.05) compared to corresponding SS/TA ratios for the 0.5 °C stored cherries at the 4-5 and 5-6 colour levels. Higher SS/TA ratio are due to lower TA values (data in Table 3) and impact flavour quality and therefore lower storage temperatures are preferable, which was expected.

    Comparing between growing years, for SH and SC cherries, the SS/TA ratio at harvest was higher in the 2019 growing year compared to the 2018 growing year. SC cherries from the 2021 growing year showed the lowest at harvest SS/TA ratio. Within cultivar, the SH cherries from the 2018 growing year showed no difference in harvest SS/TA ratio at the different colour levels. SH cherries from the 2019 growing year showed higher harvest SS/TA ratios at the 4-5 and 5-6 colour levels compared to the 3-4 colour level. The SC cherries at all growing years showed highest harvest SS/TA ratio levels at the 5-6 colour level and comparable harvest SS/TA ratio levels at the 3-4 and 4-5 colour levels. SL cherries also showed the highest harvest SS/TA ratio at the 5-6 colour level and comparable harvest SS/TA ratios at the 3-4 and 4-5 colour levels.

    Comparing cultivars at common colour level, in 2018 growing year SC cherries at the 5-6 colour level showed a higher harvest SS/TA ratio compared to SH cherries at the corresponding colour level. In the 2019 growing year SH and SC cherries showed higher harvest SS/TA ratios at the 3-4 colour level compared to SL cherries. At the 4-5 colour level, SH cherries showed the highest harvest SS/TA ratio value and SL cherries showed the lowest harvest SS/TA ratio value. At the 5-6 colour level, SH and SC cherries showed comparable SS/TA ratios while SL cherries showed the lowest SS/TA ratio.

    Overall, this data indicates that ensuring cherry flavour quality is complex as SS/TA ratio varied by growing year, colour level and cultivar. Comparing SS/TA ratio data for all cultivars over all growing years did not show an observable trend between colour level and SS/TA ratio. As such, colour is not a reliable indicator of flavor quality.

    Table 4 shows the DM values as affected by cultivar, growing year, storage and colour level at harvest. Statistical analysis showed that the main effects of Cultivar (p = 0.0001; F-value = 11.36; df = 2), Colour (p < 0.0001; F-value = 130.99; df = 2), and Year (p < 0.0001; F-value = 56.64; df = 2) were all significant. Notably, the main effect of Time (harvest vs stored) was not significant (p = 0.0922). The interactions of Cultivar * Year (p = 0.001; F-value = 6.45; df = 3); Colour * Year (p = 0.0004; F-value = 6.38; df = 4); Cultivar * Colour * Year (p = 0.0018; F-value = 4.64; df = 5) were all significant. Although SS and TA values were not obtained for all three cultivars in 2021, DM values at harvest were obtained for all three cultivars in 2021. Data in Table 4 show, in general, DM levels did not change over 28-d storage, which was expected. Additionally, data in Table 4 shows that in most cases, at common cultivar and colour level, DM values measured in 2021 were greater than DM values measured in 2018 and 2019 for all cultivars (SH, SC, and SL).

    Within each cultivar, over all growing years, the harvest DM values were significantly different (p < 0.05) at each colour level, except for SC cherries in the 2018 and 2019 growing years. 2018 and 2019 DM values were not significantly different from colour level 3-4 to colour level 4-5. At the 5-6 colour level, over all growing years, SH cherries showed higher DM values compared to dry matter values observed for SC cherries (p < 0.05). At the 3-4 colour level, over all growing seasons, the DM values for SL and SC cherries were not significantly different (p < 0.05). At the 4-5 colour level, over all growing seasons, the DM values for SL were not significantly different than the DM values exhibited by SH and SC cherries (p < 0.05). In 2021 the effect of storage temperature (0.5 °C vs 3 °C) was investigated. DM levels in the SC cherries at the different colour levels were not affected by the different storage temperature. Overall, DM levels ranged from 18.1 to 25.2 depending on cultivar, colour level, growing year, and storage.

    Figure 1ac shows the distribution of the three cherry cultivars relative to DM value ranges over all three growing years via histograms. Cherries at the same colour level did not all have the same DM; this was observed both within and between cultivars (Fig. 1ac). DM data, compiled over all available growing years, for each cultivar in the 3-4, 4-5, and 5-6 colour levels had considerable overlap. However, it is noted there is consistent shift to a higher DM at the 5-6 colour level.

    Figure 1.  Histogram representing distribution of dry matter data for: (a) Sweetheart (SH) cherries over the 2018, 2019, and 2021 growing years; (b) Staccato (SC) cherries over the 2018, 2019, and 2021 growing years; and (c) Sentennial (SL) cherries over the 2019 and 2021 growing years. For all parts, the 3-4 colour level is solid black, the 4-5 level is black stripes, and the 5-6 level is solid grey. On the horizontal axis different dry matter value (DM) ranges are shown via bins and on the vertical axis the frequency or proportion (%) of cherries within the DM bins/ranges are shown. Data was generated from two replicates of samples of 25 cherries (i.e. 50 cherries) from all available growing years.

    Over all growing years, DM values for SH cherries ranged from 14%−27%, 14%−28.5%, and 16.5%−33%, at the 3-4, 4-5, and 5-6 colour levels, respectively (Fig. 1a). SH cherries at the 3-4 and 4-5 colour levels showed the highest proportion (26% and 26%, respectively) of cherries resided in the 22.5 and 22.5% DM bins indicating the highest percentage of SH cherries in these colour levels exhibited a DM of 21% to 22.5%, while the highest proportion (21%) of cherries at the 5-6 colour level resided in the 24% DM bin indicating the highest percentage of SH cherries at this colour level exhibited a DM of 22.5% to 24% (Fig. 1a).

    For SC cherries over all growing years, DM values ranged from 14%−25.5%, 14%−30%, and 16.5%−30%, at the 3-4, 4-5, and 5-6 colour levels, respectively (Fig. 1b). SC cherries at the 3-4 colour level showed the highest proportion of cherries (27%) resided in the 19.5% DM bin which indicated the highest percentage of SC cherries at this colour level exhibited a DM of 18 to 19.5%. SC cherries at the 4-5 colour level showed the highest proportion of cherries (25%) resided in the in the 21% DM bin which indicated the highest percentage of SC cherries at this colour level exhibited a DM of 19.5% to 21 %. At the 5-6 colour level, the highest proportion (35%) of SC cherries resided in the 22.5% DM bin which indicated the highest percentage of SC cherries exhibited a DM of 21%−22.5% (Fig. 1b).

    Over the 2019 and 2021 growing years, SL cherries DM values ranged from 15%−25.5%, 15%−28.5%, and 16.5%−33% at the 3-4, 4-5 and 5-6 colour levels, respectively (Fig. 1c). SL cherries at the 3-4 colour level showed the highest proportion of cherries (36%) resided in the 21% DM bin which indicated the highest percentage of SL cherries at this colour level exhibited a DM of 19.5% to 21%. SL cherries at the 4-5 colour level showed the highest proportion of cherries (28%) resided in the in the 21% DM bin which indicated the highest percentage of SL cherries at this colour level exhibited a DM of 19.5% to 21 %. At the 5-6 colour level, the highest proportion (26%) of SC cherries resided in the 22.5% DM bin which indicated the highest percentage of SL cherries exhibited a DM of 21%−22.5% (Fig. 1c).

    In all, the data in Tables 14 and Fig. 1 indicate that colour is not a reliable indicator of maturity or flavor quality. Cherries of the same colour may differ in DM, SS, TA, and SS/TA ratio due to cultivar and growing conditions. The implication of these results are discussed in subsequent sections.

    Temperature, relative humidity and harvest date for the 2018, 2019, and 2021 growing years are detailed in Table 5. Environmental variations between years impacted colour development, which resulted in yearly variations in our harvest dates as cherry picks were based on cherry colour levels: 2018, July 16 to August 9; 2019, July 18 to August 6; and 2021, July 5 to July 27, nearly two weeks earlier than in previous years (Table 5). In terms of environmental data, the average temperature (AT), average high temperature (AHT), and average low temperature (ALT) values measured in 2021 were greater than the values determined in 2018 and 2019, while the average relative humidity (ARH) values determined in 2021 were lower than the values measured in 2018 and 2019 (Table 5). Depending on growing year and harvest date, average temperature values ranged from 17.17 to 24.28 °C, average high temperature values ranged from 28.59 to 50.68 °C, average low temperatures ranged from 7.17 to 10.68 °C, and average relative humidity values ranged from 40.68% to 66.16% (Table 5).

    Table 5.  Temperature and relative humidity environmental data for 2018, 2019, and 2021 growing years.
    Growing year Colour level Harvest date Average
    temperature
    (AT) (°C)
    Average relative humidity (ARH) Average low temperature (ALT) (°C) Average high temperature (AHT) (°C)
    2018 Sweetheart 3-4 July 16 18.96 61.5% 7.17 32.14
    4-5 July 23 18.85 59.8% 7.17 32.13
    5-6 July 30 20.45 56.85% 7.49 32.05
    Staccato 3-4 July 30 19.74 59.17% 7.42 32.04
    4-5 August 9 21.14 54.46% 7.42 32.77
    5-6 August 9 21.14 54.49% 7.42 32.77
    2018 overall average 20.05 57.71% 7.35 32.32
    2019 Sweetheart 3-4 July 18 17.86 66.04% 7.22 28.79
    4-5 July 24 18.39 66.1% 7.22 28.59
    5-6 July 24 18.39 66.1% 7.22 28.59
    Staccato 3-4 July 22 18.03 66.16% 7.22 28.59
    4-5 July 29 19.19 62.92% 8.67 29.39
    5-6 July 31 19.19 62.92% 8.67 29.39
    Sentennial 3-4 July 22 18.03 66.16% 7.22 28.59
    4-5 July 29 18.99 63.77% 8.67 29.39
    5-6 August 6 19.79 59.94% 8.67 29.39
    2019 overall average 18.87 63.65% 8.19 28.96
    2021 Sweetheart 3-4 July 5 24.01 40.68% 8.51 50.68
    4-5 July 12 24.28 40.68% 10.68 49.23
    5-6 July 20 24.10 40.68% 9.66 47.47
    Staccato 3-4 July 13 24.01 40.68% 8.51 50.68
    4-5 July 21 24.28 40.68% 10.68 49.23
    5-6 July 27 24.10 40.68% 9.66 47.47
    Sentennial 3-4 July 12 24.01 40.68% 8.51 50.68
    4-5 July 19 24.28 40.68% 10.68 49.23
    5-6 July 26 24.10 40.68% 9.66 47.47
    2021 overall average 24.12 40.68% 9.62 49.13
     | Show Table
    DownLoad: CSV

    Principal component analysis (PCA) was performed on all cultivars over all growing seasons to best resolve cultivar specific relationships between variables affecting flavour quality parameters: colour, DM, SS and TA (Fig. 2).

    Figure 2.  Principal component analysis (PCA) plot for: Sweetheart (SH) cherries with data from 2018 and 2019 growing years at the 3-4, 4-5, and 5-6 colours levels (SH34-2018, SH45-2018, SH56-2018, SH34-2019, SH45-2019, and SH56-2019; Staccato (SC) cherries with data from 2018, 2019 and 2021 growing years at the 3-4, 4-5, and 5-6 colour levels (SC34-2018, SC45-2018, SC56-2018, SC34-2019, SC45-2019, SC56-2019, SC34-2021, SC45-2021, and SC56-2021); and Sentennial (SL) cherries with data from 2019 growing year (SL34-2019, SL45-2019, and SL56-2019). PC1 and PC2 accounted for 84.75% variation. The variables include: average temperature (AT), average high temperature (AHT), average low temperature (ALT), average relative humidity (ARH), colour at harvest (ColourH), SS at harvest (SSH), SS after 28 d of storage at 0.5 °C (SS05), titratable acidity at harvest (TAH), titratable acidity after 28 d of storage at 0.5 °C (TA05) and dry matter of cherry fruit at harvest (DMH). Orchard growing factors, flavour quality attributes (loading factors), along with sweet cherry cultivars from each growing season (component scores) were presented as lines with arrows, lines with circles, and squares, respectively. Variables close to each other with small angles between them are strongly positively correlated; variables at right angles are likely not correlated; variables at large angles (close to 180°) are strongly negatively correlated.

    Figure 2 shows that principal components 1 and 2 described most of the variation (84.75%) in the model. SS at harvest (SSH) and SS at 28-d storage at 0.5 °C (SS05) along with DM at harvest (DMH) were positively correlated with colour at harvest (ColourH). TA at harvest (TAH) and TA at 28-d storage at 0.5 °C (TA05) were positively correlated with average high temperature (ATH). AHT, average low temperature (ALT) and average temperature (AT). DMH was more strongly correlated with TAH and TA05 compared to ColourH. TAH and TA05 were positively correlated, yet negatively correlated with average relative humidity (ARH). The 2021 SC samples at the 3-4, 4-5, and 5-6 colour levels (SC34-2021, SC45-2021, and SC56-2021) were clustered with TAH, TA05, ALT, AHT, and AT variables and located in a quadrant opposite of ARH. In late June 2021 a heatwave of unprecedented magnitude impacted the Pacific Northwest region of Canada and the United States; the Canadian national temperature record was broken with a new record temperature of 49.6 °C[29]. Also, the relative humidity levels during this period were also extremely low[30]. As the location of this study was impacted by this heatwave, the data shown in Table 6 shows higher temperatures and lower relative humidity values for the 2021 growing year. The TA values measured in the 2021 growing year were nearly two times the levels measured in the 2018 and 2019 growing years (Table 2). This shows an impact of growing conditions on flavor quality; both the negative correlation between ARH and TA and positive correlations of AT, AHT, and ALT with TA are notable. However, it is noted that correlation does not mean causation. The SH and SC cultivars from the 2018 growing year at the 5-6 colour level were clustered together, and were located in the same quadrant as ColourH, SSH, SS05, and DMH variables (Fig. 2). This indicates these samples were characterized by high values of SSH, SS05, and DMH. All cultivars at the 3-4 colour level from the 2018 (SH and SC), and 2019 (SH, SC, and SL) growing years along with all cultivars at the 4-5 colour level from the 2019 (SH, SC, and SL) growing year were clustered in quadrants opposite of the SSH, SS05, DMH, ColourH, TAH, and TA05 variables while near the ARH variable. The clustering of the samples indicates similarity and lower levels of SSH, SS05, DMH, TAH, and TA05.

    Table 6.  Average colour level and respiration rate of sweet cherries at harvest.
    Growing year Colour
    level
    Average colour measured at harvest
    [average dry matter at harvest]
    Dry matter bin (%), highest
    proportions of cherries
    Respiration rate (mg CO2 kg−1·h−1)
    assessed at 0.5, 5 or 10 °C
    0.5 °C 5 °C 10 °C
    2018 Sweetheart 3-4 3.74a1 [20.9%] 21, 38% 2.87a1 * 5.99a1* 9.75a1*
    4-5 4.66b1 [21.9%] 22.5, 38% 3.57b1* 5.53b1* 9.06a1*
    5-6 5.54c1 [25.2%] 25.5, 26% 3.50b1* 5.18b1* 9.58a1*
    Staccato 3-4 3.58a1 [20.2%] 19.5, 44% 4.43a2* 7.08a2* 9.90a1*
    4-5 4.62b1 [20.4%] 21, 36% 4.58a2* 8.05b2* 11.22b2*
    5-6 5.64c1 [22.4%] 22.5, 50% 4.12b2* 6.43c2* 9.78a1*
    2019 Sweetheart 3-4 3.76a1 [18.6%] 18, 26%; 19.5, 26% Nd 6.04 13.7
    4-5 4.42b1 [19.9%] 21, 32% Nd Nd 8.3
    5-6 5.42c1 [21.1%] 22.5, 28% Nd 6.95 13.5
    Staccato 3-4 3.46a1 [18.4%] 19.5, 32% Nd 5.8 12.47
    4-5 4.40b12 [19.1%] 19.5, 40% Nd 6.14 Nd
    5-6 5.40c1 [22.9%] 22.5, 26% Nd Nd Nd
    Sentennial 3-4 3.62a1 [18.2%] 18, 28% Nd 6.5 12.80
    4-5 4.22b2 [19.3%] 21, 40% Nd 3.76 Nd
    5-6 5.20c2 [22.9%] 22.5, 24% Nd Nd Nd
    2021 Sweetheart 3-4 Nd [22.1%] 22.5, 40% 3.18a1* 5.86a1* 8.8a1*
    4-5 Nd [22.5%] 22.5, 28% 2.78a1* 5.08b1* 8.1a1*
    5-6 Nd [23.6%] 24, 30% 2.65a1* 4.32c1* 9.19a1*
    Staccato 3-4 3.50a1 [21.0%] 19.5, 28% 2.72a1 4.65ab2 10.94a2*
    4-5 4.80b1 [22.0%] 21, 24%; 22.5, 20% 3.27a1* 4.38a2* 8.22b1*
    5-6 5.60c1 [23.0%] 24, 30% 3.05a1* 5.07b2* 9.57ab1*
    Sentennial 3-4 Nd [20.5%] 21, 48% 2.71a1* 4.77a2* 7.84a1*
    4-5 Nd [22.6%] 22.5, 28%; 24, 24% 2.78a1* 4.81a12* 8.28ab1*
    5-6 Nd [23.5%] 22.5, 28%; 24, 24% 4.23b2 4.47a12 9.88b1*
    Within common cultivar and growing year, values followed by different letters indicate significant differences (p ≤ 0.05)-shows colour differences; Within common colour level and growing year, values followed by different numbers indicate significant differences (p ≤ 0.05)-shows cultivar differences; Within common cultivar, growing year and colour level, values followed by * indicate significant differences (p ≤ 0.05)-shows respiration rate differences at the different temperatures. Due to incomplete data, statistical analysis was not performed on 2019 data. Nd = Actual colour was not calculated for Sweetheart and Sentennial cherries in 2021 although cherries were collected 3-4, 4-5, 5-6 colour levels as in previous years and can be considered to have colour levels of approximately 3.5, 4.5, and 5.5, respectively.
     | Show Table
    DownLoad: CSV

    High respiration rates have long been associated with rapid fruit quality deterioration[11]. Lower respiration rates help to maintain higher TA levels, thereby retaining flavour quality[11,12]. This work aimed to provide information on assessing whether rapid and non-invasive dry matter measurements can serve as a surrogate for respiration rate measurements and/or TA measurements to predict fruit quality as this information is essential for developing recommendations to optimize cherry quality retention upon long distance transport. Although it is well known that quality deteriorates more quickly in fruit with higher respiration rates, the respiration rate data for the SH, SC, and SL cherries was collected and analyzed with respect to the different colour levels and corresponding DM values to investigate a link between respiration rate and DM value. Examining the data with this perspective is very novel and additionally very little information on respiration rates is available for SC and SL sweet cherries cultivars in the literature.

    Table 6 shows the respiration rates for a) SH and b) SC cherries at different colour levels for the 2018 growing year and how they were affected by respiration rate assessment temperature (0.5, 5, and 10 °C). Table 6 also shows the respiration rates for a) SH, b) SC, and c) SL cherries at different colour levels for the 2021 growing year and how they are affected by respiration rate assessment temperature. Please note respiration data is incomplete for the 2019 growing year because of data constraints due to equipment difficulties and therefore no statistical analysis was performed on the available 2019 respiration data. As little information exists in the literature for SC and SL cherries, we have included the incomplete respiration data. Table 6 also shows average color data and average DM data for the cherries collected at the different colour levels. Additionally, Table 6 shows data on the DM (%) bins containing the highest proportion of cherries for each cultivar in each growing year at each colour level (histograms for each cultivar for individual growing year not shown).

    Table 6 shows the average colour measured for the cherries harvested at the 3-4, 4-5, and 5-6 colour levels all varied slightly depending on growing year and cultivar. In both the 2018 and 2019 growing years there was no difference in color levels between SH and SC at harvest. In the 2019 growing year, the SL cherries showed lower average colour values at the 4-5 and 5-6 colour levels compared to the average colour levels of SH and SC cherries at the same level. Nevertheless, results indicated the cherries were harvested and sorted to the desired colour levels. In 2021, average colour was not calculated for SH and SL cherries, although cherries were collected at the 3-4, 4-5, and 5-6 colour levels, as in previous years, and can be considered to have been within range. The average colour level was calculated for SC cherries in 2021, as SC cultivar received comprehensive study over all growing years (2018, 2019 and 2021). The calculated colour level values for SC cherries in the 2021 growing year at the 3-4, 4-5, and 5-6 colour levels were 3.5, 4.8, and 5.6, respectively.

    Table 6 shows the lower the respiration rate assessment temperature, the lower the respiration rate, which was expected as cherries are recommended to be stored at 0.5 °C to ensure quality retention due to this fact[1]. In 2018, SH respiration rate values were consistently lower than SC cherries at 0.5 and 5 °C. However, at 10 °C the respiration rate values become comparable between cultivars (Table 6). Comparing between colour level, SH at colour level 3-4 showed the lowest respiration rate at 0.5 °C but had the highest respiration rate when assessed at 5 °C (Table 6). While SC 5-6 cherries at the 5 °C respiration rate assessment temperature showed a significantly lower respiration rate compared to respiration rates measured for SC 3-4 and SC 4-5 cherries at 5 °C (Table 6).

    In 2021, SH and SC respiration rates were more comparable at 0.5 and 10 °C, but at 5 °C, SH respiration rates were higher than SC at the 3-4 and 4-5 colour levels while SC cherries showed a higher respiration rate when assessed at 5 °C compared to the SH cherries at the 5-6 colour level (Table 6). SH respiration rates in 2021 were consistent at 0.5 and 10 °C for all colour levels (Table 6). However, at 5 °C SH cherries at the 5-6 colour level had the lowest respiration rate for all three of the colour levels and the SH cherries at the 3-4 colour level showed the highest respiration rate. This occurred in both 2018 and 2021 (Table 6). The respiration rates of SC cherries were not affected by colour level when assessed at 0.5 °C, but at the 5 °C respiration rate assessment temperature, 2018 SC cherries at 5-6 colour level had lower respiration values (Table 6), while 2021 SC cherries at the 4-5 colour level showed a lower respiration rate value (Table 6). Comparing colour levels, SL cherries at the 5-6 colour level had the highest respiration rates at 0.5 and 10 °C (Table 6). However, at 5 °C, all SL colour levels had comparable respiration values (Table 6). Further, in 2021, all cultivars at 0.5 °C assessment temperature showed respiration rates that were comparable between all colour levels except for SL 5-6. This respiration rate value was significantly higher than the respiration rates measured for the SL 3-4 and 4-5 colour levels and was also higher than the respiration rates determined for SH and SC at the 5-6 colour level. Interestingly, the respiration rate assessed at 0.5 °C for SL at the 5-6 colour level was not significantly different than the respiration rate assessed at 5 °C for SL at the 5-6 colour level (Table 6).

    To further discuss the results presented above, a main source of decreasing TA values in cherries is high respiratory activity[11]. Therefore, linking flavour quality, which is affected by TA levels, to differences in respiration rates is reasonable. Higher respiration rate assessment temperatures were related to higher respiration rates of cherries as seen in Table 6, which was not unexpected and again points to the importance of keeping temperature near 0.5 °C during storage. Additionally, the temperature cherries experience during a growing season affects the respiration rate of the harvested fruit, as Ross et al.[1] found the average temperature and the average high temperature measured in an orchard was positively correlated with the cherry respiration rate at both 5 and 10 °C. Therefore, understanding factors that impact respiration rate, and ensuring cherries are harvested under conditions that ensure a low respiration rate is of significant importance. Table 6 (2021 data) suggests the colour level with the lowest respiration rates for SC cherries is 4-5, which is supported by previous work[1]. While Table 6 (2018 data) suggests the 5-6 colour level gives the lowest respiration rates for SC cherries. When this information is combined with the TA value data, the peak TA values for SC cherries occurs at the 4-5 level and 5-6 colour levels. SH cherries showed that for respiration rate assessed at 0.5 °C, the colour level with the consistently lowest respiration rate was 3-4, but at the 5 °C respiration rate assessment temperature, which is a more abusive temperature, the 5-6 colour level showed the lowest respiration rate in both 2018 and 2021. The highest TA values were seen at the 5-6 colour level for SH cherries. SL cherries show highest TA values at the 3-4 and 4-5 colour level in the 2019 growing year, but insufficient respiration rate data is available in 2019 to comment further. However, the data in Tables 14 indicate that colour is not a reliable indicator of maturity and/or flavor quality. Cherries of the same colour may differ in DM, SS and TA due to cultivar and growing conditions. Figure 1 shows that not all cherries at the same colour level are at the same DM both within and between cultivars. There is a range of DM values for each cultivar in the 3-4, 4-5, and 5-6 colour ranges. However, it is noted the distribution of DM shifted to the right (higher levels) in the 5-6 colour cherries. The work of Palmer et al.[25] and Toivonen et al.[6] have indicated the importance of DM as a fruit quality metric. The implications of colour, DM, and respiration rate results on flavour quality and DM standards are discussed below.

    Associations between colour and DM at harvest with sweet cherry flavour quality attributes and respiration rates were statistically examined using Pearson's correlation coefficient from all available data over all growing years to investigate whether there may be colour/DM levels that are associated with lower respiration rates (Table 7) and could be indicative of when harvest should be performed (i.e. maturity). It was found that colour at harvest was positively correlated with SS at harvest and SS after storage (r = 0.845, p ≤ 0.0005, and r = 0.684, p ≤ 0.005, respectively). Colour at harvest was also positively correlated with DM at harvest (r = 0.768, p ≤ 0.0005). This was expected as darker cherries of a certain cultivar are generally more developed or mature; sugar content (main contributor to DM) and TA increases upon fruit development[1,6,22]. Neither colour or DM at harvest were correlated with SS/TA ratio at harvest or after storage (Table 7). Over all cultivars, no correlation was seen between respiration rate at any assessment temperature and colour level (Table 7). No significant correlations were found between respiration rate assessed at 0.5 and 10 °C and DM (Table 7). A significant negative correlation (r = −0.514, p ≤ 0.025) was found between respiration rate at 5 °C and DM. It was speculated that a correlation between respiration rate and DM was not observed when assessed at 0.5 °C, as this temperature is very low and effectively slows metabolic activity regardless of physiological status of the cherry. No observed correlation between respiration rate assessed at 10 °C and DM was speculated to be due to 10 °C being such an abusive temperature that even physiologically healthy cherries show elevated respiration rates when stored at 10 °C, and likely experienced increased flavour quality deterioration, which could be tested by measuring SS and TA values. Over all cultivars at 5 °C, cherries with lower DM tended to have higher respiration rates, and may be susceptible to more rapid quality deterioration at non-ideal temperatures such as 3−5 °C, which can be encountered in the cherry industry, particularly during export shipping (personal communication, Dr. Peter Toivonen, May, 2021). This points to the importance of good temperature control during storage and diverting lower DM cherries to the domestic and/or rapid consumption market vs export market. Colour was not correlated with TA, while DM at harvest was positively correlated with TA at harvest and upon storage (Table 7), which is relevant for flavour quality. These results indicate that DM has a greater influence on flavour quality attributes than cherry colour.

    Table 7.  Correlations between colour and dry matter at harvest with sweet cherry flavour quality attributes and respiration rate.
    Relationship assessed for Sweetheart*,
    Staccato, and Sentennial**
    cultivars over 2018, 2019,
    and 2021 growing seasons
    Pearson's
    correlation
    coefficient
    Significance
    level
    (p value)
    Colour correlated with
    Soluble solids at harvest r = +0.845 p ≤ 0.0005
    Soluble solids at 28-d storage r = +0.684 p ≤ 0.005
    Dry matter at harvest r = +0.768 p ≤ 0.0005
    Dry matter correlated with
    Soluble solids at harvest r = +0.871 p ≤ 0.0005
    Soluble solids at 28-d storage r = +0.776 p ≤ 0.0005
    Colour at harvest r = +0.769 p ≤ 0.0005
    Titratable acidity at harvest r = +0.439 p ≤ 0.05
    Titratable acidity at 28 d storage r = +0.398 p ≤ 0.10
    Respiration rate at 5 °C r = −0.514 p ≤ 0.025
    Insignificant correlations
    Colour and titratable acidity at harvest r = +0.099 p = 0.696
    Colour and titratable acidity at 28 d storage r = +0.100 p = 0.692
    Colour and soluble solids to titratable
    acidity ratio at harvest
    r = +0.218 p = 0.383
    Colour and soluble solids to titratable
    acidity ratio at 28 d storage
    r = +0.073 p = 0.774
    Colour and respiration rate at 0.5 °C r = +0.252 p = 0.364
    Colour and respiration rate at 5 °C r = −0.206 p = 0.462
    Colour and respiration rate at 10 °C r = +0.084 p = 0.766
    Dry matter and soluble solids to titratable
    acidity ratio at harvest
    r = −0.135 p = 0.595
    Dry matter and soluble solids to titratable
    acidity ratio at 28 d storage
    r = −0.227 p = 0.365
    Dry matter and respiration rate at 0.5 °C r =−0.125 p = 0.657
    Dry matter and respiration rate at 10 °C r = −0.181 p = 0.519
    *Only 2018 and 2019 growing season data available; **only 2019 growing season data available.
     | Show Table
    DownLoad: CSV

    Further, specific cultivar respiration rate and DM relationships were also examined (data not shown). For SH cherries, a negative correlation was determined between respiration rate assessed at 5 °C and DM (p ≤ 0.1), yet this correlation was not seen for SL cherries. Based on statistical parameters SC cherries only showed a negative correlation between respiration rate assessed at 5 °C and DM if a higher p value > 0.1 was used which signifies evidence is not strong enough to suggest a relationship exists. Nevertheless, the statistically significant negative correlation between respiration rate assessed at 5 °C and DM over all cultivars was identified (Table 7).

    Although colour was positively correlated with DM (Table 7), a higher colour may not necessarily indicate a low respiration rate as no significant correlation was observed between colour and respiration rate at any assessment temperature when examined over all cultivars over the growing years tested. Although this highlights the importance of DM in overall quality rather than colour, the data presented thus far suggests certain cultivars achieve different optimal DM values or ranges at maturity that are related to quality retention. In general, higher DM is positive, but is there an upper limit/threshold in terms of higher respiration rate. The lack of correlation between respiration rate assessed at 5 °C and DM for SC and SL cherries seems to indicate a lower optimal DM level for these cultivars compared to SH cherries, as a negative correlation between respiration rate assessed at 5 °C and DM was observed for SH cherries. Again, non-ideal temperatures such as 3−5 °C, can be encountered in the cherry industry, particularly during export shipping, which makes these results extremely relevant to help ensure cherry growers deliver high quality fruit for the export market.

    In 2018, the respiration rate at 5 °C was lowest at the 4-5 and 5-6 colour levels for SH cherries, and the average DM values were ~22% and 25%, respectively. Information from Table 6 shows that 38% of SH fruit were in the 22.5% DM bin indicating the highest percentage of SH cherries at the 4-5 colour level had a DM of 21% to 22.5% while 26% of SH cherries at the 5-6 colour level resided in the 25.5% DM bin indicating the highest percentage of cherries at this colour level had a DM of 24% to 25.5%. For SH cherries in 2021, the lowest respiration rate at 5 °C was at the 5-6 colour level and average DM value was ~23.6%. Information from Table 6 shows that 30% of SH at the 5-6 colour level resided in 24% DM bin indicating the highest percentage of SH cherries at this colour level had a dry mater of 22.5% to 24%. For 2018 SH cherries, titratable acidity, which is important for flavour quality, was highest at the 5-6 colour level where respiration rate assessed at 5 °C was lower. These results imply, that at maturity, cherries tend to a certain DM value or range that corresponds to reduced respiratory activity and promotes quality retention, and would therefore be considered optimal. Based on this data (lower respiration rate (2018 and 2021) and peak TA (2018)), an optimal DM range for SH may be between 22.5%−25% DM or around 23% DM. This optimal DM corresponded to cherries in the 4-5 colour level (21.9%) in 2018, and in the 5-6 colour level (25.2%, 23.6% respectively) in 2018 and 2021.

    2018 respiration rate (assessed at 5 °C) was lowest at the 5-6 colour level for SC cherries and the average DM value was ~22%, respectively. Information from Table 6 shows that 50% of SC cherries resided in the 22.5% DM bin indicating the highest percentage of SC cherries at the 5-6 colour level had a DM of 21% to 22.5% The 2021 respiration rate (assessed at 5 °C) was lowest for SC cherries at the 4-5 colour level and average DM value was ~22% while the highest respiration rate was measured at the 5-6 colour level and the average DM value was ~23.0%. Information from Table 6 shows that 24% and 20% of SC cherries resided in each the 21% and 22.5% DM bins, respectively, indicating the highest percentage of SC cherries at the 4-5 colour level had a DM of 19.5% to 22.5%. For 2021 SC cherries, TA was higher at the 4-5 colour levels, where respiration rate assessed at 5 °C was lowest. Again, these results imply that at maturity cherries tends to a certain DM value or range (optimal) that corresponds to reduced respiratory activity and promotes quality retention. Based on this data (lower respiration rate (2018 and 2021) and peak TA (2018 and 2021)) an optimal DM range for SC may be between 19.5%−22.5% DM or around 22% DM. This optimal DM corresponded to cherries in the 4-5 colour level (22.0%) in 2021, and in the 5-6 colour level (22.4%) in 2018. The data also shows the optimal DM range for SH cherries is higher than the optimal DM range for SC cherries.

    In 2021, for the SL cherries, all colour levels showed the same respiration rate (assessed at 5 °C) and average DM values were 20.5%, 22.6% and 23.5% for the 3-4, 4-5 and 5-6 colour levels, respectively. Information from Table 6 shows that SL cherries at both the 4-5 and 5-6 colour levels, 28% and 24% of the cherries resided in the 22.5% and 24% DM bins indicting the highest percentage of cherries at these colour stages ranged from 21% to 24% DM. For SL, based on the one year of respiration data (2021), determining optimum DM was not as clear. At lower storage temperature (0.5 °C), lower average DM (20.5%−22.6% vs 23.5%) maintained lower respiration rates, but at higher storage temperature (5 and 10 °C) respiration rate did not appear to be affected by DM level. These lower DM values occurred at the 3-4 and 4-5 colour levels.

    Available DM, TA and respiration rate data as discussed suggests the optimal DM range for SH may be between 22.5%−25% DM or around 23% and an optimal dry matter range for SC may be between 19.5%−22.5% DM or around 22% DM, The histogram data over all growing years does further strengthen the justification for suggesting different optimal DM values for different cultivars (Fig. 1). The data over all growing years shows higher proportions of cherries in the 24 % DM bin for SH cherries at the 5-6 colour level which indicated highest proportion of cherries with a DM of 22.5% to 24%. The SC cherries at the 5-6 colour level showed the highest proportion of cherries in the 22.5% DM bin, which indicates the highest percentage of cherries have a DM of 21% to 22.5%; again these DM ranges have been suggested as optimal DM values based on previously discussed respiration data.

    In psychology self-actualization is a concept regarding the process by which an individual reaches their full potential[31]. The data suggests that sweet cherries self-actualize, with the majority of cherries reaching maturity with a DM range that promotes quality retention during storage when growing conditions are favourable. This optimal DM range is different for different cultivars, and growing conditions would be expected to influence the rate and/or ability of this 'self-actualization', as this work and our previous research has shown that environmental factors are correlated with these important quality characteristics[1]. Placing highest importance on distribution of DM levels at the 5-6 colour levels (Fig. 1) is justified as the cherries are the most physiologically mature and will likely exhibit the highest proportion of cherries with optimal DM; however, the optimal DM can occur at other colour ranges and should be used as the primary indicator of maturity. Maturity at harvest is the most important factor that determines storage-life and final fruit quality assweet cherries produce very small quantities of ethylene and do not respond to ethylene treatment; they need to be picked when fully ripe to ensure good flavour quality[32]. It is noted the CTFIL colour standard series goes up to colour level 7, yet a balance needs to be reached between flavour quality optimization vs other quality parameters such as firmness and stem pull force. Supplementary Tables S1S6 provide values of the quality parameters of firmness, stem pull force, stem shrivel, stem browning, pebbling and pitting levels at harvest and after storage for the SH, SC and SL cherries. All of these cherry cultivars exhibited good quality attributes at the 5-6 colour level, as well as lighter colour ranges.

    It is noted that the development of DM standards for different cultivars is a novel concept. This work was positioned as field work that collected cherry data for three cultivars over three growing years in adjacent orchards using the same management practices. Equipment constraints limited respiration rate data collection. As such absolute optimal DM values and/or ranges could not be determined nor was the goal of this study. The goal of this work was to further the concept that different cultivars may reach maturity at different DM levels, which would result in lower respiration rates and higher TA levels at harvest, and after storage, achieving enhanced quality retention. In this regard, absolute optimal DM would be the DM achievable by a cherry cultivar that maximizes flavour attributes and minimizes respiration under ideal conditions. In reality, the absolute optimal DM may or may not be reached during a growing season depending on environmental conditions and orchard management practices; however, cherry cultivars will reach a DM that will be optimal for the growing conditions at harvest maturity, as the present research demonstrates. Developing definitive DM standards to determine optimal harvest points for different cultivars under different environmental conditions should be a direction of research to be further pursued to ensure cherry quality, particularly for cherries subjected to longer term storage and/or cherries destined for the overseas export market.

    The present work is not the first to point to the importance of DM and cherry flavour retention, as an anecdotal report[33] indicated that SH cherries should be harvested at a DM of no higher than 20% or the fruit will lose both sugar and acidity more rapidly during shipping storage. Although this DM value is lower than the DM recommended for SH in the current work, it indicates the importance of DM level and flavour quality in relation to a specific cultivar. The differences between optimal DM for flavour retention in our work and the anecdotal report signifies the complexity of determining DM standards and the impact of growing year/environmental conditions and orchard management practices on optimal DM. Growers will continue to face these complex issues but the present work provides valuable information to growers regarding DM standards for three cultivars.

    It must be noted again that development of absolute DM standards for different cherry cultivars requires more study under rigorous controlled environmental conditions. Additionally, given the impact of environmental conditions on optimal DM, cultivars of interest must be studied over many growing years and orchard conditions to collect a robust data set. Nevertheless, the present research indicates that SH, SC, and SL cultivars have different dry matter values at maturity. The data also shows the DM range for SH cherries at maturity is higher than the DM range for SC cherries at maturity and that for SL, lower DM levels maintained lower respiration rates at lower temperatures, potentially improving ability to maintain quality after harvest.

    Overall, this research showed that DM was a better indicator of flavour quality than colour, as DM was related to both sugars and TA, while colour was only related to sugar. Therefore, this work identified that colour may not be a reliable indicator of maturity and/or flavor quality. This work indicated that cherries of the same colour may differ in DM, SS, and TA due to cultivar type and growing conditions as influenced by growing year. Relative humidity encountered by cherries during the growing season was negatively correlated with TA and higher growing temperatures were positively correlated with TA. This work discovered that sweet cherries may self-actualize, in that when growing conditions are favourable, DM levels may tend towards a certain level at maturity (optimal DM) resulting in superior flavour quality attributes and lower respiration, allowing cherries to reach their full quality potential and ensure quality retention in storage. Therefore, optimal DM can be reached at maturity despite colour. Remaining challenges include development of DM standards for various sweet cherry cultivars and further understanding the impact of growing conditions to better allow for self-actualization and prediction of the optimal DM under those conditions to optimize timing of harvest from year-to-year. Nevertheless, this research based on field work for three sweet cherry cultivars over three growing years, indicated an optimal DM range for SH between 22.5%−25% DM and an optimal DM range for SC between 19.5%−22.5% DM. Interestingly, under the same field conditions, the optimal DM range for SH cherries was higher than the optimal DM range for SC cherries. More analysis is required for determining optimal DM for SL, but the initial data indicates DM in the range of 20.5% to 22.6% maintained lower respiration rates at lower temperature potentially improving ability to maintain quality after harvest.

    The authors confirm contribution to the paper as follows: study conception and design: Ross KA, DeLury NC, Fukumoto L; data collection: Ross KA, DeLury NC, Fukumoto L; analysis and interpretation of results: Ross KA, DeLury NC, Fukumoto L; draft manuscript preparation: Ross KA, DeLury N, Fukumoto L, Forsyth JA. All authors reviewed the results and approved the final version of the manuscript.

    The datasets generated during and/or analysed during the current study are available from the corresponding author on reasonable request.

    We are grateful to the BC Cherry Association for financial support of this research project. We acknowledge Manon Gentes, Gillian Beaudry, and Duncan Robinson for their technical assistance. We are grateful to Brenda Lannard for providing her expertise on using the Felix F750 handheld spectrometer (Felix Instruments, Inc.) to obtain dry matter values and obtaining respiration data. Kelly A. Ross would like to thank and acknowledge Dr. Peter Toivonen for his mentorship, valuable scientific discussions and consistently kind support.

  • The authors declare that they have no conflict of interest.

  • [1]

    Nie J, Wang Y, He H, Guo C, Zhu W, et al. 2015. Loss-of-function mutations in CsMLO1 confer durable powdery mildew resistance in cucumber (Cucumis Sativus L.). Frontiers in Plant Science 6:1155

    doi: 10.3389/fpls.2015.01155

    CrossRef   Google Scholar

    [2]

    Zhang P, Zhu Y, Wang L, Chen L, Zhou S, et al. 2015. Mining candidate genes associated with powdery mildew resistance in cucumber via super-BSA by specific length amplified fragment (SLAF) sequencing. BMC Genomics 16:1058

    doi: 10.1186/s12864-015-2041-z

    CrossRef   Google Scholar

    [3]

    Khan MR, Rizvi TF. 2020. Effect of elevated levels of CO2 on powdery mildew development in five cucurbit species. Scientific Reports 10:4986

    doi: 10.1038/s41598-020-61790-w

    CrossRef   Google Scholar

    [4]

    Nie J, Pan J, He H, Si L, Cai R, et al. 2011. SSR Inheritance Analysis and Screening for Linked Marker of Powdery. China Vgetables 10:45−49

    Google Scholar

    [5]

    Han H, Xie B. 2012. Status and prospects of powdery mildew resistance breeding in cucurbits. China Cucurbits and Vegetables 25:43−48

    doi: 10.3969/j.issn.1673-2871.2012.04.014

    CrossRef   Google Scholar

    [6]

    Xu Q, Shi Y, Yu T, Xu X, Yan Y, et al. 2016. Whole-genome resequencing of a cucumber chromosome segment substitution line and its recurrent parent to identify candidate genes governing powdery mildew resistance. PLoS One 11(10):e0164469

    doi: 10.1371/journal.pone.0164469

    CrossRef   Google Scholar

    [7]

    Zhang C, Badri Anarjan M, Win KT, Begum S, Lee S. 2021. QTL-seq analysis of powdery mildew resistance in a Korean cucumber inbred line. Theoretical and Applied Genetics 134:435−51

    doi: 10.1007/s00122-020-03705-x

    CrossRef   Google Scholar

    [8]

    Ma M, Yang L, Hu Z, Mo C, Geng S, et al. 2024. Multiplex gene editing reveals cucumber MILDEW RESISTANCE LOCUS O family roles in powdery mildew resistance. Plant Physiology 195:1069−88

    doi: 10.1093/plphys/kiae047

    CrossRef   Google Scholar

    [9]

    Jia Z, Liu F, Mu W, Wei G, Liu Y. 2006. Study on the inoculation and fungicide sensitivity assay method of Sphaerotheca fuliginea on cucumber. Journal of Plant Protection 33:99−103

    doi: 10.3321/j.issn:0577-7518.2006.01.020

    CrossRef   Google Scholar

    [10]

    Wang P, Zhang H, Jin H, Ding X, Yu J, et al. 2016. Effects of high temperature treatment on powdery mildew control the growth, physiological mechanisms of cucumber (Cucumis sativus L.). Acta Agriculturae Shanghai 32:7−13

    doi: 10.15955/j.issn1000-3924.2016.02.02

    CrossRef   Google Scholar

    [11]

    Xu Y, Zhu Y, Wang X, Hong Z, Yang A, et al. 2023. PACLOBUTRAZOL-RESISTANCE4 positively regulates cell expansion to promote tendril elongation in cucumber. Plant Physiology 192:2756−67

    doi: 10.1093/plphys/kiad245

    CrossRef   Google Scholar

    [12]

    Nie J, He H, Peng J, Yang X, Bie B, et al. 2015. Identification and fine mapping of pm5.1: a recessive gene for powdery mildew resistance in cucumber (Cucumis sativus L.). Molecular Breeding 35:7

    doi: 10.1007/s11032-015-0206-8

    CrossRef   Google Scholar

    [13]

    Wang D, Tian L, Li D, Li Z, Hu X, et al. 2010. Inoculation method and inoculum concentration of melon powdery mildew at seedling stage. Northern Horticulture 11:185−86

    Google Scholar

    [14]

    Kang B, Hao X, Wu H, Peng B, Liu L, et al. 2022. Identification method of resistance to powdery mildew in melon at seedling stag. China Cucurbits and Vegetables 35:22−26

    doi: 10.16861/j.cnki.zggc.2022.0260

    CrossRef   Google Scholar

    [15]

    Wang L, Wang X, Song J, Zhang X, Tian M, et al. 2020. Screenings of the identification method at seedling stage in indoor and the resistant germplasm resources of muskmelon to powdery mildew in Ningxia. China Cucurbits and Vegetables 33:11−15

    doi: 10.16861/j.cnki.zggc.2020.0183

    CrossRef   Google Scholar

    [16]

    Liu D, Cheng H , Kong W, Su Y, Xu Y, et al. 2010. Identification of physiological races of powdery mildew on melon in Gansu Province. China Vegetables 6:28−32

    doi: 10.19928/j.cnki.1000-6346.2010.06.006

    CrossRef   Google Scholar

    [17]

    Li S, Wang P, Yang Y, Zhang L, Liu Q, et al. 2020. Identification of powdery mildew physiological race in seed-used pumpkin (Cucurbita pepo L.) and genetic analysis of its resistance. China Vegetables 11:72−79

    doi: 10.19928/j.cnki.1000-6346.2020.11.010

    CrossRef   Google Scholar

    [18]

    Gao Q, Sun J, Wang G, He H, Cai R, et al. 2021. The infection process of Sphaerotheca fuliginea on different resistant cucumber materials. Plant Protection 47:28−36

    doi: 10.16688/j.zwbh.2019640

    CrossRef   Google Scholar

    [19]

    Gadoury DM, Cadle-Davidson L, Wilcox WF, Dry IB, Seem RC, et al. 2012. Grapevine powdery mildew (Erysiphe necator): a fascinating system for the study of the biology, ecology and epidemiology of an obligate biotroph. Molecular Plant Pathology 13:1−16

    doi: 10.1111/j.1364-3703.2011.00728.x

    CrossRef   Google Scholar

    [20]

    Jankovics T, Komáromi J, Fábián A, Jäger K, Vida G, et al. 2015. New insights into the life cycle of the wheat powdery mildew: direct observation of ascosporic infection in Blumeria graminis f. sp. tritici. Phytopathology 105:797−804

    doi: 10.1094/PHYTO-10-14-0268-R

    CrossRef   Google Scholar

    [21]

    Tayeh C, Randoux B, Tisserant B, Khong G, Jacques P, et al. 2015. Are ineffective defence reactions potential target for induced resistance during the compatible wheat-powdery mildew interaction? Plant Physiology and Biochemistry 96:9−19

    doi: 10.1016/j.plaphy.2015.07.015

    CrossRef   Google Scholar

    [22]

    Zhu M, Riederer M, Hildebrandt U. 2017. Very-long-chain aldehydes induce appressorium formation in ascospores of the wheat powdery mildew fungus Blumeria graminis. Fungal Biology 121:716−28

    doi: 10.1016/j.funbio.2017.05.003

    CrossRef   Google Scholar

    [23]

    Gadoury D, Wakefield LM, Cadle-Davidson L, Dry IB, Seem RC, et al. 2012. Effects of prior vegetative growth, inoculum density, light, and mating on conidiation of Erysiphe necator. Phytopathology 102:65−72

    doi: 10.1094/PHYTO-03-11-0085

    CrossRef   Google Scholar

    [24]

    Ben-naim Y, Cohen Y. 2015. Inheritance of resistance to powdery mildew race 1W in watermelon. Phytopathology 105:1446−57

    doi: 10.1094/PHYTO-02-15-0048-R

    CrossRef   Google Scholar

    [25]

    Kitaoa M, Utsugia H, Kuramotob S, Tabuchib R, Fujimotoc K, et al. 2003. Light-dependent photosynthetic characteristics indicated by chlorophyll fluorescence in five mangrove species native to Pohnpei Island, Micronesia. Physiologia Plantarum 117:376−82

    doi: 10.1034/j.1399-3054.2003.00042.x

    CrossRef   Google Scholar

    [26]

    Tatagiba SD, DaMatta FM, Rodrigues FÁ. 2015. Leaf gas exchange and chlorophyll a fluorescence imaging of rice leaves infected with Monographella albescens. Phytopathology 105:180−88

    doi: 10.1094/PHYTO-04-14-0097-R

    CrossRef   Google Scholar

    [27]

    Zhang D, Wu S, Li N, Gao J, Liu S, et al. 2022. Chemical induction of leaf senescence and powdery mildew resistance involves ethylene-mediated chlorophyll degradation and ROS metabolism in cucumber. Horticulture Research 9:uhac101

    doi: 10.1093/hr/uhac101

    CrossRef   Google Scholar

    [28]

    Zhang Y, Dong W, Zhao C, Ma H. 2022. Comparative transcriptome analysis of resistant and susceptible Kentucky bluegrass varieties in response to powdery mildew infection. BMC Plant Biology 22:509

    doi: 10.1186/s12870-022-03883-4

    CrossRef   Google Scholar

    [29]

    Zhang R, Peng D, Wu Y, Li S, Xiao Y, et al. 2017. Resistance identification method of melon powdery mildew at seedling. China Cucurbits and Vegetables 30:25−26,29

    doi: 10.16861/j.cnki.zggc.2017.0030

    CrossRef   Google Scholar

    [30]

    Zhang H, Fang W, Liu C, Zhao W, Peng Y, et al. 2014. Identification of Magnaporthe oryzae pathotypes by wounding inoculation of detached rice leaves. Plant Protection 40:121−25

    doi: 10.3969/j.issn.05291542.2014.05.022

    CrossRef   Google Scholar

    [31]

    Deng L, Liao X, Wang H, Hu J, Yang J, et al. 2015. Research of detached leaf inoculation for powdery mildew of melon. China Cucurbits and Vegetables 28:18−21,29

    doi: 10.16861/j.cnki.zggc.2015.03.006

    CrossRef   Google Scholar

  • Cite this article

    Tan J, Zhong L, Fan S, Cheng S, Gao Y, et al. 2024. Methods for seedling identification of cucumber resistance to powdery mildew and its effect on the growth of cucumber seedlings. Vegetable Research 4: e030 doi: 10.48130/vegres-0024-0028
    Tan J, Zhong L, Fan S, Cheng S, Gao Y, et al. 2024. Methods for seedling identification of cucumber resistance to powdery mildew and its effect on the growth of cucumber seedlings. Vegetable Research 4: e030 doi: 10.48130/vegres-0024-0028

Figures(5)  /  Tables(4)

Article Metrics

Article views(1512) PDF downloads(263)

METHOD   Open Access    

Methods for seedling identification of cucumber resistance to powdery mildew and its effect on the growth of cucumber seedlings

Vegetable Research  4 Article number: e030  (2024)  |  Cite this article

Abstract: The severity of powdery mildew in cucumbers gravely impinges upon both yield and quality. In order to probe efficacious methods for early-stage resistance determination against powdery mildew in cucumbers, we utilized Xintai mici as an experimental subject and adopted a four-factor, three-level (L9(3)4) orthogonal experimental design. This design encompassed four factors: inoculation seedling age, inoculation concentration, inoculation method, and different hydration periods post-inoculation. Through this, we sifted and discerned the most optimal indoor method for early-stage resistance determination against powdery mildew in cucumbers. Concurrently, we studied the influence of different determination methods on the accumulation of cucumber plant biomass, chlorophyll content, and leaf photosynthetic parameters to delineate the impact patterns of powdery mildew on cucumber leaf photosynthetic traits. The results underscored that disease incidence amongst different treatments were minute, all exceeding 96.67%. In contrast to other treatments, T3 (inoculating a spore suspension of powdery mildew at a concentration of 106 per mL on one-true-leaf stage using the leaf-brushing method and maintaining hydration for 12 h post-inoculation) exhibited a rapid onset of disease, with a disease index reaching 89.03, thereby proving to be the most superior method for early-stage powdery mildew determination. Various determination methods wielded a significant influence on dry and fresh weight, chlorophyll content, and leaf photosynthetic activity of cucumber seedlings. Relative to other treatments, the net photosynthetic rate (Pn) of T3, T8, and T9 was significantly suppressed post-inoculation with powdery mildew, all lingering below 3 μmol/m2/s, while the transpiration rate (E), intercellular CO2 concentration (Ci), as well as the stomatal conductance (Gs), drastically declined, the decrease fell between 25%−80%. The relative chlorophyll content maintained at a lower level, ultimately leading to a significant reduction in the accumulation of dry matter. This demonstrates that powdery mildew can significantly stifle the growth of cucumber seedlings.

    • Powdery mildew (PM) is one of the three most susceptible diseases in cucumber production, manifesting in both facility cultivation and open-field planting. Two pathogens, Podosphaera xanthii and Golovinomyces cichoracearum, have been reported as the most common fungi causing PM in cucumber, with P. xanthii being predominant in China[1]. Upon infection, cucumber leaves are covered by irregular white powdery spots of varying sizes, the leaves turn yellow and wither, leading to light suppression in cucumber plants, damage to the photosynthetic system reduced dry matter accumulation, and restricted growth of the roots and the above-ground parts[2,3]. Infection during the flowering period can reduce cucumber yield by 20%−40%[4]. Therefore, researching cucumber powdery mildew is of crucial significance for enhancing cucumber yield and quality.

      Currently, planting disease-resistant varieties is the most economical, effective, environmentally friendly, and sustainable measure to control cucumber powdery mildew. The selection of powdery mildew-resistant cucumber varieties is the fundamental approach to control the disease. The premise for screening and cultivating cucumber materials resistant to powdery mildew is a scientific, convenient, and accurate resistance identification technology system[5]. In existing reports, research on cucumber powdery mildew inoculation mainly focuses on inoculation concentration and method. Xu et al.[6] mentioned that when inoculating cucumber powdery mildew, the concentration of spore suspension needs to be set at 1 × 10⁶ spores per mL, and cucumber leaves at the two-true-leaf stage are used as inoculation materials. Zhang et al.[7] adopted a similar protocol as Xu et al.[6] and enhanced the adsorption capacity of powdery mildew spores on leaves by adding Tween-20 to the spore suspension. When identifying the powdery mildew resistance of different cucumber materials, Ma et al.[8] diluted the spore suspension with a 10 μg/mL SDS solution to a concentration of 5 × 10⁵ conidia per milliliter and inoculated the cucumber seedlings at the three-true-leaf stage with powdery mildew using the spray method. Jia et al.[9] compared the effects of rubbing and spraying asexual spore suspension on the young leaves of cucumber seedlings, and concluded that the rubbing method had a higher incidence rate, but the specific parameters were not detailed. Wang et al.[10] mentioned in a report on controlling cucumber powdery mildew in high-temperature greenhouses that when preparing a spore suspension, the powdery mildew spores can be kept at 20−24 °C for 24 h to improve the activity of asexual spores, and then prepared into a suspension with 10−15 spores per field of view (10 × 10 microscope) for inoculation. Although the inoculation method for cucumber powdery mildew is relatively mature, there has been no reports on a systematic identification method for cucumber powdery mildew at the seedling stage.

      Therefore, based on previous research, this experiment, by artificially inoculating the cucumber variety Xintai mici with powdery mildew and adopting the four-factor three-level (L9(3)4) orthogonal test design, which includes factors such as inoculation seedling stage, inoculation concentration, inoculation method, and different moisturizing times after inoculation, screened out the best indoor seedling stage resistance identification method for cucumber powdery mildew. The experiment also explored the impact of different identification methods on cucumber growth and photosynthesis, with the aim of providing a scientific basis and theoretical foundation for the identification of cucumber powdery mildew, resistance research, and the breeding of resistant varieties.

    • The cucumber inbred line Xintai mici was used for all experiments. The PM pathogen (Podosphaera xanthii) used in this test was isolated from diseased cucumber leaves from the greenhouse at Zhejiang University of Agriculture and Forestry (Zhejiang, China) and maintained by infection of susceptible cucumber cultivar plants.

    • Cucumber plants were grown in soil (nursery substrate : garden soil = 2:1, V:V) under a long-day photoperiod (16-h light/8-h dark at 26 °C, 20,000 lx) up to one-true-leaf stage~three-true-leaf stage[11]. For the disease resistance test, a four-factor three-level (L9(3)4) orthogonal experimental design was employed, with factors including seedling age (a), spore suspension concentration (b), inoculation method (c), and moisturizing time (d). The detailed factors and levels are shown in Tables 1 & 2. Severely diseased cucumber plants from the greenhouse were selected, and fresh powdery mildew spores were collected and re-suspended in a water solution containing 0.01% Tween-20. The spore suspension was adjusted to the desired concentration (104, 105, or 106) spores per mL, and the spores were inoculated onto leaves at different seedling ages (one-true-leaf stage, two-true-leaf stage, or three-true-leaf stage) using different inoculation methods (spraying: spray a certain concentration of spore suspension onto flattened cucumber leaves with a spray bottle; rubbing: mix a specific concentration of spore suspension with quartz sand, and use gauze to evenly spread the mixture onto cucumber leaves; leaf brushing: use a specially made soft-bristled brush to evenly apply a certain concentration of spore suspension onto the leaves of cucumber plants). The inoculated plants were then placed in a growth chamber under controlled lighting conditions and subjected to 12, 24, and 36 h of moisturizing treatment. Furthermore, infection of leaf was recorded every 3 d after inoculation, and the incidence and disease index were investigated 15 d later. The experiment was set up with two biological replicates, each replicate experiment contains 90 samples (for each orthogonal scheme, 10 samples were prepared).

      Table 1.  Factors and levels of cucumber powdery mildew seedling resistance identification test.

      Factor Level 1 Level 2 Level 3
      a Seedling age one-true-leaf two-true-leaf three-true-leaf
      b Spore suspension concentration: spores/mL 104 105 106
      c Inoculation method spraying rubbing leaf brushing
      d Moisturizing time 12 h 24 h 36 h

      Table 2.  Cucumber powdery mildew seedling resistance identification implementation programme.

      Test
      no.
      Factor Scheme of orthogonal design
      a b c d
      T1 1 1 2 2 a1b1c2d2 one-true-leaf 104 rubbing 24 h
      T2 2 1 3 3 a2b2c3d3 two-true-leaf 104 leaf brushing 36 h
      T3 3 3 3 1 a3b3c1d1 three-true-leaf 106 leaf brushing 12 h
      T4 1 1 1 1 a1b1c1d3 one-true-leaf 104 spraying 12 h
      T5 2 2 2 1 a2b2c2d1 two-true-leaf 105 rubbing 12 h
      T6 3 2 1 3 a3b3c3d2 three-true-leaf 105 spraying 36 h
      T7 1 2 3 2 a1b1c3d1 one-true-leaf 105 leaf brushing 24 h
      T8 2 3 1 2 a2b2c1d2 two-true-leaf 106 spraying 24 h
      T9 3 3 2 3 a3b3c2d3 three-true-leaf 106 rubbing 36 h

      The calculation of disease index (DI) followed the method described by Nie et al.[12]. For details, refer to Table 3. The formula for calculating the disease index (DI) is:

      DI = (Sini)4N×100 (1)

      Where Si represents the disease grade, ni represents the number of plants in the corresponding disease grade, i represents each level of disease severity, and N represents the total number of plants investigated.

      Table 3.  Disease grading criteria for indoor seedling resistance identification.

      Grade Symptom
      0 no symptom
      1 < 5% of the surface area of the leaf
      2 6%−25% of the leaf infected
      3 26%−50% of the leaf infected
      4 > 50% of the leaf infected
    • In this study, four cucumber varieties with distinct resistance profiles, as determined through preliminary experiments, were chosen as test subjects. Among them, R1641 was designated as a highly resistant variety, BK2 as disease-resistant, 9930 as moderately resistant, and H136 as susceptible. At the stage when the cucumber plants developed three true leaves, the leaves were cut off and laid flat in sterilized plastic Petri dishes (with a moist filter paper placed at the bottom of the dish). The optimal indoor seedling disease resistance identification method, which had been screened, was utilized to inoculate powdery mildew on the leaves of the four germplasm resources. Details regarding the investigation of the incidence rate refer to Table 3. Furthermore, the four cucumber germplasms were graded based on their resistance levels: 0 ≤ DI < 15 was classified as highly resistant, 15 ≤ DI < 35 as resistant, 35 ≤ DI < 55 as moderately resistant, 55 ≤ DI < 75 as susceptible, and DI ≥ 75 as highly susceptible. Three plants were cultivated for each material, and three leaves were cut from each plant.

    • At 72 h after inoculation with powdery mildew, samples were taken from the leaves of the nine schemes of orthogonal design using a puncher, and the leaf discs were placed in 10 mL centrifuge tubes. Three plants were randomly selected for each treatment, and one leaf was taken from each plant. Three leaf discs were taken from each leaf, resulting in a total of nine replicates. Before observing the conidia, the leaf discs were placed in a decolorizing solution (acetic acid : ethanol = 1:3) for 3 h. They were then rinsed with deionized water two to three times and stained with cotton blue in lactophenol for 1−2 min. Subsequently, the leaf discs were clamped onto a glass slide with forceps, covered with a cover glass, and observed under a 10 × 40 magnification microscope to observe the germination status of powdery mildew conidia on cucumber leaves under different treatment combinations. Twenty conidia were observed per leaf disc.

    • Twenty days after inoculation with powdery mildew, the chlorophyll content of cucumber in each orthogonal design scheme was measured. The third leaf from the top of the cucumber plants was selected for measurement. Chl contents of cucumber leaves were determined using a SPAD-502 PLUS chlorophyll meter. The experiment was set up with two biological replicates, and in each replicate, five strains were randomly selected for measurement.

    • Twenty days after inoculation with powdery mildew, the Pn, Ci and Gs of the third leaf from the top of the cucumber in each orthogonal design scheme was measured by a portable photosynthetic instrument LI-6800 (LI-COR, Lincoln, USA). The experiment was set up with two biological replicates, and in each replicate, five strains were randomly selected for measurement.

    • Twenty-one days after inoculation with powdery mildew, the fresh weight and dry weight of cucumber plants were measured for each orthogonal design scheme as well as the control group (sprayed with water). After being killed at 105 °C for 15 min, the samples were dried at 80 °C until reaching a constant weight, and the dry weight of all cucumber plants in each treatment combination was determined. The experiment was set up with two biological replicates, and in each replicate, five strains were randomly selected for measurement.

    • All data were expressed as the mean ± standard error of the mean (SEM). Software of statistical product and service solutions (SPSS) 18.0 was used for the evaluation of the statistical experimental design.

    • At 15 d post-inoculation, the cucumber Xintai mici demonstrated full disease onset. Initially, an individual factor analysis was conducted. As depicted in Fig. 1a, with the increase in cucumber seedling age, both the disease incidence and disease index exhibited a gradual ascension, with no significant differences in disease incidence among different treatments. The disease index for inoculation at the three-true-leaf stage was the highest at 82.40, significantly higher than at the one-true-leaf stage, but bore no significant difference with the two-true-leaf stage inoculation. As illustrated in Fig. 1b, an upward trend in both disease incidence and index is observed by an increase in the concentration of inoculating spore suspension. At an inoculation concentration of 106 per mL, the disease index stands at 86.78, remarkably outstripping those of the two treatments with inoculation concentrations of 105 per mL (65.70) and 104 per mL (58.83). Conversely, there are no notable disparities in either the disease index or the incidence among treatments differing in inoculation method and post-inoculation hydration time (Fig. 1c & d).
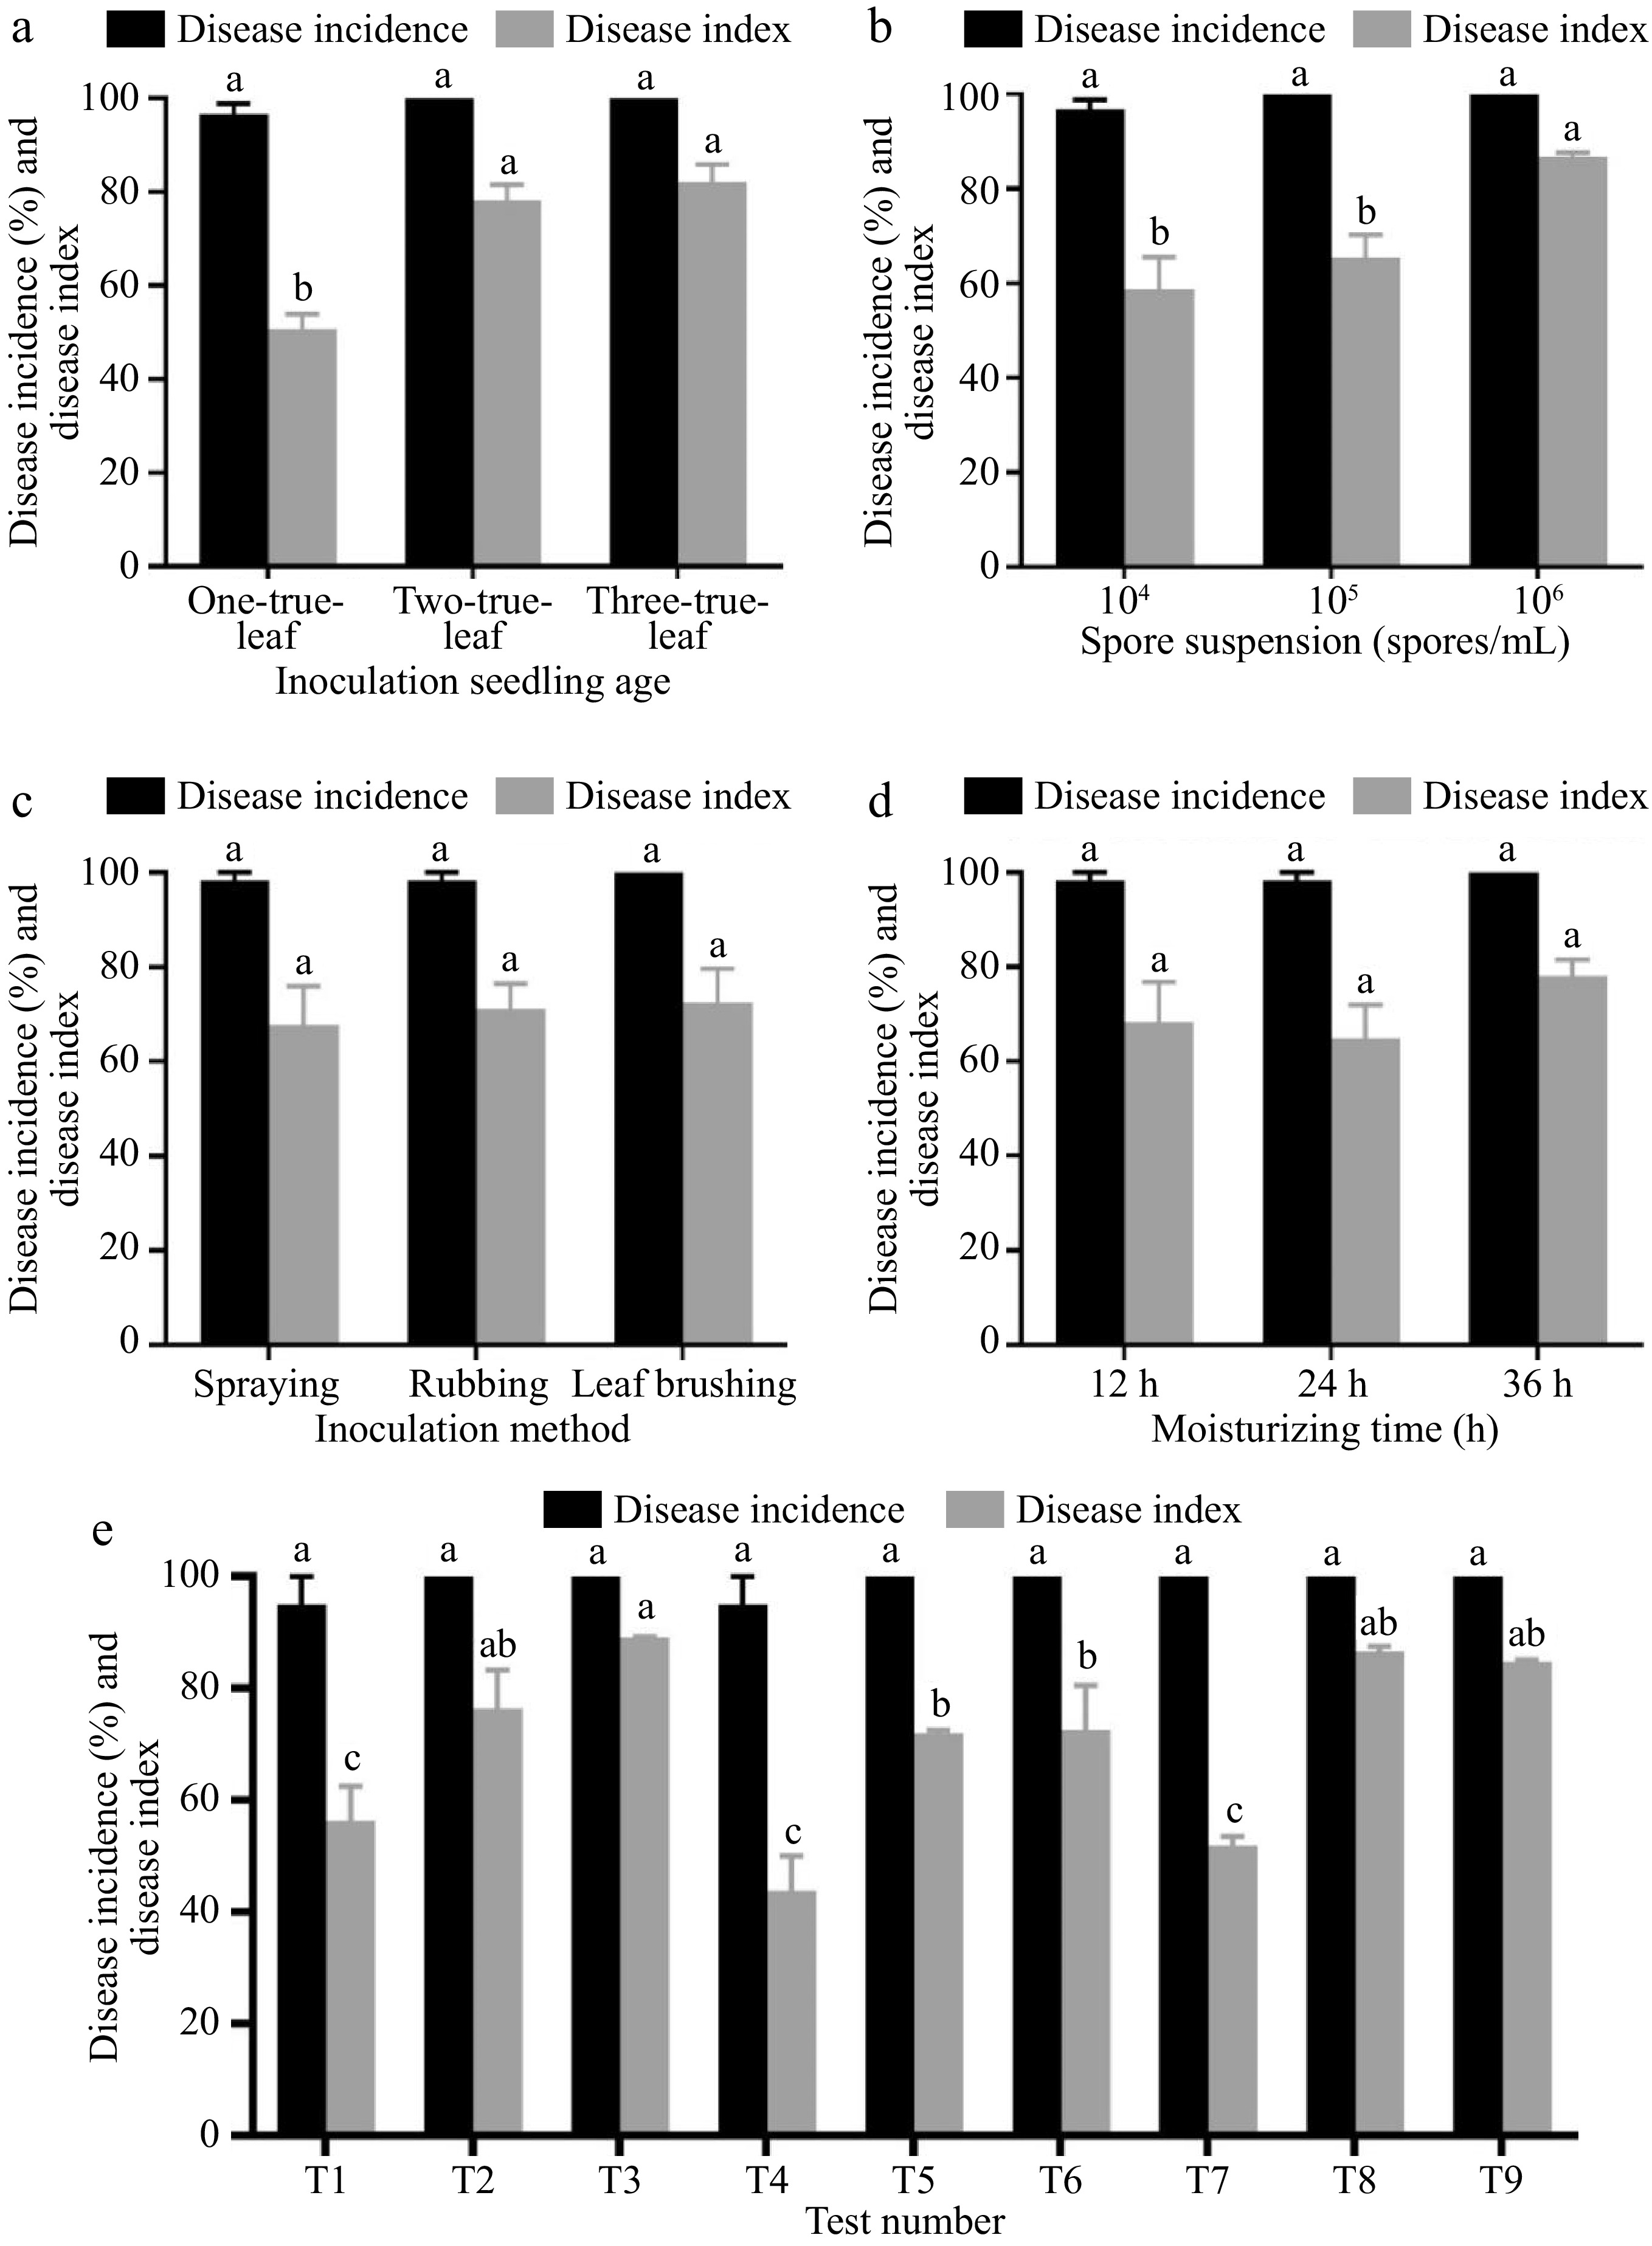
      Figure 1. 

      Resistance identification results of combinations of indoor seedling resistance identification methods (15 d). Effects of (a) different seedling ages, (b) spore suspension concentrations, (c) inoculation methods, and (d) moisturizing time on the incidence rate and disease index of cucumber seedlings. (e) The influence of different inoculation schemes on the incidence rate and disease index of cucumber seedlings. Values are means of minimum two replicates, with each containing 9 to 10 seedlings. Data are expressed as mean ± Standard error of mean, and significances were examined by one-way ANOVA, followed by Duncan's multiple comparisons test and different letters represent significant differences (p < 0.05).

      Upon analyzing the disease incidences and indices of nine treatment combinations, it is discerned that there are no significant differences in disease incidence among the treatments, all being above 96.67%. The disease progression of treatment T3 is the swiftest, with a disease incidence of 100%, and the symptoms are distinct. Fifteen days after inoculation with powdery mildew, the disease index of T3 reaches 89.03, significantly surpassing most treatments. Consequently, this treatment is regarded as the optimal method for early-stage powdery mildew resistance determination in cucumber seedlings, namely, inoculating at the three-true-leaf stage, with a spore suspension concentration of 106 per mL, using the leaf-brushing method, and maintaining hydration for 12 h post-inoculation (Fig. 1e).

    • The indoor seedling disease resistance identification method was adopted to evaluate the powdery mildew resistance of four cucumber germplasm resources. The results indicated that R1461 exhibited high resistance, BK2 demonstrated resistance, while both 9930 and H136 showed susceptibility to the disease (Fig. 2). Except for 9930, the resistance types of the other three materials were consistent with those determined in previous experiments. These findings suggest that the indoor seedling disease resistance identification method screened in this study is reliable.
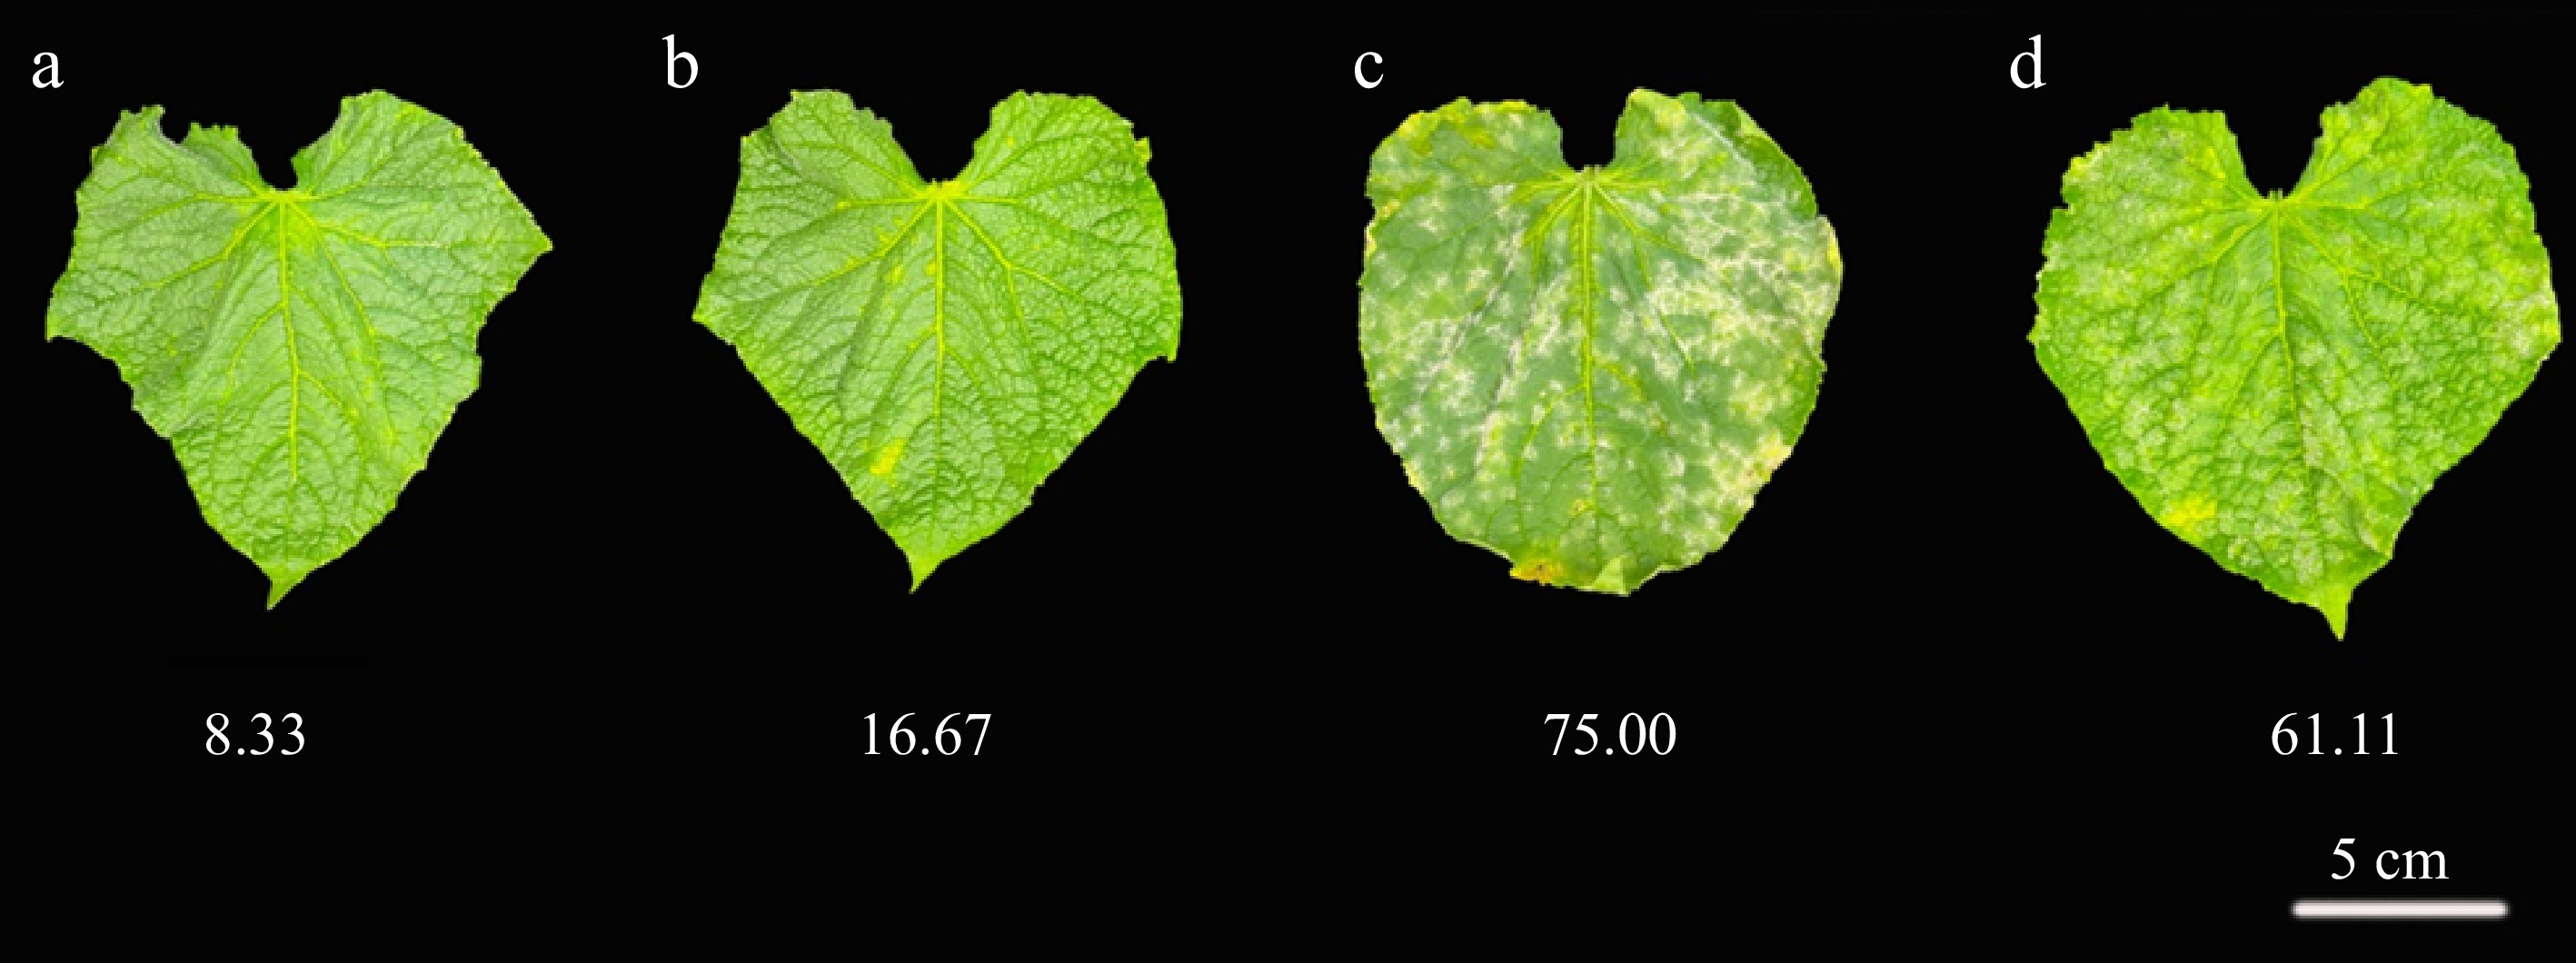
      Figure 2. 

      Identification of disease resistance in different cucumber germplasm. The onset of disease in (a) R1461, (b) BK2, (c) 9930, and (d) H136 after 15 d of inoculation with powdery mildew.

    • At 72 h after inoculation of powdery mildew on cucumber leaves, the spores in all treatment combinations began to germinate (Fig. 3). The spore growth on treatment combinations T1, T4, T5, and T7 were slow, with few germ tube branches, and some germ tubes had not yet begun to elongate. In contrast, the germ tubes of the spores on treatment combinations T2 and T6 had extended, branched, and started to spread on the leaf surface, forming hyphae. Meanwhile, the spores on treatment combinations T3, T8, and T9 also began to form hyphae, but the growth process was slightly faster than treatments T2 and T6.
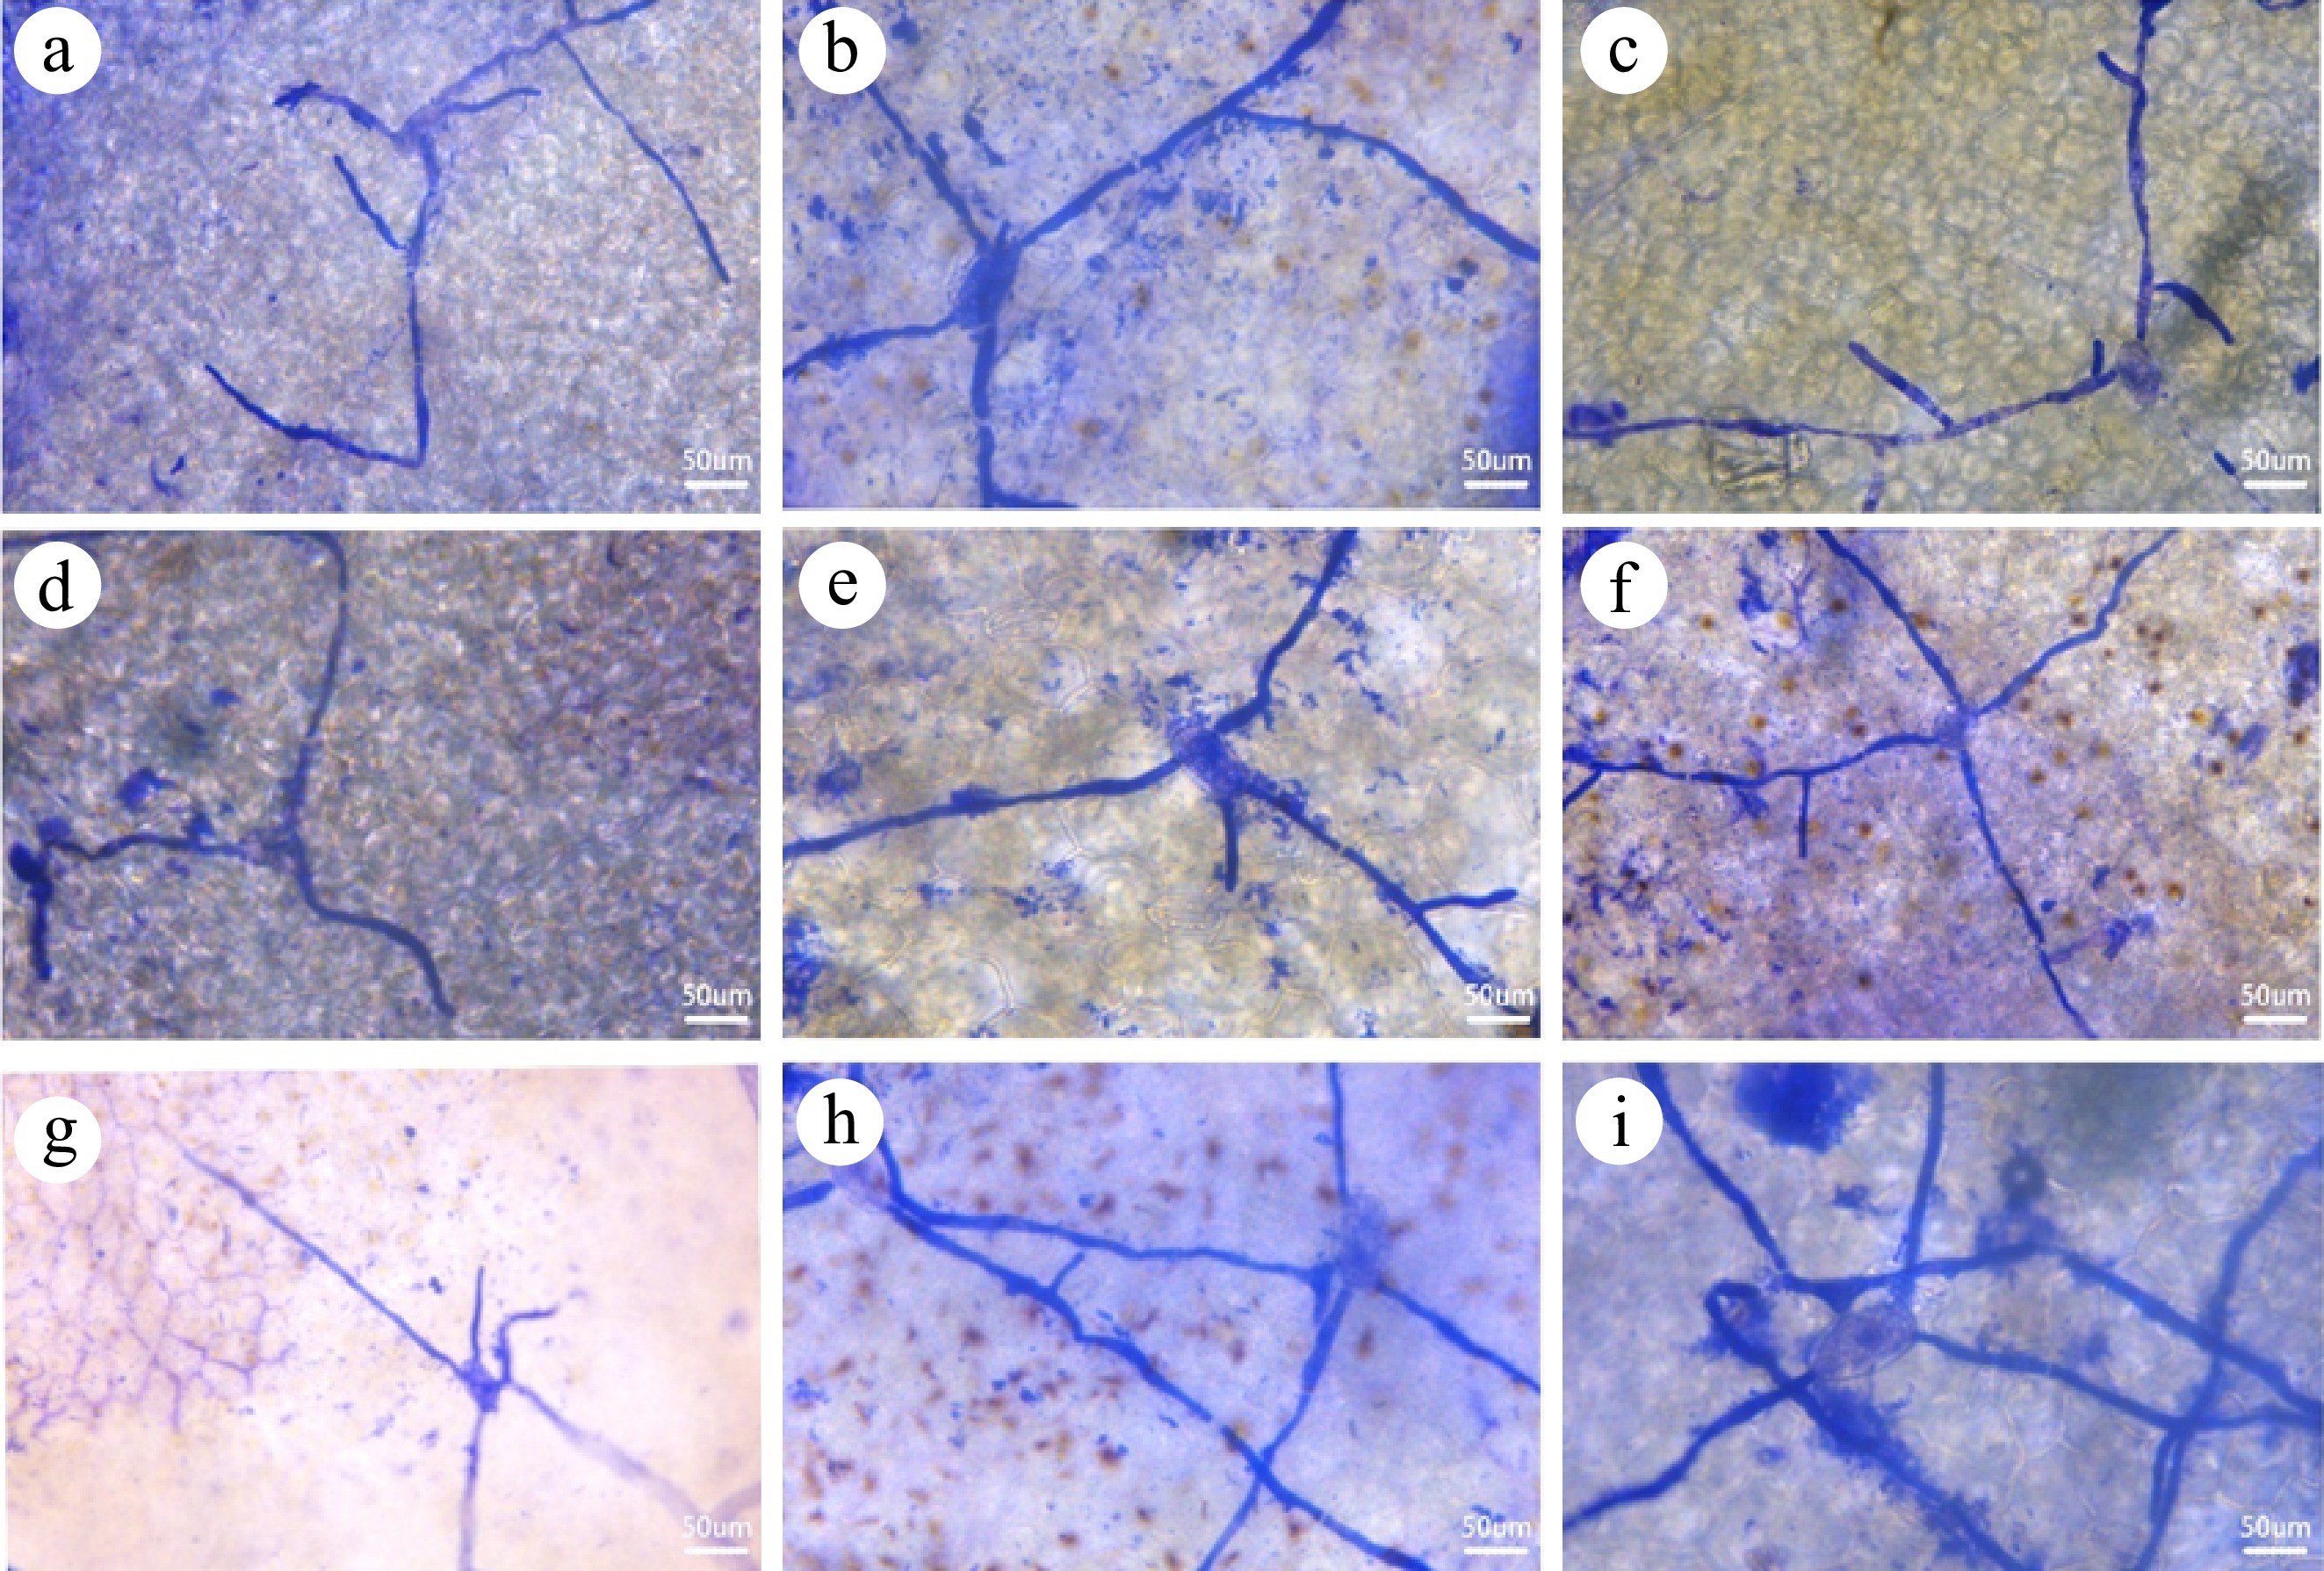
      Figure 3. 

      Growth and development of powdery mildew fungus spores under different treatment combinations. (a)−(i) Correspond to the spore germination of treatment combinations T1−T9 after 72 h of inoculation.

    • As shown in Fig. 4, compared to the control group, the fresh weight and dry weight of cucumber plants inoculated with powdery mildew fungi decreased significantly. In addition, it is observable that the impact of powdery mildew on the dry weight and fresh weight of plants diminishes as the disease index decreases. Compared to other treatments inoculated with powdery mildew at the one-true-leaf stage, the fresh and dry weights of cucumber seedlings in treatment T4 were the highest, but there was no significant difference between treatments T1 and T7. Among the treatments inoculated with powdery mildew at the two-true-leaf stage, the fresh weight under treatment T8 significantly decreased by 14.05% and 13.74% compared to T2 and T5, respectively, and the dry weight significantly decreased by 38.89% and 37.74%. When inoculated with powdery mildew at the three-true-leaf stage, compared to treatments T6 and T9, the fresh weight of cucumber plants under treatment T3 decreased by 34.01% and 13.83% respectively, and the dry weight decreased by 31.28% and 3.12%. It can be seen that the infection of powdery mildew inhibits the accumulation of dry matter in cucumber seedlings, and this inhibitory effect gradually intensifies with the worsening of the disease.
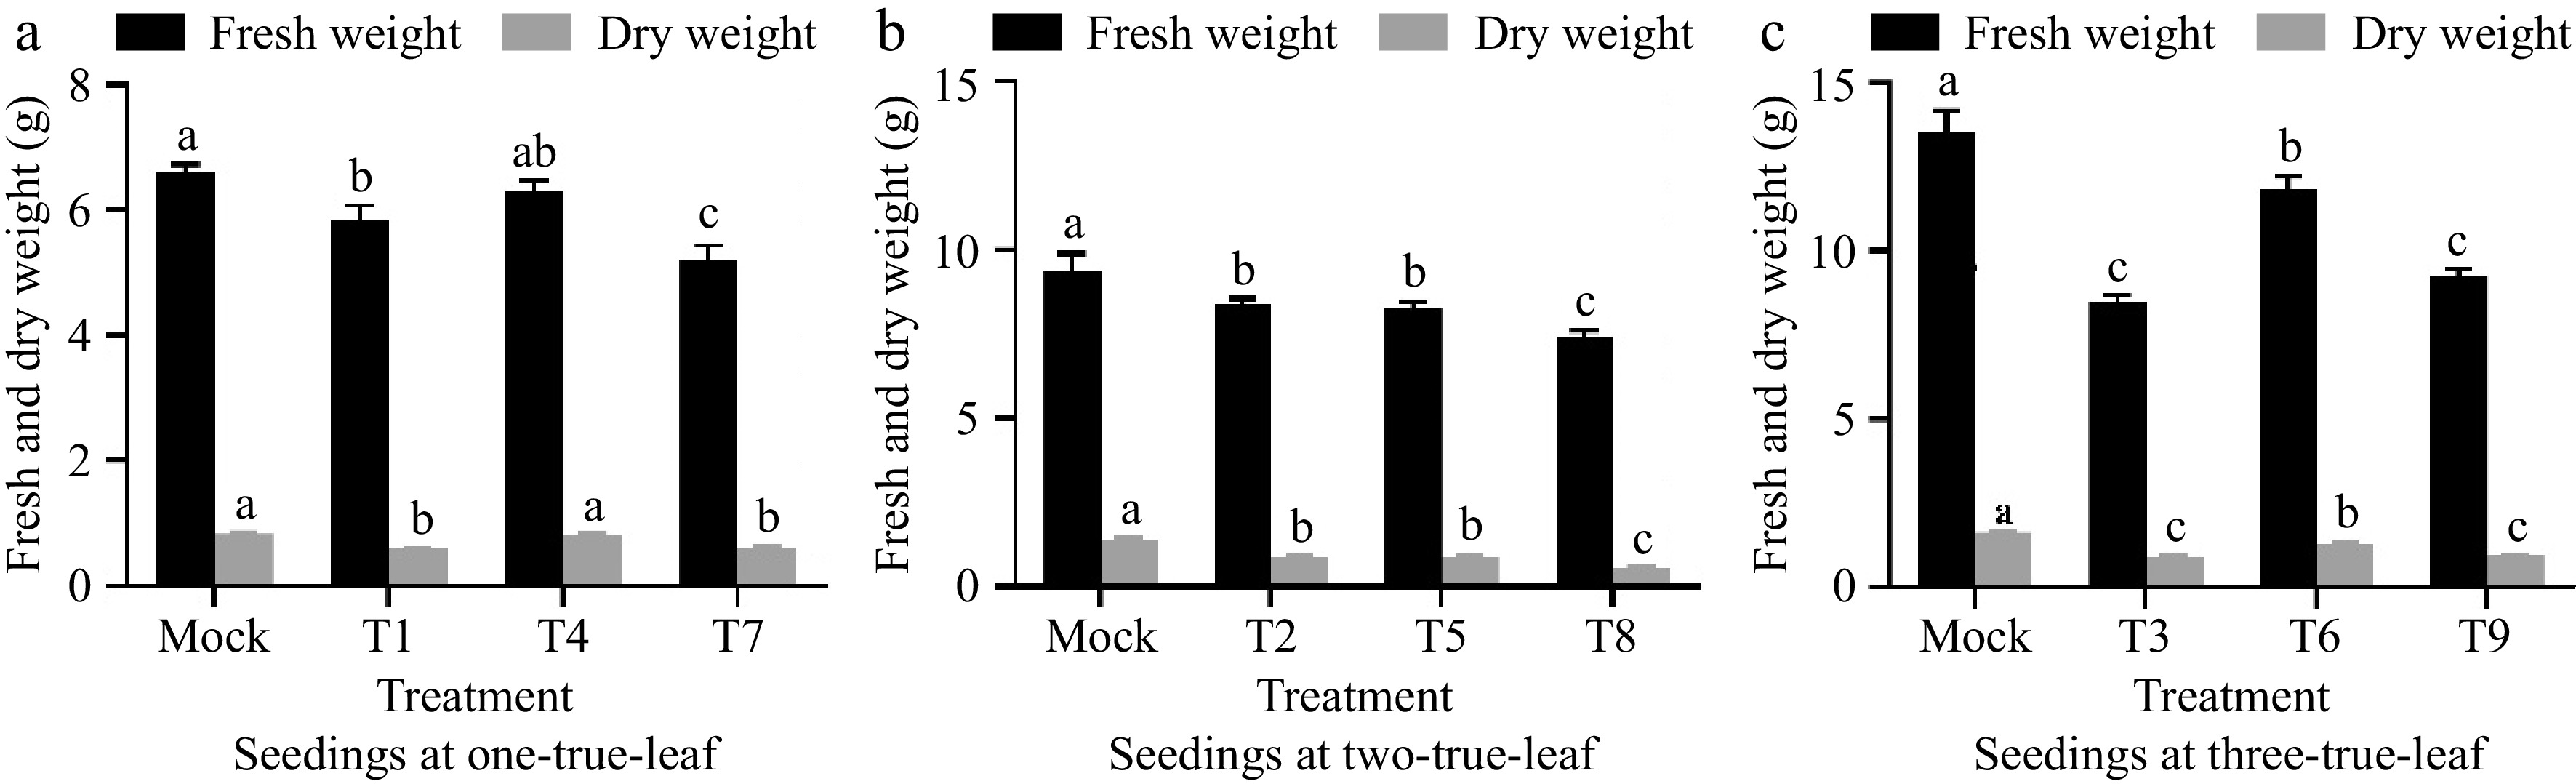
      Figure 4. 

      Effect of powdery mildew on dry and fresh weight of plants at different seedling ages. (a) The impact of inoculating powdery mildew at the one-true-leaf stage on the growth of cucumber seedlings. (b) The impact of inoculating powdery mildew at the two-true-leaf stage on the growth of cucumber seedlings. (c) The impact of inoculating powdery mildew at the three-true-leaf stage on the growth of cucumber seedlings. Values are means of minimum two replicates, with each containing five seedlings. Data are expressed as mean ± Standard error of mean, and significances were examined by one-way ANOVA, followed by Duncan's multiple comparisons test and different letters represent significant differences (p < 0.05).

    • As shown in Table 4, after inoculation with powdery mildew, cucumber leaves with different degrees of disease showed significant differences in Pn values. Compared with other treatments, T3, T8, and T9 had the greatest decline in Pn, which were only 2.42, 2.98, and 1.92, respectively. Similarly to Pn, the transpiration rate and stomatal conductance under treatments T3, T8, and T9 also significantly decreased compared to other treatments, with a decrease of more than 40%. Among the nine treatments, there was no significant difference in Ci values of most of the leaf treatments, but the Ci values of treatments T3, T8, and T9 were significantly lower than other treatments, indicating that powdery mildew inhibits the photosynthetic rate of cucumber leaves. When the disease index is low, the reduction in Pn is mainly due to non-stomatal limitations, and when the disease is serious, the reduction in Pn is mainly due to stomatal limitations.

      Table 4.  Comparison of photosynthetic parameters of diseased plants in different treatments.

      Treatments Pn
      (μmol/m2/s)
      Ci
      (μmol/mol)
      E
      (mmol/m2/s)
      Gs
      (mol/m2/s)
      T1 3.29 bc 341.17 a 1.78 ab 0.13 ab
      T2 3.08 bc 325.84 a 1.41 b 0.09 b
      T3 2.42 de 229.12 b 0.49 cd 0.03 c
      T4 3.91 a 321.45 a 1.56 b 0.10 b
      T5 3.84 ab 343.73 a 2.18 a 0.15 a
      T6 3.71 ab 332.47 a 1.83 ab 0.12 ab
      T7 4.01 a 335.53 a 1.98 a 0.14 a
      T8 2.98 cd 220.68 b 0.81 c 0.05 c
      T9 1.92 e 208.43 b 0.29 d 0.02 c
      Different lowercase letters indicate significant differences between treatments (p < 0.05).
    • Analysis of Fig. 5 shows that among the treatments of powdery mildew inoculation at the one-true-leaf stage, the SPAD value of the functional leaves in treatment T4 was the largest, but there was no significant difference with T1 and T7. At the two-true-leaf stage, compared to treatments T5 and T8, the SPAD value under treatment T2 significantly increased by 14.25% and 29.95%, respectively. Among the treatments of powdery mildew inoculation at the three-true-leaf stage, the SPAD value of treatment T6 was the largest, significantly higher than T3 and T9 by 16.37% and 13.86%. It can be seen that the infection of powdery mildew will reduce the chlorophyll content in cucumber leaves, thereby affecting the photosynthesis of cucumbers.
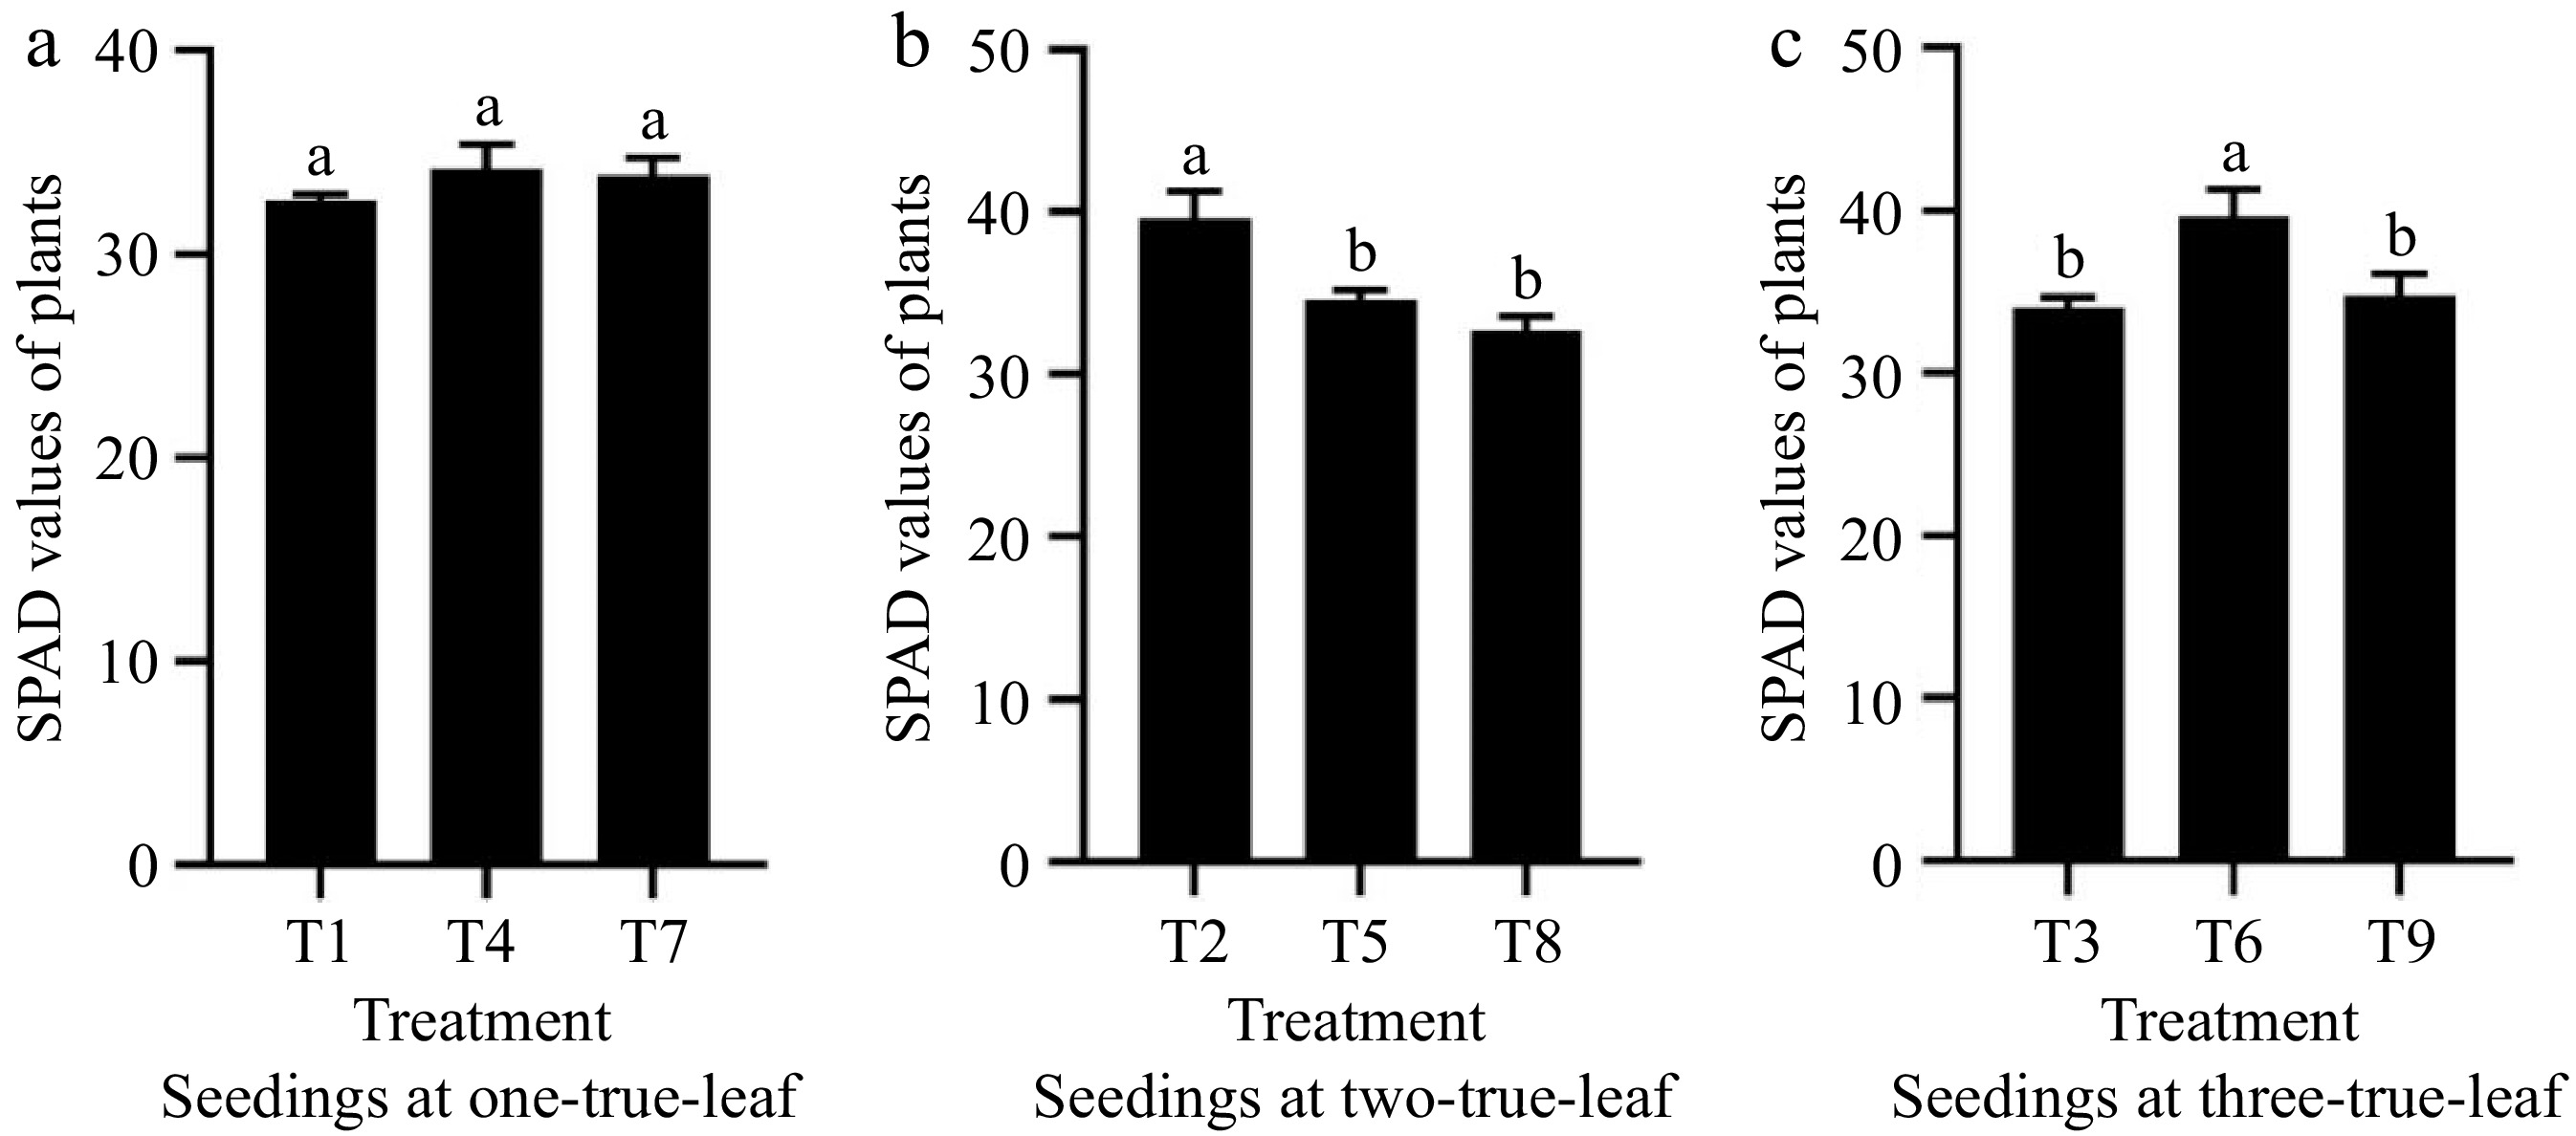
      Figure 5. 

      Statistics of SPAD values of plants at different seedling ages under powdery mildew stress. (a) The effect of treatments T1, T4, and T7 on chlorophyll content in cucumber. (b) The effect of treatments T2, T5, and T8 on chlorophyll content in cucumber. (c) The effect of treatments T2, T5, and T8 on chlorophyll content in cucumber. Values are means of minimum two replicates, with each containing five seedlings. Data are expressed as mean ± Standard error of mean, and significances were examined by one-way ANOVA, followed by Duncan's multiple comparisons test and different letters represent significant differences (p < 0.05).

    • To screen a simple and accurate method for determining the resistance to powdery mildew during the seedling stage of cucumber, this experiment employed a four-factor three-level (L9(3)4) orthogonal experimental design. The inoculation method, inoculation timing, inoculation concentration, and hydration time involved in resistance determination were explored. Moreover, the best inoculation scheme for powdery mildew during the cucumber seedling stage were screened: inoculating with a powdery mildew spore suspension concentration of 106 per mL using the leaf brushing method at the three-true-leaf stage, followed by 12 h of hydration. This aligns with the research findings of Wang et al.[13] on the inoculation method for melon powdery mildew. It is also consistent with the conclusion of Kang et al.[14] that the optimal inoculum concentration for melon is 106 per mL. In contrast, Wang et al.[15] conducted similar research on the resistance identification scheme of Ningxia melon during the seedling stage using a four-factor three-level orthogonal experimental design. They demonstrated that the optimal identification scheme was to inoculate powdery mildew spore suspension concentration of 105 per mL using the rubbing method at the four-true-leaf stage, followed by 36 h of hydration. While the inoculation conditions were somewhat similar, differences were also present, which might be attributed to the inconsistent resistance of the two cucurbits or the results of interaction among different treatment factors. Additionally, both studies did not identify the physiological races of powdery mildew, so it is speculated that the differences in pathogenicity might be due to the dominant physiological races in Ningxia and Hangzhou being disparate[16,17].

      The infection process of powdery mildew directly determines the disease rate and plant disease index[18]. After the powdery mildew spores fall on the host surface, they begin to germinate under suitable conditions, forming two to four germ tubes. Subsequently, these germ tubes begin to extend, differentiate to produce separate hyphae, form septa at the base of the hyphae, swell at the top to form attachment cells, and form infection pegs to pierce the host cuticle and epidermal cells. The infection pegs swell at the top to form haustoria that absorb nutrients to support hyphal growth. Finally, conidiophores are formed[1922]. In both wheat and cucumber, powdery mildew can complete its growth cycle within five days[18,20]. In this experiment, Xintai mici, a medium-resistant variety to powdery mildew, was used as the test material. The growth of powdery mildew 72 h after inoculation with nine treatment combinations were compared. It was found that the spores on treatments T1, T4, T5, and T7 grew at a slightly slower rate, and some germ tubes had not yet begun to extend. The spores on treatment combinations T2 and T6 formed hyphae and began to extend. The spores on treatment combinations T3, T8, and T9 also formed hyphae, and their extension speed was faster than treatments T2 and T6. This indicates that the inoculation scheme will affect the growth process of spores on cucumber leaves. This is also one of the reasons why the disease indices of treatments T3, T8, and T9 are significantly higher than other treatments. In addition, research has shown that the inoculation density of powdery mildew is positively correlated with the disease rate. In their exploration of the occurrence and prevalence of grape powdery mildew, Gadoury et al.[23] discerned that the rate of disease incidence escalates with the increase in the number of asexual spores deposited per square millimeter, a finding that resonates with the results of the present study. With the augmentation of the concentration of spore suspension, there is a gradual increase in the rate of disease incidence and disease index in cucumber powdery mildew, reaching its zenith at 106 particles per mL. Gadoury et al.[23] postulated that this phenomenon may be attributable to the sporulation of powdery mildew colonies being regulated by quorum sensing (a cell-cell communication system that exchanges a wide range of information by generating and sensing small molecule chemical signals). In cases of insufficient density of asexual spores in the colony, this sporulation signal is not triggered, resulting in the loss of sporulation capacity; however, with time progression or enhancement of the initial density of the colony, this quorum-sensing signal is triggered and rapidly propagates within the colony, stimulating the entire group's sporulation.

      The physiological state of plants may provoke different disease resistance mechanisms. Ben-Naim & Cohen[24] , in their research on watermelon powdery mildew resistance, found that the resistance of certain materials inoculated with powdery mildew in the cotyledon stage is controlled by a pair of dominant genes, whereas, during the four-true-leaf stage, the plant's resistance is governed by three pairs of dominant genes. These findings indicate a close correlation between the seedling age of the plant and its disease resistance. In the current experiment, cucumber seedlings inoculated with pathogens at the one-true-leaf stage exhibited the lowest disease index, demonstrating significant disease resistance, while those at the two-true-leaf and three-true-leaf stages were severely afflicted, showing a significant increase in disease index. Therefore, it's hypothesized that cucumber, another cucurbitaceous crop like watermelon, may possess a similar resistance mechanism, wherein different genes mediate plant resistance to powdery mildew at different developmental stages, resulting in differing resistance in cucumber seedlings at different stages.

      Chlorophyll is a pivotal indicator of plant photosynthetic capacity and the SPAD value closely correlates with the plant chlorophyll content[25]. It was observed in this study that, at the same seedling stage, with the aggravation of the disease index, the SPAD value of cucumber materials in each treatment group significantly diminished, indicating that the powdery mildew treatment impeded the synthesis of chlorophyll in cucumber leaves, a conclusion congruent with the findings of Khan & Rizvi[3], on five kinds of cucurbitaceous crops infected with powdery mildew. Chlorophyll degradation is partly due to the disruption of chloroplast structure and may also be a result of chlorophyll's participation in the plant's immune response to pathogens[26,27]. Research conducted by Zhang et al.[27] indicates that the ethylene-mediated signaling pathway plays a role in cucumber resistance to powdery mildew, with its key regulatory factor, CsEIN, promoting chlorophyll degradation and ROS synthesis by upregulating chlorophyll-degrading enzyme genes (including CsNYE1, CsPPH, CsRCCR) and ROS synthesis enzyme gene (CsRBOHs), thereby promoting leaf senescence to enhance cucumber resistance to powdery mildew.

      Zhang et al.[28] pointed out that powdery mildew can inhibit the activity of key enzymes in the Calvin cycle, thereby reducing the production of photosynthetic products and subsequently weakening the plant's photosynthesis and affecting its growth and development. The present data support the results obtained by Zhang et al.[28], after inoculation with powdery mildew, with the increase in disease severity, the photosynthetic capacity of cucumber leaves decreased, resulting in a reduction of cucumber fresh weight and dry weight. Regarding the comparative research on inoculation methods, different scholars have drawn divergent conclusions. Wang et al.[13] inferred from their research that using the brush method for leaf inoculation can reduce the surface tension of the bacterial fluid, accelerate the disease onset, and hence is the optimal method for disease inoculation. Zhang et al.[29] however, opined that the spray method yields the highest infection rate and is simple to execute. This experiment, based on a single-factor analysis, found no significant differences among different inoculation methods. Therefore, the selection of the inoculation method should be based on experimental requirements. The spray method is the most convenient and is suitable for experiments with large quantities, reducing the operational difficulty, while brushing allows the powdery mildew fungus to be evenly spread on the leaf surface, enhancing the infection rate. Zhang et al.[30] found in rice that compared to the commonly used whole-plant pathogen inoculation method, the detached leaf inoculation method significantly enhances stability of the detection results. Deng et al.[31] also found in melon research that during detached inoculation, environmental conditions have relatively less influence and a single planting of melon seedlings can be used multiple times, yielding accurate and reliable resistance identification results. In cucumber, there is a dearth of research on the detached leaf inoculation method. This experiment also adopted the traditional whole-plant inoculation method to screen for resistance identification methods. However, during the experiment, it was found challenging to precisely control the environmental conditions after inoculating with powdery mildew, especially with increased sample size, substantial differences in temperature and humidity at different locations can lead to uneven disease occurrence in plants, impacting the accuracy of resistance identification. Therefore, future research can focus on the detached leaf inoculation method in cucumber to optimize the resistance identification system in cucumber.

    • In the current study, the most optimal indoor method for early-stage resistance determination against powdery mildew of cucumber was explored using a four-factor, three-level orthogonal experimental design and T3 (inoculating a spore suspension of powdery mildew at a concentration of 106 per mL on one-true-leaf stage using the leaf-brushing method and maintaining hydration for 12 h post-inoculation) proved to be the most favorable for the development of powdery mildew disease in cucumber at the seedling stage. Seedling age and spore suspension concentration had a greater influence on powdery mildew development in cucumber than the inoculation method and wetting time. The disease index of cucumber leaves inoculation with powdery mildew at the three-leaf stage increased by 62.34% compared to the one-leaf stage. Disease index of cucumber plants inoculated with 106 particles/mL spore suspension was 47.51% and 32.61% higher than those inoculated with 105 and 104 particles/mL spore suspensions. In addition, it was found that powdery mildew inhibits photosynthesis and reduces the chlorophyll content of cucumber leaves, which ultimately leads to a reduction in plant dry matter accumulation. This study lays a solid foundation for further breeding for powdery mildew resistance.

    • The authors confirm contribution to the paper as follows: Study conception and design: Miao L, Wang H; data collection: Tan J, Zhong L; analysis and interpretation of results: Fan S, Cheng S, Gao Y; draft manuscript preparation: Tan J, Zhang P. All authors reviewed the results and approved the final version of the manuscript.

    • All data generated or analyzed during this study are included in this published article.

      • This study was supported by the National Natural Science Foundation of China (32202511), the Taishan Program of Shandong Province (Grant tsqn202306246), the Major Science and Technology Project of Plant Breeding in Zhejiang Province (2021C02065-2), the 'Pioneer' and 'Leading Goose' R&D Program of Zhejiang (2022C02051, 2023C02027), the Natural Science Foundation of Zhejiang Province (LY24C150002), College Student's Science and Technology Innovation Activity Plan of Zhejiang Province (Xinmiao Talent Project) (2022R412B047, 2023R412051).

      • The authors declare that they have no conflict of interest.

      • # Authors contributed equally: Jihong Tan, Liping Zhong

      • Copyright: © 2024 by the author(s). Published by Maximum Academic Press, Fayetteville, GA. This article is an open access article distributed under Creative Commons Attribution License (CC BY 4.0), visit https://creativecommons.org/licenses/by/4.0/.
    Figure (5)  Table (4) References (31)
  • About this article
    Cite this article
    Tan J, Zhong L, Fan S, Cheng S, Gao Y, et al. 2024. Methods for seedling identification of cucumber resistance to powdery mildew and its effect on the growth of cucumber seedlings. Vegetable Research 4: e030 doi: 10.48130/vegres-0024-0028
    Tan J, Zhong L, Fan S, Cheng S, Gao Y, et al. 2024. Methods for seedling identification of cucumber resistance to powdery mildew and its effect on the growth of cucumber seedlings. Vegetable Research 4: e030 doi: 10.48130/vegres-0024-0028

Catalog

  • About this article

/

DownLoad:  Full-Size Img  PowerPoint
Return
Return