


-
Brazil is the world's leading producer and exporter of coffee and the coffee industry contributes a total of US
${\$} $ For any new coffee plantations, the selection of cultivars most suitable for the local environment and cropping system needs careful consideration and planning. This is because coffee is a perennial crop with a lifespan of 15 to 25 years and a large investment is necessary to establish a new plantation[3]. In addition, the introduction of new cultivars often requires changes to crop management practice which is usually associated with additional labor or equipment and the input of additional resources. In other cases, farmers may also be culturally attached to traditional varieties and thus are hesitant to accept cultivars that they do not know[4]. These factors influence the adoption of new cultivars by coffee farmers who may prefer to use known cultivars that have a predictable performance[4,5].
The coffee cultivar 'Mundo Novo' was discovered in the 1940s in Brazil when the demand for cultivars was focused on high productivity[6]. Phenotypically, 'Mundo Novo' has an excellent vegetative vigor, large number of branches, and a well-developed root system, which contributes to high yields and adaptability[7,8]. These favorable characteristics made 'Mundo Novo' one of the most popular cultivars widely grown by coffee producers in Brazil, and the cultivar remains popular today[9,10].
However, the demand for specialty coffee is rapidly increasing across domestic and international markets where consumers seek exceptional taste and aroma as well as balanced characteristics of sweetness, acidity and body[11]. Productivity is no longer the single dominant factor determining cultivar adoption by coffee producers. The sensory quality of 'Mundo Novo' marginally fits into the category of gourmet coffee[12,13]. In contrast, cultivars such as 'Maragogipe'[7], 'Bourbon'[14], 'Pacamara'[12] and 'Geisha'[15], have been recognized in the specialty coffee market because of their superior cup quality.
Breeding new cultivars for dual high-yield, higher-cup quality is technically challenging, because there are complicated factors involved in cup quality[16]. Both genetic[17] and environmental[18] factors affect the plant's physiological processes, which determine the formation of a broad array of chemical compounds in different combinations and amounts[19]. Moreover, good cup quality is a result of proper post-harvest processing and roasting, which affects the formation of volatile and non-volatile compounds that are important for coffee aroma and flavor[20,21].
Non-volatile organic compounds are produced in multiple phases of coffee production, from green (raw) beans to the brewed coffee we consume. Studies have shown that some non-volatile compounds make up the taste or flavors[22].
The grading and classification of coffee in the global market are based on multiple criteria: the roast appearance and cup quality (flavor, flagrance, acidity, and body), bean physiognomies (size, shape and color), the density of beans and number of defects[23]. This complexity, with the addition of other agronomic traits, such as yield, disease resistance, and stability, make it difficult for breeders to meet multiple breeding objectives simultaneously.
On the other hand, a significant amount of intra-cultivar variation exists in Arabica coffee, even though C. arabica is a predominantly reproduced via self-pollination[24−27]. This intra-cultivar variation was mainly due to the accumulation of mutations and residue heterozygosity[24,25]. In addition, outcrossing is commonly found in Arabica coffee, which also contribute to intra-cultivar variability in some cultivars[28]. These intra-cultivar variations have been explored by coffee breeders to select new cultivars with high yields and improved disease resistances. For example, Gichimu[29] reported the existence of a significant yield variation among 'Ruiru 11' siblings and practiced intra-cultivar selection for high yields. Tassone et al.[10] took advantage of the intra-cultivar variation in 'Mundo Novo' and selected promising progenies with high yield capacity, bean size, plant height, upper and lower canopy diameter, stem diameter and plant vigor. Nonetheless, so far, few studies have been carried out on the utilization of intra-cultivar heterogeneity to improve cup quality.
The present study aims to select genotypes with a superior cup quality from the progenies of a traditional cultivar 'Mundo Novo', to develop a new germplasm with specialty coffee quality and wide adoption. A combined approach of sensory testing, biochemical analysis and SNP genotyping was performed to assess cup quality, chemical composition and verify the genetic background of the putative progenies of 'Mundo Novo'. The identified selections have a superior beverage quality, demonstrating their potential for direct adoption for breeding cultivars with improved cup quality. This information provides a good example of the rapid identification of promising coffee genotypes by the exploration of intra-cultivar genetic diversity in Arabica coffee.
-
To verify the genetic potential for cup quality, 14 seven-year-old coffee genotypes were used as single plants, derived from a single mother tree of 'Mundo Novo' at the Sítio Gabriela. The experimental site is in the municipality of Inconfidentes, located in southwestern region of Minas Gerais, Brazil. The average annual rainfall in the municipality is 1,471.6 mm, with wet summer and dry winter seasons[30]. The location is in a section of the 'Serra da Mantiqueira' that is part of the Atlantic Forest Biome[31]. The altitude of the property is 1007 (m.a.s.l) and the soil is classified as a sandy clay.
The genotypes were selected by mass selection within a stand of the 'Mundo Novo IAC 376/4' cultivar based on their phenotypic variations among the progenies. The selected plants stood out in terms of vigor, bud color and large red fruits with a high percentage of grains retained in sieves equal to or greater than 16 (in an evaluation carried out in 2015, where the progenies obtained an average of 91.4% and the control cultivar 'Mundo Novo' obtained 81% - Supplemental Table S1). The original experiment was installed in December 2009 with a spacing of 1.5 m between plants and 2.5 m between rows. The implementation and management were carried out in accordance with regional technical recommendations for the coffee crop.
Phenotypical data
-
For the phenotypic characterizations, the vegetative growth of the single 14 genotypes was evaluated over 12 consecutive months (from September 2018 to August 2019). For that, four branches of the middle third of each genotype were selected and particular characteristics of the aerial part of the plant were chosen. The morphological characteristics evaluated were the stem diameter (cm), the plant height (cm), the length of plagiotropic branches (cm) and the number of nodes for each plagiotropic branch.
Sensory analysis
-
Of the total 14 genotypes evaluated, only six single plants had enough fruit production to carry out the sensory analyses. The fruits were collected in the cherry stage, by selective harvesting, followed by drying by natural processes (described below). Two additional cultivars, 'Catuaí Vermelho IAC 99' and 'Mundo Novo IAC 376/4', from the same property were included in the analysis as controls. The fruits were harvested in 2019 and, within six hours after beginning the processing, they were taken to a concrete yard and evenly distributed on sieves (with wooden frames and wire mesh with 2.00 mm × 1.00 mm diameter openings), while maintaining separate samples. The samples were considered dried when the grains reached a moisture content of 11% to 12%. Then, the samples of dried coffee cherries, from natural processes were further processed (dehusked) and sent for laboratory analysis.
Sensory analysis was performed by three accredited tasters, according to the methodology proposed by the Specialty Coffee Association (SCA)[32], corresponding to three repetitions. The roasting process complied with the Agtron 'Gourmet' scale (63). According to this methodology, each attribute evaluated (fragrance/aroma, flavor, aftertaste, acidity, body, balance, sweetness, uniformity, cleanliness and scoring) receives grades from 0 to 10, according to the intensity in the samples based on the terminology presented by Lingle[33]. According to the SCA classification, coffee samples that achieve a score of less than 80 points do not qualify as special, 80 to 84.99 are classified as very good, 85 to 89.99 as excellent and above 90 points is considered exceptional.
Chemical analysis
-
The physical-chemical analysis was carried out at the 'Empresa de Pesquisa Agropecuaria de Minas Gerais' (EPAMIG) Laboratory 'Dr. Alcides Carvalho', in the municipality of Lavras, MG. From each of the collected samples, four replicates were performed, characterizing laboratory quadruplicates. Moisture content was determined by the oven method at 105 ± 1 °C for 16 ± 0.5 h, according to the international standard method of ISO 6673[34]. The grain samples from the plants were ground for about one minute in a mill model TE 631/2, brand Tecnal. After grinding, they were placed in plastic containers and stored in a freezer at a temperature of −18 °C, until the analysis was performed.
The non-volatile compounds such as trigonelline, chlorogenic acid, 5-caffeoylquimic acid (5-CQA) and caffeine were determined by High Performance Liquid Chromatography (HPLC), according to a methodology adapted from Vitorino et al.[35] by Malta & Chagas[19]. Samples of ground roasted coffee (0.5 g) were extracted with 100 mL of boiling distilled water, stirring for 3 min in a water bath at 100 °C. The system is coupled to a Shimadzu UV/visible spectrophotometric detector (model SPD-10A) connected by an interface (CBM-101) to a microcomputer for data processing. The analysis conditions used were 1 mL·min−1 flow; mobile phase: methanol, water, and acetic acid (20:80:1); room temperature; wavelength 272 nm. The concentration of compounds was determined by the relationship between the peak areas of caffeine, trigonelline, and chlorogenic acid in the sample and their respective Sigma standards known concentrations.
Total sugars were determined by the Antrone method[36]. Lipid content was quantified by extraction with ethyl ether in a Soxhlet apparatus[37]. Polyphenols were hotly extracted by the method of Goldstein & Swain[38]. Protein determination was performed using the method of AOAC. Polyphenol oxidase enzymatic activity (U·min−1·g−1 of sample) was detected using the method adapted by Carvalho et al.[39]. The electrical conductivity was determined by the method proposed by Loeffler et al.[40]. Potassium ion leaching was determined according to the method of Prete[41].
SNP genotyping for verification of genetic identity
-
For verification of genetic identity using SNP genotyping, fully expanded leaves at the third pair were collected from plagiotropic branches from the middle third of coffee plants. The leaves were placed in 50 ml Falcon-type polypropylene tubes, with samples individually separated for each of the 14 genotypes. The same process was carried out for 62 accessions collected in the active germplasm bank (BAG) of the EPAMIG. These accessions were included to serve as candidate parents and reference cultivars for the 14 SGAB genotypes.
For DNA extraction, the coffee leaves were pulverized, using liquid nitrogen, and soon after, 200 mg of plant material was stored in 2 ml 'Eppendorf' tubes. The DNA extractions were performed according to the protocol CTAB described by Healey et al.[42], with this change in the volume of plant material. Quantity and quality analysis were performed using a Nanovue® spectrophotometer (NanoVue GE Healthcare). 1.5 μL of each sample were used, observing the DNA concentration and the purity ratios at A260/280 and A260/230, prioritizing values between 1.8 to 2.0 for the two ratios. Subsequently, the samples were sent to the Laboratory of Sustainable Perennial Crops, United States Department of Agriculture, Agricultural Research Service (USDA – USA).
A core set of 96 SNP markers was used for genotyping. These SNPs were selected from the published SNP sequences by Merot-L'anthoene et al.[43]. The detailed information, including criteria of validation, selected SNPs and their flanking sequences, were presented in Zhang et al.[44]. The Fluidigm nanofluidic genotyping system (South San Francisco, CA, USA) was used to evaluate the putative SNP markers for genotype identification. The Assay Design Group at Fluidigm Corp. (South San Francisco, CA, USA) designed and manufactured the putative SNP primers for competitive allele-specific PCR, enabling bi-allelic scoring of SNPs at specific loci (KBioscience Ltd, Hoddesdon, UK).
SNP genotyping was performed using the Fluidigm 96.96 Dynamic ArrayTM (Fluidigm, San Francisco, CA, USA). Each 96.96 Dynamic Array can run 96 samples against 96 SNP assays generating a total of 9.216 data points in a single experiment. One key feature of this protocol is the inclusion of a specific targeted amplification (STA) reaction[45], which allows the enrichment of template molecules for each individual Integrated Fluidic Circuit® (IFC) reaction that facilitates the multiplexing during genotyping. An advantage to STA is that it allows the use of limited or low-quality DNA samples and reduces bias that may occur when samples are loaded to the 96 sample wells of the IFC. Because coffee leaf tissues contain high levels of polysaccharides and polyphenolic compounds that can potentially inhibit PCR amplification, the STA step is strongly recommended. The STA reaction was performed as described in the Fluidigm SNP Genotyping User Guide, PN 68000098 Rev I1[46]. The STA master mix consisted of 2.5 µL of TaqMan® Taq polymerase (Life Technologies, Carlsbad, CA, USA), PreAmp Master Mix (2×), 1.25 µL of Pooled assay mix (0.2×), and 1.25 µL of genomic DNA for a total reaction volume of 5.0 µL. PCR was performed with an initial denaturation step of 95 °C for 10 min, followed by 14 cycles of a 2-step amplification profile consisting of 14 sec at 95 °C and 4 min at 60 °C. The resulting amplified DNA was then diluted 1:5 in TE buffer in order to reduce the concentration of any remaining PCR by-products. Samples were then genotyped using the nanofluidic 96.96 Dynamic ArrayTM IFC (Integrated Fluidic Circuit; Fluidigm Corp.). The 96.96 Dynamic Array IFC for SNP genotyping was described by Wang et al.[45] End-point fluorescent images of the 96.96 IFC were acquired on an EP1TM imager (Fluidigm Corp.). The data was recorded with Fluidigm Genotyping Analysis Software (Fluidigm, San Francisco, CA, USA).
Statistical analysis
Phenotypical traits
-
The analysis of stem diameter, plant height, length of plagiotropic branches and number of nodes for each plagiotropic branch, 1st degree linear regression equations were adjusted for each plant and confidence intervals for the parameters of the equation, intercept and regression coefficient were obtained. The parameters of the equations were compared, to verify if the intercept and the regression coefficient were different for the evaluated plants. Comparisons were made between plants, two by two. For each pair of plants, the following regression models were used.
Plant 1: Y1i = β01 + β11 Xi + e1i
where: Y1i is the observed value of plant 1 in month i, with i = 1, 2, …, 12; β01 is the intercept of the equation for plant 1, which represents the value of the response variable in month 0, that is, when the straight line passes through the y axis. This value represents the initial value of the response variable; β11 is the regression coefficient, which represents the slope of the line. It can be interpreted as the growth rate of the response variable, that is, the higher its estimated value, the greater the increase in the response variable over time; Xi refers to the month of assessment, where Xi = 1, 2, …, 12, for i = 1, 2, …, 12; respectively; e1i is the random error associated with each observation Y1i, where e1i ~N(0,σ2 ).
Plant 2: Y2i = β02 + β12 Xi + e2i
where: Y2i is the observed value of plant 2 in month i, with i = 1, 2, …, 12; β02 is the intercept of the equation for plant 2, which represents the value of the response variable in month 0, that is, when the straight line passes through the y axis. This value represents the initial value of the response variable; β12 is the regression coefficient, which represents the slope of the line. It can be interpreted as the growth rate of the response variable, that is, the higher its estimated value, the greater the increase in the response variable over time; Xi refers to the month of evaluation, with, for, respectively; e2i is the random error associated with each observation Y2i, where e2i ~N(0,σ2).
After adjusting the equations, the estimated values and confidence intervals (CI) obtained for each parameter of the equation were used to compare the parameters of the equations two by two: (i) for each pair of plants, the intercepts were compared, that is, the initial values of the plant response variables. Thus, CI were used to check whether β01 = β02. The results were summarized in a table, using equal letters for equal parameters. Plants with higher β0's are those with higher initial values of the response variables; (ii) for each pair of plants, the regression coefficients were also compared, that is, the rates of increase ('growth') in the variable responses of the plants over time. Thus, CI were used to check whether β11 = β12. The results were summarized in a table, using equal letters for equal parameters. Plants with higher β1's are those that showed higher increases or 'growth' rate in the values of the response variables over time.
Chemical and sensory analysis
-
Univariate analyses for chemical and sensory data were performed with the GENES software[47] and, if significant differences were detected by the analysis of variance, the Scott-Knott[48] test was used to compare the means.
For the chemical variables, principal component analysis was performed, and Pearson's correlation coefficients were calculated to evaluate the relationship among these variables.
SNP data analysis
-
Population structure of the coffee samples was determined using a model-based Bayesian cluster analysis software STRUCTURE v2.3.4[49]. Admixture model was used, and the analysis was carried out without assuming any prior information about the genetic groups or geographic origins of the samples. Ten independent runs were assessed for each fixed number of clusters (K value) ranging from 1 to 10, with a burn-in length of 50,000 followed by 100,000 iterations. The most probable number of clusters was detected using the methods of Evanno et al.[50] as well as the method of Puechmaille[51]. The computation was performed using the on-line program STRUCTURE SELECTOR[52]. For the Puechmaille method, the mean membership threshold value was set at 0.5. The software CLUMPP 1.1[53] was used to find optimal alignments of independent runs and the output was used directly as input into a program for cluster visualization DISTRUCT 1.1[54].
To illustrate the genetic relationships among germplasm groups and sub-groups, distance-based multivariate analysis was performed on the individual data. A cluster analysis using the UPGMA (Unweighted Pair Group Method with Arithmetic Mean) was performed to further examine the genetic relationship among the SGAB genotypes with other reference cultivars, including 'Mundo Novo'. Pairwise genetic distance based on proportion of shared alleles was determined following the program MICROSATELLITE ANALYZER[55]. UPGMA dendrogram was generated from the resulting matrix of Nei's distance using the computer program PHYLIP version 3.697 (
http://evolution.genetics.washington.edu/phylip.html ). The dendrogram was visualized with the program FigTree v1.4.3 (http://tree.bio.ed.ac.uk/software/figtree/ ). -
The result of sensory characterization is shown in Fig. 1. Only six out of the 14 genotypes produced sufficient cherries for sensory analyses. All six tested SGAB genotypes were classified as specialty coffee following SCA protocol[32]. Among them, SGAB 7 was ranked as the best genotype, with a sensory score of 87.50, thus was rated as excellent cup quality. All six genotypes, except SGAB 13, had a sensory performance score significantly higher than the controls ('Catuaí' and 'Mundo Novo'), thus were classified as excellent or exceptional according to the SCA's protocol. Description of the sensory profile is presented in Table 1, which was based on the nuances identified by the Q-graders (Tasters) in an evaluation carried out by the cup tasting. These genotypes presented floral and fruity notes characteristics that present high scores and categorized as excellent or exceptional quality. Several other nuances in different intensities were also identified.
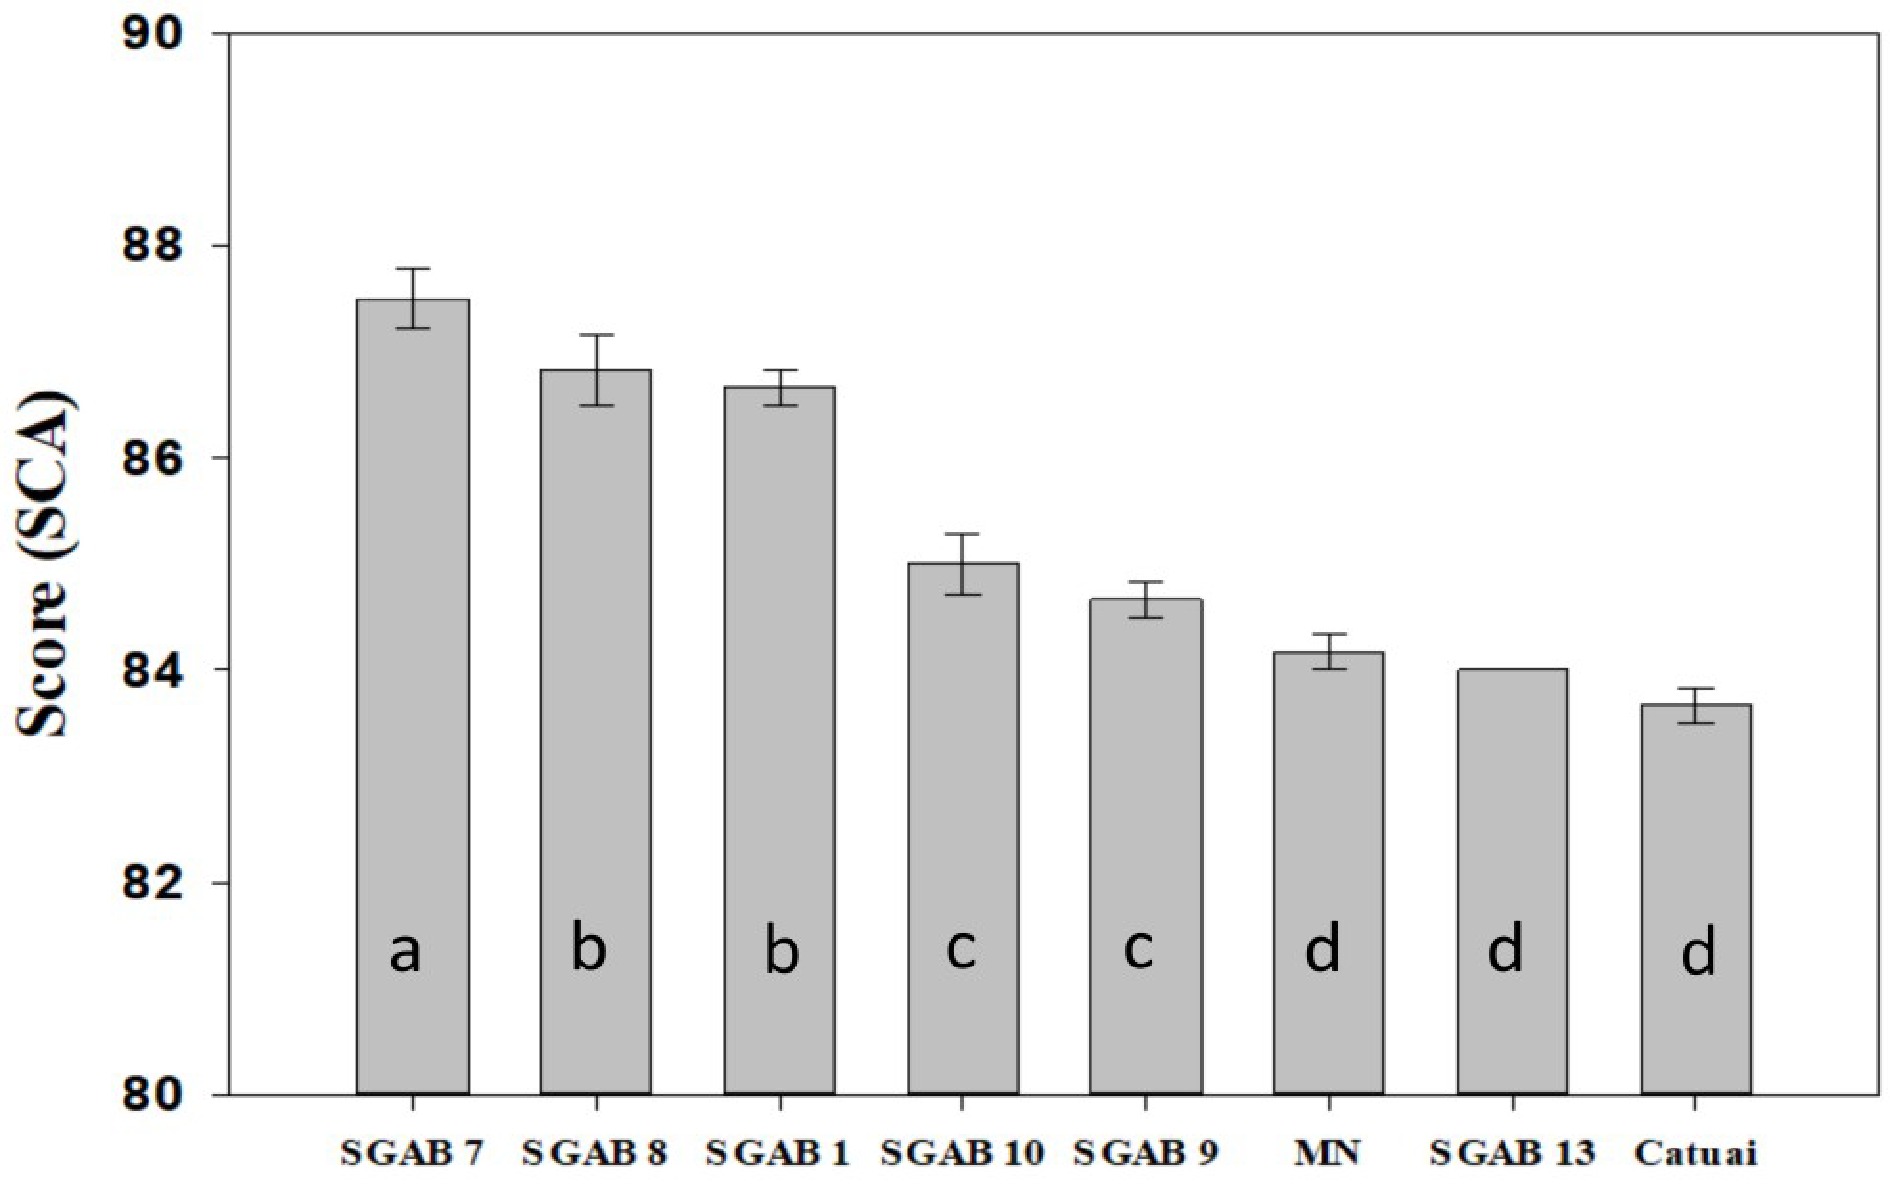
Figure 1.
Total score according to the SCA methodology, obtained in univariate sensory analysis for six genotypes and two control cultivars ('Catuaí Vermelho IAC 99' and 'Mundo Novo IAC 376/4' - MN) referring to the 2018/2019 crop year. Means followed by the same letter do not differ by the Scott Knott test (1974) (P < 0.05).
Table 1. Nuances identified by three tasters based on the methodology described by SCA using the six coffee genotypes provided and two control cultivars.
Genotypes Sensory description SGAB 7 Vivid acidity, creamy and soft body, floral, honey, Swiss lemonade, fruity, long and sweet finish. SGAB 8 Vivid and sweet acidity, creamy and soft body, yellow fruits, floral, honey, brown sugar, long and sweet finish. SGAB 1 Bright and lively acidity, creamy and velvety body, floral flavor, yellow fruits, honey, molasses, brown, long and pleasant finish. SGAB 10 Sweet acidity, creamy body, brown, caramel, long finish. SGAB 9 Vivid acidity, creamy body, high sweetness, honey, caramel, milk chocolate, long and pleasant finish. Mundo Novo IAC 376/4 Sweet acidity, creamy body, high sweetness, yellow fruit, caramel, brown, milk chocolate, long finish. SGAB13 Medium acidity, creamy body, caramel, milk chocolate, brown, long and sweet finish. Catuaí Vermelho IAC 99 Medium acidity, creamy body, clean, caramel, milk chocolate, brown, long finish. Source: adapted from Nadaleti[56]. In cup tastings, a score higher than 85 requires a greater harmonization of the qualities presented by the coffee (bean quality, chemical composition, roasting processes, grinding and others). Therefore, it is very difficult to reach the high score and be categorized as excellent and exceptional. Consequently, coffees that reach scores above 90 stand out and receive the highest market prices[16]. In the present study, we observed significant intra-cultivar variation of cup quality among the six tested SGAB genotypes, which are putative progenies of 'Mundo Novo', a popular traditional variety in Brazil. Among them, the genotypes SGAB 1, SGAB 7 and SGAB 8 qualify as excellent with unique attributes, such as floral and fruity determinants, which contributed to their superior cup quality.
Physiological parameters
-
Significant phenotypic variation was observed among the 14 SGAB genotypes evaluated from the seven years old trees. These traits included: length of the plagiotropic branches; number of nodes in the plagiotropic branches; stem diameter and plant height (Supplemental Table S2). The length ranged from 0.39 to 0.77 m. The number of nodes range from 12.96 to 27.64. The same occurred with stem diameter and height, with variations from 0.26 to 0.57, and 2.76 to 3.65 m, respectively. Likewise, the increments showed variation and changes in genotype rankings (Supplemental Table S2). As for the length of plagiotropic branch, the SGAB 7 genotype differed significantly from the others (Fig. 2a), with an average increase rate of 0.006. The genotype SGAB 13 obtained increment values among the smallest both for stem diameter, 0.001, and height, 0.008 (Fig. 2c). Lower stem and height growth may be a consequence of the plant's difficulty in taking advantage of nutrients, as well as a possible negative interaction with environmental factors in the past cropping years. Growth values among the highest for all variables were observed in relation to genotype SGAB 4. The highlight was for the variable height with 0.036 increment, showing the highest value (Fig. 2d). This fact may represent a greater plasticity and greater capacity for homeostasis of this material, which obtained performance within the highest growth values for the observation period.
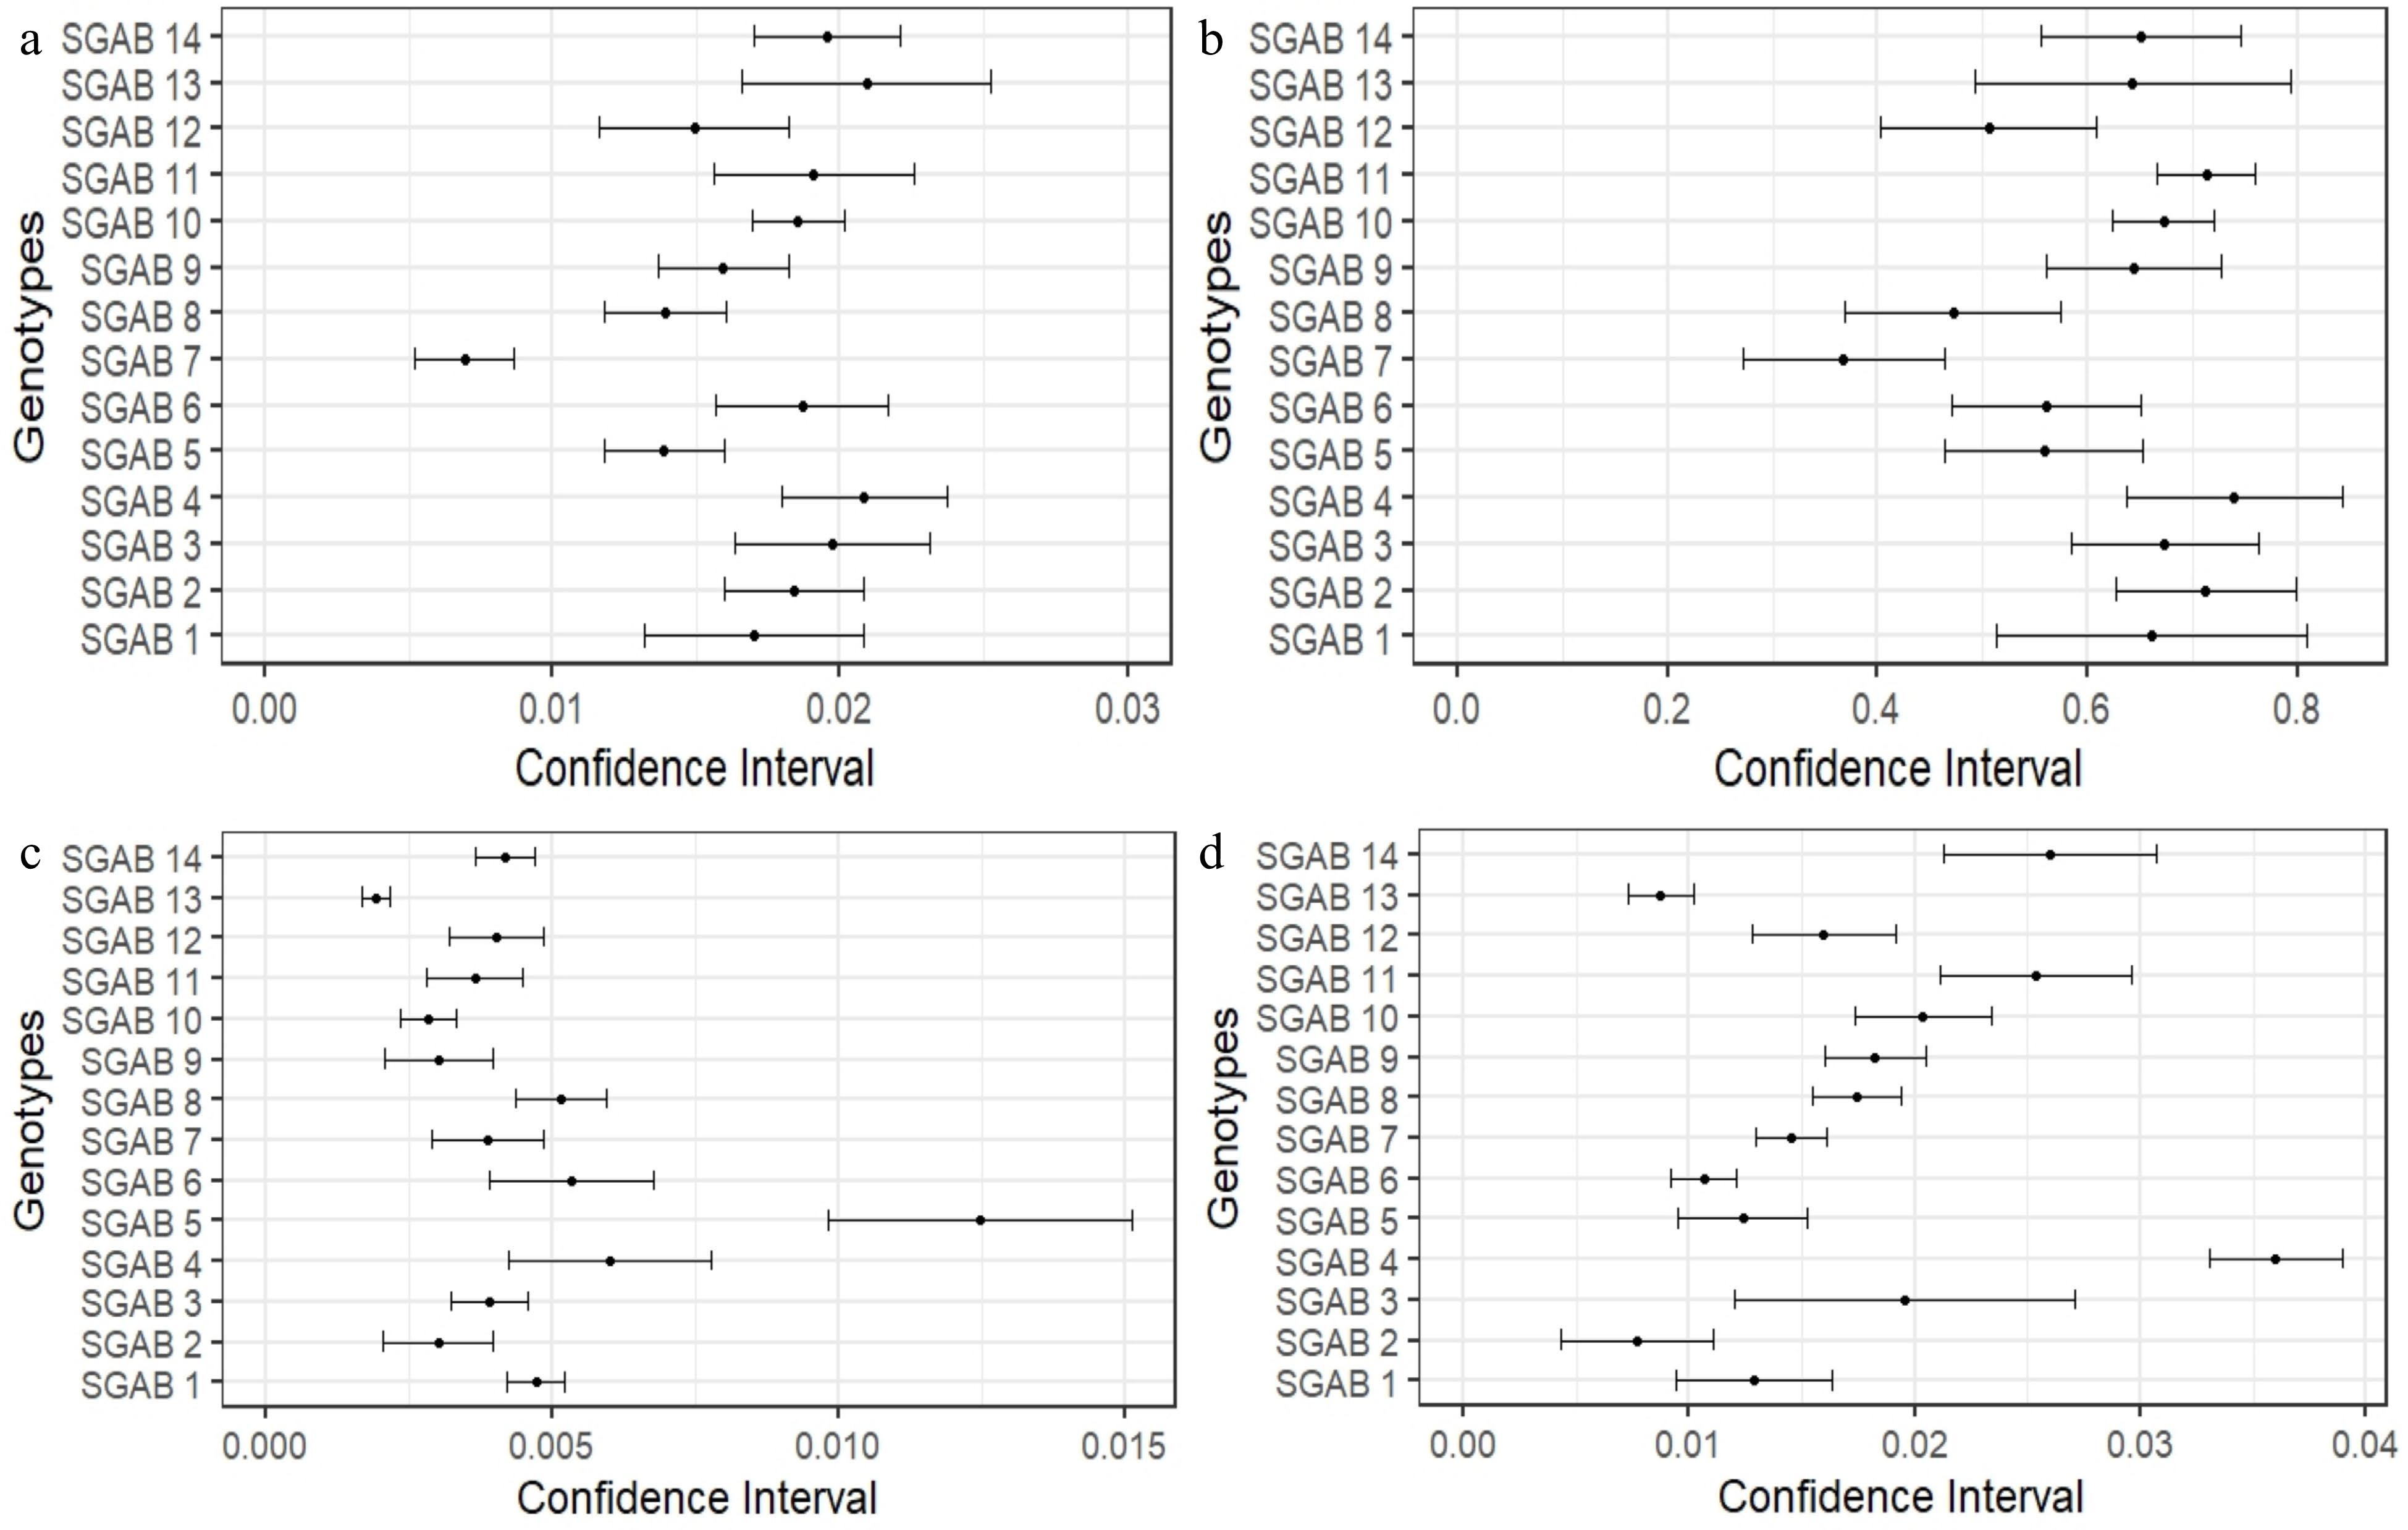
Figure 2.
Confidence interval (95%) of β1's estimates (linear regression coefficients - slope) for the variables (a) branch length, (b) number of nodes, (c) stem diameter and (d) plant height in 14 genotypes of C. arabica. Confidence interval values that are not overlapped indicate that estimates differ statistically from each other (Supplemental Table S3).
Chemical analysis
-
Chemical analyzes were performed for six genotypes and two control cultivars ('Catuaí Vermelho IAC 99' and 'Mundo Novo IAC 376/4'). The contents of trigonelline, 5-CQA chlorogenic acid, caffeine, total sugars, lipids, polyphenols, and proteins were quantified, as well as the enzymatic activity of polyphenol oxidase, electrical conductivity and potassium leaching. Based on analysis of variance and subsequent mean comparison, using Scott-Knott test, significant difference was found among the genotypes for nine out of the ten variables (Table 2).
Table 2. Chemical characterization of six genotypes and two control cultivars ('Catuaí Vermelho IAC 99' and 'Mundo Novo IAC 376/4') related to the 2018/2019 crop year.
Genotype EC LK TS PPO POL P L Trig CA C SGAB7 34.20 d 28.49 f 7.96 d 46.50 a 6.38 b 11.68 b 12.91 a 1.13 b 3.91 c 1.16 c SGAB8 41.09 b 46.02 b 8.51 c 44.08 a 6.31 b 12.29 a 10.62 b 1.15 b 3.84 c 1.17 c SGAB1 37.40 c 30.71 e 8.90 b 45.30 a 7.10 a 11.65 b 12.79 a 1.17 b 3.69 d 1.07 d SGAB10 39.68 b 43.06 c 9.40 a 44.43 a 6.15 b 12.56 a 10.61 b 1.09 b 3.74 d 1.25 b SGAB9 55.02 a 56.87 a 9.28 a 45.41 a 5.85 b 12.53 a 10.86 b 1.15 b 3.74 d 1.34 a Mundo Novo 376/4 43.08 b 36.17 d 8.55 c 45.54 a 7.32 a 12.24 a 10.44 b 1.42 a 5.23 a 1.36 a SGAB13 41.6 b 42.76 c 8.69 c 42.44 a 6.02 b 12.20 a 12.18 a 1.06 b 3.91 c 1.27 b Catuaí Vermelho IAC 99 32.18 e 25.73 g 8.30 c 47.92 a 5.70 b 12.16 a 10.64 b 1.12 b 4.27 b 1.11 d EC, Electrical Conductivity; LK, Potassium Leaching; TS, Total Sugars; PPO, Polyphenol oxydase; POL, Polyphenols, P, Proteins; L, Lipids; Trig, Trigonelin; CA, Chlorogenic Acid; C, Caffeine. Different letters represent statistical significance according to Scott-Knott test. Regarding trigonelline content, the cultivar 'Mundo Novo IAC 376/4' had the highest value of 1.42 which is significantly different from the other accessions. However, 'Mundo Novo IAC 376/4' had the lowest score of cup quality (83.7−84.2). In contrast, the genotype SGAB7 had a trigonelline content of 1.13, received the highest score for cup quality (87.5). Trigonelline is the second most important alkaloid next to caffeine and it is one of the main flavor precursors in coffee[57−59]. The present result suggests that in Arabica coffee genotypes, the trigonelline content may not have a simple relationship with sensory quality. In addition, it is possible that there is a significant genotype x environment interaction for trigonelline content in the arabica coffee used in this experiment. Relationship between the two variables, as revealed by the present study, could be site specific.
Cultivar 'Mundo Novo IAC 376/4' also had the highest content of 5-CQA chlorogenic acid of 5.23%, which is significantly higher than all the six SGAB genotypes (Table 2). This result is compatible with the result of cup quality testing. During roasting, chlorogenic acids decompose to form caffeic and quinic acids, which are associated with astringency, bitterness and acidity in beverage[60]. Therefore, chlorogenic acids are strongly associated with low quality coffee, despite it is beneficial effect to human health as an antioxidant. Low chlorogenic acids content is one of the breeding objectives for improving the quality of Arabica coffee[61].
Caffeine content varies significantly among the tested genotypes, ranging from 1.07% to 1.36%, with Cultivar 'Mundo Novo IAC 376/4' having the highest caffeine content. This range of variation is consistent with previous reports[62−64]. The lower levels of caffeine content is a common goal for Arabica coffee breeding, because a high level of caffeine content is generally associated with inferior coffee quality.
The relationship among the chemical compounds was analyzed using principal component analysis and the biplot is presented in Fig. 3a. The first two principal components explained 67.03% of the total variation of chemical parameters and of the sensory score (41.08% for PC1 and 25.95% for PC2). The variables that contributed most to PC1 were proteins and potassium leaching, whereas for PC2, the variables 5-CQA chlorogenic acid and trigonelline were main contributors.
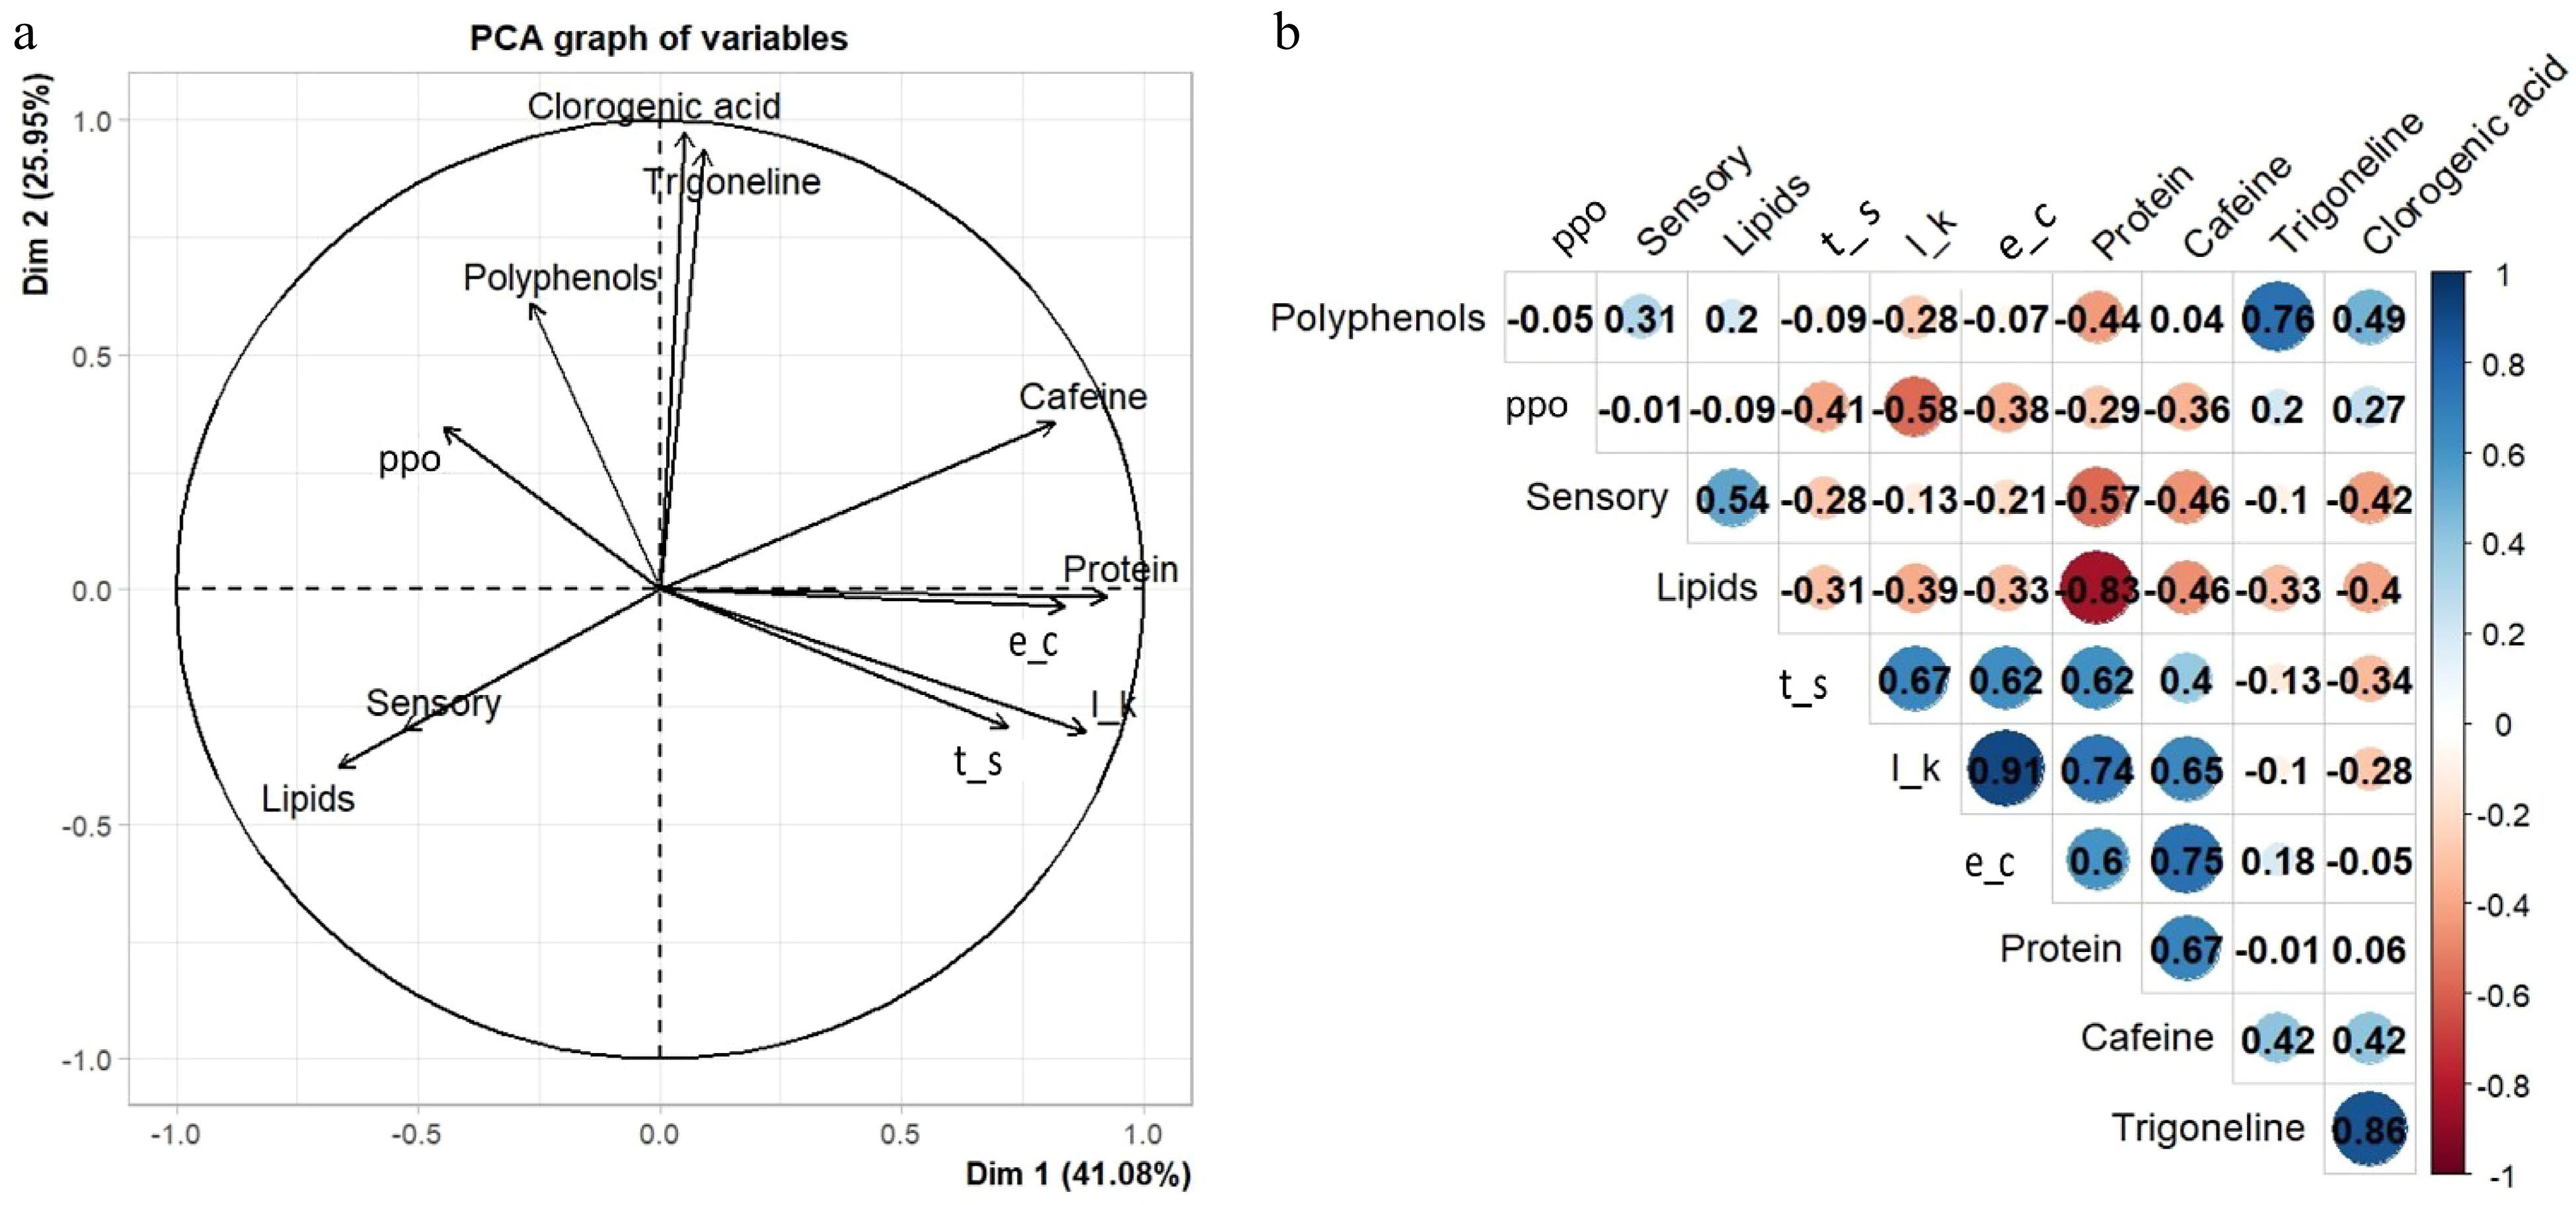
Figure 3.
(a) Principal components and (b) Pearson correlation analysis of chemical variables of six coffee genotypes evaluated. Polyphenol oxydase (ppo); Total Sugars (t_s); Potassium Leaching (l_k), Electrical Conductivity (e_c).
The data obtained were also subjected to estimates of Pearson's correlation coefficient (Fig. 3b). High correlations were found between the variables electrical conductivity and potassium leaching with proteins and caffeine, 0.60; 0.65 and 0.74; 0.65, respectively (Fig. 3b) as well as proximity between the biplot vectors for the same variables (Fig. 3a). The variable total sugars also had a high magnitude correlation with potassium leaching (0.67), electrical conductivity and proteins (both with 0.62). These compounds represented determinant variables in the composition of PC1. Low values of these compounds were observed in the genotypes with higher sensorial quality. This finding, in view of the above context, allows us to infer that this main component consists of variables that, at high rates, affect the cup quality.
In the correlation analysis (Fig. 3b), high correlation was observed among trigonelline, chlorogenic acid (5-CQA) with polyphenols (0.86 and 0.76, respectively), which is consistent with the proximity observed in their respective biplot vectors. Trigonelline and chlorogenic acids were the variables that most contributed to the formation of PC2, which were related to genotypes with lower sensory quality. Some key non-volatile compounds include alkaloids (caffeine and trigonelline) and chlorogenic acid (CGA). Both caffeine and CGA contribute to the bitter flavor, but CGA, which degrades rapidly and forms phenolic compounds, also produces astringent and acidic flavors[22].
Sugars are related to higher sensory beverage quality, especially sucrose, however this compound is also the largest carbohydrate transported in coffee phloem[65] being a source of energy and carbon skeletons for other structural molecules[66]. Genotype SGAB7 that obtained the highest score in sensory quality was the one that obtained the lowest levels of total sugars, which supports the hypothesis that sugars, instead of being accumulated, were directed to the synthesis of other molecules, which may be involved as the growth and development of the plant, and also in the cup quality.
As for the levels of lipids, a significant difference was found among the genotypes. The highest values were observed in genotypes SGAB 1, SGAB 7 and SGAB 13. Lipids are recognized as quality indicators[67] and for this reason, this variable presented a correlation of 0.54 (Fig. 3b) with the final sensory score and close proximity – which almost overlaps – of their respective vectors in the biplot (Fig. 3a). This is due to the lipid protection of the internal structures of the cells, which contributes to less volatilization of aromas during the roasting process.
The results found for the lipid component in genotypes SGAB 1 and SGAB 7 corroborate with lower index of electrical conductivity and potassium leaching, because the smaller the damage caused to cell membranes, the less solutes are leached and, consequently, the indices of electrical conductivity and leaching potassium will be smaller[68]. Therefore, the high positive correlation between these two variables was found (0.91), as well as the proximity of their respective vectors in the biplot (Fig. 3a & b).
The protein content varied from 11.65% till 12.56%. High protein contents have been associated with lower beverage quality[69]. In genotypes SGAB 7 and SGAB 1 that had the highest sensory scores, lowest protein content was found, differing from genotypes SGAB 9 and SGAB 10 that had high protein values and fit into the groups that had the lowest scores. Consistent with these results is the high negative correlation of −0.83 between the protein and lipid variables (Fig. 3b), as both have already been reported in the literature as indicators of opposite beverage quality.
The enzymatic activity of polyphenol oxidase (PPO) values ranged from 42.44 to 47.92 U·min−1·g−1 of the sample. Enzyme activity below 55.99 U·min−1·g−1 of the sample was associated with the lowest quality of the beverage[39], which was not observed in this study. According to the results, the evaluated genotypes did not differ significantly from the 'Mundo Novo IAC 376/4' cultivar in relation to PPO activity. The enzymatic activity of PPO had a negative correlation (−0.58) with the variable potassium leaching (Fig. 3b). The lower activities of this enzyme are related to the degradation of cell membranes due to the generation of quinones from the oxidation of phenols that react with this enzyme, decreasing its concentration[70]. In the situation of compromised cell structure, high levels of potassium leaching are observed, which justifies the negative correlation found.
The polyphenol contents were observed from 5.70% to 7.32%. Lower levels of polyphenols are associated with better maturation of coffee grain, consequently, better sensory quality. However, it was not the genotypes that reached the highest sensory scores that necessarily obtained the lowest concentrations of phenolic compounds, as in genotype SGAB 9 and 'Catuaí Vermelho IAC 99', because it was performed the selective harvesting in which all the fruits collected were mature.
Verification of the parent – progeny relationship
-
Based on the genotyping result of 96 SNP markers (Supplemental Table S4), the UPGMA dendrogram (Fig. 4a) depicted the relationship among the 14 SGAB genotypes and the 57 reference cultivars. Despite the segregation of morphological characteristics among the 14 genotypes, they all formed a tight sub-cluster based on SNP profiles, suggesting that they have a common parentage. The cultivar 'Mundo Novo 379/19' was closely grouped with the 14 SGAB genotypes, demonstrating the high similarity between parent and progenies. However, even the progenies supposed to be derived through self-fertilization, there is clear intra-cultivar variation as shown by the separated into small clusters (Fig. 4b).
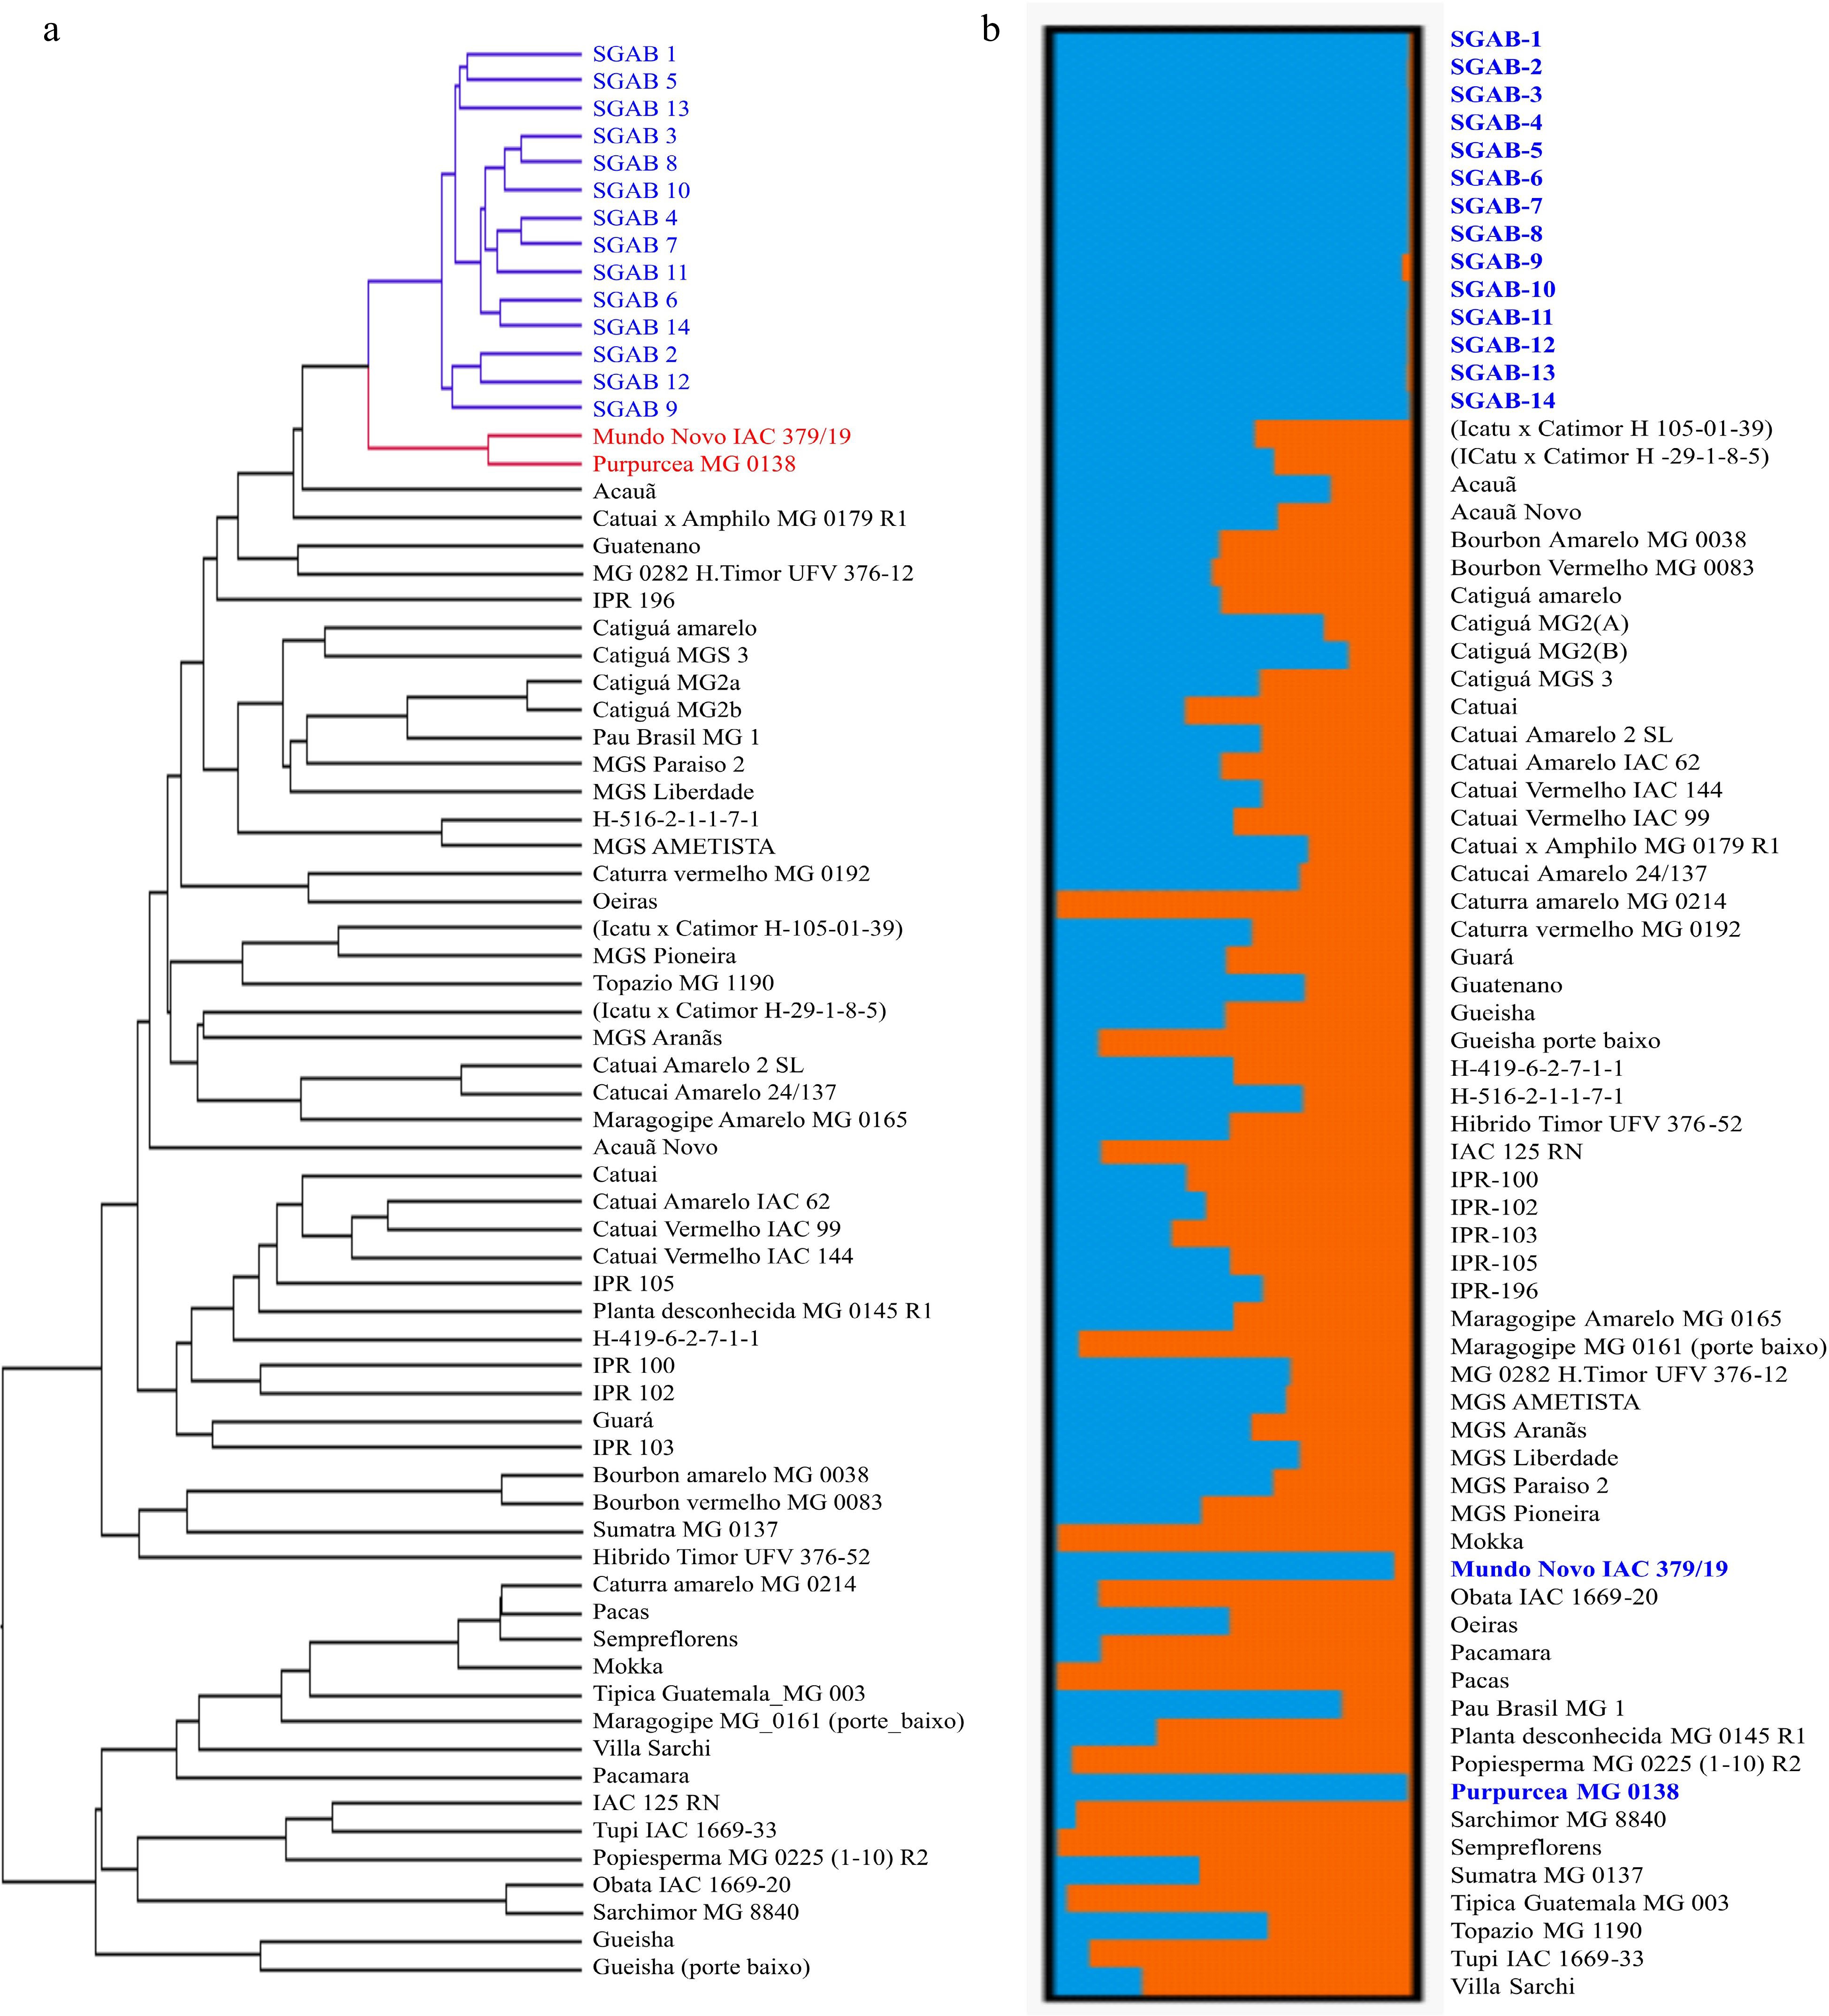
Figure 4.
(a) Genetic diversity and (b) structure population of SGAB coffee genotypes compared with EPAMIG coffee germplasm.
Another accession that closely grouped with the 14 SGAB genotypes is 'Purpuracea' (Fig 4a, b). 'Purpuracea' is a natural mutation of Maracaturra, which is the result of a natural cross of 'Maragogype' and 'Caturra'. The somatic mutation was conditioned by a pair of recessive genes (prpr) controlling leaf color. Plants that possess this mutation manifest in their young and adult leaves, stipulae and stems with a purplish tint[71,72]. The high genetic proximity between 'Mundo Novo' and 'Purpuracea' is expected, because the two cultivars share almost identical parentage in the Bourbon-Typica group. 'Mundo Novo' was selected from the cross of 'Bourbon' x 'Sumatra', whereas 'Purpuracea' was selected from the cross of 'Maragogype' x 'Caturra'.
Based on ∆K value computed by STRUCTURE HARVESTER, the 71 coffee accessions were partitioned into two clusters as the most probable number of K[50]. At a high assignment coefficient value (Q > 0.80), the first group (the blue bars in Fig. 4b) included 16 members, comprising the 14 SGAB genotypes, 'Mundo Novo' and 'Purpuracea'. This result is consistent with that depicted by the UPGMA tree, where 'Mundo Novo' and 'Purpuracea' grouped with the 14 SGAB genotypes and formed a tight sub-cluster. The second Bayesian cluster included 11 members (the orange bar in Fig. 4b), comprising 'Catimor', 'Sarchimor', and other accessions with introgressed background of 'Timor Hybrid'. The third category included 44 accessions that have an assignment coefficient (Q-Value) < 0.80, thus were classified as admixed genotypes between the first and the second clusters.
The intra-cultivar variation of the phenotypic traits as mentioned above is compatible with several previous reports in other Arabica coffee cultivars. Using SSR and AFLP markers, Tran[26] observed that even the elite cultivars of Arabica coffee, which have been exposed to intensive selection, still show a certain degree of genetic variation amongst individuals within each cultivar. Steiger et al.[25] analyzed genetic diversity among Arabica cultivars using AFLP markers and observed within cultivar variation in 'Typica', 'Mokka Hybrid', 'Catuaí/Caturra' and 'Catimor'. Gichimu[29] reported the existence of a significant yield variation among 'Ruiru 11' siblings. Specifically, Tassone et al. [10] explored the intra-cultivar variation in 'Mundo Novo' and selected progenies with high yield capacity, bean size, plant height, upper and lower canopy diameter, stem diameter, and plant vigor. Among all the selected traits, they obtained the highest selection gain in bean size (the percentage of beans retained in the sieve was 17). This type of variation was attributed to residual heterozygosity and out-crossing in Arabica coffee[25]. Indeed, outcrossing is not uncommon in Arabica coffee although the species is generally considered as an inbreeding species[73]. In some cultivars, the outcrossing rate can reach as high as 76%[28]. However, the possibility of outcross was excluded, judged by the UPGMA clustering analysis based on SNP genotyping (Fig. 4a). Despite the significant phenotypic variations, all the 14 progenies formed a tight sub-cluster, which closely grouped with 'Mundo Novo'. This result demonstrates that all the 14 SGAB genotypes have a common parent of 'Mundo Novo'. The molecular variation among the 14 genotypes, therefore, could be attributed to residual heterozygosity or mutations. Nonetheless, whole genome resequencing will need to be applied to these progenies to further understand the genetic basis of the intra-cultivar variation relating to phenotypic traits, including cup quality attributes. Specifically, a sample panel with diverse variation of quality-related traits, need to be included in future studies for genome-wide association analysis.
-
Intra-cultivar variation in the progenies of a traditional coffee cultivar 'Mundo Novo 379/19' was explored to select genotypes with superior cup quality. A total of 14 SGAB coffee genotypes, selected from the putative progenies of 'Mundo Novo 379/19' were evaluated for sensory attributes, chemical compositions, and agronomic traits. SNP markers were applied to verify their relationship with the putative parent 'Mundo Novo', together with 57 other as other reference cultivars from the coffee collection of EPAMIG, Brazil. The six SGAB coffee genotypes evaluated all showed a high sensory quality (sensory scores > 80), which enabled them to be classified as specialty coffee by the SCA standard and in the category of very good and excellent. The top three genotypes (SGAB 1, SGAB 7 and SGAB 8) were selected for future genetic improvement programs. This study demonstrates a good example of selecting dual high-yield, higher-cup quality performance cultivar from existing traditional varieties, using the approach combining field experiment, cup quality assessment, chemical analysis and SNP marker-based molecular characterization.
We thank Coordenação de Aperfeiçoamento de Pessoal de Nível Superior (CAPES), Conselho Nacional de Desenvolvimento Científico e Tecnológico (CNPq) and Instituto Brasileiro de Ciência e Tecnologia do Café (INCT/Café), under FAPEMIG grant (CAG APQ 03605/17). To Professor Vinicius Quintão Carneiro for the support in the statistical analysis of sensory and biochemical data. We would also like to give special thanks Stephen Pinney of USDA-ARS for SNP genotyping of the coffee samples.
-
Antonio Chalfun-Junior is the Editorial Board members of Journal Beverage Plant Research. He was blinded from reviewing or making decisions on the manuscript. The article was subject to the journal's standard procedures, with peer-review handled independently of these Editorial Board members and their research groups.
-
# These authors contributed equally: Gabriela Ester Ferraz, Marlon Enrique López
- Supplemental Table S1 Coffee bean granulometry of 14 coffe genotypes and two controls (Catuaí Vermelho IAC 99 and Mundo Novo)- Year 2015. *Values represented in percentages.
- Supplemental Table S2 Summary of genotypes parameters two by two comparison for the variables height, branch length, number of nodes per branch and stem diameter. The β0’s represent the initial values (intercepts) and the β1’s the increment of the values of the response variables over time (linear regression coefficients).
- Supplemental Table S3 Results of regression analysis of the estimates of β0’s (intercepts) and β1’s (linear regression coefficients – slope) for the variables plant height, branch length, number of nodes and stem diameter in 14 genotypes of C. arabica with 95% confidence interval.
- Supplemental Table S4 Result fo SNP genotyping on 14 'Mundo Novo' progenies and 57 reference accessions of Arabica coffee (Coffea arabica), using nano-fluidic array.
- Copyright: © 2023 by the author(s). Published by Maximum Academic Press, Fayetteville, GA. This article is an open access article distributed under Creative Commons Attribution License (CC BY 4.0), visit https://creativecommons.org/licenses/by/4.0/.
-
About this article
Cite this article
Ferraz GE, Lópes ME, Gonçalves FMA, Malta MR, Lima RRD, et al. 2023. Progeny selections of coffee cultivar 'Mundo Novo' with potential for the specialty coffee market. Beverage Plant Research 3:1 doi: 10.48130/BPR-2023-0001 

Progeny selections of coffee cultivar 'Mundo Novo' with potential for the specialty coffee market
- Received: 17 September 2022
- Accepted: 13 December 2022
- Published online: 06 January 2023
Abstract: Coffee is one of the most popular beverages in the world with a global market worth over
-
Key words:
- Sensory analysis /
- Cup quality /
- Molecular markers /
- Genetic variability /
- Coffea arabica