ARTICLE   Open Access    

Nutrient enhanced reclamation promoted growth, diversity and activities of carbon fixing microbes in a coal-mining subsistence land

More Information
  • Carbon-fixing microbes can potentially improve soil fertility. However, the potential and function of carbon-fixing microbes remains largely uninvestigated in reclaimed soil of coal-mining subsidence areas. In this study, treatments included UL (uncultivated land), CK (maize cultivation without fertilization), NPK (maize cultivation with chemical fertilizer), M (maize cultivation with manure), MNPK (maize cultivation with manure and chemical fertilizer) after 1-year reclamation in a typical coal mining subsidence area. Quantitative PCR, enzyme-linked immunosorbent assay (ELISA) and high-throughput sequencing were employed to investigate the topsoil carbon-fixing microbial biomass, RubisCO activity and community composition. The results showed that the dominant taxa (i.e., Proteobacteria, Cyanobacteria, Devosia and Marichromatium) were significantly changed after reclamation (P < 0.05). Carbon-fixing microbial community structure in fertilization treatments (NPK, M and MNPK) obviously differed from non-fertilizer treatments (UL and CK). Soil organic carbon and microbial biomass carbon were significantly higher in fertilization treatments than non-fertilizer treatments (P < 0.05). M significantly increased RubisCO activity and cbbL gene abundance (P < 0.05), MNPK significantly increased carbon-fixing microbial richness (P < 0.05). Carbon-fixing microbial community structure was strongly influenced by soil moisture, catalase, total phosphorus and dissolved organic carbon. Some environmental factors indirectly influenced SOC by affecting carbon-fixing microbial biomass, diversity and community structure. Our study implies that even short-term (1-year) reclamation and fertilization could significantly influence carbon-fixing microbial community structure and promote soil carbon accumulation, and the fertilization treatments with manure (M and MNPK) were more conducive, which indicated that carbon-fixing microbes were greatly conducive to improve soil fertility in reclaimed mining areas and achieve carbon neutrality.
  • Crops require a variety of nutrients for growth and nitrogen is particularly important. Nitrogen is the primary factor limiting plant growth and yield formation, and it also plays a significant role in improving product quality[14]. Nitrogen accounts for 1%−3% of the dry weight of plants and is a component of many compounds. For example, it is an important part of proteins, a component of nucleic acids, the skeleton of cell membranes, and a constituent of chlorophyll[5,6]. When the plant is deficient in nitrogen, the synthesis process of nitrogen-containing substances such as proteins decrease significantly, cell division and elongation are restricted, and chlorophyll content decreases, and this leads to short and thin plants, small leaves, and pale color[2,7,8]. If nitrogen in the plant is in excess, a large number of carbohydrates will be used for the synthesis of proteins, chlorophyll, and other substances, so that cells are large and thin-walled, and easy to be attacked by pests and diseases. At the same time, the mechanical tissues in the stem are not well developed and are prone to collapse[3,8,9]. Therefore, the development of new crop varieties with both high yields and improved nitrogen use efficiency (NUE) is an urgently needed goal for more sustainable agriculture with minimal nitrogen demand.

    Plants obtain inorganic nitrogen from the soil, mainly in the form of NH4+ and nitrate (NO3)[1013]. Nitrate uptake by plants occurs primarily in aerobic environments[3]. Transmembrane proteins are required for nitrate uptake from the external environment as well as for transport and translocation between cells, tissues, and organs. NITRATE TRANSPORTER PROTEIN 1 (NRT1)/PEPTIDE TRANSPORTER (PTR) family (NPF), NRT2, CHLORIDE CHANNEL (CLC) family, and SLOW ACTIVATING ANION CHANNEL are four protein families involved in nitrate transport[14]. One of the most studied of these is NRT1.1, which has multiple functions[14]. NRT1.1 is a major nitrate sensor, regulating many aspects of nitrate physiology and developmental responses, including regulating the expression levels of nitrate-related genes, modulating root architecture, and alleviating seed dormancy[1518].

    There is mounting evidence that plant growth and development are influenced by interactions across numerous phytohormone signaling pathways, including abscisic acid, gibberellins, growth hormones, and cytokinins[3,19,20]. To increase the effectiveness of plant nitrogen fertilizer application, it may be possible to tweak the signaling mediators or vary the content of certain phytohormones. Since the 1930s, research on the interplay between growth factors and N metabolism has also been conducted[3]. The Indole acetic acid (IAA) level of plant shoots is shown to decrease in early studies due to N shortage, although roots exhibit the reverse tendency[3,21]. In particular, low NO3 levels caused IAA buildup in the roots of Arabidopsis, Glycine max, Triticum aestivum, and Zea mays, indicating that IAA is crucial for conveying the effectiveness of exogenous nitrogen to the root growth response[20,22,23].

    Studies have shown that two families are required to control the expression of auxin-responsive genes: one is the Auxin Response Factor (ARF) and the other is the Aux/IAA repressor family[2426]. As the transcription factor, the ARF protein regulates the expression of auxin response genes by specifically binding to the TGTCNN auxin response element (AuxRE) in promoters of primary or early auxin response genes[27]. Among them, rice OsARF18, as a class of transcriptional repressor, has been involved in the field of nitrogen utilization and yield[23,28]. In rice (Oryza sativa), mutations in rice salt tolerant 1 (rst1), encoding the OsARF18 gene, lead to the loss of its transcriptional repressor activity and up-regulation of OsAS1 expression, which accelerates the assimilation of NH4+ to Asn and thus increases N utilization[28]. In addition, dao mutant plants deterred the conversion of IAA to OxIAA, thus high levels of IAA strongly activates OsARF18, which subsequently represses the expression of OsARF2 and OsSUT1 by directly binding to the AuxRE and SuRE promoter motifs, resulting in the inhibition of carbohydrate partitioning[23]. As a result, rice carrying the dao has low yields.

    Apples (Malus domestica) are used as a commercially important crop because of their high ecological adaptability, high nutritional value, and annual availability of fruit[29]. To ensure high apple yields, growers promote rapid early fruit yield growth by applying nitrogen. However, the over-application of nitrogen fertilizer to apples during cultivation also produces common diseases and the over-application of nitrogen fertilizer is not only a waste of resources but also harmful to the environment[29]. Therefore, it is of great significance to explore efficient nitrogen-regulated genes to understand the uptake and regulation of nitrogen fertilizer in apples, and to provide reasonable guidance for nitrogen application during apple production[30]. In this study, MdARF18 is identified which is a key transcription factor involved in nitrate uptake and transport in apples and MdARF18 reduces NO3 uptake and assimilation. Further analysis suggests that MdRF18 may inhibit the transcriptional level of MdNRT1.1 promoter by directly binding to its TGTCTT target, thus affecting normal plant growth.

    The protein sequence of apple MdARF18 (MD07G1152100) was obtained from The Apple Genome (https://iris.angers.inra.fr/gddh13/). Mutant of arf18 (GABI_699B09) sequence numbers were obtained from the official TAIR website (www.arabidopsis.org). The protein sequences of ARF18 from different species were obtained from the protein sequence of apple MdARF18 on the NCBI website. Using these data, a phylogenetic tree with reasonably close associations was constructed[31].

    Protein structural domain prediction of ARF18 was performed on the SMART website (https://smart.embl.de/). Motif analysis of ARF18 was performed by MEME (https://meme-suite.org/meme/tools/meme). Clustal was used to do multiple sequence comparisons. The first step was accessing the EBI web server through the Clustal Omega channel. The visualization of the results was altered using Jalview, which may be downloaded from www.jalview.org/download.[32]

    The apple 'Orin' callus was transplanted on MS medium containing 1.5 mg·L−1 6-benzylaminopurine (6-BA) and 0.5 mg·L−1 2,4 dichlorophenoxyacetic acid (2,4-D) at 25 °C, in the dark, at 21-d intervals. 'Royal Gala' apple cultivars were cultured in vermiculite and transplanted at 25 °C every 30 d. The Arabidopsis plants used were of the Columbia (Col-0) wild-type variety. Sowing and germinating Arabidopsis seeds on MS nutrient medium, and Arabidopsis seeds were incubated and grown at 25 °C (light/dark cycle of 16 h/8 h)[33].

    The nutrient solution in the base contained 1.0 mM CaCl2, 1.0 mM KH2PO4, 1.0 mM MgSO4, 0.1 mM FeSO4·7H2O 0.1 mM Na2EDTA·2H2O, 50 μM MnSO4·H2O, 50 μM H3BO3, 0.05 μM CuSO4·5H2O, 0.5 μM Na2MoO4·2H2O, 15 μM ZnSO4·7H2O, 2.5 μM KI, and 0.05 μM CoCl·6H2O, and 0.05 μM CoCl·6H2O, and 0.05 μM CoCl· 6H2O. 2H2O, 15 μM ZnSO4·7H2O, 2.5 μM KI and 0.05 μM CoCl·6H2O, and 0.05 μM CoCl·6H2O, supplemented with 0.5 mM, 2 mM, and 10 mM KNO3 as the sole nitrogen source, and added with the relevant concentrations of KCl to maintain the same K concentration[33,34].

    For auxin treatment, 12 uniformly growing apple tissue-cultured seedlings (Malus domestica 'Royal Gala') were selected from each of the control and treatment groups, apple seedlings were incubated in a nutrient solution containing 1.5 mg·L−1 6-BA, 0.2 mg·L−1 naphthalene acetic acid, and IAA (10 μM) for 50 d, and then the physiological data were determined. Apple seedlings were incubated and grown at 25 °C (light/dark cycle of 16 h/8 h).

    For nitrate treatment, Arabidopsis seedlings were transferred into an MS medium (containing different concentrations of KNO3) as soon as they germinated to test root development. Seven-day-old Arabidopsis were transplanted into vermiculite and then treated with a nutrient solution containing different concentrations of KNO3 (0.5, 2, 10 mM) and watered at 10-d intervals. Apple calli were treated with medium containing 1.5 mg·L−1 6-BA, 0.5 mg·L−1 2,4-D, and varying doses of KNO3 (0.5, 2, and 10 mM) for 25 d, and samples were examined for relevant physiological data. Apple calli were subjected to the same treatment for 1 d for GUS staining[35].

    To obtain MdARF18 overexpression materials, the open reading frame (ORF) of MdARF18 was introduced into the pRI-101 vector. To obtain pMdNRT1.1 material, the 2 kb segment located before the transcription start site of MdNRT1.1 was inserted into the pCAMBIA1300 vector. The Agrobacterium tumefaciens LBA4404 strain was cultivated in lysozyme broth (LB) medium supplemented with 50 mg·L−1 kanamycin and 50 mg·L−1 rifampicin. The MdARF18 overexpression vector and the ProMdNRT1.1::GUS vector were introduced into Arabidopsis and apple callus using the flower dip transformation procedure. The third-generation homozygous transgenic Arabidopsis (T3) and transgenic calli were obtained[36]. Information on the relevant primers designed is shown in Supplemental Table S1.

    Plant DNA and RNA were obtained using the Genomic DNA Kit and the Omni Plant RNA Kit (tDNase I) (Tiangen, Beijing, China)[37].

    cDNA was synthesized for qPCR by using the PrimeScript First Strand cDNA Synthesis Kit (Takara, Dalian, China). The cDNA for qPCR was synthesized by using the PrimeScript First Strand cDNA Synthesis Kit (Takara, Dalian, China). Quantitative real-time fluorescence analysis was performed by using the UltraSYBR Mixture (Low Rox) kit (ComWin Biotech Co. Ltd., Beijing, China). qRT-PCR experiments were performed using the 2−ΔΔCᴛ method for data analysis. The data were analyzed by the 2−ΔΔCᴛ method[31].

    GUS staining buffer contained 1 mM 5-bromo-4-chloro-3-indolyl-β-glutamic acid, 0.01 mM EDTA, 0.5 mM hydrogen ferrocyanide, 100 mM sodium phosphate (pH 7.0), and 0.1% (v/v) Triton X-100 was maintained at 37 °C in the dark. The pMdNRT1.1::GUS construct was transiently introduced into apple calli. To confirm whether MdNRT1.1 is activated or inhibited by MdARF18, we co-transformed 35S::MdARF18 into pMdNRT1.1::GUS is calling. The activity of transgenic calli was assessed using GUS labeling and activity assays[33,38].

    The specimens were crushed into fine particles, combined with 1 mL of ddH2O, and thereafter subjected to a temperature of 100 °C for 30 min. The supernatant was collected in a flow cell after centrifugation at 12,000 revolutions per minute for 10 min. The AutoAnalyzer 3 continuous flow analyzer was utilized to measure nitrate concentrations. (SEAL analytical, Mequon, WI, USA). Nitrate reductase (NR) activity was characterized by the corresponding kits (Solarbio Life Science, Beijing, China) using a spectrophotometric method[31].

    Y1H assays were performed as previously described by Liu et al.[39]. The coding sequence of MdARF18 was integrated into the pGADT7 expression vector, whereas the promoter region of MdNRT1.1 was included in the pHIS2 reporter vector. Subsequently, the constitutive vectors were co-transformed into the yeast monohybrid strain Y187. The individual transformants were assessed on a medium lacking tryptophan, leucine, and histidine (SDT/-L/-H). Subsequently, the positive yeast cells were identified using polymerase chain reaction (PCR). The yeast strain cells were diluted at dilution factors of 10, 100, 1,000, and 10,000. Ten μL of various doses were added to selective medium (SD-T/-L/-H) containing 120 mM 3-aminotriazole (3-AT) and incubated at 28 °C for 2−3 d[37].

    Dual-luciferase assays were performed as described previously[40]. Full-length MdARF18 was cloned into pGreenII 62-SK to produce MdARF18-62-SK. The promoter fragment of MdNRT1.1 was cloned into pGreenII 0800-LUC to produce pMdNRT1.1-LUC. Different combinations were transformed into Agrobacterium tumefaciens LBA4404 and the Agrobacterium solution was injected onto the underside of the leaves of tobacco (Nicotiana benthamiana) leaves abaxially. The Dual Luciferase Reporter Kit (Promega, www.promega.com) was used to detect fluorescence activity.

    Total protein was extracted from wild-type and transgenic apple calli with or without 100 μM MG132 treatment. The purified MdARF18-HIS fusion protein was incubated with total protein[41]. Samples were collected at the indicated times (0, 1, 3, 5, and 7 h).

    Protein gel blots were analyzed using GST antibody. ACTIN antibody was used as an internal reference. All antibodies used in this study were provided by Abmart (www.ab-mart.com).

    Unless otherwise noted, every experiment was carried out independently in triplicate. A one-way analysis of variance (ANOVA) was used to establish the statistical significance of all data, and Duncan's test was used to compare results at the p < 0.05 level[31].

    To investigate whether auxin affects the effective uptake of nitrate in apple, we first externally applied IAA under normal N (5 mM NO3) environment, and this result showed that the growth of Gala apple seedlings in the IAA-treated group were better than the control, and their fresh weights were heavier than the control group (Fig. 1a, d). The N-related physiological indexes of apple seedlings also showed that the nitrate content and NR activity of the root part of the IAA-treated group were significantly higher than the control group, while the nitrate content and NR activity of the shoot part were lower than the control group (Fig. 1b, c). These results demonstrate that auxin could promote the uptake of nitrate and thus promotes growth of plants.

    Figure 1.  Auxin enhances nitrate uptake of Gala seedlings. (a) Phenotypes of apple (Malus domestica 'Royal Gala') seedlings grown nutritionally for 50 d under IAA (10 μM) treatment. (b) Nitrate content of shoot and root apple (Malus domestica 'Royal Gala') seedlings treated with IAA. (c) NR activity in shoot and root of IAA treatment apple (Malus domestica 'Royal Gala') seedlings. (d) Seedling fresh weight under IAA treatment. Bars represent the mean ± SD (n = 3). Different letters above the bars indicate significant differences using the LSD test (p < 0.05).

    To test whether auxin affects the expression of genes related to nitrogen uptake and metabolism. For the root, the expression levels of MdNRT1.1, MdNRT2.1, MdNIA1, MdNIA2, and MdNIR were higher than control group (Supplemental Fig. S1a, f, hj), while the expression levels of MdNRT1.2, MdNRT1.6 and MdNRT2.5 were lower than control group significantly (Supplemental Fig. S1b, d, g). For the shoot, the expression of MdNRT1.1, MdNRT1.5, MdNRT1.6, MdNRT1.7, MdNRT2.1, MdNRT2.5, MdNIA1, MdNIA2, and MdNIR genes were significantly down-regulated (Supplemental Fig. S1a, cj). This result infers that the application of auxin could mediate nitrate uptake in plants by affecting the expression levels of relevant nitrate uptake and assimilation genes.

    Since the auxin signaling pathway requires the regulation of the auxin response factors (ARFs)[25,27], it was investigated whether members of ARF genes were nitrate responsive. Firstly, qPCR quantitative analysis showed that the five subfamily genes of MdARFs (MdARF9, MdARF2, MdARF12, MdARF3, and MdARF18) were expressed at different levels in various organs of the plant (Supplemental Fig. S2). Afterward, the expression levels of five ARF genes were analyzed under different concentrations of nitrate treatment (Fig. 2), and it was concluded that these genes represented by each subfamily responded in different degrees, but the expression level of MdARF18 was up-regulated regardless of low or high nitrogen (Fig. 2i, j), and the expression level of MdARF18 showed a trend of stable up-regulation under IAA treatment (Supplemental Fig. S3). The result demonstrates that MdARFs could affect the uptake of external nitrate by plants and MdARF18 may play an important role in the regulation of nitrate uptake.

    Figure 2.  Relative expression analysis of MdARFs subfamilies in response to different concentrations of nitrate. Expression analysis of representative genes from five subfamilies of MdARF transcription factors. Bars represent the mean ± SD (n = 3). Different letters above the bars indicate significant differences using the LSD test (p < 0.05).

    MdARF18 (MD07G1152100) was predicted through The Apple Genome website (https://iris.angers.inra.fr/gddh13/) and it had high fitness with AtARF18 (AT3G61830). The homologs of ARF18 from 15 species were then identified in NCBI (www.ncbi.nlm.nih.gov) and then constructed an evolutionary tree (Supplemental Fig. S4). The data indicates that MdARF18 was most closely genetically related to MbARF18 (Malus baccata), indicating that they diverged recently in evolution (Supplemental Fig. S4). Conserved structural domain analyses indicated that all 15 ARF18 proteins had highly similar conserved structural domains (Supplemental Fig. S5). In addition, multiple sequence alignment analysis showed that all 15 ARF18 genes have B3-type DNA-binding domains (Supplemental Fig. S6), which is in accordance with the previous reports on ARF18 protein structure[26].

    To explore whether MdARF18 could affect the development of the plant's root system. Firstly, MdARF18 was heterologously expressed into Arabidopsis, and an arf18 mutant (GABI_699B09) Arabidopsis was also obtained (Supplemental Fig. S7). Seven-day-old MdARF18 transgenic Arabidopsis and arf18 mutants were treated in a medium with different nitrate concentrations for 10 d (Fig. 3a, b). After observing results, it was found that under the environment of high nitrate concentration, the primary root of MdARF18 was shorter than arf18 and wild type (Fig. 3c), and the primary root length of arf18 is the longest (Fig. 3c), while there was no significant difference in the lateral root (Fig. 3d). For low nitrate concentration, there was no significant difference in the length of the primary root, and the number of lateral roots of MdARF18 was slightly more than wild type and arf18 mutant. These results suggest that MdARF18 affects root development in plants. However, in general, low nitrate concentrations could promote the transport of IAA by NRT1.1 and thus inhibit lateral root production[3], so it might be hypothesized that MdARF18 would have some effect on MdNRT1.1 thus leading to the disruption of lateral root development.

    Figure 3.  MdARF18 inhibits root development. (a) MdARF18 inhibits root length at 10 mM nitrate concentration. (b) MdARF18 promotes lateral root growth at 0.5 mM nitrate concentration. (c) Primary root length statistics. (d) Lateral root number statistics. Bars represent the mean ± SD (n = 3). Different letters above the bars indicate significant differences using the LSD test (p < 0.05).

    To investigate whether MdARF18 affects the growth of individual plants under different concentrations of nitrate, 7-day-old overexpression MdARF18, and arf18 mutants were planted in the soil and incubated for 20 d. It was found that arf18 had the best growth of shoot, while MdARF18 had the weakest shoot growth at any nitrate concentration (Fig. 4a). MdARF18 had the lightest fresh weight and the arf18 mutant had the heaviest fresh weight (Fig. 4b). N-related physiological indexes revealed that the nitrate content and NR activity of arf18 were significantly higher than wild type, whereas MdARF18 materials were lower than wild type (Fig. 4c, d). More detail, MdARF18 had the lightest fresh weight under low and normal nitrate, while the arf18 mutant had the heaviest fresh weight, and the fresh weight of arf18 under high nitrate concentration did not differ much from the wild type (Fig. 4b). Nitrogen-related physiological indexes showed that the nitrate content of arf18 was significantly higher than wild type, while MdARF18 was lower than wild type. The NR activity of arf18 under high nitrate did not differ much from the wild type, but the NR activity of MdARF18 was the lowest in any treatment (Fig. 4c, d). These results indicate that MdARF18 significantly inhibits plant growth by inhibiting plants to absorb nitrate, and is particularly pronounced at high nitrate concentrations.

    Figure 4.  Ectopic expression of MdARF18 inhibits Arabidopsis growth. (a) Status of Arabidopsis growth after one month of incubation at different nitrate concentrations. (b) Fresh weight of Arabidopsis. (c) Nitrate content of Arabidopsis. (d) NR activity in Arabidopsis. Bars represent the mean ± SD (n = 3). Different letters above the bars indicate significant differences using the LSD test (p < 0.05).

    In addition, to further validate this conclusion, MdARF18 overexpression calli were obtained and treated with different concentrations of nitrate (Supplemental Fig. S8). The results show that the growth of overexpressed MdARF18 was weaker than wild type in both treatments (Supplemental Fig. S9a). The fresh weight of MdARF18 was significantly lighter than wild type (Supplemental Fig. S9b), and its nitrate and NR activity were lower than wild type (Supplemental Fig. S9c, d), which was consistent with the above results (Fig. 4). This result further confirms that MdARF18 could inhibit the development of individual plants by inhibiting the uptake of nitrate.

    Nitrate acts as a signaling molecule that takes up nitrate by activating the NRT family as well as NIAs and NIR[3,34]. To further investigate the pathway by which MdARF18 inhibits plant growth and reduces nitrate content, qRT-PCR was performed on the above plant materials treated with different concentrations of nitrate (Fig. 5). The result shows that the expression levels of AtNRT1.1, AtNIA1, AtNIA2, and AtNIR were all down-regulated in overexpression of MdARF18, and up-regulated in the arf18 mutant (Fig. 5a, hj). There was no significant change in AtNRT1.2 at normal nitrate levels, but AtNRT1.2 expression levels were down-regulated in MdARF18 and up-regulated in arf18 at both high and low nitrate levels (Fig. 5b). This trend in the expression levels of these genes might be consistent with the fact that MdARF18 inhibits the expression of nitrogen-related genes and restricts plant growth. The trend in the expression levels of these genes is consistent with MdARF18 restricting plant growth by inhibiting the expression of nitrogen-related genes. However, AtNRT1.5, AtNRT1.6, AtNRT1.7, AtNRT2.1, and AtNRT2.5 did not show suppressed expression levels in MdARF18 (Fig. 5cg). These results suggest that MdARF18 inhibits nitrate uptake and plant growth by repressing some of the genes for nitrate uptake or assimilation.

    Figure 5.  qPCR-RT analysis of N-related genes. Expression analysis of N-related genes in MdARF18 transgenic Arabidopsis at different nitrate concentrations. Bars represent the mean ± SD (n = 3). Different letters above the bars indicate significant differences using the LSD test (p < 0.05).

    In addition, to test whether different concentrations of nitrate affect the protein stability of MdARF18. However, it was found that there was no significant difference in the protein stability of MdARF18 at different concentrations of nitrate (Supplemental Fig. S10). This result suggests that nitrate does not affect the degradation of MdARF18 protein.

    To further verify whether MdARF18 can directly bind N-related genes, firstly we found that the MdNRT1.1 promoter contains binding sites to ARF factors (Fig. 6a). The yeast one-hybrid research demonstrated an interaction between MdARF18 and the MdNRT1.1 promoter, as shown in Fig. 6b. Yeast cells that were simultaneously transformed with MdNRT1.1-P-pHIS and pGADT7 were unable to grow in selected SD medium. However, cells that were transformed with MdNRT1.1-P-pHIS and MdARF18-pGADT7 grew successfully in the selective medium. The result therefore hypothesizes that MdARF18 could bind specifically to MdNRT1.1 promoter to regulate nitrate uptake in plants.

    Figure 6.  MdARF18 binds directly to the promoter of MdNRT1.1. (a) Schematic representation of MdNRT1.1 promoter. (b) Y1H assay of MdARF18 bound to the MdNRT1.1 promoter in vitro. 10−1, 10−2, 10−3, and 10−4 indicate that the yeast concentration was diluted 10, 100, 1,000, and 10,000 times, respectively. 3-AT stands for 3-Amino-1,2,4-triazole. (c) Dual luciferase assays demonstrate the binding of MdARF18 with MdNRT1.1 promoter. The horizontal bar on the left side of the right indicates the captured signal intensity. Empty LUC and 35S vectors were used as controls. Representative images of three independent experiments are shown here.

    To identify the inhibition or activation of MdNRT1.1 by MdARF18, we analyzed their connections by Dual luciferase assays (Fig. 6c), and also analyzed the fluorescence intensity (Supplemental Fig. S11). It was concluded that the fluorescence signals of cells carrying 35Spro and MdNRT1.1pro::LUC were stronger, but the mixture of 35Spro::MdARF18 and MdNRT1.1pro::LUC injected with fluorescence signal intensity was significantly weakened. Next, we transiently transformed the 35S::MdARF18 into pMdNRT1.1::GUS transgenic calli (Fig. 7). GUS results first showed that the color depth of pMdNRT1.1::GUS and 35S::MdARF18 were significantly lighter than pMdnNRT1.1::GUS alone (Fig. 7a). GUS enzyme activity, as well as GUS expression, also indicated that the calli containing pMdnNRT1.1::GUS alone had a stronger GUS activity (Fig. 7b, c). In addition, the GUS activity of calli containing both pMdNRT1.1:GUS and 35S::MdARF18 were further attenuated under both high and low nitrate concentrations (Fig. 7a). These results suggest that MdARF18 represses MdNRT1.1 expression by directly binding to the MdNRT1.1 promoter region.

    Figure 7.  MdARF18 inhibits the expression of MdNRT1.1. (a) GUS staining experiment of pMdNRT1.1::GUS transgenic calli and transgenic calli containing both pMdNRT1.1::GUS and 35S::MdARF18 with different nitrate treatments. (b) GUS activity assays in MdARF18 overexpressing calli with different nitrate treatments. (c) GUS expression level in MdARF18 overexpressing calli with different nitrate treatments. Bars represent the mean ± SD (n = 3). Different numbers of asterisk above the bars indicate significant differences using the LSD test (*p < 0.05 and **p< 0.01).

    Plants replenish their nutrients by absorbing nitrates from the soil[42,43]. Previous studies have shown that some of the plant hormones such as IAA, GA, and ABA interact with nitrate[25,4445]. The effect of nitrate on the content and transport of IAA has been reported in previous studies, e.g., nitrate supply reduced IAA content in Arabidopsis, wheat, and maize roots and inhibited the transport of IAA from shoot to root[20,21]. In this study, it was found that auxin treatment promoted individual fresh weight gain and growth (Fig. 1a, b). Nitrate content and NR activity were also significantly higher in their root parts (Fig. 1c, d) and also affected the transcript expression levels of related nitrate uptake and assimilation genes (Supplemental Fig. S1). Possibly because IAA can affect plant growth by influencing the uptake of external nitrates by the plant.

    ARFs are key transcription factors to regulate auxin signaling[4649]. We identified five representative genes of the apple MdARFs subfamily and they all had different expression patterns (Supplemental Fig. S2). The transcript levels of each gene were found to be affected to different degrees under different concentrations of nitrate, but the expression level of MdARF18 was up-regulated under both low and high nitrate conditions (Fig. 2). The transcript level of MdARF18 was also activated under IAA treatment (Supplemental Fig. S3), so MdARF18 began to be used in the study of the mechanism of nitrate uptake in plants. In this study, an Arabidopsis AtARF18 homolog was successfully cloned and named MdARF18 (Supplemental Figs S4, S5). It contains a B3-type DNA-binding structural domain consistent with previous studies of ARFs (Supplemental Fig. S6), and arf18 mutants were also obtained and their transcript levels were examined (Supplemental Fig. S7).

    Plants rely on rapid modification of the root system to efficiently access effective nitrogen resources in the soil for growth and survival. The plasticity of root development is an effective strategy for accessing nitrate, and appropriate concentrations of IAA can promote the development of lateral roots[7,44]. The present study found that the length of the primary root was shortened and the number of lateral roots did increase in IAA-treated Gl3 apple seedlings (Supplemental Fig. S12). Generally, an environment with low concentrations of nitrate promotes the transport of IAA by AtNRT1.1, which inhibits the growth of lateral roots[14]. However, in the research of MdARF18 transgenic Arabidopsis, it was found that the lateral roots of MdARF18-OX increased under low concentrations of nitrate, but there was no significant change in the mutant arf18 (Fig. 3). Therefore, it was hypothesized that MdARF18 might repress the expression of the MdNRT1.1 gene or other related genes that can regulate root plasticity, thereby affecting nitrate uptake in plants.

    In rice, several researchers have demonstrated that OsARF18 significantly regulates nitrogen utilization. Loss of function of the Rice Salt Tolerant 1 (RST1) gene (encoding OsARF18) removes its ability to transcriptionally repress OsAS1, accelerating the assimilation of NH4+ to Asn and thereby increasing nitrogen utilization[28]. During soil incubation of MdARF18-OX Arabidopsis, it was found that leaving aside the effect of differences in nitrate concentration, the arf18 mutant grew significantly better than MdARF18-OX and had higher levels of nitrate and NR activity in arf18 than in MdARF18-OX. This demonstrates that MdARF18 may act as a repressor of nitrate uptake and assimilation, thereby inhibiting normal plant development (Fig. 4). Interestingly, an adequate nitrogen environment promotes plant growth, but MdARF18-OX Arabidopsis growth and all physiological indexes were poorer under high nitrate concentration than MdARF18-OX at other concentrations. We hypothesize that MdARF18 may be activated more intensively at high nitrate concentrations, or that MdARF18 suppresses the expression levels of genes for nitrate uptake or assimilation (genes that may play a stronger role at high nitrate concentrations), thereby inhibiting plant growth. In addition, we obtained MdARF18 transgenic calli (Supplemental Fig. S8) and subjected them to high and low concentrations of nitrate, and also found that MdARF18 inhibited the growth of individuals at both concentrations (Supplemental Fig. S9). This further confirms that MdARF18 inhibits nitrate uptake in individuals.

    ARF family transcription factors play a key role in transmitting auxin signals to alter plant growth and development, e.g. osarf1 and osarf24 mutants have reduced levels of OsNRT1.1B, OsNRT2.3a and OsNIA2 transcripts[22]. Therefore, further studies are needed to determine whether MdARF18 activates nitrate uptake through different molecular mechanisms. The result revealed that the transcript levels of AtNRT1.1, AtNIA1, AtNIA2, and AtNIR in MdARF18-OX were consistent with the developmental pattern of impaired plant growth (Fig. 5). Unfortunately, we attempted to explore whether variability in nitrate concentration affects MdARF18 to differ at the protein level, but the two did not appear to differ significantly (Supplemental Fig. S10).

    ARF transcription factors act as trans-activators/repressors of N metabolism-related genes by directly binding to TGTCNN/NNGACA-containing fragments in the promoter regions of downstream target genes[27,50]. The NRT family plays important roles in nitrate uptake, transport, and storage, and NRT1.1 is an important dual-affinity nitrate transporter protein[7,5052], and nitrogen utilization is very important for apple growth[53,54]. We identified binding sites in the promoters of these N-related genes that are compatible with ARF factors, and MdARF18 was found to bind to MdNRT1.1 promoter by yeast one-hybrid technique (Fig. 6a, b). It was also verified by Dual luciferase assays that MdARF18 could act as a transcriptional repressor that inhibited the expression of the downstream gene MdNRT1.1 (Fig. 6c), which inhibited the uptake of nitrate in plants. In addition, the GUS assay was synchronized to verify that transiently expressed pMdNRT1.1::GUS calli with 35S::MdARF18 showed a lighter staining depth and a significant decrease in GUS transcript level and enzyme activity (Fig. 7). This phenomenon was particularly pronounced at high concentrations of nitrate. These results suggest that MdARF18 may directly bind to the MdNRT1.1 promoter and inhibit its expression, thereby suppressing NO3 metabolism and decreasing the efficiency of nitrate uptake more significantly under high nitrate concentrations.

    In conclusion, in this study, we found that MdARF18 responds to nitrate and could directly bind to the TGTCTT site of the MdNRT1.1 promoter to repress its expression. Our findings provide new insights into the molecular mechanisms by which MdARF18 regulates nitrate transport in apple.

    The authors confirm contribution to the paper as follows: study conception and design: Liu GD; data collection: Liu GD, Rui L, Liu RX; analysis and interpretation of results: Liu GD, Li HL, An XH; draft manuscript preparation: Liu GD; supervision: Zhang S, Zhang ZL; funding acquisition: You CX, Wang XF; All authors reviewed the results and approved the final version of the manuscript.

    Data sharing not applicable to this article as no datasets were generated or analyzed during the current study.

    This work was supported by the National Natural Science Foundation of China (32272683), the Shandong Province Key R&D Program of China (2022TZXD008-02), the China Agriculture Research System of MOF and MARA (CARS-27), the National Key Research and Development Program of China (2022YFD1201700), and the National Natural Science Foundation of China (NSFC) (32172538).

  • The authors declare that they have no conflict of interest.

  • Supplemental Fig. S1 Schematic diagram of the geographic location of the study site.
    Supplemental Fig. S2 16S rRNA abundance (a) and cbbL/16S rRNA gene ratio (b) in different treatments. Values are means (n=3), and error bars represent standard deviation. Different lowercase letters above columns indicate significant differences (one-way ANOVA, P<0.05) among treatments.
    Supplemental Fig. S3 Rarefaction curves of operational taxonomic unit (OTU) numbers.
    Supplemental Fig. S4 Sobs Richness Index (a), Shannon-Weaver Diversity Index (b), Pielou Evenness Index (c) charts of the carbon-fixing microbial community. The error bars represent standard deviation. Different lowercase letters above columns indicate difference (one-way ANOVA, P<0.05) among treatments.
    Supplemental Table S1 The relative abundance of dominant phylum in different treatments.
    Supplemental Table S2 The relative abundance of dominant classes in different treatments.
  • Anandakumar S, Bakhoum N, Chinnadurai C, Malarkodi M, Arulmozhiselvan K, et al. 2022. Impact of long-term nutrient management on sequestration and dynamics of soil organic carbon in a semi-arid tropical Alfisol of India. Applied Soil Ecology 177:104549

    doi: 10.1016/j.apsoil.2022.104549

    CrossRef    Google Scholar

    Antonelli PM, Fraser LH, Gardner WC, Broersma K, Karakatsoulis J, et al. 2018. Long term carbon sequestration potential of biosolids-amended copper and molybdenum mine tailings following mine site reclamation. Ecological Engineering 117:38−49

    doi: 10.1016/j.ecoleng.2018.04.001

    CrossRef    Google Scholar

    Badger MR, Bek EJ. 2008. Multiple Rubisco forms in proteobacteria: their functional significance in relation to CO2 acquisition by the CBB cycle. Journal of Experimental Botany 59:1525−41

    doi: 10.1093/jxb/erm297

    CrossRef    Google Scholar

    Bandyopadhyay S, Maiti SK. 2019. Evaluation of ecological restoration success in mining-degraded lands. Environmental Quality Management 29:89−100

    doi: 10.1002/tqem.21641

    CrossRef    Google Scholar

    Blair GJ, Lefroy RDB, Lisle L. 1995. Soil carbon fractions based on their degree of oxidation, and the development of a carbon management index for agricultural systems. Australian Journal of Agricultural Research 46:1459−66

    doi: 10.1071/AR9951459

    CrossRef    Google Scholar

    Cambardella CA, Elliott ET. 1992. Particulate soil organic-matter changes across a grassland cultivation sequence. Soil Science Society of America Journal 56:777−83

    doi: 10.2136/sssaj1992.03615995005600030017x

    CrossRef    Google Scholar

    Cao Y, Zhou B, Wang X, Meng H, Zhang J, et al. 2020. Different fertilization treatments in coal mining-affected soils change bacterial populations and enable soil reclamation. Annals of Microbiology 70:47

    doi: 10.1186/s13213-020-01589-2

    CrossRef    Google Scholar

    Cheng R. 2022. Study on remediation effects of contaminated soil in copper mine waste-dumps based on ecological reclamation. Journal of Earth Environment 13:631−40

    Google Scholar

    Čížková B, Woś B, Pietrzykowski M, Frouz J. 2018. Development of soil chemical and microbial properties in reclaimed and unreclaimed grasslands in heaps after opencast lignite mining. Ecological Engineering 123:103−11

    doi: 10.1016/j.ecoleng.2018.09.004

    CrossRef    Google Scholar

    Dennis PG, Miller AJ, Hirsch PR. 2010. Are root exudates more important than other sources of rhizodeposits in structuring rhizosphere bacterial communities? FEMS Microbiology Ecology 72:313−27

    doi: 10.1111/j.1574-6941.2010.00860.x

    CrossRef    Google Scholar

    Ding J, Jiang X, Ma M, Zhou B, Guan D, et al. 2016. Effect of 35 years inorganic fertilizer and manure amendment on structure of bacterial and archaeal communities in black soil of northeast China. Applied Soil Ecology 105:187−95

    doi: 10.1016/j.apsoil.2016.04.010

    CrossRef    Google Scholar

    Edgar RC. 2013. UPARSE: highly accurate OTU sequences from microbial amplicon reads. Nature Methods 10:996−98

    doi: 10.1038/nmeth.2604

    CrossRef    Google Scholar

    Fuchs G. 2011. Alternative pathways of carbon dioxide fixation: insights into the early evolution of life? Annual Review of Microbiology 65:631−58

    doi: 10.1146/annurev-micro-090110-102801

    CrossRef    Google Scholar

    Gao W, Zhang B, Hao X, Xu Q, Lv J, et al. 2021. Effect of application with different manures on maize yield and phosphorus availability of reclamation soil in coal mining subsidence areas. Chinese Journal of Applied & Environmental Biology 27:956−62

    doi: 10.19675/j.cnki.1006-687x.2020.05058

    CrossRef    Google Scholar

    Guo JH, Liu XJ, Zhang Y, Shen JL, Han W, et al. 2010. Significant Acidification in Major Chinese Croplands. Science 327:1008−10

    doi: 10.1126/science.1182570

    CrossRef    Google Scholar

    Hou H, Wang C, Ding Z, Zhang S, Yang Y, et al. 2018. Variation in the soil microbial community of reclaimed land over different reclamation periods. Sustainability 10:2286

    doi: 10.3390/su10072286

    CrossRef    Google Scholar

    Huang Y, Jing J, Yan M, Hazard C, Chen Y, et al. 2021a. Contribution of pathogenic fungi to N2O emissions increases temporally in intensively managed strawberry cropping soil. Applied Microbiology and Biotechnology 105:2043−56

    doi: 10.1007/s00253-021-11163-8

    CrossRef    Google Scholar

    Huang Y, Wang Q, Zhang W, Zhu P, Xiao Q, et al. 2021b. Stoichiometric imbalance of soil carbon and nutrients drives microbial community structure under long-term fertilization. Applied Soil Ecology 168:104119

    doi: 10.1016/j.apsoil.2021.104119

    CrossRef    Google Scholar

    Jing H, Li J, Yan B, Wei F, Wang G, et al. 2021. The effects of nitrogen addition on soil organic carbon decomposition and microbial C-degradation functional genes abundance in a Pinus tabulaeformis forest. Forest Ecology and Management 489:119098

    doi: 10.1016/j.foreco.2021.119098

    CrossRef    Google Scholar

    Kusian B, Bowien B. 1997. Organization and regulation of cbb CO2 assimilation genes in autotrophic bacteria. FEMS Microbiology Reviews 21:135−55

    doi: 10.1111/j.1574-6976.1997.tb00348.x

    CrossRef    Google Scholar

    Li J, Ma Y, Hu H, Wang J, Liu Y, et al. 2015. Field-based evidence for consistent responses of bacterial communities to copper contamination in two contrasting agricultural soils. Frontiers in Microbiology 6:31

    doi: 10.3389/fmicb.2015.00031

    CrossRef    Google Scholar

    Li J, Xin Z, Yan J, Li H, Chen J, et al. 2018. Physicochemical and microbiological assessment of soil quality on a chronosequence of a mine reclamation site. European Journal of Soil Science 69:1056−67

    doi: 10.1111/ejss.12714

    CrossRef    Google Scholar

    Li P, Chen W, Han Y, Wang D, Zhang Y, et al. 2020. Effects of straw and its biochar applications on the abundance and community structure of CO2-fixing bacteria in a sandy agricultural soil. Journal of Soils and Sediments 20:2225−35

    doi: 10.1007/s11368-020-02584-5

    CrossRef    Google Scholar

    Li Y, Chen L, Wen H, Zhou T, Zhang T, et al. 2014. 454 pyrosequencing analysis of bacterial diversity revealed by a comparative study of soils from mining subsidence and reclamation areas. Journal of Microbiology and Biotechnology 24:313−23

    doi: 10.4014/jmb.1309.09001

    CrossRef    Google Scholar

    Lienhard P, Terrat S, Prévost-Bouré NC, Nowak V, Régnier T, et al. 2014. Pyrosequencing evidences the impact of cropping on soil bacterial and fungal diversity in Laos tropical grassland. Agronomy for Sustainable Development 34:525−33

    doi: 10.1007/s13593-013-0162-9

    CrossRef    Google Scholar

    Lin X. 2010. Principles and methods of soil microbiology research. Beijing: Higher Education Press.

    Google Scholar

    Liu H, Hai X, An K, Zhang H, Wang H, et al. 2022. Effects of different fertilization regimes on community structure diversity of CO2-assimilating bacteria in maize field of fluvo-aquic soil in north China. Ecology and Environment Sciences 31:715−22

    doi: 10.16258/j.cnki.1674-5906.2022.04.009

    CrossRef    Google Scholar

    Ma J, Dong W, Zhu Y, Yu H, Xiao D, et al. 2022. Impact of land reclamation on the carbon sequestration potential of soil microorganisms in the disturbed mining area of eastern plain. Journal of China Coal Society 47:1306−17

    doi: 10.13225/j.cnki.jccs.XR21.1686

    CrossRef    Google Scholar

    Martín-Lammerding D, Navas M, Albarrán MdM, Tenorio JL, Walter I. 2015. LONG term management systems under semiarid conditions: Influence on labile organic matter, β-glucosidase activity and microbial efficiency. Applied Soil Ecology 96:296−305

    doi: 10.1016/j.apsoil.2015.08.021

    CrossRef    Google Scholar

    National Bureau of Statistics. 2022. Statistical Bulletin of the People's Republic of China on National Economic and Social Development in 2021. China Information News. www.gov.cn/xinwen/2022-02/28/content_5676015.htm

    Google Scholar

    Parag B, Sasikala C, Ramana CV. 2013. Molecular and culture dependent characterization of endolithic bacteria in two beach sand samples and description of Rhizobium endolithicum sp. nov. Antonie Van Leeuwenhoek 104:1235−44

    doi: 10.1007/s10482-013-0046-7

    CrossRef    Google Scholar

    Qin C, Tao J, Liu T, Liu Y, Xiao N, et al. 2019. Responses of phyllosphere microbiota and plant health to application of two different biocontrol agents. AMB Express 9:42−42

    doi: 10.1186/s13568-019-0765-x

    CrossRef    Google Scholar

    Rasche F, Knapp D, Kaiser C, Koranda M, Kitzler B, et al. 2011. Seasonality and resource availability control bacterial and archaeal communities in soils of a temperate beech forest. The ISME Journal 5:389−402

    doi: 10.1038/ismej.2010.138

    CrossRef    Google Scholar

    Reinl KL, Brookes J, Carey CC, Harris TD, Ibelings BW, et al. 2021. Cyanobacterial blooms in oligotrophic lakes: Shifting the high-nutrient paradigm. Freshwater Biology 66:1846−59

    doi: 10.1111/fwb.13791

    CrossRef    Google Scholar

    Segata N, Abubucker S, Goll J, Schubert AM, Izard J, et al. 2011. Microbial community function and biomarker discovery in the human microbiome. Genome Biology 12:P47

    doi: 10.1186/gb-2011-12-s1-p47

    CrossRef    Google Scholar

    Shipley B. 2000. Cause and Correlation in Biology: A User's Guide to Path Analysis. Cambridge University Press. https://doi.org/10.1017/CBO9780511605949

    Google Scholar

    Shao H, Li Z, Liu D, Li Y, Lu L, et al. 2019. Effects of manure application rates on the soil carbon fractions and aggregate stability. Environmental Science 40:4691−99

    doi: 10.13227/j.hjkx.201902013

    CrossRef    Google Scholar

    Su Y, Wu L, Zhou Z, Liu Y, Zhang Y. 2013. Carbon flux in deserts depends on soil cover type: A case study in the Gurbantunggute desert, North China. Soil Biology and Biochemistry 58:332−40

    doi: 10.1016/j.soilbio.2012.12.006

    CrossRef    Google Scholar

    Sun X, Song B, Xu R, Zhang M, Gao P, et al. 2021. Root-associated (rhizosphere and endosphere) microbiomes of the Miscanthus sinensis and their response to the heavy metal contamination. Journal of Environmental Sciences 104:387−398

    doi: 10.1016/j.jes.2020.12.019

    CrossRef    Google Scholar

    Tabita FR. 1999. Microbial ribulose 1,5-bisphosphate carboxylase/oxygenase: A different perspective. Photosynthesis Research 60:1−28

    doi: 10.1023/A%3A1006211417981

    CrossRef    Google Scholar

    Tang Z, Fan F, Wan Y, Wei W, Lai L. 2015. Abundance and diversity of RuBisCO genes responsible for CO2 fixation in arid soils of Northwest China. Pedosphere. 25:150−59

    doi: 10.1016/S1002-0160(14)60085-0

    CrossRef    Google Scholar

    Techtmann SM, Lebedinsky AV, Colman AS, Sokolova TG, Woyke T, et al. 2012. Evidence for Horizontal Gene Transfer of Anaerobic Carbon Monoxide Dehydrogenases. Frontiers in Microbiology 3:132

    doi: 10.3389/fmicb.2012.00132

    CrossRef    Google Scholar

    Tedesco MJ, Gianello C, Bissani CA, Bohnen H, Volkweiss SJ. 1995. Análises de solo, plantas e outros materiais. Porto Alegre: Departamento de Solos, UFRGS.

    Google Scholar

    Tolli J, King GM. 2005. Diversity and Structure of Bacterial Chemolithotrophic Communities in Pine Forest and Agroecosystem Soils. Applied and Environmental Microbiology 71:8411−18

    doi: 10.1128/AEM.71.12.8411-8418.2005

    CrossRef    Google Scholar

    Vance ED, Brookes PC, Jenkinson DS. 1987. An extraction method for measuring soil microbial biomass C. Soil Biology and Biochemistry 19:703−7

    doi: 10.1016/0038-0717(87)90052-6

    CrossRef    Google Scholar

    Wang R, Wu X, Li G, Xiu W, Wang L, et al. 2019. Effects of conversion of forest to arable land on the abundance and structure of the cbbL-Harboring bacterial community in albic soil of the hilly region of Northeast China. Environmental Science 40:5561−69

    doi: 10.13227/j.hjkx.201905201

    CrossRef    Google Scholar

    Wang X, Li Y, Wei Y, Meng H, Cao Y, et al. 2020. Effects of fertilization and reclamation time on soil bacterial communities in coal mining subsidence areas. The Science of the Total Environment 739:139882

    doi: 10.1016/j.scitotenv.2020.139882

    CrossRef    Google Scholar

    Wei Y, Wei Y, Yu L, Zhang J, Yu Y, Deangelis DL. 2011. Relationship between vegetation restoration and soil microbial characteristics in Degraded Karst Regions: A case study. Pedosphere. 21:132−38

    doi: 10.1016/S1002-0160(10)60088-4

    CrossRef    Google Scholar

    Xiao H, Li Z, Chang X, Deng L, Nie X, et al. 2018. Microbial CO2 assimilation is not limited by the decrease in autotrophic bacterial abundance and diversity in eroded watershed. Biology and Fertility of Soils 54:595−605

    doi: 10.1007/s00374-018-1284-7

    CrossRef    Google Scholar

    Xu L, Yi M, Yi H, Guo E, Zhang A. 2017. Manure and mineral fertilization change enzyme activity and bacterial community in millet rhizosphere soils. World Journal of Microbiology & Biotechnology 34:8

    doi: 10.1007/s11274-017-2394-3

    CrossRef    Google Scholar

    Yu King Hing N, Liang F, Lindblad P, Morgan JA. 2019. Combining isotopically non-stationary metabolic flux analysis with proteomics to unravel the regulation of the Calvin-Benson-Bassham cycle in Synechocystis sp. PCC 6803. Metabolic Engineering 56:77−84

    doi: 10.1016/j.ymben.2019.08.014

    CrossRef    Google Scholar

    Yuan H, Ge T, Chen X, Liu S, Zhu Z, et al. 2015. Abundance and diversity of CO2-assimilating bacteria and algae within red agricultural soils are modulated by Changing Management Practice. Microbial Ecology 70:971−80

    doi: 10.1007/s00248-015-0621-8

    CrossRef    Google Scholar

    Yuan H, Ge T, Wu X, Liu S, Tong C, et al. 2011. Long-term field fertilization alters the diversity of autotrophic bacteria based on the ribulose-1,5-biphosphate carboxylase/oxygenase (RubisCO) large-subunit genes in paddy soil. Applied Microbiology and Biotechnology 95:1061−71

    doi: 10.1007/s00253-011-3760-y

    CrossRef    Google Scholar

    Yuan H, Ge T, Zou S, Wu X, Liu S, et al. 2013. Effect of land use on the abundance and diversity of autotrophic bacteria as measured by ribulose-1,5-biphosphate carboxylase/oxygenase (RubisCO) large subunit gene abundance in soils. Biology and Fertility of Soils 49:609−16

    doi: 10.1007/s00374-012-0750-x

    CrossRef    Google Scholar

    Yuan Y, Zhao Z, Bai Z, Wang H, Xu Z, et al. 2016. Niche characteristics of dominant herbaceous species under different land reclamation patterns in Antaibao Opencast Coal Mine. Chinese Journal of Ecology 35:3215−22

    doi: 10.13292/j.1000-4890.201612.008

    CrossRef    Google Scholar

    Zhang J, Quan C, Ma L, Chu G, Liu Z, et al. 2021. Plant community and soil properties drive arbuscular mycorrhizal fungal diversity: A case study in tropical forests. Soil Ecology Letters 3:52−62

    doi: 10.1007/s42832-020-0049-z

    CrossRef    Google Scholar

    Zhang L, Wang X, Wang J, Liao L, Lei S, et al. 2022. Alpine meadow degradation depresses soil nitrogen fixation by regulating plant functional groups and diazotrophic community composition. Plant Soil 473:319−35

    doi: 10.1007/s11104-021-05287-z

    CrossRef    Google Scholar

    Zhang X, Zhu B, Chan Z, Zhao C, Zeng R, et al. 2017. Effect of organic carbons on the removal of inorganic nitrogen coexisting in marine aquaculture by a marine purple sulfur bacterium, Marichramatium gracile YL28. Microbiology 44:1017−27

    doi: 10.13344/j.microbiol.china.160474

    CrossRef    Google Scholar

    Zhu L, Hu N, Zhang Z, Xu J, Tao B, et al. 2015. Short-term responses of soil organic carbon and carbon pool management index to different annual straw return rates in a rice–wheat cropping system. Catena 135:283−89

    doi: 10.1016/j.catena.2015.08.008

    CrossRef    Google Scholar

  • Cite this article

    Shang Y, Wu M, Zhang J, Meng H, Hong J, et al. 2023. Nutrient enhanced reclamation promoted growth, diversity and activities of carbon fixing microbes in a coal-mining subsistence land. Soil Science and Environment 2:2 doi: 10.48130/SSE-2023-0002
    Shang Y, Wu M, Zhang J, Meng H, Hong J, et al. 2023. Nutrient enhanced reclamation promoted growth, diversity and activities of carbon fixing microbes in a coal-mining subsistence land. Soil Science and Environment 2:2 doi: 10.48130/SSE-2023-0002

Figures(7)  /  Tables(1)

Article Metrics

Article views(4784) PDF downloads(634)

ARTICLE   Open Access    

Nutrient enhanced reclamation promoted growth, diversity and activities of carbon fixing microbes in a coal-mining subsistence land

Soil Science and Environment  2 Article number: 2  (2023)  |  Cite this article

Abstract: Carbon-fixing microbes can potentially improve soil fertility. However, the potential and function of carbon-fixing microbes remains largely uninvestigated in reclaimed soil of coal-mining subsidence areas. In this study, treatments included UL (uncultivated land), CK (maize cultivation without fertilization), NPK (maize cultivation with chemical fertilizer), M (maize cultivation with manure), MNPK (maize cultivation with manure and chemical fertilizer) after 1-year reclamation in a typical coal mining subsidence area. Quantitative PCR, enzyme-linked immunosorbent assay (ELISA) and high-throughput sequencing were employed to investigate the topsoil carbon-fixing microbial biomass, RubisCO activity and community composition. The results showed that the dominant taxa (i.e., Proteobacteria, Cyanobacteria, Devosia and Marichromatium) were significantly changed after reclamation (P < 0.05). Carbon-fixing microbial community structure in fertilization treatments (NPK, M and MNPK) obviously differed from non-fertilizer treatments (UL and CK). Soil organic carbon and microbial biomass carbon were significantly higher in fertilization treatments than non-fertilizer treatments (P < 0.05). M significantly increased RubisCO activity and cbbL gene abundance (P < 0.05), MNPK significantly increased carbon-fixing microbial richness (P < 0.05). Carbon-fixing microbial community structure was strongly influenced by soil moisture, catalase, total phosphorus and dissolved organic carbon. Some environmental factors indirectly influenced SOC by affecting carbon-fixing microbial biomass, diversity and community structure. Our study implies that even short-term (1-year) reclamation and fertilization could significantly influence carbon-fixing microbial community structure and promote soil carbon accumulation, and the fertilization treatments with manure (M and MNPK) were more conducive, which indicated that carbon-fixing microbes were greatly conducive to improve soil fertility in reclaimed mining areas and achieve carbon neutrality.

    • Coal is one of the most crucial energy sources worldwide. Chinese coal production increased from 3.41 billion tons in 2016 to 4.13 billion tons in 2021 (National Bureau of Statistics, 2022). In China, about 95% of the coal is from underground mining (Wang et al., 2020). This activity can lead to a decline in soil fertility, arable land reduction and environmental pollution in mining areas. Therefore, it is urgent to conduct ecological reconstruction of mining areas. Reclamation is an efficient solution to reconstruct the ecological environment in coal-mining subsidence area, and soil fertility quality restoration is critical to land reclamation. Soil organic carbon (SOC) is an important soil fertility quality indicator. Higher SOC usually indicates better soil quality (Bandyopadhyay & Maiti, 2019). Microbes in soil can assimilate CO2 and convert it into SOC (Antonelli et al., 2018). Carbon-fixing microbes play a crucial role in increasing SOC in barren soils where plant growth is limited (Su et al., 2013). Most of the carbon-fixing microbes are autotrophic. At present, six carbon-fixing pathways of autotrophic microbes have been elucidated (Fuchs, 2011), among which Calvin Benson-Bassham (CBB) cycle is the dominant pathway (Yu King Hing et al., 2019). Ribulose-1,5-bisphosphate carboxylase/oxygenase (RubisCO) is the key enzyme to control Calvin cycle rate, and has four (I, II, III, IV) forms (Tabita, 2004). Form I RubisCO was dominant in different soil environments and encoded by cbbL gene. The cbbL gene was highly conserved and widely present in the environment (Kusian & Bowien, 1997). Therefore, this gene is an effective biomarker to investigate autotrophic carbon-fixing microbial community in mining reclaimed soil.

      Many studies carried out in coal-mining areas have investigated the effects of reclamation on the diversity and activity of bacteria, archaea and fungi (Hou et al., 2018; Li et al., 2018; Wang et al., 2020). However, few of them have focused on carbon-fixing microbes in coal-mining areas. Notably, Čížková et al. (2018) found that the carbon fixation potential and microbial biomass in reclaimed soil were significantly higher than in unreclaimed lignite mining soil. Moreover, reclamation time of coal-mining areas significantly affect the abundance of carbon-fixing Acidobacteria, Bacteroidetes, Cyanobacteria, Firmicutes and Proteobacteria, and these phyla positively correlated with SOC (Ma et al., 2022). In addition to SOC, other environmental factors, such as pH and total nitrogen (Liu et al., 2022), can significantly affect community structure of carbon-fixing microbes. Moreover, fertilization treatments also significantly altered cbbL-carrying bacterial community composition and diversity (Liu et al., 2022). However, the carbon-fixing microbial biomass, diversity and activity under different reclamation and fertilization treatments in reclaiming soil of coal-mining subsidence areas still remain unclear.

      In this study, real-time quantitative PCR, ELISA and high-throughput sequencing were used to measure the effects on carbon-fixing microbial community under different reclamation and fertilization treatments were measured in an underground coal-mining subsidence area of Shanxi Province, northern China. We aim to: (1) determine the effects of reclamation and fertilization on the soil carbon-fixing microbial biomass, RubisCO activity and community structure in coal-mining subsidence areas, (2) reveal the main soil biophysicochemical factors that influenced soil carbon-fixing microbial community. We hypothesize that carbon-fixing microbial community composition will markedly change after reclamation and fertilization due to altered soil properties, and the fertilization treatments with manure is more conducive to improving the soil carbon-fixing potential in a coal-mining subsidence area. We hope our study would provide implications for the effective soil fertility improvement from the perspective of carbon-fixing microorganisms in coal-mining area, which may also be conducive to achievement of carbon neutrality in agricultural ecosystems.

    • The experiment was conducted in a reclamation field in a coal-mining subsidence area of Shanxi Yuci Guanyao Yong'an Coal Industry Co., Ltd. (37°50′19.97″ N, 112°48′21.58″ E) (Supplemental Fig. S1), Shanxi Province, northern China. This region has a temperate continental monsoon climate, with mean annual precipitation of 462 mm, 175 frost-free days and 9−10 °C mean annual temperature. A large area of this land subsided due to underground coal mining. To reuse the subsided land, after the discontinuation of gangue discharge in 2019, the gangue landfill area was covered with 1 m-thick soil and mechanically leveled. The covering soil is raw and classified as calcareous cinnamon soil (Calciustepts). Its physicochemical properties were as follows: soil organic matter (SOM) 3.20 g·kg−1, total nitrogen (TN) 0.21 g·kg−1, available phosphorus (AP) 1.48 mg·kg−1, available potassium (AK) 79.00 mg·kg−1, pH 8.34.

      After the above engineering reclamation, the land was further biologically reclaimed since 2020 and five treatments were performed, including UL (uncultivated land), CK (maize cultivation without fertilization), NPK (maize cultivation with chemical fertilizer), M (maize cultivation with manure), MNPK (maize cultivation with co-fertilization of manure and chemical fertilizer). The manure was chicken manure compost containing 27.8% organic matter, 1.68% nitrogen, 1.54% P2O5 and 0.82% K2O. The chemical fertilizer contained urea (N, 46%), calcium superphosphate (P2O5, 12%) and potassium sulfate (K2O, 60%). The fertilizing quantity of each treatment is listed in Supplemental Table S1. Each treatment had three replicates, and each replicate plot was 10 m × 5 m = 50 m2 (n = 15). Maize (Zea mays Linn.) was sown in late April with a planting density of 60,000 ha−1 and harvested in late September in each plot.

      A total of 15 topsoil samples (0−20 cm, five treatments × three replicates) were collected using the five-point mixed sampling method in each plot at maize harvest in September, 2020 (1-year reclamation). The samples were sieved through a 2 mm mesh sieve after removal of plant residues and detritus. Each sample was then subdivided and respectively stored at 4 °C (for enzyme analysis), −80 °C (for microbial molecular biological analysis), or room temperature (for soil chemical analyses).

    • All the chemical properties were measured using routine methods (Tedesco et al., 1995). Soil moisture (SM) was determined by oven drying at 105 °C until a constant weight. pH was measured using a 1:2.5 (w/v) soil-water slurry. TN and alkaline nitrogen (AN) were determined using semimicro-Kjeldahl method and alkali N-proliferation method, respectively. Total phosphorus (TP) was measured via the alkali fusion-Mo-Sb anti-spectrophotometric method. AP was extracted using sodium bicarbonate and measured via the colorimetric method. Total potassium (TK) and AK were respectively extracted using sodium hydroxide and ammonium acetate, and measured by flame photometry. SOC was determined using potassium dichromate volumetric method. Soil microbial biomass carbon (MBC) was determined using the chloroform-fumigation extraction method by Vance et al. (1987). Soil dissolved organic carbon (DOC) was extracted following the procedure by Zhu et al. (2015). Soil particulate organic carbon (POC) concentration was measured according to Cambardella & Elliott (1992). Soil easily oxidizable organic carbon (EOC) was measured using the potassium permanganate oxidation method (Blair et al., 1995).

    • The activity of soil catalase (CAT) was determined from titration of KMnO4 consumption (Lin, 2010). RubisCO enzyme activity of the soil samples was measured by immunoassay (ELISA) kit of RubisCO enzyme (Sangon Biotech, China) according to the manufacturer’s instructions.

    • DNA of each sample was extracted from 0.25 g −80 °C stored soil using PowerSoil DNA Isolation Kit (QIAGEN, Germany). Then 1% agarose gel electrophoresis and a NanoDrop 2000 spectrophotometer (Thermo Fisher Scientific, USA) were used to evaluate the quality and quantity of extracted DNA.

      The abundance of carbon-fixing microbes and bacteria were quantified using absolute quantitative PCR (qPCR) with the cbbL gene primer (K2F: 5′-ACCAYCAAGCCSAAGCTSGG-3′, V2R: 5′-GCCTTCSAGCTTGCCSACCRC-3′) and bacterial 16S rRNA gene primer (338F: 5′-CCTACGGGAGGCAGCAG-3′, 518R: 5′-ATTACCGCGGCTGCTGG-3′), respectively (Rasche et al., 2011; Tolli & King, 2005). Consequently, the cbbL/16S rRNA gene ratio was calculated to reflect the proportion of carbon-fixing bacteria in soil bacterial community. The qPCR mixture (final volume, 20 μL) included 10 μL of 2× SYBR® Premix (Biomed, China), 0.8 μL of each primer, 1.4 μL of DNA template and 7 μL of ddH2O. The thermocycling conditions were: initial denaturation at 95 °C (2 min in cbbL, 10 min in 16S rRNA), followed by 40 cycles of denaturation at 95 °C (15 s in cbbL, 30 s in 16S rRNA) and annealing at 60 °C for 1 min. Then the melting curve was used to verify the amplification specificity. The standard curves for both genes were constructed using tenfold dilution series (ranging from 102 to 108) of the recombinant plasmids containing target gene fragments from the soil. The qPCR efficiency of the cbbL and 16S rRNA gene were 102% (R2 = 0.999) and 98% (R2 = 0.998).

      Adequate amount of −80 °C stored soil samples were delivered to Shanghai Majorbio Bio-pharm Technology Co., Ltd (Shanghai, China) for sequencing of microbial cbbL gene with the primer set K2F/V2R on an Illumina MiSeq PE300 platform. The raw reads are available in SRA (Sequence Read Archive) database of NCBI with accession number PRJNA852533.

    • The raw cbbL gene sequencing reads were demultiplexed, quality-filtered by fastp version 0.20.0 and merged based on overlaps by FLASH version 1.2.7. Sequencing reads were assigned to each sample according to the unique individual barcodes. For further improvement of sequencing data quality, the original sequences were controlled and filtered by QIIME (Quantitative Insights into Microbial Ecology) software package. UPARSE standard pipeline (v7.0.1090, http://drive5.com/uparse/) was utilized to cluster high-quality sequences into operational taxonomic unit (OTU) with a 97% similarity, and chimera was identified and removed (Edgar, 2013). The representative sequences of each OTU were compared with related sequences retrieved from NCBI (National Center for Biotechnology Information) database to assign a taxonomic classification using BLAST (Huang et al., 2021a).

      Alpha diversity analysis, including Sobs index (S), Shannon-Wiener diversity (H) (Wei et al., 2011), and Pielou index (J) (Yuan et al., 2016), were calculated using Microsoft Excel 2019 software. Sobs index was the observed OTU number (Qin et al., 2019). Linear discriminant analysis (LDA) effect size (LEfSe, http://huttenhower.sph.harvard.edu/galaxy) (Segata et al., 2011) was performed to screen enriched bacterial taxa in soils under different treatments.

      Principal component analysis (PCA) and biclustering heatmap analysis were used to identify the differences of the carbon-fixing microbial community among different treatments using ade4 package and ComplexHeatmap package of R (v.4.0.3), respectively.

      The Vegan package (v2.5.2) in the R (v4.0.3) was used to conduct calculation of Variance inflation factors (VIF), Redundancy analysis (RDA) between the carbon-fixing microbial community structure and environmental variables, and variance partitioning analysis (VPA). VIF were used as the criterion for distinguish collinearity among explanatory variables, environmental variables with VIF > 5 were eliminated before RDA and VPA (Zhang et al., 2022). According to the RDA results, structural equation modeling (SEM) was constructed using IBM SPSS AMOS 24.0. Based on the influence and relationship among known factors, the model was fitted with the maximum likelihood estimation method. The fitness of the model was evaluated via low χ2/df (χ2/df < 3, the closer χ2/ df is to 1, the better is the model fit, P > 0.05), high goodness-of-fit index (GFI > 0.89), low root mean square error of approximation (RMSEA < 0.01, if RMSEA = 0, it means complete fitness of the model) and low akaike information criterion (AIC) (Shipley, 2000).

      Microsoft Excel 2016 software was utilized for initial data analysis, SPSS 26.0 software was utilized for one-way ANOVA and multiple comparisons (Duncan post hoc test, P < 0.05).

    • Soil properties among different treatments are listed in Table 1. For basic physicochemical and enzymatic properties, compared with UL, TN was significantly increased in NPK, M and MNPK (P < 0.05), AP was significantly increased in NPK and MNPK (P < 0.05), TK was significantly decreased in the other four treatments (P < 0.05). The highest pH was in UL. Compared with CK, NPK, M and MNPK increased contents of TN, AP, AK and CAT, but decreased contents of SM, AN and TP. Compared with CK, TN and CAT were significantly higher in M and MNPK (P < 0.05).

      Table 1.  Soil biophysicochemical properties in different treatments

      IndexTreatments
      ULCKNPKMMNPK
      SM (g·kg−1)0.17 ± 0.02ab0.19 ± 0.02a0.15 ± 0.01b0.18 ± 0.01ab0.15 ± 0.01b
      pH8.27 ± 0.09a7.86 ± 0.49a7.85 ± 0.42a8.15 ± 0.06a8.14 ± 0.13a
      TN (g·kg−1)0.27 ± 0.04c0.32 ± 0.06bc0.40 ± 0.07b0.56 ± 0.01a0.59 ± 0.06a
      AN (mg·kg−1)304.05 ± 0.00ab344.59 ± 11.50a302.85 ± 30.84ab315.97 ± 145.67ab174.08 ± 99.02b
      TP (g·kg−1)0.38 ± 0.00a0.69 ± 0.46a0.39 ± 0.20a0.35 ± 0.28a0.39 ± 0.20a
      AP (mg·kg−1)5.09 ± 0.00b10.93 ± 0.26ab17.68 ± 5.80a12.14 ± 0.80ab18.65 ± 7.16a
      TK (g·kg−1)5.61 ± 0.00a3.72 ± 0.74b2.88 ± 1.40b3.20 ± 0.03b4.01 ± 0.70b
      AK (mg·kg−1)80.06 ± 0.00a74.71 ± 8.34a77.39 ± 8.34a86.73 ± 10.08a86.74 ± 15.17a
      CAT (ml·g−1)2.15 ± 0.06a1.52 ± 0.22b1.65 ± 0.03b2.22 ± 0.05a1.97 ± 0.26a
      SOC (g·kg−1)1.74 ± 0.00c1.55 ± 0.08c2.07 ± 0.17b3.35 ± 0.24a3.12 ± 0.04a
      MBC (mg·kg−1)9.85 ± 0.45d17.06 ± 1.50c19.72 ± 0.58b37.78 ± 2.29a37.45 ± 0.82a
      DOC (g·kg−1)0.09 ± 0.01a0.09 ± 0.02a0.08 ± 0.01a0.08 ± 0.01a0.08 ± 0.01a
      POC (g·kg−1)0.24 ± 0.23a0.28 ± 0.15a0.52 ± 0.12a0.60 ± 0.18a0.71 ± 0.57a
      EOC (g·kg−1)1.58 ± 0.22a1.48 ± 0.58a1.34 ± 0.35a1.93 ± 0.46a1.65 ± 0.69a
      Values indicate mean ± standard deviations (n = 3). Different letters in each row represent a significant difference among treatments (one-way ANOVA, P < 0.05).

      For soil carbon relevant properties, NPK, M and MNPK increased POC, and significantly increased SOC, MBC compared with UL and CK (P < 0.05). MBC was significantly higher in four other treatments than UL (P < 0.05).

    • Soil RubisCO activity are depicted in Fig.1a and significant differences were observed among treatments. Compared with other treatments, M treatment significantly increased RubisCO activity (P < 0.05). RubisCO activity was the lowest in NPK and had no significant difference among UL, CK and MNPK (P > 0.05).

      Figure 1. 

      (a) Soil RubisCO activity and (b) cbbL gene abundances in different treatments. Values are means (n = 3), and error bars represent standard deviation. Different lowercase letters above columns indicate significant differences (one-way ANOVA, P < 0.05) among treatments.

      Soil cbbL gene abundance was depicted in Fig. 1b and was significantly the highest in M (2.07 × 10⁷ copies/g dry soil, P < 0.05), which was consistent with RubisCO activity. Moreover, the ratio of cbbL/16S rRNA in M was also significantly the highest (3.37%) (Supplemental Fig. S2). The lowest cbbL gene abundance was in CK (7.92 × 10⁵ copies/g dry soil). Compared with CK, cbbL gene abundance was increased 4.18, 25.18 and 8.74 times in NPK, M and MNPK, respectively. But there was no statistical difference among UL, CK, NPK and MNPK treatments.

    • A total of 6,140,983 raw sequences were obtained. Each sample contained 34931 high quality sequences after quality filtering and subsampling (normalizing the sequence number according to the minimum sample). All the sequences were further classified into 17 phyla, 43 classes, 84 orders, 160 families, 361 genera and 3719 OTUs. The rarefaction curve (Supplemental Fig. S3) showed that the current sampling depth included most carbon-fixing microbial taxa in the samples and was sufficient for further analyses.

      Based on sequencing data, the α diversity indices (Sobs Richness, Shannon-Weaver Diversity, Pielou Evenness indices) of the carbon-fixing microbes in different treatments are depicted in Supplemental Fig. S4. The highest values of Sobs, Shannon-Weaver and Pielou indices were in MNPK, and Sobs index was significantly higher than the other four treatments (P < 0.05). The Shannon-Weaver and Pielou indices were higher in NPK, M and MNPK than CK. They suggested that fertilization increased soil microbial diversity and evenness, especially in the MNPK, and MNPK also significantly improved soil microbial richness (P < 0.05).

      Furthermore, carbon-fixing microbial community composition at phylum level and class level are shown in Fig. 2a & b, respectively. The dominant phyla were Proteobacteria (73.26%−86.23%), Cyanobacteria (5.58%−17.69%) and Actinobacteria (2.16%−5.40%), comprising 91.15%−96.00% of the sequences. The dominant classes were Alphaproteobacteria (43.07%−70.18%), Betaproteobacteria (11.68%−21.60%), Gammaproteobacteria (1.77%−8.55%), Cyanophyceae (4.81%−15.14%), Cyanobacteria (0.64%−1.96%) and Actinobacteria (1.93%−5.04%), comprising 90.36%−95.78% of the sequences. It is worth noting that carbon-fixing fungi and archaea were also detected, which were not reflected in the figure due to relatively low abundance. In addition, the top 10 dominant genera were Bradyrhizobium, Rhodopseudomonas, Noviherbaspirillum, Cyanobium, Variovorax, Devosia, Marichromatium, Mesorhizobium, Nitrobacter and Thermoleptolyngbya, comprising 66.84%−88.26% of the sequences.
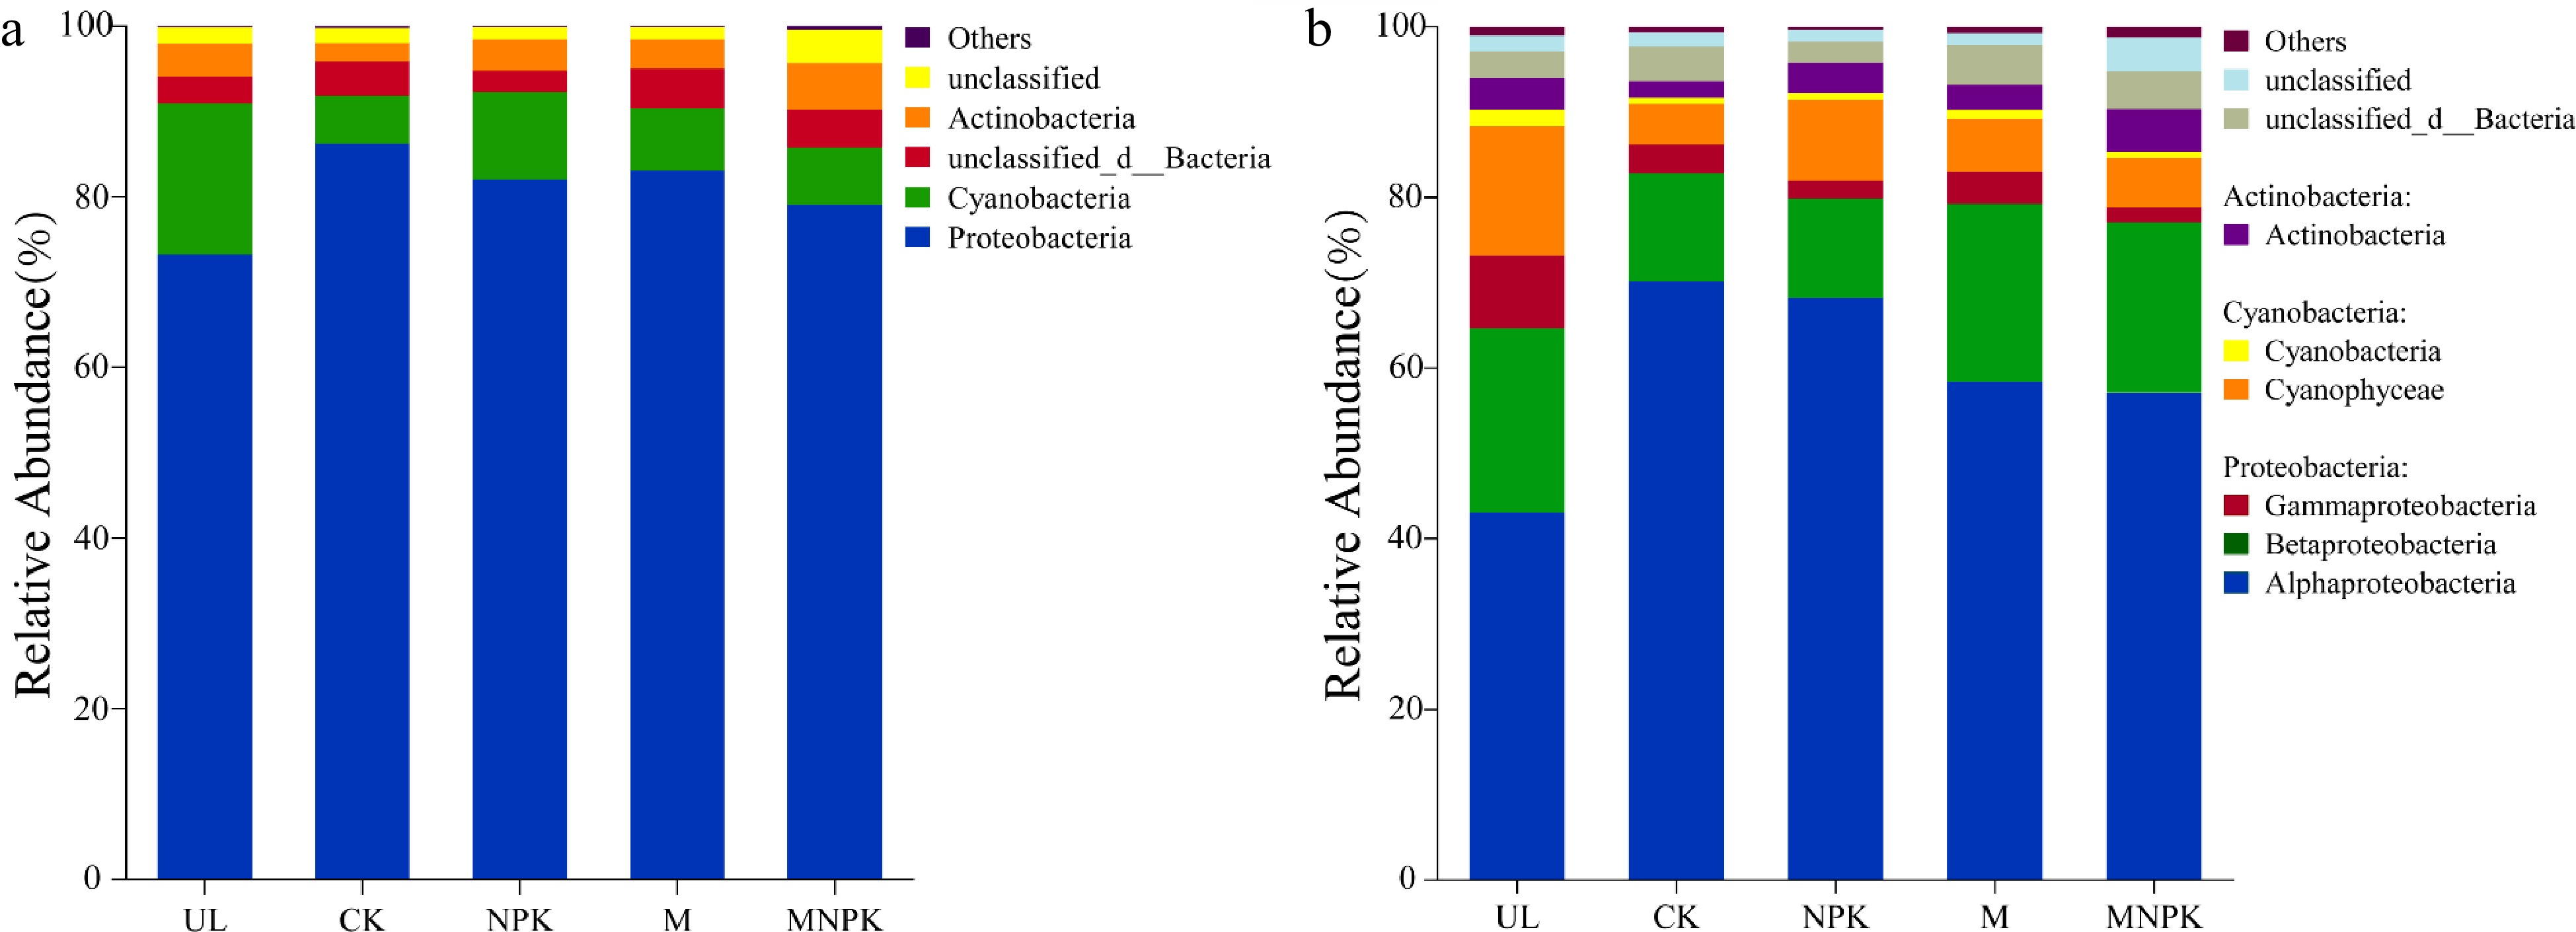
      Figure 2. 

      Taxonomic composition of carbon-fixing microbial communities in soils at (a) phylum level and (b) class level.

      Supplemental Table S1 showed that the relative abundances of the phyla Proteobacteria, Cyanobacteria and Actinobacteria were significantly different among treatments. Compared with UL, the other four treatments increased Proteobacteria, while significantly decreased Cyanobacteria (P < 0.05). NPK, M and MNPK increased Cyanobacteria and Actinobacteria, but decreased Proteobacteria compared with CK.

      Supplemental Table S2 showed that the relative abundances of the classes Alphaproteobacteria, Gammaproteobacteria, Cyanophyceae, Cyanobacteria and Actinobacteria were significantly different among treatments. Compared with UL, the other four treatments increased Alphaproteobacteria, but significantly decreased Gammaproteobacteria, Cyanophyceae and Cyanobacteria (P < 0.05). NPK, M and MNPK increased Cyanobacteria and Actinobacteria, but decreased Alphaproteobacteria compared with CK.

      LefSe analysis was applied to ascertain the biomarkers, which were significantly enriched carbon-fixing microbial taxa in certain treatments (Fig. 3a). There were 17 biomarkers with LDA score > 3.5, 16 of which belonged to Proteobacteria phylum. Therefore, reclamation mainly influenced the assembly of proteobacteria, which was consistent with the results of carbon-fixing microbial community composition (Fig. 2a). Compared with UL, class Alphaproteobacteria was significantly enriched in four other treatments; family Bradyrhizobiaceae was significantly enriched in NPK and MNPK; family Comamonadaceae was significantly enriched in M and MNPK; family Phyllobacteriaceae, genus Mesorhizobium and genus Nitrobacter were significantly enriched in MNPK; family Devosiaceae and genus Devosia were significantly enriched in CK. Compared with four other treatments, five biomarkers were significantly enriched in UL, namely class Gammaproteobacteria, order Chromatiales, family Chromatiaceae and genus Marichromatium, i.e. these taxa were significantly decreased in all bioreclamation treatments (CK, NPK, M and MNPK).
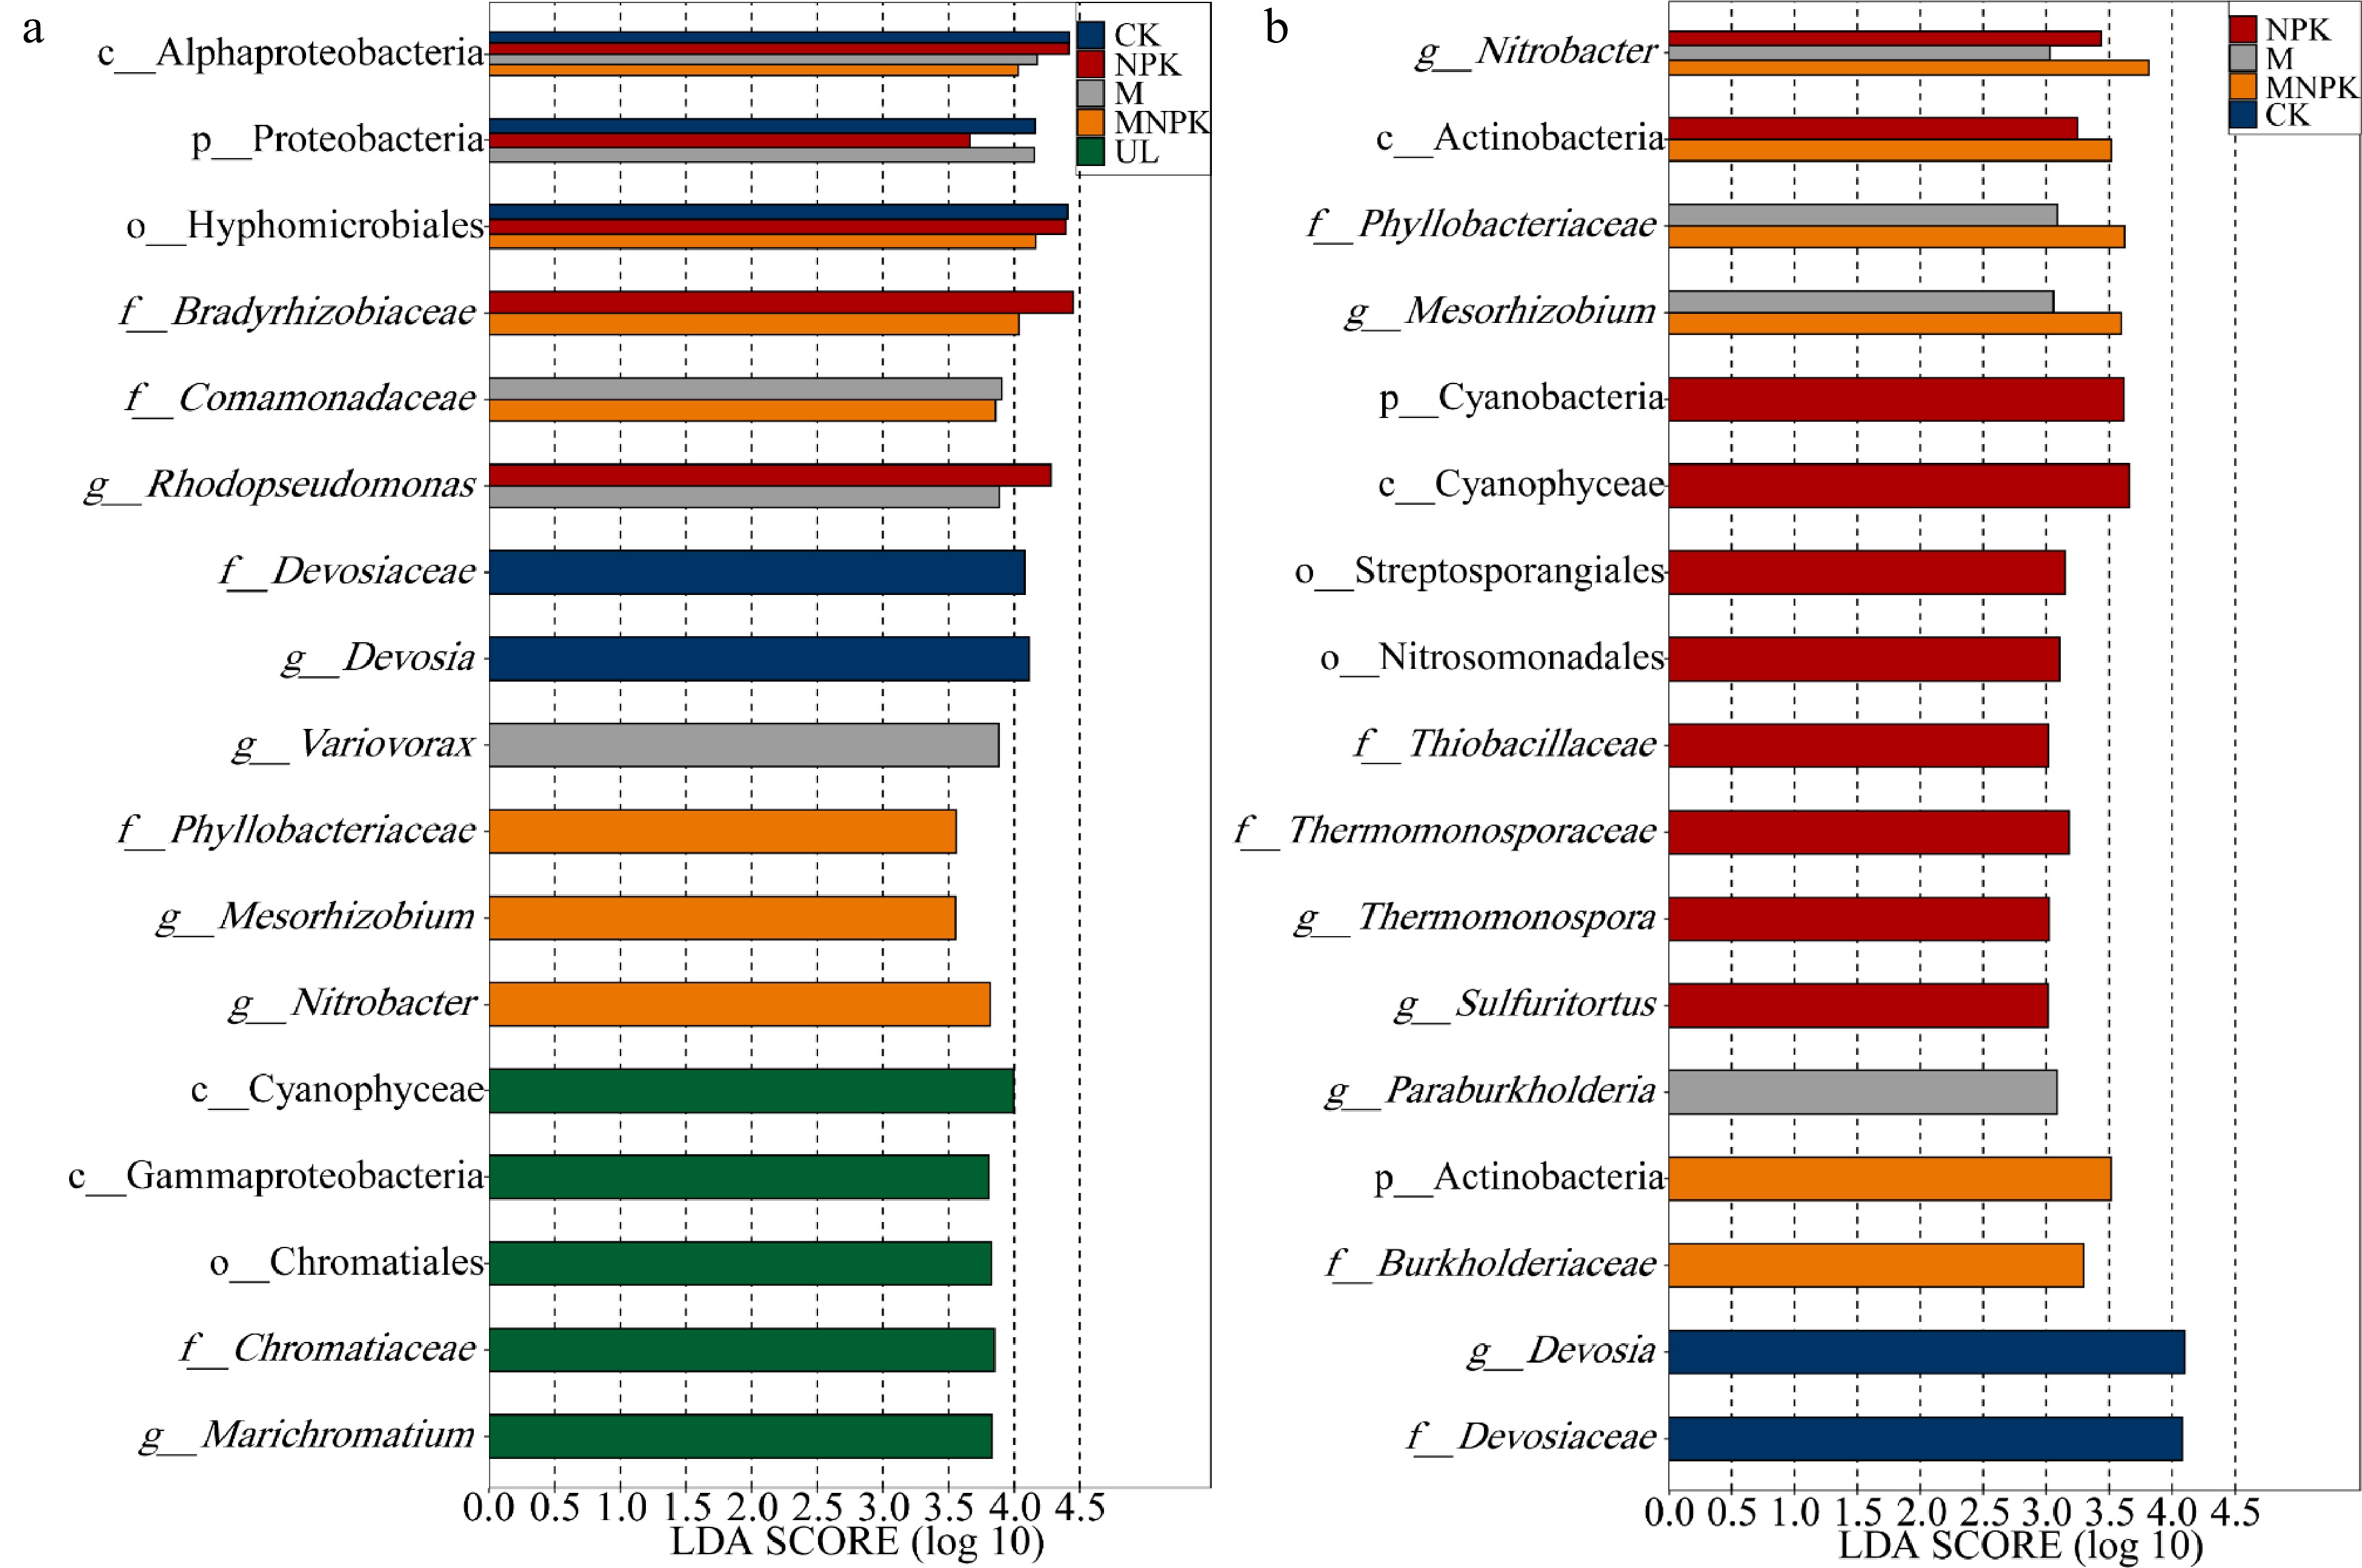
      Figure 3. 

      Linear discriminant analysis (LDA) effect size analysis determined biomarkers (a) between UL and other treatments (CK, NPK, M and MNPK) and (b) between CK and fertilization treatments (NPK, M and MNPK). The LDA score indicates the effect size and ranking of each differentially abundant taxon (P < 0.05, LDA score > 3.5, a) (P < 0.05, LDA score > 3.0, b). The ordinate is the taxon with significant difference among groups, and the abscissa is a bar chart to visually show the LDA log score of each taxon. Blue, red, gray and orange bars represent the biomarkers in CK, NPK, M and MNPK having significantly greater abundances than in UL, respectively (a). Green bars represent the biomarkers in UL having significantly greater abundances than in all the other four treatments (a). Gray orange and red bars represent the biomarkers in M MNPK and NPK having significantly greater abundances than in CK, respectively (b). Blue bars represent the biomarkers in CK having significantly greater abundances than in all the other three treatments (b).

      There were 17 biomarkers with LDA score > 3.0 (Fig. 3b), 10, five and two of them respectively belonged to Proteobacteria, Actinobacteria and Cyanobacteria phylum. Therefore, fertilization mainly influenced the assembly of these three phyla, which was consistent with the results of taxa composition mentioned in Fig. 2a. Compared with CK, genus Nitrobacter was significantly enriched in NPK M and MNPK; family Phyllobacteriaceae and genus Mesorhizobium were significantly enriched in M and MNPK; class Actinobacteria was significantly enriched in NPK and MNPK; Phylum Cyanobacteria, class Cyanophyceae, family Thiobacillaceae, genus Sulfuritortus, family Thermomonosporaceae and genus Thermomonospora were significantly enriched in NPK. Compared with NPK, M and MNPK, family Devosiaceae and genus Devosia were significantly enriched in CK, which means these taxa were significantly decreased in all fertilization treatments (NPK, M and MNPK).

    • Afterwards, PCA and biclustering heatmap analysis were applied to explore β-diversity of carbon-fixing microbes. PCA biplot showed that 35.93% of total variance in carbon-fixing microbial community structure was explained by the first two axes (Fig. 4). It also showed that five treatments were clearly differentiated into three clusters, UL and CK as cluster 1, M and MNPK as cluster 2, and NPK as cluster 3 along the PC2 axis, which indicated that the carbon-fixing microbial community structure among the three clusters was different. The score in PC2 axis significantly differed among each cluster (P < 0.05).
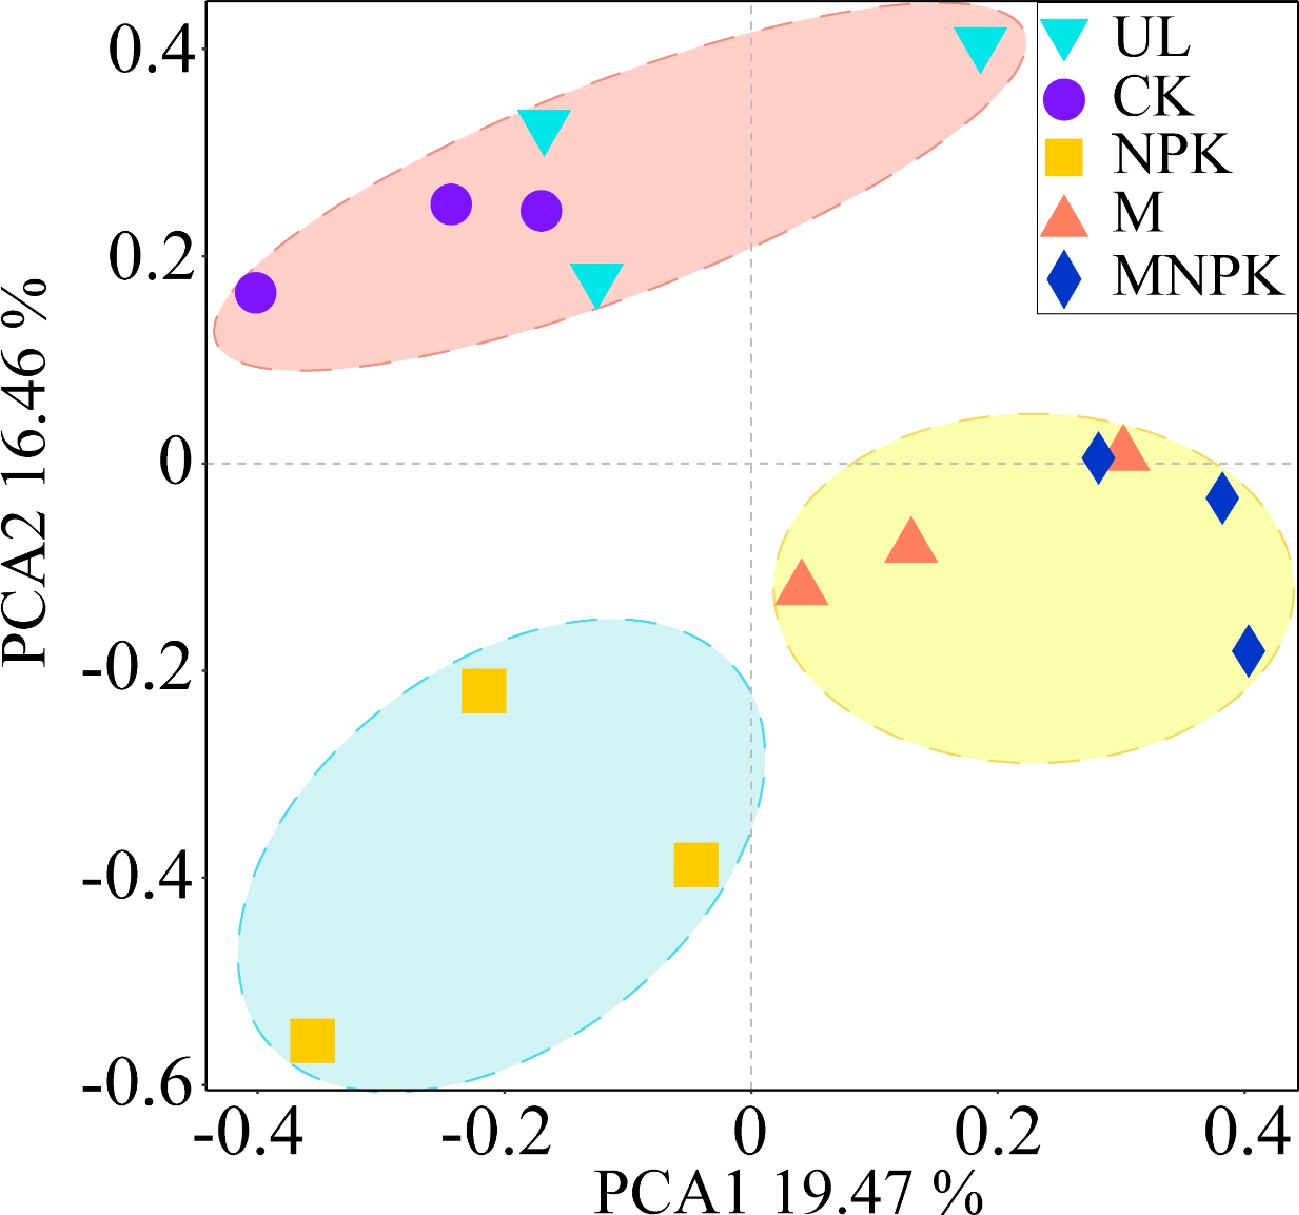
      Figure 4. 

      Principal component analysis (PCA) of the carbon-fixing microbial community in different treatments.

      Biclustering heatmap were also applied to explore the community structure of carbon-fixing microbes under different treatments (Fig. 5). Vertical clustering of heatmap showed that five treatments were classified into two clusters: M and MNPK were clustered together, while UL, CK and NPK formed a second cluster, and the second cluster was divided into two subclusters, UL and CK as a subcluster, NPK as another subcluster, which was consistent with PCA. Horizontal clustering of heatmap showed that the carbon-fixing microbial community structure differed among treatments. Compared with UL and CK, Actinomadura was increased in NPK, M and MNPK. Compared with the other three treatments Variovorax, Hydrogenophaga, Novosphingobium and Polumorphum harbored a higher relative abundance in M and MNPK. Pseudonocardia relative abundance was higher in NPK and MNPK than in three other treatments. Compared with four other treatments, Mesorhizobium, Nitrobacter, Cupriavidus, Rhodoferax, Rhodoblastus, Mycobacterium, Sphingomonas and Sinorhizobium were more abundant in MNPK. The relative abundance of Noviherbaspirillum, Marichromatium and Thermoleptolyngbya were higher in UL than in four other treatments.
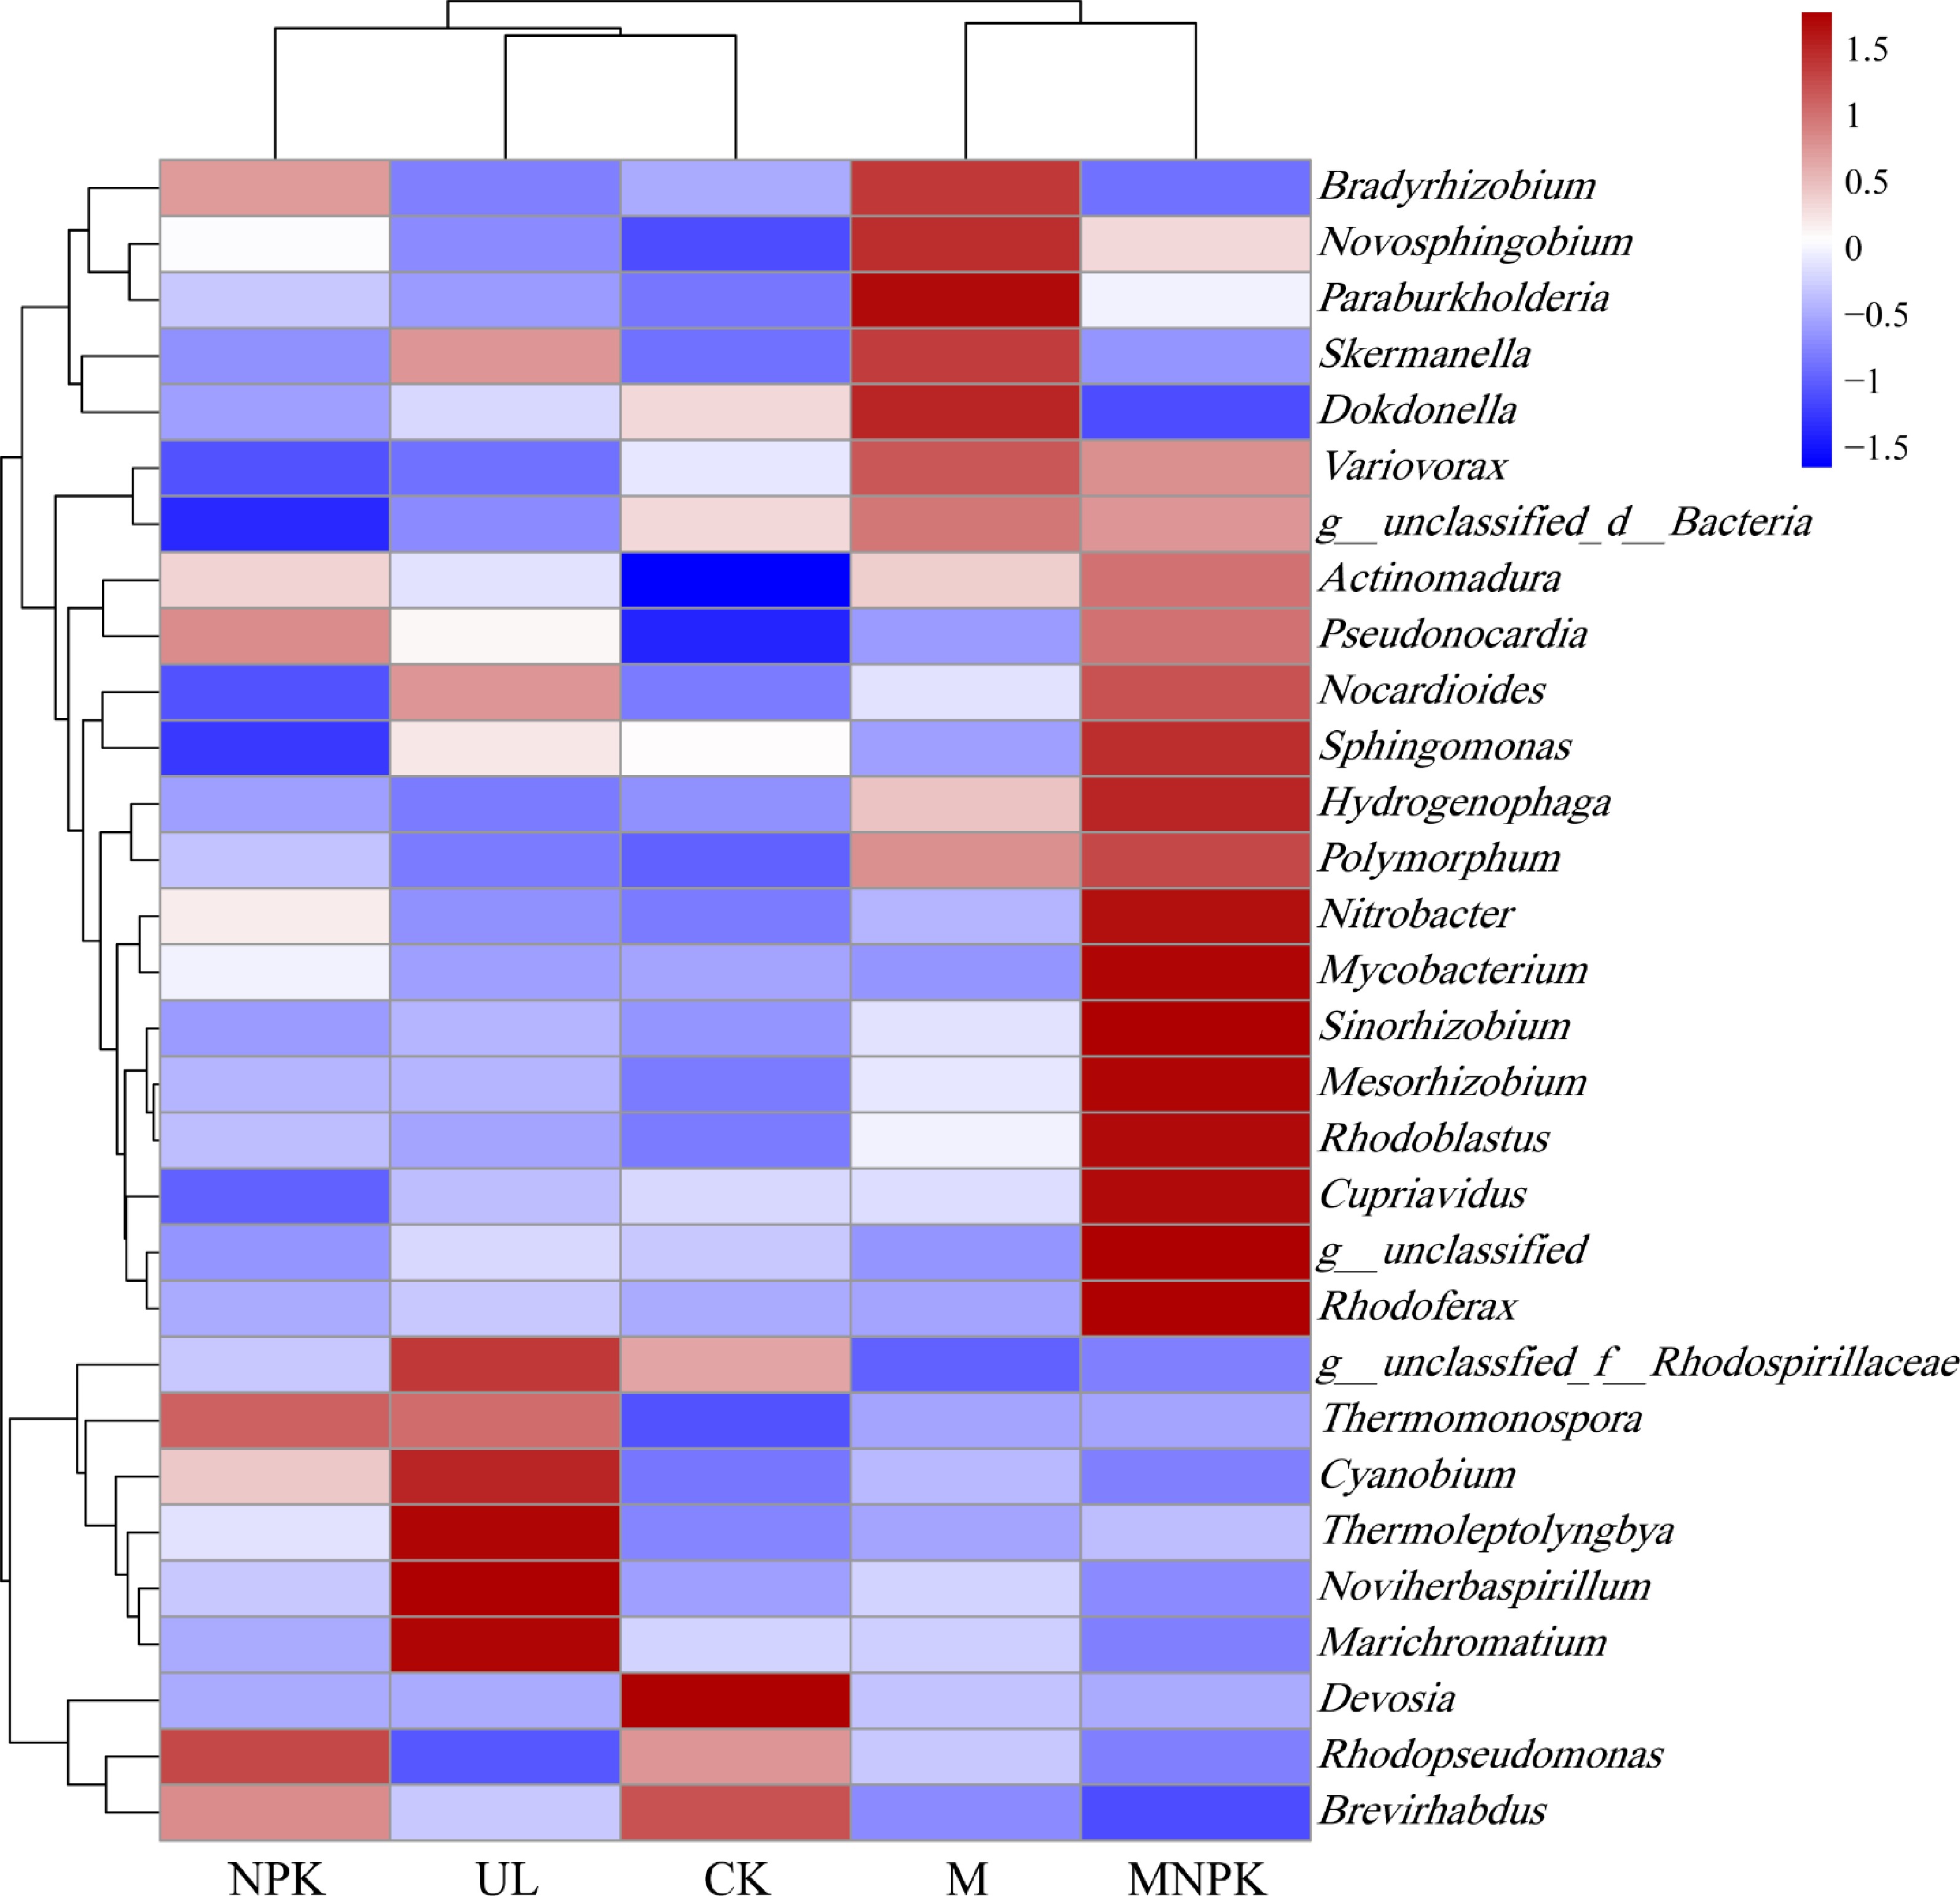
      Figure 5. 

      Biclustering heatmap of the carbon-fixing microbial distributions of the top 30 abundant genera is present in different treatments. The color intensity of the color lumps represents the abundance of the carbon-fixing microbial genera in different treatments, with red representing higher abundance and blue representing lower abundance.

    • RDA were utilized to investigate the correlation of soil properties with soil carbon-fixing microbial community structure. Soil properties with VIF > 5 were removed before RDA to avoid the effect of collinearity. Then, eight variables, including CAT, EOC, AP, DOC, AK, SM, TP and AN were screened out for RDA.

      The RDA (Fig. 6a) showed that the first two axes explained 41.93% and 11.45% of the total variance in soil carbon-fixing microbial community, respectively. The score in RDA2 axis significantly differed among treatments (P < 0.05). M and MNPK were clustered together and obviously separated from UL, CK and NPK, which was consistent with PCA and biclustering heatmap results. The soil properties with the highest explanatory proportion of soil carbon-fixing microbial community structure were SM (r = 0.6288, P = 0.001), CAT (r = 0.5508, P = 0.006), TP (r = 3972, P = 0.048), DOC (r = 0.3875, P = 0.041).
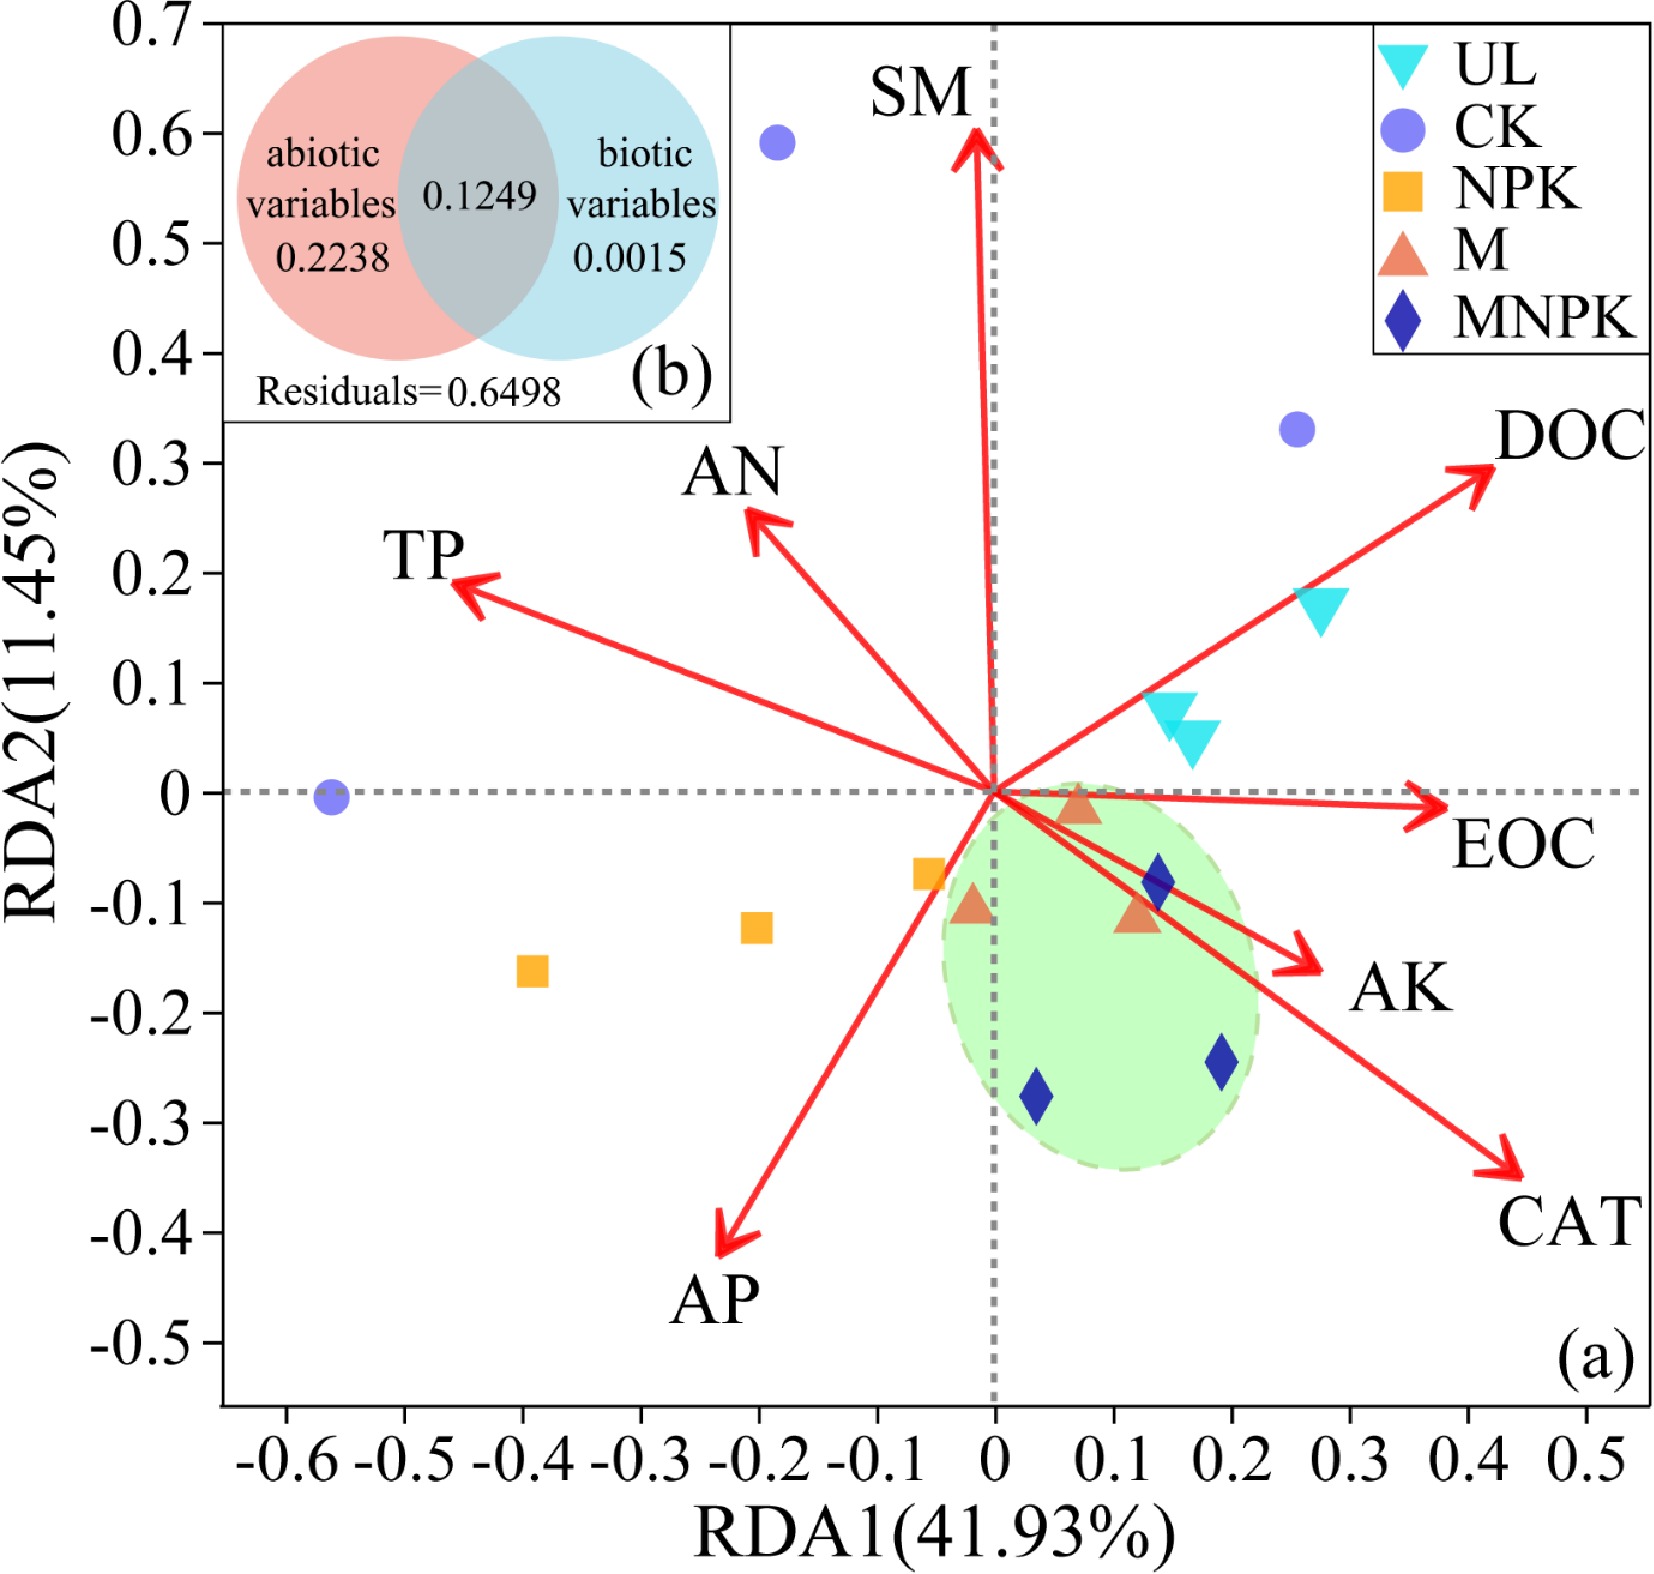
      Figure 6. 

      (a) Redundancy analysis (RDA) linking carbon-fixing microbial communities with environmental variables in different treatments. Arrows represent the correlation between the soil properties and carbon-fixing microbial communities. Variables that are angled at more than 90° of each other have the least correlation. The length of the arrow represents the correlation. Variables that have arrows extended in opposite directions correlate negatively to each other. (b) Diagrams explaining variance partitioning (VPA) show the relative contribution of ecological drivers with VIF < 5 to soil carbon-fixing microbial community structure. The abiotic variables include EOC, AP, DOC, AK, SM, TP and AN; the biotic variables include CAT. The numbers are the percentages of the total variables explained by the factors.

      To further unveil the relationship between carbon-fixing microbial community and environmental variables, the explanatory variables included in RDA were divided into two groups (abiotic variables and biotic variables) for VPA. The VPA (Fig. 6b) showed that abiotic variables were the more important factors affecting carbon-fixing microbial community assembly. The abiotic variables and biotic variables explained 22.38% and 0.15% of the variation in the carbon-fixing microbial community, respectively. Moreover, 64.98% of variation remained unexplained.

      Based on RDA and PCA, the dominant soil properties (CAT, DOC, TP and EOC) and fertilization treatments with different manure application doses that affected the structure of carbon-fixing microbial community, were further included in SEM analysis. SEM was applied to reveal the causal relationship among soil properties, treatments (manure application dose), RubisCO activity, community composition (loading score on the first PCA axis) (Li et al., 2015), cbbL gene abundance, α diversity (Shannon-Weaver diversity index) (Zhang et al., 2021) and soil carbon accumulation (Fig. 7). It also used to further explain and quantify the contribution of key factors influencing both carbon-fixing microbial community and soil carbon fixation.
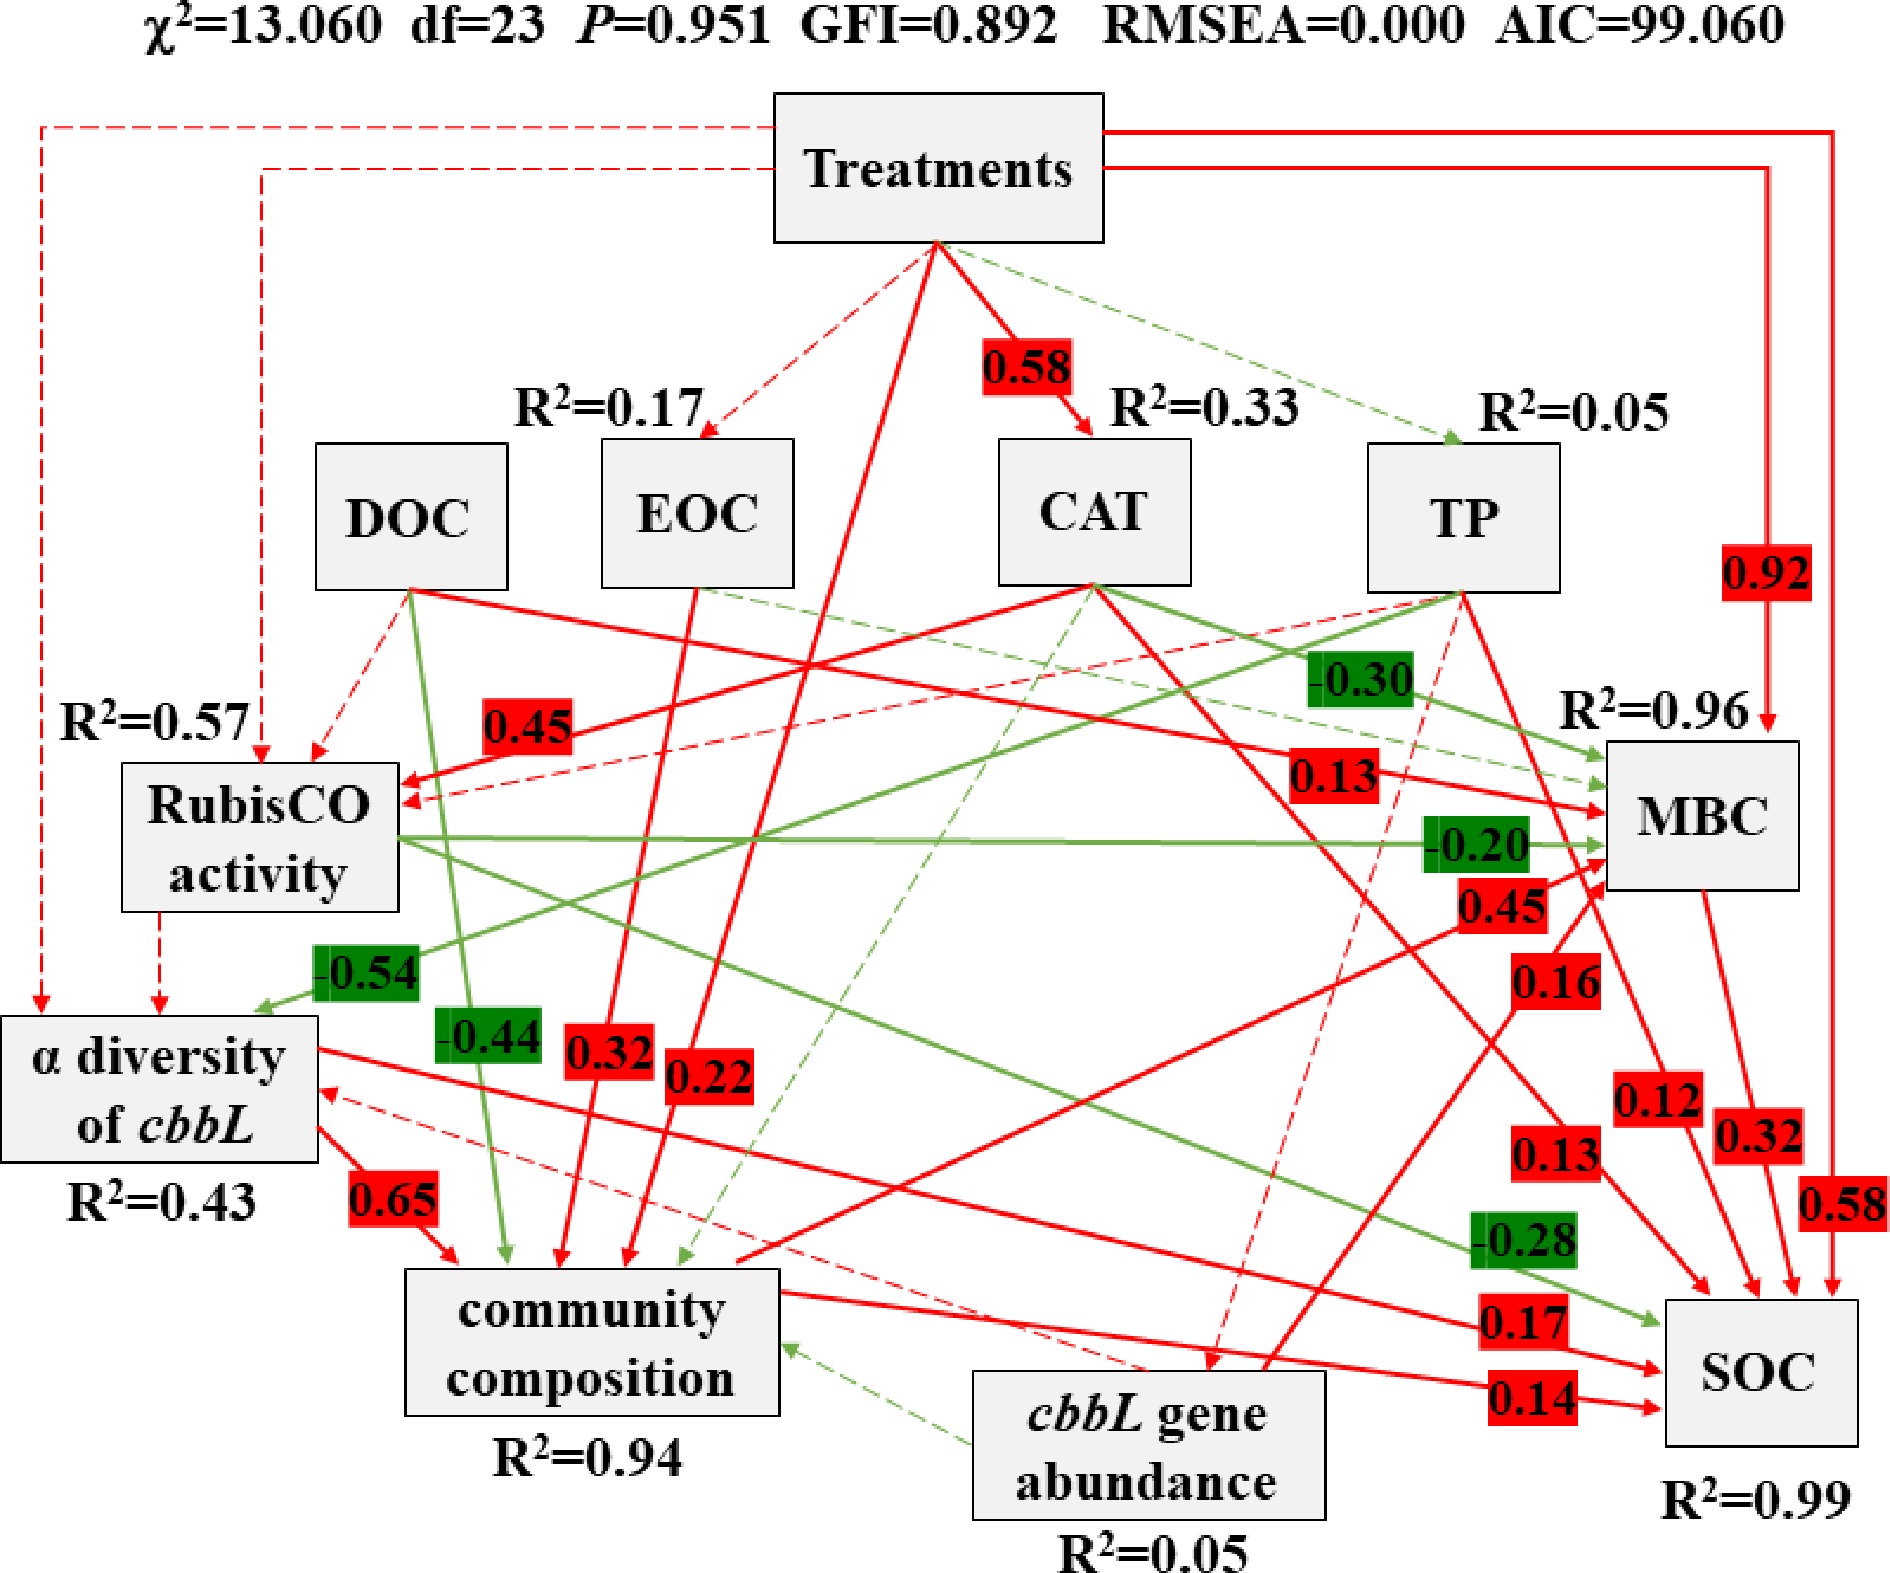
      Figure 7. 

      Structural equation model (SEM) shows the causal influences of treatments, DOC, EOC, CAT, TP, RubisCO activity, α diversity of cbbL, community composition (carbon-fixing microbial community), cbbL gene abundance, SOC and MBC. Positive and negative effects are respectively showed in red and green, and significant and non-significant effects are showed with solid and dashed arrow lines, respectively. The standardized coefficients are marked above each path (only marked significant effect paths) and indicate the expected impact of a unit standard-deviation change at one node on units of standard-deviation change in connected nodes. R2 values represent the proportion of the variance explained for each endogenous variable.

      This model is completely consistent with our causal hypothesis (χ2 = 13.060, df = 23, P = 0.951, GFI = 0.892, RMSEA = 0.000, AIC = 99.060) and it could explain 99%, 96%, 94%, 57% and 43% variance of the SOC, MBC, community composition, RubisCO activity and α diversity of cbbL, respectively. SOC was directly affected by treatments, MBC, TP, CAT, RubisCO activity, α diversity of cbbL and community composition and indirectly affected by DOC (standardized indirect effects = −0.15) and EOC (standardized indirect effects = 0.06). MBC was directly affected by treatments, CAT, DOC, RubisCO activity, community composition and cbbL gene abundance. Community composition was directly affected by treatments, EOC, DOC and α diversity of cbbL.

    • This study was defined to assess the restoration and responses of carbon-fixing microbial communities in coal-mining areas after different treatments. Among the different treatments, the comparison between UL and CK reveals the variations of carbon-fixing microbial communities before and after reclamation without fertilization. This study revealed significant increase of MBC after reclamation. This could be attributed to the increase of exogenous carbon and other nutrients needed for microbial growth, which promotes the proliferation of microbes, and leads to the increase of MBC after reclamation. Moreover, microbial residues, crop litter, roots and exudates were decomposed and transformed into humus, which promoted soil aggregates formation and changed soil structure, increased microbial proliferation and MBC.

      Additionally, Proteobacteria, Cyanobacteria and Actinobacteria were dominant phyla of carbon-fixing microbial communities under different treatments, which suggests that these were the major contributors to soil microbial carbon fixation, which was similar to the results of Badger & Bek (2008). LefSe analysis (Fig. 3) further suggested the importance of Proteobacteria and Cyanobacteria phyla in the soil reclamation process, Cao et al. (2020) and Ma et al. (2022) have shown similar results in their studies on Chinese coal-mining soils. In addition, compared to unreclaimed soil (UL), our study revealed that reclamation (CK) significantly enriched Proteobacteria and Devosia (P < 0.05), while significantly reduced Cyanobacteria and Marichromatium (P < 0.05). This may be because reclamation enriched soil nutrient such as TN and AP (Table 1), and Proteobacteria is classified as copiotrophs, which prefer nutrient-rich conditions (Lienhard et al., 2013). Devosia, a potential plant-associated nitrogen-fixing bacterium, enriched within the root endosphere (Sun et al., 2021), thereby there may be a link between the enrichment of Devosia and the increase of TN and AN with the growth of plants after reclamation. Cyanobacteria evolved and thrived in low-nutrient systems and oligotrophic systems, respectively (Reinl et al., 2021), the significant increase of other microbes reduced the proportion of Cyanobacteria after reclamation. Marichromatium, a photosynthetic bacterium, could utilize variety of carbon, nitrogen and sulfur sources (Parag et al., 2013), thereby Marichromatium has higher relative abundance in uncultivated land because of its adaptability to barren environments. Moreover, Zhang et al. (2017) reported that organic carbon source type would also affect Marichromatium abundance, so we speculated that reclamation may also alter the organic carbon composition, which provides a new direction for further research.

      The cbbL gene abundance, RubisCO activity and α diversity did not significantly differ before (UL) and after reclamation (CK). Moreover, PCA and biclustering heatmap showed that carbon-fixing microbial community structure was similar in CK and UL, which was inconsistent with other studies (Li et al., 2014). Cao et al. (2020) reported that soil microbial diversity and construction were strongly influenced by reclamation time. Soil improvement effect was positively correlated with soil reclamation time. Therefore, the above results of this study maybe because reclamation time in our study is too short to show obvious improvement effect of reclamation. Above all, reclamation even without fertilization in the initial stage could contribute to significant shifts in dominant taxa and MBC, and a trend of ecological recovery.

    • Previous studies have shown that one-year of reclamation with fertilization does improve soil fertility (Cheng, 2022; Gao et al., 2021). Different fertilization treatments greatly influence various fractions of carbon as well as carbon fixation (Wang et al., 2020). In our study, the comparison of M, NPK and MNPK with CK could reveal the effect of fertilization on carbon-fixing microbial communities. Our study showed that the reclamation with addition of fertilizers (NPK, M and MNPK) increased POC, SOC and MBC (P < 0.05) (Table 1), which was consistent with Anandakumar’s study (Anandakumar et al., 2022) in semi-arid areas of India. Carbon-fixing microbial community composition was significantly affected by fertilization (Figs 5 & 6). This may be because fertilization increased the nutrient elements required by carbon-fixing microbes, and thereby altered carbon-fixing microbial community structure. Moreover, Devosia was significantly decreased, while Nitrobacter was significantly enriched after fertilization (P < 0.05) (Fig. 3b). Xu et al. (2017) reported that Devosia was strongly positively correlated with AN. Therefore, it might because AN was the highest in CK (Table 1), Devosia was more suitable for growth and reproduction under CK treatment. Nitrobacter fixed carbon through Calvin cycle and may play a crucial role in coupling soil carbon (C) and nitrogen (N) cycles (Wang et al., 2019). These bacterial taxa are related to soil N cycle, which imply that influence of N cycle cannot be neglected in the study of soil C cycle, and it is essential to further simultaneously investigate microbes involved in soil C and N cycle.

      In addition, it should be noted that there were significant separations of the carbon-fixing microbial community structure between the chemical fertilizer treatment (NPK) and manure and manure with chemical fertilizer treatments (M and MNPK) based on Figs 5 & 6. Moreover, MBC, SOC and TN were significantly higher in manure treatments (M and MNPK), compared with chemical fertilizer, which was consistent with Huang et al. (2021b). The application of manure (M) significantly increased carbon-fixing microbial biomass, the cbbL/16S rRNA ratio and RubisCO diversity. It may be because that mining area soil is relatively barren, and manure can increase organic matter more directly and effectively (Dennis et al., 2010), higher organic carbon content promoted facultative autotrophic bacterial growth and resulted in a high carbon-fixing microbial biomass (Yuan et al., 2012). Compared with CK, the application of manure with chemical fertilizer (MNPK) significantly increased richness of carbon-fixing microbial community, which was similar with Ding et al. (2016). This is because the combination of manure and chemical fertilizer not only supplemented the input of organic carbon, improved the availability of nutrients and water retention capacity, but also improved soil physical properties, which greatly stimulated carbon-fixing microbial community and activity (Guo et al., 2010), increased carbon-fixing microbial richness. However, RubisCO activity was significantly reduced by chemical fertilizer (NPK) compared with non-fertilized treatments (CK), but the carbon-fixing microbial biomass and α diversity was not significantly affected, which was consistent with the report by Jing et al. in China (Jing et al., 2021). This may be due to the application of chemical fertilizer leads to the great increase in soil phosphorus (P) (Table 1), which limit or co-limit the growth of soil autotrophic microorganisms (Yuan et al., 2015). In summary, compared with CK, the application of manure (M) improves the carbon-fixing microbial activity and abundance significantly, thereby promotes soil carbon fixation and ecological restoration in the mining area, while the application of manure with chemical fertilizer (MNPK) is more conducive to the improvement of carbon-fixing microbial diversity.

    • Environmental factors affecting soil carbon storage remain largely unknown, particularly in mining reclamation ecosystems, where biophysicochemical properties were key factors indirectly affecting variation in soil carbon storage by affecting the biomass, diversity and community structure of carbon-fixing microbes (Li et al., 2018). This study indicated that SM CAT, TP and DOC were the key factors significantly influencing soil carbon-fixing microbial community structure based on RDA. The effect of SM and CAT on carbon-fixing microbial community structure were significant and greater than that of TP and DOC.

      This study showed that even the differences of DOC and EOC did not reach statistically significant levels after reclamation and fertilization, they still exert marked effect on the variations of soil carbon-fixing microbial community. Carbon-fixing microbes are sensitive to the DOC and EOC content (Li et al., 2020), thereby DOC and EOC directly influence microbial composition. Our study revealed that the changes in DOC and EOC caused by reclamation and fertilization can affect carbon-fixing potential through affecting carbon-fixing microbial community composition. Relative to carbon-fixing microbial abundance and diversity, DOC and EOC made a greater contribution to the alteration of microbial carbon-fixing potential, which was consistent with previous research in Chinese Loess Plateau (Xiao et al., 2018).

      RubisCO activity was positively correlated with CAT, which was because CAT accelerates the decomposition of H2O2 and other harmful substances, thereby promoting the conversion of substances and energy in the soil and providing favorable environment for the survival of carbon-fixing microbes (Ma et al., 2022). A great deal of research revealed that SOC was positively correlated with RubisCO activity (Tang et al., 2015; Techtmann et al., 2012; Yuan et al., 2011), which was opposite with our study result. This may be because at the beginning of the reclamation, new equilibrium relationship between SOC fixation and mineralization has not been established, and SOC has not reached the stage of gradual accumulation.

      SEM results indicated that in addition to soil properties, fertilization treatments with different manure application doses also affected carbon-fixing microbial community composition. This may due to application of manure could loosen soil, improve soil aeration, enhance carbon-fixing microbial activity, and change carbon-fixing microbial community composition (Shao et al., 2019). SOC and MBC were positively correlated with fertilization treatments with different manure application doses, which was because manure was rich in organic matter, SOC increased with the increase of manure application dose. Moreover, the application of manure promoted the decomposition of original SOC by priming effect, increased the carbon and other nutrients needed for microbial growth, thereby promotes microbial proliferation and increases MBC (Martín-Lammerding et al., 2015). Our study showed that microbial evolution trends in the complex environment of mining areas was not completely consistent with other studies. This is because there are other factors not included that altered carbon-fixing microbial community structure (Fig. 7), and soil types and soil characteristics varied in different regions, it is difficult to obtain an entirely consistent effect pattern of soil biophysicochemical properties on carbon-fixing microbial communities in different regions.

      Overall, the results confirmed the hypothesis that carbon-fixing microbes play a crucial part in soil carbon sequestration in barren coal mining areas even after only a short-term reclamation and fertilization. The results also highlighted reclamation and fertilization significantly altered carbon-fixing microbial diversity and community, and improved potential ecosystem function. Our future research will further explore the isolation of carbon-fixing microbial strain and its application as microbial fertilizer in reclaimed soil of coal-mining subsidence areas, which would further facilitate soil fertility improvement in coal mining subsidence area.

    • Our study revealed that reclamation even without fertilization in the initial stage could bring significant shifts in MBC and dominant taxa (i.e., Proteobacteria, Cyanobacteria, Devosia and Marichromatium) and showed a trend of ecological recovery. Moreover, reclamation with fertilization significantly increased SOC and MBC (P < 0.05) and significantly altered carbon-fixing microbial community composition. Among these fertilization treatments, the application of manure (M) is more conducive to increasing carbon-fixing microbial abundance, the cbbL/16S rRNA ratio and RubisCO activity in the current short-term reclamation. SM, CAT, TP and DOC were the key factors significant influencing soil carbon-fixing microbial community structure, which provided a theoretical basis for improving the carbon-fixing potential. Reclamation and fertilization could significantly influence carbon-fixing microbial community structure (P < 0.05) and increase soil carbon storage due to altered soil properties and manure application dose. The fertilization treatments with manure were more conducive to improving the soil carbon-fixing potential. These findings contributed to improving soil fertility and accelerating ecological restoration and reconstruction in the mining area.

      • This work was financially supported by the National Natural Science Foundation of China (41907215), the Incentive Research Foundation of Shanxi Province for Recruited Doctoral Talents (SXYBKY2018009), the Science and Technology Innovation Foundation of Shanxi Agricultural University (2018YJ24) and the Natural Science Research Project of Shanxi Province (202103021224171).

      • The authors declare that they have no conflict of interest.

      • Supplemental Fig. S1 Schematic diagram of the geographic location of the study site.
      • Supplemental Fig. S2 16S rRNA abundance (a) and cbbL/16S rRNA gene ratio (b) in different treatments. Values are means (n=3), and error bars represent standard deviation. Different lowercase letters above columns indicate significant differences (one-way ANOVA, P<0.05) among treatments.
      • Supplemental Fig. S3 Rarefaction curves of operational taxonomic unit (OTU) numbers.
      • Supplemental Fig. S4 Sobs Richness Index (a), Shannon-Weaver Diversity Index (b), Pielou Evenness Index (c) charts of the carbon-fixing microbial community. The error bars represent standard deviation. Different lowercase letters above columns indicate difference (one-way ANOVA, P<0.05) among treatments.
      • Supplemental Table S1 The relative abundance of dominant phylum in different treatments.
      • Supplemental Table S2 The relative abundance of dominant classes in different treatments.
      • Copyright: © 2023 by the author(s). Published by Maximum Academic Press, Fayetteville, GA. This article is an open access article distributed under Creative Commons Attribution License (CC BY 4.0), visit https://creativecommons.org/licenses/by/4.0/.
    Figure (7)  Table (1) References (59)
  • About this article
    Cite this article
    Shang Y, Wu M, Zhang J, Meng H, Hong J, et al. 2023. Nutrient enhanced reclamation promoted growth, diversity and activities of carbon fixing microbes in a coal-mining subsistence land. Soil Science and Environment 2:2 doi: 10.48130/SSE-2023-0002
    Shang Y, Wu M, Zhang J, Meng H, Hong J, et al. 2023. Nutrient enhanced reclamation promoted growth, diversity and activities of carbon fixing microbes in a coal-mining subsistence land. Soil Science and Environment 2:2 doi: 10.48130/SSE-2023-0002

Catalog

  • About this article

/

DownLoad:  Full-Size Img  PowerPoint
Return
Return