


-
Soil salinity is one of the major constraints to agricultural production[1] as many crop species are sensitive to salinity and generally cannot grow under NaCl at or over 100 mM[2], which is more likely to occur under an overlap of both drought and high temperature. The exposure to gradually increasing levels of NaCl is usually called salt stress, whereas sudden exposure is considered as salt shock (SS)[3]. The former often occurs in saline soils, and the latter rarely but occasionally takes place in cultivated lands that are vulnerable to flooding by large amounts of seawater[3].
Studies on tolerance of plants to salt stress have been conducted across diverse plant species[1, 2, 4−9]. Even now, the mechanism of salt tolerance remains a hot topic in plant-related research fields, with numerous articles reviewing research progress[10−16].
It has been indicated that at the physiological level there are positive correlations between salt tolerance, activities of the antioxidant enzymes such as superoxide dismutase (SOD), peroxidase (POD), catalase (CAT) and ascorbate peroxidase (APX), and the synthesis of antioxidant compounds[8, 17].
As one of the world's three major food crops, maize (Zea mays) is relatively sensitive to salt stress[18], more sensitive at emergence and seedling stages than at the flowering stage[19]. Maize planting has been expanded into salinity-affected lands because of the ever-growing demand for this crop, where this crop is bound to meet SS. Maize tolerance to salt stress is under intensive and extensive study[20−30], but its response to SS, even for other plants, is still largely unclear.
Huangzao4 (HZ4), Chang7-2 (C7-2), Ye478 (Y478) and Zheng58 (Z58) are important in-use foundation parent inbred lines for maize crossbreeding in China, of which C7-2 and Z58 are derivative inbred lines of HZ4 and Y478[31], respectively. Both HZ4 and C7-2 are of the Tangshan Sipingtou Chinese landrace germplasm, Y478 belongs to Reid's yellow dent germplasm introduced from modern American maize hybrids, and Z58 is from the Lvda red coda Chinese landrace germplasm[31]. According to our pre-experiments, HZ4, C7-2, Y478 and Z58 differed in SS tolerance. The hypothesis was that responses to SS would be different with maize lines differing in tolerance. In this study, we focused on how these maize inbred lines responded to SS in a 1× Hoagland nutrient solution supplemented with 150 NaCl.
-
Maize inbred lines of HZ4, C7-2, Y478 and Z58 were grown in a growth room that had a humidity of 60%−80%, temperatures of 28 °C (day) and 26 °C (night), and 12-h light of maximum light intensity of 13,000 lux provided by SYLVANIA Luxline Plus F58W/840 fluorescent light tubes (Germany).
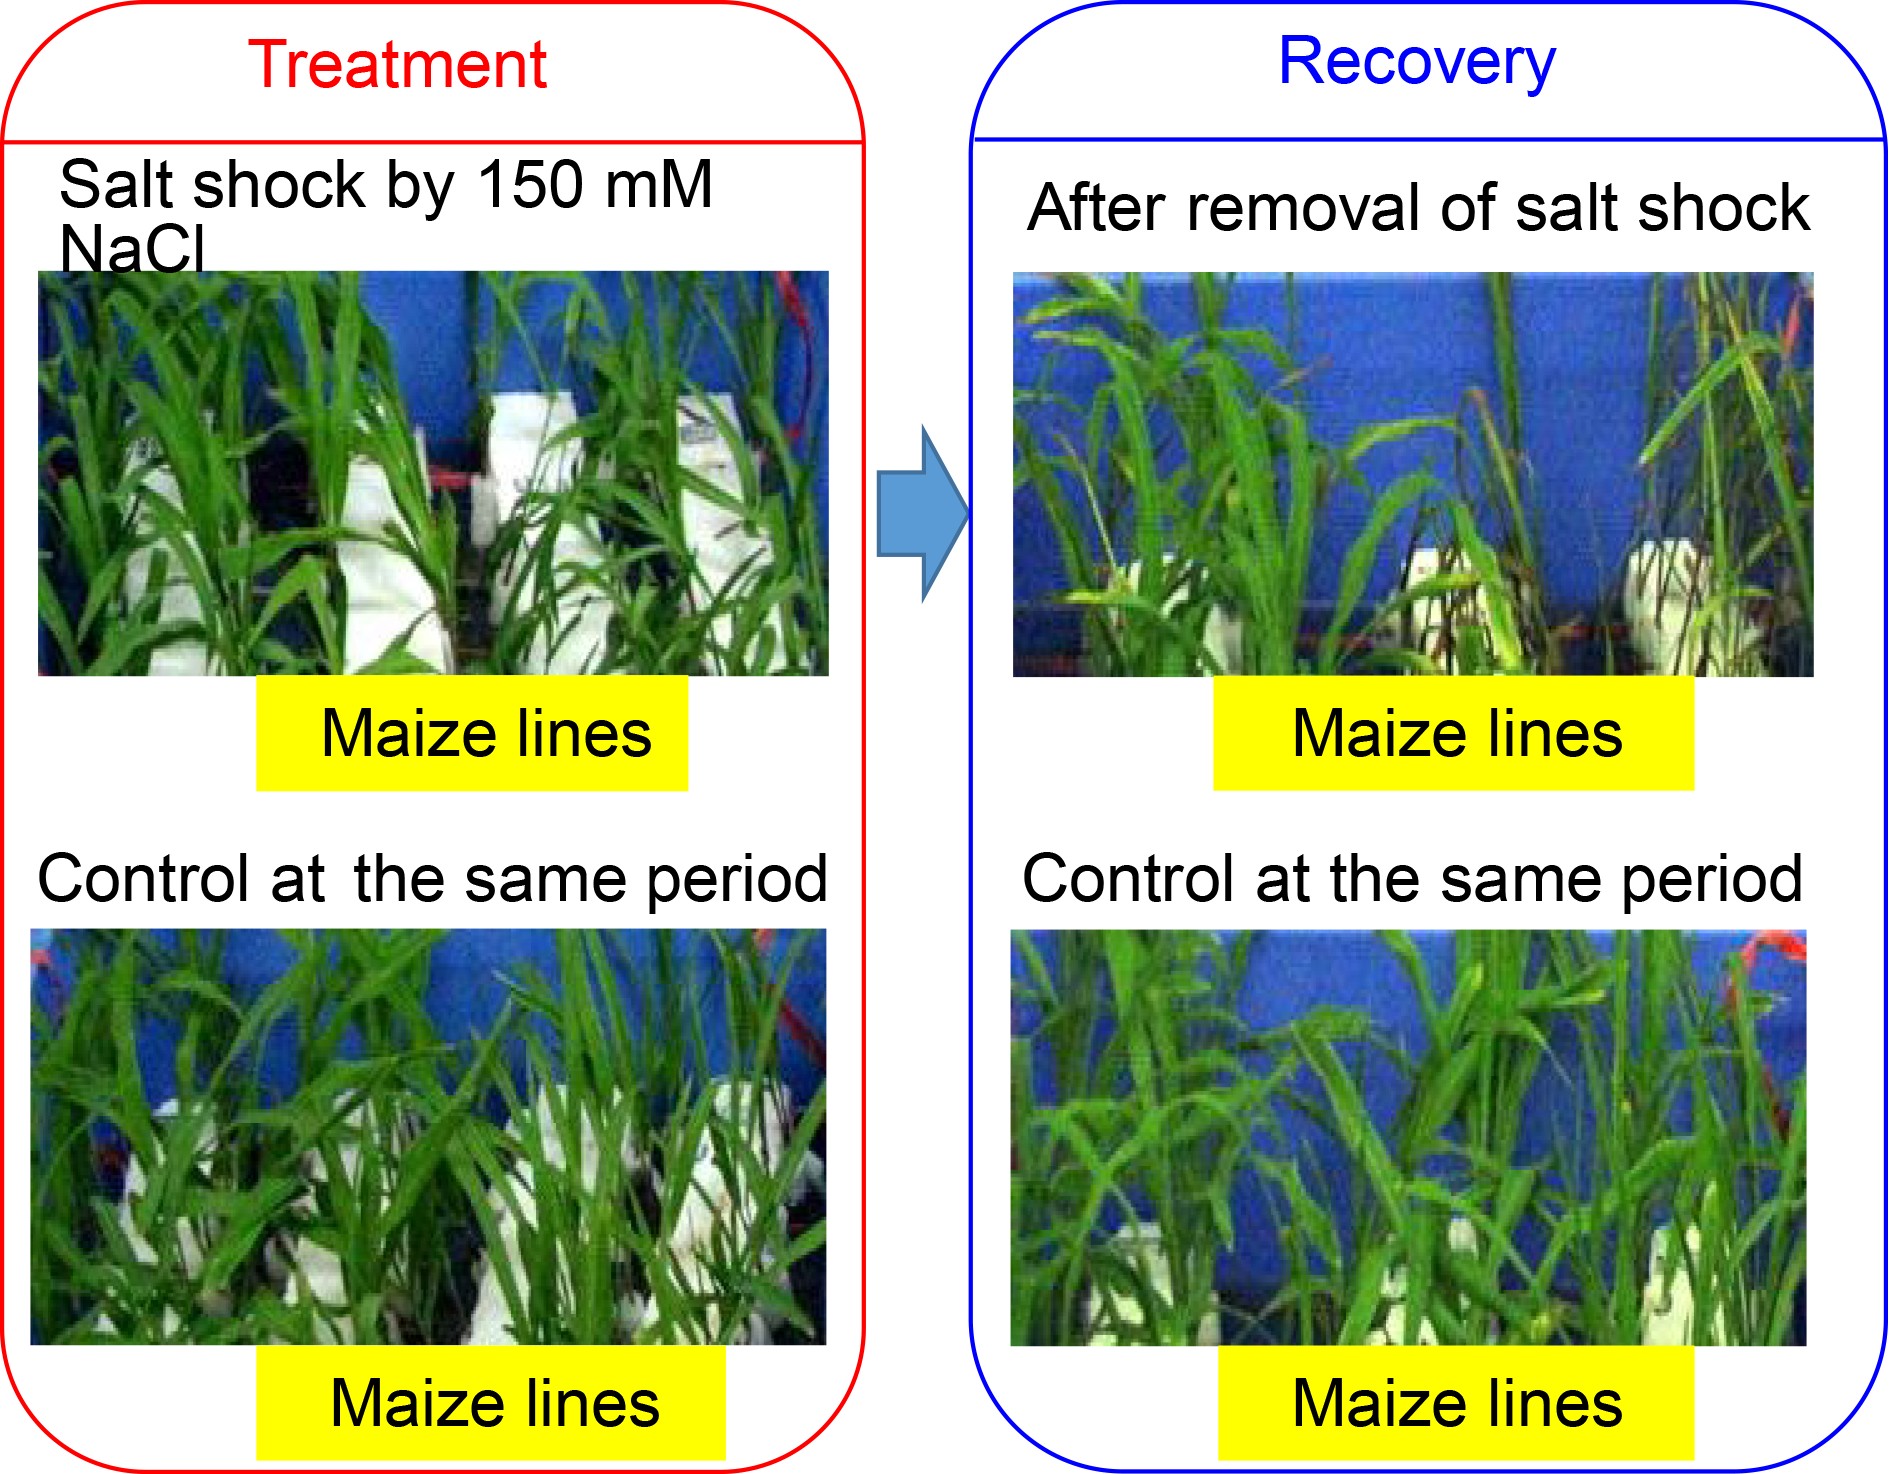
In brief, maize seeds were surface-sterilized with 75% ethanol and grown in sterile moist sand at 28 °C. At the two-leaf stage, the seedlings of health and uniform growth were treated by removal of the residual endosperm and then transplanted into holes of plastic foam boards, at least six holes and two seedlings per hole for each maize line under each treatment. The plastic foam boards were placed in square plastic pots containing 1× Hoagland nutrient solution at pH 6.0, where roots of the seedlings were completely immersed in the solution. During treatments, the nutrient solution was renewed once every 2 d and vigorously aerated for 15 min every 1 h. At the three-leaf stage, the nutrient solution in the pots was renewed with the nutrient solution supplemented with 150 mM NaCl for SS. The SS treatments were conducted for 5, 24, 48, and 72 h, respectively. The seedlings that were treated by SS for 72 h were transferred for removal of SS (RSS) into the new nutrient solution without the added NaCl and resumed growth for 48 h. Parallel control seedlings were those cultivated in the nutrient solution without the added NaCl.
Tissue sampling
-
Tissues were sampled from the fully expanded 2nd leaves and the roots at 10 a.m. The sampled tissues were immediately used, frozen in liquid nitrogen, or fixed for at least 24 h at 4 °C in the fixation solution containing 4% glutaraldehyde and 0.1 M of K2HPO4-KH2PO4 buffer (pH 7.2). The fixed tissues were used for the scanning electron microscopy (SEM) observation.
Assay of the relative water content (RWC) in leaves
-
The RWC assay was performed as described in the literature[32] but with minor modifications. In brief, the sampled fresh leaves were immediately weighed (fresh weight, Wf), immersed in distilled water for 24 h, placed on dried filter paper to remove water of the leaf surface, and then weighed (saturated leaf fresh weight, Ws). The saturated leaves were further dried for 2 h at 105 °C and then for 7 h at 70 °C, and weighed (dry weight, Wd). The RWC was calculated as the following formula: RWC (%) = [(Wf-Wd)/(Ws-Wd)] × 100.
SEM observation
-
The leaves fixed in the fixation solution were washed three times with the KH2PO4-K2HPO4 buffer (pH 7.4) containing 4% (w/v) glutaraldehyde, and dehydrated for 30 min once sequentially in 30%, 50%, 70%, 80%, and 90% ethanol respectively, and then twice in 100% ethanol. The dehydrated leaves were then observed and imaged by using the Hitachi S-3400N SEM instrument following the procedures in the literature[33].
Evaluation of root cell viability
-
The root cell viability was evaluated following methods in the literature[34] but with minor modifications. Fragments (1 cm long) of fresh roots behind the root tips were stained for 30 min in 0.025% (w/v) Evans blue, rinsed for 15 min with deionized water, and then imaged.
After imaging, roots were crushed with a glass rod, soaked for 30 min in 0.5 mL of a solution containing 50% (v/v) MeOH and 1% (w/v) SDS, heated for 15 min in water bath of 50 °C, and then centrifuged for 15 min at 14,000× g. The optical density value of the resulting supernatant at 600 nm was measured for estimation of Evans blue content by using the SHIMADZU UVmin-1240 spectrophotometer (Japan) and used to evaluate the cell viability.
Assay of the ion content
-
The sample tissues were quickly rinsed with deionized water to remove the residues attached on the tissue surfaces, dried for 2 h at 105 °C, and then for 7 h at 70 °C until to a constant weight. The 0.1 g of the dried tissues was wet-ashed at 170 °C in 4 mL of concentrated sulfuric acid containing additional 5 drops of H2O2, and then analyzed by using the 6400 atomic absorption spectrophotometer (Shanghai Jinpeng Analytical Instruments Co., Ltd, China) following the manufacturer's instructions.
Assay of the activities of antioxidant enzymes
-
Two hundred mg of the frozen tissues were homogenized in 5 mL of a pre-chilled 50 mM NaH2PO4-Na2HPO4 buffer (pH 7.0) containing 1% polyvinylpyrrolidone (Guangdong Guanghua Chemical Factory Co. Ltd., Shantou, China), 1 mM ascorbic acid (Bio Basic Inc., Toronto, Canada) and 1 mM EDTA, and then centrifuged for 20 min at 15,000× g at 4 °C. The supernatant was used as the crude extract.
SOD activity was assayed following the p-nitro blue tetrazolium chloride (NBT) method described in the literature[35]but with minor modifications. In brief, the photochemical reaction mixture was composed of 0.1 mL of the crude extract, 1.5 mL of 50 mM NaH2PO4-Na2HPO4 buffer (pH 7.0), 0.3 mL of 13 mM methionine, 750 µM NBT, 0.3 mL of 110 µM EDTA-Na2, 0.5 mL deionized water, and 10 µM riboflavin. The photochemical reaction was conducted for 20 min at 25 °C in a light incubator with 3,000 lux. The absorbance (A) value at 560 nm in the reaction was measured for estimation of SOD activity by using the spectrophotometer. SOD activity was estimated following the formula: = (ACK − AE) / (50% × ACK × Cpro × V), where ACK and AE were the A values of the control tubes and the reaction respectively, Cpro indicated the protein content in the crude extract (mg·L−1), and V represented the total crude extract used (mL).
POD activity was assayed following the method in the literature[36]but with minor modifications. In brief, 0.02 mL of the crude extract reacted at 25 °C with 1 mL of 10 mM 3,3-dimethylglutaric acid-NaOH (pH 6.0) containing 5.5 mM guaiacol and 5.5 mM H2O2. The A470 nm value of the reaction was measured after reaction for 0, 30, 60, 90, 120 , and 180 s, by using the spectrophotometer. POD activity was estimated following the formula: = △A470 nm / (Cpro × V × t), where △A470 nm was the variation of the A value within the reaction time period, Cpro indicated the protein content in the crude extract (mg·L−1), V was the total crude extract used (mL), and t indicated the reaction time .
CAT activity was assayed following the method in the literature[37] but with minor modifications. Briefly, 0.1 mL of the crude extract reacted at 25 °C with 1.4 mL of 0.05 M K2HPO4 (pH 7.0) containing 13.2 mM H2O2. The A240 nm value of the reaction was measured every 20 s for total 2 min by using the spectrophotometer. CAT activity was estimated following the formula: = △A 240 nm / (Cpro × V × t), where △A 240 nm was the variation of the A value within the reaction time period, Cpro indicated the protein content in the crude extract (mg·L−1), V was the total crude extract used (mL), and t indicated the reaction time.
APX activity was measured following the ascorbate oxidation method[38]but with some modifications. The reaction was conducted at 25 °C in the 2-mL solution composed of 0.02 mL of the crude extract, 50 mM potassium phosphate (pH 7.0), 0.1 mM EDTA, 0.5 mM sodium ascorbate, and 0.1 mM H2O2. The A290 nm value of the reaction was measured after reaction for 0, 10, 20, 30, 40, 50, and 60 s by using the spectrophotometer. APX activity was estimated following the formula: = △A290 nm / (Cpro × V × t), where △A290 nm was the variation of the A value within the reaction time period, Cpro indicated the protein content in the crude extract (mg·L−1), V was the total crude extract (mL) used, and t indicated the reaction time.
Measurement of malondialdehyde
-
The 0.1 mL of the crude extract and 0.1 mL of 0.6% thiobarbituric acid were mixed together, heated for 15 min in boiling water, immediately cooled on ice, and then centrifuged for 10 min at 1,698× g. The A value of the supernatant was measured at 532, 600, and 450 nm by using the spectrophotometer, respectively. The malondialdehyde content was calculated as a formula: = [6.45 × (A 532 nm – A 600nm) − 0.56 × A450 nm] / Cpro, where Cpro indicated the protein content in the crude extract (mg·L-1).
Superoxide anion radical (SAR) quantification
-
SAR content was estimated in accordance with the method in the literature[39]but with some modifications. First, 0.1 mL of the crude extract, 0.075 mL of 50 mM NaH2PO4-Na2HPO4 buffer (pH 7.8), and 0.025 mL of 10 mM hydroxylamine hydrochloride (Guangdong Guanghua Chemical Factory Co. Ltd., Shantou, China) were mixed and heated for 20 min at 25 °C. Then, 0.1 mL of 17 mM p-aminobenzene sulfonic acid (Bio Basic Inc., Toronto, Canada) and 0.1 mL of 7 mM α-naphthylamine (Shanghai Silian Chemical Co., Ltd., Shanghai, China) were added and allowed to further react for 30 min at 25 °C. The standard curve was plotted with the solution containing different concentrations of NaNO2, p-aminobenzene sulfonic acid, and α-naphthylamine. The A530 nm value of the reaction was measured by using the spectrophotometer and used to estimate SAR contents in the tissues as a formula: = (2 × X) / 20 × Vs × Cpro, where X was the standard curve reading, 2 was the dilution ratio of the used crude extract, 20 was the reaction time (min), Vs was solution sampled during the colour reaction (mL), and Cpro was the protein content of the crude extract (mg·L−1).
Statistical analysis of the data
-
Statistical analyses of the data was conducted following the t test at a level of p < 0.05 using a programme in SPSS 13.0 software (
www.spss.com ). -
Under control conditions, no significant differences were observed in phenotype among maize lines (Fig. 1a). The differences among maize lines in leaf phenotype occurred under SS and after RSS (Table 1; Fig. 1a). Under SS, Z58 showed no significant changes in leaf phenotype, and more than 95% of C7-2 leaves died after SS of 72 h (Table 1; Fig. 1a). After RSS, all seedlings of 72 h-SS-stressed Z58 survived, however, all seedlings of 72 h-SS-stressed C7-2 died (Table 1; Fig. 1a).
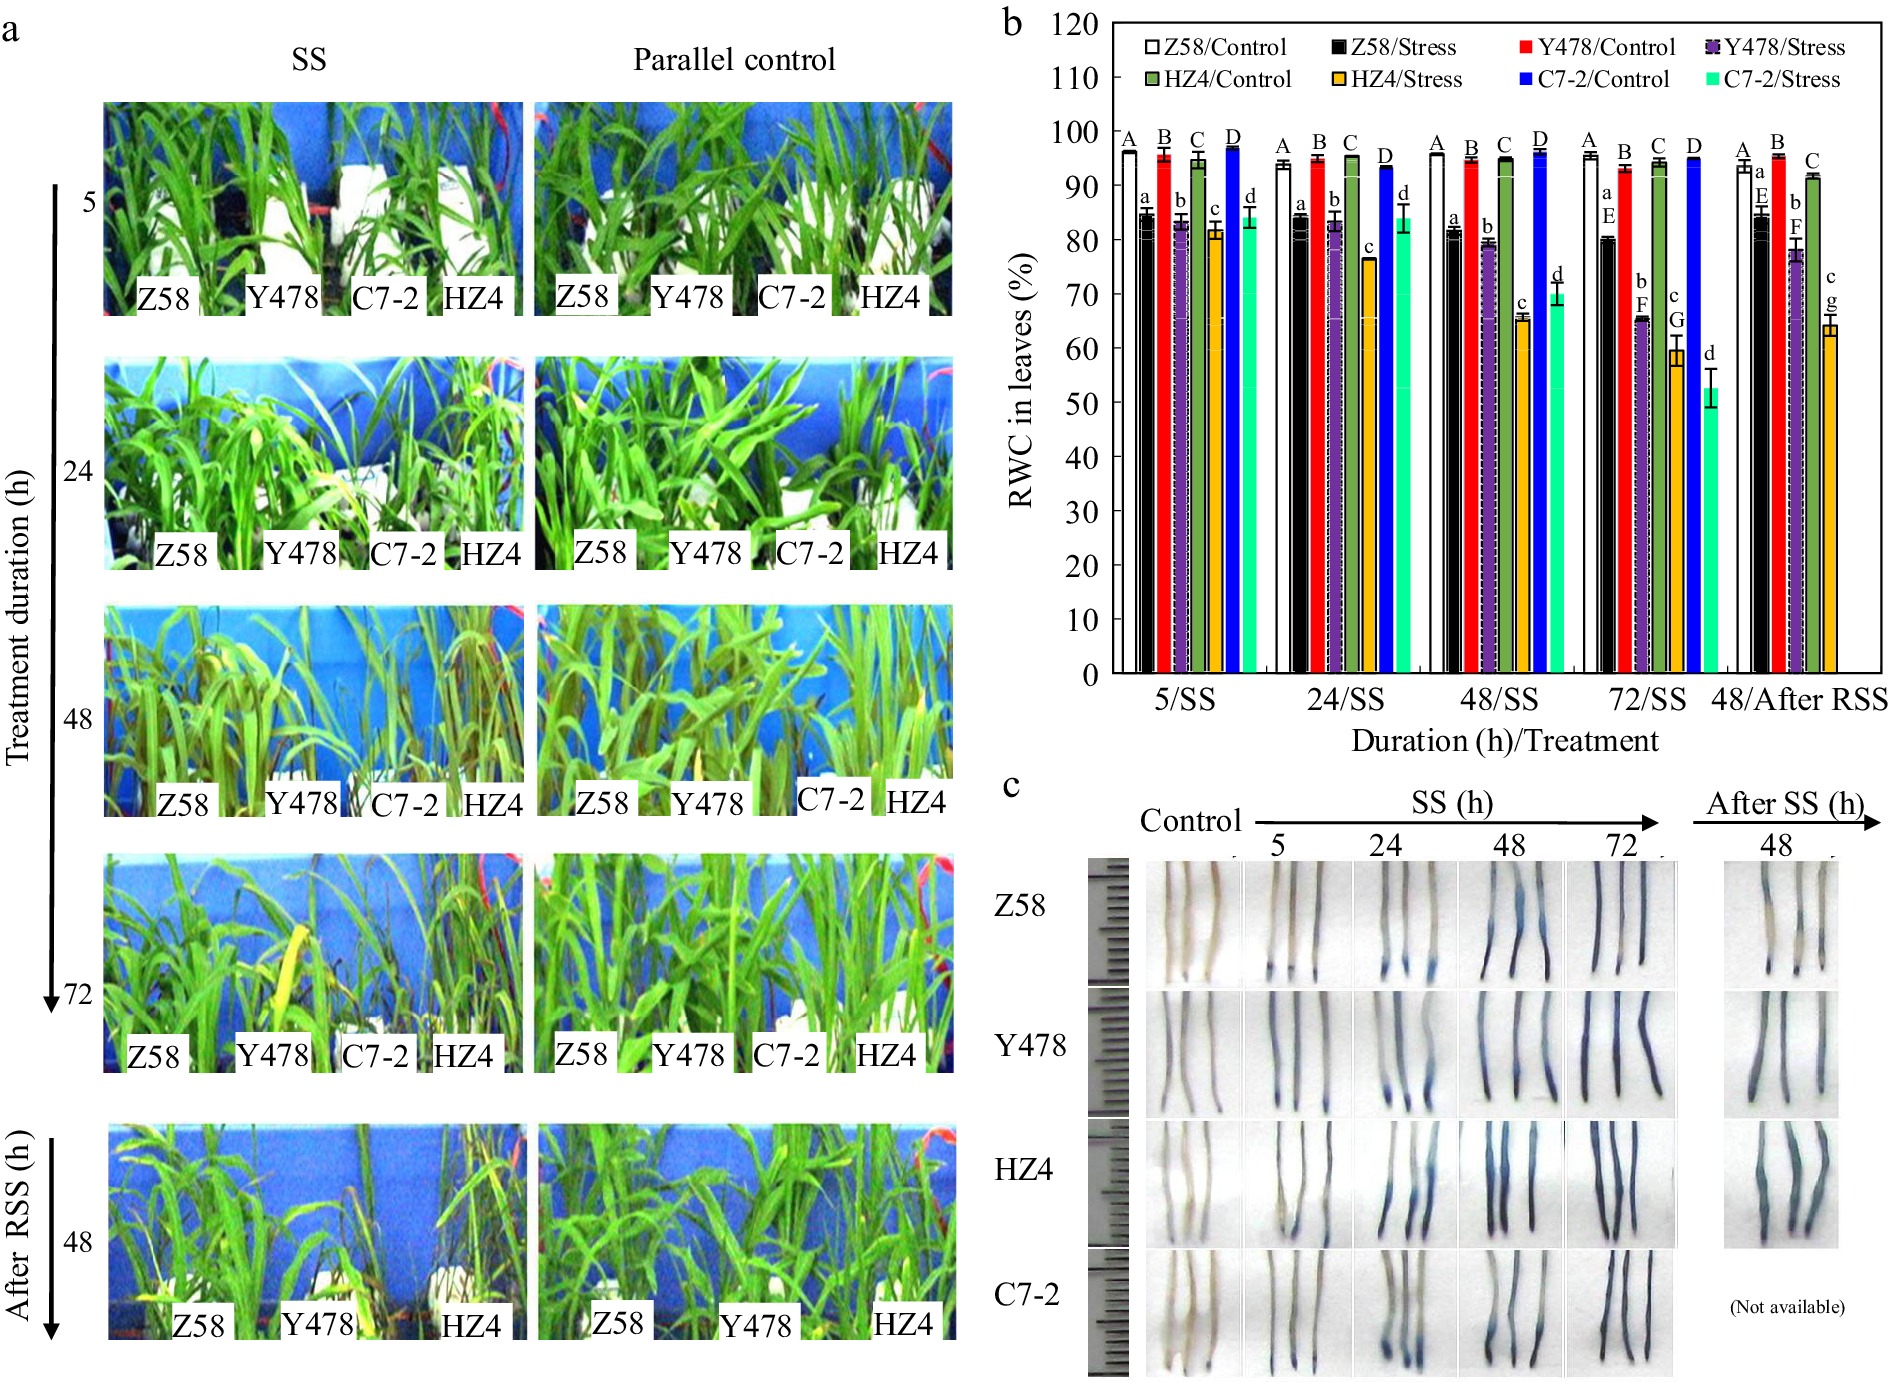
Figure 1.
(a) Phenotype, (b) leaf RWC, and (c) root staining of maize inbred lines under SS and after RSS. The SS stress was conducted with 150 mM NaCl. The RSS treatment was performed on maize plants stressed by SS for 72 h. In (b), the data were the means ± standard deviation (SD) of the fully expanded 2nd leaves of 5-leaf-old seedlings (n = 5−10) for each maize line under each treatment, and statistical analysis comparison was conducted between the same maize lines under control and the same SS stress, and between the same maize lines after SS of 72 h and after RSS. In (b), upper and lower cases of the same letter indicated a statistical significance at p < 0.05. In (c), fresh nodal roots (1 cm behind the root tip) from 5-leaf-old seedlings (n = 5−10) of each maize line were stained with Evans blue solution. The data of maize inbred line C7-2 after RSS were not available because of no surviving seedlings. C7-2, Maize inbred line Chang7-2. HZ4, Maize inbred line Huangzao4. RSS, Removal of SS. RWC, Relative water content. SS, Salt shock. Y478, Maize inbred line Ye478. Z58, Maize inbred line Zheng58.
Table 1. Phenotypes of seedlings of maize inbred lines under SS and after RSS.
Maize line Yellowing of leaves Death rate (%) of seedlings under SS for After RSS 5 h 24 h 48 h 72 h Surviving seedlings (%) Z58 Slightly; The edge of about 10% of leaves after SS of 72 h 0 0 0 0 100 Y478 Obviously; About 15% of leaves began turning yellow after SS of 48 h 0 0 1.2 2.1 50.5 C7-2 Obviously; About 15% of the leaves began turning yellow after SS of 24 h 0 0 40.5 95 0 HZ4 Somewhat like C7-2 0 0 23.5 80 48.65 The SS stress was conducted with 150 mM NaCl. The RSS treatment was performed on maize plants stressed by SS for 72 h. Leaves were observed and counted from leaves of 15−20 seedlings for each maize line. Survival rate after RSS referred to the percentag of surviving seedlings compared to seedlings stressed after SS of 72 h. C7-2, Maize inbred line Chang 7-2. HZ4, Maize inbred line Huangzao4. RSS, Removal of SS. SS, Salt shock. Y478, Maize inbred line Ye478. Z58, Maize inbred line Zheng58. Leaf RWC started to significantly decrease after SS of 5 h but had no significant difference among maize lines. The significant differences of maize lines in leaf RWC occurred after SS of 24, 48 and 72 h, respectively. Leaf RWC was highest in Z58 and lowest in C7-2 after SS of 72 h (Fig. 1b). Notably, leaf RWC of Z58 did not significantly fluctuate under SS (Fig. 1b).
However, leaf RWC of Z58, Y478 and HZ4 significantly increased after RSS when compared to that in their respective maize lines SS-stressed for 72 h but it was still significantly lower than that of their respective control lines (Fig. 1b).
The deeper the Evans blue staining indicated the less viability of cells. Consequently, the visible staining differences occurred among roots of maize lines after SS of 5 h and more significantly after SS of 24 h (Fig. 1c), where Evans blue-stained root zone was close to root tips of SS-stressed Z58 but relatively longer in SS-stressed lines of Y478, HZ4 and C7-2 (Fig. 1c).
After RSS, Evans blue-staining was only at local root zone in SS-stressed Z58 but still in a longer root zone in SS-stressed lines of Y478 and HZ4. The staining depth of SS-stressed roots of maize lines followed Z58 < Y478 < HZ4 (Fig. 1c) but was shallower than that of their respective maize lines after SS of 72 h. Such staining differences were echoed partly by the quantitative assay of Evans blue (Fig. 2a).
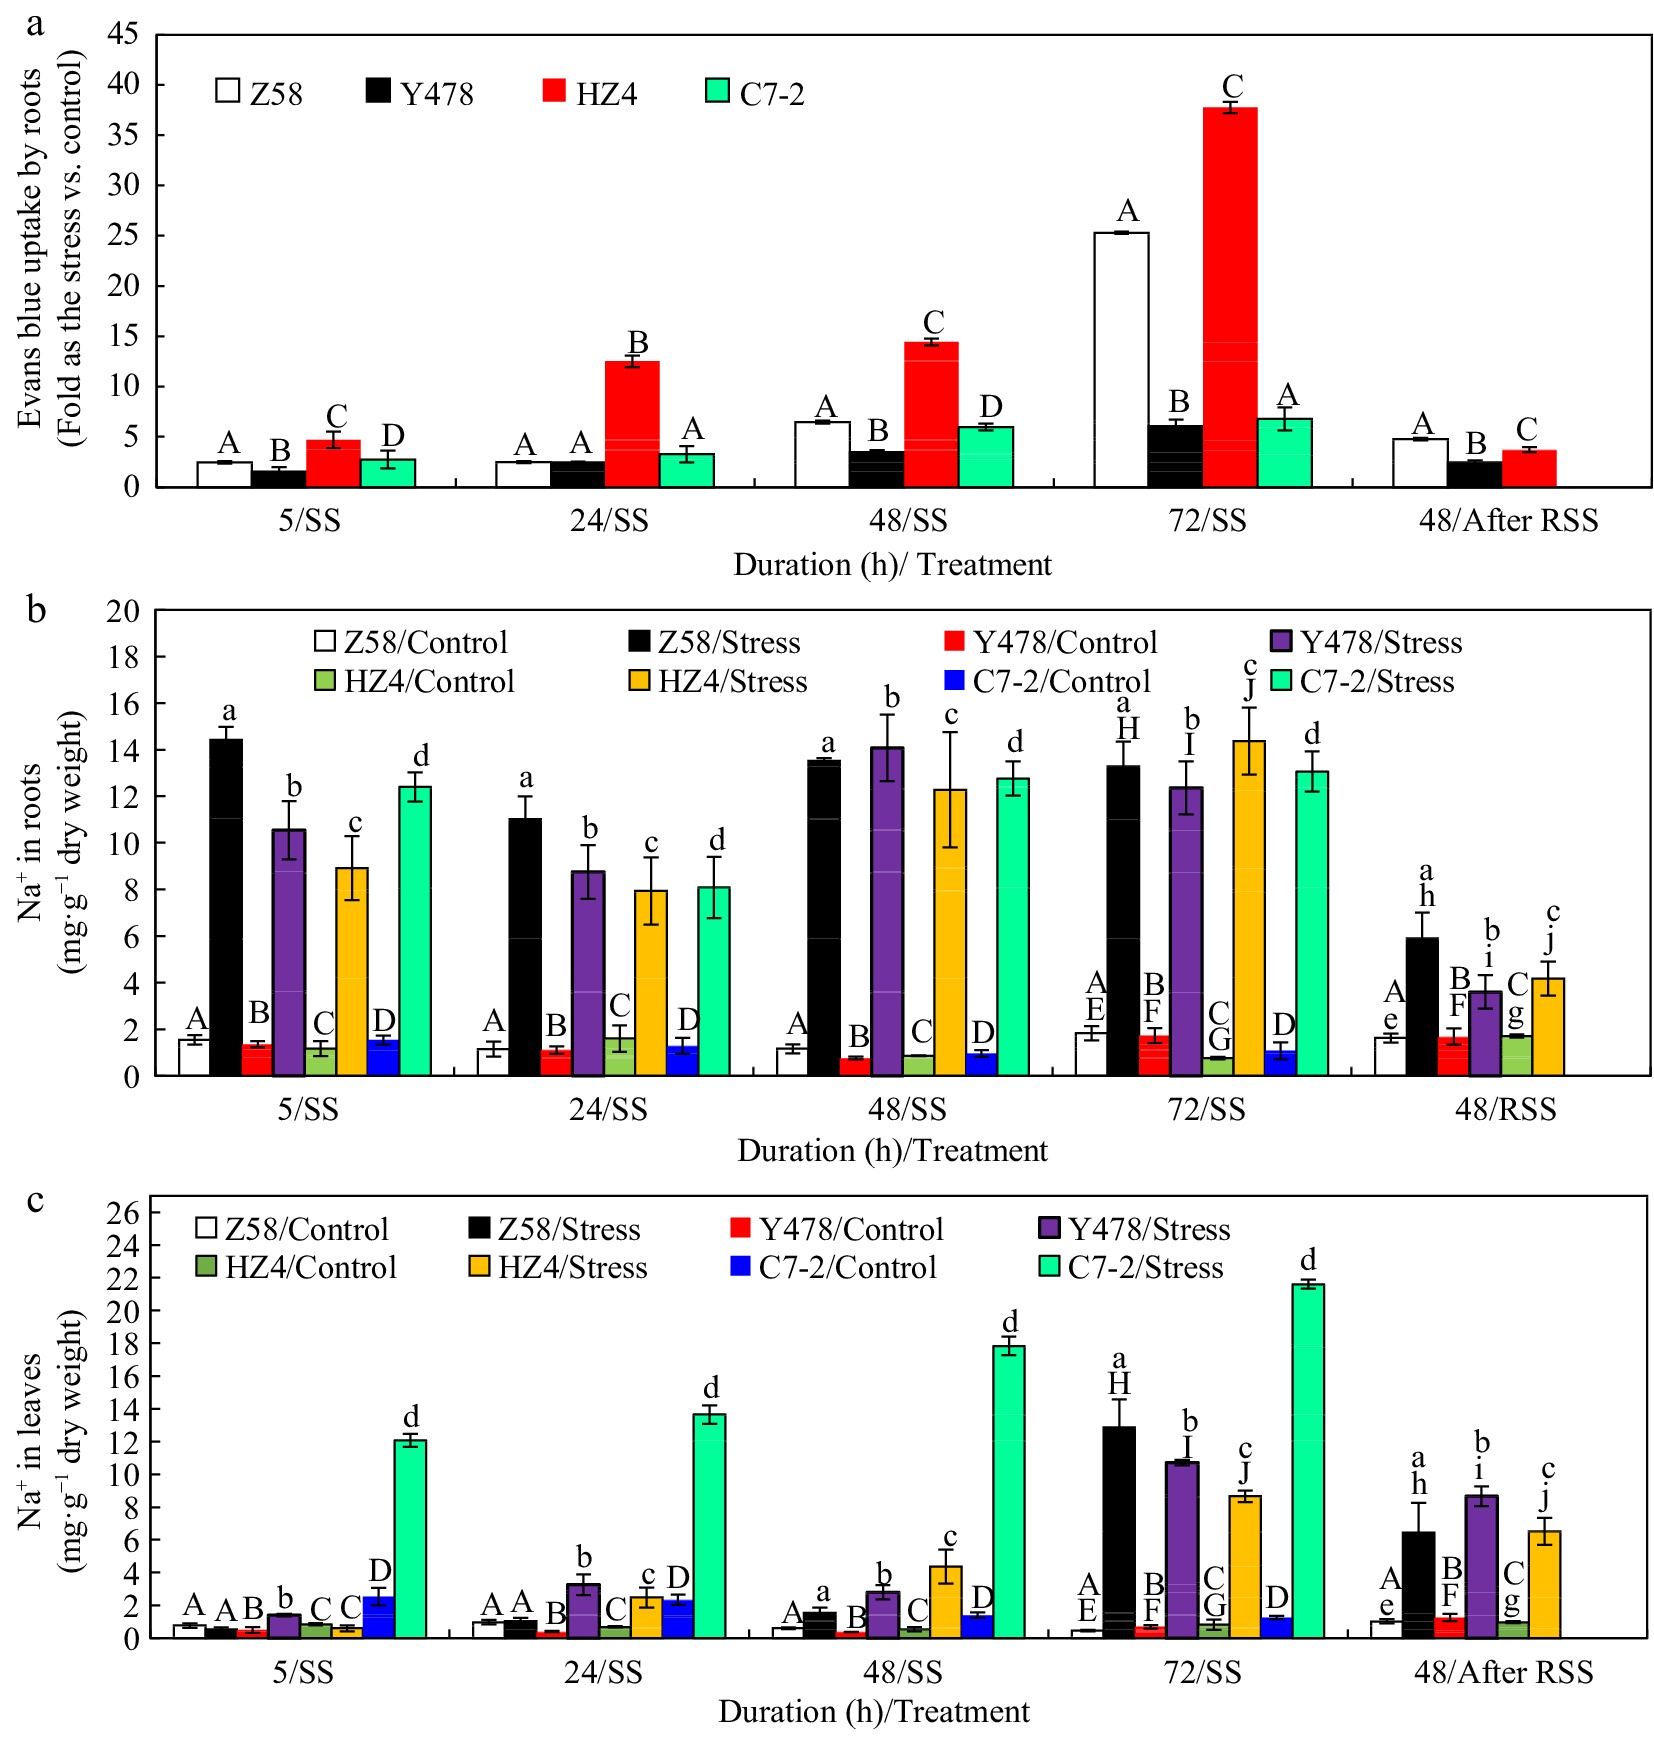
Figure 2.
Evans blue content in (a) fresh nodal roots, and Na+ content in (b) roots and (c) leaves of maize inbred lines under SS and after RSS. The SS was conducted with 150 mM NaCl. The RSS treatment was performed on maize plants stressed by SS for 72 h. In (a), Evans blue content analysis was based on the Evans blue-stained fresh nodal roots (1 cm behind the root tip), where each datum was the mean ± SD from 5-leaf-old seedlings (n = 3−5) for each maize line under each treatment. In (b), each datum was the mean ± SD from a collection of roots of 5-leaf-old seedlings (n = 5−10). In (c), each datum was the mean ± SD from the fully expanded 2nd leaves of 5-leaf-old seedlings (n = 5−10). The statistical analysis comparison was conducted between the same maize line under control and the same SS stress, and between the same maize line after SS of 72 h and after RSS. The upper and lower cases of the same letter indicated a statistical significance at p < 0.05. The data of maize inbred line C7-2 after RSS were not available because of no surviving seedlings. C7-2, Maize inbred line Chang7-2. HZ4, Maize inbred line Huangzao4. RSS, Removal of SS. SD, Standard deviation. SS, Salt shock. Y478, Maize inbred line Ye478. Z58, Maize inbred line Zheng58.
Both phenotype of shoots (Table 1; Fig. 1a) and root staining (Fig. 1c) under SS and after RSS indicated that SS tolerance degree of maize lines roughly followed Z58 > Y478 > HZ4 > C7-2.
Na+ content in the tissues
-
Under control conditions, there were very slight but no significant differences in Na+ content of either roots (Fig. 2b) or leaves (Fig. 2c) among different maize lines.
Na+ content in roots of SS-stressed maize lines significantly increased when compared to that in their respective control-treated lines, which roughly fluctuated as follows: highest in roots of Z58 after SS of 5 and 24 h, and no significant differences among maize lines after SS of 48 and 72 h (Fig. 2b). After RSS, Na+ content in roots of SS-stressed maize lines of Z58, Y478 and HZ4 significantly decreased when compared to that in their respective maize lines after SS of 72 h but it was still significantly higher than that in their respective control lines (Fig. 2a). It should be noted that after RSS Na+ content in roots of SS-stressed Z58 was still highest among SS-stressed maize lines, similar to the situation in its roots after SS of 5 and 24 h (Fig. 2b).
Na+ content in leaves of SS-stressed C7-2 was highest among SS-stressed maize lines (Fig. 2c). After RSS (Fig. 2c), changes in Na+ content in leaves of SS-stressed maize lines were very similar to those in roots (Fig. 2b) of SS-stressed maize lines. Overall, the absolute Na+ content was much higher in leaves than in roots for each SS-stressed maize line.
K+ and Ca2+ contents in the tissues
-
Overall, K+ content in roots (Fig. 3a) and leaves (Fig. 3b) of Z58 was highest among maize lines under either control conditions or SS stress.
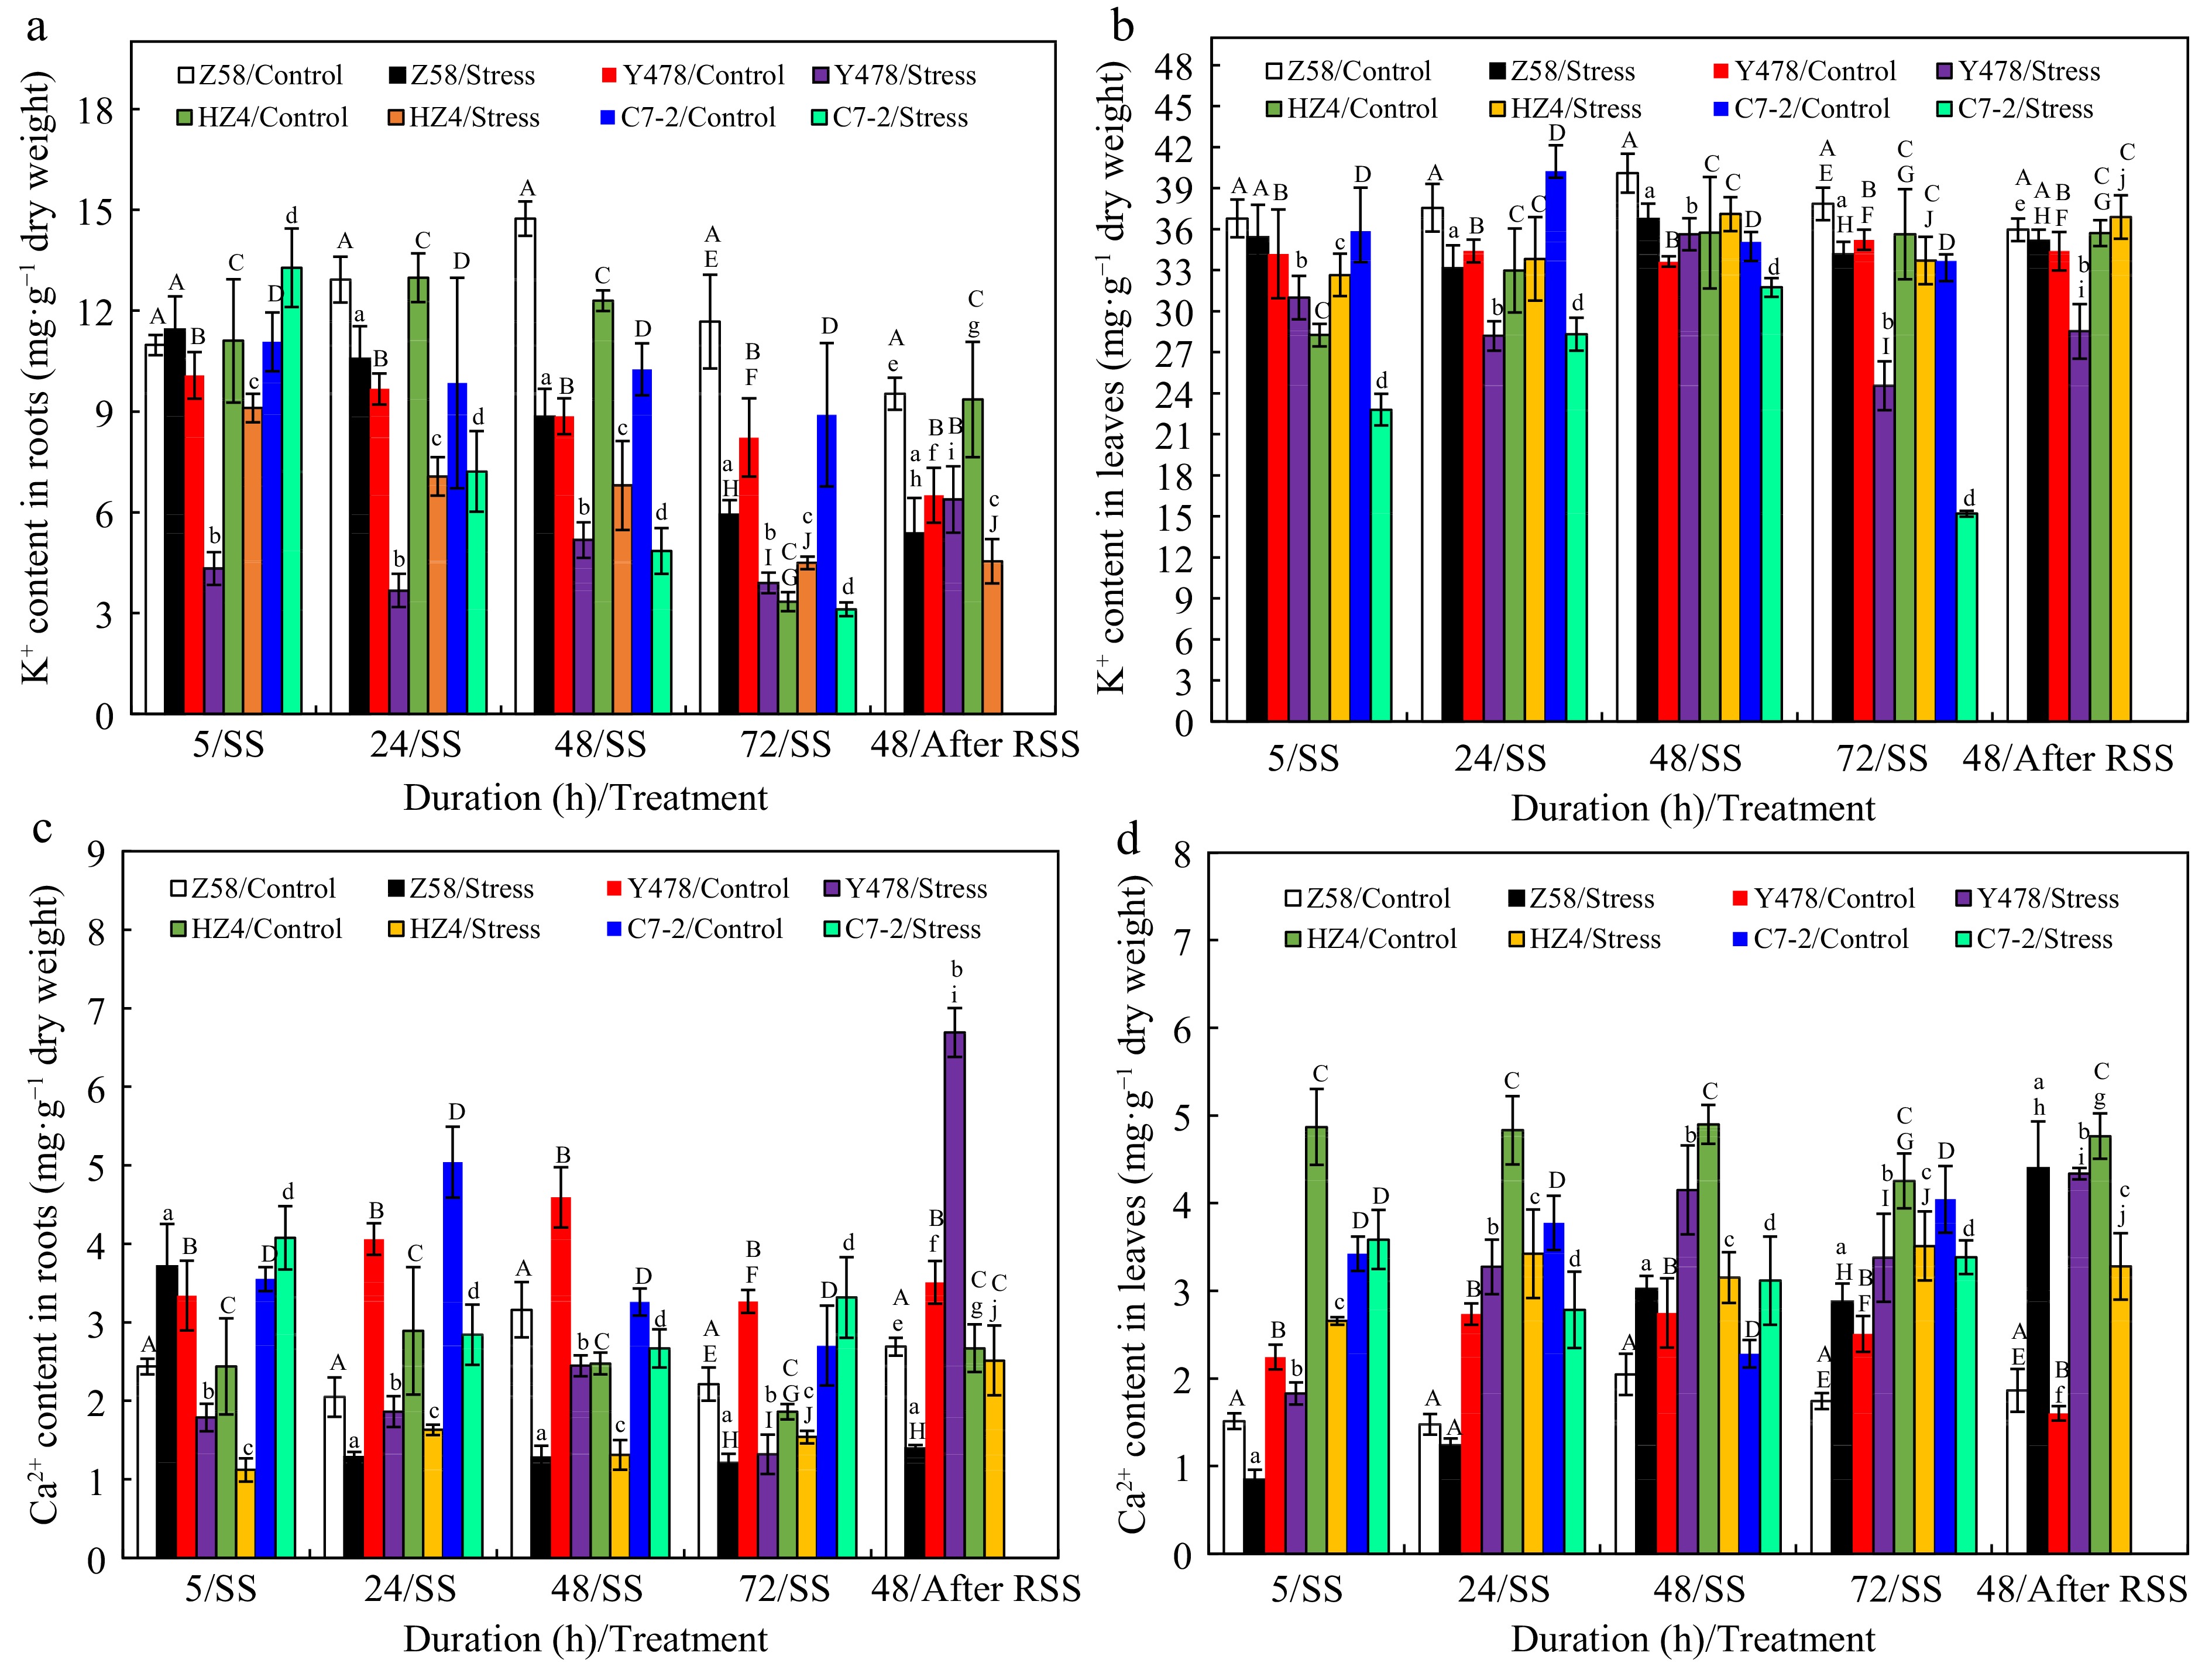
Figure 3.
K+ content in (a) roots and (b) leaves, and Ca2+ content in (c) roots and (d) leaves of maize inbred lines under SS and after RSS. The SS was conducted with 150 mM NaCl. The RSS treatment was performed on maize plants stressed by SS for 72 h. Each datum was the mean ± SD from the fully expanded 2nd leaves or a collection of roots of 5-leaf-old seedlings (n = 3−5) for each maize line under each treatment. The statistical analysis comparison was conducted between the same maize line under control and the same SS stress, and between the same maize line after SS of 72 h and after RSS. The upper and lower cases of the same letter indicated a statistical significance at p < 0.05. The data of maize inbred line C7-2 after RSS were not available because of no surviving seedlings. C7-2, Maize inbred line Chang7-2. HZ4, Maize inbred line Huangzao4. RSS, Removal of SS. SD, Standard deviation. SS, Salt shock. Y478, Maize inbred line Ye478. Z58, Maize inbred line Zheng58.
As for K+ content in roots of SS-stressed maize lines, it showed no significant changes in Z58, significantly decreased in Y478 and HZ4, and significantly increased in C7-2 after SS of 5 h. K+ content tended to decrease although it fluctuated in some maize lines after SS of 24 h (Fig. 3a). After RSS, K+ content in SS-stressed maize lines of Z58 and Y478 was still lower than that in their respective control lines (Fig. 3a).
Regarding K+ content in leaves of SS-stressed maize lines, it showed no change in Z58, significant decreases in Y478 and C7-2 and a significant increase in HZ4 after SS of 5 h when compared to that in their respective control lines. However, as the SS time prolonged, although K+ content was significantly lower than their respective control maize lines, it fluctuated obviously with maize lines. In general, K+ content in roots (Fig. 3a) and leaves (Fig. 3b) of C7-2 after SS of 48 and 72 h was lowest among SS-stressed maize lines. After RSS, K+ content in SS-stressed lines of Z58 and HZ4 was very close that in their respective control lines (Fig. 3b).
With aspect to Ca2+ content in roots of SS-stressed maize lines, it significantly increased in Z58 and C7-2, and significantly decreased in Y478 and HZ4 after SS of 5 h (Fig. 3c). Ca2+ content in Z58 significantly decreased but remained relatively constant as SS exceeded 5 h. After RSS, Ca2+ content was still lower in SS-stressed Z58, sharply increased in SS-stressed Y478, and recovered to the control level in SS-stressed HZ4 when compared to that in their respective control maize lines (Fig. 3c).
As regards Ca2+ content in leaves, it was highest in HZ4 and lowest in Z58 under control conditions. Interestingly, as for Ca2+ content under SS, it changed greatly with maize lines, either increased or decreased at some SS-time points. however, it was still lowest in SS-stressed Z58 when compred to that in teir respective control lines (Fig. 3d). After RSS, Ca2+ content significantly increased in SS-stressed lines of Z58 and Y478 (Fig. 3d).
Malondialdehyde content in the tissues
-
In general, malondialdehyde content in roots (Fig. 4a) and leaves (Fig. 4b) of all SS-stressed maize lines tended to significantly increase as SS time prolonged when compared to that in their respective control maize lines, highest in roots (Fig. 4a) and higher in the most cases in leaves (Fig. 4b) of SS-stressed lines of HZ4 and C7-2. Notably, malondialdehyde content in roots (Fig. 4a) and (Fig. 4b) of SS-stressed Z58 and Y478 showed slight changes when SS time was over 24 h, not as dramatically increased as in other SS-stressed maize lines (Fig. 4a). After RSS, malondialdehyde content in roots (Fig. 4a) and leaves (Fig. 4b) of SS-stressed maize lines significantly decreased when compared to that in their respective lines that were SS-stressed for 72 h, but it was still higher than that in their respective control maize lines, highest in SS-stressed HZ4.
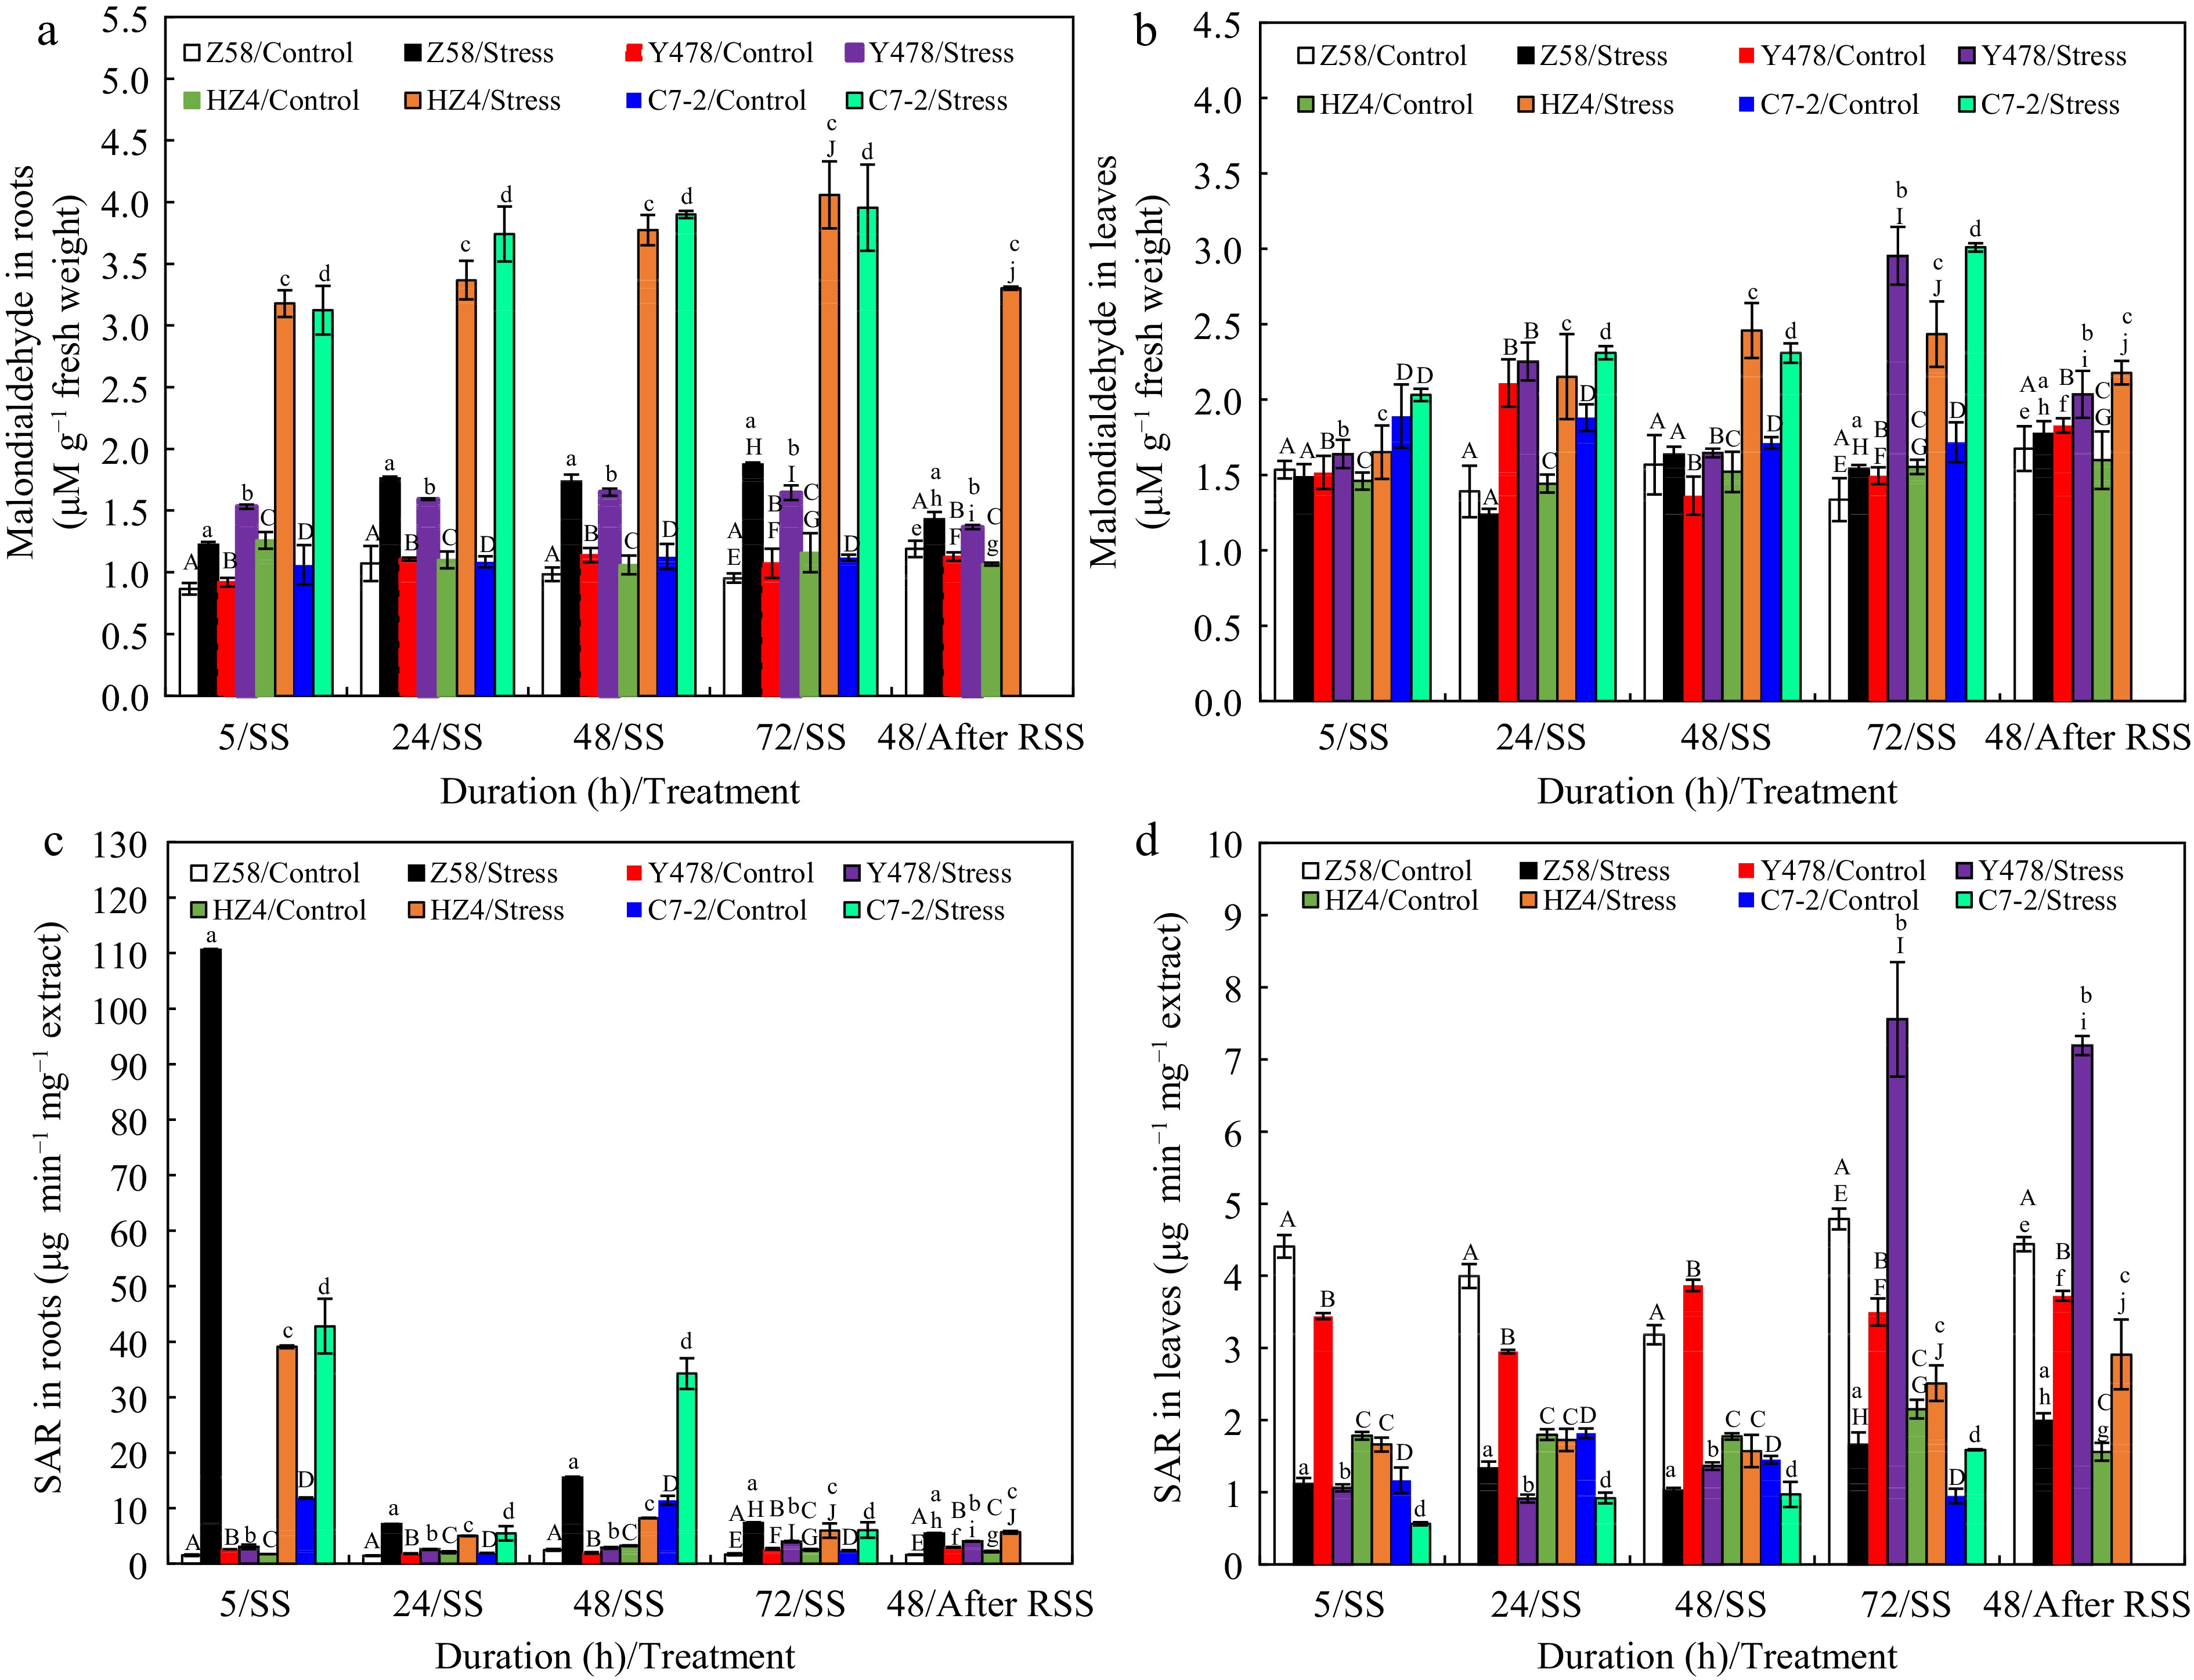
Figure 4.
Malondialdehyde content in (a) roots and (b) leaves, and SAR content in (c) roots and (d) leaves of maize inbred lines under SS and after RSS. The SS was conducted with 150 mM NaCl. The RSS treatment was performed on maize plants stressed by SS for 72 h. Each datum was the mean ± SD from the fully expanded 2nd leaves or a collection of the roots of 5-leaf-old seedlings (n = 3−5) for each maize line. The statistical analysis comparison was conducted between the same maize line under control and the same SS stress, and between the same maize line after SS of 72 h and after RSS. The upper and lower cases of the same letter indicated a statistical significance at p < 0.05. The data of maize inbred line C7-2 after RSS were not available because of no surviving seedlings. C7-2, Maize inbred line Chang7-2. HZ4, Maize inbred line Huangzao4. RSS, Removal of SS. SAR, Superoxide anion radical. SD, Standard deviation. SS, Salt shock. Y478, Maize inbred line Ye478. Z58, Maize inbred line Zheng58.
SAR production in the tissues
-
As for SAR production in roots, no significant differences were found among maize lines under control conditions (Fig. 4a). Under SS stress, SAR production significantly increased in maize lines but was highest in Z58 especially after SS of 5 h. However, SAR production tended to significantly decline in SS-stressed maize lines when SS time was at and over 24 h although it was higher than that in their respective control lines. After RSS, SAR production situation in SS-stressed lines of Z58, Y478 and HZ4 was almost the same as that in their respective maize lines that were SS-stressed for 72 h (Fig. 4c).
Regarding SAR production in leaves, SAR production in Z58 and Y478 was much higher than that in HZ4 and C7-2 under control conditions (Fig. 4d). Under SS stress, SAR production was always much lower in most SS-stressed maize lines after SS of 5, 24, and 48 h, and significantly decreased in Y478 but increased in HZ4 and C7-2 after SS of 72 h (Fig. 4d) when compared to that in their respective control lines. After SS, SAR production was almost identical to that in their respective maize lines that were SS-stressed for 72 h (Fig. 4d).
Activities of SOD and POD in the tissues
-
As for SOD activity in roots, it showed differences among maize lines under control conditions, and significantly increased but was highest in Z58 under SS (Fig. 5a). For SOD activity in leaves, it was much higher in Z58 and Y478 under control conditions, and significantly decreased in Z58, Y478 and C7-2 but significantly increased in HZ4 after SS of 48 and 72 h (Fig. 5b) when compared to that in their respective control lines. After SS, SOD activity was higher in roots of SS-stressed maize lines (Fig. 5a) and only in leaves of SS-stressed HZ4 when compared to that in their respective control lines (Fig. 5b).
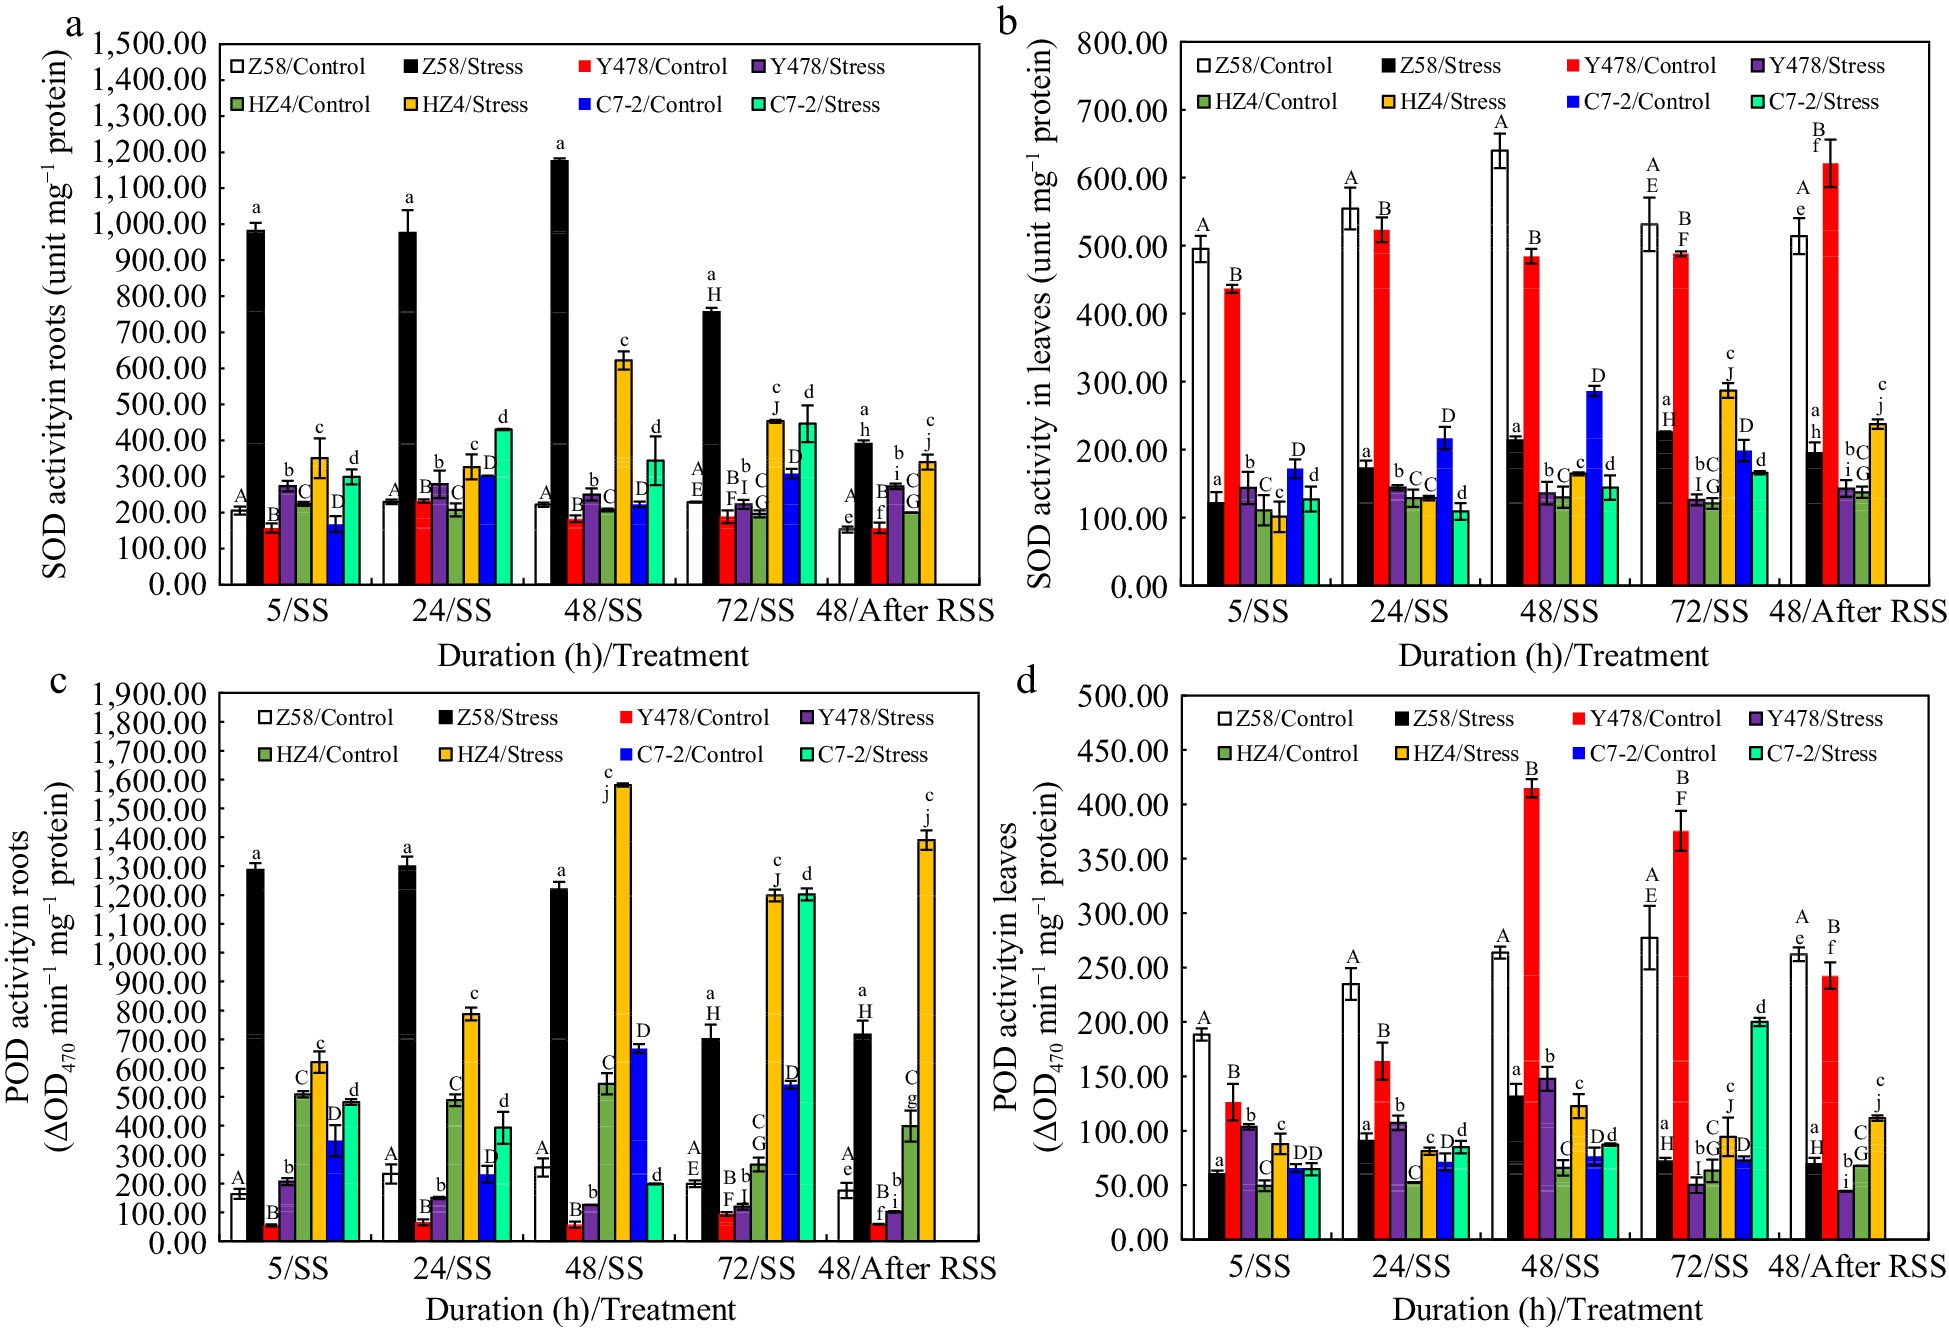
Figure 5.
SOD activity in (a) roots and (b) leaves, and POD activity in (c) roots and (d) leaves of maize inbred lines under SS and after RSS. The SS was conducted with 150 mM NaCl. The RSS treatment was performed on maize plants stressed by SS for 72 h. Each datum was the mean ± SD from the fully expanded 2nd leaves or a collection of the roots of 5-leaf-old seedlings (n = 3−5) for each maize line under each treatment. The statistical analysis comparison was conducted between the same maize line under control and the same SS stress, and between the same maize line after SS of 72 h and after RSS. The upper and lower cases of the same letter indicated a statistical significance at p < 0.05. The data of maize inbred line C7-2 after RSS were not available because of no surviving seedlings. C7-2, Maize inbred line Chang7-2. HZ4, Maize inbred line Huangzao4. POD, Peroxidase. RSS, Removal of SS. SD, Standard deviation. SOD, Superoxide dismutase. SS, Salt shock. Y478, Maize inbred line Ye478. Z58, Maize inbred line Zheng58.
Overall, the changing patterns of POD activity in either roots (Fig. 5c) or leaves (Fig. 5d) of maize lines either under control conditions and SS or after RSS were almost in line with those SOD activity in corresponding roots (Fig. 5a) or leaves (Fig. 5b) .
Activities of CAT and APX in the tissues
-
As for CAT activity in roots under SS, it significantly increased in all SS-stressed maize lines (Fig. 6a) but was much higher in SS-stressed Z58 than that in other SS-stressed maize lines especially after SS of 5 h. In leaves under SS, overall, CAT activity significantly increased after SS of 5, and 24 h for all SS-stressed maize lines and significantly decreased after SS of 48, and 72 h for SS-stressed maize lines of Z58 and Y478 (Fig. 6b). Notably, CAT activity was always higher in leaves of SS-stresed maize lines of HZ4 and C7-2 than that in their respective control lines (Fig. 6a). After SS, it was higher in roots (Fig. 6a) of all SS-stressed maize lines, and higher in leaves (Fig. 6b) of SS-stressed maize lines of Z58 and HZ4 than that in their respective control lines.
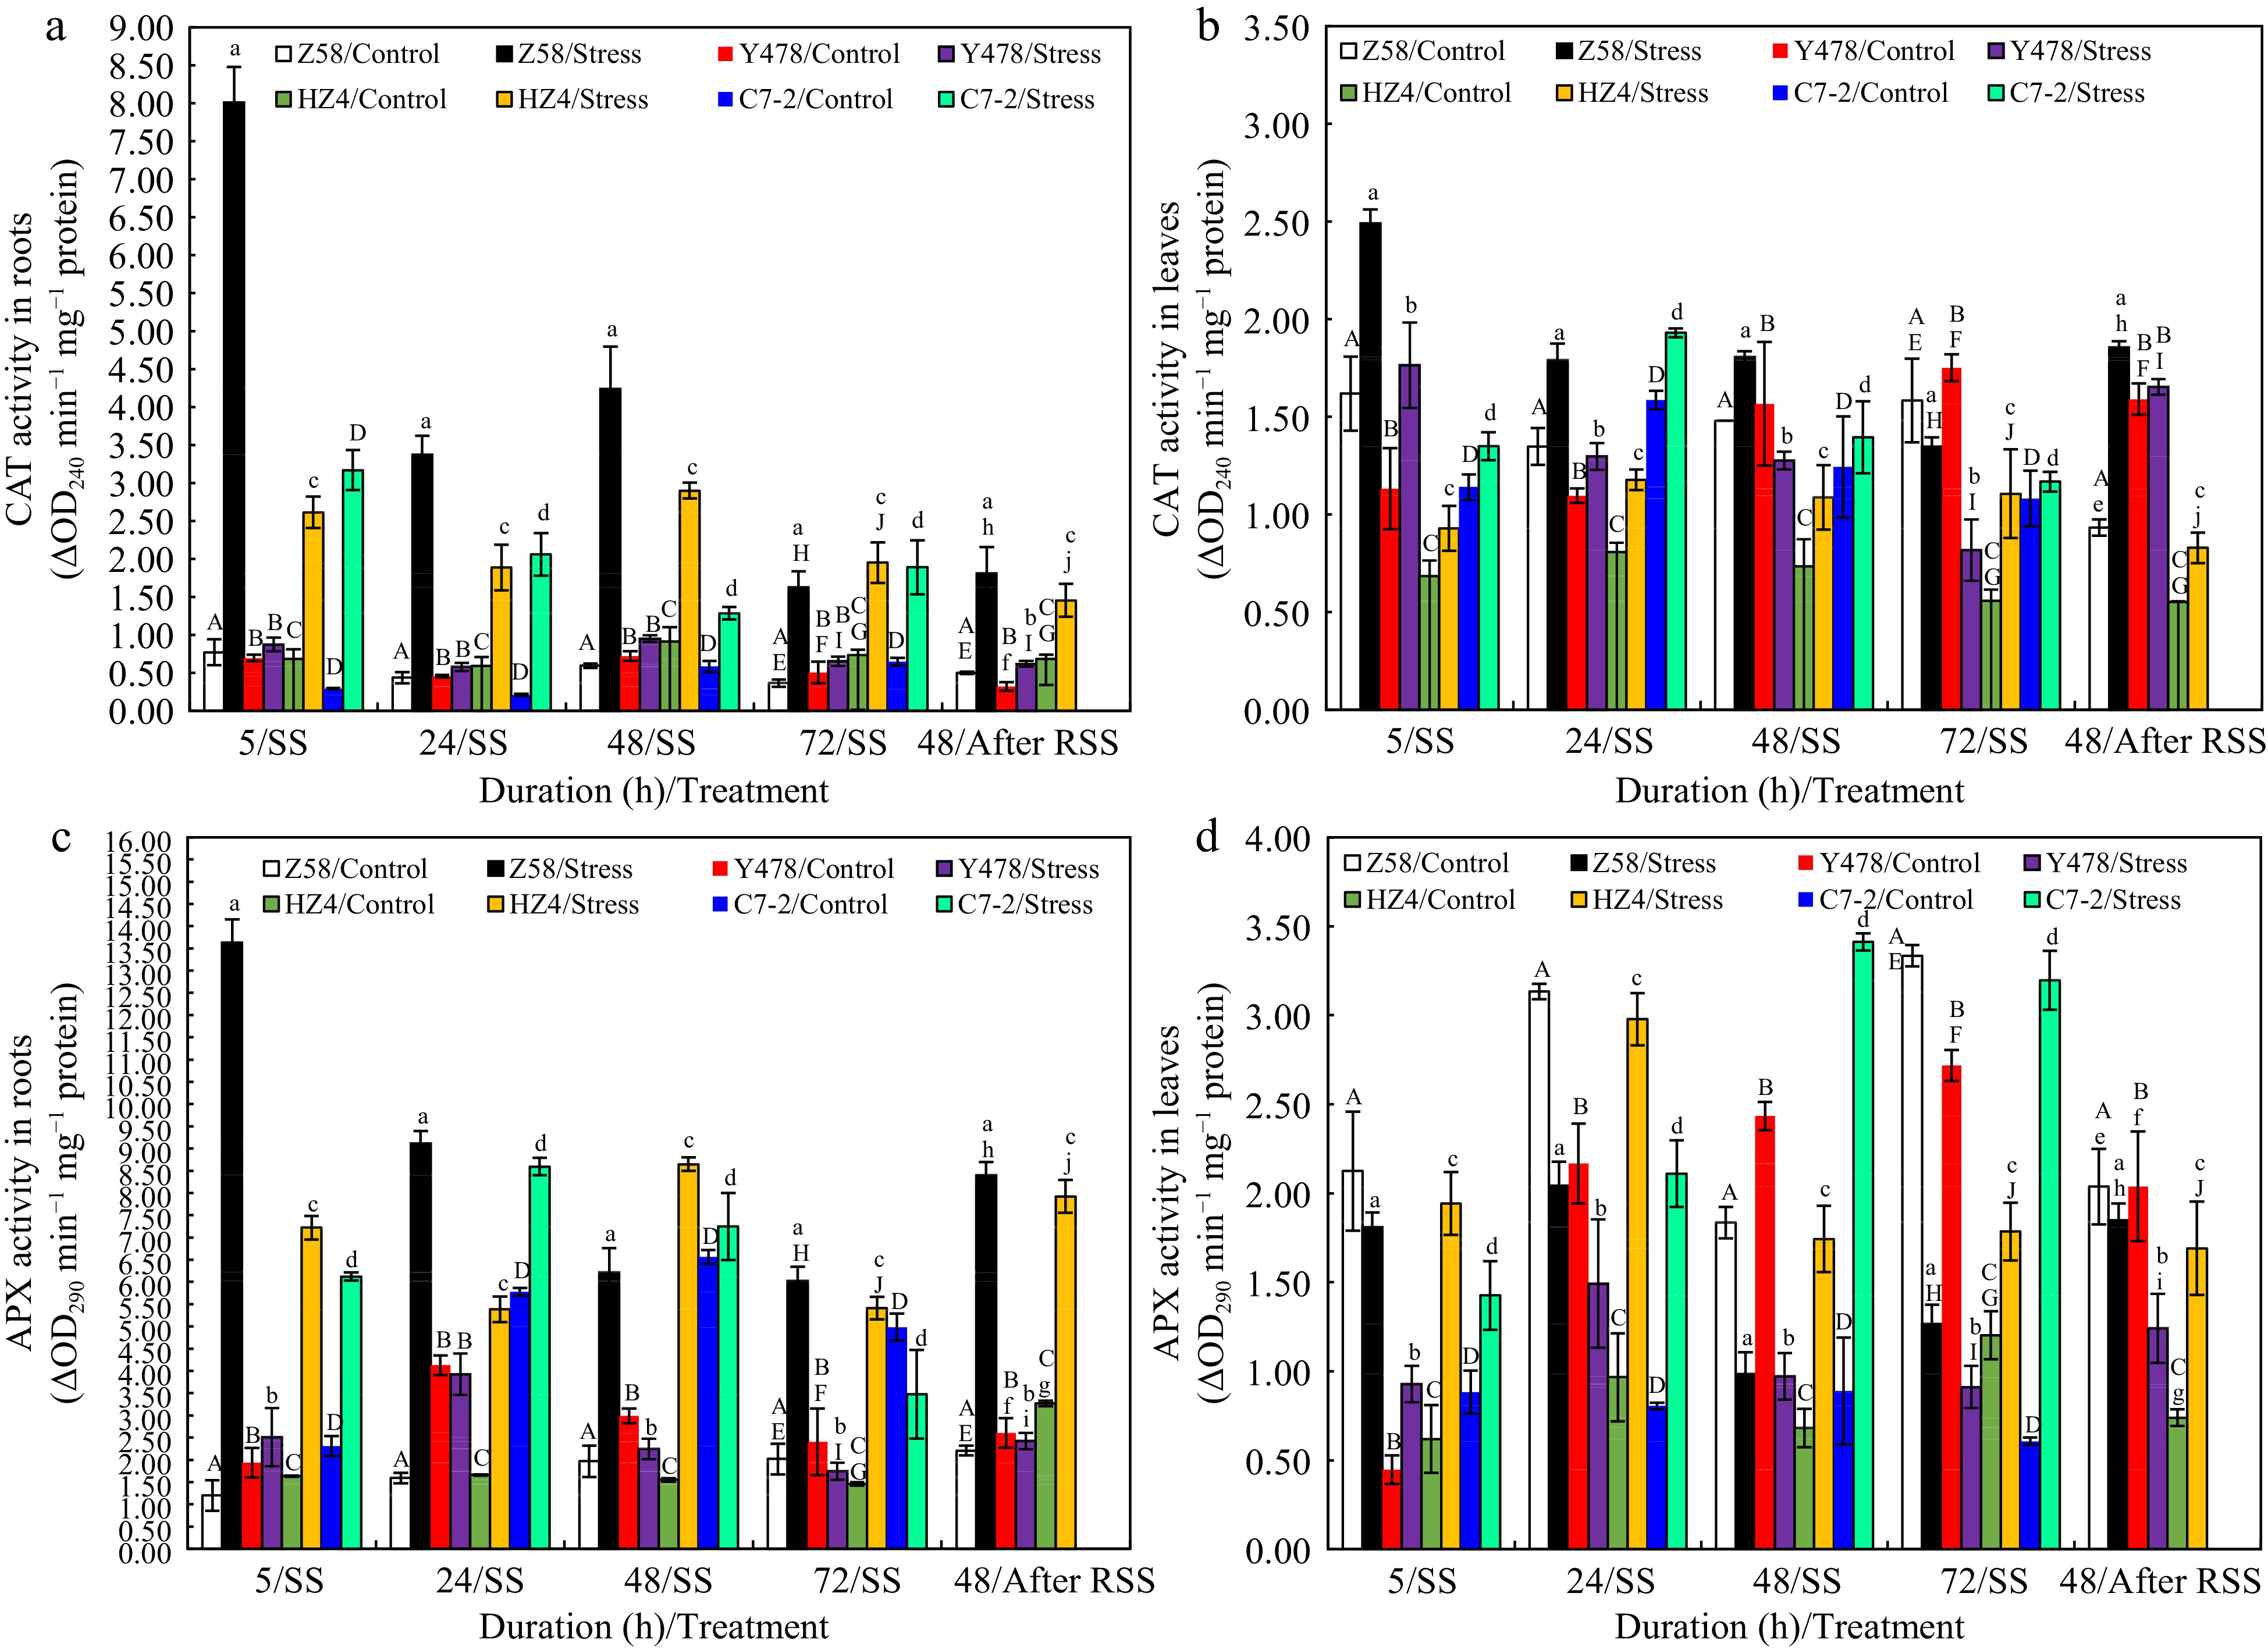
Figure 6.
CAT activity in (a) roots and (b) leaves, and APX activity in (c) roots and (d) leaves of maize inbred lines under SS and after RSS. The SS was conducted with 150 mM NaCl. The RSS treatment was performed on maize plants stressed by SS for 72 h. Each datum was the mean ± SD from the fully expanded 2nd leaves or a collection of the roots of 5-leaf-old seedlings (n = 3−5) for each maize line under each treatment. The statistical analysis comparison was conducted between the same maize line under control and the same SS stress, and between the same maize line after SS of 72 h and after RSS. The upper and lower cases of the same letter indicated a statistical significance at p < 0.05. The data were not available for maize inbred line C7-2 after RSS because of no surviving seedlings. APX, Ascorbate peroxidase; CAT, Catalase. C7-2, Maize inbred line Chang7-2. HZ4, Maize inbred line Huangzao4. RSS, Removal of SS. SD, Standard deviation. SS, Salt shock. Y478, Maize inbred line Ye478. Z58, Maize inbred line Zheng58.
Overall, APX activity changes in roots (Fig. 6c) under control conditions and SS or after RSS were somewhat similar to CAT activity found in roots (Fig. 6a) although there were slight differences for some maize lines. As for APX activity in leaves, it was always higher in SS-stressed maize lines of HZ4 and C7-2, but significantly lower in SS-stressed maize lines of Z58 and Y478 after SS of 72 h when compared to that in their respective control lines (Fig. 6d). After RSS, APX activity was much higher in roots (Fig. 6c) of SS-stressed maize lines of Z58 and HZ4, and lower in leaves (Fig. 6d) of SS-stressed maize lines of Z58 and Y478 but much higher in leaves (Fig. 6d) of SS-stressed HZ4 when compared to that in their respective control lines.
Stomatal behaviour of leaves
-
The leaf stomata were always opened in Z58 under SS, began to close in HZ4 and C7-2 after SS of 24 h and in Y478 after SS of 48 h (Fig. 7a) when compared to those of their respective controls lines (Fig. 7b). After RSS, the leaf stomata were still opened in SS-stressed Z58, slightly opened in SS-stressed Y478, and still closed in SS-stressed HZ4 (Fig. 7a).
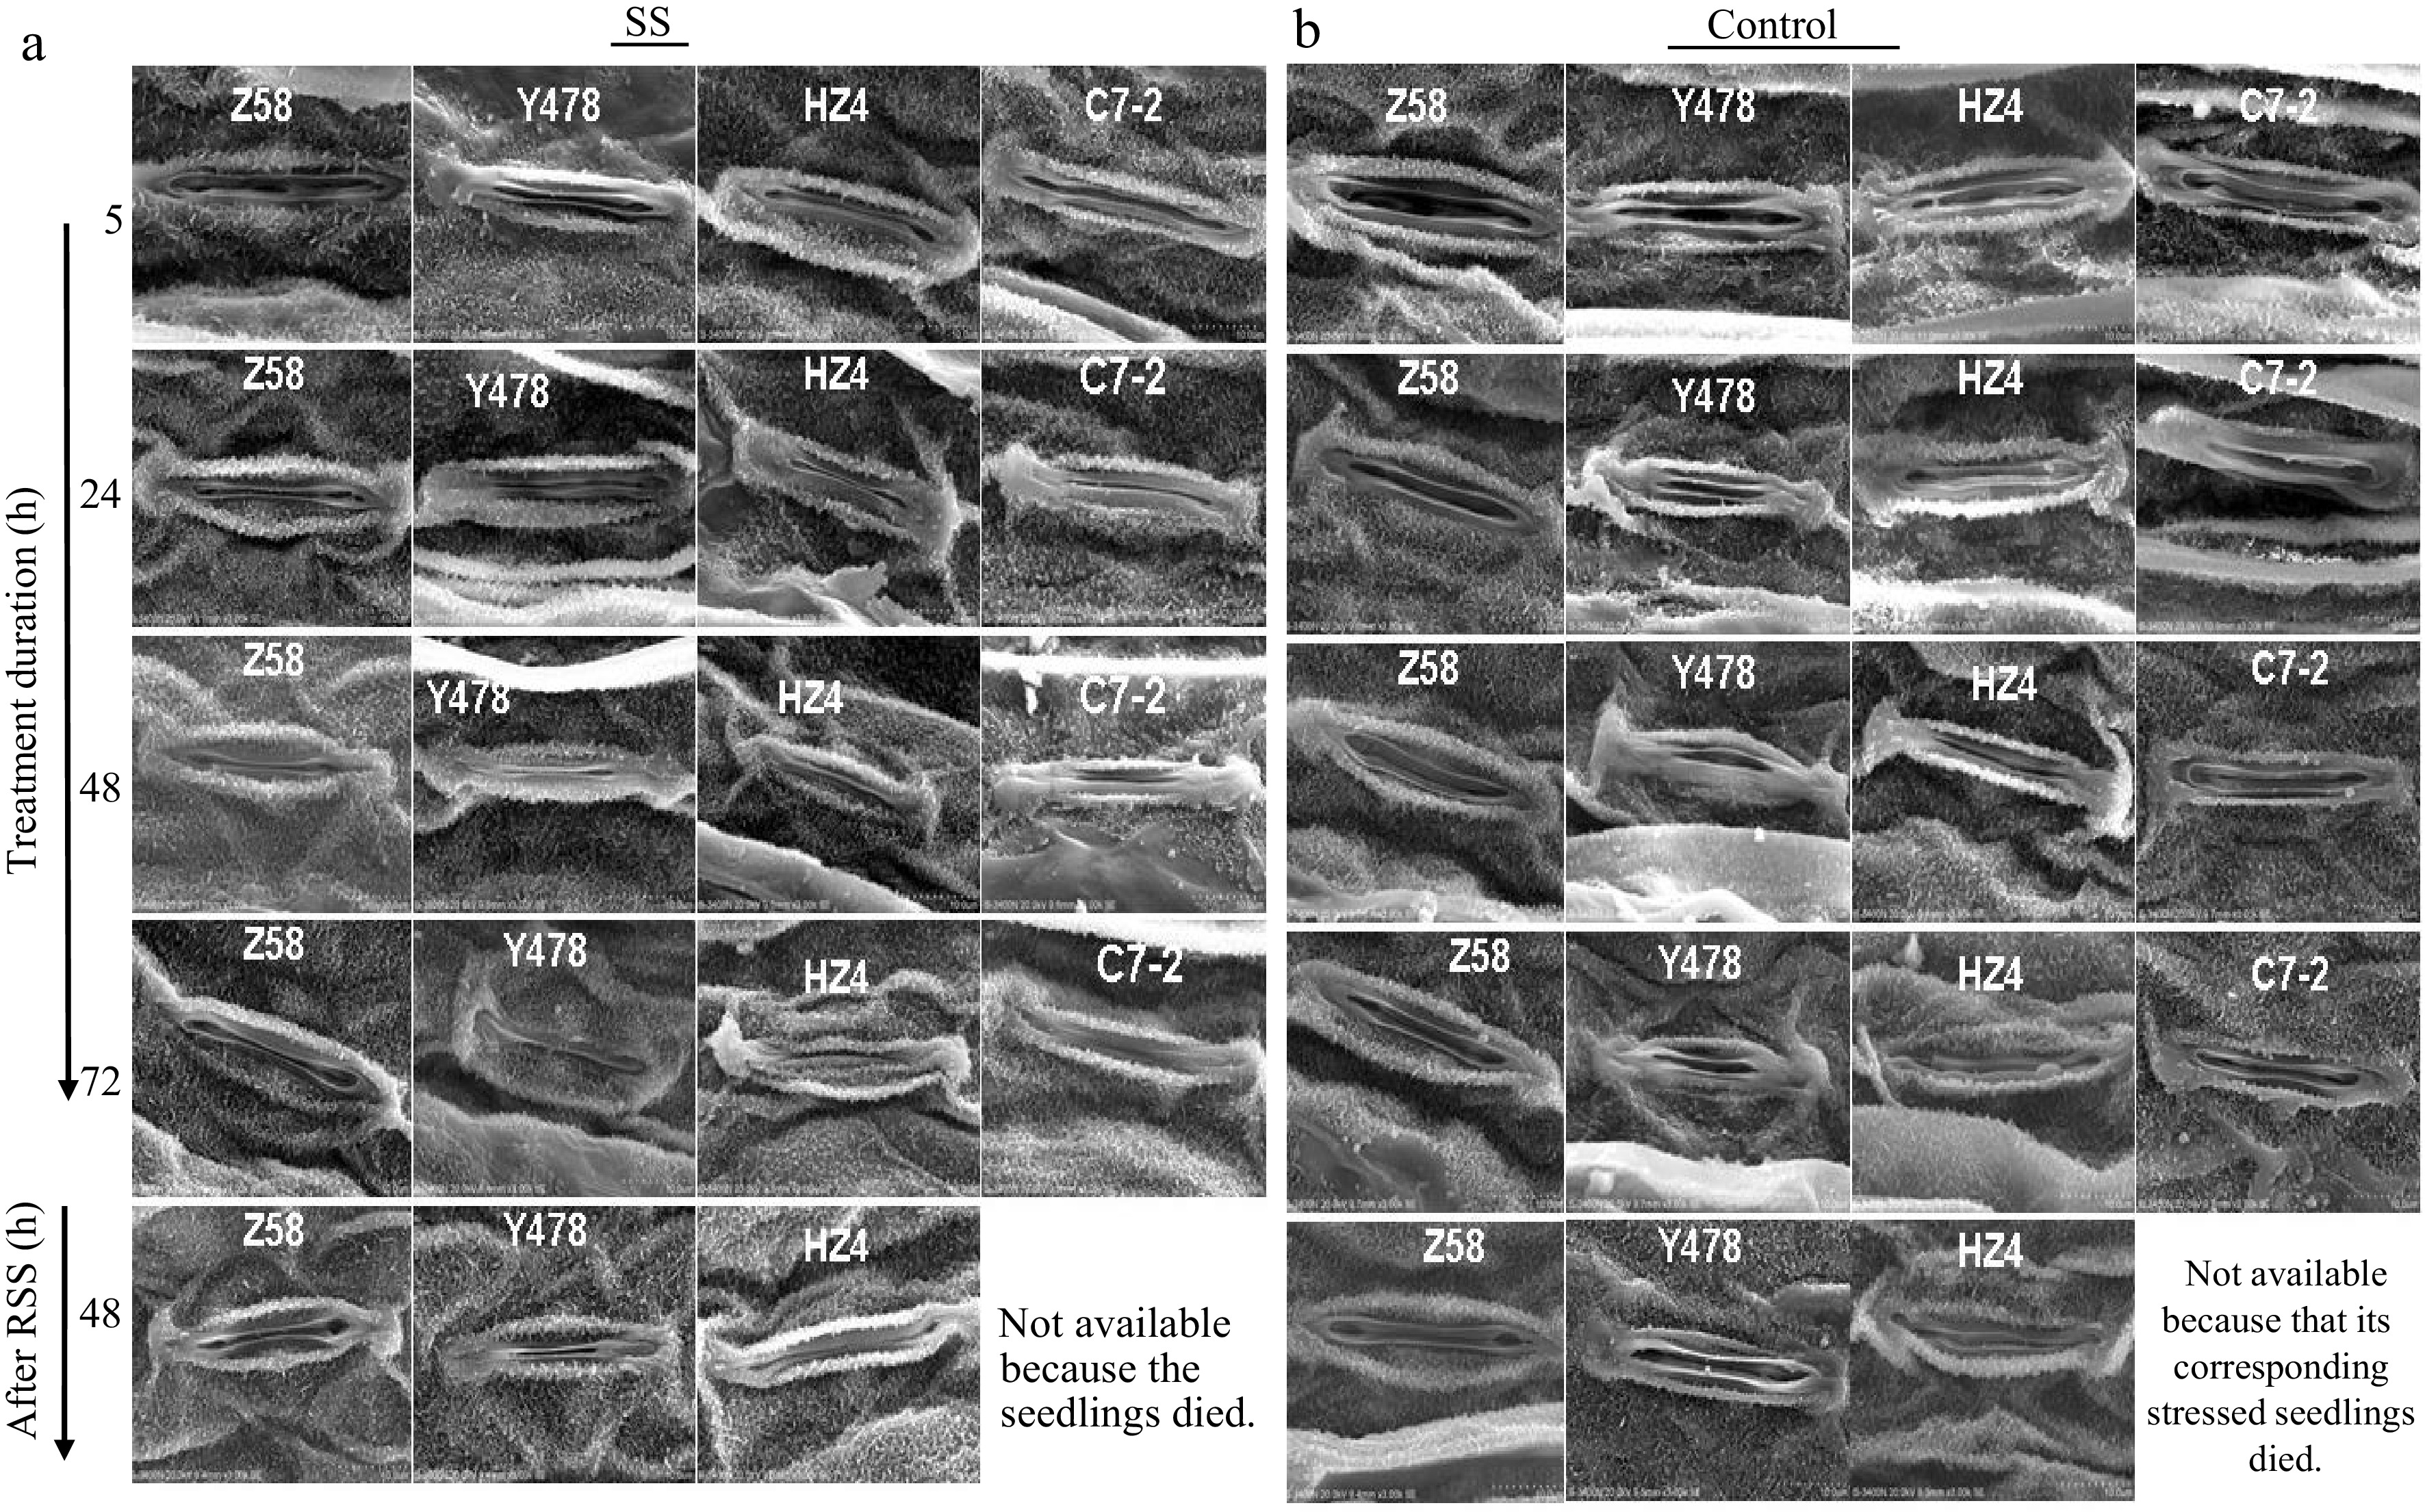
Figure 7.
Stomatal behaviour in leaves of maize inbred lines under SS and after RSS. The SS was conducted with 150 mM NaCl. The RSS treatment was performed on maize plants stressed by SS for 72 h. The photos of the leaf stomata were taken by SEM from the central region of the front surface of the fully expanded 2nd leaves of 3-leaf-old seedlings (n = 5) for each maize line under each treatment. The data of maize inbred line C7-2 after RSS were not available because of no surviving seedlings. C7-2, Maize inbred line Chang7-2. HZ4, Maize inbred line Huangzao4. RSS, Removal of SS. SEM, Scanning electron microscopy. SS, Salt shock. Y478, Maize inbred line Ye478. Z58, Maize inbred line Zheng58.
-
In this study, responses of four maize inbred lines of Z58, Y478, HZ4 and C7-2 to SS and RSS were characterized. In terms of phenotype, SS tolerance was strongest for Z58 and weakest for C7-2 (Table 1; Fig. 1a).
The decreased leaf RWC (Fig. 1b) and significantly increased Na+ content in roots (Fig. 2b) of SS-stressed maize lines after SS of 5 h suggest that maize suffers from the combined effects of water deficit, Na+ accumulation-induced osmotic stress at the whole-plant level once SS begins, somewhat differing from the two-phase ('osmotic' response/water deficit that dominates in Phase1 and the salt-specific response/salt toxicity in Phase 2) response model of plant growth under stepwise salt stress[40] .
The salt tolerance mechanisms in plants partly depend on controlling Na+ uptake and transport from roots to shoots[6]. It was reported that maize cultivars of lower Na+ contents were more sensitive to salt than cultivars of higher Na+ contents[20, 27, 30]. The enhanced salt tolerance of tomato plants expressing yeast HAL5 gene was related to a lower Na+ transport rate from roots to shoots[41]. Interestingly, our results indicated that Na+ content showed massive differences in leaves (Fig. 2c) but not in roots (Fig. 2b) among SS-stressed maize lines, highest in C7-2 leaves (Fig. 2c). In addition, Na+ content increased highly in C7-2 leaves within a short SS time (viz. after SS of 5 h) but in leaves of other maize lines only after a longer SS time (viz. after SS of 72 h) (Fig. 2c). These results together with Evans blue staining of SS-stressed roots (Fig. 1c) suggest that Na+ transport rate from roots to shoots is maybe slower in SS-tolerant maize lines than in SS-sensitive maize lines, and further imply that maintaining Na+ homeostasis in cells of leaves is more important for SS tolerance of maize.
A common oxidative stress on plants under salt stress results from over-production of reactive oxygen species (ROS) such as SARs[42]. High levels of ROS can damage cells[42]. However, an appropriate level of ROS is also important for plant growth and development because ROS plays a pivotal signalling role in stress-triggered tolerance mechanisms[43−45]. Therefore, a balance between production and removal of ROS must be tightly regulated to tolerate stress[17, 44]. In this study, SAR levels were overall much higher in roots than in leaves of SS-stressed maize especially after SS of 5 h (Fig. 4c). Z58, the most tolerant maize line, had the highest SAR level in roots (Fig. 4c) and the lowest Na+ content in leaves after SS of 5 h (Fig. 2c). However, C7-2, the most sensitive maize lines, had a lower SAR level in roots after SS of 5 h (Fig. 4c) and the highest Na+ level in leaves after SS of 72 h (Fig. 2c). These results strongly indicate that SS-tolerant maize lines can easily generate SAR signalling in roots than SS-sensitive maize lines at the onset of SS, and further implicate that the Na+-induced SAR signalling is probably involved in mediating the Na+ transport from roots to shoots and/or in balancing intracellular Na+.
The intracellular K+/Na+ ratio is a key determining trait of salt tolerance[46]. Lower K+ levels can further increase Na+ toxicity under salt stress because Na+ can compete with K+ for enzyme activation and protein biosynthesis[46]. Coupling of the lowest K+ contents (Fig. 3b) with the highest Na+ contents (Fig. 2c) in C7-2 leaves after SS of 5, 48, and 72 h suggest that Na+ accumulation under SS likely leads to leakiness of more cytosolic K+ in SS-sensitive maize than in SS-tolerant maize, in agreement with the prior viewpoints[47].
The peroxidation of the cell membrane by ROS is one of the main causes of membrane damage, resulting in production of malondialdehyde[48, 49]. The high malondialdehyde contents in both roots (Fig. 4a) and leaves (Fig. 4b) in SS-stressed maize lines of HZ4 and C7-2 suggest that keeping the cell membrane stable is of great importance in maize tolerance to SS.
High Ca2+ levels benefit plants under salt stress by compensating/minimizing the Na+-induced leakiness of cytosolic K+[50], increasing the relative availability of water for maize growth[51], and maintaining K+/Na+ selectivity[46]. Salt stress can cause a decrease in Ca2+ influx and an increase in Ca2+ efflux from the maize root cells[52]. During the first phase after approximately 2-3 weeks of salt stress applied in a hydroponic nutrient solution via daily NaCl increases, salt-sensitive maize cultivar 8023 had higher concentrations of Ca2+ than did salt-tolerant maize cultivar Pioneer 3906, although Ca2+ concentrations in shoots decreased in both two cultivars[21]. In cotton treated by SS in a 0.1× modified Hoagland solution supplemented with NaCl and CaCl2, Ca2+ influx increased in proportion to salt concentration (ranging from 150 to 250 mM NaCl)[50]. In this study, although Ca2+ content fluctuated greatly among roots of maize lines during SS (Fig. 3c), it gradually increased in leaves of Z58 and Y478 as SS time prolonged, and significantly decreased in leaves of HZ4 and C7-2 after SS of more than 24 h (Fig. 3d). Such discrepancies among different studies may be due to differences in treatment conditions/processes and materials. Anyway, our results suggest that maintaining high levels of Ca2+ in leaves is important to enhance maize tolerance to SS. These results together strongly indicate that Ca+/K+/Na+ balance is most important for palnt tolerance to salt stress but differ with plant species.
SOD, POD, CAT and APX are major antioxidant enzymes for plants to cope with oxidative damage under abiotic stresses[9, 17, 42, 43]. In this study, that the activities of the enzymes in SS-stressed maize increased but were highest activities in roots of Z58 in a short SS time (viz. after SS of 5 h) (Figs 5 & 6) suggest that increasing the activities of the antioxidant enzymes in roots is more significant at the initial SS phase than the late SS phase for maize to tolerate SS. This is likely because roots are only one tissue that is directly exposed to SS environments, on the other hand, the early and timely increase in the enzyme activity is conducive to the reconstruction of the antioxidant systems for maize to adapt to the ensuing SS. In addition, the differences in the enzyme activities between roots and leaves and among different maize lines under SS (Figs 5 & 6) implies that the utilization of antioxidant systems under SS varies with tissues and maize lines, with APX activity pattern as an example which significantly decreased in leaves of Z58 but significantly increased in leaves of HZ4 and C7-2 under SS (Fig. 6d).
The opening and closing of leaf stomata affect the entrance of CO2 into leaves, of which the stomatal closure not only causes the accumulation of ROS[42, 53] but also inhibits the production of osmoprotectants and radical scavengers[6]. The leaf stomata were always opened in Z58 and closed earlier in other maize lines under SS (Fig. 7a). The more significantly increased SAR levels in leaves of Y478, HZ4 and C7-2 as SS time prolonged (Fig. 4d). These results suggest that opening of the leaf stomata is particularly crucial to enhance maize tolerance to SS.
Taken all results together, the related mechanisms of SS tolerance of maize as well as a possible way to improve maize SS tolerance by spraying Ca and K fertilizer were proposed (Fig. 8).
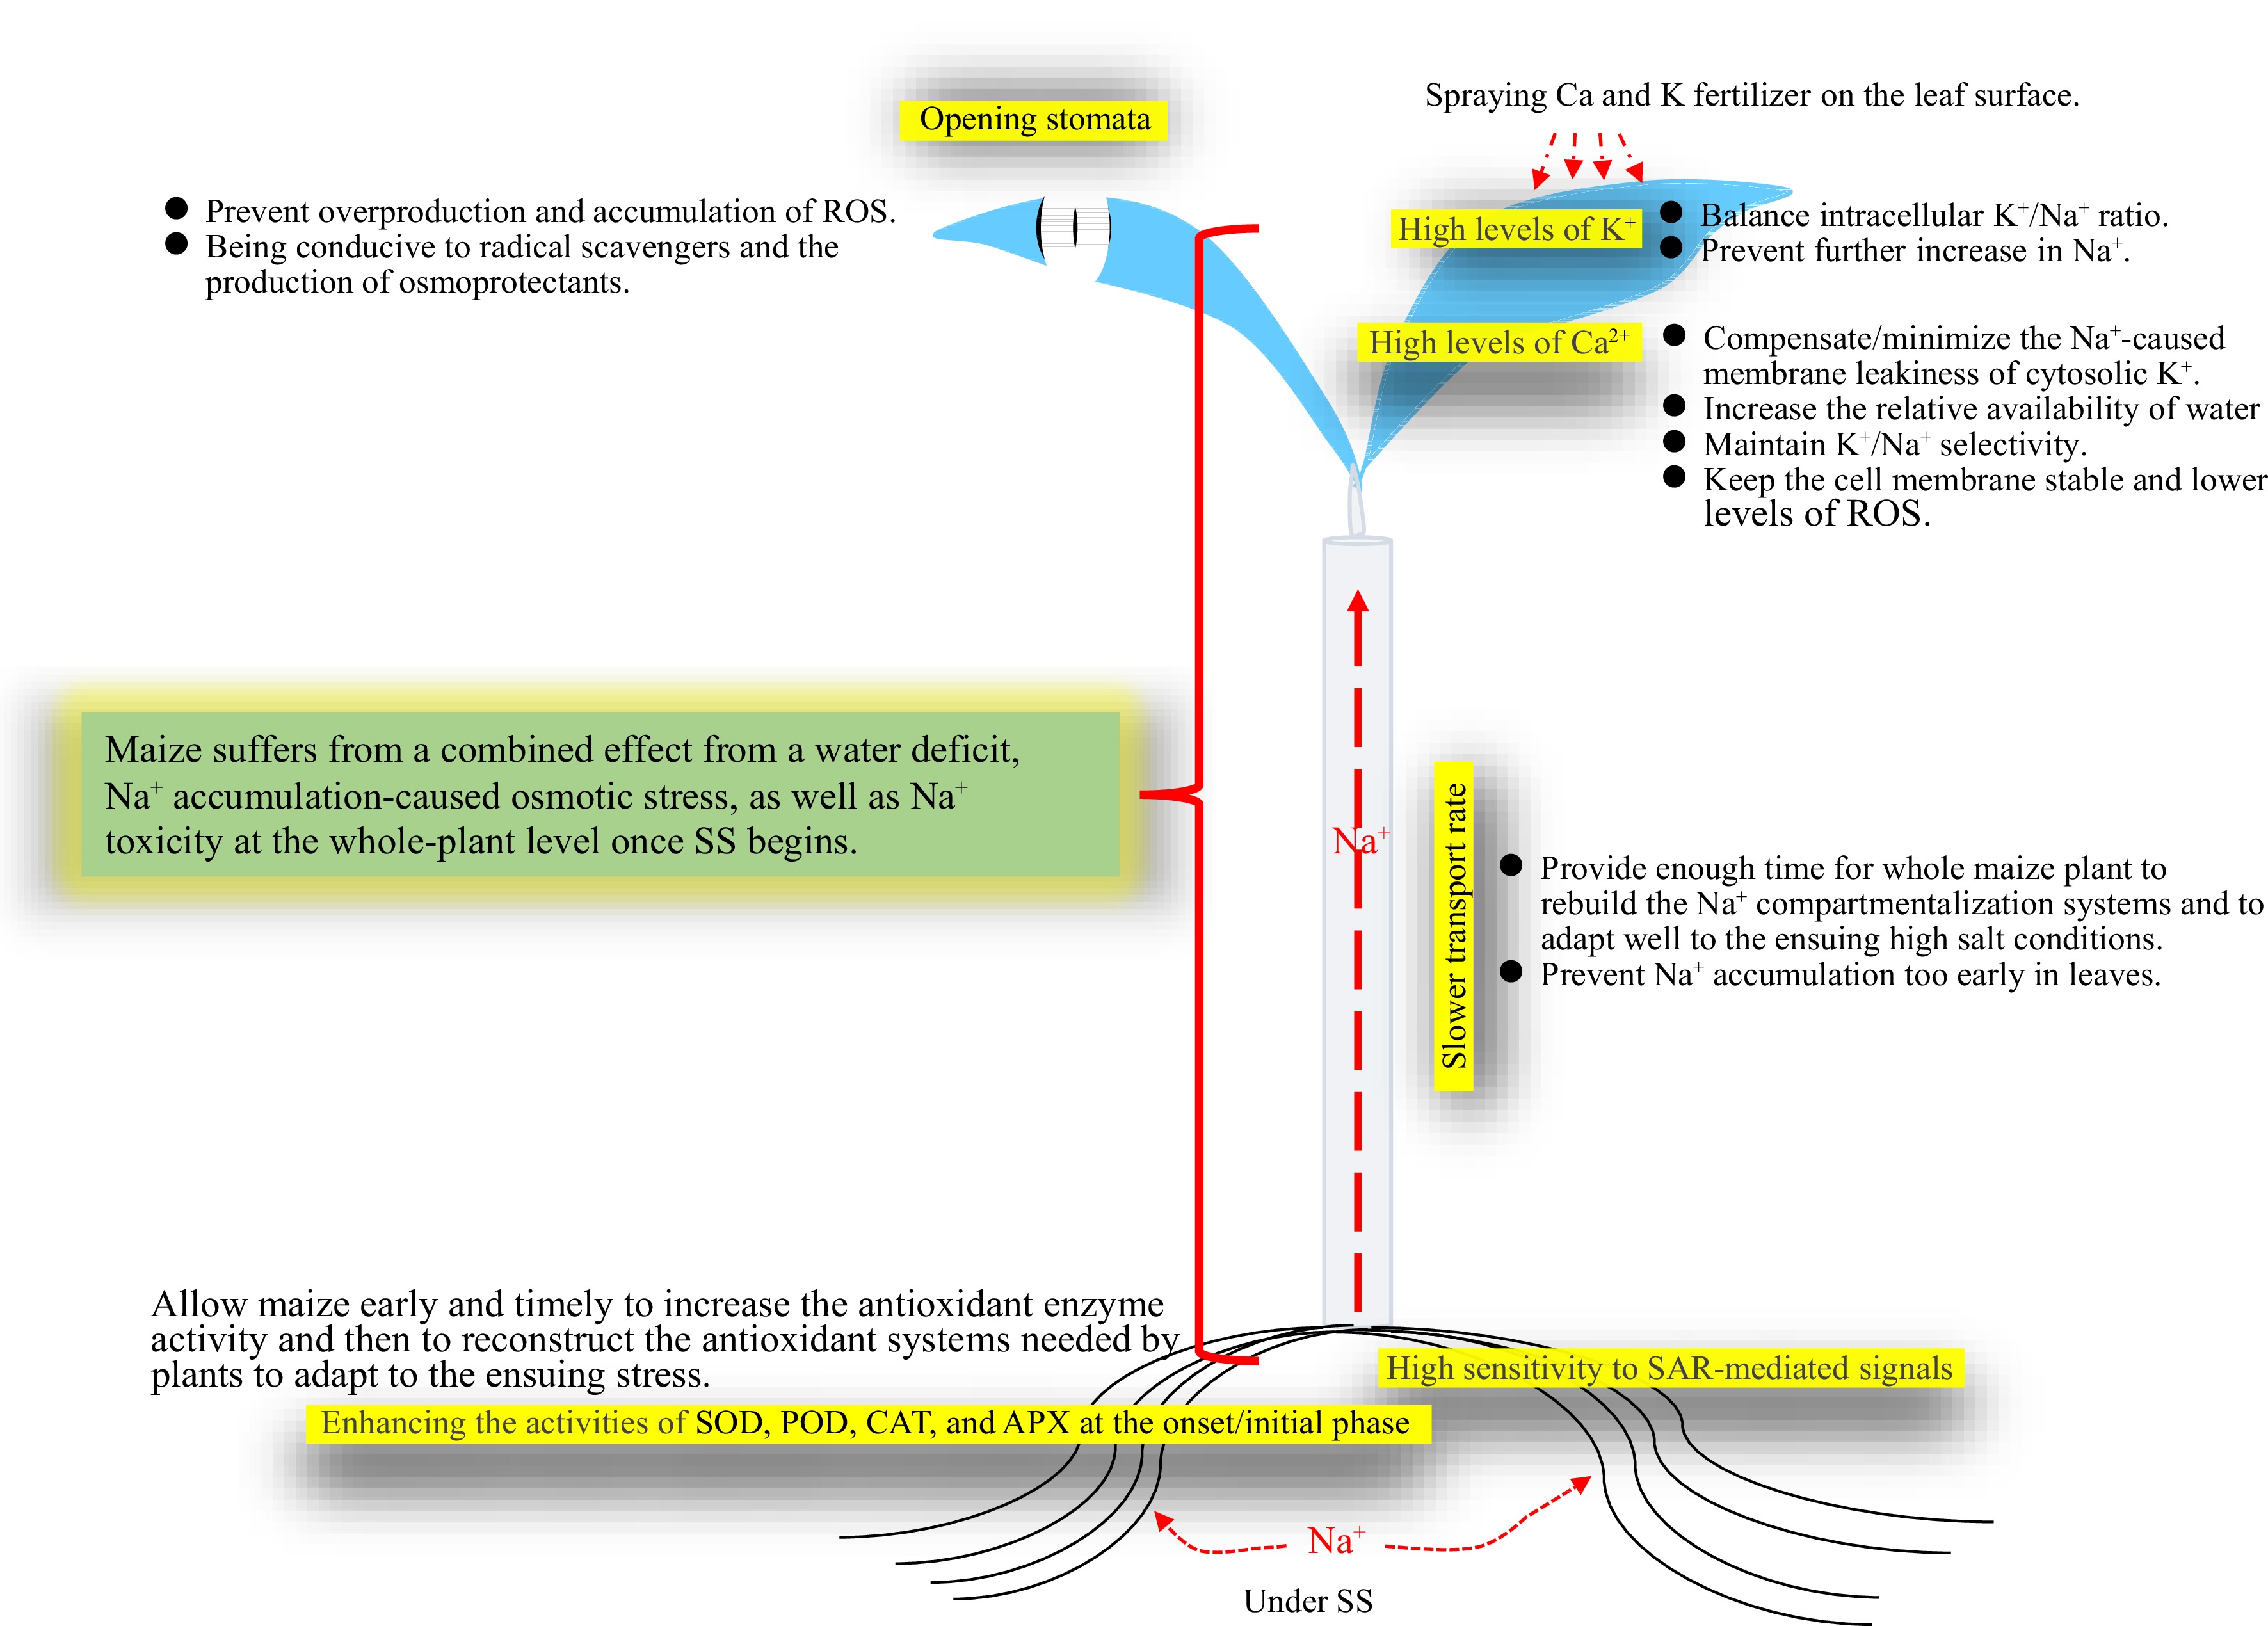
Figure 8.
Schematic mechanisms of maize tolerance to SS, and a possible measure to improve tolerance to SS. A possible measure to improve maize tolerance to SS by spraying Ca and K fertilizer onto leaf surfaces was suggested and shown. APX, Ascorbate peroxidase; CAT, Catalase; POD, Peroxidase; ROS, Reactive oxygen species; SAR, Superoxide anion radical; SOD, Superoxide dismutase; SS, Salt shock.
-
Maize has no clear processes of phase-order-response to SS, which suffers from the combined effects of osmotic stress, water deficiency, and Na+ accumulation-induced toxicity once SS occurs. Stronger tolerance of maize to SS is characterized by (1) timely increases in activities of antioxidant enzymes (SOD, POD, CAT and APX) and a stronger SAR-mediated signalling necessary to trigger the relevant tolerance mechanisms in roots once SS occurs; (2) a slow Na+ transport rate from roots to shoots especially in the early SS stage; and (3) opening of leaf stomata, and fine cell membrane integrity to prevent leakage of Ca2+ and K+ under SS. However, these mechanisms should be verified with more maize lines in future.
-
The authors confirm contribution to the paper as follows: study conception and design: Li YZ, Fan XW; data collection: Pan JL; analysis and interpretation of results: Li YZ, Pan JL; draft manuscript preparation: Li YZ. All authors reviewed the results and approved the final version of the manuscript.
-
All data generated or analyzed during this study are included in this published article.
-
We are grateful to Professors Yu Li and Yun-Su Shi, the Institute of Crop Sciences, CAAS, who kindly supplied the maize seeds.
-
The authors declare that they have no conflict of interest.
-
Received 28 April 2023; Accepted 17 October 2023; Published online 7 November 2023
-
Timely increased antioxidant enzyme activities are important to tolerance to stress.
Superoxide anion signalling at the beginning of stress is necessary for tolerance to stress.
A slow Na + transport rate from roots to shoots can endow tolerance to stress.
- Copyright: © 2023 by the author(s). Published by Maximum Academic Press on behalf of Hainan University. This article is an open access article distributed under Creative Commons Attribution License (CC BY 4.0), visit https://creativecommons.org/licenses/by/4.0/.
-
About this article
Cite this article
Pan JL, Fan XW, Li YZ. 2023. Insights into physio-biochemical responses of maize to salt shock stress and removal of the stress at the whole-plant level. Tropical Plants 2:20 doi: 10.48130/TP-2023-0020 

Insights into physio-biochemical responses of maize to salt shock stress and removal of the stress at the whole-plant level
- Received: 28 April 2023
- Accepted: 17 October 2023
- Published online: 07 November 2023
Abstract: Maize (Zea mays) is one of the world's three major food crops but sensitive to salinity at the seedling stage. Salinity/salt stress usually occurs due to gradually increased NaCl or under sudden exposure to NaCl, of which the latter is called salt shock (SS). However, little is known about physio-biochemical responses of maize to SS at the whole-plant level. The purpose of this study was to characterize the physio-biochemical response events of maize under SS. The experiments were conducted with four maize foundation parent inbred lines of Huangzao4, Chang7-2, Zheng58 and Ye478 under 150 mM NaCl for SS and after removal of SS in the nutrient solutions. The main findings were that the maize lines had no clear phase-order-response to SS, which suffered from the combined effects of osmotic stress, water deficiency, and Na+ accumulation-induced toxicity once SS occurred, and that SS-tolerant maize lines showed (1) timely increased activities of antioxidant enzymes (superoxide dismutase, peroxidase, catalase, and ascorbate peroxidase) and stronger superoxide anion radical-mediated signalling in roots at the beginning of SS, (2) a slow Na+ transport rate from roots to shoots especially in the early SS stage, and (3) opening of leaf stomata, and fine cell membrane integrity during SS. The related mechanisms of SS tolerance of maize were proposed and discussed.
-
Key words:
- Maize /
- Salt shock response /
- Antioxidant enzymes /
- Ca and K ions /
- Leaf stomata