ARTICLE   Open Access    

9,10-Anthraquinone contamination in tea processing using coal as heat source

  • # Authors contributed equally: Jiawei Yu, Li Zhou

More Information
  • 9,10-Anthraquinone (AQ) is a contaminant with a potential carcinogenic risk and occurs in tea worldwide. The maximum residue limit (MRL) of AQ in tea set by the European Union (EU) is 0.02 mg/kg. The possible sources of AQ in tea processing and the main stages of its occurrence were investigated based on a modified AQ analytical method and gas chromatography-tandem mass spectrometry (GC-MS/MS) analysis. Compared with electricity as the heat source in green tea processing, AQ increased by 4.3 to 23.9 times in tea processing with coal as the heat source, far exceeding 0.02 mg/kg, while the AQ level in the environment tripled. The same trend was observed in oolong tea processing under coal heat. The steps with direct contact between tea leaves and fumes, such as fixation and drying, are considered as the main steps of AQ production in tea processing. The levels of AQ increased with the rising contact time, suggesting that high levels of AQ pollutant in tea may be derived from the fumes caused by coal and combustion. Fourty samples from different workshops with electricity or coal as heat sources were analyzed, ranged from 50.0%−85.0% and 5.0%−35.0% for detection and exceed rates of AQ. In addition, the maximum AQ content of 0.064 mg/kg was observed in the tea product with coal as the heat source, indicating that the high levels of AQ contamination in tea products are likely to be contributed by coal.
  • Agricultural management practices impact soil physicochemical properties to a remarkable extent. Degradation of soil health has led to a contraction in agricultural production and soil biodiversity particularly due to conventional farming practices, indiscriminate use of inorganic fertilizers (INF) and inadequate input of residues[1]. Organic or inorganic fertilizers have been regarded as a critical component of agriculture to accomplish global food security goals[2]. The exogenous supply of fertilizers could easily alter soil properties by restoring the nutrients that have been absorbed by the plants[2]. Thus, implementing adequate nutrient management strategies could boost plant yield and sustain plant health. Tillage affects the soil, especially for crop production and consequently affects the agro-ecosystem functions. This involves the mechanical manipulation of the soil to modify soil attributes like soil water retention, evapotranspiration, and infiltration processes for better crop production. Thus, tillage practices coupled with fertilizer inputs may prove a viable strategy to improve soil health components such as nutrient status, biodiversity, and organic carbon.

    Soil serves as a major reservoir of nutrients for sustainable crop production. Intensive cultivation due to growing population burden has led to the decline of soil nutrient status that has adversely affected agricultural production. Various researchers have assessed the soil nutrient budget and the reasons behind decline of nutrient content in soil[3]. Soil management strategies have assisted in overcoming this problem to a greater extent. Tillage practices redistribute soil fertility and improve plant available nutrient content due to soil perturbations[4]. Different tillage and fertilization practices alter soil nutrient cycling over time[5]. Fertilization is an important agricultural practice which is known to increase nutrient availability in soil as well as plants[6]. A report has been compiled by Srivastava et al.[7], which assessed the effectiveness of different fertilizers on soil nutrient status in Indian soils.

    Soil biota has a vital role in the self-regulating functions of the soil to maintain soil quality which might reduce the reliance on anthropogenic activities. Soil microbial activities are sensitive to slight modifications in soil properties and could be used as an index of soil health[8]. Maintenance of microbial activity is essential for soil resilience as they influence a diverse range of parameters and activities including soil structure formation, soil SOM degradation, bio-geochemical cycling of nutrients etc.[9]. Various researchers have identified microbial parameters like microbial biomass carbon (MBC), potentially mineralizable nitrogen (PMN), soil respiration, microbial biomass nitrogen (MBN), and earthworm population as potential predictors of soil quality. Geisseler & Scow[10] have compiled a review on the affirmative influence of long-term mineral fertilization on the soil microbial community.

    Being the largest terrestrial carbon (C) reservoir, soil organic carbon (SOC) plays a significant role in agricultural productivity, soil quality, and climate change mitigation[11]. Manure addition, either solely or along with INF augments SOC content which helps in the maintenance and restoration of SOM more effectively as compared to the addition of INF alone[12]. Enhancement of recalcitrant and labile pools of SOC could be obtained through long-term manure application accentuating the necessity of continuous organic amendments for building up C and maintaining its stability[13]. Generally, compared with manure addition, INF application is relatively less capable of raising SOC and its labile fractions[14]. Alteration in SOC content because of management strategies and/or degradation or restoring processes is more prominent in the labile fraction of soil C[15]. Several fractions of soil C play vital roles in food web and nutrient cycles in soils besides influencing many biological properties of soil[16]. Thus, monitoring the response of SOC and its fractions to various management practices is of utmost importance.

    A positive impact on SOC under manure application coupled with INF in rice-wheat systems has been reported, as compared to sole applications of INFs[17]. Although ploughing and other mechanical disturbances in intensive farming cause rapid OM breakdown and SOC loss[18], additional carbon input into the soil through manure addition and rational fertilization increases carbon content[13]. Wei et al.[19] in light sandy loam soil of China found that the inclusion of crop straw together with inorganic N, P and K fertilizers showed better results for improving soil fertility over sole use of inorganic fertilizers. Zhu et al.[20] studied the influence of soil C through wheat straw, farmyard manure (FYM), green manure, and rice straw on plant growth, yield, and various soil properties and found that the recycling of SOM under intensive cultivation is completely reliant on net OM input and biomass inclusion. However, most of the studies on residue management and organically managed systems could not provide clear views regarding the relations between the quality of OM inputs and biological responses towards it. The disintegration of soil aggregates due to ploughing, use of heavy machinery, and residue removal has been reported widely under conventional tillage (CT) practices[21]. On the contrary, improvement in SOC stabilization has also been observed by some scientists[22]. Under CT, the disintegration of macro-aggregates into micro-aggregates is a prominent phenomenon, while conservation tillage has been identified as a useful practice for increasing macro-aggregates as well as carbon sequestration in agricultural soils[23]. By and large, the ploughing depth (0–20 cm) is taken into consideration for evaluating the impact of tillage and straw retention on soil aggregation[24], while degradation in deeper layers of soil is becoming a major constraint towards soil quality together with crop yield[25].

    Hence, the present review would be useful in determining how tillage practices and inorganic and organic fertilization impact nutrient availability in the soil, microbial composition and SOC fractions besides stocks under different land uses.

    Agricultural production is greatly influenced by nutrient availability and thus nutrient management is required for sustaining higher yields of crop. The term 'nutrient availability' refers to the quantity of nutrients in chemical forms accessible to plant roots or compounds likely to be converted to such forms throughout the growing season in lieu of the total amount of nutrients in the soil. For optimum growth, different crops require specifically designed nutrient ratios. Plants need macronutrients [nitrogen (N), phosphorus (P), potassium (K) in higher concentrations], secondary nutrients [calcium (Ca), magnesium (Mg), sulphur (S) in moderate amounts as compared to macronutrients] and Micronutrients [Zn (zinc), Fe (iron), Cu (copper), B (boron), Mn (manganese), Mo (molybdenum) in smaller amounts] for sustainable growth and production[26]. Fertilizers assist the monitoring of soil nutrient levels by direct addition of required nutrients into the soil through different sources and tillage practices may alter the concentration of available plant nutrients through soil perturbations. Various studies on the influence of fertilization and tillage practices on available plant nutrients have been discussed below.

    Yue et al.[27] reported that long-term fertilization through manure/INF improved the macronutrient content of Ultisol soil in China. Two doses of NPK (2NPK) considerably improved soil properties over a single dose (NPK). Combined application (NPK + OM) resulted in higher hydrolysable N and available P over the sole OM application. The total K content was higher under the treatments NPK, 2NPK and NPK + OM than sole OM treatment, whereas available K was higher in treatments NPK + OM and 2NPK over the sole OM and NPK. Likewise, OM, INF, and OM + INF were evaluated for their potential to regulate the soil macronutrient dynamics. Organic manure significantly improved the soil N content, whereas INF showed comparable results to that of the control treatment. Besides, all the treatments improved available P and exchangeable K concentration[28].

    Hasnain et al.[29] performed comparative studies of different ratios of INF + compost and different application times for the chemical N fertilizer on silty loamy soils of China. The available nitrogen and phosphorous content were greater in conjoint OM + INF application over the bare INF and control application irrespective of N application time. Soil quality substantially improved with increasing ratio of compost and 70:30 (INF to compost ratio) was found to be most suitable to maintain soil fertility and nutrient status. Another study by Liu et al.[30] reported the superior effects of NPK + pig manure and NPK + straw to improve soil available P and K over the control and sole NPK treatments. However, total N concentration did not exhibit any significant variation under any treatment.

    Shang et al.[31] accounted the positive impact of vermicompost and mushroom residue application on grassland soil fertility in China. The addition of organic manures improved available P and K content to a considerable extent. Under moisture-deficit winter wheat-fallow rotation, another study quantified the influence of residue management approaches and fertilizer rate on nutrient accrual. Residue burning resulted in no decline in soil macronutrient content, whereas the perpetual addition of FYM for 84 years significantly improved total N and extractable K and P concentration. Thus, residue incorporation along with FYM application may prove beneficial in reducing the temporal macronutrient decline[32].

    Ge et al.[33] examined the effects of NPK and NPK along with manure (NPKM) addition on the macronutrient status of Hapli-Udic Cambisol soil. The NPKM application resulted in the highest increase in total N, available-P and K concentration as compared to NPK and control. Likewise, mineral fertilization reduction and partial substitution with organic amendments have posed a significant influence on soil macronutrient status. Soil available P and K decreased after INF reduction[34]. Chen et al.[35] evinced that integrated application of manure and mineral fertilizers to red clay soil (typical Ultisols) improved hydrolyzed nitrogen and available P due to an increase in the decomposition of organic matter (OM) and N bio-fixation than sole mineral fertilizers and control.

    A long-term experiment was carried out out by Shiwakoti et al.[36] to ascertain the influence of N fertilization and tillage on macronutrient dynamics in soil. Nitrogen fertilization produced higher crop biomass which might have improved total N and P concentration in soil. Moreover, the reduced interaction between soil colloids and residue or greater cation exchange sites due to tillage practices could have augmented K concentration in 0−10 cm soil depth. Likewise, among tillage systems combined organic (poultry manure) and inorganic (lime and fertilizers) fertilization, no-tillage, and reduced tillage with organic fertilization resulted in higher availability of P owing to minimal disturbance of soil which decreases contact surface between phosphate ions and adsorption sites. Greater losses of K in runoff water under NT resulted in lower K availability under NT than CT[37].

    The influence of tillage systems on soil nutrient dynamics showed that minimal soil disturbances under zero tillage prohibited redistribution of soil nutrients and resulted in the highest available N, P, and K in the surface soil[38]. The influence of tillage timing on soil macronutrient status has also been assessed under tillage treatments that are fall tillage (FT), spring tillage (ST), no tillage (NT), and disk/chisel tillage (DT/CT) on mixed mesic Typic Haploxerolls soil. All the tillage systems differed in the quantity of residues generated. Thus, variation in the decomposition of crop residue and mineralization of SOM resulted in variable rates of nutrient release. The FT and ST had the highest N content over DT/CT and NT systems at corresponding depth. The N content also decreased with soil depth irrespective of tillage treatment. The available P and extractable K were highest under NT at the top 10 cm soil depth and increased over time[39]. Residue management in combination with tillage treatments (ST and CT) has been reported to affect the soil macronutrient status in Bangladesh. Tillage treatments enhanced the total N content to a considerable extent. Moreover, 3 years of residue retention led to a higher concentration of total N, available P and K in the soil.

    The combinations of N, P, and K in different ratios together with two rates of organic fertilizer (OF) applied on the aquic Inceptisol having sandy loam texture influenced the micronutrient status of the soil[40]. Soil Zn content decreased with time when no fertilizer was applied as compared to organic fertilizer (OF) application. The mineral fertilizer treatments led to a substantial increase in DTPA-extractable micronutrients in the soil. The higher micronutrient concentration due to higher OM highlights the importance of maintaining OM for soil fertility and higher crop production. Further studies revealed that long-term application of sole N fertilizers led to a significant decline in total Zn and Cu, whereas Mn and Fe status improved through atmospheric deposition. Phosphorus and OF addition along with straw incorporation markedly increased total Zn, Cu, Fe, and Mn. The DTPA-extractable Mn, Zn, Fe, and Cu were also higher in OF treatment, thus demonstrating the beneficial effects of constant OM application for maintaining the nutrient status of soil[41].

    López-Fando & Pardo[42] quantified the impact of various tillage practices including NT, CT, minimum tillage (MT), and zone-tillage (ZT) on soil micronutrient stocks. Tillage systems did exhibit a significant influence on plant available Fe stocks in the topsoil; however, diminished with depth under ZT, NT and MT. Manganese was higher in NT and ZT at all depths and increased with soil depth. Zinc was highest under NT and other results did not vary significantly as in the case of Cu. The SOC levels were also found to be responsible to affect micronutrients due to tillage practices. Likewise, in Calciortidic Haploxeralf soil the distribution of soil micronutrients (Zn, Mn, Fe, Cu) was ascertained under different tillage practices (CT, MT, and NT). The micronutrient status was highest under NT in the upper layers due to the higher SOC level[43].

    Sharma & Dhaliwal[44] determined that the combined application of nitrogen and rice residues facilitated the transformation of micronutrients (Zn, Mn, Fe, Cu). Among different fractions, the predominant fractions were crystalline Fe bound in Zn, Mn, and Cu and amorphous Fe oxide in Fe with 120 kg N ha˗1 and 7.5-ton rice residue incorporation. The higher content of occluded fractions adduced the increment in cationic micronutrient availability in soil with residue incorporation together with N fertilization due to increased biomass. Rice straw compost along with sewage sludge (SS) and INF also affected the micronutrient availability under the RW cropping system. Nitrogen fertilization through inorganic fertilizers and rice straw compost and sewage sludge (50% + 50%) improved soil micronutrient status due to an increase in SOM over sole NPK fertilizers[45]. Earlier, Dhaliwal et al.[46] in a long-term experiment determined that different combinations of NPK along with biogas slurry as an organic source modified the extractable micronutrient status of the soil.

    A comparative study was carried out by Dhaliwal et al.[47] to ascertain the long-term impact of agro-forestry and rice–wheat systems on the distribution of soil micronutrients. The DTPA-extractable and total Cu, Zn, Fe, and Mn were greater in the RW system due to the reduced conditions because of rice cultivation. Under the RW system Zn removal was higher which was balanced by continuous Zn application. The higher availability of Fe under the RW system was due to reduced conditions. Contrarily, Mn was greater under the agro-forestry system owing to nutrient recycling from leaf litter.

    The long-term impact of integrated application of FYM, GM, WCS (wheat-cut straw) and INF on the soil micronutrients (Zn, Mn, Cu, and Fe) have been studied by Dhaliwal et al.[48]. The FYM application substantially improved DTPA-extractable Zn status followed by GM and WCS, whereas Cu content was maximum in the plots with OM application. The highest Fe concentration was recorded in treatment in which 50% recommended N supplied through FYM. This could be ascribed to the release of micronutrients from OM at low soil pH.

    Shiwakoti et al.[49] studied the dual effects of tillage methods (MP, DP, SW) and variable rates of N (0, 45, 90, 135 and 180 kg ha−1) on the distribution of micronutrients under a moisture-deficit winter wheat-fallow system. The soil Mn content was highest under the DP regime. Inorganic N application reduced Cu content in the soil. Comparative studies with adjacent undisturbed grass pasture indicated the loss of Zn and Cu to a significant extent. Thus, DP along with nitrogen added through inorganic fertilizers could improve micronutrient concentration in the soil. Moreover, the results implied that long-term cultivation with nitrogen fertilization and tillage results in the decline of essential plant nutrients in the soil. Thus, organic amendments along with INF may prove an effective approach to increase soil micronutrient content. In another study conducted by Lozano-García & Parras-Alcántara[50] tillage practices such as NT under apple orchard, CT with the wheat-soybean system and puddling (PD) in the rice-rice cropping system were found to affect nutrient status. Under CT, Cu content was lowest and Zn content was highest. On the contrary, puddling caused an increase in Fe and Mn concentration owing to the dispersion of soil aggregates which reduced the percolation of water and created an anaerobic environment thereby enhancing the availability of Fe and Mn.

    Tillage practices along with gypsum fertilization have been known to affect secondary nutrient concentrations in soil. In a long-term experiment, FYM application showed maximum response to increased S concentration due to the maximum addition of OM through FYM over other treatments as S is an essential component of OM and FYM[32]. Higher Mg content was recorded in FYM and pea vine treatments because the application of organic matter through organic manure or pea vines outright led to Mg accrual. The lower Mg concentration in topsoil than the lower layers was due to the competition between Mg and K for adsorbing sites and thus displacement of Mg by K. Han et al.[28] while ascertaining the impact of organic manures and mineral fertilizers (NPK) on soil chemical attributes determined that INF application reduced exchangeable calcium, whereas no significant changes were exhibited in the magnesium concentrations. The OM application significantly increased both the calcium and magnesium concentrations in the soil.

    While ascertaining the effect of different tillage treatments such as CT, NT, and MT on exchangeable and water-soluble cations, Lozano-García & Parras-Alcántara[50] recorded that NT had greater content of exchangeable Ca2+ and Mg2+ than MT and CT. The exchangeable Ca2+ decreased with depth, however, opposite results were observed for Mg2+ which might be due to the higher uptake of Mg2+ by the crop. On another note, there might be the existence of Mg2+-deficient minerals on the surface horizon. Alam et al.[51] studied the temporal effect of tillage systems on S distribution in the soil and observed that available S was 19%, 31%, and 34% higher in zero tillage than in minimum tillage, conventional tillage, and deep tillage, respectively.

    Kumar et al.[38] appraised the impact of tillage systems on surface soil nutrient dynamics under the following conditions: conventional tillage, zero till seeding with bullock drawn, conventional tillage with bullock drawn seeding, utera cropping and conservation tillage seeding with country plough and observed that tillage had a significant impact on the available S content. Compared with conventional tillage, zero and minimum tillage had higher S content as there was none or limited tillage operations which led to the accumulation of root stubble in the soil that decomposed over time and increased S concentration.

    Soil is considered a hotspot for microbial biodiversity which plays an important role in building a complex link between plants and soil. The microbial components exhibit dynamic nature and, therefore, are characterized as good indicators of soil quality[52]. These components include MBC, MBN, PMN and microbial respiration which not only assist in biological transformations like OM conversion, and biological nitrogen fixation but also increase nutrient availability for crop uptake. Management strategies such as fertilizer inputs and tillage practices may exert beneficial effects on soil biota as discussed below.

    Soil is an abode to a considerable portion of global biodiversity. This biodiversity not only plays a pivotal role in regulating soil functions but also provides a fertile ground for advancing global sustainability, especially agricultural ventures. Thus, the maintenance of soil biodiversity is of paramount importance for sustaining ecosystem services. Soil biodiversity is the diverse community of living creatures in the soil that interact not only with one another but also with plants and small animals to regulate various biological activities[53]. Additionally, it increases the fertility of soil by converting organic litter to SOM thereby enhancing SOC content. Thus, the SOM measures the number and activity of soil biota. Furthermore, the quality and amount of SOC, as well as plant diversity have a considerable impact on the soil microbial community structure[54].

    Dangi et al.[55] ascertained the impact of integrated nutrient management and biochar on soil microbial characteristics and observed that soil amended with biochar or the addition of organic manures influenced microbial community composition and biomass and crop yield. After two years, the higher rates of biochar significantly enhanced the levels of gram-positive and gram-negative bacterial phospholipid fatty acid (PLFA), total arbuscular mycorrhizal fungal (AMF) than lower rates, unfertilized and non-amended soil. Luan et al.[56] conducted a comparison study in a greenhouse to assess the effects of various rates of N fertilizer and kinds (inorganic and organic) on enzyme activities and soil microbial characteristics. Microbial growth (greater total PLFAs and microbial biomass carbon) and activity were promoted by manure substitution of mineral fertilizer, particularly at a higher replacement rate. On account of lower response in bacterial over fungal growth, manure addition led to a greater fungi/bacteria ratio. Furthermore, manure application significantly enhanced microbial communities, bacterial stress indicators and functional diversity. Lazcano et al.[57] determined the influence of different fertilization strategies on microbial community structure and function, soil biochemical properties and crop yield three months after addition of fertilizer. The integrated fertilizer regimes augmented microbial growth with improved enzyme activity as compared to sole inorganic amendments. Bacterial growth showed variable response with variation in fertilizer regime used whereas fungal growth varied with the amount of fertilizer added. Compared to mineral fertilizers, manure application led to a rapid increase in PLFA biomarkers for gram-negative bacteria. The organic amendments exhibited significant effects even at small concentration of the total quantity of nutrients applied through them; thus, confirming the viability of integrated fertilizer strategies in the short term.

    Kamaa et al.[58] assessed the long-term effect of crop manure and INF on the composition of microbial communities. The organic treatments comprised of maize (Zea mays) stover (MS) at 10 t ha−1 and FYM @ 10 t ha−1, INF treatments (120 kg N, 52.8 kg P-N2P2), integrated treatments (N2P2 + MS, N2P2 + FYM), fallow plot and control. The treatment N2P2 exhibited unfavourable effects on bacterial community structure and diversity that were more closely connected to the bacterial structure in control soils than integrated treatments or sole INF. In N2P2, fungal diversity varied differently than bacterial diversity but fungal diversity was similar in the N2P2 + FYM and N2P2 + MS-treated plots. Thus, the total diversity of fungal and bacterial communities was linked to agroecosystem management approaches which could explain some of the yield variations observed between the treatments. Furthermore, a long-term experiment was performed by Liu et al.[59] to study the efficiency of pig manure and compost as a source for N fertilization and found unique prokaryotic communities with variable abundance of Proteobacteria under compost and pig manure treatments.

    Recently, Li et al.[60] assessed the influence of different tillage practices (no-tillage, shallow tillage, deep tillage, no-tillage with straw retention, shallow tillage with straw retention and deep tillage with straw retention) on microbial communities and observed that tillage practices improved the bacterial Shannon index to a greater extent over the no-tillage plots in which the least value was recorded. Another research study by He et al.[61] reported the effect of tillage practices on enzyme activities at various growth stages. Across all the growth stages, enzyme activities of cellobiohydrolase (CBH), β-xylosidase (BXYL), alkaline phosphatase (AP), β-glucosidase (BG), β-N-acetylglucosamines (NAG) were 17%−169%, 7%−97%, 0.12%−29%, 3%−66%, 23%−137% greater after NT/ST, NT, ST, ST/PT, and PT/NT treatments as compared to plow tillage. The NT/ST treatment resulted in highest soil enzyme activities and yield, and thus was an effective and sustainable method to enhance soil quality and crop production.

    Microbes play a crucial role in controlling different soil functions and soil ecology and microbial community show significant variation across as well as within the landscape. On average, the total biomass of microbes exceeds 500 mg C kg soil−1[62]. Microbial biomass carbon is an active constituent of SOM which constitutes a fundamental soil quality parameter because SOM serves as a source of energy for microbial processes and is a measure of potential microbial activity[48,63]. Soil systems that have higher amounts of OM indicate higher levels of MBC. Microbial biomass carbon is influenced by many parameters like OM content in the soil, land use, and management strategies[64]. The MBC and soil aggregate stability are strongly related because MBC integrates soil physical and chemical properties responds to anthropogenic activities.

    Microbial biomass is regarded as a determinative criterion to assess the functional state of soil. Soils having high functional diversity of microbes which, by and large, occurs under organic agricultural practices, acquire disease and insect-suppressive characteristics that could assist in inducing resistance in plants[65]. Dou et al.[66] determined that soil microbial biomass C (SMBC) was 5% to 8% under wheat-based cropping systems and zero tillage significantly enhanced SMBC in the 0−30 cm depth, particularly in the upper 0 to 5 cm. According to Liang et al.[67], SMBC and soil microbial biomass N (SMBN) in the 0−10 cm surface layer were greater in the fertilized plots in comparison to the unfertilized plots on all sampling dates whereas microbial biomass C and N were highest at the grain filling stage. Mandal et al.[68] demonstrated that MBC also varied significantly with soil depth. Surface soil possessed a maximum MBC value than lower soil layers due to addition of crop residues and root biomass on the surface soil. The MBC content was highest with combined application of INF along with farmyard manure and GM, whereas untreated plots showed minimum MBC values. The incorporation of CR slows down the rate of mineralization processes; therefore, microbes require more time to decompose the residues and utilize the nutrients released[69]. On the other hand, incorporation of GR having a narrow C:N ratio enhances microbial activity and consequently accelerates mineralization in the soil. Malviya[70] also recorded that the SMBC contents were significantly greater under RT than CT, regardless of soil depth which was also assigned to residue incorporation which increases microbial biomass on account of higher carbon substrate in RT.

    Naresh et al.[71] studied the vertical distribution of MBC under no-tillage (NT), shallow (reduced) tillage and normal cultivated fields. A shallow tillage system significantly altered the tillage induced distribution of MBC. In a field experiment, Nakhro & Dkhar[72] examined the microbial populations and MBC in paddy fields under organic and inorganic farming approaches. The organic source used was a combination of rock phosphate, FYM and neem cake, whereas a mixture of urea, muriate of potash and single super phosphate was used as an inorganic source. The organically treated plots exhibited the highest MBC compared to inorganically treated plots and control. Organic carbon exhibited a direct and significant correlation with bacterial and fungal populations. The addition of organic fertilizers enhanced the content of SOC and consequently resulted in higher microbial count and MBC. Ramdas et al.[73] investigated the influence of inorganic and organic sources of nutrients (as minerals or INF) applied over a five-year period on SOC, MBC and other variables. It was observed that the addition of FYM and conjoint application of paddy straw (dry) and water hyacinth (PsWh) (fresh) significantly increased the SOC content than vermicompost, Chromolaena adenophorum (fresh) and Glyricidia aculeate (fresh), and Sesbania rostrata (fresh).

    Xu et al.[74] evaluated the influence of long-term fertilization strategies on the SOC content, soil MBN, soil MBC, and soil microbial quotient (SMQ) in a continuous rice system and observed that MBC at the main growth stages of early and late rice under 30% organic matter and 70% mineral fertilizer and 60% organic matter and 40% mineral fertilizer treatments was greater as compared to mineral fertilizer alone (MF), rice straw residues and mineral fertilizer (RF), and no fertilizer (CK) treatments. However, SMBC levels at late growth stages were greater in comparison to early growth stages. A recent study by Xiao et al.[75] demonstrated that increasing tillage frequency (no-tillage, semi-annual tillage, and tillage after every four months, two months, and one month) decreased soil MBC. Microbial biomass carbon content was significantly greater in no-till treatment (597 g kg−1) than in tillage every four months (421 g kg−1), two months (342 g kg−1) and one month (222 g kg−1). The decrease in the content of MBC in association with tillage practices is due to soil perturbations which enhanced soil temperature, diminished soil moisture content, and resulted in the destruction of microbial habitat and fungal hyphae. Therefore, the MBC content eventually affected the N cycle.

    Li et al.[76] reported that in comparison to CT, NT and RT resulted in increased MBC content and NT significantly increased MBC by 33.1% over CT. Furthermore, MBC concentration was 34.1% greater in NT than RT. The increase in MBC concentration was correlated with the results of increase in SOC concentration. Site-specific factors including soil depth and mean annual temperature significantly affected the response ratio of MBC under NT as compared to the duration of NT.

    Microbial biomass nitrogen (MBN) is a prominent indicator of soil fertility as it quantifies the biological status of soil. Soil MBN is strongly associated with organic matter of the soil. The nitrogen in MBN has a rapid turnover rate thereby reflecting the changes in management strategies way before the transformations in total N are discernable[77].

    In an experiment on continuous silage maize cultivation with crop rotation, Cerny et al.[78] observed that organic fertilizers exerted an affirmative influence on the soil MBN. During the application of organic manure MBN decreased, but there was higher MBN content as compared to control. However, addition of mineral nitrogenous fertilizers exerted an adverse effect on MBN content in experiments with maize. El-Sharkawi[79] recorded that organic matter-treated pots resulted in maximum MBN content than urea-treated pots. The sludge application enhanced total MBN and, therefore, could implicitly benefit crop production particularly in poor soils[18]. Sugihara et al.[80] observed that during the grain-filling stage in maize, residue and/or fertilizer addition exerted a pronounced influence on soil microbial dynamics; however, a clear effect of residue and ⁄or fertilizer addition was not observed. Microbial biomass nitrogen reduced dramatically from 63–71 to 18–33 kg N ha˗1 and C:N ratio at the same time increased more than ten-fold in all plots.

    Malik et al.[81] apprised that the organic amendments significantly enhanced MBN concentrations up to 50% more than the unamended soil. Wang et al.[82] evaluated the influence of organic materials on MBN content in an incubation and pot experiment with acidic and calcareous soils. The results revealed that MBN content which was affected by the different forms of organic amendments, increased by 23.37%−150.08% and 35.02%−160.02% in acidic and calcareous soils, respectively. The MBN content of both soils decreased with the increase in the C/N ratio of the organic materials, though a higher C/N ratio was effective for sustaining a greater MBN content for a very long time.

    Dhaliwal & Bijay-Singh[52] observed higher MBN levels in NT soils (116 kg ha−1) than in cultivated soils (80 kg ha−1). Kumar et al.[83] ascertained that in surface layer, MBN content was 11.8 mg kg−1 in CT which increased to 14.1 and 14.4 mg kg−1 in ZT and RT without residue retention and 20.2, 19.1 and 18.2 mg kg−1 in ZT, RT and CT with residue incorporation, respectively (Table 1). In the subsurface layer, the increased tendency on account of tillage and crop residue retention was identical to those of 0−15 cm layer but the magnitude was comparatively meagre (Table 1). In comparison to control, the persistent retention of crop residues led to significant accrual of MBN in the surface layer.

    Table 1.  Effect of different treatments on contents of various fractions of soil organic carbon[38].
    TreatmentsPMN (mg kg−1)MBC (mg kg−1)MBN (mg kg−1)DOC (mg kg−1)
    Depths (cm)
    0−1515−300−1515−300−1515−300−1515−30
    Tillage practices
    ZTR12.411.2562.5471.120.218.9198.6183.6
    ZTWR8.57.6350.4302.114.112.6167.1159.2
    RTR10.69.9490.2399.319.117.2186.4171.6
    RTWR7.66.6318.1299.814.413.7159.5148.7
    CTR9.38.5402.9354.418.216.6175.9168.9
    CT6.75.6307.9289.511.89.7142.5134.6
    Nitrogen management
    Control3.62.8218.3202.910.810.4103.792.3
    80 kg N ha−15.34.4241.1199.414.912.2128.3116.9
    120 kg N ha−18.97.6282.7220.916.516.1136.8123.6
    160 kg N ha−19.88.4343.9262.919.418.1164.8148.9
    200 kg N ha−110.49.7346.3269.622.721.7155.7136.4
    ZTR = Zero tillage with residue retention, ZTWR = Zero tillage without residue retention; RTR = Reduced tillage with residue retention, RTWR = Reduced tillage without residue retention, CTR = Conventional tillage with residue incorporation; CT = Conventional tillage without residue incorporation.
     | Show Table
    DownLoad: CSV

    Xiao et al.[75] determined that the MBN content decreased with tillage treatment having highest value in no tillage treatment, however, the difference among the treatments was negligible. Soil perturbations decreased the aggregate size and thus lower the soil aeration and exposure of fresh organic matter which restricted the growth of microorganisms. The results also concluded that MBN content is highly sensitive to tillage. Ginakes et al.[84] assessed the impact of zone tillage intensity on MBN in a corn-kura clover cropping sequence. Microbial biomass nitrogen was influenced by time and type of tillage treatment. Temporal studies revealed that MBN was higher after tillage treatment than the values possessed before tillage. Under different tillage treatments, higher values were recorded in ST (shank-till) and DT (double-till) over NT and RZT (zone-till) treatments.

    Another biological parameter, PMN, is a crucial parameter of soil fertility due to its association with soil N supply for crop growth. Also, PMN indicates the status of soil microbial community associated with PMN, whether it is improving or degrading. Forest soils are characterized by greater levels of PMN than CT receiving conventional chemical fertilizers which could be assignable to improved microbial activity in the former soils than the latter[48,77]. Aulakh et al.[85] assessed the effect of various combinations of fertilizer N, P, FYM and wheat residue (WR) applied to soybean and soybean residues added to wheat under CT and CA. The added fertilizers of N and P, FYM, and crop residue enhanced the mean weight diameter and water-stable aggregates thus favoured the development of macro-aggregates. The treatment INF + FYM + crop residue performed better among all the treatments. The net flux of mineral nitrogen from the mineralizable fraction is used to measure potentially mineralizable N which indicates the balance between mineralization and immobilization by soil microbes[77]. Nitrogen mineralization is widely used to assess the ability of SOM to supply inorganic nitrogen in the form of nitrate which is the most common form of plant-available nitrogen. Kumar et al.[83] observed an increase in PMN which was higher in surface soil than sub-surface soil thereby implying that high OC accumulation on account of crop residue retention was the most probable cause.

    Verma & Goyal[86] assessed the effect of INM and organic manuring on PMN and observed that PMN was substantially affected by different organic amendments. Potentially mineralizable nitrogen varied between 19.6−41.5 mg kg−1 soil with greater quantity (2.5%) in vermicompost applied plots than FYM treated plots. The INF treatments resulted in lower PMN content which could be due to nutrient immobilization by microbes. Mahal et al.[87] reported that no-till resulted in higher PMN content than conventional tillage treatments. This trend was due to the maintenance of SOM due to the residue cover and reduction of soil erosion under no-tillage system[88]. On the contrary, tillage practices led to the loss of SOC owing to loosened surface soil and higher mineralization of SOM.

    Soil respiration is referred as the sum of CO2 evolution from intact soils because of the respiration by soil organisms, mycorrhizae and roots[89]. Various researchers have proposed soil respiration as a potential indicator of soil microbial activity[52,77]. Gilani & Bahmanyar[90] observed that addition of organic amendments enhanced soil respiration more than the control and synthetic fertilizer treatments. Moreover, among organic amendment treatments, highest soil respiration was observed in sewage-sludge treated soils. Under controlled conditions in saline-sodic soil, Celis et al.[91] reported that sewage sludge resulted in a higher soil respiration rate than mined gypsum and synthetic gypsum. The application of gypsum because of minimal organic matter intake had little effect on soil respiration. The addition of organic matter especially during early spring led to higher microbial biomass and soil respiration albeit diminished levels of nitrate-N. Moreover, SOM hinders the leaching of nitrate ions thereby resulting in a better soil chemical environment[71].

    Faust et al.[92] observed that microbial respiration was associated with volumetric water content. The respiration declined with less availability of water, thus the lesser the tillage intensity, the more the volumetric water content which consequently resulted in higher microbial respiration. Another study by Bongiorno et al.[93] reflected the influence of soil management intensity on soil respiration. Reduced tillage practices resulted in 51% higher basal respiration than CT. Furthermore, this investigation suggested that microbial catabolic profile could be used as a useful biological soil quality indicator. Recently, Kalkhajeh et al.[94] ascertained the impact of simultaneous addition of N fertilizer and straw-decomposing microbial inoculant (SDMI) on soil respiration. The SDMI application boosted the soil microbial respiration which accelerated the decomposition of straw due to N fertilization. The C/N ratio did not affect the microbial respiration at elongation and heading stages, whereas N fertilization enhanced the microbial respiration to a greater extent than the unfertilized control. Additionally, the interaction between sampling time and basal N application significantly affected microbial respiration.

    Gong et al.[95] apprised the effect of conventional rotary tillage and deep ploughing on soil respiration in winter wheat and observed that deep ploughing resulted in a higher soil respiration rate than conventional rotary tillage. Soil moisture content and temperature are the dominating agents influencing soil respiration which is restricted by the soil porosity.

    Soil organic carbon plays a vital role in regulating various soil functions and ecosystem services. It is influenced by numerous factors like tillage practices and fertilization. Moreover, modified management practices may prove beneficial to avoid SOC loss by increasing its content. An exogenous supply of fertilizers may alter the chemical conditions of soil and thus result in transformation of SOC. Tillage practices lead to frequent soil disturbances which reduce the size of soil aggregates and accelerate the oxidation of SOC thereby reducing its content. The literature on the influence of fertilization and tillage practices on the transformation of SOC is discussed below.

    Soil organic carbon is a major part of the global carbon cycle which is associated not only with the soil but also takes part in the C cycling through vegetation, oceans and the atmosphere (Figs 1 & 2). Soil acts as a sink of approximately 1,500 Pg of C up to 1 m depth, which is greater than its storage in the atmosphere (approximately 800 Pg C) and terrestrial vegetation (500 Pg C) combined[96]. This dynamic carbon reservoir is continuously cycling in diverse molecular forms between the different carbon pools[97]. Fertilization (both organic and mineral) is one of the crucial factors that impart a notable influence on OC accretion in the soil. Many researchers have studied the soil C dynamics under different fertilizer treatments. Though inorganic fertilizers possess the advantage of easy handling, application and storage, they do not contribute to soil organic carbon. On the contrary, regardless of management method, plant residues are known to increase organic carbon content.

    Figure 1.  Impact of different fertilization regimes on abundance of the microbial biomarker groups . Error bars represent the standard error of the means and different letters indicate significant differences at p < 0.05 among treatments. Source: Li et al.[60].
    Figure 2.  Soil organic carbon (SOC) dynamics in the global carbon cycle.

    Katkar et al.[98] reported a higher soil quality index under conjunctive nutrient management strategies comprising addition of compost and green leaves along with mineral nutrients. Mazumdar et al.[99] investigated the impact of crop residue (CR), FYM, and leguminous green manure (GM) on SOC in continuous rice-wheat cropping sequence over a 25-year period. At the surface layer, the maximum SOC content was recorded under NPK + FYM than NPK + CR and NPK + GM treatments. SOC was significantly lower under sole application of INFs (NPK) than the mixed application of organic and inorganic treatments. A higher range of SOC content was recorded at a depth of 0.6 m in the rice-wheat system (1.8–6.2 g kg−1) in farmyard manure (FYM)-treated plots than 1.7–5.3 g kg−1 under NPK, and 0.9–3.0 g kg−1 in case of unfertilized plots[100]. In a research study Dutta et al.[101] reported that rice residue had a higher decomposition rate (k¼ 0.121 and 0.076 day−1) followed by wheat (0.073 and 0.042 day−1) and maize residues (0.041 day−1) when their respective residues placed on soil surface than incorporated in the soils. Naresh et al.[102] found FYM and dhaincha as GM/ sulphitation press mud (SPM) treatments are potent enough to enhance the SOC. Maximum SOC content was noted in 0–5 cm depth that reduced gradually along the profile. In surface soil, the total organic content (TOC) under different treatments varied with source used to supply a recommended dose of nitrogen (RDN) along with conventional fertilizer (CF).

    Cai et al.[103] ascertained that long-term manure application significantly improved SOC content in different size fractions which followed the sequence: 2,000–250 μm > 250–53 μm > 53 μm fraction. Naresh et al.[22] determined that mean SOC content increased from 0.54% in control to 0.65% in RDF and 0.82% in RDF + FYM treatment and improved enzyme activity; thus, ultimately influenced nutrient dynamics under field conditions. The treatments RDF + FYM and NPK resulted in 0.28 Mg C ha−1 yr−1 and 0.13 Mg C ha−1 yr−1, respectively and thus higher sequestration than control. Zhao et al.[104] determined that in the surface layer, significant increase in SOC content in each soil aggregate was noticed under straw incorporation treatments over no straw incorporated treatments (Fig. 3). Moreover, the aggregate associated OC was significantly higher in the surface layer than the sub-surface layer. The highest increment in aggregate-associated OC was noted in both maize and wheat straw (MR-WR) added plots followed by MR and least in WR. Besides, all of the three straw-incorporated treatments exhibited notable increase in SOC stock in each aggregate fraction in the surface layer of the soil. In the subsurface (20−40 cm) layer under MR-WR, significant rise in SOC stock of small macro-aggregates was observed, whereas there was a reduction in SOC stock in the silt + clay fraction than other treatments. The straw-incorporated treatments increased the quantity of mineral-associated organic matter (mSOM) and intra-aggregate particulate organic matter, (iPOM) within small macro-aggregates and micro-aggregates especially in the topmost layer of the soil.

    Figure 3.  Distribution of OC in coarse iPOM (intra-aggregate particulate organic matter) fine iPOM, mSOM (mineral-associated matter), and free LF (free light fraction) of small macro-aggregates and micro-aggregates in the 0–20 cm and 20–40 cm soil layers under MR-WR (return of both maize and wheat straw), MR (maize straw return), WR (wheat straw return). Different lowercase and uppercase letters indicate significant differences at p < 0.05 among treatments and depths respectively[104].

    Srinivasarao et al.[105] reported that SOC content was reduced with the addition of INFs (100% RDN) alone as compared to the conjunctive application of inorganic and organic or sole FYM treatments. Earlier, Srinivasarao et al.[106] reported that FYM treated plots exhibited greater per cent increase in SOC stock than mineral fertilized plots and control. Tong et al.[107] ascertained that the application of NP and NPK significantly improved SOC stocks. On the contrary, fertilized soils could also exhibit decrease in carbon content than control. Naresh et al.[108] determined that higher biomass C input significantly resulted in greater particulate organic carbon (POC) content. Zhang et al.[109] ascertained that long-term addition of NPK and animal manures significantly improved SOC stocks by a magnitude of 32%−87% whereas NPK and wheat/ and or maize straw incorporation enhanced the C stocks by 26%−38% than control. Kamp et al.[110] determined that continuous cultivation without fertilization decreased SOC content by 14% than uncultivated soil. However, super optimum dose of NPK, balanced NPK fertilization and integration of NPK with FYM not only improved SOC content but also SOC stocks over the first year. In conventionally tilled cotton-growing soils of southern USA, Franzluebbers et al.[111] estimated that carbon sequestration averaged 0.31 ± 0.19 Mg C ha−1 yr−1. Mandal et al.[112] reported maximum SOC stock in the surface layer of the soil (0–15 cm) which progressively diminished with depth in each land use system. A significant decrease in SOC stock along the profile depth was also observed by Dhaliwal et al.[47] in both croplands and agroforestry. In the topmost soil layer, highest SOC stock was recorded in rice–fallow system while the lowest was in the guava orchard[112].

    Nath et al.[113] determined that there was accrual of higher TOC in surface layers as compared to lower layers of soil under paddy cultivation. This accrual could be adduced to left-over crop residues and remnant root biomass which exhibited a decreasing trend with soil depth. Das et al.[114] determined that integrated use of fertilizers and organic sources resulted in greater TOC as compared to control or sole fertilizer application. Fang et al.[115] observed that the cumulative carbon mineralization differed with aggregate size in top soils of broad-leaved forests (BF) and coniferous forests (CF). However, in deep soil it was greater in macro-aggregates as compared to micro-aggregates in BF but not in CF (Fig. 4). By and large, the percent SOC mineralized was greater in macro-aggregates as compared to micro-aggregates. Dhaliwal et al.[100] ascertained that SOC accrual was considerably influenced by residue levels and tillage in surface soil (0−20 cm); albeit no variation was observed at lower depth (20−40 cm). The SOC content was greater in zero-tilled and permanently raised beds incorporated with residues as compared to puddled transplanted rice and conventionally planted wheat. Pandey et al.[116] reported that no-tillage prior to sowing of rice and wheat increased soil organic carbon by 0.6 Mg C ha–1 yr–1. The carbon sequestration rate on account of no-tillage or reduced tillage ranged between 0−2,114 kg ha–1 yr–1 in the predominant cropping system of South Asia, Xue et al.[117] observed that the long-term conventional tillage, by and large, exhibited a significant decline in SOC owing to degradation of soil structure, exposing protected soil organic matter (intra-soil aggregates) to microbes. Therefore, the adoption of no-tillage could hamper the loss of SOC thereby resulting in a greater or equivalent quantity of carbon in comparison to CT (Fig. 5).

    Figure 4.  (a) Soil aggregate fractions of two depths in two restored plantations of subtropical China, (b) organic carbon and (c) its mineralization from various soil aggregates within 71 d at various soil depths in two restored plantations of subtropical China. Error bars show the standard error of the mean. The different letters represent significant differences among the different soil aggregate fractions within a depth at p < 0.05[115].
    Figure 5.  The concentrations of (a) SOC, (b) total nitrogen (TN), and (c) soil C:N ratio for 0–50 cm profile under different tillage treatments in 2012 and 2013. NT = no-till with residue retention; RT = rotary tillage with residue incorporation; PT = plow tillage with residue incorporation; and PT0 = plow tillage with residue removed. The lowercase letters indicate statistical difference among treatments at p < 0.05[117].

    Singh et al.[118] determined that carbon stock in the 0-40 cm layer increased by 39, 35 and 19% in zero-tilled clay loam, loam, and sandy loam soils, respectively as compared to conventional tilled soils over a period of 15 years. Kuhn et al.[119] also apprised about the advantages of NT over CT vis-a-vis SOC stocks across soil depths. In the surface layer (0−20 cm) NT, by and large, resulted in higher SOC stocks as compared to CT; however, SOC stocks exhibited a declining trend with soil depth, in fact, became negative at depths lower than 20 cm. Sapkota et al.[120] observed that over a period of seven years, direct dry-seeded rice proceeded by wheat cultivation with residue retention enhanced SOC at 0-60 cm depth by a magnitude of 4.7 and 3.0 t C ha−1 in zero-tillage (ZTDSR-ZTW + R) and without tillage (PBDSR-PBW + R), respectively. On the contrary, the conventional tillage rice-wheat cropping system (CTR-CTW) decreased the SOC up to 0.9 t C ha−1 (Table 2).

    Table 2.  Influence of tillage and crop establishment methods on SOC stock and its temporal variation under rice–wheat system[120].
    Tillage and crop establishment methodsDepths (m)
    0–0.050.05–0.150.15–0.30.3–0.60–0.6
    Total SOC (t/ha)
    CTR-CTW3.5e7.1c8.77.026.2c
    CTR-ZTW3.9d7.6bc8.86.526.7c
    ZTDSR-CTW4.2d7.5bc9.26.327.3c
    ZTDSR-ZTW4.9c8.9ab8.26.228.2bc
    ZTDSR-ZTW+R6.1a9.0ab9.86.831.8a
    PBDSR-PBW+R5.5b9.3a9.36.030.1ab
    MSD0.41.72.01.42.49
    Treatment effect
    (p value)
    < 0.0010.040.1580.267< 0.001
    Initial SOC content3.6 ±
    0.15
    8.1 ±
    1.39
    8.78 ±
    1.07
    6.7 ±
    0.73
    27.1 ±
    1.21
    Change in SOC over seven years (t/ha)
    CTR-CTW−0.16−0.99−0.040.28−0.90
    CTR-ZTW0.28−0.500.01−0.20−0.41
    ZTDSR-CTW0.62−0.570.45−0.340.16
    ZTDSR-ZTW1.340.84−0.62−0.461.09
    ZTDSR-ZTW+R2.490.961.040.164.66
    PBDSR-PBW+R1.891.220.51−0.642.98
    CTR-CTW = Conventionally tilled puddled transplanted rice followed by conventionally tilled wheat, CTR-ZTW = Conventionally tilled puddled transplanted rice followed by zero-tilled wheat, ZTDSR-CTW = Zero-tilled direct dry-seeded rice followed by conventionally tilled wheat, ZTDSR-ZTW = Zero-tilled direct dry-seeded rice followed by zero-tilled wheat, ZTDSR-ZTW+R = Zero-tilled direct dry-seeded rice followed by zero-tilled wheat with residue retention, PBDSR-PBW+R = Direct dry-seeded rice followed by direct drilling of wheat both on permanent beds with residue retention, MSD, minimum significant difference. Significant different letters indicate significant differences at p < 0.05.
     | Show Table
    DownLoad: CSV

    Labile organic carbon (LC) is that fraction of SOC that is rapidly degraded by soil microbes, therefore, having the highest turnover rate. This fraction can turn over quickly on account of the change in land use and management strategies. From the crop production perspective, this fraction is crucial as it sustains the soil food cycle and, hence, considerably impacts nutrient cycling thereby altering soil quality and productivity. Short-term management could influence the labile fraction of carbon[121]. However, some site-specific problems and regional factors may influence their distribution in soil layers[102].

    Banger et al.[122] observed significant alteration in labile pools of C, for instance, particulate organic matter (POM), water-soluble C (WSC) and light fraction of C (LFC) because of the addition of fertilizers and/or FYM over a 16-year period. Particulate organic matter, LFC and WSC contributed 24%–35%, 12%–14% and 0.6%–0.8%, respectively, towards SOC. The increase in concentration of SOC including its pools like POC and the sequestration rate due to integrated nutrient management was also reported by Nayak et al.[123]. Gu et al.[124] observed that mulch-treated soils (straw and grass mulch) had significantly greater levels of LOC, POC, DOC and EOC as compared to no mulch-treated soils which could be adduced to the addition of straw, root and its sections into the soil. The content of labile C fractions across all treatments exhibited a decreasing trend with soil depth[23, 102, 125].

    In a long-term experiment, Anantha et al.[126] observed that the total organic carbon apportioned into labile carbon, non-labile, less labile, and very labile carbon constituted around 18.7%, 19.3%, 20.6% and 41.4% of the TOC, respectively (Table 3). Zhu et al.[20] determined that straw incorporation had a substantial impact on TOC and labile C fractions of the soil which were greater in straw incorporated treatments as compared to non-straw treatments across all the depths. Wang et al.[127] reported that the light fraction organic carbon (LFOC) and DOC were significantly greater in the straw-applied treatments than the control by a magnitude of 7%–129% for both the early and late season rice. The treatments NPK + FYM or NPK + GR + FYM resulted in greater content of very labile and labile C fractions whereas non-labile and less labile fractions were greater in control and NPK + CR treatment. There was 40.5% and 16.2% higher C build-up in sole FYM treated plots and 100% NPK + FYM, respectively over control. On the other hand, a net depletion of 1.2 and 1.8 Mg ha−1 in carbon stock was recorded under 50% NPK and control treatments, respectively. Out of the total C added through FYM, only 28.9% was stabilized as SOC, though an external supply of OM is a significant source of soil organic carbon[69]. Hence, to sustain the optimum SOC level at least an input of 2.3 Mg C ha−1 y−1 is required. A comparatively greater quantity of soil C in passive pools was observed in 100% NPK + FYM treatment. The increase in allocation of C into the passive pool was about 33%, 35%, 41% and 39% of TOC in control, suboptimal dose, optimal dose and super optimal dose of NPK which indicates that the concentration of passive pools increased with an increase in fertilization doses. Water-soluble carbon (WSC) was 5.48% greater in the upper soil layer as compared to lower layer of soil. In surface soil (0−15 cm), the values of light fraction carbon (LFC) were 81.3, 107.8, 155.2, 95.7, 128.8, 177.8 and 52.7 mg kg−1 in ZT without residue retention, ZT with 4 t ha−1 residue retention, ZT with 6 t ha−1 residue retention, FIRB without residue addition and FIRB with 4 and 6 t ha−1 residue addition and CT, respectively (Table 4). Tiwari et al.[128] determined that the decrease in POC was due to reduction in fine particulate organic matter in topsoil whereas decrement in dissolved organic carbon was observed largely in subsoil. Therefore, in surface soils fine POC and LFOC might be regarded as preliminary evidence of organic C alteration more precisely, while DOC could be considered as a useful indicator for subsoil. Reduction in allocations of fine POC, LFOC and DOC to SOC caused by tillage and straw management strategies indicated the decline in quality of SOC. A higher SOC concentration was recorded in the conjoint application of INF + FYM (0.82%) and sole application of INF (0.65%) than control (0.54%). Kumar et al.[83] reported that the CT without residue retention had significantly lower labile carbon fractions (27%–48%) than zero-tillage with 6-ton residue retention. Moreover, residue-retained fertilized treatments had significantly greater labile fractions of C than sole fertilized treatments[125]. Kumar et al.[83] reported highest change in DOC in zero-till with residue retention (28.2%) in comparison to conventional tillage practices. In ZT, absence of soil perturbations resulted in sustained supply of organic substrata for soil microbes which increases their activity. On the contrary, CT practices resulted in higher losses of C as CO2 due to frequent disturbances.

    Table 3.  Oxidisable organic carbon fractions in soils (g kg−1) at different layers[126].
    TreatmentDepths (cm)
    0−1515−3030−45Total
    Very Labile C
    Control3.6 ± 0.5c1.4 ± 0.3b1.3 ± 0.2a6.3 ± 0.4b
    50% NPK4.6 ± 0.3bc2.1 ± 0.7ab1.5 ± 0.1a8.1 ± 0.9a
    100% NPK4.4 ± 0.3bc2.3 ± 0.2a1.4 ± 0.5a8.0 ± 0.7a
    150% NPK5.0 ± 0.2ab2.6 ± 0.2a1.5 ± 0.1a9.0 ± 0.3a
    100% NPK + FYM4.8 ± 0.2ab2.0 ± 0.2ab1.3 ± 0.3a8.1 ± 0.2a
    FYM5.9 ± 1.3a2.2 ± 0.2a1.4 ± 0.3a9.5 ± 1.6a
    Fallow4.2 ± 0.7bc1.5 ± 0.5b0.7 ± 0.3b6.3 ± 0.8b
    Lbile C
    Control2.4 ± 0.3a1.0 ± 0.2a0.8 ± 0.4a4.2 ± 0.6a
    50% NPK1.7 ± 0.4ab0.9 ± 0.5a0.7 ± 0.2a3.3 ± 0.7a
    100% NPK1.8 ± 0.4ab0.8 ± 0.5a0.6 ± 0.3a3.2 ± 0.8a
    150% NPK1.2 ± 0.3b0.7 ± 0.2a0.9 ± 0.2a2.8 ± 0.4a
    100% NPK + FYM1.9 ± 0.3ab0.7 ± 0.2a0.7 ± 0.3a3.4 ± 0.2a
    FYM2.5 ± 0.9a0.7 ± 0.3a0.7 ± 0.2a3.9 ± 0.9a
    Fallow2.2 ± 1.0ab1.0 ± 0.3a1.0 ± 0.4a4.1 ± 1.1a
    Less labile C
    Control1.5 ± 0.3c0.6 ± 0.4c0.4 ± 0.0c2.6 ± 0.7d
    50% NPK1.8 ± 0.1c0.4 ± 0.1c0.5 ± 0.2c2.7 ± 0.1cd
    100% NPK2.5 ± 0.3ab0.8 ± 0.1bc1.1 ± 0.2ab4.4 ± 0.1b
    150% NPK2.6 ± 0.2a0.9 ± 0.1bc0.4 ± 0.2c3.9 ± 0.1b
    100% NPK + FYM2.7 ± 0.6a1.5 ± 0.2a1.4 ± 0.1a5.6 ± 0.7a
    FYM1.9 ± 0.7bc1.7 ± 0.2a1.0 ± 0.2b4.5 ± 0.7ab
    Fallow1.5 ± 0.3c1.3 ± 0.7ab0.9 ± 0.4b3.8 ± 1.2bc
    Non labile C
    Control1.2 ± 0.5b1.2 ± 0.3a0.2 ± 0.2b2.6 ± 0.5b
    50% NPK1.2 ± 0.9b1.7 ± 0.8a0.7 ± 0.4ab3.5 ± 1.8ab
    100% NPK1.3 ± 0.6b1.5 ± 0.6a0.5 ± 0.2ab3.3 ± 1.0ab
    150% NPK1.4 ± 0.3b1.5 ± 0.2a0.8 ± 0.1a3.7 ± 0.3ab
    100% NPK + FYM2.0 ± 0.8b1.3 ± 0.1a0.3 ± 0.3ab3.5 ± 0.7ab
    FYM3.7 ± 1.3a1.0 ± 0.2a0.5 ± 0.5ab5.1 ± 1.9a
    Fallow2.1 ± 0.2b1.4 ± 0.7a0.4 ± 0.2ab3.9 ± 0.9ab
    Values in the same column followed by different letters are significantly different at p < 0.001, ± indicates the standard deviation values of the means.
     | Show Table
    DownLoad: CSV
    Table 4.  Influence of tillage and nitrogen management on distribution of carbon fractions in soil[83].
    TreatmentsWSOC
    (g kg−1)
    SOC
    (g kg−1)
    OC
    (g kg−1)
    BC
    (g kg−1)
    POC
    (mg kg)
    PON
    (mg kg−1)
    LFOC
    (mg kg−1)
    LFON
    (mg kg−1)
    Depths (cm)
    0−1515−300−1515−300−1515−300−1515−300−1515−300−1515−300−1515−300−1515−30
    Tillage practices
    ZTR28.826.223.119.39.619.134.694.281342.8967.9119.5108.1194.7154.814.812.3
    ZTWR25.324.618.414.87.877.213.763.19981.1667.494.686.5120.5104.711.810.3
    RTR27.025.922.418.28.688.174.133.871230.2836.9109.797.8170.9144.913.711.6
    RTWR23.721.818.114.27.667.073.122.96869.4604.482.676.6107.197.39.78.6
    CTR26.124.421.817.48.497.963.823.481099.1779.498.489.3143.8115.912.810.9
    CT21.820.916.113.16.215.642.892.63617.5481.869.257.690.873.69.67.9
    Nitrogen management
    Control21.114.916.113.16.135.481.581.07709.7658.631.726.3123.9104.36.45.8
    80 kg N ha−128.321.217.814.76.466.162.461.75860.7785.668.456.2132.8116.17.66.9
    120 kg N ha−129.522.119.116.17.256.713.262.18952.2808.989.578.5150.6127.69.78.6
    160 kg N ha−130.223.120.818.27.757.283.822.661099.5823.896.883.4168.5145.710.29.8
    200 kg N ha−131.125.421.318.77.937.484.153.421153.1898.4103.997.3176.2152.911.710.6
    WSOC = Water soluble organic carbon, SOC = Total soil organic carbon, OC = Oxidizable organic carbon, BC =Black carbon, POC = particulate organic carbon, PON = particulate organic nitrogen, LFOC = labile fraction organic carbon, and LFON = labile fraction organic nitrogen. ZTR = Zero tillage with residue retention, ZTWR = Zero tillage without residue retention; RTR = Reduced tillage with residue retention, RTWR = Reduced tillage without residue retention, CTR = Conventional tillage with residue incorporation; CT = Conventional tillage without residue incorporation.
     | Show Table
    DownLoad: CSV

    The soil characteristics such as plant available nutrients, microbial diversity and soil organic carbon transformation are dwindling on account of intensive cultivation under conventional tillage practices, therefore, demand relevant management approaches for soil and crop sustainability. Long-term application of organic amendments significantly increases soil properties by increasing plant available macro, micro, secondary nutrients and soil organic C, whereas the increase in organic C by INF application is, by and large, due to increment in organic C content within macro-aggregates and in the silt + clay compartments. The soil organic carbon and other plant available nutrients were significantly greater in conservation tillage systems as compared to conventional tillage (CT) that conservation approaches could be an exemplary promoter of soil productivity by modifying soil structure thereby protecting SOM and maintaining higher nutrient content. The mean concentration of different fractions of carbon MBN, PMN and soil respiration under integrated nutrient management treatments was higher as compared with to control. Therefore, the conjoint use of organic manures or retention of crop residues with inorganic fertilizers is imperative to reduce the depletion of SOC while sustaining crop production as a realistic alternative. Future research should focus mainly on the usage of organic and mineral fertilizers in conjunction with conservation tillage approaches to sustain the soil environment.

    The authors confirm contribution to the paper as follows: study conception and design: Dhaliwal SS, Shukla AK, Randhawa MK, Behera SK; data collection: Sanddep S, Dhaliwal SS, Behera SK; analysis and interpretation of results: Dhaliwal SS, Gagandeep Kaur, Behera SK; draft manuscript preparation: Dhaliwal SS, walia, Shukla AK, Toor AS, Behera SK, Randhawa MK. All authors reviewed the results and approved the final version of the manuscript.

    Data sharing not applicable to this article as no datasets were generated or analyzed during the current study.

    The support rendered by the Departemnt of Soil Science, PAU, Ludhiana, RVSKVV, Gwailor, CSSRI, Karnal, IISS, Bhopal, School of Organic Farming, PAU Ludhiana and Washington State University, USA is fully acknowledged .

  • The authors declare that they have no conflict of interest.

  • [1]

    ITC. 2021. Annual Bulletin of Statistics 2021. https://inttea.com/publication/

    [2]

    Hicks A. 2001. Review of global tea production and the impact on industry of the Asian economic situation. AU Journal of Technology 5

    Google Scholar

    [3]

    Katsuno T, Kasuga H, Kusano Y, Yaguchi Y, Tomomura M, et al. 2014. Characterisation of odorant compounds and their biochemical formation in green tea with a low temperature storage process. Food Chemistry 148:388−95

    doi: 10.1016/j.foodchem.2013.10.069

    CrossRef   Google Scholar

    [4]

    Chen Z, Ruan J, Cai D, Zhang L. 2007. Tri-dimesion Pollution Chain in Tea Ecosystem and its Control. Scientia Agricultura Sinica 40:948−58

    Google Scholar

    [5]

    He H, Shi L, Yang G, You M, Vasseur L. 2020. Ecological risk assessment of soil heavy metals and pesticide residues in tea plantations. Agriculture 10:47

    doi: 10.3390/agriculture10020047

    CrossRef   Google Scholar

    [6]

    Jin C, He Y, Zhang K, Zhou G, Shi J, et al. 2005. Lead contamination in tea leaves and non-edaphic factors affecting it. Chemosphere 61:726−32

    doi: 10.1016/j.chemosphere.2005.03.053

    CrossRef   Google Scholar

    [7]

    Owuor PO, Obaga SO, Othieno CO. 1990. The effects of altitude on the chemical composition of black tea. Journal of the Science of Food and Agriculture 50:9−17

    doi: 10.1002/jsfa.2740500103

    CrossRef   Google Scholar

    [8]

    Garcia Londoño VA, Reynoso M, Resnik S. 2014. Polycyclic aromatic hydrocarbons (PAHs) in yerba mate (Ilex paraguariensis) from the Argentinean market. Food Additives & Contaminants: Part B 7:247−53

    doi: 10.1080/19393210.2014.919963

    CrossRef   Google Scholar

    [9]

    Ishizaki A, Saito K, Hanioka N, Narimatsu S, Kataoka H. 2010. Determination of polycyclic aromatic hydrocarbons in food samples by automated on-line in-tube solid-phase microextraction coupled with high-performance liquid chromatography-fluorescence detection. Journal of Chromatography A 1217:5555−63

    doi: 10.1016/j.chroma.2010.06.068

    CrossRef   Google Scholar

    [10]

    Phan Thi LA, Ngoc NT, Quynh NT, Thanh NV, Kim TT, et al. 2020. Polycyclic aromatic hydrocarbons (PAHs) in dry tea leaves and tea infusions in Vietnam: contamination levels and dietary risk assessment. Environmental Geochemistry and Health 42:2853−63

    doi: 10.1007/s10653-020-00524-3

    CrossRef   Google Scholar

    [11]

    Zelinkova Z, Wenzl T. 2015. The occurrence of 16 EPA PAHs in food – A review. Polycyclic aromatic compounds 35:248−84

    doi: 10.1080/10406638.2014.918550

    CrossRef   Google Scholar

    [12]

    Omodara NB, Olabemiwo OM, Adedosu TA . 2019. Comparison of PAHs formed in firewood and charcoal smoked stock and cat fish. American Journal of Food Science and Technology 7:86−93

    doi: 10.12691/ajfst-7-3-3

    CrossRef   Google Scholar

    [13]

    Zou LY, Zhang W, Atkiston S. 2003. The characterisation of polycyclic aromatic hydrocarbons emissions from burning of different firewood species in Australia. Environmental Pollution 124:283−89

    doi: 10.1016/S0269-7491(02)00460-8

    CrossRef   Google Scholar

    [14]

    Charles GD, Bartels MJ, Zacharewski TR, Gollapudi BB, Freshour NL, et al. 2000. Activity of benzo [a] pyrene and its hydroxylated metabolites in an estrogen receptor-α reporter gene assay. Toxicological Sciences 55:320−26

    doi: 10.1093/toxsci/55.2.320

    CrossRef   Google Scholar

    [15]

    Han Y, Chen Y, Ahmad S, Feng Y, Zhang F, et al. 2018. High time- and size-resolved measurements of PM and chemical composition from coal combustion: implications for the EC formation process. Environmental Science & Technology 52:6676−85

    doi: 10.1021/acs.est.7b05786

    CrossRef   Google Scholar

    [16]

    Khiadani (Hajian) M, Amin MM, Beik FM, Ebrahimi A, Farhadkhani M, et al. 2013. Determination of polycyclic aromatic hydrocarbons concentration in eight brands of black tea which are used more in Iran. International Journal of Environmental Health Engineering 2:40

    doi: 10.4103/2277-9183.122427

    CrossRef   Google Scholar

    [17]

    Fitzpatrick EM, Ross AB, Bates J, Andrews G, Jones JM, et al. 2007. Emission of oxygenated species from the combustion of pine wood and its relation to soot formation. Process Safety and Environmental Protection 85:430−40

    doi: 10.1205/psep07020

    CrossRef   Google Scholar

    [18]

    Shen G, Tao S, Wang W, Yang Y, Ding J, et al. 2011. Emission of oxygenated polycyclic aromatic hydrocarbons from indoor solid fuel combustion. Environmental Science & Technology 45:3459−65

    doi: 10.1021/es104364t

    CrossRef   Google Scholar

    [19]

    International Agency for Research on Cancer (IARC), World Health Organization. 2014. Diesel and gasoline engine exhausts and some nitroarenes. International Agency for Research on Cancer Monographs on the Evaluation of Carcinogenic Risks to Humans. Report. 105:9

    [20]

    de Oliveira Galvão MF, de Oliveira Alves N, Ferreira PA, Caumo S, de Castro Vasconcellos P, et al. 2018. Biomass burning particles in the Brazilian Amazon region: Mutagenic effects of nitro and oxy-PAHs and assessment of health risks. Environmental Pollution 233:960−70

    doi: 10.1016/j.envpol.2017.09.068

    CrossRef   Google Scholar

    [21]

    Wang X, Zhou L, Luo F, Zhang X, Sun H, et al. 2018. 9,10-Anthraquinone deposit in tea plantation might be one of the reasons for contamination in tea. Food Chemistry 244:254−59

    doi: 10.1016/j.foodchem.2017.09.123

    CrossRef   Google Scholar

    [22]

    Anggraini T, Neswati, Nanda RF, Syukri D. 2020. Identification of 9,10-anthraquinone contamination during black and green tea processing in Indonesia. Food Chemistry 327:127092

    doi: 10.1016/j.foodchem.2020.127092

    CrossRef   Google Scholar

    [23]

    Zamora R, Hidalgo FJ. 2021. Formation of naphthoquinones and anthraquinones by carbonyl-hydroquinone/benzoquinone reactions: A potential route for the origin of 9,10-anthraquinone in tea. Food Chemistry 354:129530

    doi: 10.1016/j.foodchem.2021.129530

    CrossRef   Google Scholar

    [24]

    Yang M, Luo F, Zhang X, Wang X, Sun H, et al. 2022. Uptake, translocation, and metabolism of anthracene in tea plants. Science of the Total Environment 821:152905

    doi: 10.1016/j.scitotenv.2021.152905

    CrossRef   Google Scholar

    [25]

    Zastrow L, Schwind K-H, Schwägele F, Speer K. 2019. Influence of smoking and barbecuing on the contents of anthraquinone (ATQ) and polycyclic aromatic hydrocarbons (PAHs) in Frankfurter-type sausages. Journal of Agricultural and Food Chemistry 67:13998−4004

    doi: 10.1021/acs.jafc.9b03316

    CrossRef   Google Scholar

    [26]

    Fouillaud M, Caro Y, Venkatachalam M, Grondin I, Dufossé L. 2018. Anthraquinones. In Phenolic Compounds in Food : Characterization and Analysis, eds. Leo ML.Vol. 9. Boca Raton: CRC Press. pp. 130−70 https://hal.univ-reunion.fr/hal-01657104

    [27]

    Piñeiro-Iglesias M, López-Mahı́a P, Muniategui-Lorenzo S, Prada-Rodrı́guez D, Querol X, et al. 2003. A new method for the simultaneous determination of PAH and metals in samples of atmospheric particulate matter. Atmospheric Environment 37:4171−75

    doi: 10.1016/S1352-2310(03)00523-5

    CrossRef   Google Scholar

  • Cite this article

    Yu J, Zhou L, Wang X, Yang M, Sun H, et al. 2022. 9,10-Anthraquinone contamination in tea processing using coal as heat source . Beverage Plant Research 2: 8 doi: 10.48130/BPR-2022-0008
    Yu J, Zhou L, Wang X, Yang M, Sun H, et al. 2022. 9,10-Anthraquinone contamination in tea processing using coal as heat source . Beverage Plant Research 2: 8 doi: 10.48130/BPR-2022-0008

Figures(5)  /  Tables(3)

Article Metrics

Article views(6190) PDF downloads(1122)

ARTICLE   Open Access    

9,10-Anthraquinone contamination in tea processing using coal as heat source

Beverage Plant Research  2 Article number: 8  (2022)  |  Cite this article

Abstract: 9,10-Anthraquinone (AQ) is a contaminant with a potential carcinogenic risk and occurs in tea worldwide. The maximum residue limit (MRL) of AQ in tea set by the European Union (EU) is 0.02 mg/kg. The possible sources of AQ in tea processing and the main stages of its occurrence were investigated based on a modified AQ analytical method and gas chromatography-tandem mass spectrometry (GC-MS/MS) analysis. Compared with electricity as the heat source in green tea processing, AQ increased by 4.3 to 23.9 times in tea processing with coal as the heat source, far exceeding 0.02 mg/kg, while the AQ level in the environment tripled. The same trend was observed in oolong tea processing under coal heat. The steps with direct contact between tea leaves and fumes, such as fixation and drying, are considered as the main steps of AQ production in tea processing. The levels of AQ increased with the rising contact time, suggesting that high levels of AQ pollutant in tea may be derived from the fumes caused by coal and combustion. Fourty samples from different workshops with electricity or coal as heat sources were analyzed, ranged from 50.0%−85.0% and 5.0%−35.0% for detection and exceed rates of AQ. In addition, the maximum AQ content of 0.064 mg/kg was observed in the tea product with coal as the heat source, indicating that the high levels of AQ contamination in tea products are likely to be contributed by coal.

    • Tea manufactured from leaves of the evergreen shrub Camellia sinensis (L.) O. Kuntze, is one of the most globally popular beverages due to its refreshing taste and health benefits. In 2020 globally, tea production had increased to 5,972 million metric tons, which was a doubling in the past 20 years[1]. Based on different ways of processing, there are six main types of tea, including green tea, black tea, dark tea, oolong tea, white tea and yellow tea[2,3]. To ensure the quality and safety of products, it is very important to monitor the levels of pollutants and define the origin.

      Identifying the sources of contaminants, such as pesticide residues, heavy metals and other pollutants such as polycyclic aromatic hydrocarbons (PAHs), is the primary step to control pollution. Direct spraying of synthetic chemicals in tea plantations, as well as air drift caused by operations near tea gardens, are the main source of pesticide residues in tea[4]. Heavy metals can accumulate in tea and lead to toxicity, which are mainly derived from soil, fertilizer and atmosphere[57]. As for other pollution appearing unexpectedly in tea, it was quite difficult to identify due to the complex procedures of the production tea chain including plantation, processing, package, storage and transportation. The PAHs in tea came from the deposition of vehicle exhausts and the combustion of fuels used during the processing of tea leaves, such as firewood and coal[810].

      During the coal and firewood combustion, pollutants such as carbon oxides are formed[11]. As a result, it is susceptible for residues of these above-mentioned pollutants to occur in the processed products, such as grain, smoked stock and cat fish, at high temperature, posing a threat to human health[12,13]. The PAHs caused by combustion are derived from the volatilization of PAHs contained in the fuels itself, the high-temperature decomposition of aromatic compounds and the compound reaction between free radicals[14]. Combustion temperature, time, and oxygen content are important factors that affect the conversion of PAHs. With the increase of temperature, the PAHs content first increased and then decreased, and the peak value occurred at 800 °C; The PAHs content decreased sharply to trace with increasing combustion time when it was below a limit called 'boundary time', with the increase of oxygen content in the combustion air, PAHs emissions reduced significantly, but incomplete oxidation would produce OPAHs and other derivatives[1517].

      9,10-Anthraquinone (AQ, CAS: 84-65-1, Fig. 1), an oxygen-containing derivative of PAHs[18], consists of three condensed cycles. It was listed as a possible carcinogen (Group 2B) by the International Agency for Research on Cancer in 2014[19]. AQ can poison to topoisomerase II cleavage complex and inhibit the hydrolysis of adenosine triphosphate (ATP) by DNA topoisomerase II, causing DNA double-strand breaks, which means that long-term exposure under AQ-containing environment and direct contact with high level of AQ can lead to DNA damage, mutation and increase the risk of cancer[20]. As negative effects on human health, the AQ maximum residue limit (MRL) of 0.02 mg/kg was set in tea by the European Union. According to our previous studies, the deposits of AQ were suggested as the main source during tea plantation[21]. Also, based on the experimental consequences in Indonesian green and black tea processing, it is obvious that the AQ level changed significantly and the smoke from processing equipment was suggested as one of main reasons[22]. However, the accurate origin of AQ in tea processing remained elusive, although some hypotheses of AQ chemical pathway were suggested[23,24], indicating that it is extremely important to determine the crucial factors affecting the AQ level in tea processing.
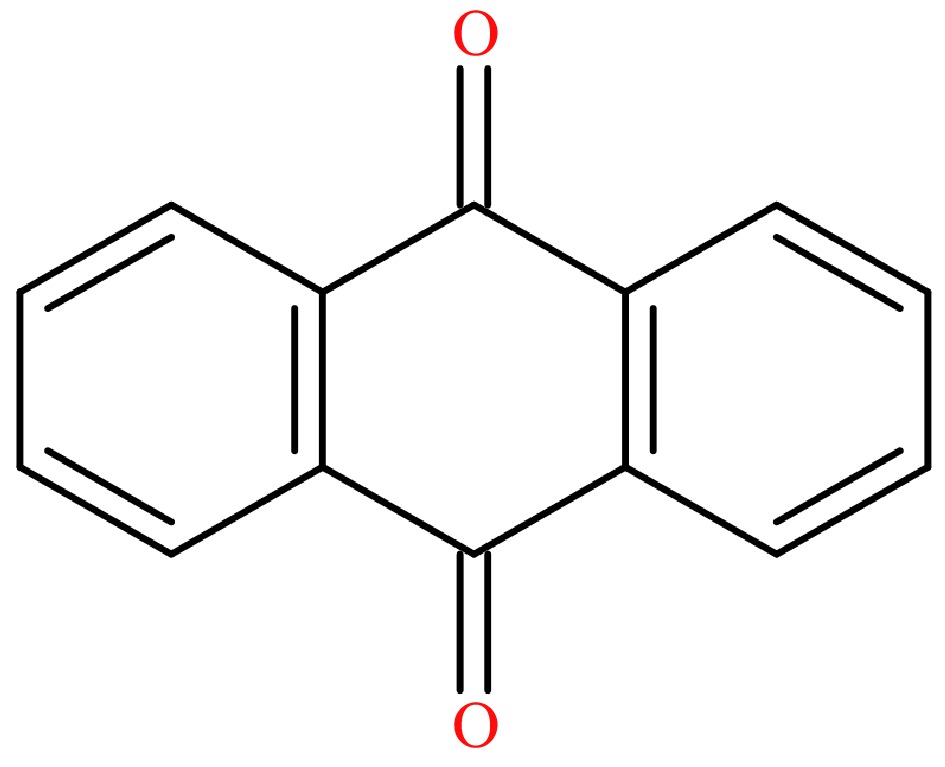
      Figure 1. 

      The chemical formula of AQ.

      Given the research on the formation of AQ during coal combustion and the potential menace of fuels in tea processing, a comparative experiment was carried out to explain the effect of processing heat sources on AQ in tea and air, quantitative analysis on the changes of AQ content at different processing steps, which is helpful to confirm the accurate origin, occurrence pattern and degree of AQ pollution in tea processing.

    • Compared with our previous study[21], a liquid-liquid extraction procedure was combined before injection to GC-MS/MS in order to improve sensitivity and maintain instrumental statements. In Fig 2b, the improved method showed a significant improvement in the purification of the sample, the solvent became lighter in color. In Fig 2a, a full scan spectrum (50−350 m/z) illustrated that after purification, the base line of the MS spectrum reduced obviously and the fewer chromatographic peaks were available, indicating that a large number of interfering compounds were removed after the liquid-liquid extraction.
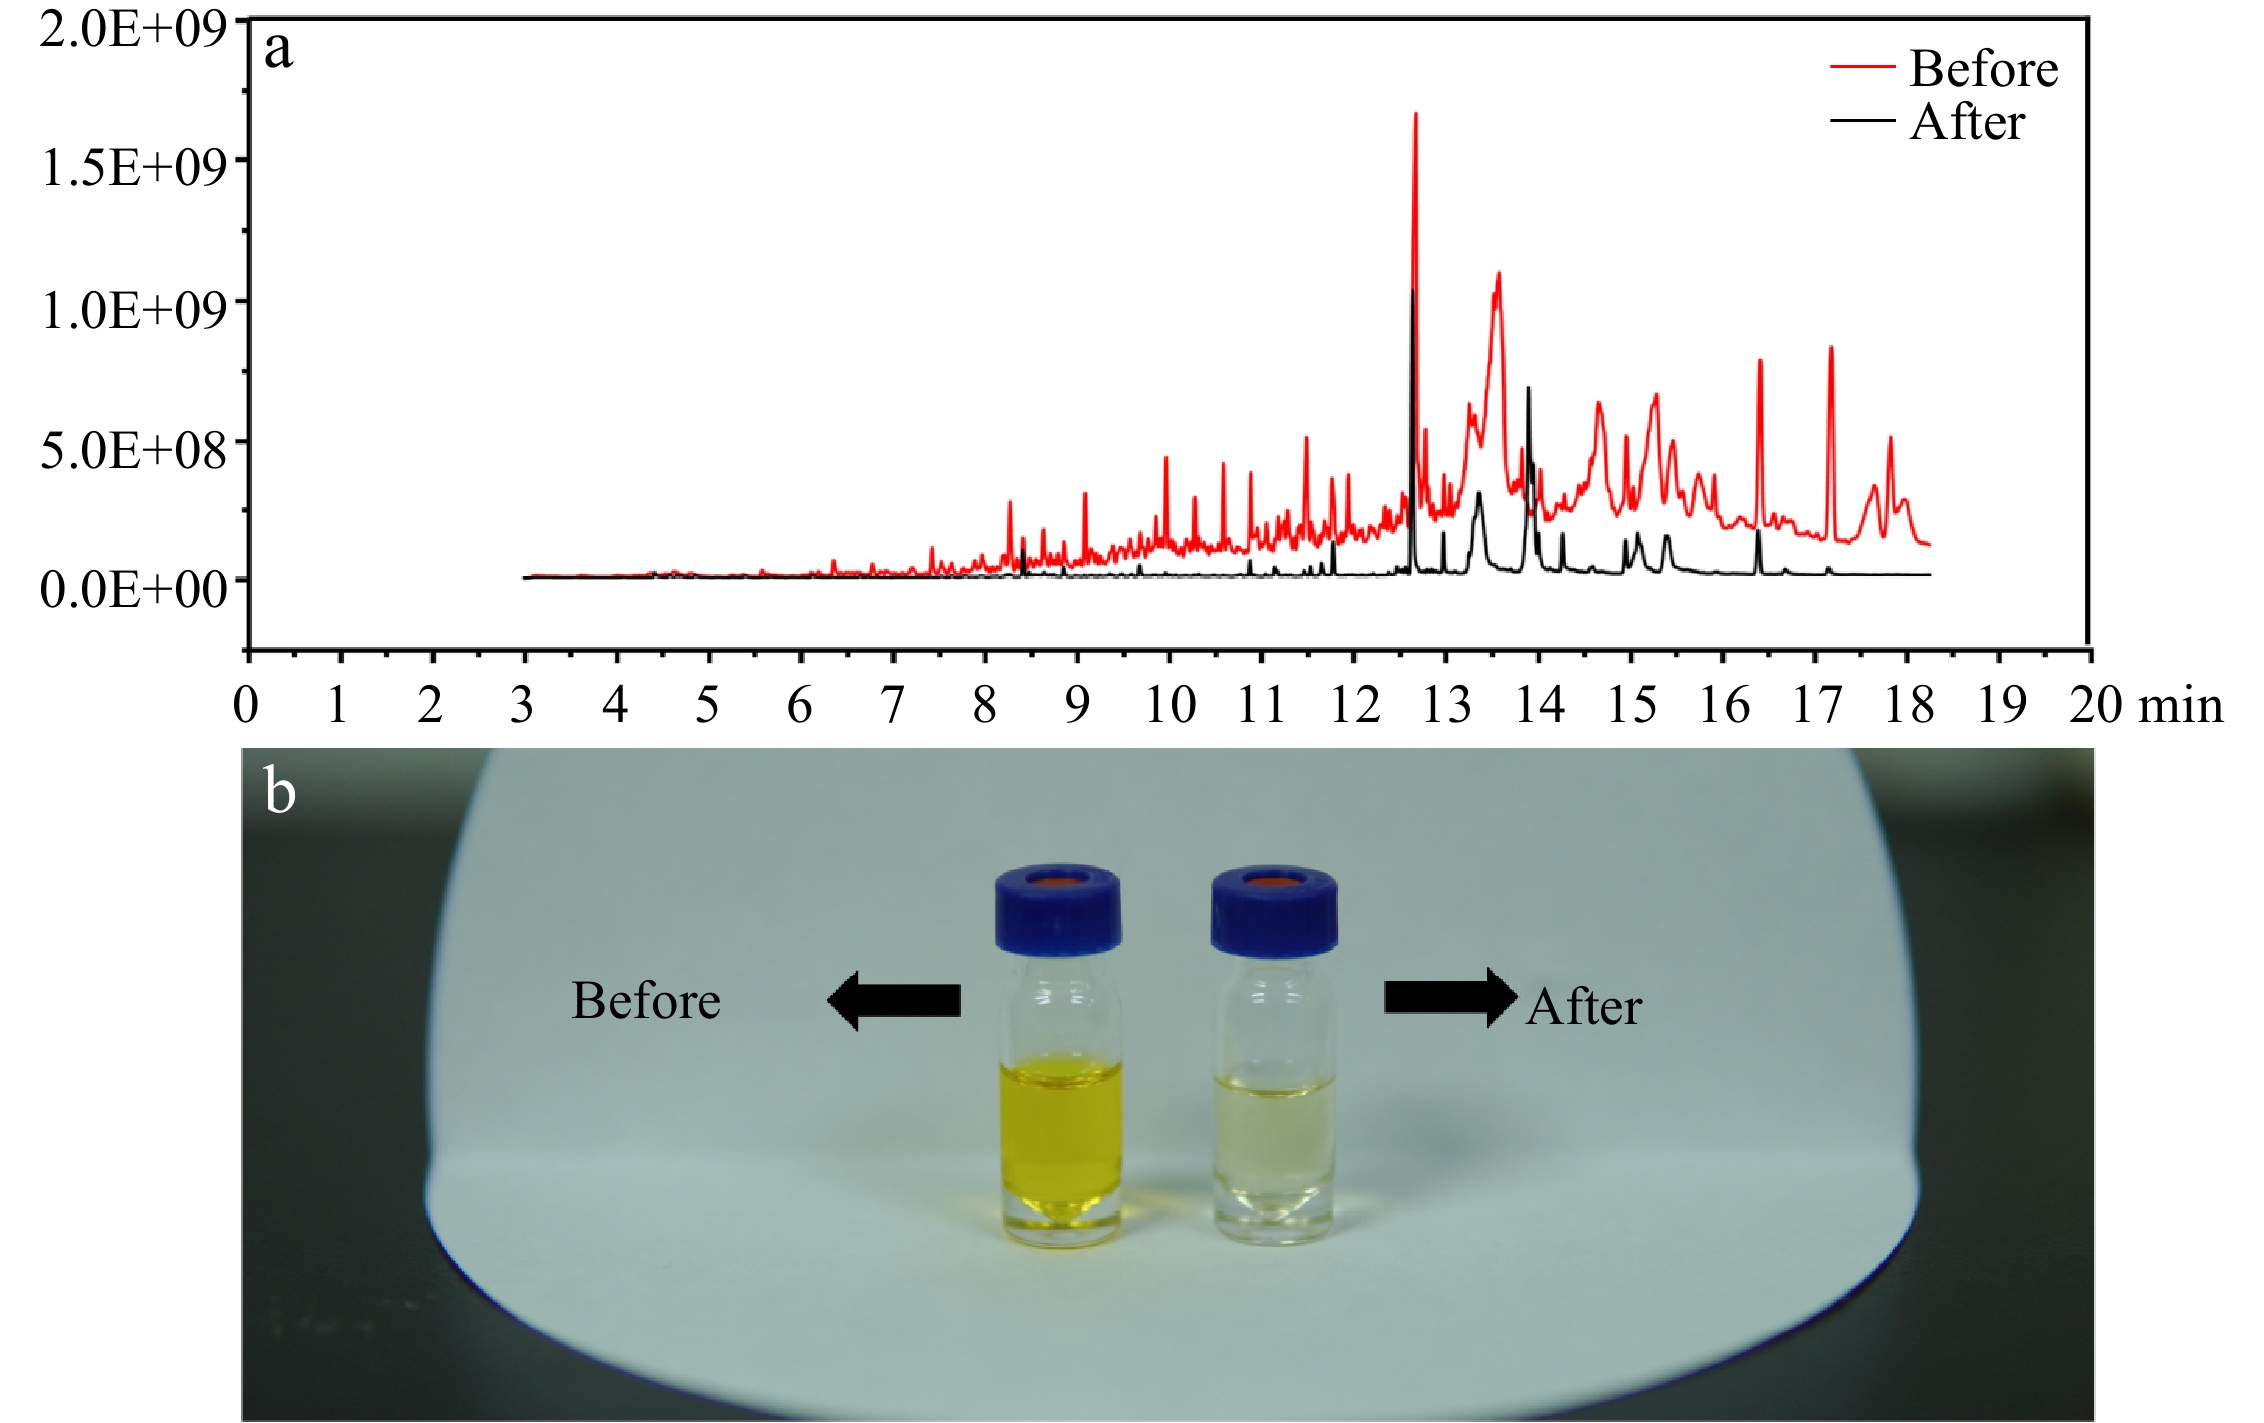
      Figure 2. 

      (a) Full scan spectrum of the sample before and after the purification. (b) The purification effect of the improved method.

      Method validation, including linearity, recovery, limit of quantitation (LOQ) and matrix effect (ME), are shown in Table 1. It is satisfactory to obtain the linearity with the coefficient of determination (r2) higher than 0.998, which ranged from 0.005 to 0.2 mg/kg in the tea matrix and acetonitrile solvent, and in the air sample with a range of 0.5 to 8 μg/m3.

      Table 1.  Validated parameters of AQ in spiked samples.

      MartrixFortified level
      (mg/kg)
      Recovery
      (%, SD)
      RSD
      n = 5
      LOQ
      (mg/kg)
      r2 (range g/L)ME (%)
      Tea shoots0.005125.7 ± 8.66.90.0050.999 (5−200)10.9
      0.0196.5 ± 5.75.9
      0.0287.4 ± 6.47.3
      Dry tea0.00577.8 ± 9.712.50.0050.998 (5−200)9.0
      0.02113.0 ± 3.23.6
      0.005107.6 ± 1.41.5
      Air sample0.5a117.06 ± 9.410.80.5a0.999 (0.5−8)196.1
      1.578.47 ± 4.05.1
      3.0105.07 ± 14.814.1
      a: µg/m3

      Recovery of AQ was evaluated at three spiked concentrations between measured and actual concentrations in dry tea (0.005, 0.02, 0.05 mg/kg), fresh tea shoots (0.005, 0.01, 0.02 mg/kg) and air sample (0.5, 1.5, 3 μg/m3). Recovery of AQ in tea ranged from 77.78% to 113.02% in dry tea and from 96.52% to 125.69% in tea shoots, with RSD% lower than 15%. Recovery of AQ in air samples ranged from 78.47% to 117.06% with RSD% below 20%. The lowest spiked concentration was identified as LOQ, which were 0.005 mg/kg, 0.005 mg/kg and 0.5 μg/m³ in tea shoots, dry tea and air samples, respectively. As listed in Table 1, the matrix of dry tea and tea shoots slightly increased the AQ response, leading to the ME of 109.0% and 110.9%. As for the matrix of air samples, the ME was 196.1%.

    • With the aim of finding out the effects of different heat sources on tea and processing environment, a batch of fresh leaves were divided into two specific groups and processed separately in two processing workshops in the same enterprise. One group was supplied with electricity, and the other with coal.

      As shown in Fig. 3, the AQ level with electricity as the heat source ranged from 0.008 to 0.013 mg/kg. During the fixation process, the parching of tea leaves caused by processing in a pot with high temperature resulted in a 9.5% increase in AQ. Then, the level of AQ remained during the rolling process despite the loss of juice, suggesting that physical processes may not affect the level of AQ in tea processing. After the first drying steps, AQ level increased slightly from 0.010 to 0.012 mg/kg, then continued to rise to 0.013 mg/kg until the end of re-drying. PFs, which significantly showed the variation in each step, were 1.10, 1.03, 1.24, 1.08 in fixation, rolling, first drying and re-drying, respectively. The results of PFs suggested that processing under electrical energy had a slight effect on the levels of AQ in tea.
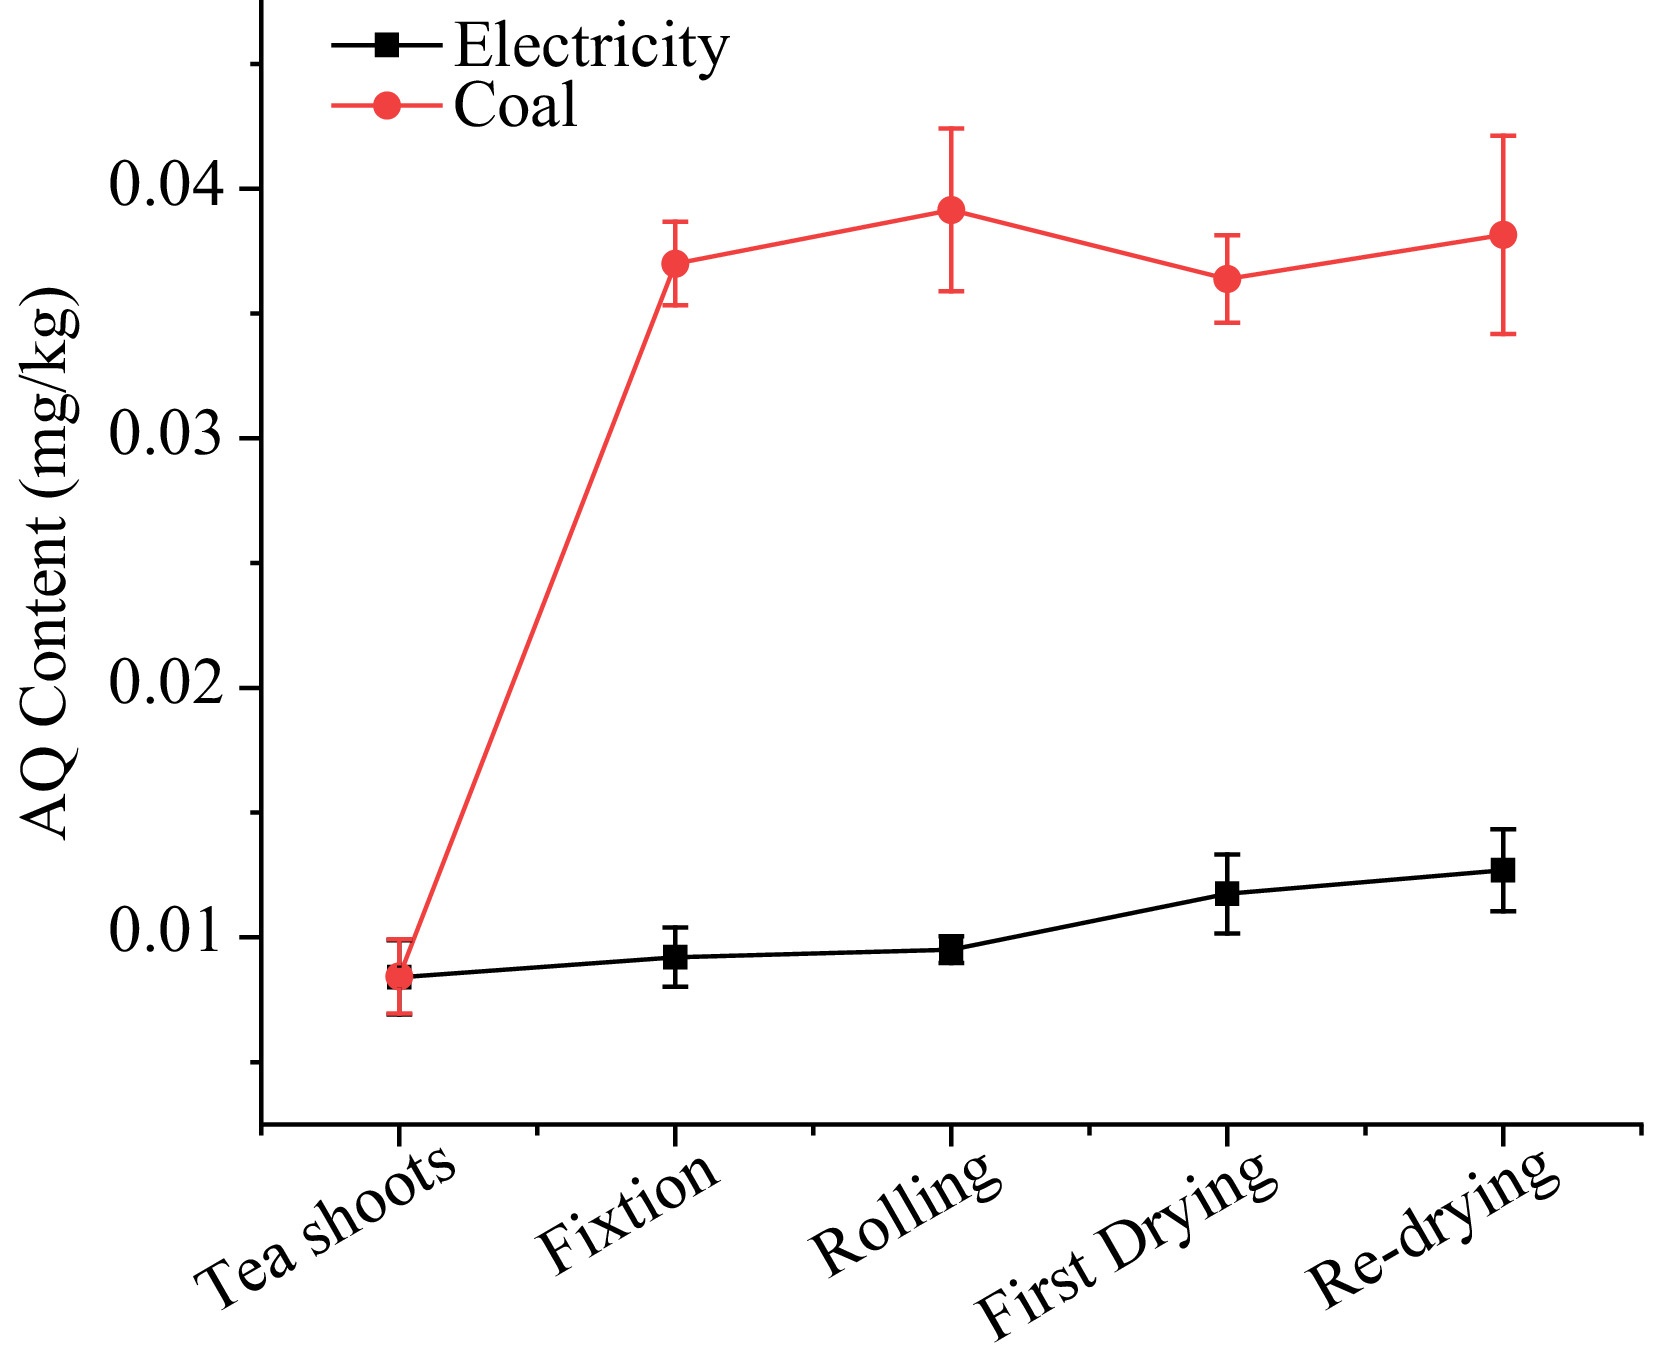
      Figure 3. 

      The AQ level during green tea processing with electricity and coal as heat sources.

      In the case of coal as the heat source, the AQ content sharply increased during the tea processing, surging from 0.008 to 0.038 mg/kg. 338.9% AQ were increased in the fixation procedure, reaching 0.037 mg/kg, which far exceeded the MRL of 0.02 mg/kg set by the European Union. During the rolling stage, the level of AQ still increased by 5.8% despite being far from the fixation machine. In first drying and re-drying, the AQ content increased little or decreased slightly. The PFs using coal as the heat source in fixation, rolling first drying and re-drying were 4.39, 1.05, 0.93, and 1.05, respectively.

      To further determine the relationship between the coal combustion and AQ pollution, the suspended particulate matters (PMs) in air in the workshops under both heat sources were collected for air assessment, as shown in Fig. 4. The AQ level of PMs with coal as the heat source was 2.98 μg/m3, which was over three times higher than that with electricity 0.91 μg/m3.
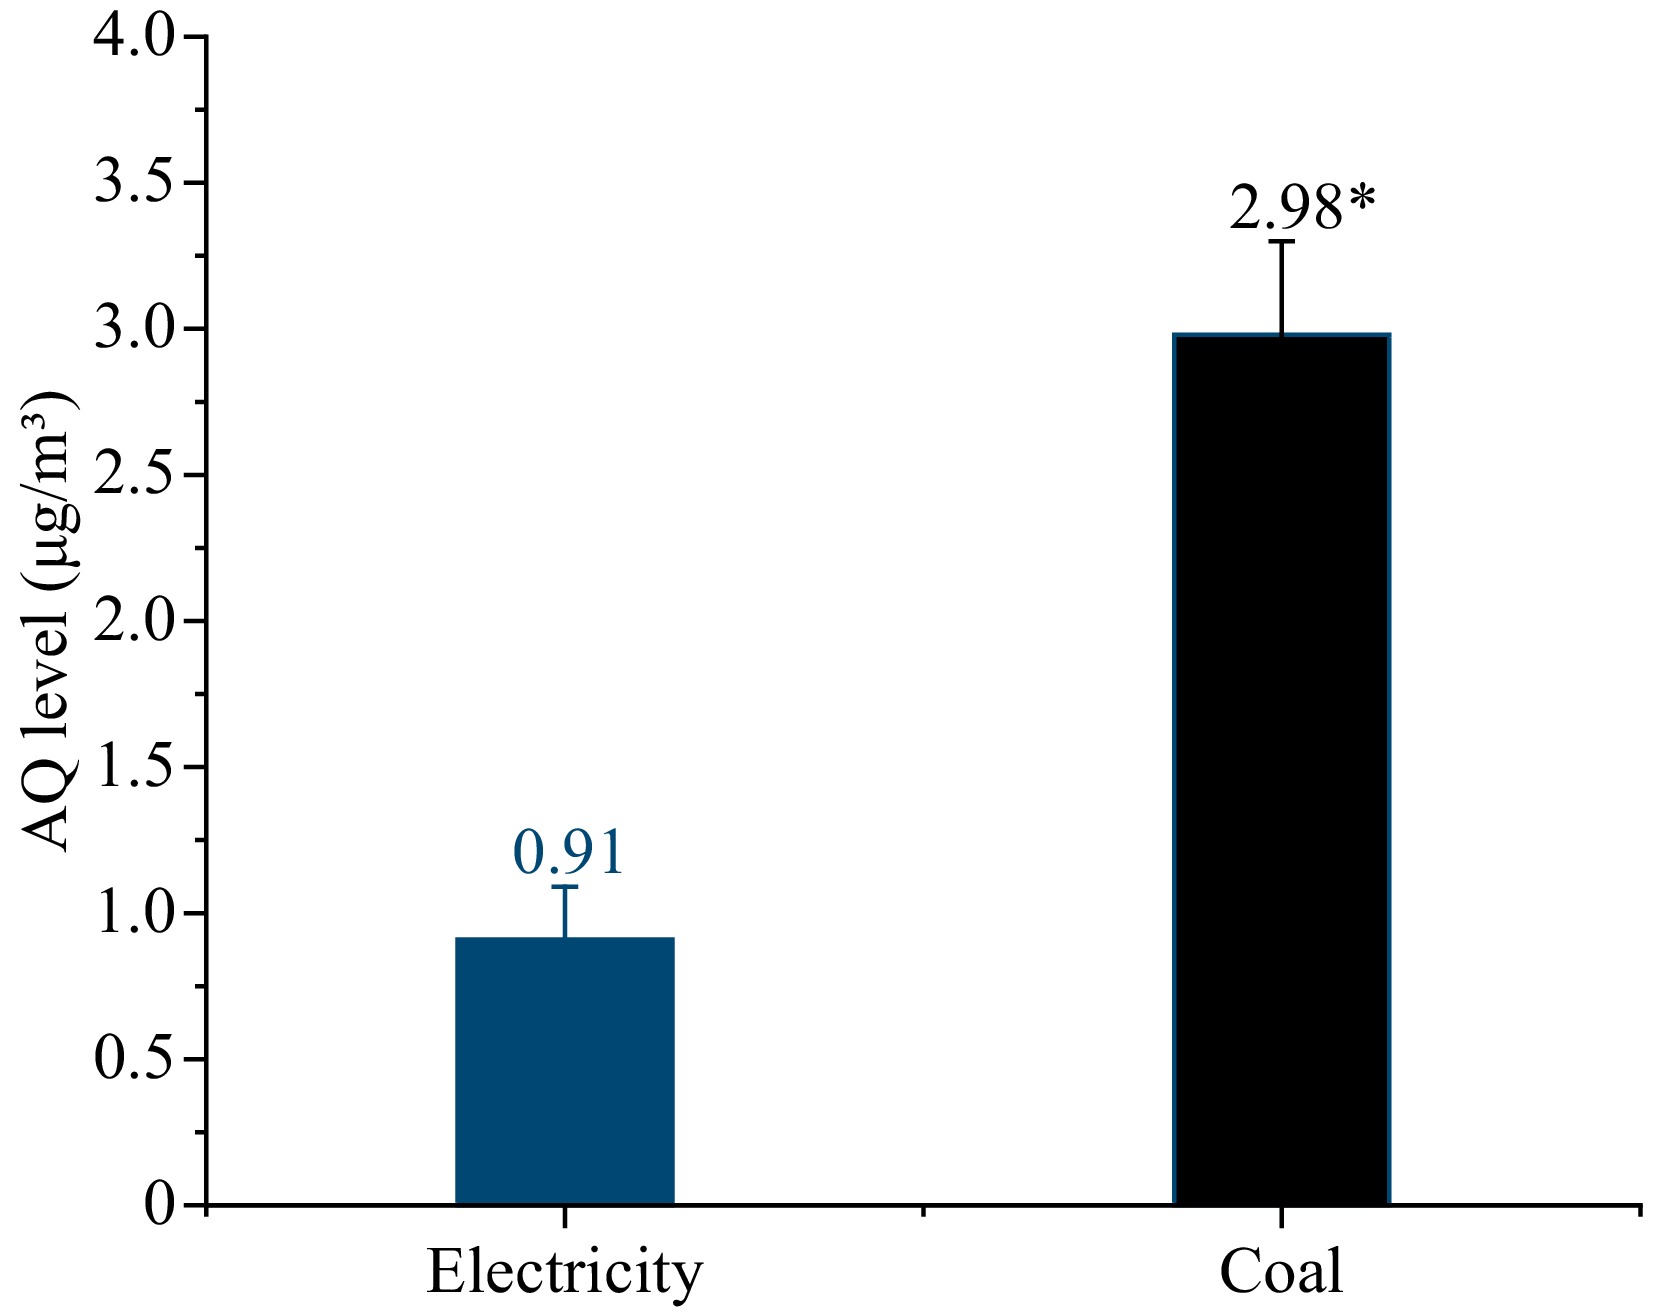
      Figure 4. 

      The levels of AQ in the environment with electricity and coal as heat source. * Indicates significant differences in AQ levels in the samples (p < 0.05).

    • Oolong tea, mainly produced in Fujian and Taiwan, is a kind of partially fermented tea. To further determine the main steps of increasing AQ level and the effects of different fuels, the same batch of fresh leaves was made into oolong tea with coal and natural gas-electric hybrid as heat sources, simultaneously. The AQ levels in oolong tea processing using different heat sources are shown in Fig. 5. For oolong tea processing with natural gas-electric hybrid, the trend of AQ level was stagnating below 0.005 mg/kg, which was similar to that in green tea with electricity.
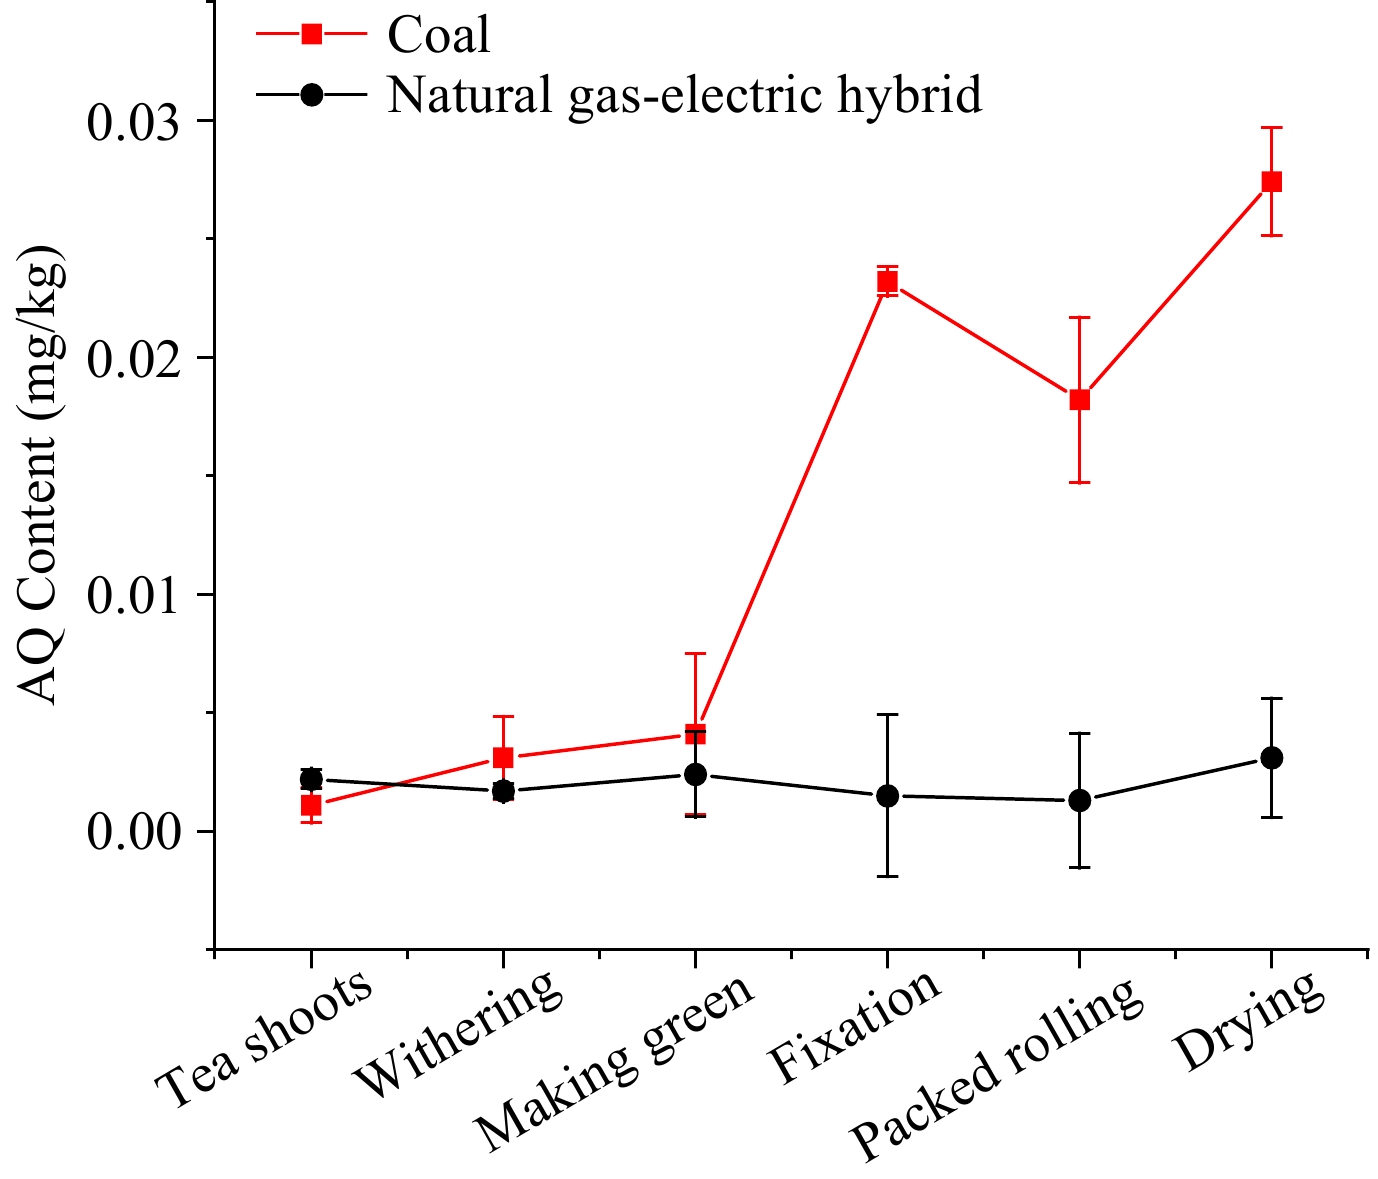
      Figure 5. 

      The AQ level during oolong tea processing with natural gas-electric blend and coal as heat source.

      With coal as the heat source, the AQ levels in the first two steps, withering and making green, were essentially the same as with natural gas-electric blend. However, the subsequent procedures until fixation showed the gap widened gradually, at which point the AQ level surged from 0.004 to 0.023 mg/kg. The level in the packed rolling step decreased to 0.018 mg/kg, which may be due to the loss of tea juice carrying away some of AQ contaminants. After the rolling stage, the level in the drying stage increased to 0.027 mg/kg. In withering, making green, fixation, packed rolling and drying, the PFs were 2.81, 1.32, 5.66, 0.78, and 1.50, respectively.

    • To determine the effects on AQ content of tea with different heat sources, 40 tea samples from the tea workshops using electricity or coal as heat sources were analyzed, as shown in Table 2. Compared with using electricity as a heat source, coal had the most detective rates (85.0%) with the maximum AQ level of 0.064 mg/kg, indicating that it was easy to cause AQ contaminant by fumes produced by coal combustion, and a rate of 35.0% was observed in samples of coal. Most conspicuously, electricity had the lowest detective and excedance rates of 56.4% and 7.7% respectively, with the maximum content of 0.020 mg/kg.

      Table 2.  The occurrence for AQ in tea products with different heat sources.

      Total samples
      analyzed
      Number of detective
      samples
      Rates of
      detection (%)
      Number of samples
      exceeded MRL
      Rates of
      exceedance (%)
      Min
      (mg/kg)
      Max
      (mg/kg)
      Electricity201050.015.0ND0.020
      Coal201785.0735.0ND0.064
    • Based on the PFs during processing with the two kinds of heat sources, it was clear that fixation was the main step that led to the increase of AQ levels in tea production with coal and processing under electrical energy had a slight effect on the content of AQ in tea. During green tea processing, coal combustion produced a lot of fumes in the fixation process compared with the electric heating process, indicating that maybe fumes were the main source of AQ pollutants from contact with tea shoots instantly in tea processing, similar to the exposure process in the smoked barbecue samples[25]. The slightly increase in AQ content during the rolling stage suggested that the fumes caused by coal combustion not only affected the AQ level during the fixation step, but also in the processing environment due to atmospheric deposition. Coals were also used as the heat source in the first drying and re-drying, but in these two steps the AQ content increased slightly or decreased slightly. This may be explained by the fact that the enclosed hot-wind dryer kept tea away from fumes caused by coal combustion[26]. In order to determine the pollutant source, the AQ levels in the atmosphere were analyzed, resulting in a significant gap between the two workshops. The main reason for this is that the coal used in the fixation, first drying and re-drying stages would generate AQ during incomplete combustion. These AQ were then adsorbed in the small particles of solids after coal combustion and dispersed in the air, elevating the levels of AQ pollution in the workshop environment[15]. Over time, due to the large specific surface area and adsorption capacity of tea, these particulates then settled on the surface of the tea leaves, resulting in the increase of AQ in production. Therefore, coal combustion was thought to be the main route leading to excessive AQ contamination in tea processing, with fumes being the source of pollution.

      As for oolong tea processing, AQ were increased under processing with both heat sources, but the difference between the two heat sources was significant. The results also suggested that coal as a heat source played a major role in increasing AQ level, and the fixation was deemed as the main step for increasing AQ contamination in oolong tea processing based on the PFs. During the oolong tea processing with natural gas-electric hybrid as a heat source, the trend of AQ level was stagnating below 0.005 mg/kg, which was similar to that in green tea with electricity, suggesting that clean energy, such as electricity and natural gas, can decrease the risk of producing AQ contaminants from processing.

      As for sampling tests, the results showed that the situation of AQ contaminantion was worse when using coal as a heat source rather than electricity, which could be due to the fumes from combustion of coal coming into contact with tea leaves and lingering around the workplace. However, though it was obvious that electricity was the cleanest heat source during tea processing, there were still AQ contaminant in tea products using electricity as the heat source. The situation seems slightly similar to previously published work in which the reaction of 2- alkenals with hydroquinones and benzoquinones was suggested as a potential chemical pathway[23], reasons for this will be investigated in future research.

    • In this work, the possible sources of AQ pollution in green and oolong tea were confirmed by comparative experiments based on improved GC-MS/MS analytical methods. Our findings directly supported that the main pollutant source of high levels of AQ was fume caused by combustion, which not only affected the processing stages but also affected workshop environments. Unlike in the rolling and withering stages, where the changes in the level of AQ were inconspicuous, the stages with direct involvement of coal and firewood, such as fixation, are the main process in which AQ contamination rose due to the amount of contact between tea and fumes during these stages. Therefore, clean fuels such as natural gas and electricity were recommended as the heat source in tea processing. Additionally, the experimental results also showed that in the absence of fumes generated by combustion, there were still other factors contributing to trace AQ during tea processing, while small amounts of AQ were also observed in the workshop with clean fuels, which should be further investigated in future research.

    • Anthraquinone standard (99.0%) was purchased from Dr. Ehrenstorfer GmbH Company (Augsburg, Germany). D8-Anthraquinone internal standard (98.6%) was purchased from C/D/N Isotopes (Quebec, Canada). Anhydrous sodium sulfate (Na2SO4) and magnesium sulfate (MgSO4) (Shanghai, China). Florisil was supplied by Wenzhou Organic Chemical Company (Wenzhou, China). Mircro-glass fiber paper (90 mm) was purchased from Ahlstrom-munksjö company (Helsinki, Finland).

    • The green tea samples were processed with fixation, rolling, first drying and re-drying (using enclosed equipment), while the oolong tea samples were processed with withering, making green (rocking and standing fresh leaves alternately), fixation, packed rolling, and drying. Samples from each step were collected three times at 100g after thorough mixing. All the samples were stored at −20 °C for further analysis.

      Air samples were collected by glass fiber paper (90 mm) using medium volume samplers (PTS-100, Qingdao Laoshan Electronic Instrument Company, Qingdao, China)[27], running at 100 L/min for 4 h.

      Fortified samples were spiked with AQ at 0.005 mg/kg, 0.010 mg/kg, 0.020 mg/kg for fresh tea shoots, at 0.005 mg/kg, 0.020 mg/kg, 0.050 mg/kg for dry tea and at 0.012 mg/kg (0.5 µg/m3 for air sample), 0.036 mg/kg (1.5 µg/m3 for air smaple), 0.072 mg/kg (3.0 µg/m3 for air sample) for glass filter paper, respectively. After shaking thoroughly, all the samples were left for 12 h, followed by extraction and clean-up steps.

      The moisture content was obtained by taking 20 g of the sample after mixing each step, heating at 105 °C for 1 h, then weighing and repeating three times and taking the average value and dividing it by the weight prior to heating.

    • Tea sample: The extraction and purification of AQ from tea samples was performed based on the published method from Wang et al. with several adaptations[21]. Briefly, 1.5 g of tea samples were first mixed with 30 μL D8-AQ (2 mg/kg) and left to stand for 30 min, then well mixed with 1.5 mL deionized water and left to stand for 30 min. 15 mL 20% acetone in n-hexane was added to the tea samples and sonicated for 15 min. Then the samples were vortexed with 1.0 g MgSO4 for 30 s, and centrifuged for 5 min, at 11,000 rpm. After being moved to 100 mL pear-shaped flasks, 10 mL of the upper organic phase was evaporated to almost dryness under vacuum at 37 °C. 5 mL 2.5% acetone in n-hexane re-dissolved the extract in pear-shaped flasks for purification. The glass column (10 cm × 0.8 cm) consisted from bottom to top of glass wool and 2g florisil, which was between two layers of 2 cm Na2SO4. Then 5 mL of 2.5% acetone in n-hexane prewashed the column. After loading the redissolved solution, AQ was eluted three times with 5 mL, 10 mL, 10 mL of 2.5% acetone in n-hexane. The combined eluates were transferred to pear-shaped flasks and evaporated to almost dryness under vacuum at 37 °C. The dried residue was then reconstituted with 1 mL of 2.5% acetone in hexane followed by filtration through a 0.22 µm pore size filter. Then the reconstituted solution was mixed with acetonitrile at a volume ratio of 1:1. Following the shaking step, the subnatant was used for GC-MS/MS analysis.

      Air sample: Half of the fiber paper, dripped with 18 μL d8-AQ (2 mg/kg), was immersed in 15 mL of 20% acetone in n-hexane, then sonicated for 15 min. The organic phase was separated by centrifugation at 11,000 rpm for 5 min and the entire upper layer was removed in a pear-shaped flask. All organic phases were evaporated to almost dryness under vacuum at 37 °C. 5 mL of 2.5% acetone in hexane redissolved the extracts for purification in the same way as in the tea samples.

    • Varian 450 gas chromatograph equipped with Varian 300 tandem mass detector (Varian, Walnut Creek, CA, USA) was used to perform AQ analysis with MS WorkStation version 6.9.3 software. Varian Factor Four capillary column VF-5ms (30 m × 0.25 mm × 0.25 μm) was used for chromatographic separation. The carrier gas, helium (> 99.999%), was set at a constant flow rate of 1.0 mL/min with collision gas of Argon (> 99.999%). The oven temperature started from 80 °C and held for 1 min; increased at 15 °C/min to 240 °C, then reached 260 °C at 20 °C/min and held for 5min. The temperature of the ion source was 210 °C, as well as the transfer line temperature of 280 °C. The injection volume was 1.0 μL. The MRM conditions are shown in Table 3.

      Table 3.  MRM conditions of 9,10-anthraquinone and D8-anthraquinone.

      EquipmentCompoundTR (min)Parent ion (m/z)Daughter ion (m/z)Collision energy
      Vairan 450GC-300MS9,10-anthraquinone13.0220815222
      18010
      D8-anthraquinone12.9921616020
      18810
      Agilent 8890GC-7000DMS9,10-anthraquinone12.1520815230
      18010
      D8-anthraquinone12.1921616030
      18810

      Agilent 8890 gas chromatograph equipped with Agilent 7000D triple quadrupole mass spectrometer (Agilent, Stevens Creek, CA, USA) was used to analyze the purification effect with MassHunter version 10.1 software. Agilent J&W HP-5ms GC Column (30 m × 0.25 mm × 0.25 μm) was used for chromatographic separation. The carrier gas, Helium (> 99.999%), was set at a constant flow rate of 2.25 mL/min with collision gas of Nitrogen (> 99.999%). The temperature of EI ion source was adjusted at 280 °C, the same as the transfer line temperature. The oven temperature started from 80 °C and was held for 5 min; raised by 15 °C/min to 240 °C, then reached 280 °C at 25 °C/min and maintained for 5 min. The MRM conditions are shown in Table 3.

    • The AQ content in fresh leaves was corrected to dry matter content by dividing by moisture content in order to compare and analyze AQ levels during processing.

      The changes of AQ in tea samples were evaluated with Microsoft Excel software and IBM SPSS Statistics 20.

      Processing factor was used to describe the changes in AQ during tea processing. PF = Rl/Rf , where Rf is the AQ level before the processing step and Rl is the AQ level after the processing step. PF indicates a decrease (PF < 1) or an increase (PF > 1) in AQ residual during a specific processing step.

      ME indicates a decrease (ME < 1) or an increase (ME > 1) in response to the analytical instruments, which is based on the ratio of slopes of calibration in the matrix and solvent as follows:

      ME = (slopematrix/slopesolvent − 1) × 100%

      Where slopematrix is the slope of calibration curve in matrix-matched solvent, slopesolvent is the slope of calibration curve in solvent.

      • This work was supported by Science and Technology Major Project in Zhejiang Province (2015C12001) and National Science Foundation of China (42007354).

      • The authors declare that they have no conflict of interest.

      • # Authors contributed equally: Jiawei Yu, Li Zhou

      • Copyright: © 2022 by the author(s). Published by Maximum Academic Press, Fayetteville, GA. This article is an open access article distributed under Creative Commons Attribution License (CC BY 4.0), visit https://creativecommons.org/licenses/by/4.0/.
    Figure (5)  Table (3) References (27)
  • About this article
    Cite this article
    Yu J, Zhou L, Wang X, Yang M, Sun H, et al. 2022. 9,10-Anthraquinone contamination in tea processing using coal as heat source . Beverage Plant Research 2: 8 doi: 10.48130/BPR-2022-0008
    Yu J, Zhou L, Wang X, Yang M, Sun H, et al. 2022. 9,10-Anthraquinone contamination in tea processing using coal as heat source . Beverage Plant Research 2: 8 doi: 10.48130/BPR-2022-0008

Catalog

  • About this article

/

DownLoad:  Full-Size Img  PowerPoint
Return
Return