REVIEW   Open Access    

Purine alkaloids in tea plants: component, biosynthetic mechanism and genetic variation

More Information
  • The purine alkaloids, including caffeine, theobromine, and theacrine, are one of the most important quality and functional components of tea plants and commercial teas. In this paper, we review the component, biosynthetic mechanism and genetic variation of purine alkaloids in tea plants. The content of caffeine and theobromine in 403 accessions Chinese tea germplasms core collection preserved in the National Germplasm Hangzhou Tea Repository were analyzed using High Performance Liquid Chromatography (HPLC). The purine alkaloid profiles of different tea varieties, germplasm types, geographical origin, seasons, were highlighted. Some naturally low caffeine or caffeine-free, high theobromine or high theacrine germplasms were identified and the possible biosynthetic mechanism of hypernormal purine alkaloid content in tea plants were partially revealed. Some Cleaved Amplified Polymorphic Sequences (CAPS) DNA markers were developed for the identification of purine alkaloid content. The potential application of genetic engineering and DNA markers developed based on the low caffeine TCS1 (tea caffeine synthesis gene) alleles for marker assisted selection (MAS), and cocoa tea and kucha in low caffeine/high theacrine tea cultivar breeding programs were also reviewed.
  • Agricultural management practices impact soil physicochemical properties to a remarkable extent. Degradation of soil health has led to a contraction in agricultural production and soil biodiversity particularly due to conventional farming practices, indiscriminate use of inorganic fertilizers (INF) and inadequate input of residues[1]. Organic or inorganic fertilizers have been regarded as a critical component of agriculture to accomplish global food security goals[2]. The exogenous supply of fertilizers could easily alter soil properties by restoring the nutrients that have been absorbed by the plants[2]. Thus, implementing adequate nutrient management strategies could boost plant yield and sustain plant health. Tillage affects the soil, especially for crop production and consequently affects the agro-ecosystem functions. This involves the mechanical manipulation of the soil to modify soil attributes like soil water retention, evapotranspiration, and infiltration processes for better crop production. Thus, tillage practices coupled with fertilizer inputs may prove a viable strategy to improve soil health components such as nutrient status, biodiversity, and organic carbon.

    Soil serves as a major reservoir of nutrients for sustainable crop production. Intensive cultivation due to growing population burden has led to the decline of soil nutrient status that has adversely affected agricultural production. Various researchers have assessed the soil nutrient budget and the reasons behind decline of nutrient content in soil[3]. Soil management strategies have assisted in overcoming this problem to a greater extent. Tillage practices redistribute soil fertility and improve plant available nutrient content due to soil perturbations[4]. Different tillage and fertilization practices alter soil nutrient cycling over time[5]. Fertilization is an important agricultural practice which is known to increase nutrient availability in soil as well as plants[6]. A report has been compiled by Srivastava et al.[7], which assessed the effectiveness of different fertilizers on soil nutrient status in Indian soils.

    Soil biota has a vital role in the self-regulating functions of the soil to maintain soil quality which might reduce the reliance on anthropogenic activities. Soil microbial activities are sensitive to slight modifications in soil properties and could be used as an index of soil health[8]. Maintenance of microbial activity is essential for soil resilience as they influence a diverse range of parameters and activities including soil structure formation, soil SOM degradation, bio-geochemical cycling of nutrients etc.[9]. Various researchers have identified microbial parameters like microbial biomass carbon (MBC), potentially mineralizable nitrogen (PMN), soil respiration, microbial biomass nitrogen (MBN), and earthworm population as potential predictors of soil quality. Geisseler & Scow[10] have compiled a review on the affirmative influence of long-term mineral fertilization on the soil microbial community.

    Being the largest terrestrial carbon (C) reservoir, soil organic carbon (SOC) plays a significant role in agricultural productivity, soil quality, and climate change mitigation[11]. Manure addition, either solely or along with INF augments SOC content which helps in the maintenance and restoration of SOM more effectively as compared to the addition of INF alone[12]. Enhancement of recalcitrant and labile pools of SOC could be obtained through long-term manure application accentuating the necessity of continuous organic amendments for building up C and maintaining its stability[13]. Generally, compared with manure addition, INF application is relatively less capable of raising SOC and its labile fractions[14]. Alteration in SOC content because of management strategies and/or degradation or restoring processes is more prominent in the labile fraction of soil C[15]. Several fractions of soil C play vital roles in food web and nutrient cycles in soils besides influencing many biological properties of soil[16]. Thus, monitoring the response of SOC and its fractions to various management practices is of utmost importance.

    A positive impact on SOC under manure application coupled with INF in rice-wheat systems has been reported, as compared to sole applications of INFs[17]. Although ploughing and other mechanical disturbances in intensive farming cause rapid OM breakdown and SOC loss[18], additional carbon input into the soil through manure addition and rational fertilization increases carbon content[13]. Wei et al.[19] in light sandy loam soil of China found that the inclusion of crop straw together with inorganic N, P and K fertilizers showed better results for improving soil fertility over sole use of inorganic fertilizers. Zhu et al.[20] studied the influence of soil C through wheat straw, farmyard manure (FYM), green manure, and rice straw on plant growth, yield, and various soil properties and found that the recycling of SOM under intensive cultivation is completely reliant on net OM input and biomass inclusion. However, most of the studies on residue management and organically managed systems could not provide clear views regarding the relations between the quality of OM inputs and biological responses towards it. The disintegration of soil aggregates due to ploughing, use of heavy machinery, and residue removal has been reported widely under conventional tillage (CT) practices[21]. On the contrary, improvement in SOC stabilization has also been observed by some scientists[22]. Under CT, the disintegration of macro-aggregates into micro-aggregates is a prominent phenomenon, while conservation tillage has been identified as a useful practice for increasing macro-aggregates as well as carbon sequestration in agricultural soils[23]. By and large, the ploughing depth (0–20 cm) is taken into consideration for evaluating the impact of tillage and straw retention on soil aggregation[24], while degradation in deeper layers of soil is becoming a major constraint towards soil quality together with crop yield[25].

    Hence, the present review would be useful in determining how tillage practices and inorganic and organic fertilization impact nutrient availability in the soil, microbial composition and SOC fractions besides stocks under different land uses.

    Agricultural production is greatly influenced by nutrient availability and thus nutrient management is required for sustaining higher yields of crop. The term 'nutrient availability' refers to the quantity of nutrients in chemical forms accessible to plant roots or compounds likely to be converted to such forms throughout the growing season in lieu of the total amount of nutrients in the soil. For optimum growth, different crops require specifically designed nutrient ratios. Plants need macronutrients [nitrogen (N), phosphorus (P), potassium (K) in higher concentrations], secondary nutrients [calcium (Ca), magnesium (Mg), sulphur (S) in moderate amounts as compared to macronutrients] and Micronutrients [Zn (zinc), Fe (iron), Cu (copper), B (boron), Mn (manganese), Mo (molybdenum) in smaller amounts] for sustainable growth and production[26]. Fertilizers assist the monitoring of soil nutrient levels by direct addition of required nutrients into the soil through different sources and tillage practices may alter the concentration of available plant nutrients through soil perturbations. Various studies on the influence of fertilization and tillage practices on available plant nutrients have been discussed below.

    Yue et al.[27] reported that long-term fertilization through manure/INF improved the macronutrient content of Ultisol soil in China. Two doses of NPK (2NPK) considerably improved soil properties over a single dose (NPK). Combined application (NPK + OM) resulted in higher hydrolysable N and available P over the sole OM application. The total K content was higher under the treatments NPK, 2NPK and NPK + OM than sole OM treatment, whereas available K was higher in treatments NPK + OM and 2NPK over the sole OM and NPK. Likewise, OM, INF, and OM + INF were evaluated for their potential to regulate the soil macronutrient dynamics. Organic manure significantly improved the soil N content, whereas INF showed comparable results to that of the control treatment. Besides, all the treatments improved available P and exchangeable K concentration[28].

    Hasnain et al.[29] performed comparative studies of different ratios of INF + compost and different application times for the chemical N fertilizer on silty loamy soils of China. The available nitrogen and phosphorous content were greater in conjoint OM + INF application over the bare INF and control application irrespective of N application time. Soil quality substantially improved with increasing ratio of compost and 70:30 (INF to compost ratio) was found to be most suitable to maintain soil fertility and nutrient status. Another study by Liu et al.[30] reported the superior effects of NPK + pig manure and NPK + straw to improve soil available P and K over the control and sole NPK treatments. However, total N concentration did not exhibit any significant variation under any treatment.

    Shang et al.[31] accounted the positive impact of vermicompost and mushroom residue application on grassland soil fertility in China. The addition of organic manures improved available P and K content to a considerable extent. Under moisture-deficit winter wheat-fallow rotation, another study quantified the influence of residue management approaches and fertilizer rate on nutrient accrual. Residue burning resulted in no decline in soil macronutrient content, whereas the perpetual addition of FYM for 84 years significantly improved total N and extractable K and P concentration. Thus, residue incorporation along with FYM application may prove beneficial in reducing the temporal macronutrient decline[32].

    Ge et al.[33] examined the effects of NPK and NPK along with manure (NPKM) addition on the macronutrient status of Hapli-Udic Cambisol soil. The NPKM application resulted in the highest increase in total N, available-P and K concentration as compared to NPK and control. Likewise, mineral fertilization reduction and partial substitution with organic amendments have posed a significant influence on soil macronutrient status. Soil available P and K decreased after INF reduction[34]. Chen et al.[35] evinced that integrated application of manure and mineral fertilizers to red clay soil (typical Ultisols) improved hydrolyzed nitrogen and available P due to an increase in the decomposition of organic matter (OM) and N bio-fixation than sole mineral fertilizers and control.

    A long-term experiment was carried out out by Shiwakoti et al.[36] to ascertain the influence of N fertilization and tillage on macronutrient dynamics in soil. Nitrogen fertilization produced higher crop biomass which might have improved total N and P concentration in soil. Moreover, the reduced interaction between soil colloids and residue or greater cation exchange sites due to tillage practices could have augmented K concentration in 0−10 cm soil depth. Likewise, among tillage systems combined organic (poultry manure) and inorganic (lime and fertilizers) fertilization, no-tillage, and reduced tillage with organic fertilization resulted in higher availability of P owing to minimal disturbance of soil which decreases contact surface between phosphate ions and adsorption sites. Greater losses of K in runoff water under NT resulted in lower K availability under NT than CT[37].

    The influence of tillage systems on soil nutrient dynamics showed that minimal soil disturbances under zero tillage prohibited redistribution of soil nutrients and resulted in the highest available N, P, and K in the surface soil[38]. The influence of tillage timing on soil macronutrient status has also been assessed under tillage treatments that are fall tillage (FT), spring tillage (ST), no tillage (NT), and disk/chisel tillage (DT/CT) on mixed mesic Typic Haploxerolls soil. All the tillage systems differed in the quantity of residues generated. Thus, variation in the decomposition of crop residue and mineralization of SOM resulted in variable rates of nutrient release. The FT and ST had the highest N content over DT/CT and NT systems at corresponding depth. The N content also decreased with soil depth irrespective of tillage treatment. The available P and extractable K were highest under NT at the top 10 cm soil depth and increased over time[39]. Residue management in combination with tillage treatments (ST and CT) has been reported to affect the soil macronutrient status in Bangladesh. Tillage treatments enhanced the total N content to a considerable extent. Moreover, 3 years of residue retention led to a higher concentration of total N, available P and K in the soil.

    The combinations of N, P, and K in different ratios together with two rates of organic fertilizer (OF) applied on the aquic Inceptisol having sandy loam texture influenced the micronutrient status of the soil[40]. Soil Zn content decreased with time when no fertilizer was applied as compared to organic fertilizer (OF) application. The mineral fertilizer treatments led to a substantial increase in DTPA-extractable micronutrients in the soil. The higher micronutrient concentration due to higher OM highlights the importance of maintaining OM for soil fertility and higher crop production. Further studies revealed that long-term application of sole N fertilizers led to a significant decline in total Zn and Cu, whereas Mn and Fe status improved through atmospheric deposition. Phosphorus and OF addition along with straw incorporation markedly increased total Zn, Cu, Fe, and Mn. The DTPA-extractable Mn, Zn, Fe, and Cu were also higher in OF treatment, thus demonstrating the beneficial effects of constant OM application for maintaining the nutrient status of soil[41].

    López-Fando & Pardo[42] quantified the impact of various tillage practices including NT, CT, minimum tillage (MT), and zone-tillage (ZT) on soil micronutrient stocks. Tillage systems did exhibit a significant influence on plant available Fe stocks in the topsoil; however, diminished with depth under ZT, NT and MT. Manganese was higher in NT and ZT at all depths and increased with soil depth. Zinc was highest under NT and other results did not vary significantly as in the case of Cu. The SOC levels were also found to be responsible to affect micronutrients due to tillage practices. Likewise, in Calciortidic Haploxeralf soil the distribution of soil micronutrients (Zn, Mn, Fe, Cu) was ascertained under different tillage practices (CT, MT, and NT). The micronutrient status was highest under NT in the upper layers due to the higher SOC level[43].

    Sharma & Dhaliwal[44] determined that the combined application of nitrogen and rice residues facilitated the transformation of micronutrients (Zn, Mn, Fe, Cu). Among different fractions, the predominant fractions were crystalline Fe bound in Zn, Mn, and Cu and amorphous Fe oxide in Fe with 120 kg N ha˗1 and 7.5-ton rice residue incorporation. The higher content of occluded fractions adduced the increment in cationic micronutrient availability in soil with residue incorporation together with N fertilization due to increased biomass. Rice straw compost along with sewage sludge (SS) and INF also affected the micronutrient availability under the RW cropping system. Nitrogen fertilization through inorganic fertilizers and rice straw compost and sewage sludge (50% + 50%) improved soil micronutrient status due to an increase in SOM over sole NPK fertilizers[45]. Earlier, Dhaliwal et al.[46] in a long-term experiment determined that different combinations of NPK along with biogas slurry as an organic source modified the extractable micronutrient status of the soil.

    A comparative study was carried out by Dhaliwal et al.[47] to ascertain the long-term impact of agro-forestry and rice–wheat systems on the distribution of soil micronutrients. The DTPA-extractable and total Cu, Zn, Fe, and Mn were greater in the RW system due to the reduced conditions because of rice cultivation. Under the RW system Zn removal was higher which was balanced by continuous Zn application. The higher availability of Fe under the RW system was due to reduced conditions. Contrarily, Mn was greater under the agro-forestry system owing to nutrient recycling from leaf litter.

    The long-term impact of integrated application of FYM, GM, WCS (wheat-cut straw) and INF on the soil micronutrients (Zn, Mn, Cu, and Fe) have been studied by Dhaliwal et al.[48]. The FYM application substantially improved DTPA-extractable Zn status followed by GM and WCS, whereas Cu content was maximum in the plots with OM application. The highest Fe concentration was recorded in treatment in which 50% recommended N supplied through FYM. This could be ascribed to the release of micronutrients from OM at low soil pH.

    Shiwakoti et al.[49] studied the dual effects of tillage methods (MP, DP, SW) and variable rates of N (0, 45, 90, 135 and 180 kg ha−1) on the distribution of micronutrients under a moisture-deficit winter wheat-fallow system. The soil Mn content was highest under the DP regime. Inorganic N application reduced Cu content in the soil. Comparative studies with adjacent undisturbed grass pasture indicated the loss of Zn and Cu to a significant extent. Thus, DP along with nitrogen added through inorganic fertilizers could improve micronutrient concentration in the soil. Moreover, the results implied that long-term cultivation with nitrogen fertilization and tillage results in the decline of essential plant nutrients in the soil. Thus, organic amendments along with INF may prove an effective approach to increase soil micronutrient content. In another study conducted by Lozano-García & Parras-Alcántara[50] tillage practices such as NT under apple orchard, CT with the wheat-soybean system and puddling (PD) in the rice-rice cropping system were found to affect nutrient status. Under CT, Cu content was lowest and Zn content was highest. On the contrary, puddling caused an increase in Fe and Mn concentration owing to the dispersion of soil aggregates which reduced the percolation of water and created an anaerobic environment thereby enhancing the availability of Fe and Mn.

    Tillage practices along with gypsum fertilization have been known to affect secondary nutrient concentrations in soil. In a long-term experiment, FYM application showed maximum response to increased S concentration due to the maximum addition of OM through FYM over other treatments as S is an essential component of OM and FYM[32]. Higher Mg content was recorded in FYM and pea vine treatments because the application of organic matter through organic manure or pea vines outright led to Mg accrual. The lower Mg concentration in topsoil than the lower layers was due to the competition between Mg and K for adsorbing sites and thus displacement of Mg by K. Han et al.[28] while ascertaining the impact of organic manures and mineral fertilizers (NPK) on soil chemical attributes determined that INF application reduced exchangeable calcium, whereas no significant changes were exhibited in the magnesium concentrations. The OM application significantly increased both the calcium and magnesium concentrations in the soil.

    While ascertaining the effect of different tillage treatments such as CT, NT, and MT on exchangeable and water-soluble cations, Lozano-García & Parras-Alcántara[50] recorded that NT had greater content of exchangeable Ca2+ and Mg2+ than MT and CT. The exchangeable Ca2+ decreased with depth, however, opposite results were observed for Mg2+ which might be due to the higher uptake of Mg2+ by the crop. On another note, there might be the existence of Mg2+-deficient minerals on the surface horizon. Alam et al.[51] studied the temporal effect of tillage systems on S distribution in the soil and observed that available S was 19%, 31%, and 34% higher in zero tillage than in minimum tillage, conventional tillage, and deep tillage, respectively.

    Kumar et al.[38] appraised the impact of tillage systems on surface soil nutrient dynamics under the following conditions: conventional tillage, zero till seeding with bullock drawn, conventional tillage with bullock drawn seeding, utera cropping and conservation tillage seeding with country plough and observed that tillage had a significant impact on the available S content. Compared with conventional tillage, zero and minimum tillage had higher S content as there was none or limited tillage operations which led to the accumulation of root stubble in the soil that decomposed over time and increased S concentration.

    Soil is considered a hotspot for microbial biodiversity which plays an important role in building a complex link between plants and soil. The microbial components exhibit dynamic nature and, therefore, are characterized as good indicators of soil quality[52]. These components include MBC, MBN, PMN and microbial respiration which not only assist in biological transformations like OM conversion, and biological nitrogen fixation but also increase nutrient availability for crop uptake. Management strategies such as fertilizer inputs and tillage practices may exert beneficial effects on soil biota as discussed below.

    Soil is an abode to a considerable portion of global biodiversity. This biodiversity not only plays a pivotal role in regulating soil functions but also provides a fertile ground for advancing global sustainability, especially agricultural ventures. Thus, the maintenance of soil biodiversity is of paramount importance for sustaining ecosystem services. Soil biodiversity is the diverse community of living creatures in the soil that interact not only with one another but also with plants and small animals to regulate various biological activities[53]. Additionally, it increases the fertility of soil by converting organic litter to SOM thereby enhancing SOC content. Thus, the SOM measures the number and activity of soil biota. Furthermore, the quality and amount of SOC, as well as plant diversity have a considerable impact on the soil microbial community structure[54].

    Dangi et al.[55] ascertained the impact of integrated nutrient management and biochar on soil microbial characteristics and observed that soil amended with biochar or the addition of organic manures influenced microbial community composition and biomass and crop yield. After two years, the higher rates of biochar significantly enhanced the levels of gram-positive and gram-negative bacterial phospholipid fatty acid (PLFA), total arbuscular mycorrhizal fungal (AMF) than lower rates, unfertilized and non-amended soil. Luan et al.[56] conducted a comparison study in a greenhouse to assess the effects of various rates of N fertilizer and kinds (inorganic and organic) on enzyme activities and soil microbial characteristics. Microbial growth (greater total PLFAs and microbial biomass carbon) and activity were promoted by manure substitution of mineral fertilizer, particularly at a higher replacement rate. On account of lower response in bacterial over fungal growth, manure addition led to a greater fungi/bacteria ratio. Furthermore, manure application significantly enhanced microbial communities, bacterial stress indicators and functional diversity. Lazcano et al.[57] determined the influence of different fertilization strategies on microbial community structure and function, soil biochemical properties and crop yield three months after addition of fertilizer. The integrated fertilizer regimes augmented microbial growth with improved enzyme activity as compared to sole inorganic amendments. Bacterial growth showed variable response with variation in fertilizer regime used whereas fungal growth varied with the amount of fertilizer added. Compared to mineral fertilizers, manure application led to a rapid increase in PLFA biomarkers for gram-negative bacteria. The organic amendments exhibited significant effects even at small concentration of the total quantity of nutrients applied through them; thus, confirming the viability of integrated fertilizer strategies in the short term.

    Kamaa et al.[58] assessed the long-term effect of crop manure and INF on the composition of microbial communities. The organic treatments comprised of maize (Zea mays) stover (MS) at 10 t ha−1 and FYM @ 10 t ha−1, INF treatments (120 kg N, 52.8 kg P-N2P2), integrated treatments (N2P2 + MS, N2P2 + FYM), fallow plot and control. The treatment N2P2 exhibited unfavourable effects on bacterial community structure and diversity that were more closely connected to the bacterial structure in control soils than integrated treatments or sole INF. In N2P2, fungal diversity varied differently than bacterial diversity but fungal diversity was similar in the N2P2 + FYM and N2P2 + MS-treated plots. Thus, the total diversity of fungal and bacterial communities was linked to agroecosystem management approaches which could explain some of the yield variations observed between the treatments. Furthermore, a long-term experiment was performed by Liu et al.[59] to study the efficiency of pig manure and compost as a source for N fertilization and found unique prokaryotic communities with variable abundance of Proteobacteria under compost and pig manure treatments.

    Recently, Li et al.[60] assessed the influence of different tillage practices (no-tillage, shallow tillage, deep tillage, no-tillage with straw retention, shallow tillage with straw retention and deep tillage with straw retention) on microbial communities and observed that tillage practices improved the bacterial Shannon index to a greater extent over the no-tillage plots in which the least value was recorded. Another research study by He et al.[61] reported the effect of tillage practices on enzyme activities at various growth stages. Across all the growth stages, enzyme activities of cellobiohydrolase (CBH), β-xylosidase (BXYL), alkaline phosphatase (AP), β-glucosidase (BG), β-N-acetylglucosamines (NAG) were 17%−169%, 7%−97%, 0.12%−29%, 3%−66%, 23%−137% greater after NT/ST, NT, ST, ST/PT, and PT/NT treatments as compared to plow tillage. The NT/ST treatment resulted in highest soil enzyme activities and yield, and thus was an effective and sustainable method to enhance soil quality and crop production.

    Microbes play a crucial role in controlling different soil functions and soil ecology and microbial community show significant variation across as well as within the landscape. On average, the total biomass of microbes exceeds 500 mg C kg soil−1[62]. Microbial biomass carbon is an active constituent of SOM which constitutes a fundamental soil quality parameter because SOM serves as a source of energy for microbial processes and is a measure of potential microbial activity[48,63]. Soil systems that have higher amounts of OM indicate higher levels of MBC. Microbial biomass carbon is influenced by many parameters like OM content in the soil, land use, and management strategies[64]. The MBC and soil aggregate stability are strongly related because MBC integrates soil physical and chemical properties responds to anthropogenic activities.

    Microbial biomass is regarded as a determinative criterion to assess the functional state of soil. Soils having high functional diversity of microbes which, by and large, occurs under organic agricultural practices, acquire disease and insect-suppressive characteristics that could assist in inducing resistance in plants[65]. Dou et al.[66] determined that soil microbial biomass C (SMBC) was 5% to 8% under wheat-based cropping systems and zero tillage significantly enhanced SMBC in the 0−30 cm depth, particularly in the upper 0 to 5 cm. According to Liang et al.[67], SMBC and soil microbial biomass N (SMBN) in the 0−10 cm surface layer were greater in the fertilized plots in comparison to the unfertilized plots on all sampling dates whereas microbial biomass C and N were highest at the grain filling stage. Mandal et al.[68] demonstrated that MBC also varied significantly with soil depth. Surface soil possessed a maximum MBC value than lower soil layers due to addition of crop residues and root biomass on the surface soil. The MBC content was highest with combined application of INF along with farmyard manure and GM, whereas untreated plots showed minimum MBC values. The incorporation of CR slows down the rate of mineralization processes; therefore, microbes require more time to decompose the residues and utilize the nutrients released[69]. On the other hand, incorporation of GR having a narrow C:N ratio enhances microbial activity and consequently accelerates mineralization in the soil. Malviya[70] also recorded that the SMBC contents were significantly greater under RT than CT, regardless of soil depth which was also assigned to residue incorporation which increases microbial biomass on account of higher carbon substrate in RT.

    Naresh et al.[71] studied the vertical distribution of MBC under no-tillage (NT), shallow (reduced) tillage and normal cultivated fields. A shallow tillage system significantly altered the tillage induced distribution of MBC. In a field experiment, Nakhro & Dkhar[72] examined the microbial populations and MBC in paddy fields under organic and inorganic farming approaches. The organic source used was a combination of rock phosphate, FYM and neem cake, whereas a mixture of urea, muriate of potash and single super phosphate was used as an inorganic source. The organically treated plots exhibited the highest MBC compared to inorganically treated plots and control. Organic carbon exhibited a direct and significant correlation with bacterial and fungal populations. The addition of organic fertilizers enhanced the content of SOC and consequently resulted in higher microbial count and MBC. Ramdas et al.[73] investigated the influence of inorganic and organic sources of nutrients (as minerals or INF) applied over a five-year period on SOC, MBC and other variables. It was observed that the addition of FYM and conjoint application of paddy straw (dry) and water hyacinth (PsWh) (fresh) significantly increased the SOC content than vermicompost, Chromolaena adenophorum (fresh) and Glyricidia aculeate (fresh), and Sesbania rostrata (fresh).

    Xu et al.[74] evaluated the influence of long-term fertilization strategies on the SOC content, soil MBN, soil MBC, and soil microbial quotient (SMQ) in a continuous rice system and observed that MBC at the main growth stages of early and late rice under 30% organic matter and 70% mineral fertilizer and 60% organic matter and 40% mineral fertilizer treatments was greater as compared to mineral fertilizer alone (MF), rice straw residues and mineral fertilizer (RF), and no fertilizer (CK) treatments. However, SMBC levels at late growth stages were greater in comparison to early growth stages. A recent study by Xiao et al.[75] demonstrated that increasing tillage frequency (no-tillage, semi-annual tillage, and tillage after every four months, two months, and one month) decreased soil MBC. Microbial biomass carbon content was significantly greater in no-till treatment (597 g kg−1) than in tillage every four months (421 g kg−1), two months (342 g kg−1) and one month (222 g kg−1). The decrease in the content of MBC in association with tillage practices is due to soil perturbations which enhanced soil temperature, diminished soil moisture content, and resulted in the destruction of microbial habitat and fungal hyphae. Therefore, the MBC content eventually affected the N cycle.

    Li et al.[76] reported that in comparison to CT, NT and RT resulted in increased MBC content and NT significantly increased MBC by 33.1% over CT. Furthermore, MBC concentration was 34.1% greater in NT than RT. The increase in MBC concentration was correlated with the results of increase in SOC concentration. Site-specific factors including soil depth and mean annual temperature significantly affected the response ratio of MBC under NT as compared to the duration of NT.

    Microbial biomass nitrogen (MBN) is a prominent indicator of soil fertility as it quantifies the biological status of soil. Soil MBN is strongly associated with organic matter of the soil. The nitrogen in MBN has a rapid turnover rate thereby reflecting the changes in management strategies way before the transformations in total N are discernable[77].

    In an experiment on continuous silage maize cultivation with crop rotation, Cerny et al.[78] observed that organic fertilizers exerted an affirmative influence on the soil MBN. During the application of organic manure MBN decreased, but there was higher MBN content as compared to control. However, addition of mineral nitrogenous fertilizers exerted an adverse effect on MBN content in experiments with maize. El-Sharkawi[79] recorded that organic matter-treated pots resulted in maximum MBN content than urea-treated pots. The sludge application enhanced total MBN and, therefore, could implicitly benefit crop production particularly in poor soils[18]. Sugihara et al.[80] observed that during the grain-filling stage in maize, residue and/or fertilizer addition exerted a pronounced influence on soil microbial dynamics; however, a clear effect of residue and ⁄or fertilizer addition was not observed. Microbial biomass nitrogen reduced dramatically from 63–71 to 18–33 kg N ha˗1 and C:N ratio at the same time increased more than ten-fold in all plots.

    Malik et al.[81] apprised that the organic amendments significantly enhanced MBN concentrations up to 50% more than the unamended soil. Wang et al.[82] evaluated the influence of organic materials on MBN content in an incubation and pot experiment with acidic and calcareous soils. The results revealed that MBN content which was affected by the different forms of organic amendments, increased by 23.37%−150.08% and 35.02%−160.02% in acidic and calcareous soils, respectively. The MBN content of both soils decreased with the increase in the C/N ratio of the organic materials, though a higher C/N ratio was effective for sustaining a greater MBN content for a very long time.

    Dhaliwal & Bijay-Singh[52] observed higher MBN levels in NT soils (116 kg ha−1) than in cultivated soils (80 kg ha−1). Kumar et al.[83] ascertained that in surface layer, MBN content was 11.8 mg kg−1 in CT which increased to 14.1 and 14.4 mg kg−1 in ZT and RT without residue retention and 20.2, 19.1 and 18.2 mg kg−1 in ZT, RT and CT with residue incorporation, respectively (Table 1). In the subsurface layer, the increased tendency on account of tillage and crop residue retention was identical to those of 0−15 cm layer but the magnitude was comparatively meagre (Table 1). In comparison to control, the persistent retention of crop residues led to significant accrual of MBN in the surface layer.

    Table 1.  Effect of different treatments on contents of various fractions of soil organic carbon[38].
    TreatmentsPMN (mg kg−1)MBC (mg kg−1)MBN (mg kg−1)DOC (mg kg−1)
    Depths (cm)
    0−1515−300−1515−300−1515−300−1515−30
    Tillage practices
    ZTR12.411.2562.5471.120.218.9198.6183.6
    ZTWR8.57.6350.4302.114.112.6167.1159.2
    RTR10.69.9490.2399.319.117.2186.4171.6
    RTWR7.66.6318.1299.814.413.7159.5148.7
    CTR9.38.5402.9354.418.216.6175.9168.9
    CT6.75.6307.9289.511.89.7142.5134.6
    Nitrogen management
    Control3.62.8218.3202.910.810.4103.792.3
    80 kg N ha−15.34.4241.1199.414.912.2128.3116.9
    120 kg N ha−18.97.6282.7220.916.516.1136.8123.6
    160 kg N ha−19.88.4343.9262.919.418.1164.8148.9
    200 kg N ha−110.49.7346.3269.622.721.7155.7136.4
    ZTR = Zero tillage with residue retention, ZTWR = Zero tillage without residue retention; RTR = Reduced tillage with residue retention, RTWR = Reduced tillage without residue retention, CTR = Conventional tillage with residue incorporation; CT = Conventional tillage without residue incorporation.
     | Show Table
    DownLoad: CSV

    Xiao et al.[75] determined that the MBN content decreased with tillage treatment having highest value in no tillage treatment, however, the difference among the treatments was negligible. Soil perturbations decreased the aggregate size and thus lower the soil aeration and exposure of fresh organic matter which restricted the growth of microorganisms. The results also concluded that MBN content is highly sensitive to tillage. Ginakes et al.[84] assessed the impact of zone tillage intensity on MBN in a corn-kura clover cropping sequence. Microbial biomass nitrogen was influenced by time and type of tillage treatment. Temporal studies revealed that MBN was higher after tillage treatment than the values possessed before tillage. Under different tillage treatments, higher values were recorded in ST (shank-till) and DT (double-till) over NT and RZT (zone-till) treatments.

    Another biological parameter, PMN, is a crucial parameter of soil fertility due to its association with soil N supply for crop growth. Also, PMN indicates the status of soil microbial community associated with PMN, whether it is improving or degrading. Forest soils are characterized by greater levels of PMN than CT receiving conventional chemical fertilizers which could be assignable to improved microbial activity in the former soils than the latter[48,77]. Aulakh et al.[85] assessed the effect of various combinations of fertilizer N, P, FYM and wheat residue (WR) applied to soybean and soybean residues added to wheat under CT and CA. The added fertilizers of N and P, FYM, and crop residue enhanced the mean weight diameter and water-stable aggregates thus favoured the development of macro-aggregates. The treatment INF + FYM + crop residue performed better among all the treatments. The net flux of mineral nitrogen from the mineralizable fraction is used to measure potentially mineralizable N which indicates the balance between mineralization and immobilization by soil microbes[77]. Nitrogen mineralization is widely used to assess the ability of SOM to supply inorganic nitrogen in the form of nitrate which is the most common form of plant-available nitrogen. Kumar et al.[83] observed an increase in PMN which was higher in surface soil than sub-surface soil thereby implying that high OC accumulation on account of crop residue retention was the most probable cause.

    Verma & Goyal[86] assessed the effect of INM and organic manuring on PMN and observed that PMN was substantially affected by different organic amendments. Potentially mineralizable nitrogen varied between 19.6−41.5 mg kg−1 soil with greater quantity (2.5%) in vermicompost applied plots than FYM treated plots. The INF treatments resulted in lower PMN content which could be due to nutrient immobilization by microbes. Mahal et al.[87] reported that no-till resulted in higher PMN content than conventional tillage treatments. This trend was due to the maintenance of SOM due to the residue cover and reduction of soil erosion under no-tillage system[88]. On the contrary, tillage practices led to the loss of SOC owing to loosened surface soil and higher mineralization of SOM.

    Soil respiration is referred as the sum of CO2 evolution from intact soils because of the respiration by soil organisms, mycorrhizae and roots[89]. Various researchers have proposed soil respiration as a potential indicator of soil microbial activity[52,77]. Gilani & Bahmanyar[90] observed that addition of organic amendments enhanced soil respiration more than the control and synthetic fertilizer treatments. Moreover, among organic amendment treatments, highest soil respiration was observed in sewage-sludge treated soils. Under controlled conditions in saline-sodic soil, Celis et al.[91] reported that sewage sludge resulted in a higher soil respiration rate than mined gypsum and synthetic gypsum. The application of gypsum because of minimal organic matter intake had little effect on soil respiration. The addition of organic matter especially during early spring led to higher microbial biomass and soil respiration albeit diminished levels of nitrate-N. Moreover, SOM hinders the leaching of nitrate ions thereby resulting in a better soil chemical environment[71].

    Faust et al.[92] observed that microbial respiration was associated with volumetric water content. The respiration declined with less availability of water, thus the lesser the tillage intensity, the more the volumetric water content which consequently resulted in higher microbial respiration. Another study by Bongiorno et al.[93] reflected the influence of soil management intensity on soil respiration. Reduced tillage practices resulted in 51% higher basal respiration than CT. Furthermore, this investigation suggested that microbial catabolic profile could be used as a useful biological soil quality indicator. Recently, Kalkhajeh et al.[94] ascertained the impact of simultaneous addition of N fertilizer and straw-decomposing microbial inoculant (SDMI) on soil respiration. The SDMI application boosted the soil microbial respiration which accelerated the decomposition of straw due to N fertilization. The C/N ratio did not affect the microbial respiration at elongation and heading stages, whereas N fertilization enhanced the microbial respiration to a greater extent than the unfertilized control. Additionally, the interaction between sampling time and basal N application significantly affected microbial respiration.

    Gong et al.[95] apprised the effect of conventional rotary tillage and deep ploughing on soil respiration in winter wheat and observed that deep ploughing resulted in a higher soil respiration rate than conventional rotary tillage. Soil moisture content and temperature are the dominating agents influencing soil respiration which is restricted by the soil porosity.

    Soil organic carbon plays a vital role in regulating various soil functions and ecosystem services. It is influenced by numerous factors like tillage practices and fertilization. Moreover, modified management practices may prove beneficial to avoid SOC loss by increasing its content. An exogenous supply of fertilizers may alter the chemical conditions of soil and thus result in transformation of SOC. Tillage practices lead to frequent soil disturbances which reduce the size of soil aggregates and accelerate the oxidation of SOC thereby reducing its content. The literature on the influence of fertilization and tillage practices on the transformation of SOC is discussed below.

    Soil organic carbon is a major part of the global carbon cycle which is associated not only with the soil but also takes part in the C cycling through vegetation, oceans and the atmosphere (Figs 1 & 2). Soil acts as a sink of approximately 1,500 Pg of C up to 1 m depth, which is greater than its storage in the atmosphere (approximately 800 Pg C) and terrestrial vegetation (500 Pg C) combined[96]. This dynamic carbon reservoir is continuously cycling in diverse molecular forms between the different carbon pools[97]. Fertilization (both organic and mineral) is one of the crucial factors that impart a notable influence on OC accretion in the soil. Many researchers have studied the soil C dynamics under different fertilizer treatments. Though inorganic fertilizers possess the advantage of easy handling, application and storage, they do not contribute to soil organic carbon. On the contrary, regardless of management method, plant residues are known to increase organic carbon content.

    Figure 1.  Impact of different fertilization regimes on abundance of the microbial biomarker groups . Error bars represent the standard error of the means and different letters indicate significant differences at p < 0.05 among treatments. Source: Li et al.[60].
    Figure 2.  Soil organic carbon (SOC) dynamics in the global carbon cycle.

    Katkar et al.[98] reported a higher soil quality index under conjunctive nutrient management strategies comprising addition of compost and green leaves along with mineral nutrients. Mazumdar et al.[99] investigated the impact of crop residue (CR), FYM, and leguminous green manure (GM) on SOC in continuous rice-wheat cropping sequence over a 25-year period. At the surface layer, the maximum SOC content was recorded under NPK + FYM than NPK + CR and NPK + GM treatments. SOC was significantly lower under sole application of INFs (NPK) than the mixed application of organic and inorganic treatments. A higher range of SOC content was recorded at a depth of 0.6 m in the rice-wheat system (1.8–6.2 g kg−1) in farmyard manure (FYM)-treated plots than 1.7–5.3 g kg−1 under NPK, and 0.9–3.0 g kg−1 in case of unfertilized plots[100]. In a research study Dutta et al.[101] reported that rice residue had a higher decomposition rate (k¼ 0.121 and 0.076 day−1) followed by wheat (0.073 and 0.042 day−1) and maize residues (0.041 day−1) when their respective residues placed on soil surface than incorporated in the soils. Naresh et al.[102] found FYM and dhaincha as GM/ sulphitation press mud (SPM) treatments are potent enough to enhance the SOC. Maximum SOC content was noted in 0–5 cm depth that reduced gradually along the profile. In surface soil, the total organic content (TOC) under different treatments varied with source used to supply a recommended dose of nitrogen (RDN) along with conventional fertilizer (CF).

    Cai et al.[103] ascertained that long-term manure application significantly improved SOC content in different size fractions which followed the sequence: 2,000–250 μm > 250–53 μm > 53 μm fraction. Naresh et al.[22] determined that mean SOC content increased from 0.54% in control to 0.65% in RDF and 0.82% in RDF + FYM treatment and improved enzyme activity; thus, ultimately influenced nutrient dynamics under field conditions. The treatments RDF + FYM and NPK resulted in 0.28 Mg C ha−1 yr−1 and 0.13 Mg C ha−1 yr−1, respectively and thus higher sequestration than control. Zhao et al.[104] determined that in the surface layer, significant increase in SOC content in each soil aggregate was noticed under straw incorporation treatments over no straw incorporated treatments (Fig. 3). Moreover, the aggregate associated OC was significantly higher in the surface layer than the sub-surface layer. The highest increment in aggregate-associated OC was noted in both maize and wheat straw (MR-WR) added plots followed by MR and least in WR. Besides, all of the three straw-incorporated treatments exhibited notable increase in SOC stock in each aggregate fraction in the surface layer of the soil. In the subsurface (20−40 cm) layer under MR-WR, significant rise in SOC stock of small macro-aggregates was observed, whereas there was a reduction in SOC stock in the silt + clay fraction than other treatments. The straw-incorporated treatments increased the quantity of mineral-associated organic matter (mSOM) and intra-aggregate particulate organic matter, (iPOM) within small macro-aggregates and micro-aggregates especially in the topmost layer of the soil.

    Figure 3.  Distribution of OC in coarse iPOM (intra-aggregate particulate organic matter) fine iPOM, mSOM (mineral-associated matter), and free LF (free light fraction) of small macro-aggregates and micro-aggregates in the 0–20 cm and 20–40 cm soil layers under MR-WR (return of both maize and wheat straw), MR (maize straw return), WR (wheat straw return). Different lowercase and uppercase letters indicate significant differences at p < 0.05 among treatments and depths respectively[104].

    Srinivasarao et al.[105] reported that SOC content was reduced with the addition of INFs (100% RDN) alone as compared to the conjunctive application of inorganic and organic or sole FYM treatments. Earlier, Srinivasarao et al.[106] reported that FYM treated plots exhibited greater per cent increase in SOC stock than mineral fertilized plots and control. Tong et al.[107] ascertained that the application of NP and NPK significantly improved SOC stocks. On the contrary, fertilized soils could also exhibit decrease in carbon content than control. Naresh et al.[108] determined that higher biomass C input significantly resulted in greater particulate organic carbon (POC) content. Zhang et al.[109] ascertained that long-term addition of NPK and animal manures significantly improved SOC stocks by a magnitude of 32%−87% whereas NPK and wheat/ and or maize straw incorporation enhanced the C stocks by 26%−38% than control. Kamp et al.[110] determined that continuous cultivation without fertilization decreased SOC content by 14% than uncultivated soil. However, super optimum dose of NPK, balanced NPK fertilization and integration of NPK with FYM not only improved SOC content but also SOC stocks over the first year. In conventionally tilled cotton-growing soils of southern USA, Franzluebbers et al.[111] estimated that carbon sequestration averaged 0.31 ± 0.19 Mg C ha−1 yr−1. Mandal et al.[112] reported maximum SOC stock in the surface layer of the soil (0–15 cm) which progressively diminished with depth in each land use system. A significant decrease in SOC stock along the profile depth was also observed by Dhaliwal et al.[47] in both croplands and agroforestry. In the topmost soil layer, highest SOC stock was recorded in rice–fallow system while the lowest was in the guava orchard[112].

    Nath et al.[113] determined that there was accrual of higher TOC in surface layers as compared to lower layers of soil under paddy cultivation. This accrual could be adduced to left-over crop residues and remnant root biomass which exhibited a decreasing trend with soil depth. Das et al.[114] determined that integrated use of fertilizers and organic sources resulted in greater TOC as compared to control or sole fertilizer application. Fang et al.[115] observed that the cumulative carbon mineralization differed with aggregate size in top soils of broad-leaved forests (BF) and coniferous forests (CF). However, in deep soil it was greater in macro-aggregates as compared to micro-aggregates in BF but not in CF (Fig. 4). By and large, the percent SOC mineralized was greater in macro-aggregates as compared to micro-aggregates. Dhaliwal et al.[100] ascertained that SOC accrual was considerably influenced by residue levels and tillage in surface soil (0−20 cm); albeit no variation was observed at lower depth (20−40 cm). The SOC content was greater in zero-tilled and permanently raised beds incorporated with residues as compared to puddled transplanted rice and conventionally planted wheat. Pandey et al.[116] reported that no-tillage prior to sowing of rice and wheat increased soil organic carbon by 0.6 Mg C ha–1 yr–1. The carbon sequestration rate on account of no-tillage or reduced tillage ranged between 0−2,114 kg ha–1 yr–1 in the predominant cropping system of South Asia, Xue et al.[117] observed that the long-term conventional tillage, by and large, exhibited a significant decline in SOC owing to degradation of soil structure, exposing protected soil organic matter (intra-soil aggregates) to microbes. Therefore, the adoption of no-tillage could hamper the loss of SOC thereby resulting in a greater or equivalent quantity of carbon in comparison to CT (Fig. 5).

    Figure 4.  (a) Soil aggregate fractions of two depths in two restored plantations of subtropical China, (b) organic carbon and (c) its mineralization from various soil aggregates within 71 d at various soil depths in two restored plantations of subtropical China. Error bars show the standard error of the mean. The different letters represent significant differences among the different soil aggregate fractions within a depth at p < 0.05[115].
    Figure 5.  The concentrations of (a) SOC, (b) total nitrogen (TN), and (c) soil C:N ratio for 0–50 cm profile under different tillage treatments in 2012 and 2013. NT = no-till with residue retention; RT = rotary tillage with residue incorporation; PT = plow tillage with residue incorporation; and PT0 = plow tillage with residue removed. The lowercase letters indicate statistical difference among treatments at p < 0.05[117].

    Singh et al.[118] determined that carbon stock in the 0-40 cm layer increased by 39, 35 and 19% in zero-tilled clay loam, loam, and sandy loam soils, respectively as compared to conventional tilled soils over a period of 15 years. Kuhn et al.[119] also apprised about the advantages of NT over CT vis-a-vis SOC stocks across soil depths. In the surface layer (0−20 cm) NT, by and large, resulted in higher SOC stocks as compared to CT; however, SOC stocks exhibited a declining trend with soil depth, in fact, became negative at depths lower than 20 cm. Sapkota et al.[120] observed that over a period of seven years, direct dry-seeded rice proceeded by wheat cultivation with residue retention enhanced SOC at 0-60 cm depth by a magnitude of 4.7 and 3.0 t C ha−1 in zero-tillage (ZTDSR-ZTW + R) and without tillage (PBDSR-PBW + R), respectively. On the contrary, the conventional tillage rice-wheat cropping system (CTR-CTW) decreased the SOC up to 0.9 t C ha−1 (Table 2).

    Table 2.  Influence of tillage and crop establishment methods on SOC stock and its temporal variation under rice–wheat system[120].
    Tillage and crop establishment methodsDepths (m)
    0–0.050.05–0.150.15–0.30.3–0.60–0.6
    Total SOC (t/ha)
    CTR-CTW3.5e7.1c8.77.026.2c
    CTR-ZTW3.9d7.6bc8.86.526.7c
    ZTDSR-CTW4.2d7.5bc9.26.327.3c
    ZTDSR-ZTW4.9c8.9ab8.26.228.2bc
    ZTDSR-ZTW+R6.1a9.0ab9.86.831.8a
    PBDSR-PBW+R5.5b9.3a9.36.030.1ab
    MSD0.41.72.01.42.49
    Treatment effect
    (p value)
    < 0.0010.040.1580.267< 0.001
    Initial SOC content3.6 ±
    0.15
    8.1 ±
    1.39
    8.78 ±
    1.07
    6.7 ±
    0.73
    27.1 ±
    1.21
    Change in SOC over seven years (t/ha)
    CTR-CTW−0.16−0.99−0.040.28−0.90
    CTR-ZTW0.28−0.500.01−0.20−0.41
    ZTDSR-CTW0.62−0.570.45−0.340.16
    ZTDSR-ZTW1.340.84−0.62−0.461.09
    ZTDSR-ZTW+R2.490.961.040.164.66
    PBDSR-PBW+R1.891.220.51−0.642.98
    CTR-CTW = Conventionally tilled puddled transplanted rice followed by conventionally tilled wheat, CTR-ZTW = Conventionally tilled puddled transplanted rice followed by zero-tilled wheat, ZTDSR-CTW = Zero-tilled direct dry-seeded rice followed by conventionally tilled wheat, ZTDSR-ZTW = Zero-tilled direct dry-seeded rice followed by zero-tilled wheat, ZTDSR-ZTW+R = Zero-tilled direct dry-seeded rice followed by zero-tilled wheat with residue retention, PBDSR-PBW+R = Direct dry-seeded rice followed by direct drilling of wheat both on permanent beds with residue retention, MSD, minimum significant difference. Significant different letters indicate significant differences at p < 0.05.
     | Show Table
    DownLoad: CSV

    Labile organic carbon (LC) is that fraction of SOC that is rapidly degraded by soil microbes, therefore, having the highest turnover rate. This fraction can turn over quickly on account of the change in land use and management strategies. From the crop production perspective, this fraction is crucial as it sustains the soil food cycle and, hence, considerably impacts nutrient cycling thereby altering soil quality and productivity. Short-term management could influence the labile fraction of carbon[121]. However, some site-specific problems and regional factors may influence their distribution in soil layers[102].

    Banger et al.[122] observed significant alteration in labile pools of C, for instance, particulate organic matter (POM), water-soluble C (WSC) and light fraction of C (LFC) because of the addition of fertilizers and/or FYM over a 16-year period. Particulate organic matter, LFC and WSC contributed 24%–35%, 12%–14% and 0.6%–0.8%, respectively, towards SOC. The increase in concentration of SOC including its pools like POC and the sequestration rate due to integrated nutrient management was also reported by Nayak et al.[123]. Gu et al.[124] observed that mulch-treated soils (straw and grass mulch) had significantly greater levels of LOC, POC, DOC and EOC as compared to no mulch-treated soils which could be adduced to the addition of straw, root and its sections into the soil. The content of labile C fractions across all treatments exhibited a decreasing trend with soil depth[23, 102, 125].

    In a long-term experiment, Anantha et al.[126] observed that the total organic carbon apportioned into labile carbon, non-labile, less labile, and very labile carbon constituted around 18.7%, 19.3%, 20.6% and 41.4% of the TOC, respectively (Table 3). Zhu et al.[20] determined that straw incorporation had a substantial impact on TOC and labile C fractions of the soil which were greater in straw incorporated treatments as compared to non-straw treatments across all the depths. Wang et al.[127] reported that the light fraction organic carbon (LFOC) and DOC were significantly greater in the straw-applied treatments than the control by a magnitude of 7%–129% for both the early and late season rice. The treatments NPK + FYM or NPK + GR + FYM resulted in greater content of very labile and labile C fractions whereas non-labile and less labile fractions were greater in control and NPK + CR treatment. There was 40.5% and 16.2% higher C build-up in sole FYM treated plots and 100% NPK + FYM, respectively over control. On the other hand, a net depletion of 1.2 and 1.8 Mg ha−1 in carbon stock was recorded under 50% NPK and control treatments, respectively. Out of the total C added through FYM, only 28.9% was stabilized as SOC, though an external supply of OM is a significant source of soil organic carbon[69]. Hence, to sustain the optimum SOC level at least an input of 2.3 Mg C ha−1 y−1 is required. A comparatively greater quantity of soil C in passive pools was observed in 100% NPK + FYM treatment. The increase in allocation of C into the passive pool was about 33%, 35%, 41% and 39% of TOC in control, suboptimal dose, optimal dose and super optimal dose of NPK which indicates that the concentration of passive pools increased with an increase in fertilization doses. Water-soluble carbon (WSC) was 5.48% greater in the upper soil layer as compared to lower layer of soil. In surface soil (0−15 cm), the values of light fraction carbon (LFC) were 81.3, 107.8, 155.2, 95.7, 128.8, 177.8 and 52.7 mg kg−1 in ZT without residue retention, ZT with 4 t ha−1 residue retention, ZT with 6 t ha−1 residue retention, FIRB without residue addition and FIRB with 4 and 6 t ha−1 residue addition and CT, respectively (Table 4). Tiwari et al.[128] determined that the decrease in POC was due to reduction in fine particulate organic matter in topsoil whereas decrement in dissolved organic carbon was observed largely in subsoil. Therefore, in surface soils fine POC and LFOC might be regarded as preliminary evidence of organic C alteration more precisely, while DOC could be considered as a useful indicator for subsoil. Reduction in allocations of fine POC, LFOC and DOC to SOC caused by tillage and straw management strategies indicated the decline in quality of SOC. A higher SOC concentration was recorded in the conjoint application of INF + FYM (0.82%) and sole application of INF (0.65%) than control (0.54%). Kumar et al.[83] reported that the CT without residue retention had significantly lower labile carbon fractions (27%–48%) than zero-tillage with 6-ton residue retention. Moreover, residue-retained fertilized treatments had significantly greater labile fractions of C than sole fertilized treatments[125]. Kumar et al.[83] reported highest change in DOC in zero-till with residue retention (28.2%) in comparison to conventional tillage practices. In ZT, absence of soil perturbations resulted in sustained supply of organic substrata for soil microbes which increases their activity. On the contrary, CT practices resulted in higher losses of C as CO2 due to frequent disturbances.

    Table 3.  Oxidisable organic carbon fractions in soils (g kg−1) at different layers[126].
    TreatmentDepths (cm)
    0−1515−3030−45Total
    Very Labile C
    Control3.6 ± 0.5c1.4 ± 0.3b1.3 ± 0.2a6.3 ± 0.4b
    50% NPK4.6 ± 0.3bc2.1 ± 0.7ab1.5 ± 0.1a8.1 ± 0.9a
    100% NPK4.4 ± 0.3bc2.3 ± 0.2a1.4 ± 0.5a8.0 ± 0.7a
    150% NPK5.0 ± 0.2ab2.6 ± 0.2a1.5 ± 0.1a9.0 ± 0.3a
    100% NPK + FYM4.8 ± 0.2ab2.0 ± 0.2ab1.3 ± 0.3a8.1 ± 0.2a
    FYM5.9 ± 1.3a2.2 ± 0.2a1.4 ± 0.3a9.5 ± 1.6a
    Fallow4.2 ± 0.7bc1.5 ± 0.5b0.7 ± 0.3b6.3 ± 0.8b
    Lbile C
    Control2.4 ± 0.3a1.0 ± 0.2a0.8 ± 0.4a4.2 ± 0.6a
    50% NPK1.7 ± 0.4ab0.9 ± 0.5a0.7 ± 0.2a3.3 ± 0.7a
    100% NPK1.8 ± 0.4ab0.8 ± 0.5a0.6 ± 0.3a3.2 ± 0.8a
    150% NPK1.2 ± 0.3b0.7 ± 0.2a0.9 ± 0.2a2.8 ± 0.4a
    100% NPK + FYM1.9 ± 0.3ab0.7 ± 0.2a0.7 ± 0.3a3.4 ± 0.2a
    FYM2.5 ± 0.9a0.7 ± 0.3a0.7 ± 0.2a3.9 ± 0.9a
    Fallow2.2 ± 1.0ab1.0 ± 0.3a1.0 ± 0.4a4.1 ± 1.1a
    Less labile C
    Control1.5 ± 0.3c0.6 ± 0.4c0.4 ± 0.0c2.6 ± 0.7d
    50% NPK1.8 ± 0.1c0.4 ± 0.1c0.5 ± 0.2c2.7 ± 0.1cd
    100% NPK2.5 ± 0.3ab0.8 ± 0.1bc1.1 ± 0.2ab4.4 ± 0.1b
    150% NPK2.6 ± 0.2a0.9 ± 0.1bc0.4 ± 0.2c3.9 ± 0.1b
    100% NPK + FYM2.7 ± 0.6a1.5 ± 0.2a1.4 ± 0.1a5.6 ± 0.7a
    FYM1.9 ± 0.7bc1.7 ± 0.2a1.0 ± 0.2b4.5 ± 0.7ab
    Fallow1.5 ± 0.3c1.3 ± 0.7ab0.9 ± 0.4b3.8 ± 1.2bc
    Non labile C
    Control1.2 ± 0.5b1.2 ± 0.3a0.2 ± 0.2b2.6 ± 0.5b
    50% NPK1.2 ± 0.9b1.7 ± 0.8a0.7 ± 0.4ab3.5 ± 1.8ab
    100% NPK1.3 ± 0.6b1.5 ± 0.6a0.5 ± 0.2ab3.3 ± 1.0ab
    150% NPK1.4 ± 0.3b1.5 ± 0.2a0.8 ± 0.1a3.7 ± 0.3ab
    100% NPK + FYM2.0 ± 0.8b1.3 ± 0.1a0.3 ± 0.3ab3.5 ± 0.7ab
    FYM3.7 ± 1.3a1.0 ± 0.2a0.5 ± 0.5ab5.1 ± 1.9a
    Fallow2.1 ± 0.2b1.4 ± 0.7a0.4 ± 0.2ab3.9 ± 0.9ab
    Values in the same column followed by different letters are significantly different at p < 0.001, ± indicates the standard deviation values of the means.
     | Show Table
    DownLoad: CSV
    Table 4.  Influence of tillage and nitrogen management on distribution of carbon fractions in soil[83].
    TreatmentsWSOC
    (g kg−1)
    SOC
    (g kg−1)
    OC
    (g kg−1)
    BC
    (g kg−1)
    POC
    (mg kg)
    PON
    (mg kg−1)
    LFOC
    (mg kg−1)
    LFON
    (mg kg−1)
    Depths (cm)
    0−1515−300−1515−300−1515−300−1515−300−1515−300−1515−300−1515−300−1515−30
    Tillage practices
    ZTR28.826.223.119.39.619.134.694.281342.8967.9119.5108.1194.7154.814.812.3
    ZTWR25.324.618.414.87.877.213.763.19981.1667.494.686.5120.5104.711.810.3
    RTR27.025.922.418.28.688.174.133.871230.2836.9109.797.8170.9144.913.711.6
    RTWR23.721.818.114.27.667.073.122.96869.4604.482.676.6107.197.39.78.6
    CTR26.124.421.817.48.497.963.823.481099.1779.498.489.3143.8115.912.810.9
    CT21.820.916.113.16.215.642.892.63617.5481.869.257.690.873.69.67.9
    Nitrogen management
    Control21.114.916.113.16.135.481.581.07709.7658.631.726.3123.9104.36.45.8
    80 kg N ha−128.321.217.814.76.466.162.461.75860.7785.668.456.2132.8116.17.66.9
    120 kg N ha−129.522.119.116.17.256.713.262.18952.2808.989.578.5150.6127.69.78.6
    160 kg N ha−130.223.120.818.27.757.283.822.661099.5823.896.883.4168.5145.710.29.8
    200 kg N ha−131.125.421.318.77.937.484.153.421153.1898.4103.997.3176.2152.911.710.6
    WSOC = Water soluble organic carbon, SOC = Total soil organic carbon, OC = Oxidizable organic carbon, BC =Black carbon, POC = particulate organic carbon, PON = particulate organic nitrogen, LFOC = labile fraction organic carbon, and LFON = labile fraction organic nitrogen. ZTR = Zero tillage with residue retention, ZTWR = Zero tillage without residue retention; RTR = Reduced tillage with residue retention, RTWR = Reduced tillage without residue retention, CTR = Conventional tillage with residue incorporation; CT = Conventional tillage without residue incorporation.
     | Show Table
    DownLoad: CSV

    The soil characteristics such as plant available nutrients, microbial diversity and soil organic carbon transformation are dwindling on account of intensive cultivation under conventional tillage practices, therefore, demand relevant management approaches for soil and crop sustainability. Long-term application of organic amendments significantly increases soil properties by increasing plant available macro, micro, secondary nutrients and soil organic C, whereas the increase in organic C by INF application is, by and large, due to increment in organic C content within macro-aggregates and in the silt + clay compartments. The soil organic carbon and other plant available nutrients were significantly greater in conservation tillage systems as compared to conventional tillage (CT) that conservation approaches could be an exemplary promoter of soil productivity by modifying soil structure thereby protecting SOM and maintaining higher nutrient content. The mean concentration of different fractions of carbon MBN, PMN and soil respiration under integrated nutrient management treatments was higher as compared with to control. Therefore, the conjoint use of organic manures or retention of crop residues with inorganic fertilizers is imperative to reduce the depletion of SOC while sustaining crop production as a realistic alternative. Future research should focus mainly on the usage of organic and mineral fertilizers in conjunction with conservation tillage approaches to sustain the soil environment.

    The authors confirm contribution to the paper as follows: study conception and design: Dhaliwal SS, Shukla AK, Randhawa MK, Behera SK; data collection: Sanddep S, Dhaliwal SS, Behera SK; analysis and interpretation of results: Dhaliwal SS, Gagandeep Kaur, Behera SK; draft manuscript preparation: Dhaliwal SS, walia, Shukla AK, Toor AS, Behera SK, Randhawa MK. All authors reviewed the results and approved the final version of the manuscript.

    Data sharing not applicable to this article as no datasets were generated or analyzed during the current study.

    The support rendered by the Departemnt of Soil Science, PAU, Ludhiana, RVSKVV, Gwailor, CSSRI, Karnal, IISS, Bhopal, School of Organic Farming, PAU Ludhiana and Washington State University, USA is fully acknowledged .

  • The authors declare that they have no conflict of interest.

  • [1]

    Committee AD. 1998. An Agricultural Dictionary. 1458 pp. Beijing: China Agricultural Press

    [2]

    Xu J. 2006. Studies on comparison of chemical constituents of four species of Camellia Sect. Thea and the central nervous system activity of theaerine, a special purine alkaloid in C. assamica var. kucha. Thesis. Shenyang Pharmaceutical University, China

    [3]

    Ashihara H, Mizuno K, Yokota T, Crozier A. 2017. Xanthine alkaloids: occurrence, biosynthesis, and function in plants. Progress in the Chemistry of Organic Natural Products 105:1653

    doi: 10.1007/978-3-319-49712-9_1

    CrossRef   Google Scholar

    [4]

    Wan XC. 2003. Tea Biochemistry. Beijing: China Agricultural Press

    [5]

    Chen L, Zhou ZX. 2005. Variations of main quality components of tea genetic resources [Camellia sinensis (L. ) O. Kuntze] preserved in the China National Germplasm Tea Repository. Plant Foods for Human Nutrition 60:31−5

    doi: 10.1007/s11130-005-2540-1

    CrossRef   Google Scholar

    [6]

    Li J. 2013. A correlation study of caffeine contents with theobromine contents transcriptional expression and cSNP of key enzyme genes in tea plants. Thesis. Anhui Agricultural University, China

    [7]

    Zhou C, Jin J, Yao M, Chen L. 2011. Progress on purine alkaloids metabolism in tea and other plants. Journal of Tea Science 31:87−94

    doi: 10.13305/j.cnki.jts.2011.02.010

    CrossRef   Google Scholar

    [8]

    Zhang H, Ye C, Zhang R, Ma Y, Zeng P. 1988. A discovery of new tea resource — cocoa tea tree containing theobromine from China. Acta Scientiarum Naturalium Universitatis Sunyatseni 27:131−33

    Google Scholar

    [9]

    Teng J. 2018. The biochemical characteristics and N-methyltransferase of purine alkaloid pathway in Camellia gymnogyna Chang from Dayao Mountain. Thesis. South China Agricultural University, China

    [10]

    Ye C, Zheng X, Yuan C, Gao K, Shi X, Zhang H. 2001. A review of research on cocoa tea, a new resource of caffeine-free tea plant. Guangdong Agricultural Science 2001:12−15

    Google Scholar

    [11]

    Yan Z, Huang J, Wang D. 2020. Research progress in natural theobromine-enriched tea plants. Guangdong Agricultural Sciences 47:37−44

    Google Scholar

    [12]

    Qin D, Wang Q, Li H, Fang K, Jiang X, et al. 2021. Progress in research on Camellia kucha (Chang et Wang) Chang and its special constituent theacrine. Food Science 42:353−59

    Google Scholar

    [13]

    Shi X, Zheng X, Song X, Wang Y, Ye C. 2008. A new combination of Kucha. Acta Scientiarum Naturalium Universitatis Sunyatseni 47:129−30

    Google Scholar

    [14]

    Ye C, Lin Y, Su J, Song X, Zhang H. 1999. Purine alkaloids in Camellia assamica var. kucha Chang et Wang. Acta Scientiarum Naturalium Universitatis Sunyatseni 38:82−86

    Google Scholar

    [15]

    Cheng Y, Yan Z, Lu J, Ye C, Wang D. 2010. Isolation and preparation of theacrine by high-speed counter-current chromatography from Camellia assamica var. Kucha. Acta Scientiarum Naturalium Universitatis Sunyatseni 49:65−69

    Google Scholar

    [16]

    Ashihara H, Sano H, Crozier A. 2008. Caffeine and related purine alkaloids: biosynthesis, catabolism, function and genetic engineering. Phytochemistry 69:841−56

    doi: 10.1016/j.phytochem.2007.10.029

    CrossRef   Google Scholar

    [17]

    Anaya AL, Cruz-Ortega R, Waller GR. 2006. Metabolism and ecology of purine alkaloids. Frontiers in Bioscience-Landmark 11:2354−70

    doi: 10.2741/1975

    CrossRef   Google Scholar

    [18]

    Arnold SEJ, Dudenhöffer JH, Fountain MT, James KL, Hall DR, et al. 2021. Bumble bees show an induced preference for flowers when primed with caffeinated nectar and a target floral odor. Current Biology 31:4127−4131.E4

    doi: 10.1016/j.cub.2021.06.068

    CrossRef   Google Scholar

    [19]

    McLellan TM, Caldwell JA, Lieberman HR. 2016. A review of caffeine's effects on cognitive, physical and occupational performance. Neuroscience & Biobehavioral Reviews 71:294−312

    doi: 10.1016/j.neubiorev.2016.09.001

    CrossRef   Google Scholar

    [20]

    Ribeiro JA, Sebastião AM. 2010. Caffeine and adenosine. Journal of Alzheimers Disease 20:S3−S15

    doi: 10.3233/JAD-2010-1379

    CrossRef   Google Scholar

    [21]

    Cellai L, Carvalho K, Faivre E, Deleau A, Vieau D, et al. 2018. The adenosinergic signaling: a complex but promising therapeutic target for Alzheimer's disease. Frontiers in Neuroscience 12:520

    doi: 10.3389/fnins.2018.00520

    CrossRef   Google Scholar

    [22]

    Fiani B, Zhu L, Musch BL, Briceno S, Andel R, et al. 2021. The neurophysiology of caffeine as a central nervous system stimulant and the resultant effects on cognitive function. Cureus 13:e15032

    doi: 10.7759/cureus.15032

    CrossRef   Google Scholar

    [23]

    Arendash GW, Cao C. 2010. Caffeine and coffee as therapeutics against Alzheimer's disease. Journal of Alzheimers Disease 20:S117−S126

    doi: 10.3233/JAD-2010-091249

    CrossRef   Google Scholar

    [24]

    Arendash GW, Mori T, Cao CH, Mamcarz M, Runfeldt M, et al. 2009. Caffeine reverses cognitive impairment and decreases brain amyloid-β levels in aged Alzheimer's disease mice. Journal of Alzheimers Disease 17:661−80

    doi: 10.3233/JAD-2009-1087

    CrossRef   Google Scholar

    [25]

    Arendash GW, Schleif W, Rezai-Zadeh K, Jackson EK, Zacharia LC, et al. 2006. Caffeine protects Alzheimer's mice against cognitive impairment and reduces brain β-amyloid production. Neuroscience 142:941−52

    doi: 10.1016/j.neuroscience.2006.07.021

    CrossRef   Google Scholar

    [26]

    Huang Y, Liu Y, Dushenkov S, Ho CT, Huang M. 2009. Anti-obesity effects of epigallocatechin-3-gallate, orange peel extract, black tea extract, caffeine and their combinations in a mouse model. Journal of Functional Foods 1:304−10

    doi: 10.1016/j.jff.2009.06.002

    CrossRef   Google Scholar

    [27]

    Scott JR, Hassett AL, Brummett CM, Harris RE, Clauw DJ, et al. 2017. Caffeine as an opioid analgesic adjuvant in fibromyalgia. Journal of Pain Research 10:1801−9

    doi: 10.2147/JPR.S134421

    CrossRef   Google Scholar

    [28]

    Sharangi AB. 2009. Medicinal and therapeutic potentialities of tea (Camellia sinensis L. ) – A review. Food Research International 42:529−35

    doi: 10.1016/j.foodres.2009.01.007

    CrossRef   Google Scholar

    [29]

    van Dam RM. 2006. Coffee and type 2 diabetes: from beans to beta-cells. Nutrition, Metabolism & Cardiovascular Diseases 16:69−77

    doi: 10.1016/j.numecd.2005.10.003

    CrossRef   Google Scholar

    [30]

    Guessous I, Pruijm M, Ponte B, Ackermann D, Ehret G, et al. 2015. Associations of ambulatory blood pressure with urinary caffeine and caffeine metabolite excretions. Hypertension 65:691−96

    doi: 10.1161/HYPERTENSIONAHA.114.04512

    CrossRef   Google Scholar

    [31]

    Coleman WF. 2001. Chocolate: theobromine and caffeine. Journal of Chemical Education 81:1232

    doi: 10.1021/ed081p1232

    CrossRef   Google Scholar

    [32]

    Ried K, Sullivan TR, Fakler P, Frank OR, Stocks NP. 2017. Effect of cocoa on blood pressure. Cochrane Database of Systematic Reviews

    doi: 10.1002/14651858.CD008893.pub3

    CrossRef   Google Scholar

    [33]

    van den Bogaard B, Draijer R, Westerhof BE, van den Meiracker AH, van Montfrans GA, et al. 2010. Effects on peripheral and central blood pressure of cocoa with natural or high-dose theobromine: a randomized, double-blind crossover trial. Hypertension 56:839−46

    doi: 10.1161/HYPERTENSIONAHA.110.158139

    CrossRef   Google Scholar

    [34]

    Sarriá B, Martínez-López S, Sierra-Cinos JL, Garcia-Diz L, Goya L, et al. 2015. Effects of bioactive constituents in functional cocoa products on cardiovascular health in humans. Food Chemistry 174:214−18

    doi: 10.1016/j.foodchem.2014.11.004

    CrossRef   Google Scholar

    [35]

    Grases F, Rodriguez A, Costa-Bauza A. 2014. Theobromine inhibits uric acid crystallization. A potential application in the treatment of uric acid nephrolithiasis. PLoS One 9:e111184

    doi: 10.1371/journal.pone.0111184

    CrossRef   Google Scholar

    [36]

    Usmani OS, Belvisi MG, Patel HJ, Crispino N, Birrell MA, et al. 2005. Theobromine inhibits sensory nerve activation and cough. FASEB Journal 19:231−33

    doi: 10.1096/fj.04-1990fje

    CrossRef   Google Scholar

    [37]

    Tanaka E, Mitani T, Nakashima M, Yonemoto E, Fujii H, et al. 2022. Theobromine enhances the conversion of white adipocytes into beige adipocytes in a PPARγ activation-dependent manner. Journal of Nutritional Biochemistry 100:108898

    doi: 10.1016/j.jnutbio.2021.108898

    CrossRef   Google Scholar

    [38]

    Cova I, Leta V, Mariani C, Pantoni L, Pomati S. 2019. Exploring cocoa properties: is theobromine a cognitive modulator. Psychopharmacology 236:561−72

    doi: 10.1007/s00213-019-5172-0

    CrossRef   Google Scholar

    [39]

    Kargul B, Özcan M, Peker S, Nakamoto T, Simmons WB, et al. 2012. Evaluation of human enamel surfaces treated with theobromine: a pilot study. Oral Health & Preventive Dentistry 10:275−82

    Google Scholar

    [40]

    Camps-Bossacoma M, Pérez-Cano FJ, Franch A, Castell M. 2018. Theobromine is responsible for the effects of cocoa on the antibody immune status of rats. Journal of Nutrition 148:464−71

    doi: 10.1093/jn/nxx056

    CrossRef   Google Scholar

    [41]

    Sheng Y, Xiang J, Wang Z, Jin J, Wang Y, et al. 2020. Theacrine from Camellia kucha and its health beneficial effects. Frontiers in Nutrition 7:596823

    doi: 10.3389/fnut.2020.596823

    CrossRef   Google Scholar

    [42]

    Taylor L, Mumford P, Roberts M, Hayward S, Mullins J, et al. 2016. Safety of TeaCrine®, a non-habituating, naturally-occurring purine alkaloid over eight weeks of continuous use. Journal of the International Society of Sports Nutrition 13:2

    doi: 10.1186/s12970-016-0113-3

    CrossRef   Google Scholar

    [43]

    Li Y, Chen M, Wang C, Li X, Ouyang S, et al. 2015. Theacrine, a purine alkaloid derived from Camellia assamica var. kucha, ameliorates impairments in learning and memory caused by restraint-induced central fatigue. Journal of Functional Foods 16:472−83

    doi: 10.1016/j.jff.2015.05.003

    CrossRef   Google Scholar

    [44]

    Duan W, Liang L, Pan M, Lu D, Wang T, et al. 2020. Theacrine, a purine alkaloid from kucha, protects against Parkinson's disease through Sirt3 activation. Phytomedicine 77:153281

    doi: 10.1016/j.phymed.2020.153281

    CrossRef   Google Scholar

    [45]

    Ouyang S, Zhai Y, Wu Y, Xie G, Wang G, et al. 2021. Theacrine, a potent antidepressant purine alkaloid from a special Chinese tea, promotes adult hippocampal neurogenesis in stressed mice. Journal of Agricultural and Food Chemistry 69:7016−27

    doi: 10.1021/acs.jafc.1c01514

    CrossRef   Google Scholar

    [46]

    Barnes PJ. 2013. Theophylline. American Journal of Respiratory and Critical Care Medicine 188:901−6

    doi: 10.1164/rccm.201302-0388PP

    CrossRef   Google Scholar

    [47]

    Suzuki T, Takahashi E. 1976. Caffeine biosynthesis in Camellia sinensis. Phytochemistry 15:1235−39

    doi: 10.1016/0031-9422(76)85084-4

    CrossRef   Google Scholar

    [48]

    Suzuki T. 1972. The participation of S-adenosylmethionine in the biosynthesis of caffeine in the tea plant. FEBS Letters 24:18−20

    doi: 10.1016/0014-5793(72)80815-9

    CrossRef   Google Scholar

    [49]

    Koshiishi C, Kato A, Yama S, Crozier A, Ashihara H. 2001. A new caffeine biosynthetic pathway in tea leaves: utilisation of adenosine released from the S-adenosyl-L-methionine cycle. FEBS Letters 499:50−54

    doi: 10.1016/S0014-5793(01)02512-1

    CrossRef   Google Scholar

    [50]

    Xie G, He R, Kurihara H. 2010. Research progress on biosynthesis and catabolism of tea alkaloids. Chinese Journal of Natural Medicines 8:153−60

    doi: 10.3724/SP.J.1009.2010.00153

    CrossRef   Google Scholar

    [51]

    Zhang Y, Fu J, Zhou Q, Li F, Shen Y, et al. 2022. Metabolite profiling and transcriptome analysis revealed the conserved transcriptional regulation mechanism of caffeine biosynthesis in tea and coffee plants. Journal of Agricultural and Food Chemistry 70:3239−51

    doi: 10.1021/acs.jafc.1c06886

    CrossRef   Google Scholar

    [52]

    Li P, Ye Z, Fu J, Xu Y, Shen Y, et al. 2022. CsMYB184 regulates caffeine biosynthesis in tea plants. Plant Biotechnology Journal 20:1012−14

    doi: 10.1111/pbi.13814

    CrossRef   Google Scholar

    [53]

    Kato M, Mizuno K, Crozier A, Fujimura T, Ashihara H. 2000. Caffeine synthase gene from tea leaves. Nature 406:956−7

    doi: 10.1038/35023072

    CrossRef   Google Scholar

    [54]

    Jin J, Yao M, Ma C, Ma J, Chen L. 2014. Cloning and sequence analysis of the N-methyltransferase gene family involving in caffeine biosynthesis of tea plant. Journal of Tea Science 34:188−94

    doi: 10.13305/j.cnki.jts.2014.02.015

    CrossRef   Google Scholar

    [55]

    Jin J, Yao M, Ma C, Ma J, Chen L. 2016. Natural allelic variations of TCS1 play a crucial role in caffeine biosynthesis of tea plant and its related species. Plant Physiology and Biochemistry 100:18−26

    doi: 10.1016/j.plaphy.2015.12.020

    CrossRef   Google Scholar

    [56]

    Liu Y, Jin J, Yao M, Chen L. 2019. Screening, cloning and functional research of the rare allelic variation of caffeine synthase gene (TCS1g) in tea plants. Scientia Agricultura Sinica 52:1772−83

    Google Scholar

    [57]

    Jin J, Yao M, Ma C, Ma J, Chen L. 2016. Association mapping of caffeine content with TCS1 in tea plant and its related species. Plant Physiology and Biochemistry 105:251−59

    doi: 10.1016/j.plaphy.2016.04.032

    CrossRef   Google Scholar

    [58]

    Ma J, Jin J, Yao M, Ma C, Xu Y, et al. 2018. Quantitative trait loci mapping for theobromine and caffeine contents in tea plant (Camellia sinensis). Journal of Agricultural Food Chemistry 66:13321−27

    doi: 10.1021/acs.jafc.8b05355

    CrossRef   Google Scholar

    [59]

    Zheng X, Ye C, Kato M, Crozier A, Ashihara H. 2002. Theacrine (1,3,7,9-tetramethyluric acid) synthesis in leaves of a Chinese tea, kucha (Camellia assamica var. kucha). Phytochemistry 60:129−34

    doi: 10.1016/S0031-9422(02)00086-9

    CrossRef   Google Scholar

    [60]

    Wang S, Chen J, Ma J, Jin J, Chen L, Yao M. 2020. Novel insight into theacrine metabolism revealed by transcriptome analysis in bitter tea (Kucha, Camellia sinensis). Scientific Reports 10:6286

    doi: 10.1038/s41598-020-62859-2

    CrossRef   Google Scholar

    [61]

    Zhang Y, Li Y, Wang Y, Tan L, Cao Z, et al. 2020. Identification and characterization of N9-methyltransferase involved in converting caffeine into non-stimulatory theacrine in tea. Nature Communications 11:1473

    doi: 10.1038/s41467-020-15324-7

    CrossRef   Google Scholar

    [62]

    Kalberer P. 1965. Breakdown of caffeine in the leaves of Coffea arabica L. Nature 205:597−98

    doi: 10.1038/205597a0

    CrossRef   Google Scholar

    [63]

    Ashihara H, Gillies FM, Crozier A. 1997. Metabolism of caffeine and related purine alkaloids in leaves of tea (Camellia sinensis L). Plant and Cell Physiology 38:413−19

    doi: 10.1093/oxfordjournals.pcp.a029184

    CrossRef   Google Scholar

    [64]

    Ashihara H, Kato M, Crozier A. 2011. Distribution, biosynthesis and catabolism of methylxanthines in plants. In Methylxanthines, ed. Fredholm BB. vol 200. Springer, Berlin, Heidelberg. pp. 11−31 https://doi.org/10.1007/978-3-642-13443-2_2

    [65]

    Chen J, Ma C, Chen L. 2019. 40 years of research on tea germplasm resources in China. China Tea 41:1−5+46

    Google Scholar

    [66]

    Wang X, Chen L, Yang Y. 2011. Establishment of core collection for Chinese tea germplasm based on cultivated region grouping and phenotypic data. Frontiers of Agriculture in China 5:344

    doi: 10.1007/s11703-011-1097-z

    CrossRef   Google Scholar

    [67]

    Jin J, Zhou C, Ma C, Yao M, Ma J, et al. 2014. Identification on purine alkaloids of representative tea germplasms in China. Journal of Plant Genetic Resources 15:279−85

    Google Scholar

    [68]

    Song W, Liu B, Yi B, Jiang H, Ma L, et al. 2011. Identification, evaluation and screening on elite and rare tea germplasms from Yunnan Province. Journal of Tea Science 31:45−52

    doi: 10.13305/j.cnki.jts.2011.01.008

    CrossRef   Google Scholar

    [69]

    Liu Y, Pang D, Jiang H, Tian Y, Li Y, et al. 2021. Biochemical component analysis and specific resource selection of 66 accessions of tea germplasms in Yunnan. Journal of Southern Agriculture 52:693−99

    Google Scholar

    [70]

    Wang Z, Chen L. 2011. Japanese tea cultivars and breeding techniques. China Tea 33:10−13

    Google Scholar

    [71]

    Takeda Y. 1994. Differences in caffeine and tannin contents between tea cultivars, and application to tea breeding. Japan Agricultural Research Quarterly 28:117−23

    Google Scholar

    [72]

    Ogino A, Tanaka J, Taniguchi F, Yamamoto MP, Yamada K. 2009. Detection and characterization of caffeine-less tea plants originated from interspecific hybridization. Breeding Science 59:277−83

    doi: 10.1270/jsbbs.59.277

    CrossRef   Google Scholar

    [73]

    Hyun DY, Gi GY, Sebastin R, Cho GT, Kim SH, et al. 2020. Utilization of phytochemical and molecular diversity to develop a target-oriented core collection in tea germplasm. Agronomy-Basel 10:1667

    doi: 10.3390/agronomy10111667

    CrossRef   Google Scholar

    [74]

    Tang Y, Song W, Yi B, Ji P, Wang P, et al. 2010. Identification and evaluation on low caffeine content in tea germplasm. Southwest China Journal of Agricultural Sciences 23:1051−54

    doi: 10.16213/j.cnki.scjas.2010.04.032

    CrossRef   Google Scholar

    [75]

    Zhang K, Ding Y, Yang J. 2013. Comparative analysis of catechin and caffeine content of wild tea plant in Sichuan-Chongqing region. Chinese Journal of Applied Environmental Biology 19:379−82

    doi: 10.3724/SP.J.1145.2013.00379

    CrossRef   Google Scholar

    [76]

    Teng J, Zeng Z, Huang Y. 2018. Compositon characteristics of purine alkaloids and biochemical components of Camellia gymnogyna. Guihaia 38: 568−76

    [77]

    Jin J, Chai Y, Liu Y, Zhang J, Yao M, et al. 2018. Hongyacha, a naturally caffeine-free tea plant from Fujian, China. Journal of Agricultural Food Chemistry 66:11311−19

    doi: 10.1021/acs.jafc.8b03433

    CrossRef   Google Scholar

    [78]

    Jin J, Jiang C, Yao M, Chen L. 2020. Baiyacha, a wild tea plant naturally occurring high contents of theacrine and 3''-methyl-epigallocatechin gallate from Fujian, China. Scientific Reports 10:9715

    doi: 10.1038/s41598-020-66808-x

    CrossRef   Google Scholar

    [79]

    Mohanpuria P, Kumar V, Ahuja PS, Yadav SK. 2011. Producing low-caffeine tea through post-transcriptional silencing of caffeine synthase mRNA. Plant Molecular Biology 76:523−34

    doi: 10.1007/s11103-011-9785-x

    CrossRef   Google Scholar

    [80]

    Ogino A, Taniguchi F, Yoshida K, Matsumoto S, Fukuoka H, et al. 2019. A new DNA marker CafLess-TCS1 for selection of caffeine-less tea plants. Breeding Science 69:393−400

    doi: 10.1270/jsbbs.18161

    CrossRef   Google Scholar

    [81]

    Li H, Fang K, Qin D, Jiang X, Wu H. 2021. Comparative transcriptome analysis reveals putative genes responsible for high theacrine content in Kucha (Camellia kucha (Chang et Wang) Chang). Tropical Plant Biology 14:82−92

    doi: 10.1007/s12042-020-09280-1

    CrossRef   Google Scholar

  • Cite this article

    Zhang S, Jin J, Chen J, Ercisli S, Chen L. 2022. Purine alkaloids in tea plants: component, biosynthetic mechanism and genetic variation. Beverage Plant Research 2:13 doi: 10.48130/BPR-2022-0013
    Zhang S, Jin J, Chen J, Ercisli S, Chen L. 2022. Purine alkaloids in tea plants: component, biosynthetic mechanism and genetic variation. Beverage Plant Research 2:13 doi: 10.48130/BPR-2022-0013

Figures(4)  /  Tables(1)

Article Metrics

Article views(12186) PDF downloads(1834)

REVIEW   Open Access    

Purine alkaloids in tea plants: component, biosynthetic mechanism and genetic variation

Beverage Plant Research  2 Article number: 13  (2022)  |  Cite this article

Abstract: The purine alkaloids, including caffeine, theobromine, and theacrine, are one of the most important quality and functional components of tea plants and commercial teas. In this paper, we review the component, biosynthetic mechanism and genetic variation of purine alkaloids in tea plants. The content of caffeine and theobromine in 403 accessions Chinese tea germplasms core collection preserved in the National Germplasm Hangzhou Tea Repository were analyzed using High Performance Liquid Chromatography (HPLC). The purine alkaloid profiles of different tea varieties, germplasm types, geographical origin, seasons, were highlighted. Some naturally low caffeine or caffeine-free, high theobromine or high theacrine germplasms were identified and the possible biosynthetic mechanism of hypernormal purine alkaloid content in tea plants were partially revealed. Some Cleaved Amplified Polymorphic Sequences (CAPS) DNA markers were developed for the identification of purine alkaloid content. The potential application of genetic engineering and DNA markers developed based on the low caffeine TCS1 (tea caffeine synthesis gene) alleles for marker assisted selection (MAS), and cocoa tea and kucha in low caffeine/high theacrine tea cultivar breeding programs were also reviewed.

    • Alkaloids are heterocyclic nitrogen-containing compounds produced by higher plants and some microorganisms. They usually have remarkable biological activity and pharmacological effects, and are widely distributed in more than 2,000 kinds of plants in more than 100 families[1]. Tea, coffee and cocoa are the three most popular non-alcoholic beverages in the world. They all contain purine alkaloids such as caffeine, and theobromine. Some tea plants also contain theacrine, another purine alkaloid with a different function. Purine alkaloids not only affect the taste and quality of tea, but also have health benefits. The content profiles of main purine alkaloids in Chinese tea germplasm, the molecular mechanism of purine alkaloid metabolism in some hypernormal tea germplasms, the potential of DNA markers in marker-assisted selection and genetic engineering in the low caffeine/high theacrine tea breeding were comprehensively reviewed. In order to better understand the content profile of purine alkaloids in tea germplasms, the function of key genes in the purine alkaloid biosynthesis pathway, as well as providing a roadmap for special tea cultivar's genetic improvement in the future.

    • The alkaloids in tea plants are mainly purine alkaloids, with a small amount of pyrimidine base. Purine alkaloids are the secondary metabolite of purine nucleotide[2], including methylxanthine and methyluric acid. Their chemical structures are based on the skeleton of xanthine and uric acid[3], differing by the number and position of methyl groups on the purine ring. The three main purine alkaloids in tea plants are caffeine, theobromine and theacrine.

    • 1,3,7-trimethylxanthine, its chemical formula is C8H10N4O2 (Fig. 1c). Caffeine is the most abundant purine alkaloid in tea, generally accounting for 2%−5% of the dry matter content[4]. It is one of the most important quality and functional components in tea. Chen & Zhou[5] analyzed the caffeine content of 596 accession tea germplasms preserved in China National Germplasm Hangzhou Tea Repository (CNGTR), which basically represent the genetic diversity of Chinese tea plants. The caffeine content varied from 1.2% to 5.9%, averaging 4.2%.
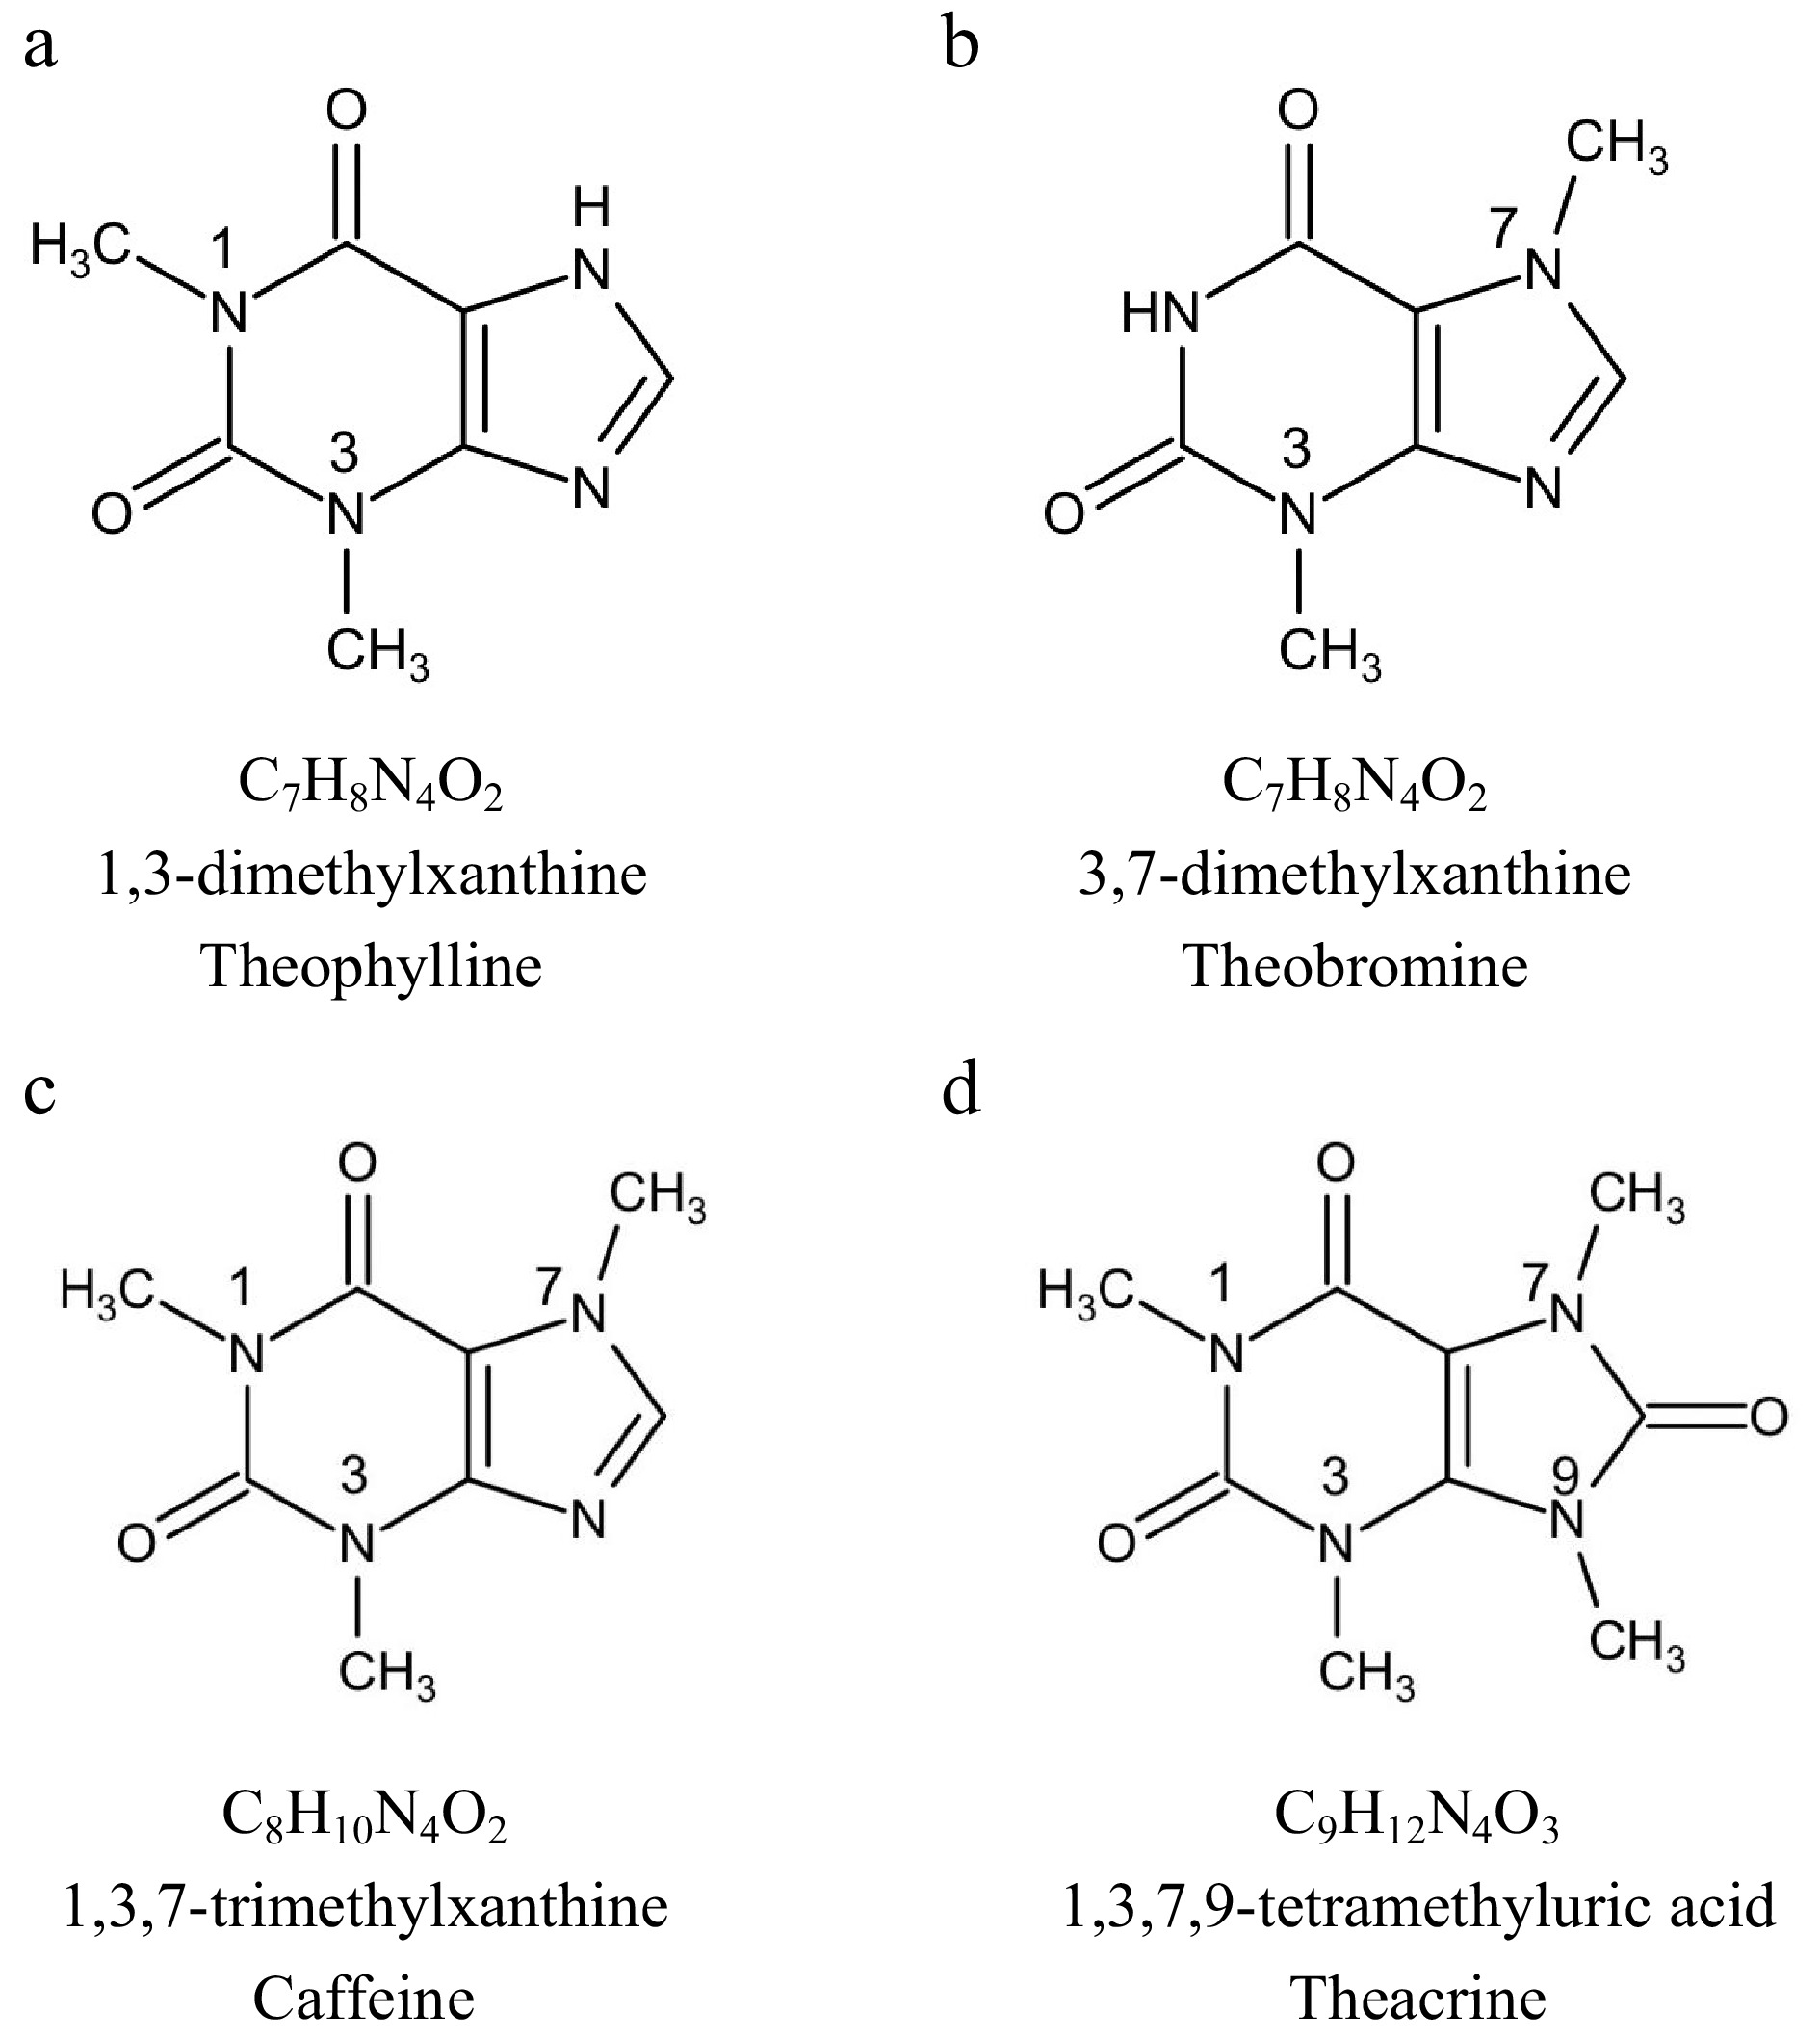
      Figure 1. 

      The chemical structure of the main purine alkaloids in tea plants.

    • 3,7-dimethylxanthine, the chemical formula is C7H8N4O2 (Fig. 1b). Theobromine, a precursor for caffeine synthesis, lacks a methyl group at the N-1 position compared to caffeine[6]. Theobromine is the main alkaloid of the cocoa plant. Generally, theobromine content is less in tea plants, and the theobromine content in young leaves is 0.05%−0.80%[7]. Among the tea plants in Sect. Thea (L.) Dyer Camellia L., C. ptilophylla Chang discovered in the 1980s is a new tea plant resource with high theobromine (4.7%) and no caffeine[8]. Additionally, C. gymnogyna Chang[9], C. irrawadiensis P. K. Barua, C. crassicolumna Chang, C. purpurea Chang et Chen[10], Hongyacha[11] are all naturally rich in theobromine, no or low caffeine tea genetic resources, respectively.

    • 1,3,7,9-tetramethyluric acid, the chemical formula is C9H12N4O3 (Fig. 1d), the structure is similar to caffeine, the difference is that the C8 position is increased by a carbonyl group and the N9 position is increased by a methyl group[12]. Theacrine is a special purine alkaloid contained in Kucha, a special tasting bitter tea plant. Kucha once was classified into C. kucha (Chang et Wang) Chang[13], C. sinensis var. kucha and C. assamica var. kucha, but actually it has no significant morphological difference with C. sinensis. Ye et al. isolated and identified a high content of 1,3,7,9-tetramethyluric acid (1.29%) in the young shoots of Kucha for the first time, and they found a new distribution pattern of purine alkaloids in tea plants[14]. The theacrine content in the tender shoots with 'two and a bud' of Kucha was 1.3%−3.4%. The pure theacrine could be obtained from Kucha leaf by high-speed countercurrent chromatography[15].

      In addition, the purine alkaloids found in tea also include theophylline (1,3-dimethylxanthine) (Fig. 1a), which is the isomer of theobromine, and the content in tea is much lower, generally about 0.05%. It occurs naturally in trace amounts in coffee and cocoa (Table 1).

      Table 1.  Purine alkaloids in tea, coffee and cacao (%).

      Purine alkaloidsTeaCoffeeCacao
      ArabicaRobusta
      Caffeine2.0−5.01−1.52−2.71.5
      Theobromine0.06−1.0TraceTrace1.8
      Theacrine0.5−3.6 (rare)///
      Theophylline0.05TraceTraceTrace
    • Purine alkaloids not only affect the flavor of tea, but also have important biological activities and physiological functions. Although several major purine alkaloids in tea have similar structures, their functions are quite different.

    • At present, the role of purine alkaloids in plants has not been fully determined, there are two hypotheses to explain the physiological role of caffeine in plants, the 'chemical defense' and 'allelopathic function' theories[16]. The 'chemical defense' proposed that high concentrations of caffeine in young tissues and fruits of Coffea arabica and Camellia sinensis have a defensive effect, protecting young shoots from pathogens and reducing herbivore feeding. And the 'allelopathic theory' proposes that the release of caffeine in the seed coat and fallen leaves into the soil can inhibit the growth of competitive plants and regulate the plant spacing[17]. Caffeine in plants has long been thought to have a defensive effect, acting as a natural pesticide and antifeedant. But a recent study found that caffeine, which is naturally present in nectar of plants such as Citrus and Coffea, has no repellent effect on bees. Instead, it may affect the behavior of pollinators to enhance pollination and protect the normal reproduction of plants[18].

      Caffeine occurs naturally in many foods and beverages, and most caffeine is consumed as coffee and tea. In long-term consumption, it has been found that caffeine has significant effects on cognitive, physical and ocupational performance[19]. Current research suggests that low to moderate (approximately 40−300 mg or ~0.5−4.0 mg kg−1) doses of caffeine improve cognition, which is mainly manifested in improving alertness, learning and memory[19]. Caffeine is structurally similar to adenosine, and exerts central nervous system (CNS) effects by antagonizing adenosine receptors (ARs)[20], affecting brain function. Epidemiological studies have shown that caffeine, as a non-selective adenosine receptors antagonist[21], has the potential to treat cognitive disorders, including Alzheimer's disease, Parkinson's disease, depression, and schizophrenia[20]. It has been confirmed in many studies involving animals and humans[22]. By studying a transgenic mouse model for Alzheimer's disease (AD), it was found that caffeine can rapidly reduce the level of abnormal protein (amyloid-β; Aβ) in the plasma of AD mice and humans (the core of AD pathogenesis)[23], and reverse AD-induced cognitive impairment in aged mice[24]. Decreased levels of Aβ protein may be the mechanism of action of caffeine to improve cognition[25]. In addition, studies have shown that caffeine also has pharmacological effects such as anti-obesity[26], analgesia[27], diuresis[28], reducing the risk of type II diabetes[29] and cardiovascular mortality[30].

      Low doses of caffeine had positive effects on cognition, while higher doses improved exercise performance. Doses > 200 mg (~3 mg kg−1) of caffeine showed ergogenic properties on endurance, muscle strength, and high-intensity exercise[19]. Special occupational groups, especially athletes, should control the time and dosage of caffeine intake.

    • Compared to caffeine, theobromine's effects are not well studied. Caffeine is a central nervous system stimulant, while theobromine is a smooth muscle stimulant, promoting vasodilation[31]. The hypotensive effect of cocoa are well established[32], theobromine seems to be partially responsible for this effect. A randomized, double-blind crossover trial demonstrated that high-dose theobromine lowers central systolic blood pressure and is beneficial for cardiovascular health in humans[33]. In addition, theobromine may have hypoglycemic effects[34]. In many cases, theobromine is considered a natural compound with therapeutic properties. An in vitro study have shown that theobromine inhibits uric acid crystallization and has high clinical potential in the treatment of uric acid nephrolithiasis[35]. Usmani et al. demonstrated for the first time that theobromine suppresses cough without CNS side effects. It can be used clinically to treat acute and chronic cough[36]. Similar to caffeine, theobromine has potential obesity therapeutic[37] and neuroprotective effects[38]. Notably, theobromine is less stimulatory to the CNS and may have a higher potential than caffeine. In addition, theobromine also has special effects of protecting tooth enamel[39], immune regulation[40], and anti-inflammation.

    • Sheng et al.[41] comprehensively reviewed the beneficial health effects of theacrine, including antioxidant effect, anti-inflammatory effect, reducing fatigue effects, improving cognitive effect and hypnotic effect. Theacrine has been identified as non-toxic by toxicological tests, and a clinical study in which subjects took theacrine supplementation for 8 weeks also concluded that theacrine is safe for humans[42]. Its potential medicinal functions have been studied in recent years. A behavioral test showed that oral theacrine significantly reversed central fatigue-induced learning and memory impairments[43]. There are many studies proving that theacrine can prevent Parkinson's disease by directly activating the Sirt3 signaling pathway, restoring mitochondrial function and inhibiting the apoptosis of dopaminergic neurons[44]. Unlike caffeine, theacrine does not stimulate central excitation and is now considered a new antidepressant purine alkaloid drug[45].

    • Theophylline occurs naturally in tea and cocoa beans. Although the content is extremely low, it has a high medicinal value and is an important alkaloid in tea plants. In 1985, theophylline was first extracted from tea and chemically synthesized. It was found that theophylline has diuretic and bronchodilating effects. Recent studies have shown that low-dose theophylline helps treat asthma and chronic obstructive pulmonary disease (COPD), with multiple anti-inflammatory effects. Clinically, it can be administered intravenously or orally. It is worth noting that high-dose theophylline has side effects, such as headache, vomiting and arrhythmia, clinical use should pay attention to the recommended dose[46].

    • Purine alkaloids are secondary metabolites of purine nucleotides. Studies have shown that adenine nucleotide are the most effective presumed precursors in caffeine biosynthesis[47]. Tea alkaloids are methylxanthine derivatives, xanthine is considered to be the most important precursor in caffeine synthesis, and SAM (S-adenosyl methionine) is an active methyl donor in caffeine biosynthesis[48]. Koshiishi et al.[49] proposed the main pathway for SAM to xanthosine (SAM → SAH (S-adenosyl-homocysteine) → adenosine → adenine → AMP → IMP → XMP → xanthosine), and believed that the purine ring in caffeine also came from SAM. In addition to the SAM pathway, xanthine can also be synthesized through the AMP pathway, the GMP pathway and the de novo pathway. Currently, it is believed that tea plants in Sect. Thea (L.) Dyer Camellia L. mainly synthesize xanthine through the SAM pathway and the AMP supplementation pathway (adenosine → AMP), while Coffea arabica mainly synthesize xanthine through the AMP pathway[50] (Fig. 2).
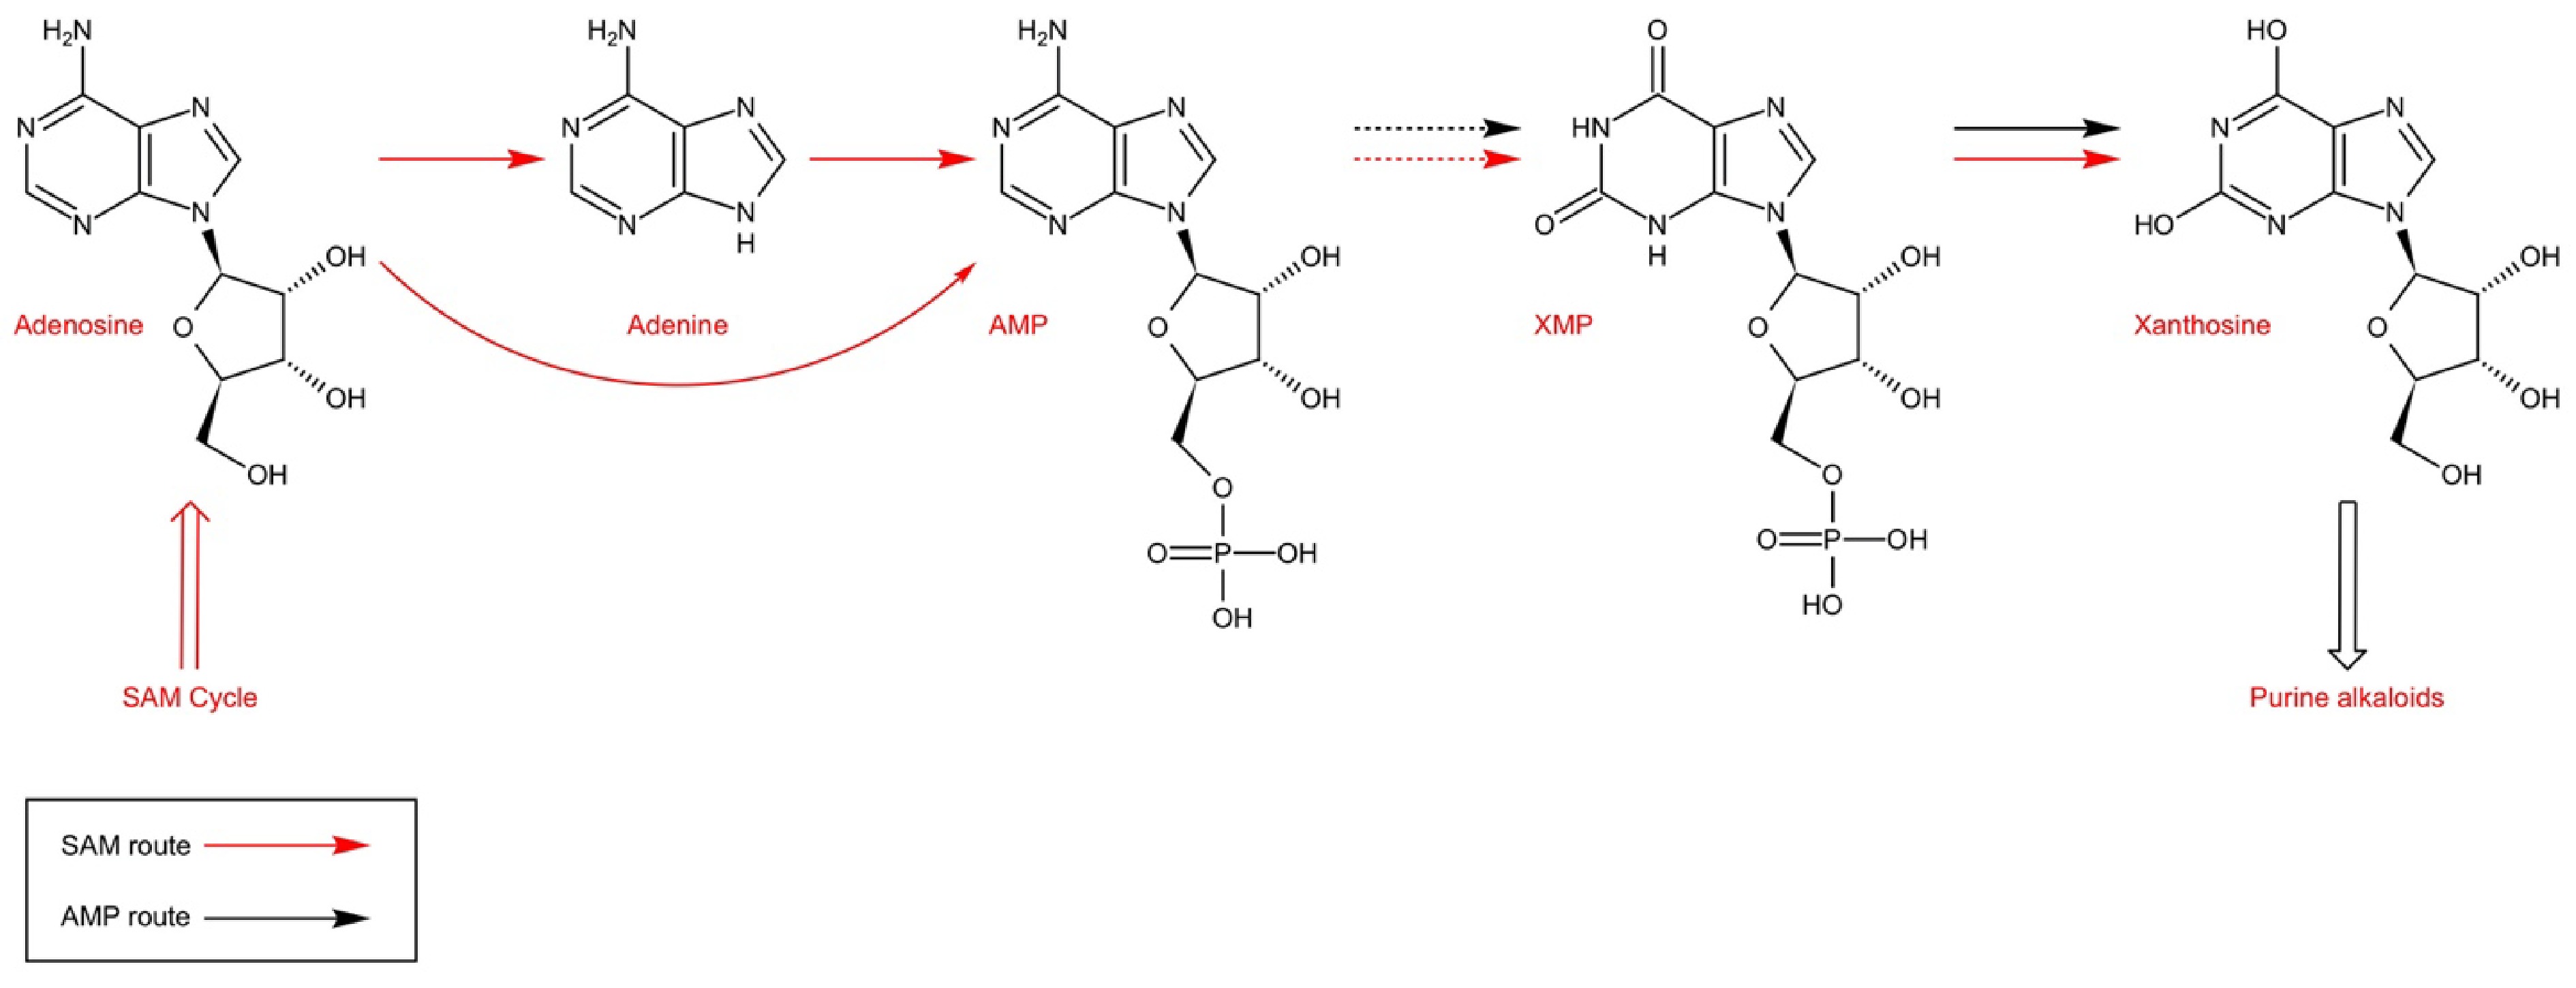
      Figure 2. 

      Purine alkaloids are synthesized from xanthosine which is produced via two main routes in tea and coffee: SAM route and AMP route (adapted from Ashihara et al.[16]).

      Ashihara et al.[16] reviewed the main caffeine biosynthetic pathway, which is the four-step reaction of caffeine synthesis from xanthine, including one nucleosidase step and three methylation steps: xanthosine → 7-methylxanthosine → 7-methylxanthine → theobromine → caffeine (Fig. 3) . Among them, the tea caffeine synthase (TCS), which catalyzes N-3 and N-1 methylation, is considered to be the most critical enzyme in the caffeine biosynthetic pathway of tea plants.
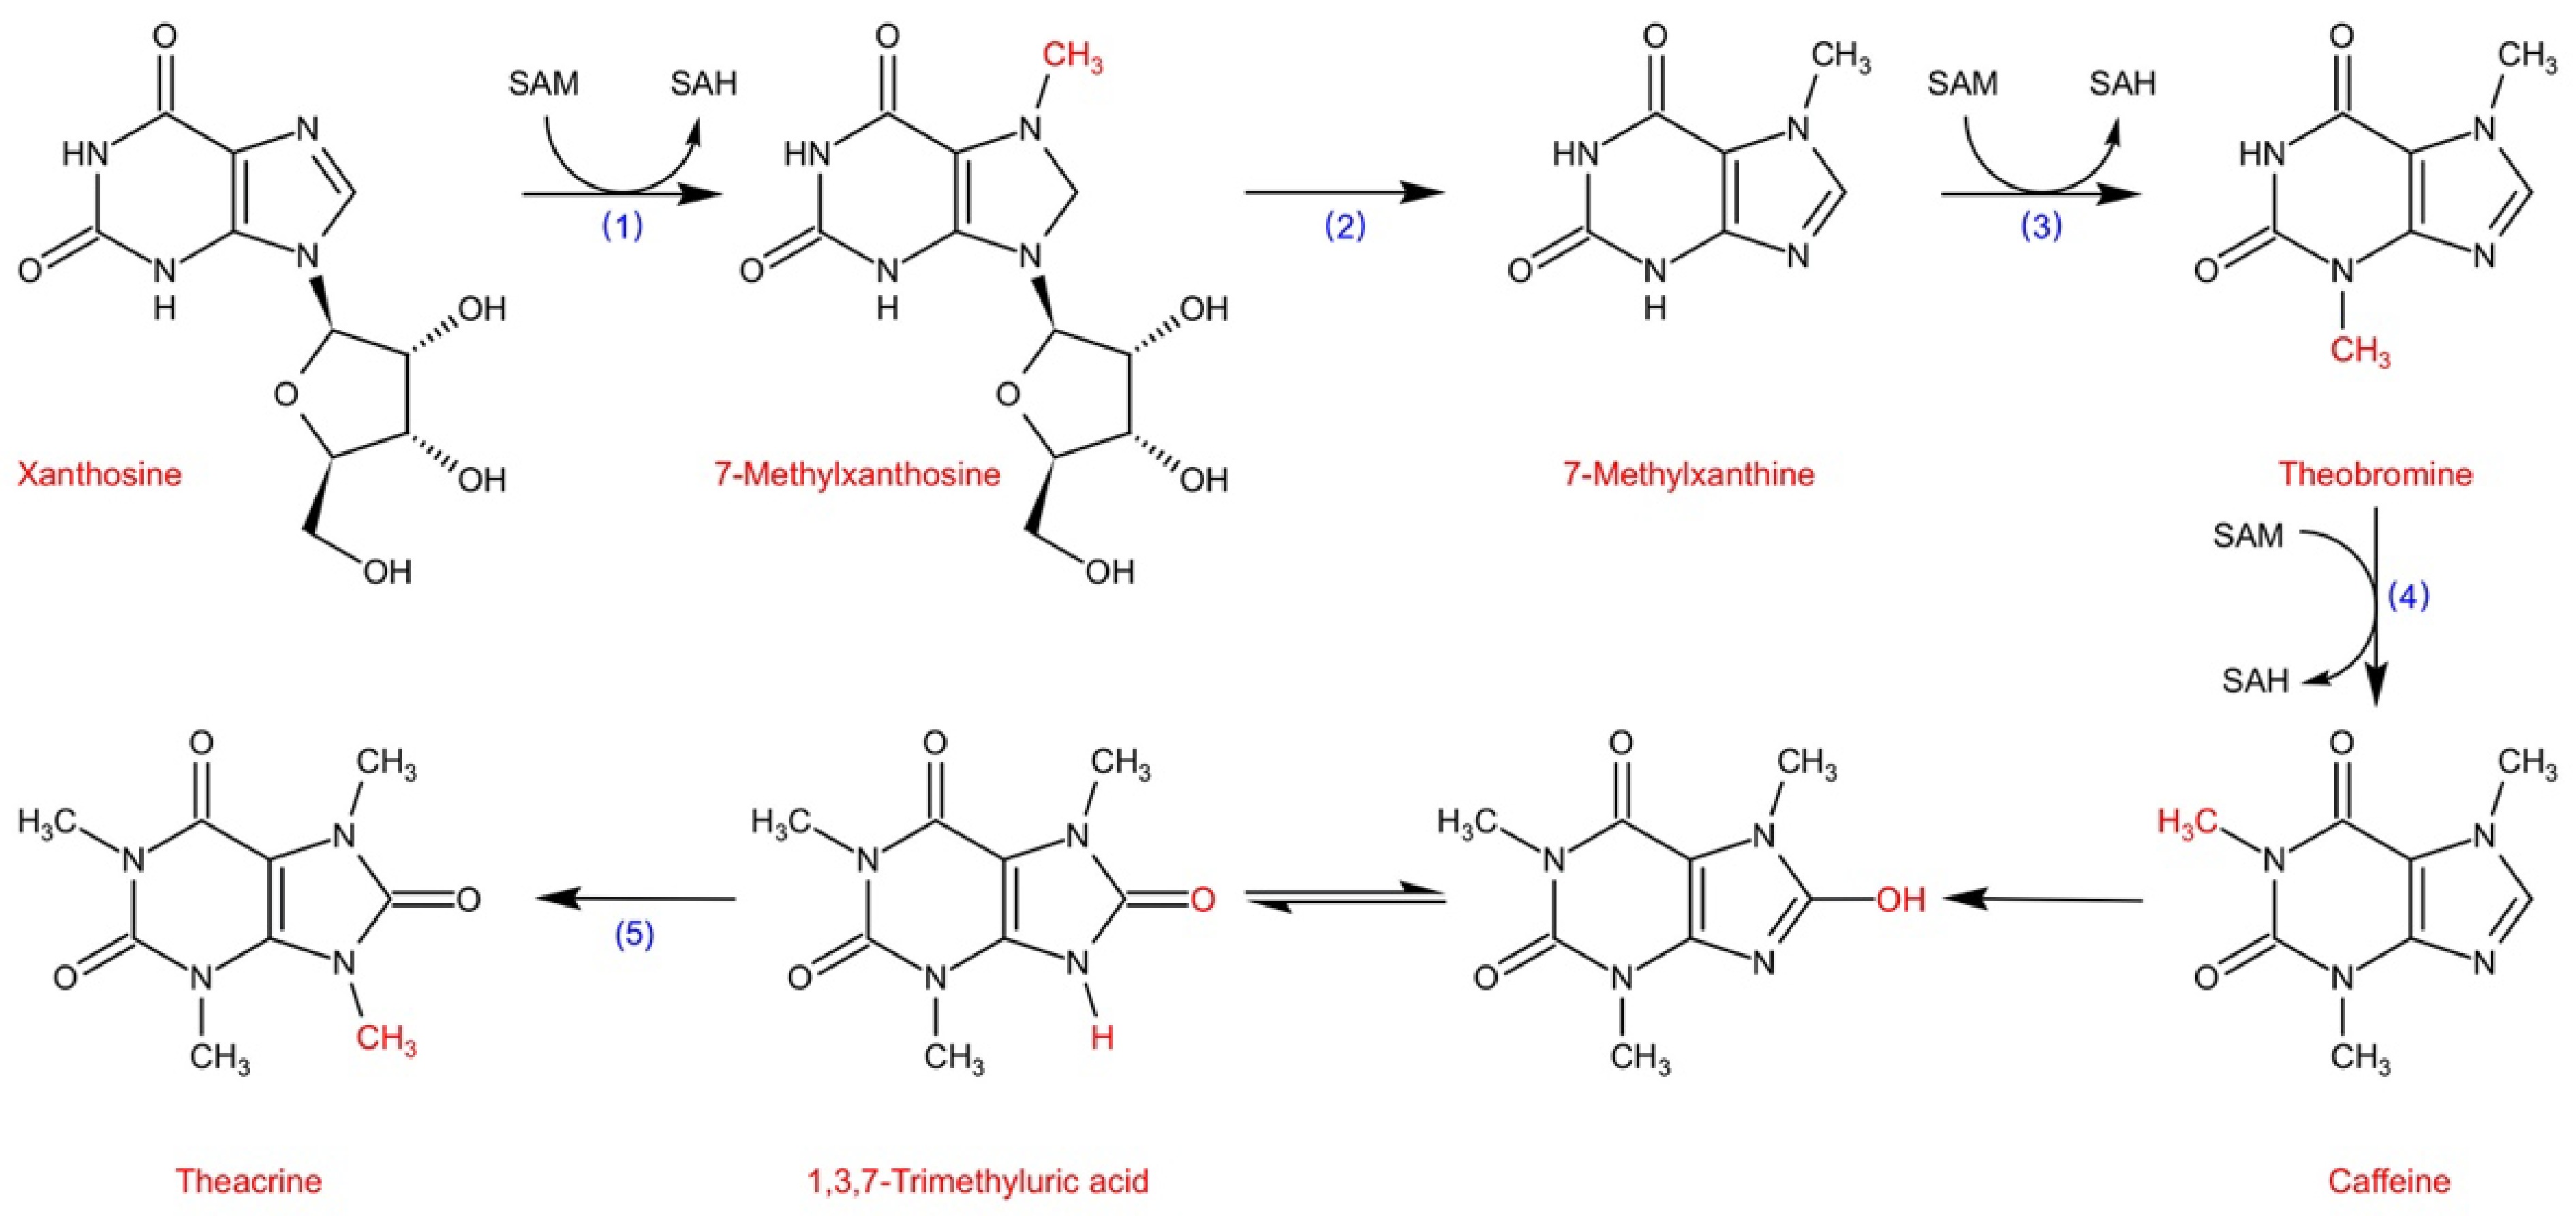
      Figure 3. 

      The main purine alkaloids biosynthesis pathway in tea plants (Adapted from Ashihara et al.[16]). (1) xanthosine 7-N-methyltransferase; (2) N-methylnucleosidase; (3) monomethylxanthine N-methyltransferase; (4) 3,7-dimethylxanthine N-methyltransferase TCS1; (5) 1,3,7-trimethyluric acid N-methyltransferase (CkTcS).

      Although the caffeine biosynthetic pathway has been extensively studied in tea plants and other caffeine-rich plants, the regulatory mechanism of caffeine synthesis remains unclear. In a recent study, metabolite profiling and transcriptome profiling provided a comprehensive understanding of the transcriptional regulatory mechanisms of caffeine biosynthesis and metabolism in tea and coffee. The analysis concluded that the regulatory mechanisms of caffeine biosynthesis in tea and coffee plants are partially conserved[51]. In addition, transcription factors related to the caffeine biosynthesis pathway were identified, and it was determined that CsMYB184 positively regulates caffeine biosynthesis in tea plants[52].

    • In 2000, the tea caffeine synthase (TCS) was first cloned[53], it belongs to N-methyltransferase (NMT), and studies have shown that high caffeine biosynthesis in tea plant shoots mainly depends on the expression of TCS1 gene[16]. The full-length DNA genome of 6 NMTs from 'Baiye 1' (TCS1-TCS6) were cloned and found that TCS1 has the activity of catalyzing N-3 and N-1 methylation, while TCS2 does not have N-methylation transferase activity; the expression levels of TCS3-TCS5 are very low in tea shoots, and TCS6 is a pseudogene. It is believed that in the NMT gene family, the function of TCS1 is the most important for the synthesis and regulation of caffeine[54]. Further research found that TCS1 has seven types of allelic variations, namely TCS1a-TCS1g, and these genes were all composed by four exons and three introns through analysis of gene structure. Among them, TCS1a is the predominant allele, and TCS1b-g is the rare allele, which only appears in a few wild germplasms. The natural variation of TCS1 change the transcription level. TCS1 alleles with low transcription levels or its encoded proteins with only TS activities (TCS1b, TCS1c, TCS1g), and TCS1 alleles with high transcription levels or its encoded proteins with both TS and CS activities (TCS1a, TCS1d, TCS1e, TCS1f), suggesting that the allelic variation of TCS1 plays an important role in caffeine biosynthesis[55]. The TCS1a expression protein present in regular tea plant resources converts theobromine accumulated in tea plants into caffeine, so caffeine becomes the purine alkaloid with the highest content in regular tea plants; and the allelic variation with only TS activity is an excellent allelic variation that can be exploited during the breeding of low-caffeine tea cultivars[55,56].

      In addition, the 225th and 269th amino acids of TCS1 were identified as key active sites by site-directed mutagenesis. The 225th amino acid residue was arginine or histidine, which determined whether TCS1 had caffeine synthase activity[55]. By resequencing the TCS1 locus of 44 accessions tea genetic resources, 87 SNPs were identified. And two polymorphic sites, SNP4318 and SNP6252, were selected to develop CAPS markers[57]. Through association analysis, SNP4318 was determined to be associated with caffeine content in four environments, explaining 4.0%–7.7% of the phenotypic variance[57].

    • A F1 pseudo-testcross population which was generated by crossing between C. sinensis var. sinensis 'Yingshuang' and C. sinensis var. pubilimba 'Beiyue Danzhu' was used for purine alkaloids QTL (quantitative trait locus) analysis[58]. Ten QTLs were identified for four measurement years in total: 1 controlled caffeine content (CAF), 4 controlled theobromine content (TBR), 2 controlled sum of caffeine and theobromine (SCT), 3 controlled caffeine-to-theobromine ratio (CTR)[58]. The major QTL that controls caffeine content (qCAF1) was mapped onto Linkage Group (LG) 01, explaining an average of 20.1% of the phenotypic variance, helping to elucidate the molecular mechanisms of theobromine and caffeine accumulation for genetic improvement of tea plants.

    • Theacrine has special health-care effects, and it has, in recent years, gradually become well known to the public, but the molecular mechanism of its metabolism is still unclear. Zheng et al.[59] used the 14C isotope tracer method to demonstrate for the first time that theacrine in Kucha leaves is synthesized from caffeine, which may produce the intermediate 1,3,7-trimethyluric acid and is further methylated to generate 1,3,7,9-tetramethyluric acid. Wang et al.[60] analyzed the transcriptome of Kucha and found that the NMT encoded by TEA024443 may catalyze N-9 methylation. Zhang et al.[61] identified the theacrine synthase (CkTcS) from Kucha, which has N9-methyltransferase activity and can only catalyze the methylation of 1,3,7-trimethyluric acid to form theacrine, confirming that C8 oxidation takes place prior to N9-methylation, but currently the mechanism of C8 oxidation is unclear (Fig. 2). The above findings are helpful to analyze the synthesis mechanism of theacrine and provide new approaches for the production of decaffeinated beverages.

    • Kalberer[62] first reported the catabolism of caffeine in Coffea arabica using 14C-labeled tracer experiment, and believed that caffeine could be completely degraded in coffee leaves. Ashihara et al.[63] reported the catabolism of purine alkaloids in Camellia sinensis, and indicated that the catabolism of caffeine in tea leaves is very slow, which is the main reason for the accumulation of caffeine in tea plants. The conversion of caffeine to theophylline is the major rate-limiting step of caffeine catabolism. At present, it is believed that caffeine catabolism begins with its conversion to theophylline catalyzed by N7-demethylase, and demonstrate that the major catabolic pathway is caffeine → theophylline → 3-methylxanthine → xanthine, and xanthine is further degraded by the conventional purine catabolism pathway to CO2 and NH3[16]. Theophylline and 3-methylxanthine produced during metabolism can be reused to synthesize caffeine in young leaves[16].

      Some Camellia species accumulate other purine alkaloid instead of caffeine. Theobromine is the major purine alkaloid in C. ptilophylla, and studies have shown that theobromine is a precursor of caffeine, as opposed to a catabolite, of caffeine. Theobromine is finally degraded to CO2 and NH3 via 3-methylxanthine, xanthine[64]. In C. sinensis, caffeine can also be converted to theobromine to xanthine, but it is not the main catabolic pathway of caffeine (Fig. 4).
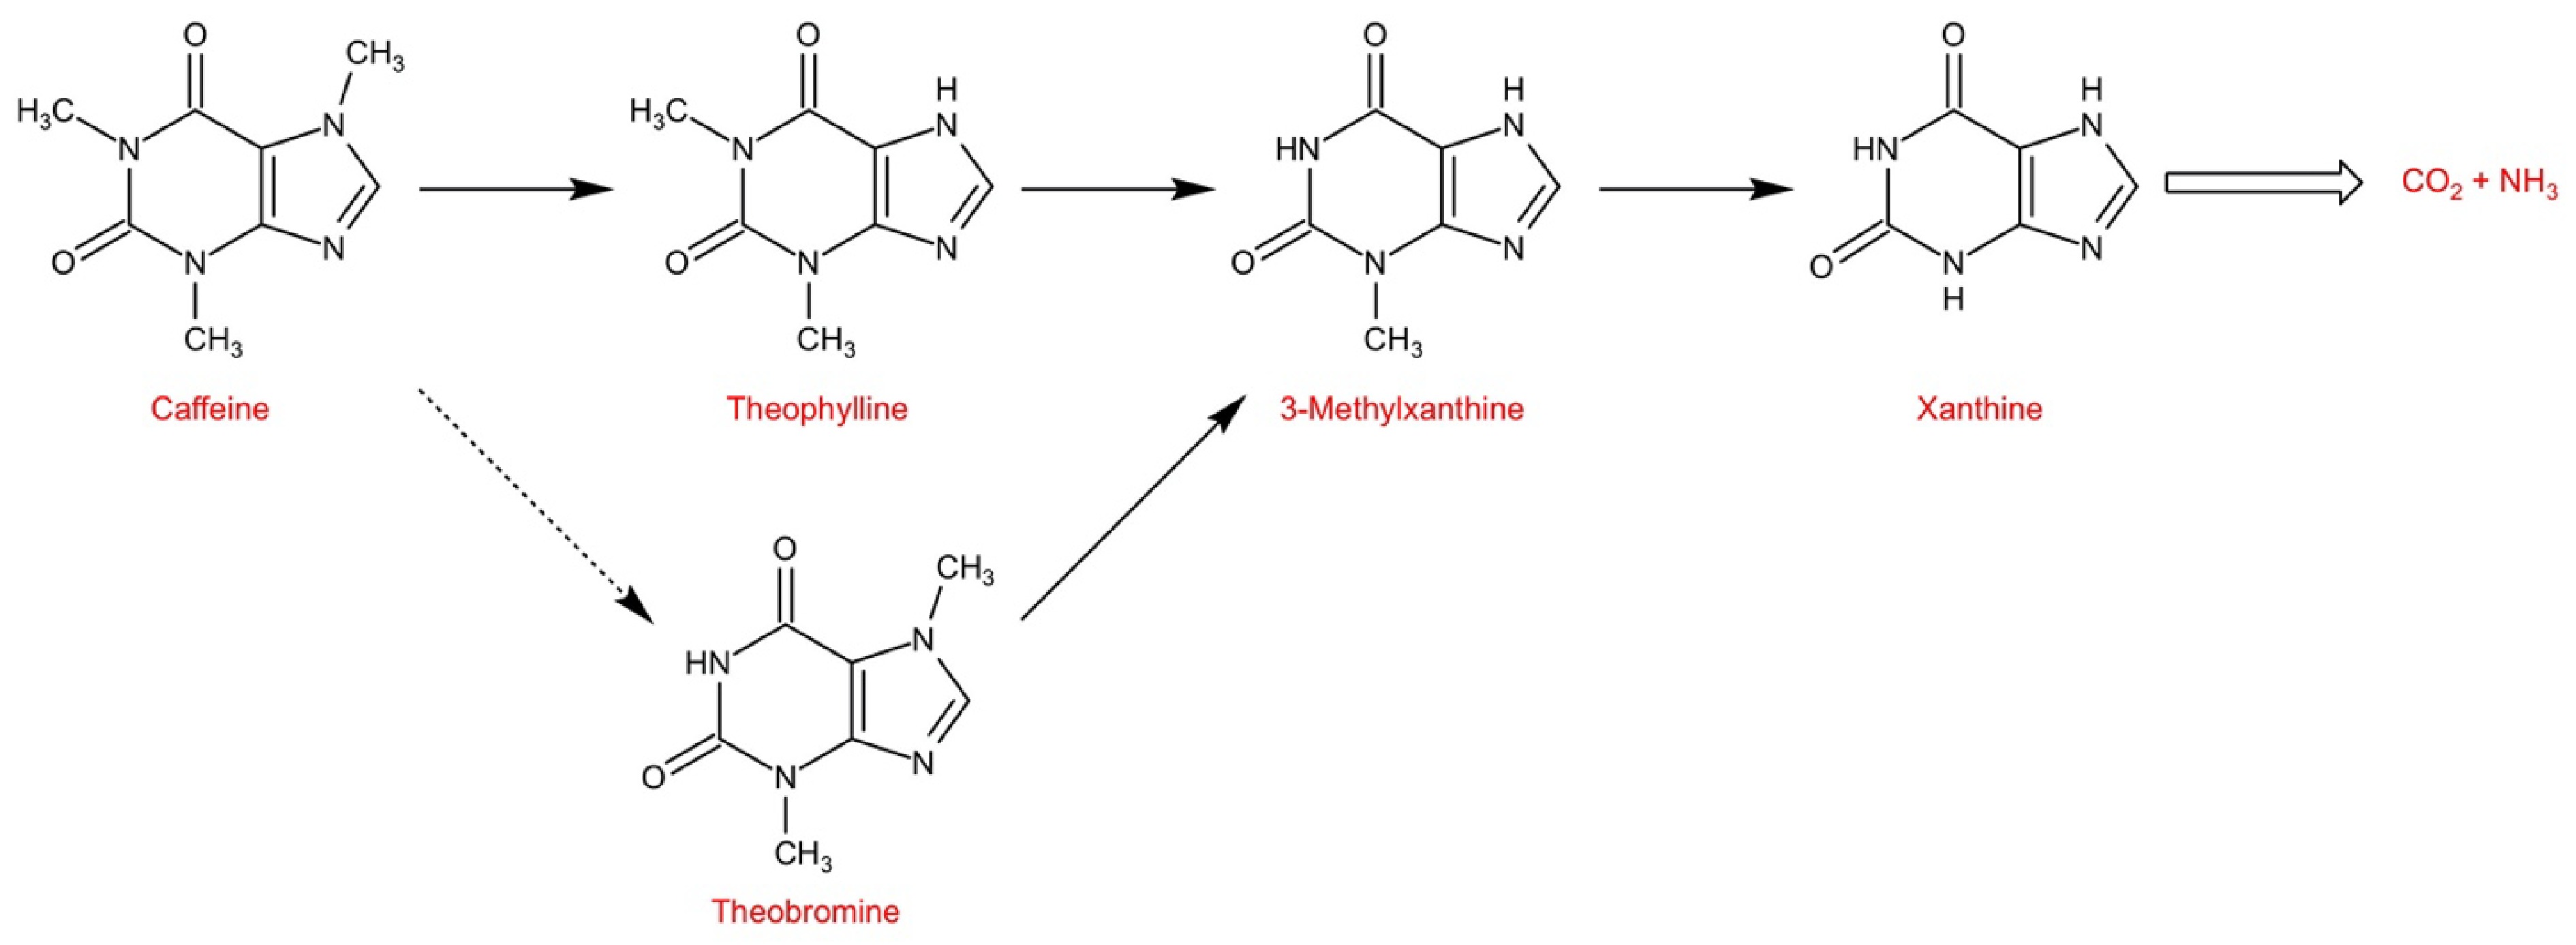
      Figure 4. 

      The main purine alkaloids catabolic pathway in tea plants (Adapted from Ashihara et al.[16]).

    • The China National Germplasm Tea Repository (CNGTR) holds more than 3,000 accessions of tea germplasm from tea growing provinces of China and around the world. It is the most abundant field genebank for preserving tea germplasms in the world. Until 2019, 2,296 accessions were preserved in the China National Germplasm Hangzhou Tea Repository (CNGHTR)[65]. The rich and diverse tea genetic resources provide the material basis for tea plant genetic improvement. However, it is still difficult to identify, evaluate and utilize all resources. Therefore, it is necessary to establish the core collections of tea plants in China, hoping to represent the diversity of the entire genetic resources to the greatest extent with the minimum number of resources and the minimum genetic repeatability[66]. The identification and evaluation of the core collections will help to discover excellent genes of tea plants, and screen out a batch of tea germplasms with specific purine alkaloid components, and promote tea plant improvement and the breeding of new varieties.

      According to the Chinese Agriculture Industry Standard 'Evaluating standards for elite and rare germplasm resources-Tea plant (Camellia sinensis (L.) O. Kuntze) (NY/T 2031−2011)', accessions with caffeine content ≥ 5% or ≤ 1.5% are cataloged as rare germplasms. Chen & Zhou tested the caffeine content of 596 accessions tea germplasm collected from tea producing provinces in China and found that more than 60% of the resources were higher than 4.1%[5]. Among them, 30 accessions were high caffeine (≥ 5.0%) rare germplasms, and most of the valuable hypernormal germplasms were found to come from Yunnan and Fujian.

      The profiling of caffeine and theobromine content for selected 403 accessions Chinese tea germplasm core collection were identified using High Performance Liquid Chromatography (HPLC). The results showed that caffeine content was generally stable between years and seasons, ranging from 0.23% to 5.34% in spring and 0.11% to 6.0% in autumn, and more than 93% of the resources varied from 2.5% to 4.5%[67]. Theobromine content varied significantly in spring, and about 80% of the resources varied from 0.2% to 0.6%[67]. The representative 403 accessions genetic resources were collected from 18 tea producing provinces in China, from which three high caffeine, two low caffeine and high theobromine, and one low caffeine and high theacrine accessions, a total of six specific tea accessions were screened, all from Yunnan and Guangdong. It is believed that Yunnan and Guangdong had higher coefficient of variation and diversity indices.

      About 500 accessions of tea germplasm preserved in the China National Germplasm Menghai Tea Repository Branch (CNGMTRB) were comprehensively identified and evaluated. Nine accessions with super caffeine content were screened out, including seven high caffeine and two low caffeine accessions[68]. Among the tea plant in Sect. Thea (L.) Dyer Camellia L., natural low-caffeine resources are scarce, which is of great significance for the breeding of low-caffeine tea plant cultivars. In addition, the biochemical components of 66 Yunnan tea genetic resources were analyzed, and the results showed that coefficient of variation of purine alkaloids was the total amount of purine alkaloids < caffeine < theobromine[69], which was the same as the results of Jin et al.[67]. Moreover, four rare germplasms of high theacrine were screened out.

    • In addition to China, Japan, India, Kenya and other tea producing countries have also preserved a large number of tea plant germplasms. According to reports, Japan has been planning to introduce a large number of tea plant seeds from China, South Korea, India, Indonesia, Sri Lanka and other tea growing countries, and has accumulated more than 6,800 tea genetic resource accessions[70]. Takeda[71] analyzed the tannin and caffeine content of 1,500 accessions of tea germplasm, the caffeine content ranged from 1.64% to 5.46%, similar to Chinese tea germplasms[67]. The caffeine content of the two varieties of C. sinensis (L.) O. Kuntze was significantly different. Compared with C. sinensis var. sinensis, the variation in caffeine content of the C. sinensis var. assamica was larger, and the average content was higher (4.1%). And then, nine high caffeine content accessions were screened out from the assamica variety. The results of the Chinese core collection also showed that the caffeine content of the three varieties of C. sinensis (L.) O. Kuntze was significantly different, while the caffeine content of the assamica variety increased in autumn, and the content changed significantly between seasons[67].

      Ogino et al.[72] first reported the detection of caffeine-less plants in the offspring of cultivated tea. In the natural hybrid progeny of the hybrid 'Cha Chuukanbohon Nou 6' (C. taliensis × C. sinensis), two low-caffeine and high-theobromine tea resources were found, named 'CafLess1' and 'CafLess2', respectively[72]. According to reports, the National Institute of Vegetable and Tea Science in Japan has preserved about 3,600 accessions of tea germplasms[72]. Before that, no caffeine-less (≤ 0.2%) germplasm was found in any resource. The discovery of the two rare germplasms will be applied to the breeding of caffeine-less tea varieties. Analysis using simple sequence repeat (SSR) marker suggested that caffeine-less traits may be recessively inherited. This not only facilitates the analysis of the mechanism of caffeine synthesis, but also obtains DNA markers closely related to caffeine-free trait for molecular marker-assisted selection (MAS) in tea breeding programs.

      In South Korea, a set of 462 tea accessions was used for the core collection construction[73]. The average caffeine content in two years was 1.67% (0.04−3.25). It is low compared with the Chinese and Japanese collections.

    • Since the discovery of cocoa tea (C. ptilophylla Chang) by Professor Chang Hong-ta in Guangdong, China in the 1980s, people have realized that the tea germplasm with specific purine alkaloids may have special pharmacological effects, and thus began to pay attention to the collection, screening and utilization of natural low-caffeine tea germplasms. Wild tea genetic resources are abundant in Southwest China. The wild tea plants were screened with caffeine content as an indicator, and a number of high-caffeine tea germplasms were screened in Yunnan, but only two natural low-caffeine accessions were found: 'Jinchang Dashucha' (0.06%) and 'Daba Dashucha' (0.07%)[68]. Taxonomically, both belong to C. crassicolumna Chang. Compared with the main cultivars in Yunnan, their economic characters and sensory qualities are poor[74]. Two high-caffeine accessions were screened in Sichuan-Chongqing region: 'Nanchuan 1' (6.25%) and 'Nanchuan 2' (5.87%), and one natural low-caffeine accession: 'Huangshan Kucha' (0.323%) and its progeny plant (0.36%). It is believed that the caffeine content of tea plants may be determined by the characteristics of the variety, and 'Huangshan Kucha' can be used as breeding material for low-caffeine tea plants[75]. In Guangxi, a germplasm (C. gymnogyna Chang) containing theobromine, caffeine and theacrine was screened, which provided new materials for the development of functional components of tea plants[76]. Recently, two new tea germplasms with specific purine alkaloid components were discovered in Fujian, which have high research value and will be introduced separately below.

      'Hongyacha' (HYC) is a naturally caffeine-less/free wild tea plant[77]. It was first reported in Fujian Province, China in 2018, which is significantly different from cocoa tea in morphological characteristics and biochemical components. The young leaves are purple or light purple, contain abundant theobromine, trans-catechins, gallocatechin-(4→8)-gallocatechin gallate (GC-(4→8)-GCG), 1,3,4,6-tetra-O-galloyl-β-D-glucopyranose(1,3,4,6-GA-glc), and (−)-gallocatechin-3,5-di-O-gallate (GC-3,5-diGA), which are not detected in regular tea. In addition, the study found that the recombinant protein of caffeine synthase gene (TCS1) in HYC only has theobromine synthase activity, and it is considered that 'Hongyacha' is a new type of caffeine-less tea plant, which can be used for scientific research and efficient utilization in the future.

      'Baiyacha' (BYC) is a wild tea plant naturally rich in theacrine[78]. Most recently, Jin et al.[78] reported that 'Baiyacha' was also found in Fujian Province, China, which has similar morphological characteristics to C. gymnogyna Chang. Some individual plants rich in catechins, 3"-methyl-epigallocatechin gallate (EGCG3"Me) and theacrine. The study found that with increasing leaf maturity, the content of caffeine decreased significantly, and the content of theacrine and EGCG3"Me increased. EGCG3"Me is an O-methylated EGCG, which has obvious pharmacological effects like theacrine. 'Baiyacha' is the first discovered tea plant resource rich in both theacrine and EGCG3"Me, which is of great value for breeding new varieties with functional components and conducting scientific research in the future.

    • Purine alkaloids are a class of substances that exist in large quantities in non-alcoholic beverages, of which caffeine is the most important component. Beverages containing caffeine, such as coffee, tea, and functional drinks, have a large global consumption. Appropriate intake of caffeine is beneficial to human health, but excessive intake of caffeine or special populations' intake of caffeine may cause negative effects of anxiety and insomnia. Some consumers are naturally sensitive to caffeine intake. At present, the market demand for low-caffeine or decaffeinated products is increasing rapidly. To decaffeinate tea, manufacturers often treat it with supercritical carbon dioxide or hot water treatments. However, these methods can affect the flavor of the brew and destroy compounds in the tea associated with health benefits. Since Kato et al. successfully cloned the caffeine synthase gene in 2000, scientists began to explore the possibility of obtaining natural low-caffeine coffee or tea through genetic engineering. Using the identified gene encoding caffeine synthase, transgenic plants with reduced caffeine content can be produced by RNA interference. It has been reported that coffee seedlings with a 70% reduction in caffeine content have been obtained through genetic engineering[64], but there has been no relevant reports on tea.

      Mohanpuria et al.[79] tried to use RNAi technology to produce low-caffeine content tea plants. Transgenic plants showed a significant suppression of Caffeine Synthesis transcript expression and also showed a reduction of 44%−61% in caffeine and 46%−67% in theobromine content as compared to controls[79]. These results suggest that the RNAi construct developed using a single partial fragment of CS gene reduced the expression of the targeted endogenous gene significantly[79]. It might be a potential molecular technique for generating low-caffeine tea plants.

    • Allelic variations of TCS1 play an important role in caffeine biosynthesis of tea plants. There are two molecular mechanisms controlling the caffeine biosynthesis in low-caffeine-accumulating tea germplasms. TCS1 natural variant reduces transcript level or its encoded protein has only theobromine synthase activity. Allelic variations of TCS1 can be used for the selection of low-caffeine tea plant varieties. Low caffeine individuals might be selected from progenies resulting from crosses between specific accessions containing TCS1b, TCS1c, or TCS1f, TCS1g with low caffeine biosynthetic activity[55]. Ogino et al. believed that the caffeine-free phenotype was closely related to the TCS1, and used a three-nucleotide insertion TTC in TCS1, developed a DNA molecular marker 'CafLess-TCS1', and confirmed that 'CafLess-TCS1' is an effective selection marker for breeding of caffeine-less tea cultivars[80].

    • Among hypernormal tea germplasms, although the health benefits of cocoa tea and Kucha have long been known, relevant scientific study is still very limited. In recent years, scientists have paid more attention to the discovery and utilization of natural tea germplasm rich in theobromine or theacrine. Hypernormal germplasms not only have different morphological and biochemical characteristics, but may also have unique regulatory mechanisms and candidate genes. Ye et al. screened out a batch of low-caffeine, high-theobromine tea germplasms from the wild population, and established the first natural caffeine-free tea germplasm base in China. In the later stage, the screening of excellent individuals of wild cocoa tea will be strengthened to further determine the pharmacological and physiological functions of cocoa tea. Several recent studies on Kucha have identified highly expressed TCS genes (TEA010054, TEA022559) at the transcriptional level[81], which are helpful to reveal the metabolic mechanism of purine alkaloids at the molecular level. This will help in identification and tea plant breeding rich in theobromine or theacrine.

      • This work was supported by the National Natural Science Foundation of China (U19A200592 & 32072631), the Chinese Academy of Agricultural Sciences through the Agricultural Science and Technology Innovation Program (CAASASTIP-2017-TRICAAS), Earmarked Fund for China Agriculture Research System of MOF and MARA (CARS-19) to L Chen.

      • The authors declare that they have no conflict of interest.

      • Copyright: 2022 by the author(s). Exclusive Licensee Maximum Academic Press, Fayetteville, GA. This article is an open access article distributed under Creative Commons Attribution License (CC BY 4.0), visit https://creativecommons.org/licenses/by/4.0/.
    Figure (4)  Table (1) References (81)
  • About this article
    Cite this article
    Zhang S, Jin J, Chen J, Ercisli S, Chen L. 2022. Purine alkaloids in tea plants: component, biosynthetic mechanism and genetic variation. Beverage Plant Research 2:13 doi: 10.48130/BPR-2022-0013
    Zhang S, Jin J, Chen J, Ercisli S, Chen L. 2022. Purine alkaloids in tea plants: component, biosynthetic mechanism and genetic variation. Beverage Plant Research 2:13 doi: 10.48130/BPR-2022-0013

Catalog

  • About this article

/

DownLoad:  Full-Size Img  PowerPoint
Return
Return