


-
Due to the tasty flavor and supposed health benefits, tea, which has its origins in Southwest China, is the second most popular beverage worldwide after water[1,2]. Diversified tea genetic resources are the basis for tea breeding programs and producing new tea products. There are several species and varieties in the Camellia L. Sect. Thea (L.) Dyer. Among them, C. tachangensis F. C. Zhang is one of the most primitive wild species so far lacking in research and utilization. 'P113' with purple tender shoots was newly selected from wild C. tachangensis population, containing a high level of flavonoids and anthocyanins. The physiological, biochemical characteristics and the molecular mechanisms of some purple tea cultivars belonging to C. sinensis have been reported previously[3,4], but uncertainty still exists regarding the precise compositional and molecular underpinnings of flavonoid biosynthesis in C. tachangensis.
Flavonoids have attracted much research attention because of their diverse pharmacological effects, especially two predominant pigments such as flavonols and anthocyanins[5−7]. For example, flavonols such as rutin and quercetin are abundantly distributed in red wine, black tea, and other fruit juices, and quercetin-3-O-glucoside have been identified as the major flavonols[8]. Flavanols have a variety of biological activities, including antioxidant, hepatoprotective, antimicrobial, anti-inflammatory, and vasodilatation effects, which are also considered as potential anticancer agents[9]. Anthocyanins, as a water-soluble natural pigment, are closely related to the color development of plants, including leaves, flowers, fruits, and others[10]. Previous studies have revealed anthocyanins were identified in purple leaf colored tea. The flavonoid biosynthesis pathway and corresponding regulatory mechanism have been well studied in many plants, for example arabidopsis, maize, and leaf mustard. Most of the genes involved in flavonoid biosynthesis in C. sinensis were identified based on TPIA database, including PAL, C4H, 4CL, CHS, F3H, DFR, and ANS[11]. However, identification of the flavonoid genes terminal modification is a complex process because of the huge diversity of flavonoid structures and their tissue-specific distribution. He analyzed the distribution of anthocyanins and O-Glycosylated flavonols in purple-leaf tea variety 'Mooma1' , and found that a UGT gene (CsUGT72AM1) was strongly associated with the accumulation of O-Glycosylated flavonols in purple-leaf. Nevertheless, these key enzymes have not been cloned and characterized from C. tachangensis due to the complex genetic background of tea species[12]. In contrast, several transcription factors, including MYBs, bHLHs, and WRKYs, were proved in regulating the biosynthesis of flavonoids and anthocyanins in plants. Recently, some progress has been made on the regulation of flavonoid and anthocyanin biosynthesis by TFs in tea plants. CsMYB5a, CsMYB5e, CsAN2, CsMYB5e, CsGL3 and CsTT8 were revealed in regulating the biosynthesis of anthocyanin and proanthocyanidin[13]. In addition, some WRKYs and bZIPs have also been reported to regulate flavonoid biosynthesis[14]. Combined transcriptomic and metabolomic analyses may be a good approach to identify metabolism-related genes. In the purple-leaf tea 'Jinmingzao' and green-leaf 'Huangdan', phenolic compounds, flavonoids, phenolic acids, and tannins were revealed to be significantly accumulated in and identified the genes related to flavonoid biosynthesis[15]. In pink tea flower, the anthocyanins pelargonidin 3-O-β-d-glucoside, cyanidin O-syringic acid, petunidin 3-O-glucoside were specifically distributed[16]. In 'Zikui', a new purple-leaf tea plant, petunidin 3-O-glucoside, cyanidin 3-O-galactoside, and cyanidin 3-O-glucoside were indicated, and suggested the structural genes F3'H and ANS were regulated by CsMYB90 TF, which might be involved in biosynthesis of anthocyanins[17].
'P113' attracted the attention due to its purple appearance and vigorous vitality to change its internal components, which has an important impact on tea quality. Combining metabolome and transcriptome analysis, this study described the changes of flavonoids in the process of shoot color change of red purple mutant 'P113', and explored the relationship based on differentially expressed between the flavonoids related genes and the flavonoid metabolites, as well as the transcription factors and the flavonoid related genes. The present research will lay a molecular foundation for the breeding of characteristic purple tea and the development of new products in the future.
-
The tea germplasm 'P113' with purple leaf were selected from wild-type population (C. tachangensis F. C. Zhang) in Pu'an (location: 25°43' N, 104°96' E, altitude 1,600 m), Guizhou province (China), and were planted in the local experimental field of the College of Tea Science. The buds (Group A: P1-1, P1-2, P1-3), the first leaf (Group B: P2-1, P2-2, P2-3), the second leaf (Group C: P3-1, P3-2, P3-3) and the third leaf (Group D: P4-1, P4-2, P4-3) with three duplicates, were collected from healthy tender shoots free from disease and pests of 'P113' in mid early April, 2021, respectively. All samples were immediately put into liquid nitrogen until analysis.
-
Total flavonoids and anthocyanidins measurement of the tender shoots was performed as previously described[18,19]. Metabolite profiling analyses were supported by Majorbio Bio-pharm Technology Co., Ltd (Shanghai, China). The experimental procedures were provided by this company. The data were analyzed on the online platform of Majorbio Cloud Platform (
www.majorbio.com ) and the analysis for quantitative MS on the obtained flavonoids metabolites of each sample were performed using the multiple reaction monitoring (MRM) mode based on the local metabolic database. Using the online PLANTCYC (www.plantcyc.org ) and KEGG database (www.kegg.jp ) to annotate the identified flavonoids.RNA extraction, transcriptome sequencing, and library construction
-
Using the TaKaRa MiniBEST Plant RNA Extraction Kit to extract the total RNA from the frozen leaf sample. Using DNase I (TAKARA) to remove contaminated DNA from the extracted RNA, and using the Dynabeads mRNA purification kits to isolate the mRNAs from the total RNA. Following purification, the mRNA was fragmented into small fragments and reverse-transcribed into first strand cDNA using random hexamer primers. Then, using the NEBNext Ultra RNA Library Prep to generate the double-stranded cDNA. Finally, adding the adaptors into double-strand cDNA were further enriched by PCR to construct the final cDNA libraries for Illumina novaseq 6000 sequencing. Using Illumina novaseq 6000 sequencing platform to sequence the cDNA library.
RNA-seq data analysis
-
The RNA-seq analysis was supported by Majorbio Cloud Platform as metabolite profiling. In brief, the FASTX Toolkit (version 0.0.14) was used to analyze the base quality, base error rate, and base content classification of each sample[20]. SeqPrep and Sickle softwares were used for quality control (QC) of the original data to get the high-quality clean data, including the removing adaptors sequence, low-quality reads and N (unrecognizable bases). Trinity software was used to assemble these high-quality clean data to generate contigs and singletons[21] and TransRate software was used for de novo assembly filtering and optimization as well as evaluation[22]. The final unigenes/transcripts were obtained from BUSCO analysis[23]. Moreover, using GO databases and KEGG databases to annotate the obtained unigenes. To calculate the expressed level of unigenes and normalized to transcripts per million reads fragments mapped (TPM). The differential gene analysis between groups was carried out by using the differential analysis software DESeq2, based on the quantitative results of expression and obtained the differentially expressed genes (DEGs) between the comparison groups. The screening threshold was |log2FC| ≥ 1 and p adjust < 0.05.
Association analysis between metabolite profiling and transcriptome
-
Association analysis was carried out by calculating the values of correlation coefficient between the differentially expressed metabolites (DEMs) and the DEGs, which are both enriched in flavonoid biosynthesis pathway (ko00941), flavonoid and flavonol biosynthesis (ko00944) and anthocyanin biosynthesis (ko00942). The software Adobe Illustrator CC 2019 and MENA (
http://ieg4.rccc.ou.edu/mena/ ) was used for correlation analysis to construct the correlation network between DEGs and DEMs. In addition, the online String database (http://string-db.org/ ) was used to structure the network for differentially expressed transcription factors and DEGs, which were significantly concerned with DEMs.Real-time quantitative polymerase chain reaction
-
Nine DEGs associated with the flavonoids were selected for qRT-PCR, and the primers are listed in Supplemental Table S1. One-step RT-qPCR kit was used for analysis, which used high-quality reverse transcriptase and Taq-DNA polymerase, as well as the reaction system (20 µL) developed by Sangon Biotech (Shanghai) Co., Ltd (China). That is add successively 10 µL 2× onestep RT-qPCR Master Mix, 0.4 µL forward primer, 0.4 µL reverse primer, 0.65 µL RT enzyme Mix, 0.1−100 ng RNA Template, and finally add a certain amount of RNase free ddH2O in the ice tube to make the volume of the whole system 20 µL. After that, quantitative analysis was carried out on real-time fluorescence quantitative PCR instrument. Using the 2−ΔΔCᴛ method to analyze the results with GADPH gene expression as an internal reference. Three biological and technical replicates were used in the present study.
-
Leaf color is one of the screening indexes of specific tea resources which was specifically associated with flavonoid compounds, especially anthocyanins. To investigate the dynamic changes in bioactive components at the different developmental stages of 'P113', four developmental stages (bud, first leaf, second leaf and third leaf) were used to determine the dynamic changes of the total flavonoids and anthocyanins (Fig. 1a). As shown in Fig. 1b, the total content of flavonoids was significantly increased from bud to the second leaf, and slightly decreased in the third leaf. In addition, the total content of anthocyanin in the bud was the lowest, reached the highest in the first leaf and then decreases with the development of stages (Fig. 1b). Overall, the total flavonoid contents and the total anthocyanin contents was changed with the development of the tender shoots of 'P113', suggesting that the flavonoids dynamically varied during leaf growth and these samples might be used for further metabolite profiling and transcriptome investigations.
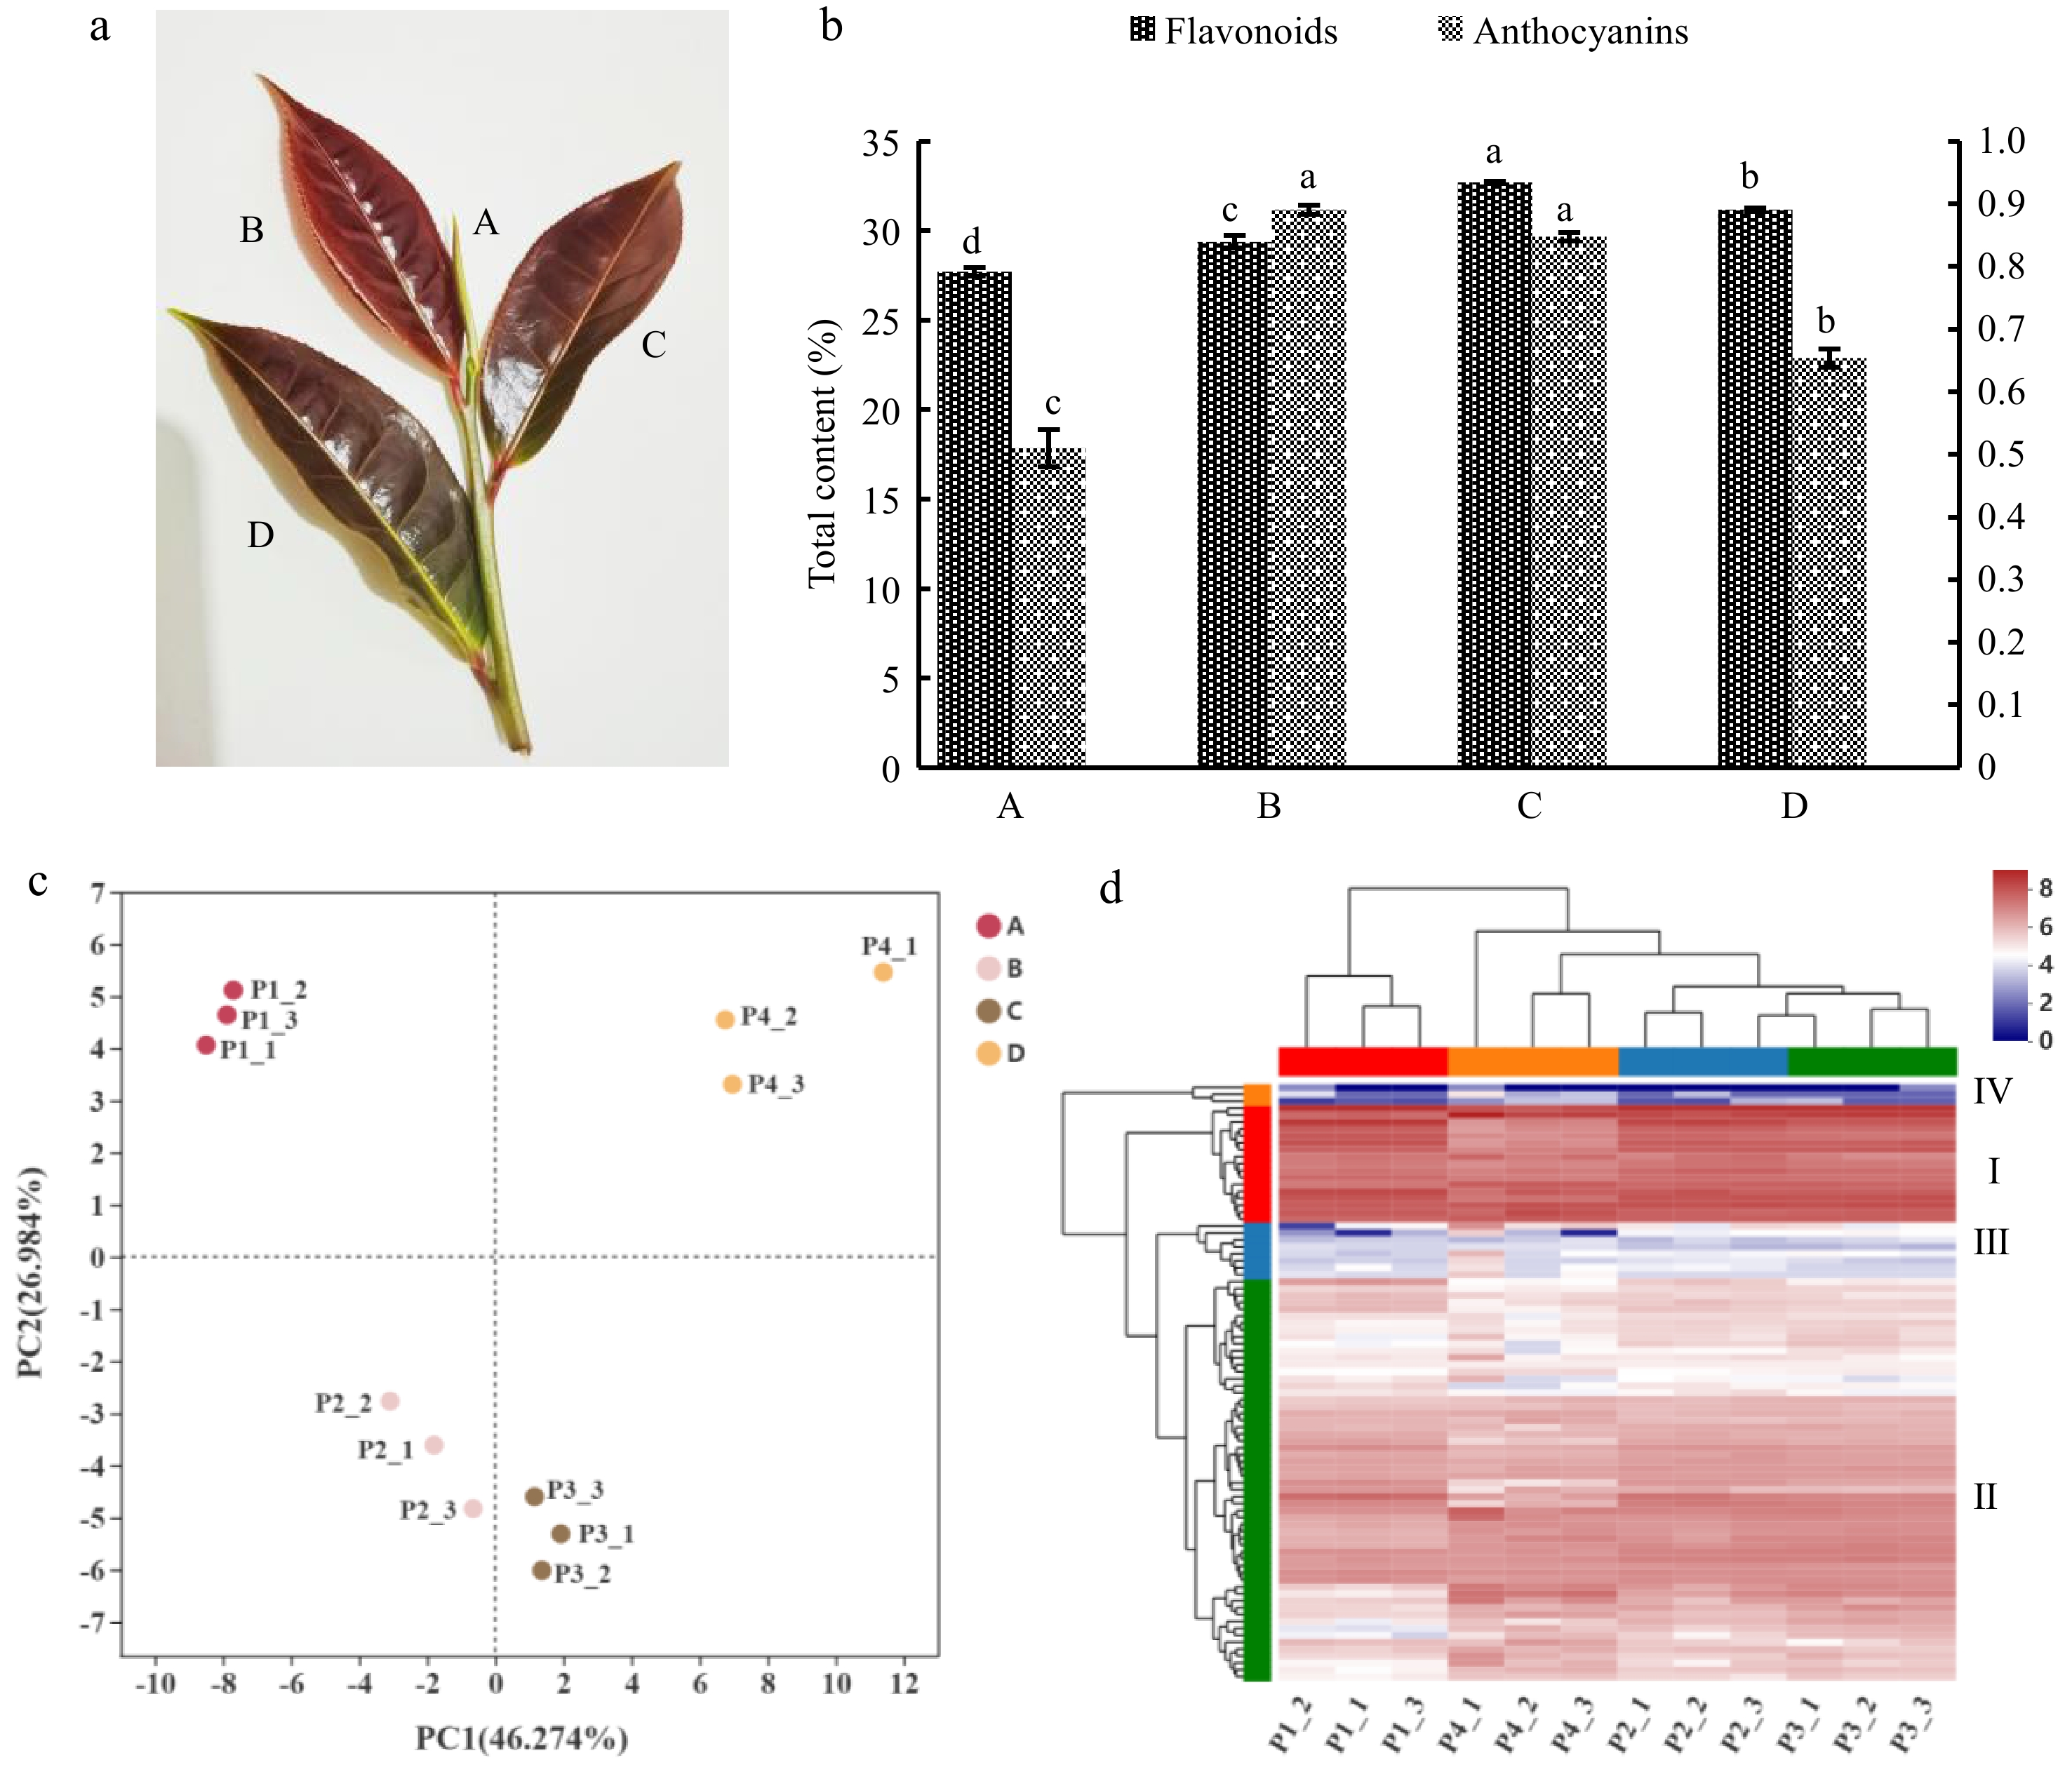
Figure 1.
(a) Tender shoots of 'P113'. The capital letters A, B, C and D represent bud, first leaf, second leaf and third leaf in (a) respectively. (b) Accumulation changes in total flavonoids and anthocyanins contents during tender shoots developmental and the content of anthocyanins was determined at FW state, and the flavonoids were determined at DW state. The left y-axis represents the total flavonoids content, and the right y-axis represents the total anthocyanins content. Error bars represent the mean ± SD and lowercase letters a, b, c and d represent significant difference, p < 5%. (c) Principal component analysis (PCA). (c) The distance between points can indicate the similarity within and between samples, the closer the distance, the greater the sample similarity, and the farther the distance, the smaller the sample similarity. (d) Clustering heatmap tree of total flavonoid metabolites of P113 in different tissues. Each row represents a metabolite and each column represents a sample, different colors in the leftmost column represent different clusters: Cluster I in red, Cluster II in green, Cluster III in blue and Cluster IV in orange. And different colors in the top row represent different sample groups: Group A in red, Group B in blue, Group C in green and Group D in orange. Different colors in the cluster heat map represent different contents, red and blue represent higher or lower metabolite contents respectively.
Metabolic profiling reveals resource-specific distribution of flavonoids in 'P113'
-
To identify the flavonoid compounds of 'P113', the tender shoots (sampled in April) were subjected to Untargeted Metabolomics analysis and the metabolite profiling of developmental stages was analyzed by UHPLC-Q Exactive HF-X system. A total of 86 flavonoids metabolites were determined, including 15 biflavonoids and polyflavonoids (17.44%), 23 flavans (26.74%), seven flavones (8.13), 36 flavoid glycosides (41.86%), two hydroxyflavoids (2.32%), two O-methylated flavoids (2.32%) and one sulfated flavoid (1.16%) in all samples (Supplemental Fig. S1 and Table S2). The flavonoid profile of developing leaves of 'P113' can be clearly distinguished using PCA, and the variance of 73.26% between the various samples can be explained by PCA1 (46.27%) and PCA2 (26.98%), indicating a dynamic change during leaf development (Fig. 1c). Additionally, PCA revealed relatively little variation between biological replicates, suggesting a good association between replicates. The overall flavonoid analysis and the PCA results were further supported by hierarchical cluster analysis (HCA), which revealed that the quantities of the majority of identified metabolites were considerably altered at various developmental phases. The accumulation pattern of flavonoids may be categorically classified into four clusters, according to HCA (Fig. 2b and Supplemental Table S3). Cluster I, Group D had significantly lower quantities of flavonoids than the other groups. The levels of flavonoid accumulation in Cluster II showed an upward trend, with Group C having the highest amounts. Cluster III, a flavonoid, accumulated heavily in Group B. Group D had significantly more flavonoids than the other groups in cluster IV. Overall, Cluster I had a higher accumulation of flavonoids in the four development stages, and showed a gradual increasing trend. The accumulation of Cluster IV was the lowest, followed by Cluster III, both of which showed a gradual decreasing trend (Fig. 1d and Supplemental Table S3).
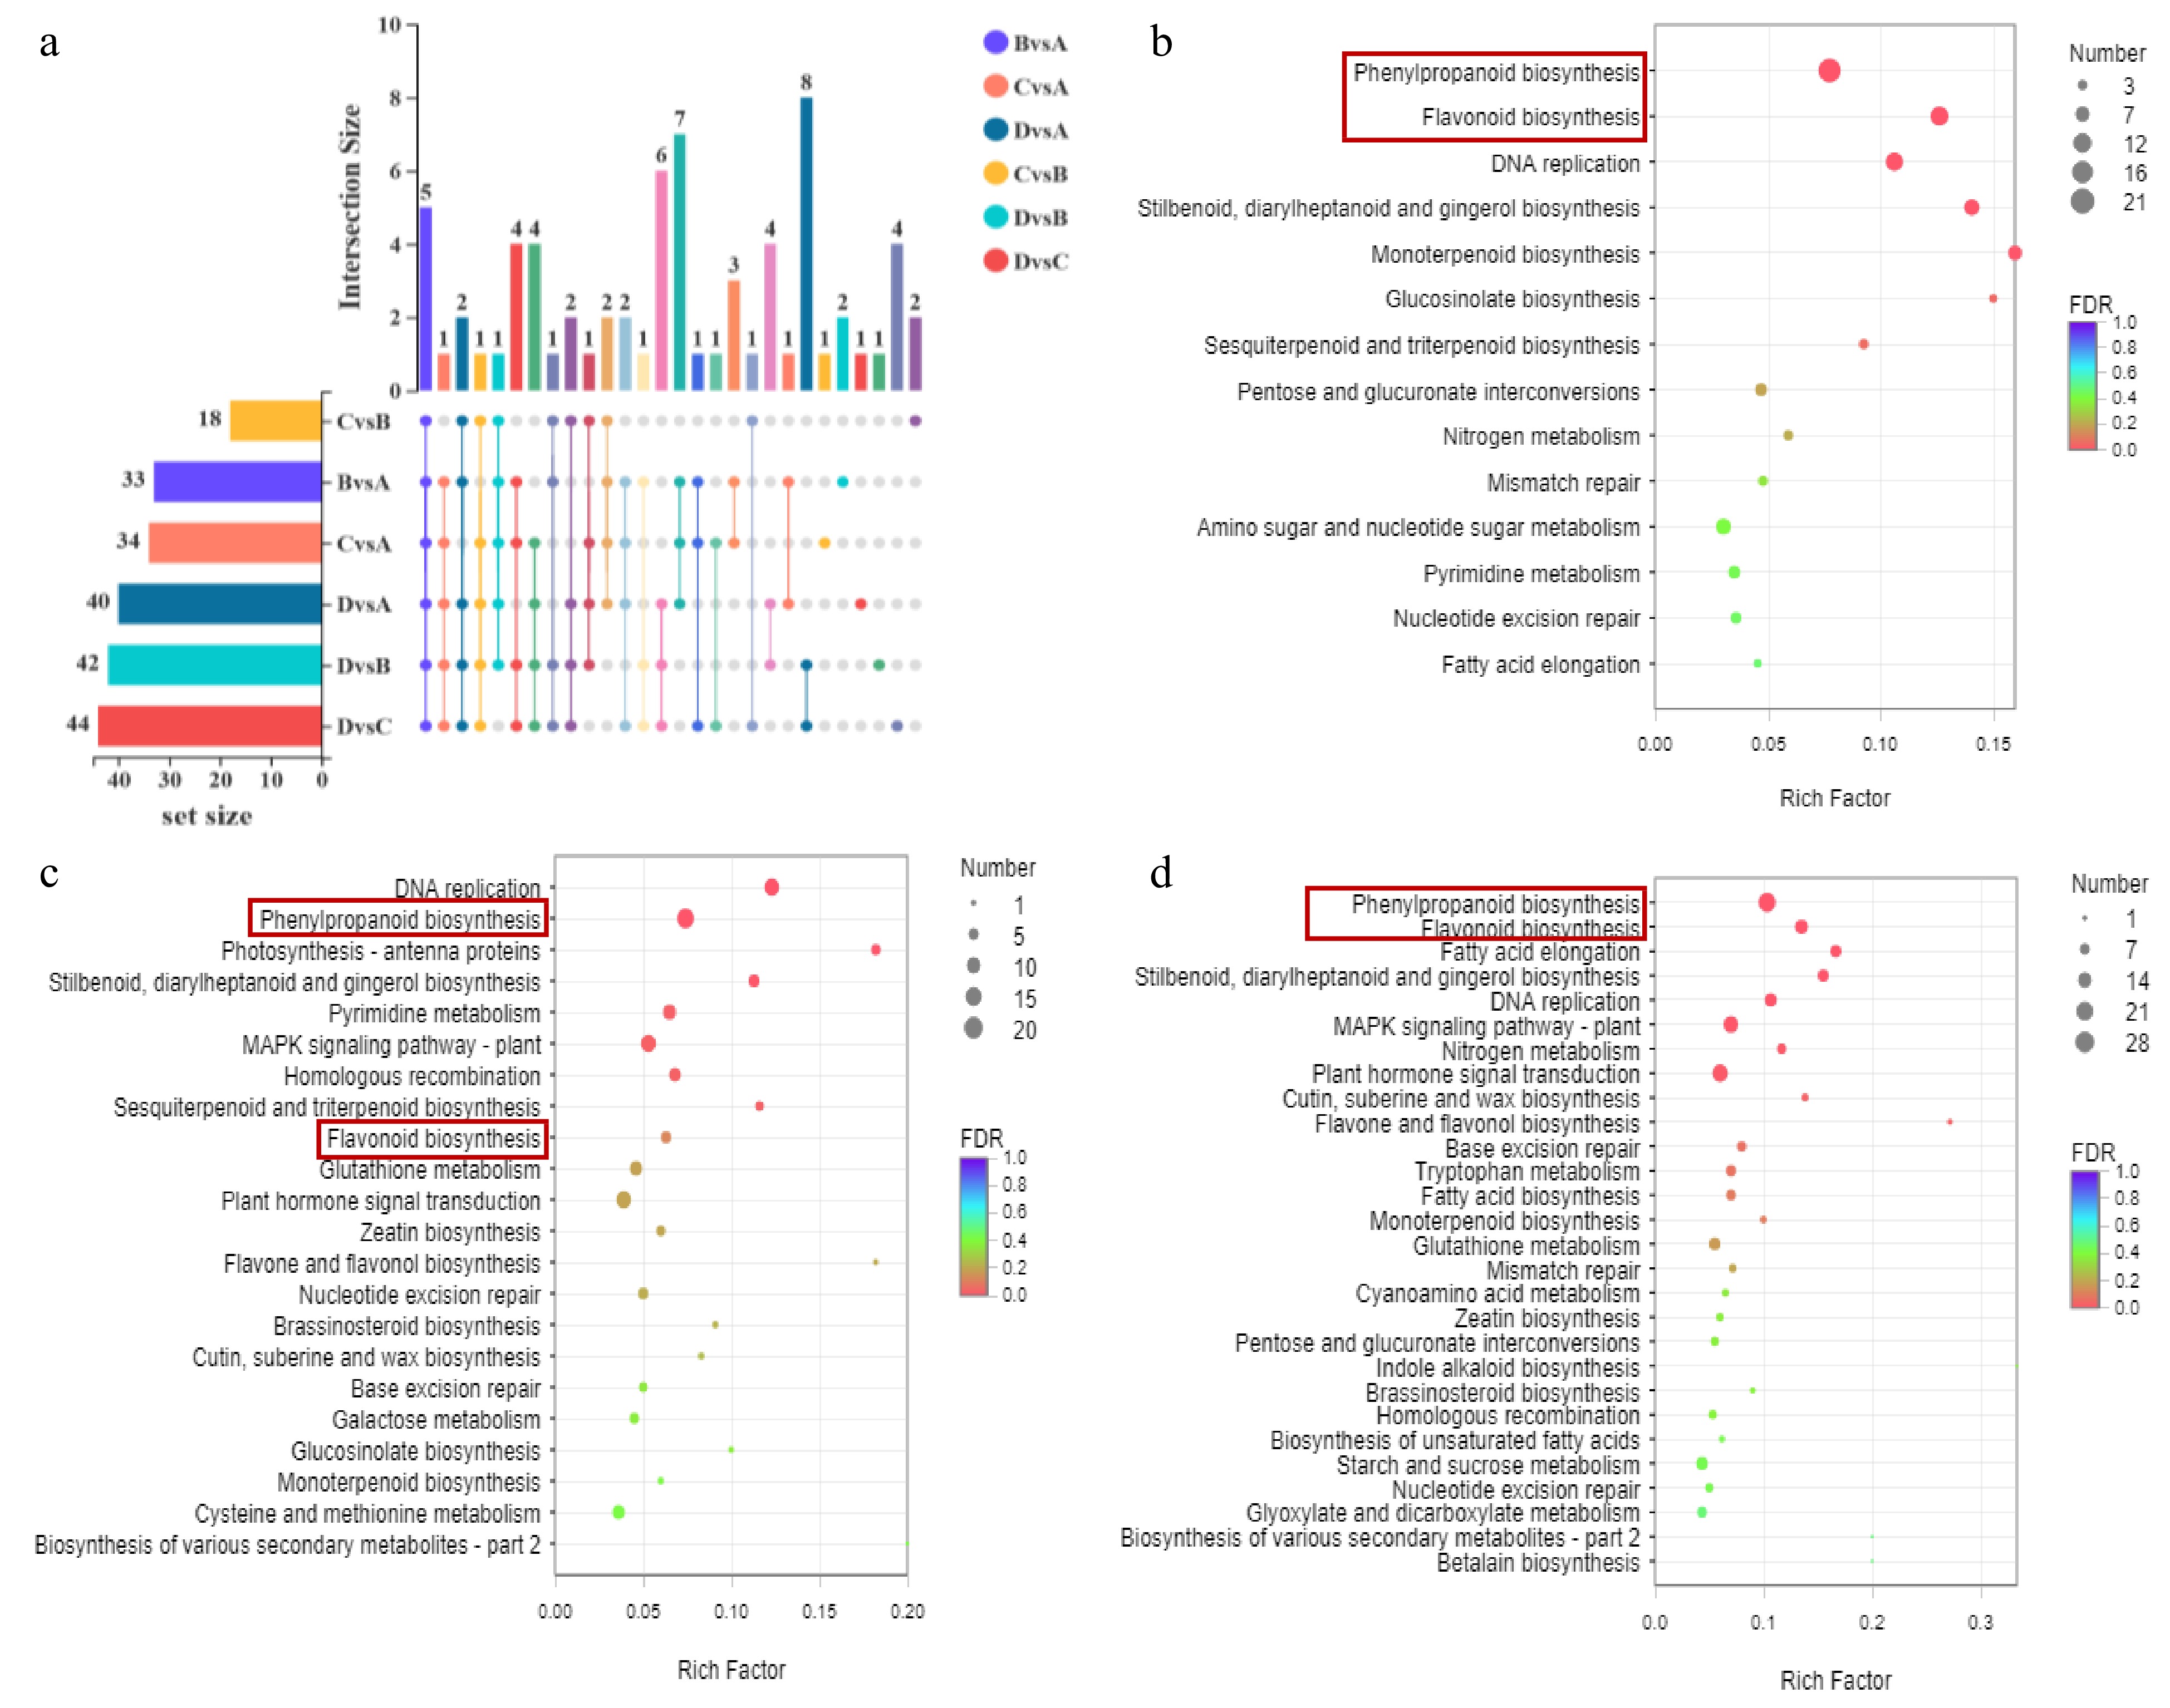
Figure 2.
(a) Up-set venn of significantly different metabolites between different comparison groups. The set size in the lower left corner is the statistics of the number of elements of each set. The histogram on the right is the statistical result of the number of elements after taking the intersection of various sets. The single point below represents the unique elements of a group, and the line between points represents the unique intersection of different groups. KEGG enrichment bubble diagram. Significantly enriched KEGG pathway (P < 0.05) from DEGs in (b) A vs B, (c) B vs C and (d) C vs D.
Changes in the concentration and composition of flavonoids between the different developmental stages of 'P113'
-
The flavonoids from different stages were used to conduct a pairwise comparison based on their relative amounts in order to further examine the differential accumulation of flavonoid compounds among the various developmental stages of 'P113'. The result was the identification of 70 flavonoids with differential accumulation (p = 0.05) (Supplemental Table S4). Up-set venn analysis showed that there are 33 differential metabolites in B vs A, 34 in C vs A, 40 in D vs A, 18 in C vs B, 42 in D vs B and 44 in D vs C (Fig. 2a and Supplemental Table S5). Among them, there were five common flavonoids in all comparison groups, and there were 2, 1, 1, 2, 1 and 4 specific metabolites in comparison group B vs A, C vs A, D vs A, C vs B, D vs B and D vs C respectively (Fig. 2a and Supplemental Table S5). B vs A showed that seven flavonoids increased and 26 flavonoids decreased, the increased flavonoids included two biflavonoids and polyflavonoids, one flavone, two flavonoid glycosides and two O-methylated flavonoids, the decreased flavonoids included two biflavonoids and polyflavonoids, three flavans, three flavones, 17 flavonoid glycosides and one hydroxyflavonoid (Supplemental Fig. S2a and Table S4); C vs A showed that 25 flavonoids increased and nine flavonoids decreased, the increased flavonoids included two biflavonoids and polyflavonoids, three flavans, three flavones, 16 flavonoid glycosides and one hydroxyflavonoid, and the decreased flavonoids included one biflavonoid and polyflavonoid, two flavans, two flavones and four flavonoid glycosides (Supplemental Fig. S2b and Table S4). D vs A showed that 20 flavonoids increased and 20 flavonoids decreased, the increased flavonoids included one biflavonoid and polyflavonoid, seven flavans, two flavones, 15 flavonoid glycosides and one hydroxyflavonoid, and the decreased flavonoids included one biflavonoid and polyflavonoid, two flavans, two flavones, eight flavonoid glycosides, one O-methylated flavonoid and one sulfated flavonoid (Supplemental Fig. S2c and Table S4). C vs B showed that nine flavonoids increased and nine flavonoids decreased, the increased flavonoids included two flavans, six flavonoid glycosides and one hydroxyflavonoid, and the decreased flavonoids included two flavans, two flavones and seven flavonoid glycosides (Supplemental Fig. S2d and Table S4). D vs B showed that 14 flavonoids increased and 28 flavonoids decreased, the increased flavonoids included two biflavonoids and polyflavonoids, three flavans, one flavone, eight flavonoid glycosides and one hydroxyflavonoid, and the decreased flavonoids included two biflavonoids and polyflavonoids, 12 flavans, two flavones and 12 flavonoid glycosides (Supplemental Fig. S2e and Table S4). D vs C showed that 12 flavonoids increased and 32 flavonoids decreased, the increased flavonoids included one biflavonoid and polyflavonoid, three flavans, one flavones and eight flavonoid glycosides, and the decreased flavonoids included two biflavonoids and polyflavonoids, 12 flavans, two flavones and 12 flavonoid glycosides (Supplemental Fig. S2f and Table S4).
It should be noted that five flavonoids (dihydrokaempferol, avicularin, rutin, quercetin 3-(3R-glucosylrutinoside) and 4''-O-Acetylmyricitrin) were increased with the tender shoots developmental of 'P113'; 2 flavonoids (quercetin 3-(6-[4-glucosyl-p-coumaryl]glucosyl)(1→2)-rhamnoside and quercetin-3-O-galactoside) were increased from bud to second leaf, but decreased from second leaf to third leaf; seven flavonoids (kaempferol, aspalathin, patuletin 3-gentiobioside, 3-{[3,4-dihydroxy-5-(hydroxymethyl)oxolan-2-yl]oxy}-5,7-dihydroxy-2-(3-hydroxyphenyl)-3,4-dihydro-2H-1-benzopyran-4-one, quercetin 3-O-glucoside, astragalin and cyanidin) were increased from bud to first leaf, but non-significantly cumulative change from first leaf to third leaf; nine flavonoids (ent-Epicatechin-(4α→8)-ent-epicatechin-(4α→8)-ent-epicatechin 3',3''-digallate, (−)-Epicatechin, afzelechin, tricin 7-[feruloyl-(→2)-glucuronyl-(1→2)-glucuronide], 4'-Methylisoscutellarein 8-(2''-sulfoglucoside), [5-(3-{[3,4-dihydroxy-5-(hydroxymethyl)oxolan-2-yl]oxy}-5,7-dihydroxy-4-oxo-3,4-dihydro-2H-1-benzopyran-2-yl)-2-hydroxyphenyl]oxidanesulfonic acid, 6-{4-[6-(3,4-dihydroxy-6-methyl-5-oxooxan-2-yl)-5,7-dihydroxy-4-oxo-4H-chromen-2-yl]-2-methoxyphenoxy}-3,4,5-trihydroxyoxane-2-carboxylic acid, isoquercitrin and kaempferol-3-O-glucoside) were increased from bud to first leaf, but decreased from second leaf to third leaf. Interestingly, the cyanidin content, one of the main anthocyanins in tea leaf, was increased from bud to the first leaf, un-significant difference from the first leaf to the third leaf, and maintained at a higher level than the bud. The pelargonidin content, another main anthocyanin in tea leaf was un-significant difference from bud to the first leaf, up-regulated from the first leaf to the second leaf, but down-regulated from the second leaf to the third leaf and the overall trend is to increase first and then decrease.
The different metabolites found in each comparison group were annotated using the KEGG database to show where they fit into the KEGG metabolic pathway. The three pathways of flavonoid biosynthesis (ko00941), flavonoid and flavonol biosynthesis (ko00944), and anthocyanin biosynthesis were where the differential flavonoids from each comparison group were primarily localized (ko00942) (Supplemental Fig. S3 and Table S6).
Transcriptome analysis of the developmental stages of 'P113'
-
In higher plants, the regulation of flavonoid production includes several regulatory genes in addition to structural genes[24]. Twelve cDNA libraries were created from the same samples for metabolite profiling analysis and RNA-seq analysis in order to further investigate the molecular mechanism of flavonoids biosynthesis in the developmental stages of 'P113'. As shown in Supplemental Table S7, a total of 539,745,922 raw reads ranging from 41,594,884 to 52,667,476 for each library and 533,685,242 clean reads ranging from 41,123,426 to 52,074,768 for each library were obtained. The percentage of Q30 in each sample was greater than 93%, and the GC content of each sample was between 44% and 45.18%. Moreover, 77.09 to 78.59% of clean reads were mapped to the reference genome for each library. In all (Supplemental Table S8), 151,883 unigenes were assembled, of which the largest length was14,723 bp, the smallest length was 201 bp, the average length was 829 bp, N50 length was 1,295 bp, the fragment mapped percent was 56.94% and the transrate score was 0.23. Overall, the data indicated that the high-quality RNA-Seq data could be used for further analysis.
The cluster analysis of gene expression dynamics and the Pearson correlation coefficient between several biological replicates were examined initially in order to further investigate the DEGs during leaf growth of tea variety 'P113'. The k-means approach assigned all 151,883 unigenes to nine separate groups, showing that many genes were differentially expressed between different samples (Supplemental Fig. S4). The biological replicates were strong, and the data could be used to further identify the DEGs because the correlation coefficients of gene expression levels between biological replicates for all samples were more than 0.9 (Supplemental Fig. S5). According to differential expression multiple with a |log2FC| ≥ 1 and p-adjust < 0.05 in the present study, 1,172 (553 upregulated and 619 downregulated), 4,255 (2,088 upregulated and 2,167 downregulated), 8,877 (4,389 upregulated and 4,488 downregulated), 1,375 (551 upregulated and 824 downregulated), 5,435 (2,861 upregulated and 2,574 downregulated), and 2,021 (935 upregulated and 1,086 downregulated) DEGs were detected in B vs A, C vs A, D vs A, C vs B, D vs B and D vs C, respectively.
GO term enrichment was used to investigate the biological function of DEGs using Blast-GO software. As a result, 1,172 (B vs A), 4,255 (C vs A), 1,375 (C vs B), 8,877 (D vs A), 5,435 (D vs B) and 2,021 (D vs C) were classified into 36 functional groups, including 11 molecular function categories, 11 cellular component categories, and 14 biological process categories (Supplemental Fig. S6 and Table S9). In all comparison groups for molecular functions, binding, catalytic activity, and transporter activity are most prevalent. The most common components in biological processes are organelles, cells, and membranes. The most prevalent cellular processes, metabolic processes, and biological regulation are found in cellular components.
In addition, to further understand DEGs involved in metabolic pathways, KEGG analysis was performed. In the present study, 231 (B vs A), 321 (C vs B), and 464 (D vs C) DEGs were assigned to 60, 86, and 92 metabolic pathways, respectively (Supplemental Table S10), and 14, 22, and 28 pathways were substantially enriched (Supplemental Table S11) (p < 0.05). Notably, phenylalanine biosynthesis (ko00940, included 21, 20, and 28 DEGs) and flavonoid biosynthesis pathways (ko00941, included 14, 7, and 15 DEGs) were widely distributed in B vs A (Fig. 2b), C vs B (Fig. 2c), and D vs C (Fig. 2d), respectively (Supplemental Table S11) (p < 0.05).
Six categories, comprising metabolism, genetic information processing, environmental information processing, cellular processes, organismal systems, and human diseases, were assigned to all metabolic pathways from B vs A, C vs B, C vs A, D vs A, D vs B, and D vs C (Supplemental Fig. S7). The metabolism category contained the largest pathways among all of them (Supplemental Fig. S7). The five pathways containing the most DEGs in the metabolic category of B vs A were carbohydrate metabolism, biosynthesis of other secondary metabolites, metabolism of terpenoids and polyketides, amino acid metabolism and lipid metabolism highly enriched, successively. In C vs A were carbohydrate metabolism, biosynthesis of other secondary metabolites, lipid metabolism, metabolism of terpenoids and polyketides and amino acid metabolism highly enriched, successively. In D vs A were carbohydrate metabolism, lipid metabolism, biosynthesis of other secondary metabolites, amino acid metabolism and energy metabolism highly enriched, successively. In C vs B were carbohydrate metabolism, biosynthesis of other secondary metabolites, amino acid metabolism, metabolism of terpenoids and polyketides and energy metabolism highly enriched, successively. In D vs B were carbohydrate metabolism, energy metabolism, lipid metabolism, biosynthesis of other secondary metabolites and amino acid metabolism highly enriched, successively. In D vs C were carbon metabolism, biosynthesis of other secondary metals, lipid metabolism, amino acid metabolism and metabolism of terpenoids and polyketides highly enriched, successively. Noteworthy, biosynthesis of other secondary metals exists in the top five of all comparison groups, and contains pathways related to flavonoid metabolism, such as flavoid biosynthesis, phenoid biosynthesis, flavone and flavonol biosynthesis (Supplemental Fig. S7).
DEGs in developmental stages of 'P113'
-
Based on the enriched KEGG pathways and gene functional annotation, DEGs encoding important enzymes involved in flavonoid production were found. As in the results, a total of 53 DEGs involved in flavonoids were identified in B vs A, C vs A, D vs A, C vs B, D vs B and D vs C (Supplemental Fig S8 and Table S12). Among them, 18 DEGs involved in flavonoid biosynthesis and metabolism, including one CYP73A gene, one ANS gene, three FLS genes, two UGT73C6 genes, five LAR genes, one F3'5'H gene, one AOMT gene, two DFR genes, one F3'H gene, and one BZ1 gene, were identified (Supplemental Table S13). The results showed that the expression level of eight genes, including two LAR, one F3'H, three HCT, one DFR and one UDPGT, were increased in B vs A, and no significant difference was detected in C vs B and D vs C. One ANS and one F3'5'H were only increased in C vs D. In addition, that one gene (HCT) was up-regulated in B vs A, C vs B and D vs C. Two genes (2 HCT) were up-regulated in B vs A and C vs B but un-significantly differentially expressed in D vs C among all DEGs (Supplemental Table S12).
As shown, three class TFs with differential expressions, including 29 bHLHs (Supplemental Table S14), 32 MYBs (Supplemental Table S15), and 20 WRKYs (Supplemental Table S16), were identified based on the RNA-seq data. Among them, the expression pattern of some genes was consistent with the dynamic changes of anthocyanins. The results showed that the expression level of 14 bHLHs, 13 MYBs, and seven WRKYs TFs were first increased from bud to the third leaf of 'P113', eight bHLHs, six MYBs and 11 WRKYs were decreased from bud to third leaf with the tender shoot developmental of 'P113', and four bHLHs, two MYBs and two WRKYs were increased from bud to second leaf but decreased from second leaf to third leaf with the tender shoot developmental of 'P113'. It is worth noting that two MYBs were up-regulated in B vs A, C vs B and D vs C. Two bHLHs, two MYBs and one WRKY were up-regulated in B vs A, but un-significantly differentially expressed in C vs B and D vs C. Two MYBs and two WRKYs were up-regulated in C vs B and D vs C, but un-significantly differentially expressed in B vs A. Four bHLHs, two MYBs and two WRKYs were up-regulated in D vs C, but un-significantly differentially expressed in B vs A and C vs B.
Correlation analysis between DEGs and DEMs
-
Through this study, 70 differential metabolites, 53 DEGs, 29 bHLH TFs, 32 MYB TFs and 20 WRKY TFs were screened. In order to understand the biosynthetic regulatory network of flavonoids in 'P113', the relationship between DEMs and DEGs in different developmental stages were studied (bud to first leaf, first leaf to second leaf, second leaf to third leaf), and the regulatory role between DETFs and DEGs, through correlation network analysis (Fig. 3), it was found that 14 DEGs were significantly correlated with 12 DEMs during the development from bud to the first leaf, (R > 0.9) (Fig. 3a and Supplemental Table S17), nine DEGs were significantly correlated with 12 DEMs during the development from the first leaf to the second leaf, (R > 0.9) (Fig. 3b and Supplemental Table S18), and 12 DEGs were significantly correlated with 37 DEMs during the development from the second leaf to the third leaf, (R > 0.9) (Fig. 3c and Supplemental Table S19). Among them, from the bud to the first leaf development stage, the anthocyanin pigments cyanidin (ID: metab_5109) was differentially expressed, and eight genes were significantly related to it. At the development stage of the second leaf and the third leaf, the anthocyanin pigments pelargonidin (ID: metab_8219) with differential expression, and there were seven genes significantly related to it. Through the analysis of protein interaction relationship (Fig. 3d and Supplemental Table S20), it is found that among the eight genes significantly correlated with cornflower, one gene is Trinity_DN64030_c0_g1 (F3H) interacted well with other 11 proteins (transcription factors) (the comprehensive correlation score was greater than 0.7), which were DFR (0.999), TT7 (0.998), FLS1 (0.994), UGT78D2 (0.990), C4H (0.968), ANS (0.939), MYB12 (0.925), TT2 (0.878), MYB114 (0.809), MYB113 (0.807) and HCT (0.741). Among the seven genes significantly correlated with geranium, three genes had good interaction with other proteins: Gene Trinity_ DN2257_c0_g1 (FLS1) interacted well with nine proteins such as DFR (0.999), TT7 (0.997), F3H (0.994), C4H (0.960), UGT78D2 (0.979), MYB12 (0.945), HCT (0.793), TT2 (0.758) and ANS (0.700); Gene Trinity_ DN2781_c0_g1 (HCT) interacted well with nine proteins such as C4H (0.996),CCOAMT (0.946), CCoAOMT1 (0.910), SHT (0.907), AT4G26220 (0.807), FLS1 (0.793), TT7 (0.770), F3H (0.741) and DFR (0.703); Gene Trinity_DN13572_c0_g3 (SHT) interacted well with C4H (0.918) and HCT (0.907).
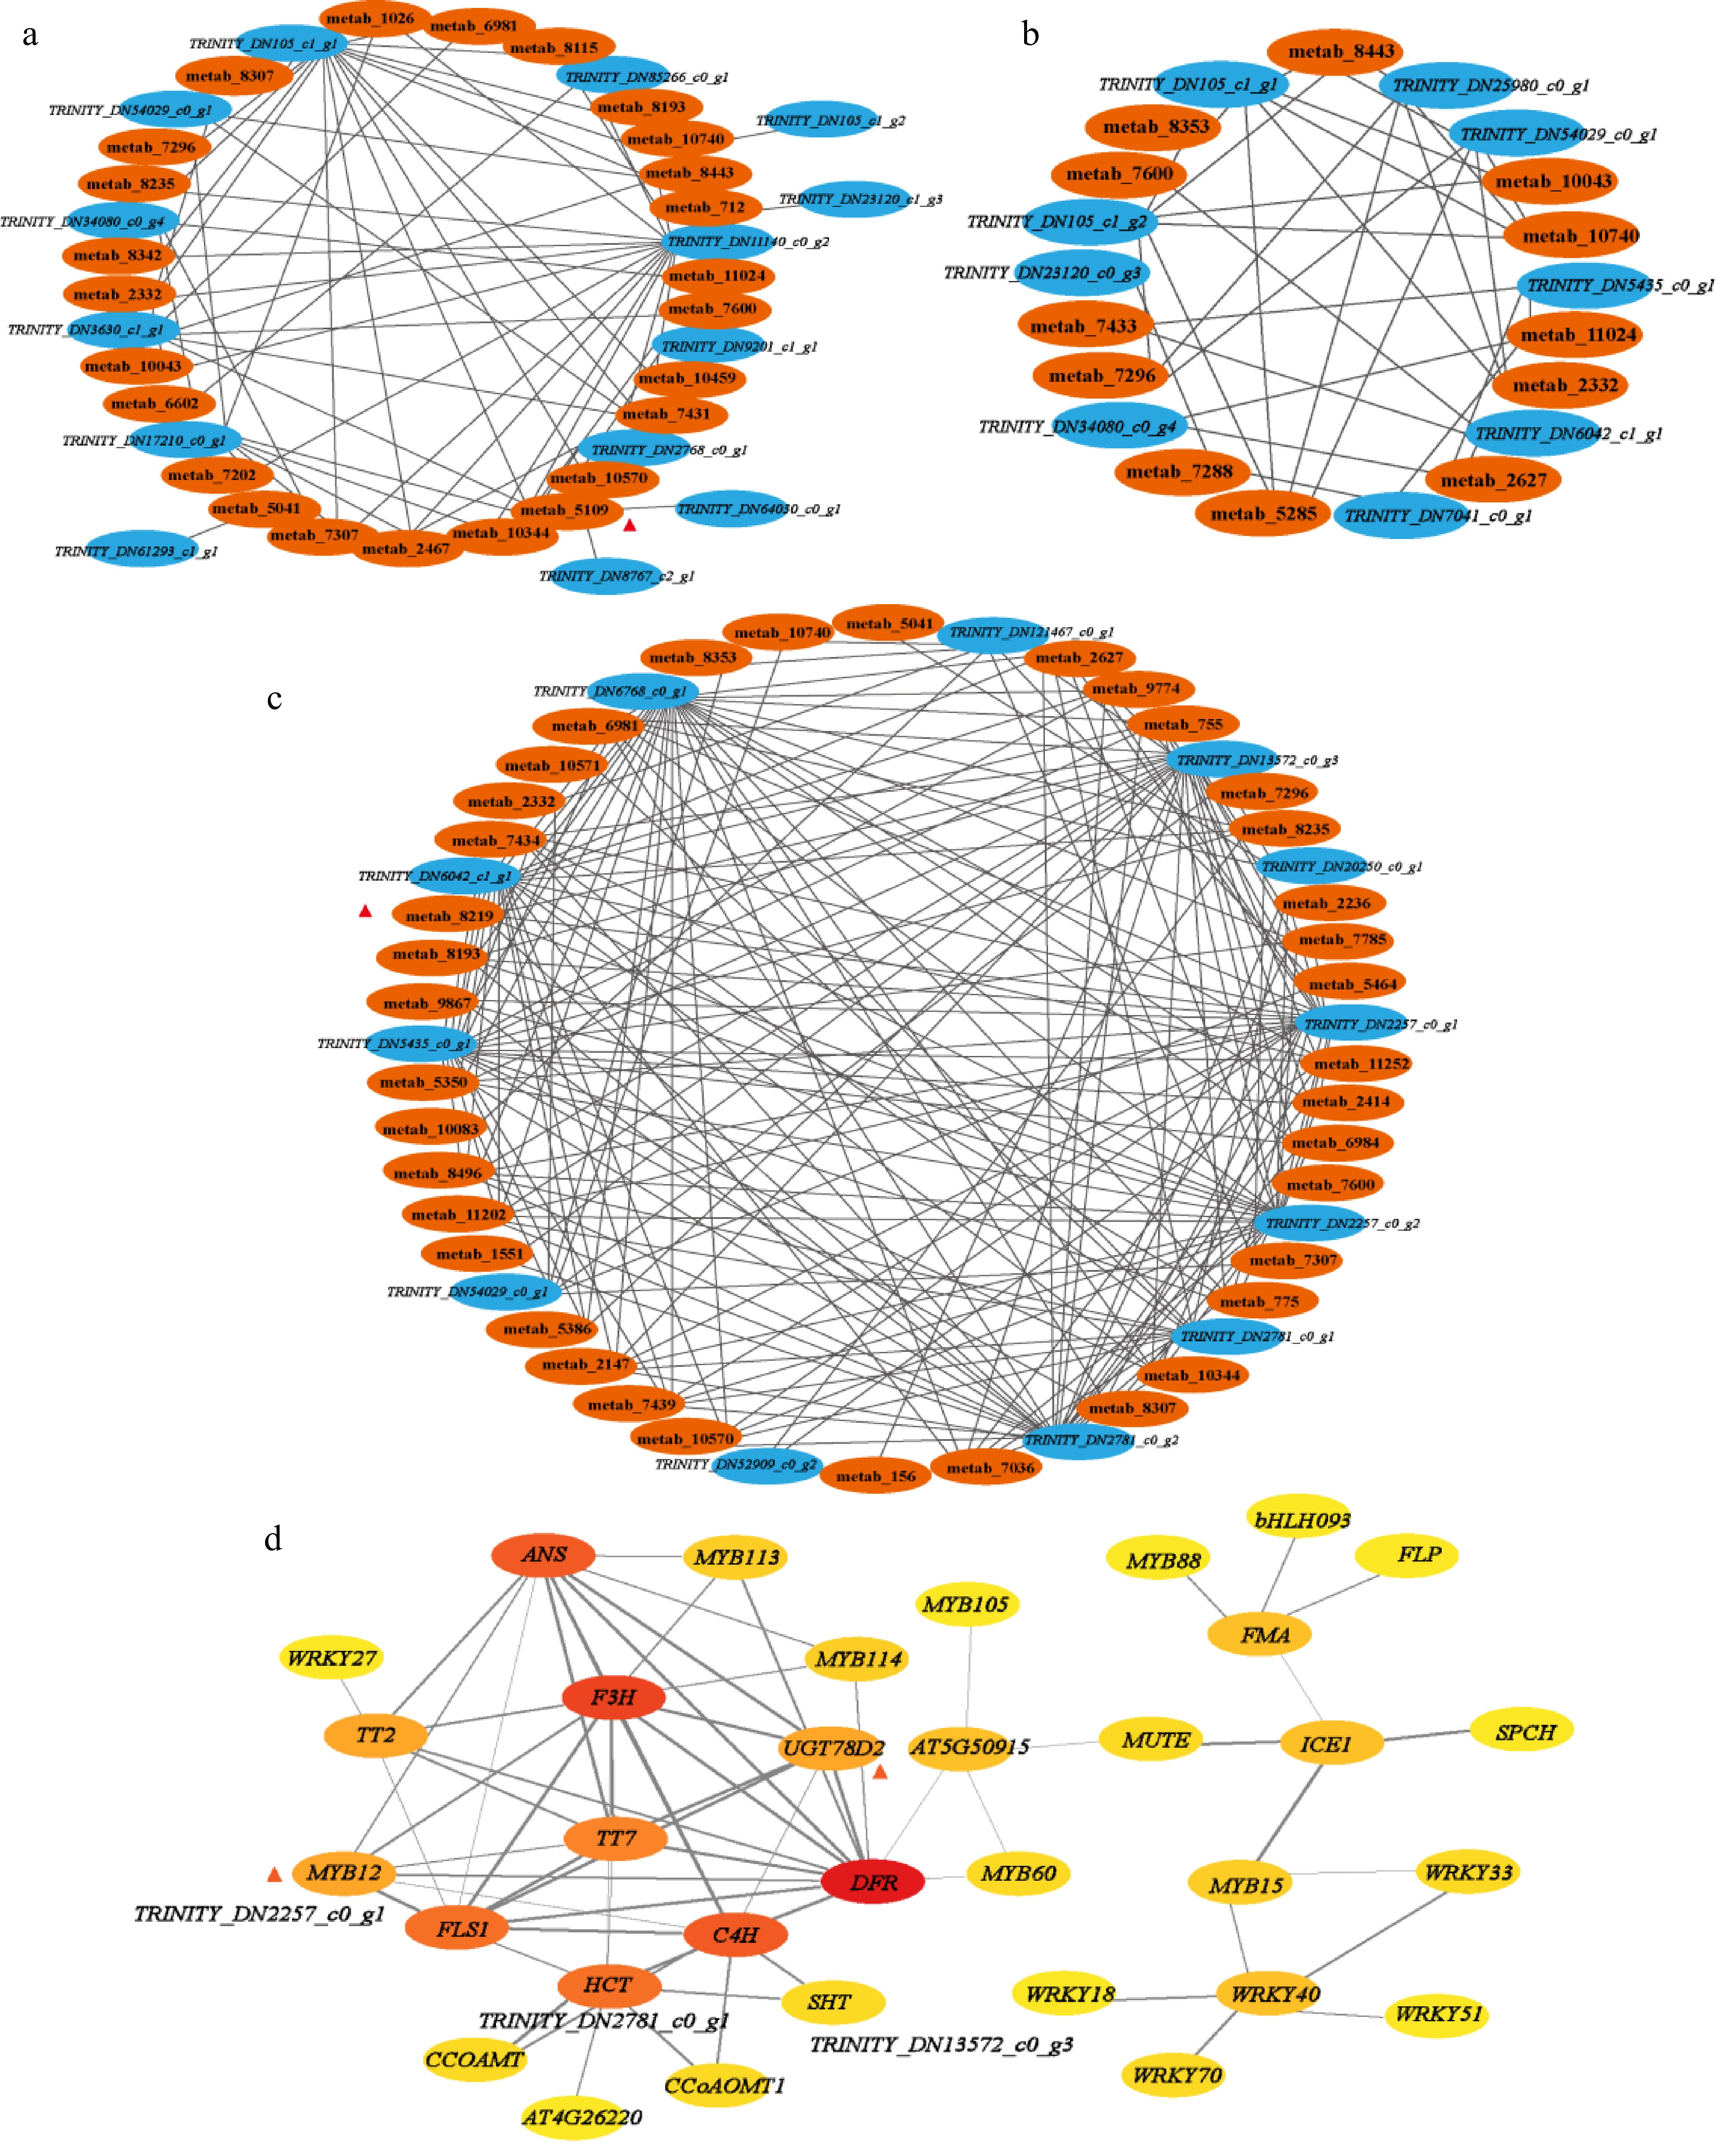
Figure 3.
Connection network of differential accumulation of flavonoids biosynthesis related metabolites and related genes: (a) stage of bud to first leaf, (b) stage of first leaf to second leaf, (c) stage of second leaf to third leaf, R > 0.9. (d) Protein interaction network between different genes. Score > 0.7.
Confirmation of DEGs in flavonoid biosynthesis of 'P113' by qRT-PCR
-
Seven structural genes (DEGs) and two TFs (DEGs) related to flavonoids/anthocyanin biosynthesis were determined by qRT-PCR in four tissues of 'P113'. As shown in Fig. 4, the expression of all selected genes showed a similar trend between qRT-PCR and RNA-seq and displayed a high correlation, and thus verified the transcriptome data.
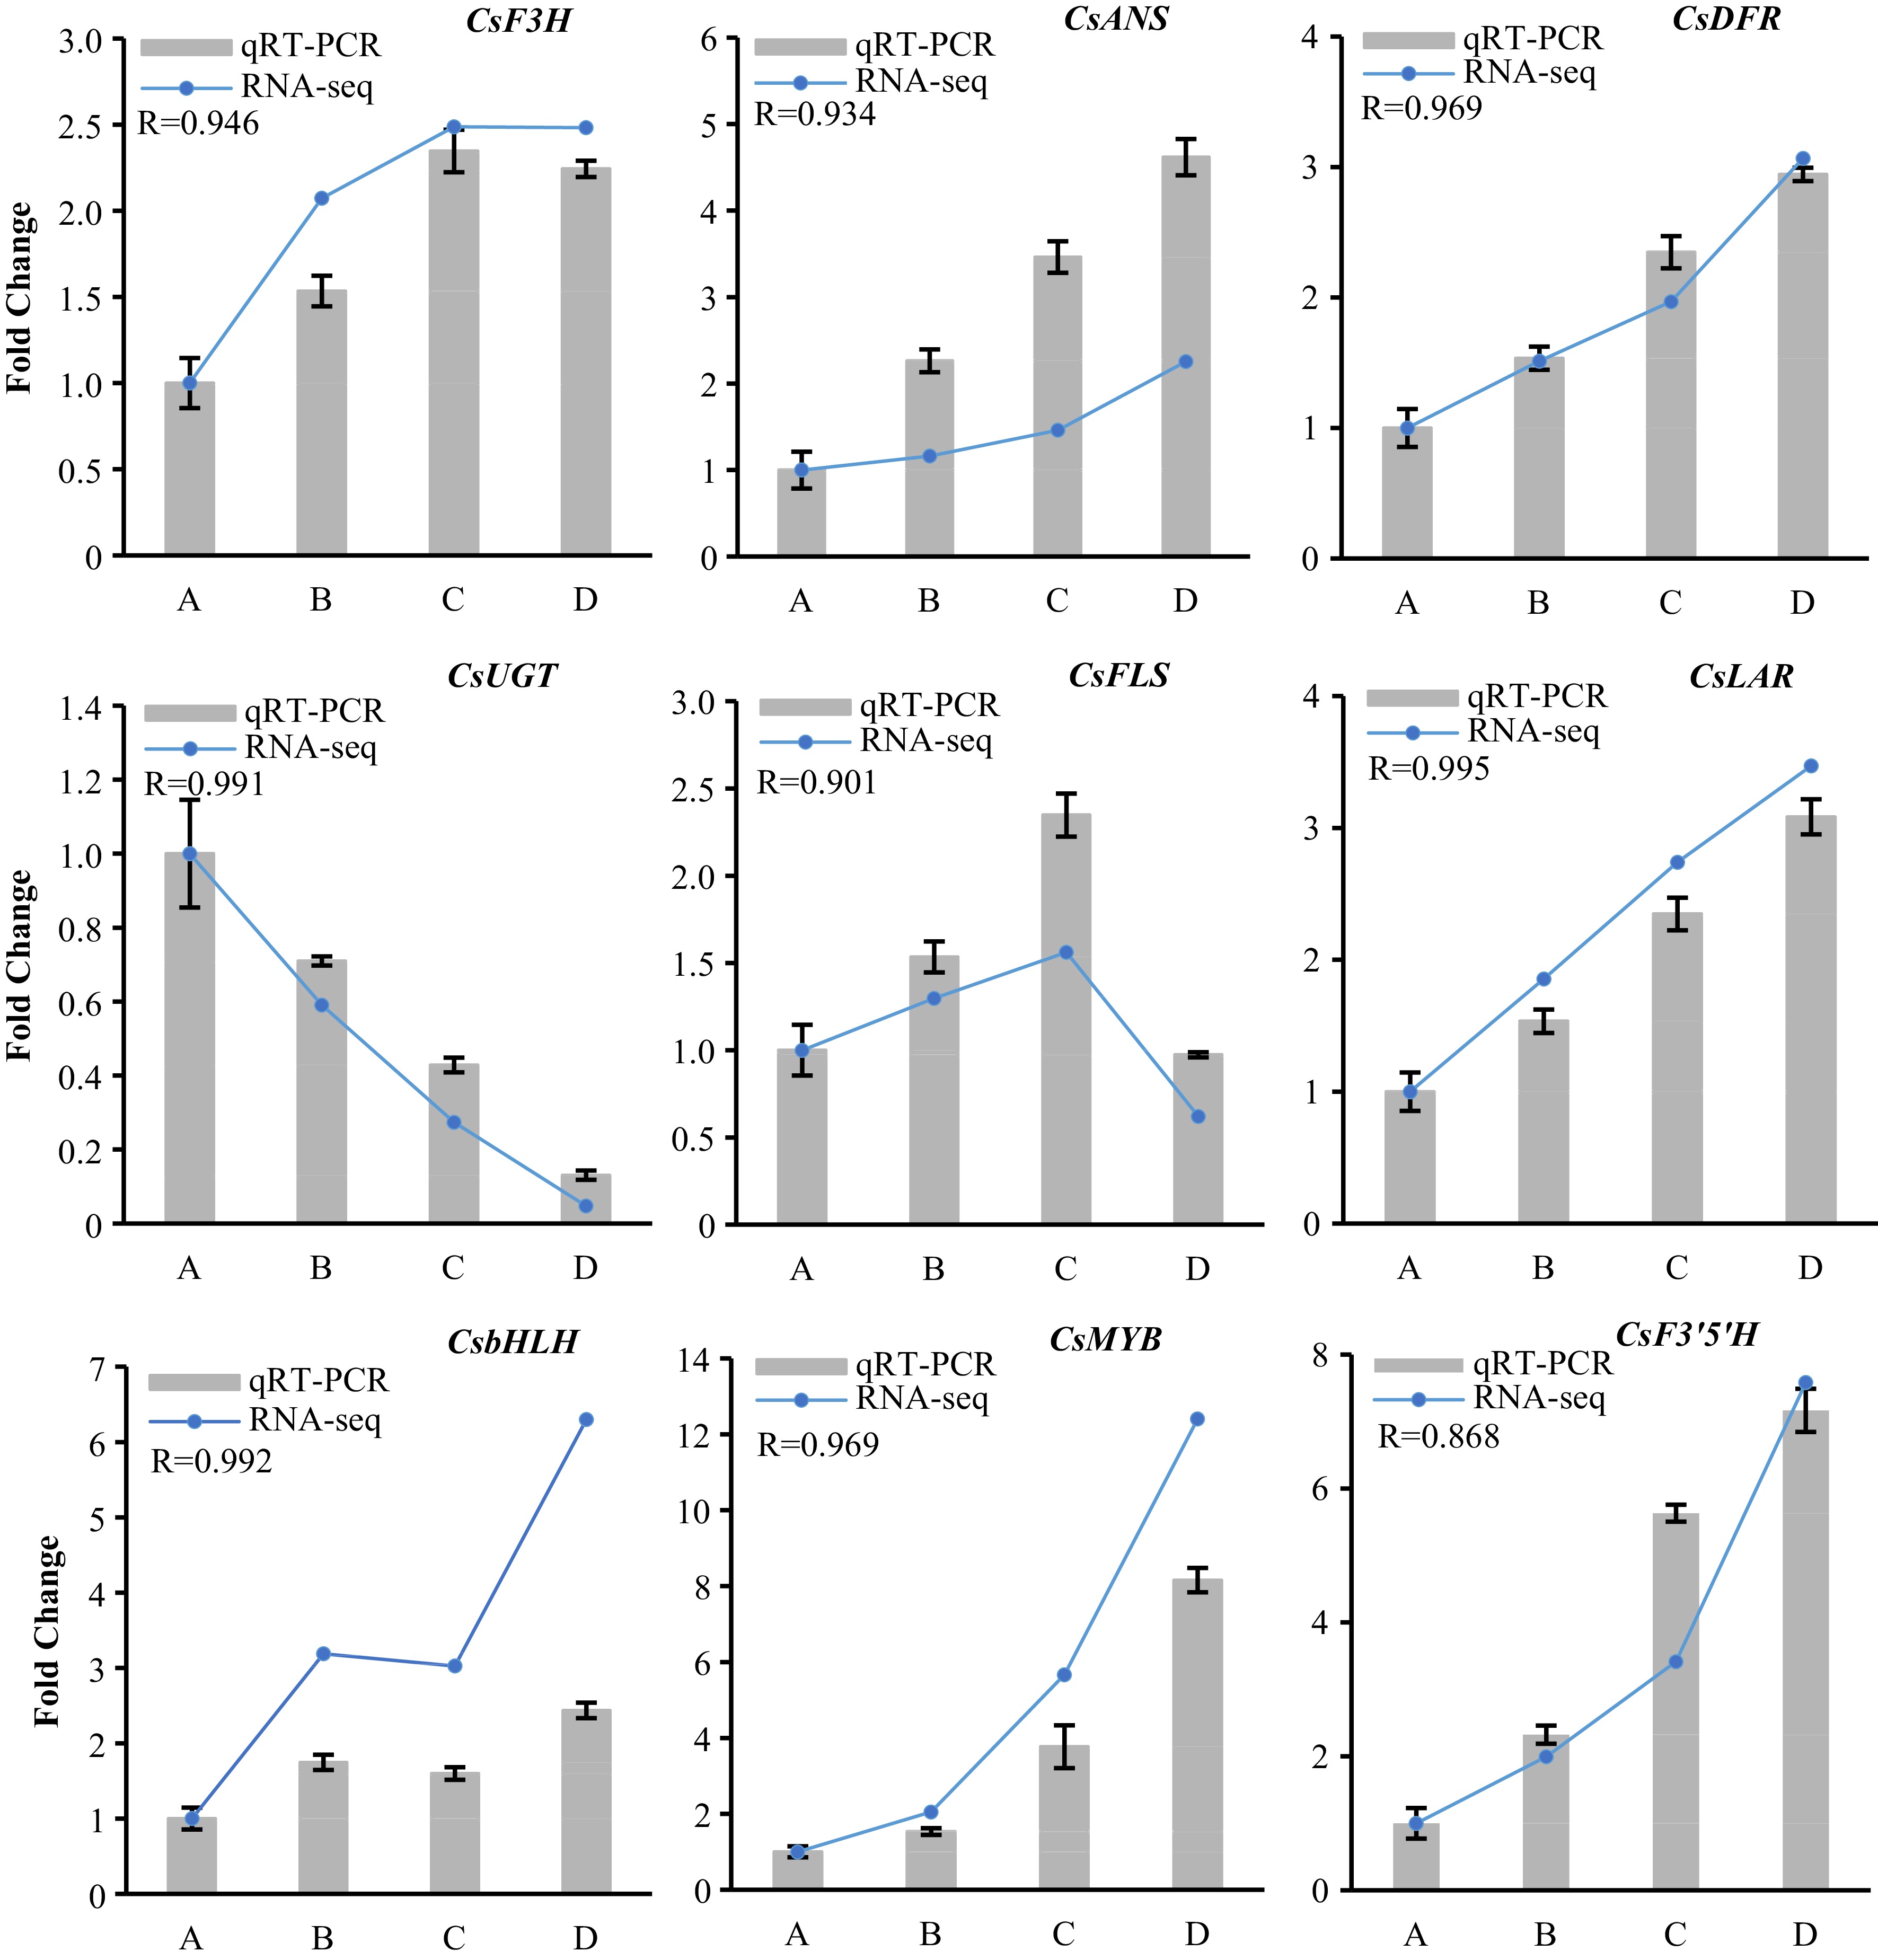
Figure 4.
Quantitative real-time PCR verified the flavonoid-biosynthesis related differentially expressed structure genes and TFs (DEGs) in developing tender shoots of ‘P113’. Relative expression levels of qRT-PCR were calculated using GADPH-actin as a standard. The Pearson correlation coefficient (R) represents correlation between qRT-PCR and RNA-seq of each tested gene in all samples.
-
Because of the important research value, researchers are shifting their attention to the ancienter and special tea genetic resources[25]. As a recently domesticated species, C. tachangensis is being developed into new tea products[26]. 'P113' is a purple tea germplasm that was discovered accidently and is different from the normal green tea plant. It is rich in flavonoids and anthocyanins, which provides good raw materials for the development of special products. However, very little is recognized about flavonoid composition and the molecular mechanism of flavonoid biosynthesis in the tender shoots of C. tachangensis. In the present study, we conducted a comprehensive transcriptome and metabolite analysis to identify the flavonoid compositions and the characteristics of the genes involved in flavonoid biosynthesis in developing tender shoots.
Flavonoids/anthocyanins contribute to the process of shoots purple in 'P113'
-
Previous studies have shown that flavonoids and anthocyanins are usually responsible for red, blue, and purple in plant tissues, and when their proportion is high enough, they can mask the green responsible for chlorophyll, resulting in different degrees of red, purple, or blue in plant tissues[27−29]. Shen et al. measured the total anthocyanin content of the tender branches of two purple tea cultivars, 'Zixin' and 'Zijuan', and discovered that the anthocyanin levels of purple leaves were consistently considerably greater than those of green leaves and believed that the significant accumulation of flavonoids/anthocyanins was the reason for the purple colour of tea leaves[4]. Through the initial determination of the total flavonoid contents in different developmental stages of tender shoots of 'P113', it was found that the accumulation mode of flavonoids in 'P113' was first increased and then decreased. As per previous studies, Li et al. evaluated the total flavonoid concentrations of a high-flavonoid tartary buckwheat variety at the initial filling stage, peak filling stage, and initial maturity stage, and discovered that as the seeds developed, the total flavonoid content first climbed and subsequently declined[30]. In the present study, the buds are primarily green, the first leaf is entirely purple, the second leaf is primarily purple with a tiny green tint at the leaf base, and the third leaf is almost evenly divided between purple and green. The total anthocyanin contents were determined, and it was found that the total anthocyanin contents were consistent with the degree of leaf color purple. Wang et al. considered that flavonol types and content contribute a lot to copigmentation, especially in bluing effect and deeper colors[31]. In the present study, 86 flavonoids were identified, which broadened our understanding of flavonoids in the purple plant of C. tachangensis P113 for the first time. Of these flavonoids, 70 metabolites were differentially expressed at least one comparison group. Kaempferol, myricetin, and quercetin derivatives with significant expression belong to flavonols. It was suggested that flavonoids metabolism is closely related to the purple-leaf phenotype of 'P113'.
DEMs and DEGs in the metabolic pathway
-
The expression of genes associated with flavonoids is influenced by the expression of related genes. Transcription factors and other variables also affect gene expression, and they are constantly able to either enhance or suppress one another[32−34]. Considering that there is no reference genome information of Camellia tachangensis we used reference-free genomes to process the transcriptome data in this study. This is a decision made before the start of the study. We tried to use 'Suchazao' as reference genome, but we found the comparison rate not high enough to meet our expectations as it still missed close to 20% of the genes, which may contain important information. In the present study, the pathway was carried out (Supplemental Fig. S9) according to the results of KEGG pathway (Supplemental Fig. S3), the DEMs (Supplemental Tables S5 & S6) and the DEGs (Supplemental Table S11). The flavonoid biosynthesis starts from the phenylalanine biosynthesis and generates neringenin chalcone and caffeoyl-COA through a series of enzymes such as PAL, 4CL, CYP73A and CHS. Then neringenin chalcone enters the flavone and flavonol biosynthesis under the action of CHI and F3H, and caffeoyl-COA enters the anthocyanin biosynthesis under the action of CHS and F3H, which are branches of the flavonoid biosynthesis. It is worth noting that, pigment substances pelargonidin was generated by dihydrokaempferol under the action of ANS from the flavone and flavonol biosynthesis, and dihydroquercetin was generated by dihydrokaempferol from the flavone and flavonol biosynthesis under the action of CYP75A and CYP75B1 to enter the anthocyanin biosynthesis. Mei et al. found that the main anthocyanins in 'Zijuan' are delphinidin, cyanidin and their glycosides[35]. However, in this study, the anthocyanins that showed differential expression in the process of leaf color change were mainly pelargonidin and cyanidin, which may be caused by different species. And the expression of pelargonidin showed irregular changes (first decreased, then increased, and then decreased), cyanidin increased gradually and delphinidin showed unsignificant differential expression with the development of tender shoots of P113. As the early substrate of anthocyanin synthesis, eriodictyol increased first and then decreased with the development of shoots. However, as the substrate of dihydrokaempferol, neringenin maintained a high expression (even slightly decreased with the development of shoots), so that the expression of dihydrokaempferol increased continuously under the action of F3H to add the amount of substrate for anthocyanin synthesis, at the same time, it also leads to the direct substrate competition between anthocyanin biosynthesis and flavone and flavonol biosynthesis.
Key factors of promoting the purple in tender shoots
-
Multigroup association analysis is often used to explore the external and internal connections for some scientific research purposes[36,37]. In 'Zijuan', Jiang et al. investigated the relationship between anthocyanin accumulation and the expression of related genes at various developmental stages and discovered that the expression levels of structural and regulatory genes at various developmental stages were significantly different and had a direct impact on the anthocyanin accumulation level. They suggested that the transcription factors bHLH, R2R3-MYB1, and R2R2-MYB2 might play a role in the expression of structural genes in the route for synthesising flavonoids, hence boosting the buildup of anthocyanins[38]. MYB12 is a member of the R2R3-MYB family and is thought to play a major role in the biosynthesis of flavonoids and anthocyanins[31,39]. It robustly activates the promoters of the enzymes chalcone synthase (CHS), flavanone 3-hydroxylase (F3H), flavonol synthase (FLS), and chalcone flavanone isomerase (CHI)[40]. But in the study of Chen et al., they found that CsMYB17 may play a key role in the regulation of cya-3-O-gal, del-3-O-gal, cya-3-O-glu and pel-3-O-glu[41]. MYB is the largest transcription factor family in plants. It plays an important role in plant growth and development, plant response to biotic and abiotic stresses, and regulation of plant secondary metabolite biosynthesis. The structure genes in 'P113' that are highly associated with the synthesis of anthocyanins, cyanidin and pelargonidin are F3H and FLS, and they have the highest score with MYB12 in protein interaction. It can be speculated that MYB12 is involved in the regulation of tender shoots purple of 'P113' and is a key factor. Xie et al. reviewed the research progress of UDP-glycosyltransferase related to plant flavonoid biosynthesis and suggested that UGT78D2 greatly promoted the biosynthesis of quercetins[42]. In whole cell biotransformation of quercetin utilizing E. coli carrying AtUGT78D2, Kim et al. demonstrated that UGT78D2 may employ UDP-N-acetylglucosamine as a sugar donor and created quercetin 3-O-N-acetylglucosamine[43]. Lee et al. reported that UGT78D2 can catalyze the glycosylation of flavonol and anthocyanin, promote the metabolic flux of anthocyanin, and make the seed coats of Arabidopsis purple[44]. UGT glucosyltransferase 78D2 (UGT78D2), belonging to UDP glycosyltransferase family, specifically glycosylates the 3-position of flavonoid C-ring, such as anthocyanin and geranium, and flavonols such as kaempferol and quercetin are acceptable substrates[45]. However, during the purple process of 'P113', UGT78D2 has a good interaction with the purple gene. It is speculated that it is involved in the regulation and is the key factor of the purple tender shoots of 'P113'.
In conclusion, these findings supported our hypothesis that the accumulation of flavonoids/anthocyanins is closely associated to purple tender shoots of C. tachangensis 'P113', and the accumulation of these substances is regulated by some structural genes and transcription factors, which are also considered to be beneficial to the biosynthesis of anthocyanins in other plants.
This work was supported by the Project of the National key R & D plan (2021YFD1200203-1), Science and Technology Plan Project of Guizhou province, in RP China ([2019]1404), Project of the National Science Foundation, in RP China (32060700), Project of the key field project of Natural Science Foundation of Guizhou Provincial Department of education (KY [2021] 042), Science and Technology Plan Project of Guizhou province, in RP China([2021] General Project 126) and Project of the National key R & D plan (2021YFD1100307)
-
The authors declare that they have no conflict of interest.
- Supplemental Table S1 Primers for 9 DEG related to flavonoid biosynthesis for qRT PCR analysis.
- Supplemental Table S2 86 flavonoids metabolites identified by metabolome and classification.
- Supplemental Table S3 Metabolite information and its relative expression in cluster heat map.
- Supplemental Table S4 Expression of flavonoids in different comparison groups.
- Supplemental Table S5 Up-set venn analysis of common or unique metabolites between different comparison groups.
- Supplemental Table S6 KEGG pathway enrichment of differential metabolites.
- Supplemental Table S7 Summary statistics of RNA-seq results of tender shoots of ‘P113’.
- Supplemental Table S8 Transcriptome de novo assembly.
- Supplemental Table S9 Go function annotation and classification.
- Supplemental Table S10 Statistics of KEGG pathway enrichment quantity.
- Supplemental Table S11 Significantly enriched KEGG pathway.
- Supplemental Table S12 DEGs in different comparison groups.
- Supplemental Table S13 Structural genes in differentially expressed genes.
- Supplemental Table S14 Differentially expressed bHLH transcription factors.
- Supplemental Table S15 Differentially expressed MYB transcription factors.
- Supplemental Table S16 Differentially expressed WRKY transcription factors.
- Supplemental Table S17 Correlation between differentially expressed metabolites and differentially expressed genes in BvsA.
- Supplemental Table S18 Correlation between differentially expressed metabolites and differentially expressed genes in CvsB.
- Supplemental Table S19 Correlation between differentially expressed metabolites and differentially expressed genes in DvsC.
- Supplemental Table S20 Protein interaction score between differentially expressed genes and differentially expressed transcription factors.
- Supplemental Fig.S1 Classification pie chart of flavonoids. Each color represents a classification, and the area size of each color represents the proportion of classification.
- Supplemental Fig. S2 Differential accumulation of flavonoids metabolites during tender shoots development of P113. (a), (b), (c), (d), (e)and (f) represents the clustering heat map of flavonoids metabolites with differences among Bvs.A, Cvs.A, Dvs.A, Cvs.B, Dvs.B and Dvs.C groups respectively. A is the bud (P1), B is the first leaf (P2), C is the second leaf (P3) and D is the third leaf (P4).
- Supplemental Fig. S3 The differential metabolites of flavonoids were enriched by KEGG pathway (P < 0.05). Flavonoid biosynthesis is the pathway of ko00941. Flavone and flavonol biosynthesis is the pathway of ko00944. Anthocyanin biosynthesis is the pathway of ko00942.
- Supplemental Fig. S4 Clustered gene expression profiles from developing tender shoots. The clusters were defined on the basis of gene temporal expression profile in R using the k-means method. The y axis represents the standardized TPM value of genes, and the x axis represents the different samples.
- Supplemental Fig. S5 Correlation heat map between samples. On the right and below are the sample names, and on the left and above are the sample clusters, and Group A in orange, Group B in blue, Group C in green and Group D in red. Different colors represent the size of the correlation coefficient between samples, and the more red the color, the greater the correlation, and the bluer the color, the smaller the correlation. The value in the color block is the correlation coefficient.
- Supplemental Fig. S6 GO functional annotation analysis of differential genes in the development of tender shoots of P113. The abscissa represents the secondary classification of GO, the ordinate represents the number of unigenes included in the secondary classification, and the lower three colors represent the three branches of GO (BP, CC, MF).
- Supplemental Fig. S7 Histogram of KEGG, The ordinate is the name of KEGG metabolic pathway, and the abscissa is the number of unigenes annotated to the pathway. KEGG metabolic pathways can be divided into seven categories: metabolism, genetic information processing, environmental information processing, cellular processes, organic systems, human diseases and drug development.
- Supplemental Fig S8 Number of significantly flavonoid related DEGs in the developing of tender shoots of P113.
- Supplemental Fig. S9 Metabolites and Structure genes expression profile. The heat map color block shows the changes of metabolite expression in the four tissues of A, B, C and D from left to right: A represents bud, B represents the first leaf, C represents the second leaf and D represents the third leaf. The orange box on the left is flavone and flavonol biosynthesis, and the right purple box is anthocyanin biosynthesis.
- Copyright: © 2023 by the author(s). Published by Maximum Academic Press, Fayetteville, GA. This article is an open access article distributed under Creative Commons Attribution License (CC BY 4.0), visit https://creativecommons.org/licenses/by/4.0/.
-
About this article
Cite this article
Li F, Deng X, Huang Z, Zhao Z, Li C, et al. 2023. Integrated transcriptome and metabolome provide insights into flavonoid biosynthesis in 'P113', a new purple tea of Camellia tachangensis. Beverage Plant Research 3:3 doi: 10.48130/BPR-2023-0003 

Integrated transcriptome and metabolome provide insights into flavonoid biosynthesis in 'P113', a new purple tea of Camellia tachangensis
- Received: 13 November 2022
- Accepted: 03 January 2023
- Published online: 02 February 2023
Abstract: Plants typically exhibit the purple phenomenon as a result of an increase in flavonoids and anthocyanins. A new tea germplasm 'P113' was recently selected from Camellia tachangensis, which is purple in tender shoots. In the present study, integrated transcriptome and metabolome were used to analyze the flavonoid metabolite components and the genes involved in flavonoid biosynthesis in 'P113'. A total of 86 flavonoid metabolites were identified, including 70 significantly differential metabolites (p < 0.05) and they were enriched to the three metabolic pathways of ko00941, ko00942 and ko00944 through KEGG pathway analysis. A total of 136 flavonoid involved genes were obtained from transcriptomic study, of which 53 were significantly differentially expressed in developmental shoots. The correlation between metabolite profiling and transcriptome, transcriptome and protein interactions suggested that transcription factor MYB12 and glycosyltransferase UGT78D2 had a good facilitation on purple tender shoots. The metabolic pathways and potential genes that underlie the coloration of the shoots in 'P113' are clarified in this study. It also lays the groundwork for identifying potential genes involved in color variation and offers a theoretical framework for the creation and use of distinctive genetic resources and the breeding of new cultivars.
-
Key words:
- Camellia tachangensis /
- Metabolome /
- Transcriptome /
- Flavonoids /
- Purple tender shoots.