


-
Landslide, as one of the most common geological disasters in nature, poses a serious threat to the safety of human life and property, and earthquake is one of the main factors inducing landslide disasters. With the rapid development in recent years of Geographic Information System (GIS), the processing of regional information about landslide susceptibility has become faster and more convenient[1]. On this basis, the analysis method of regional landslide disasters has also been continuously improved and developed. However, the occurrence of landslide disasters in a wide area is controlled by many influencing factors, and the high-dimensional nonlinear characteristics between these influencing factors and landslide susceptibility determine that the regional landslide disaster is a complex process that changes with the dynamic space of the external environment, which is worthy of further study[2].
The evaluation of landslide susceptibility is to analyze and evaluate the relative possibility of slope instability under the conditions of influencing factors in the study area on the basis of existing landslide inventory data[3−5]. Generally, the evaluation methods of regional landslide susceptibility can be divided into two categories: deterministic method and non-deterministic method. The deterministic analysis method is mainly based on the mechanism analysis of landslide occurrence, and uses different mechanical or physical models to evaluate the slope stability. Common deterministic methods include limit equilibrium analysis and Newmark permanent displacement method. Non-deterministic methods mainly use statistical methods to establish a quantitative evaluation model of various influencing factors and known landslides, and then use the model to evaluate the landslide susceptibility of the study area[6−8].
The deterministic method has clear physical and mechanical significance. Saade et al.[9] used the limit equilibrium analysis method to analyze the relationship between soil strength parameters, slope angle and critical acceleration of instability when the safety factor is equal to 1, and obtained the fitting curve, which was used to calculate and evaluate the landslide susceptibility of the Beiling earthquake in 1994. Jibson et al.[10,11] obtained a simple Newmark model based on Arias strength by analyzing 11 ground motion records in 1993, and then collected 30 earthquakes worldwide in 2007, with a total of 2,270 ground motion records. Using these records, four simplified permanent displacement models based on Arias strength, critical acceleration and critical acceleration ratio were established. The simplified model based on the critical acceleration ratio has become one of the most widely used regional landslide assessment models. Romeo[12] modified Jibson's displacement model by using 190 ground motion records recorded by 98 stations of 17 earthquakes in Italy, and proposed a simplified model applicable to Italy.
The high-dimensional nonlinear characteristics of the non-deterministic are consistent with the complexity of the regional influencing factors, and it has a wider application than the deterministic method. The commonly used statistical methods of uncertain methods include: analytic hierarchy process, random forest, Bayesian, artificial neural network, support vector machine, logical regression, deep learning, etc. Table 1 lists the selection of landslide influencing factors and methodology of some relevant researches. The common influencing factors are mainly about terrain, geology and seismology. Gigovic et al.[13] used the Best–Worst methodology to carry out the landslide susceptibility assessment in the region of the Republic of Serbia based on 1082 landslide data. Xu et al.[14] selected ten landslide influencing factors to analyze the landslide susceptibility of Deyang City, Sichuan Province under the Wenchuan earthquake using the evidence weight method. Traditional statistical methods have obvious shortcomings in expressing nonlinear characteristics due to the fact that it could be hard for using simple coefficient or index to describe the complex relation within multiple factors, so scholars tried to apply the machine learning method to the susceptibility assessment of geological disasters[15−18]. Xu et al.[19] used SVM to carry out susceptibility analysis on landslides caused by the Wenchuan earthquake in 2012, applied three different ratio of sample groups and four different kernel functions for analysis, and found that the accuracy obtained by using radial basis function is the best. Yao et al.[20] used one-classification, two-classification support vector machines and logistic regression methods respectively to evaluate the landslide susceptibility in Hong Kong, and found that the two-classification vector machines had the best calculation results. Ma & Xu[21] combined the permanent displacement model with support vector machine and applied logistic regression and SVM respectively to analyze the landslide susceptibility. The results showed that the combination of permanent displacement and SVM was superior to the results of a single permanent displacement model.
Table 1. Overview of selection of influencing factors and methodology.
Reference Year Influencing factors Methodology Gigovic et al.[13] 2019 Elevation, slope, aspect, distance to road network, distance to river, distance to fault, lithology, NDVI, terrain wetness index (TWI), stream power index (SPI), sediment transport index (STI), annual rainfall, distance to urban area, and land use rate Multi-criteria decision analysis best–worst methodology Xu et al.[14] 2012 Slope, aspect, slope curvature, elevation, surface catchment, drainage distance, road distance, lithology, fault distance, and NDVI Weight of evidence modeling Xu et al.[19] 2012 Elevation, slope angle, slope direction, fault distance, river distance, and lithology Support vector machine Yao et al.[20] 2008 Lithology, slope angle, slope aspect, elevation and vegetation Support vector machine Ma & Xu[21] 2019 Permanent displacement, critical acceleration, terrain, peak ground acceleration, river distance, and road distance Newmark model, support vector machine, logic regression With an increasing preference towards machine learning methods, various algorithms have been applied for landslide susceptibility mapping. However, in most studies, only one to three types of machine learning methods are used and compared, lacking comparative analysis of performance between multiple algorithms[22]. In the present research, we aim to generate landslide susceptibility zonation maps in the affected area of the 2013 Min-Zhang earthquake and compare the accuracy and performance of different commonly used machine learning algorithms comprehensively. The accuracy assessment of the produced landslides zonation maps is evaluated using the determination coefficient and receiver operating characteristic curve (ROC).
-
The position of study area is in the 2013 Ms6.6 Min-Zhang earthquake affected region of Lanzhou Province, northwest China. The Min-Zhang earthquake occurred at 07:45 on July 22, 2013, and the epicenter was located at 34.50° N, 104.20° E, situating in the junction of Min County and Zhang County, as shown in Fig. 1. The Ms6.6 Min-Zhang earthquake had a shallow focus of 20 km and it was caused by the tectonic activity of Lintan-Dangchang fault. The affected areas of Min-Zhang earthquake mainly contained Min County, Zhang County, Wushan County, Zhuoni County, and Dangchang County. The seismic intensity map is illustrated in Fig. 1. The maximum intensity of Min-Zhang earthquake reached VIII degree, covering an area of 706 km2. The Min-Zhang earthquake caused a total of 95 deaths, five missing and more than 800 injuries. The study area was selected based on the square area of earthquake affected region, covering an area of 15,300 km2 (Fig. 1). A large number of geological disasters were induced by the severe seismic motion and the deposit of landslide buried the neighboring villages and roads, posing a significant threat to the safety of public and traffic.
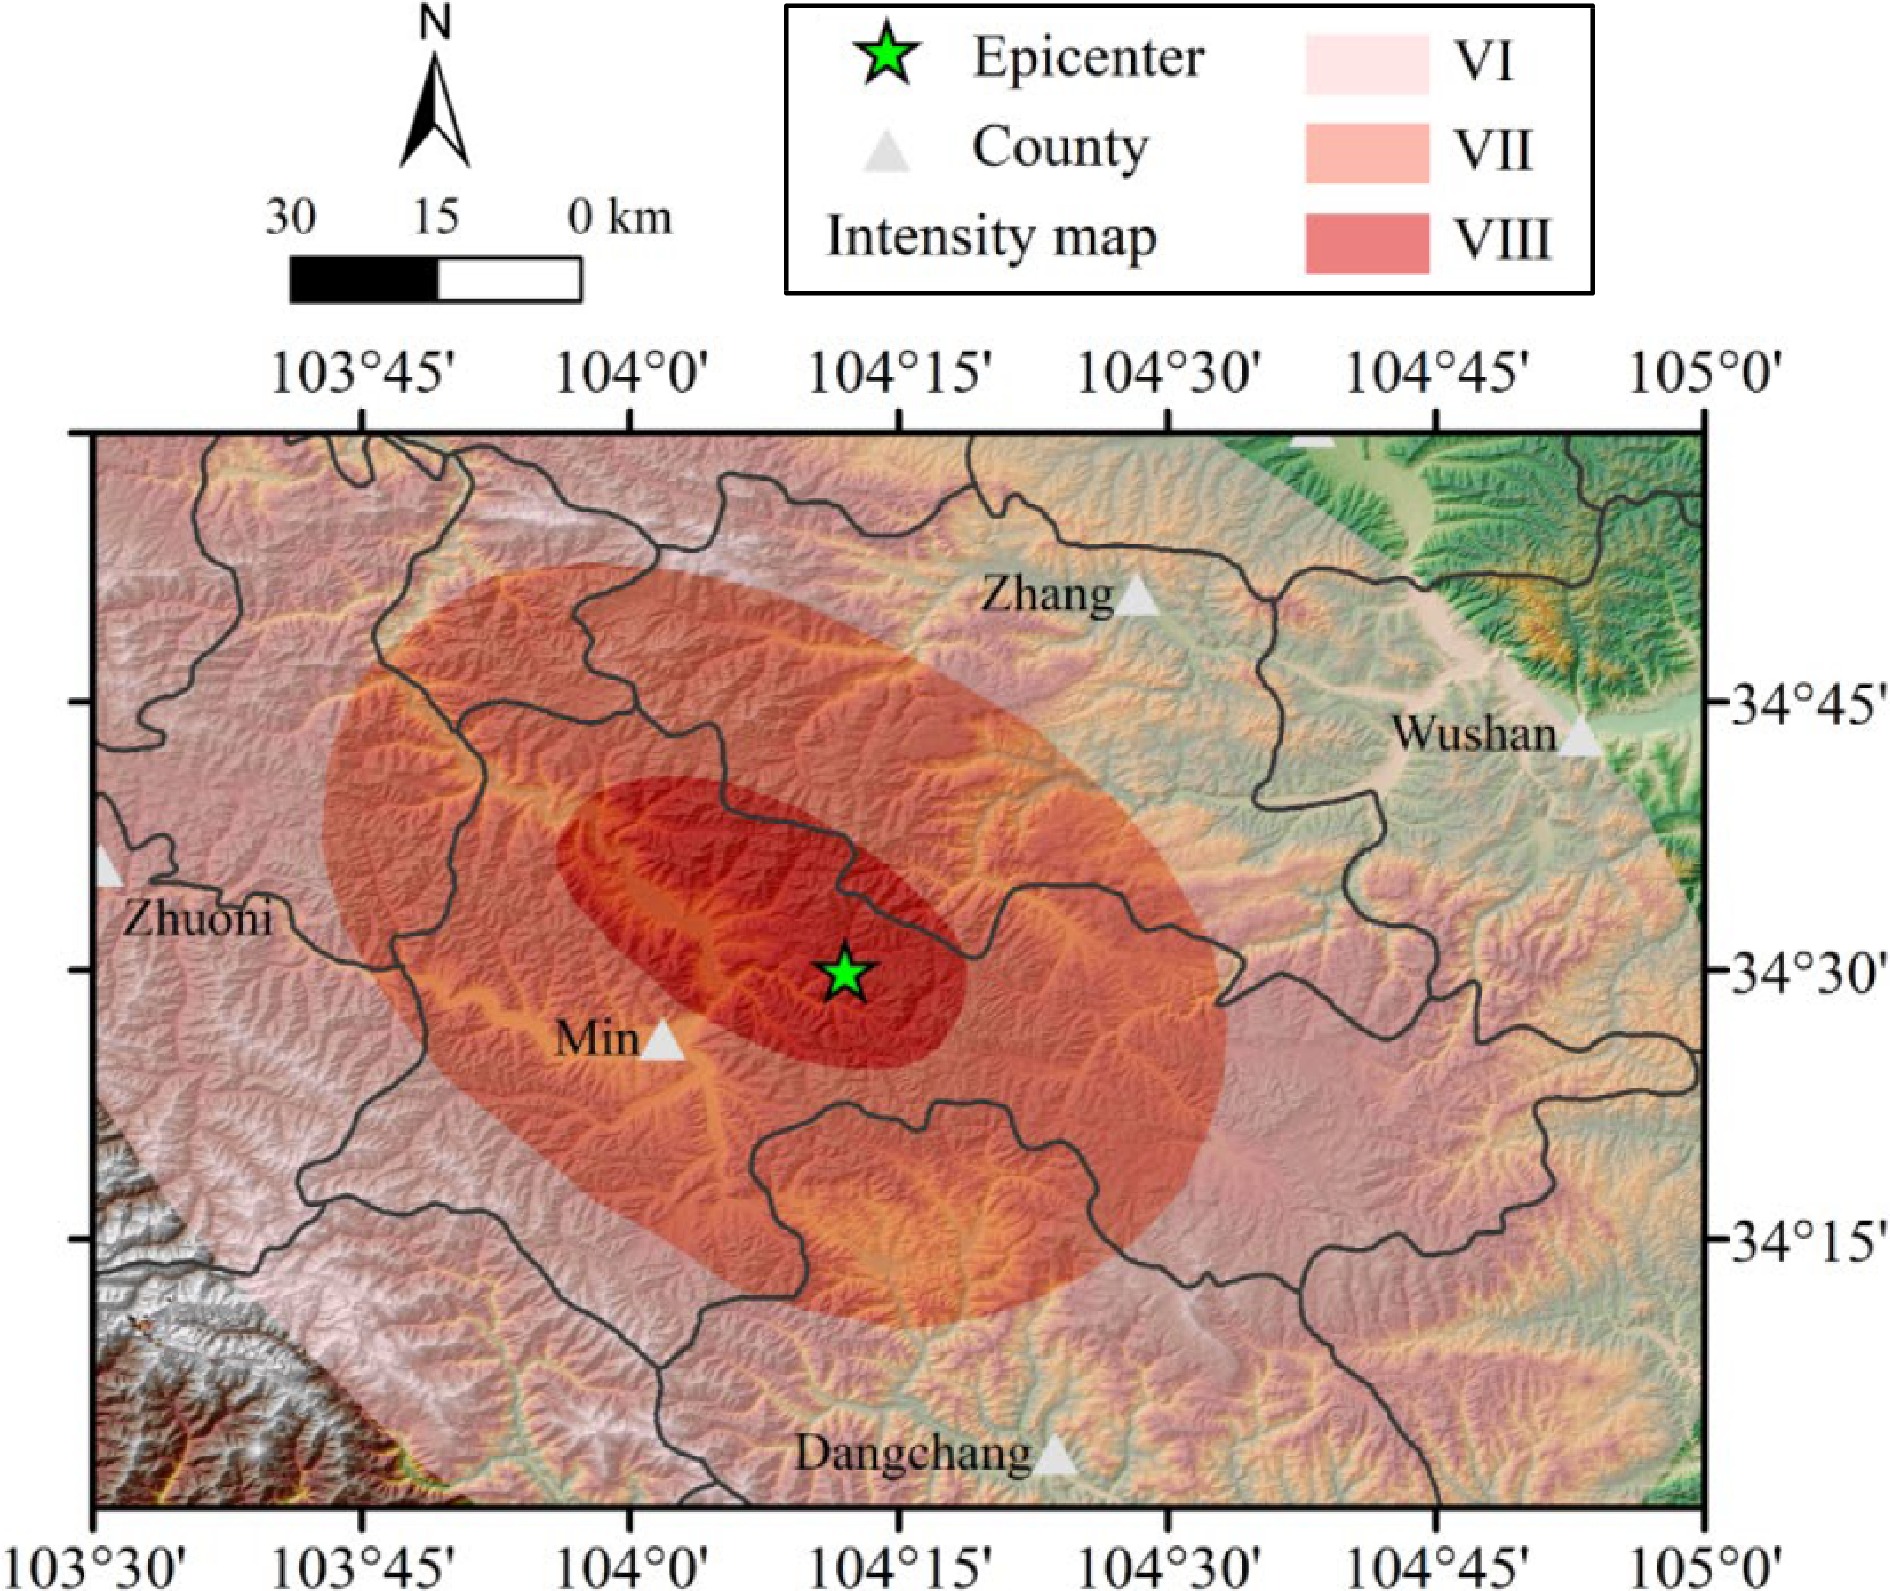
Figure 1.
Location of the 2013 Ms6.6 Min-Zhang earthquake.
The flow chart in Fig. 2 shows the entire model frame work for seismic landslide susceptibility mapping using machine learning methods. A study process including the phases as here influencing factor collection, sample collection, model training, model testing, and susceptibility mapping is followed. The influencing factors considered in the presented research contains peak ground acceleration (PGA), epicenter distance, elevation, slope, aspect, plan curvature, profile curvature, fault distance, river distance, and normalized difference vegetation index (NDVI). The seismic landslide inventory of the Min-Zhang earthquake is adopted as the samples of seismic landslide. Five commonly used machine learning methods including K Nearest Neighbors (KNN), Naive Bayes (NB), Random Forest (RF), Logistic Regression (LR), and Support Vector Machine (SVM) are used to construct the evaluation model of seismic landslide susceptibility. And the performance of five target models is compared with the receiver operator characteristic (ROC) curve. Finally, the susceptibility of seismic landslide is mapped using geographical information system (GIS) to illustrate the spatial distribution of landslide occurrence probability.
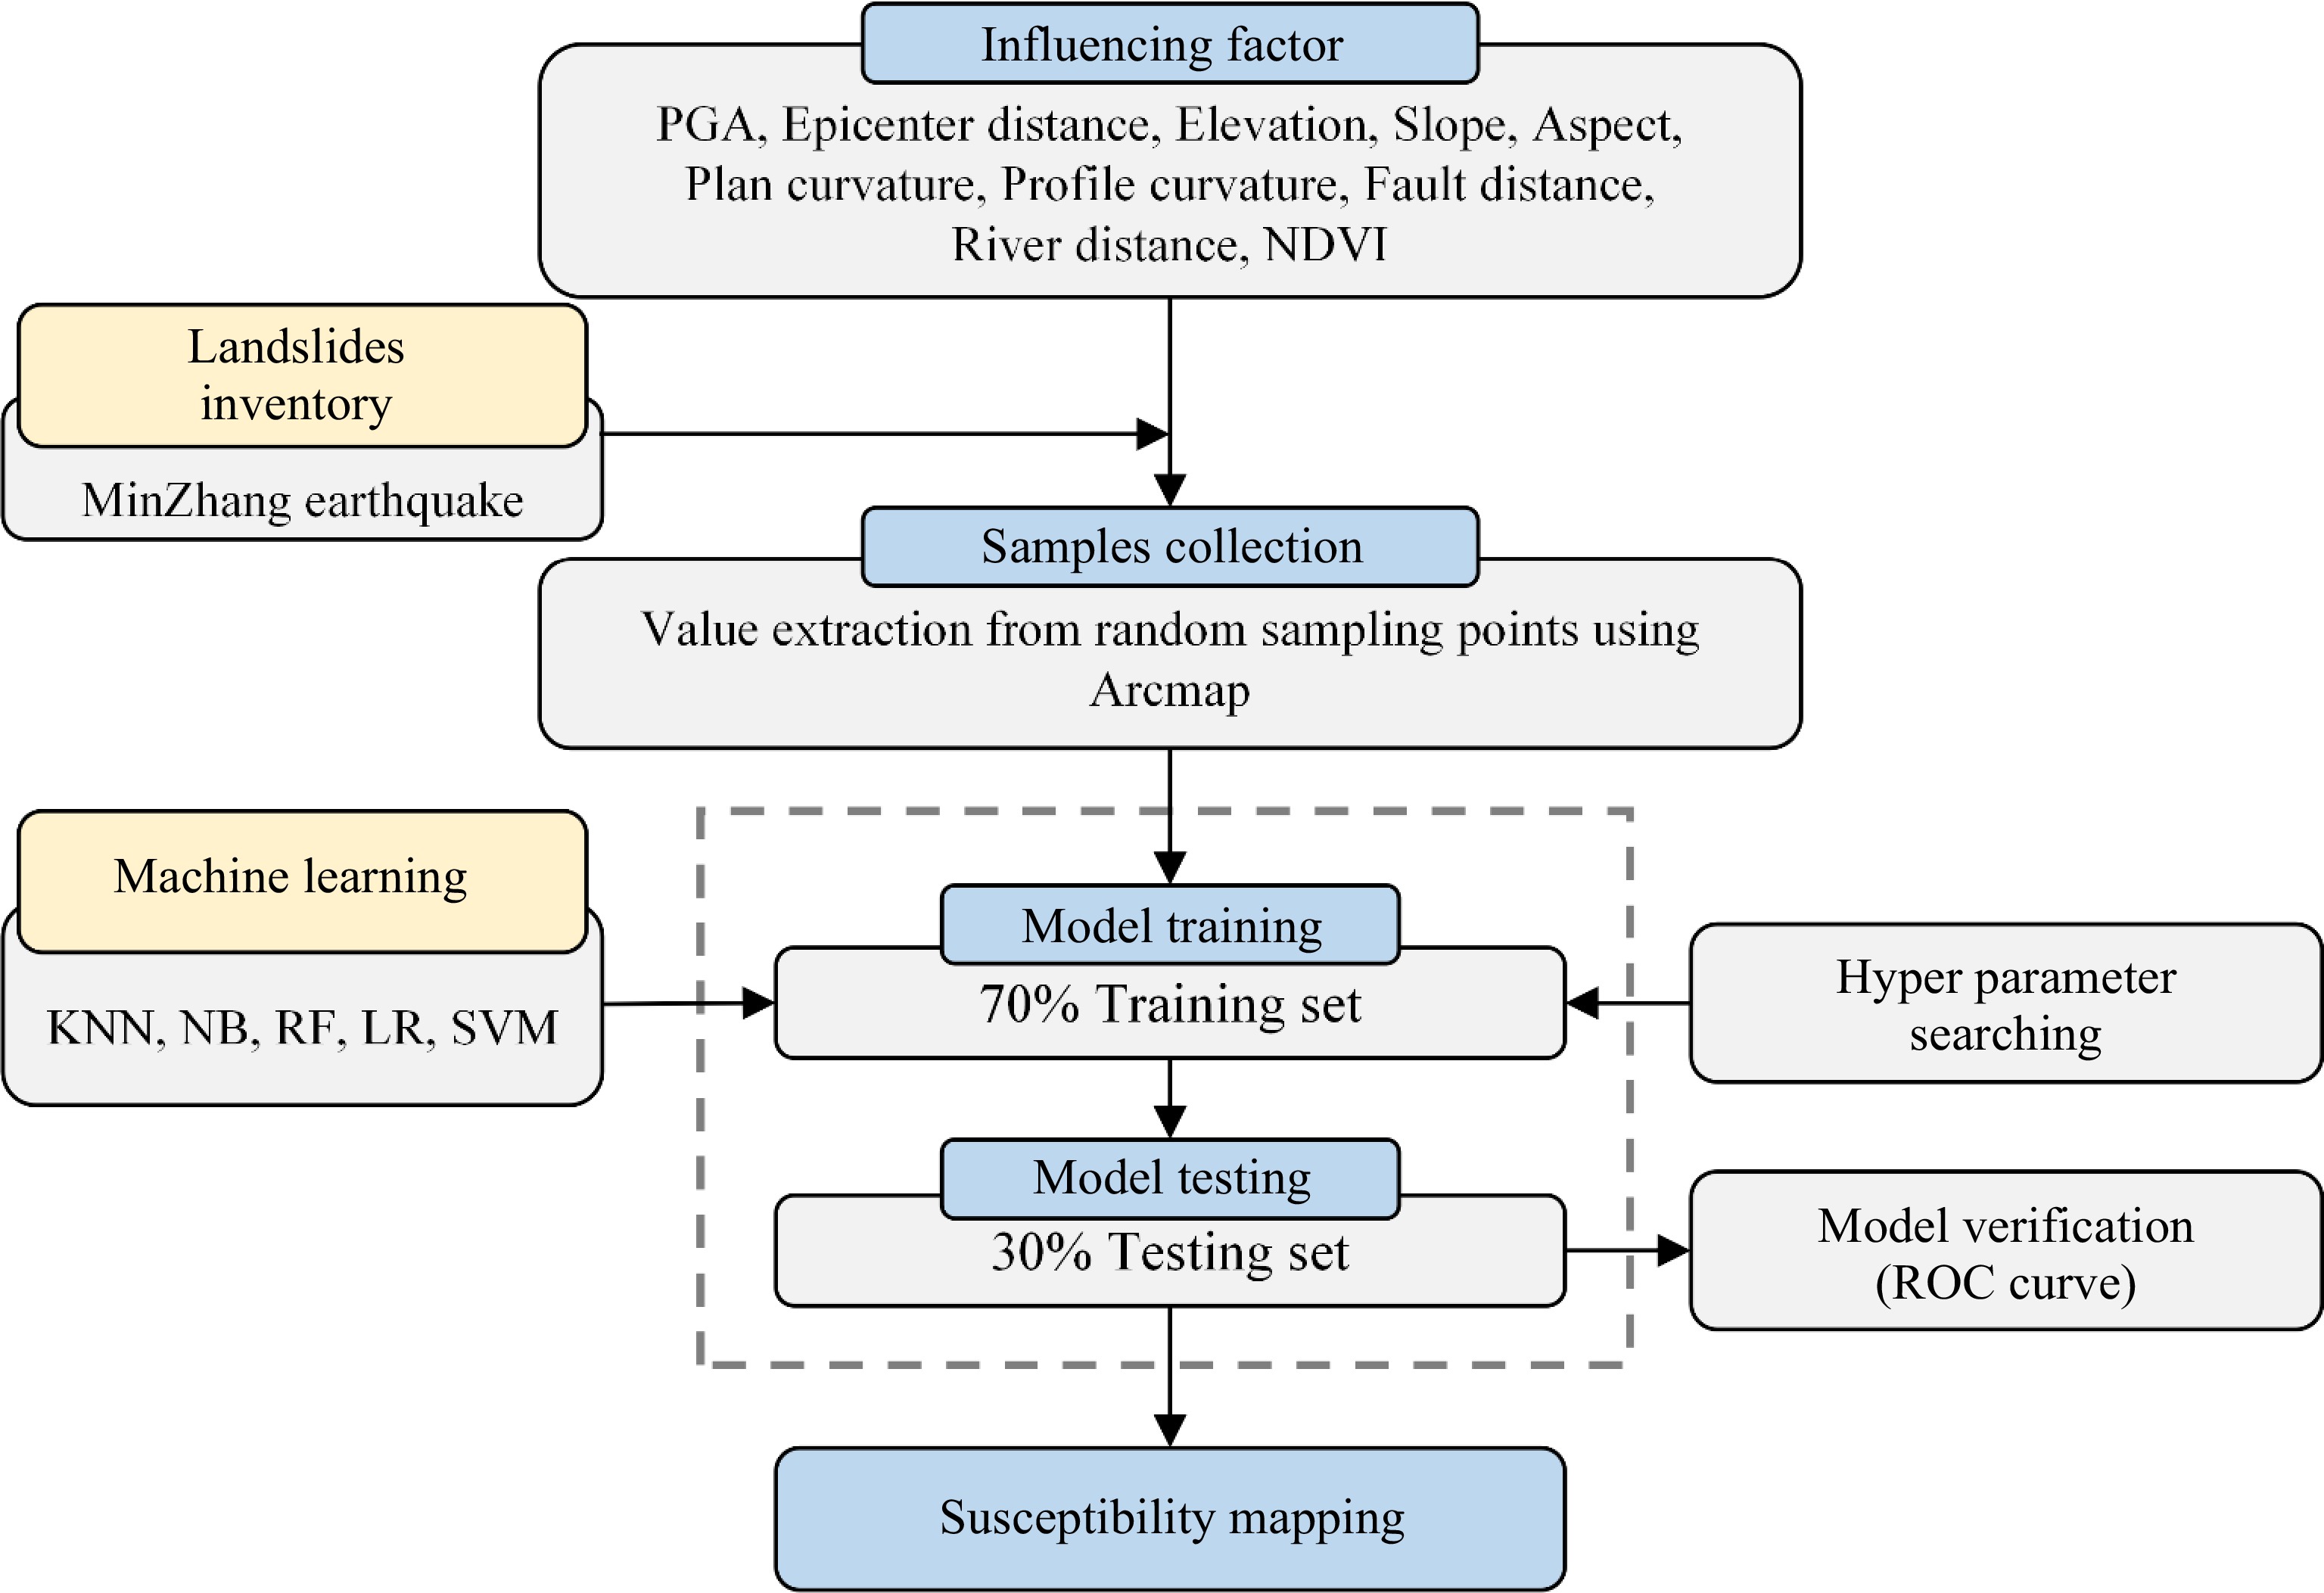
Figure 2.
Model framework for seismic landslide prediction.
Seismic landslide inventory map
-
Landslide inventory is key to study the distribution of seismic landslides and to map seismic landslide susceptibility. The seismic landslide inventory map of the Min-Zhang earthquake is shown in Fig. 3, which is obtained from an open data repository of earthquake-triggered ground-failure inventories[23,24]. The region of landslide inventory has spanned the entire earthquake-affected area. The landslide inventory was interpreted using both pre- and post-earthquake aerial photographs. The boundary of seismic landslide was mapped as polygons using semiautomated classification method based on spectral characteristics of aerial photographs. And the centroid of polygons was identified as the location of landslides induced by the Min-Zhang earthquake.
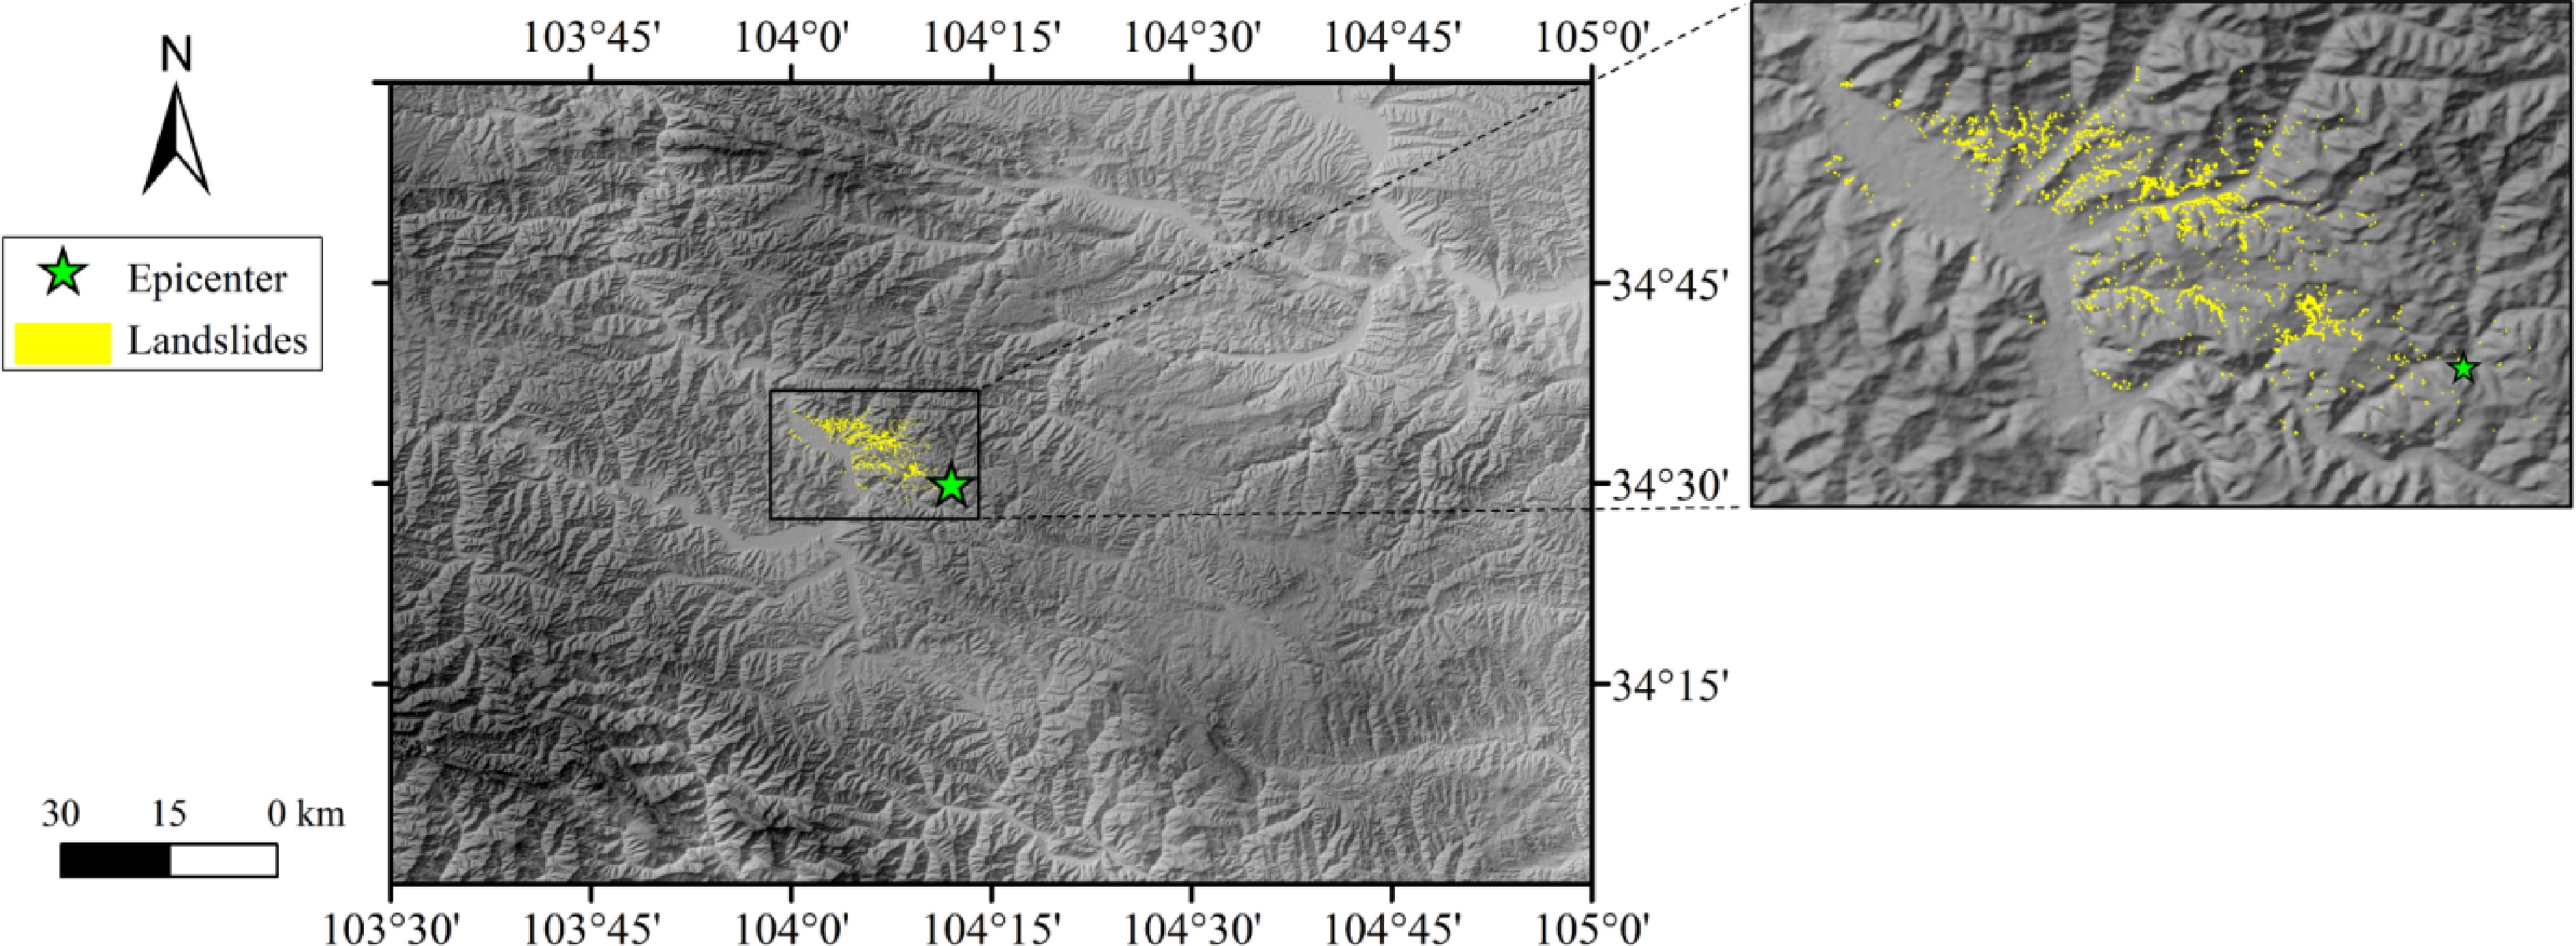
Figure 3.
Seismic landslide inventory map.
The study area is located in the Loess Plateau in the east of the Qinghai-Tibet Plateau. The average elevation is high, and the topography is characterized by steep mountains, deep valleys, and shallow cuttings. Slopes are covered by sedimentary and residual Quaternary loess. The underlying rock layer is mainly mudstone. The inventory map contains a total quantity of 2,330 landslides induced by the Min-Zhang earthquake. The minimum area of seismic landslide under Min-Zhang earthquake was 5 m2. The maximum area of seismic landslide was 49,810 m2, located in the Yongguang Village, Min County, approximately 5 km away from the epicenter. From the spatial distribution of seismic landslides, it can be noticed that landslides under the Min-Zhang earthquake were concentrated in a relatively small region northwest of the epicenter.
In addition to seismic landslide, non-landslide samples should also be collected to obtain the characteristics of non-landslide. A buffer zone of landslide polygons with a distance of 100 m was generated, and 2330 non-landslide sample points were generated randomly in the range beyond the landslide buffer zone. The sample database of the susceptibility evaluation model consisted of both landslide points and non-landslide points, and the ratio of landslide samples to non-landslide samples is 1:1. The total number of samples is 4,660. Moreover, 70% of samples were chosen at random as a training set, while remaining samples were used as a testing set for model performance assessment. Despite the fact that the landslide was within a relatively small range, the scope for collecting the non-landslide samples is a wider region, as shown in Fig. 3. The wider scope of non-landslide samples could make the sample dataset contain richer features of negative samples. When the number of samples remains unchanged, sampling around wider regions provides better predictions than sampling at just one or a small location[25].
Influencing factors of seismic landslide
-
The appropriate influencing factors of seismic landslide are important for the assessment of landslide susceptibility. As there is no standard guideline or universal criterion regarding feature factors for seismic landslide susceptibility evaluation, it is commonly accepted that the factors concerning topography, geology, and seismology are significant for seismic landslide susceptibility assessment[26]. The influencing factors of the present research are selected referring to the relevant studies for a comprehensive evaluation[27,28]. The considered influencing factors of seismic landslides in the present research includes PGA, epicenter distance, elevation, slope, aspect, plan curvature, profile curvature, fault distance, river distance, and NDVI.
The details of all influencing factors adopted in the research are listed in Table 2. The PGA factor was derived from Institute of Engineering Mechanics, China Earthquake Administration and it was interpolated by the Kriging method using GIS. The position of the epicenter was obtained from the Internet and the epicenter distance factor was mapped using buffer analysis of GIS. The elevation and NDVI factor were originated from Computer Network Information Center, Chinese Academy of Sciences, whose resolution was 30 × 30 m. The slope, aspect, plan curvature, and profile curvature factor were derived from the DEM of the study area using GIS. The fault and river within the study area were from the China Earthquake Network Center.
Table 2. Data details of influencing factors.
Influencing factor Type Resolution Data source Year updated PGA Raster 30 m × 30 m Institute of Engineering Mechanics, China Earthquake Administration 2013 Epicenter distance Raster 30 m × 30 m Internet 2013 Elevation Raster 30 m × 30 m Geospatial Data Cloud site, Computer Network Information Center, Chinese Academy of Sciences 2009 Slope Raster 30 m × 30 m Extracted from DEM 2009 Aspect Raster 30 m × 30 m Extracted from DEM 2009 Plan curvature Raster 30 m × 30 m Extracted from DEM 2009 Profile curvature Raster 30 m × 30 m Extracted from DEM 2009 Fault distance Raster 1:100000 China Earthquake Network Center 2011 River distance Raster 1:100000 China Earthquake Network Center 2011 NDVI Raster 90 m × 90 m Geospatial Data Cloud site, Computer Network Information Center, Chinese Academy of Sciences 2012 (a) Peak ground acceleration (PGA)
PGA represents the peak value of acceleration record waveform, which can be considered as the maximum instantaneous force exerted by motion. PGA is a commonly used parameter to describe the ground motion intensity of an earthquake[29]. The distribution map of PGA under the Min-Zhang earthquake is given inFig. 4a. The PGA map is obtained through spatial interpolation of seismic data recorded by motion observation station. The maximum value of PGA under the Min-Zhang earthquake reached 176.88 gal.
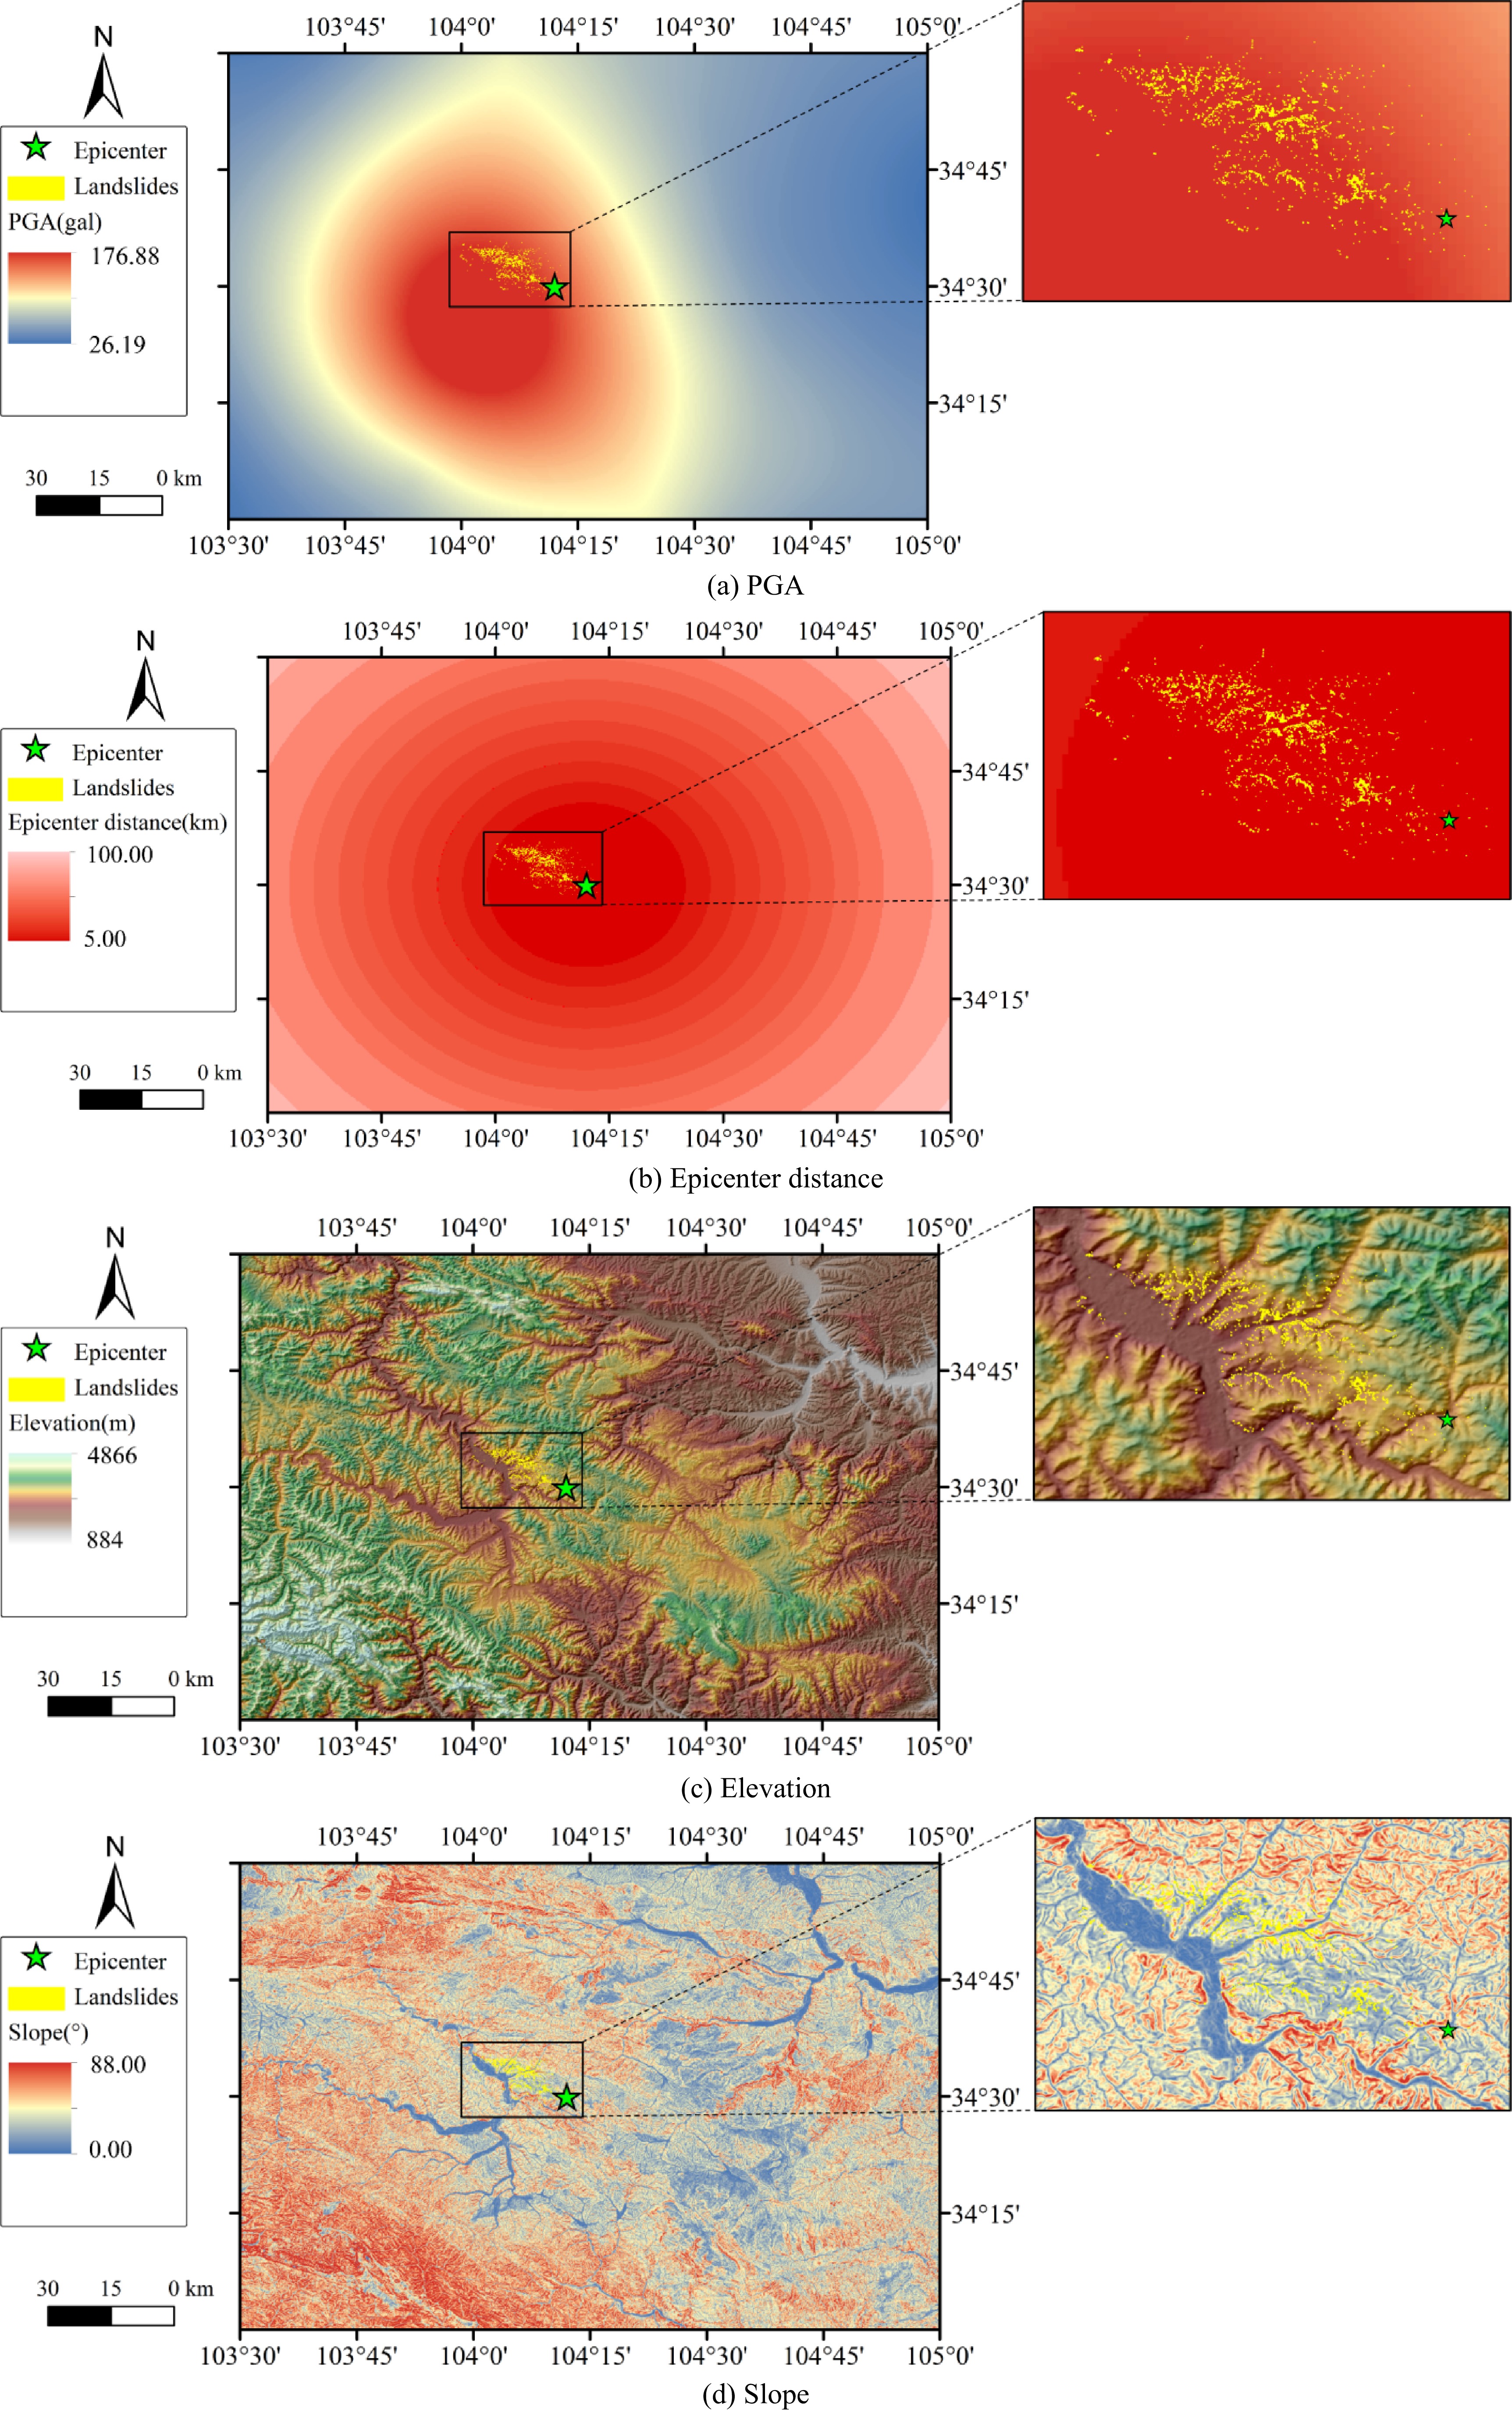
Figure 4.
Influencing factors used in landslide susceptibility mapping. (to be continued)
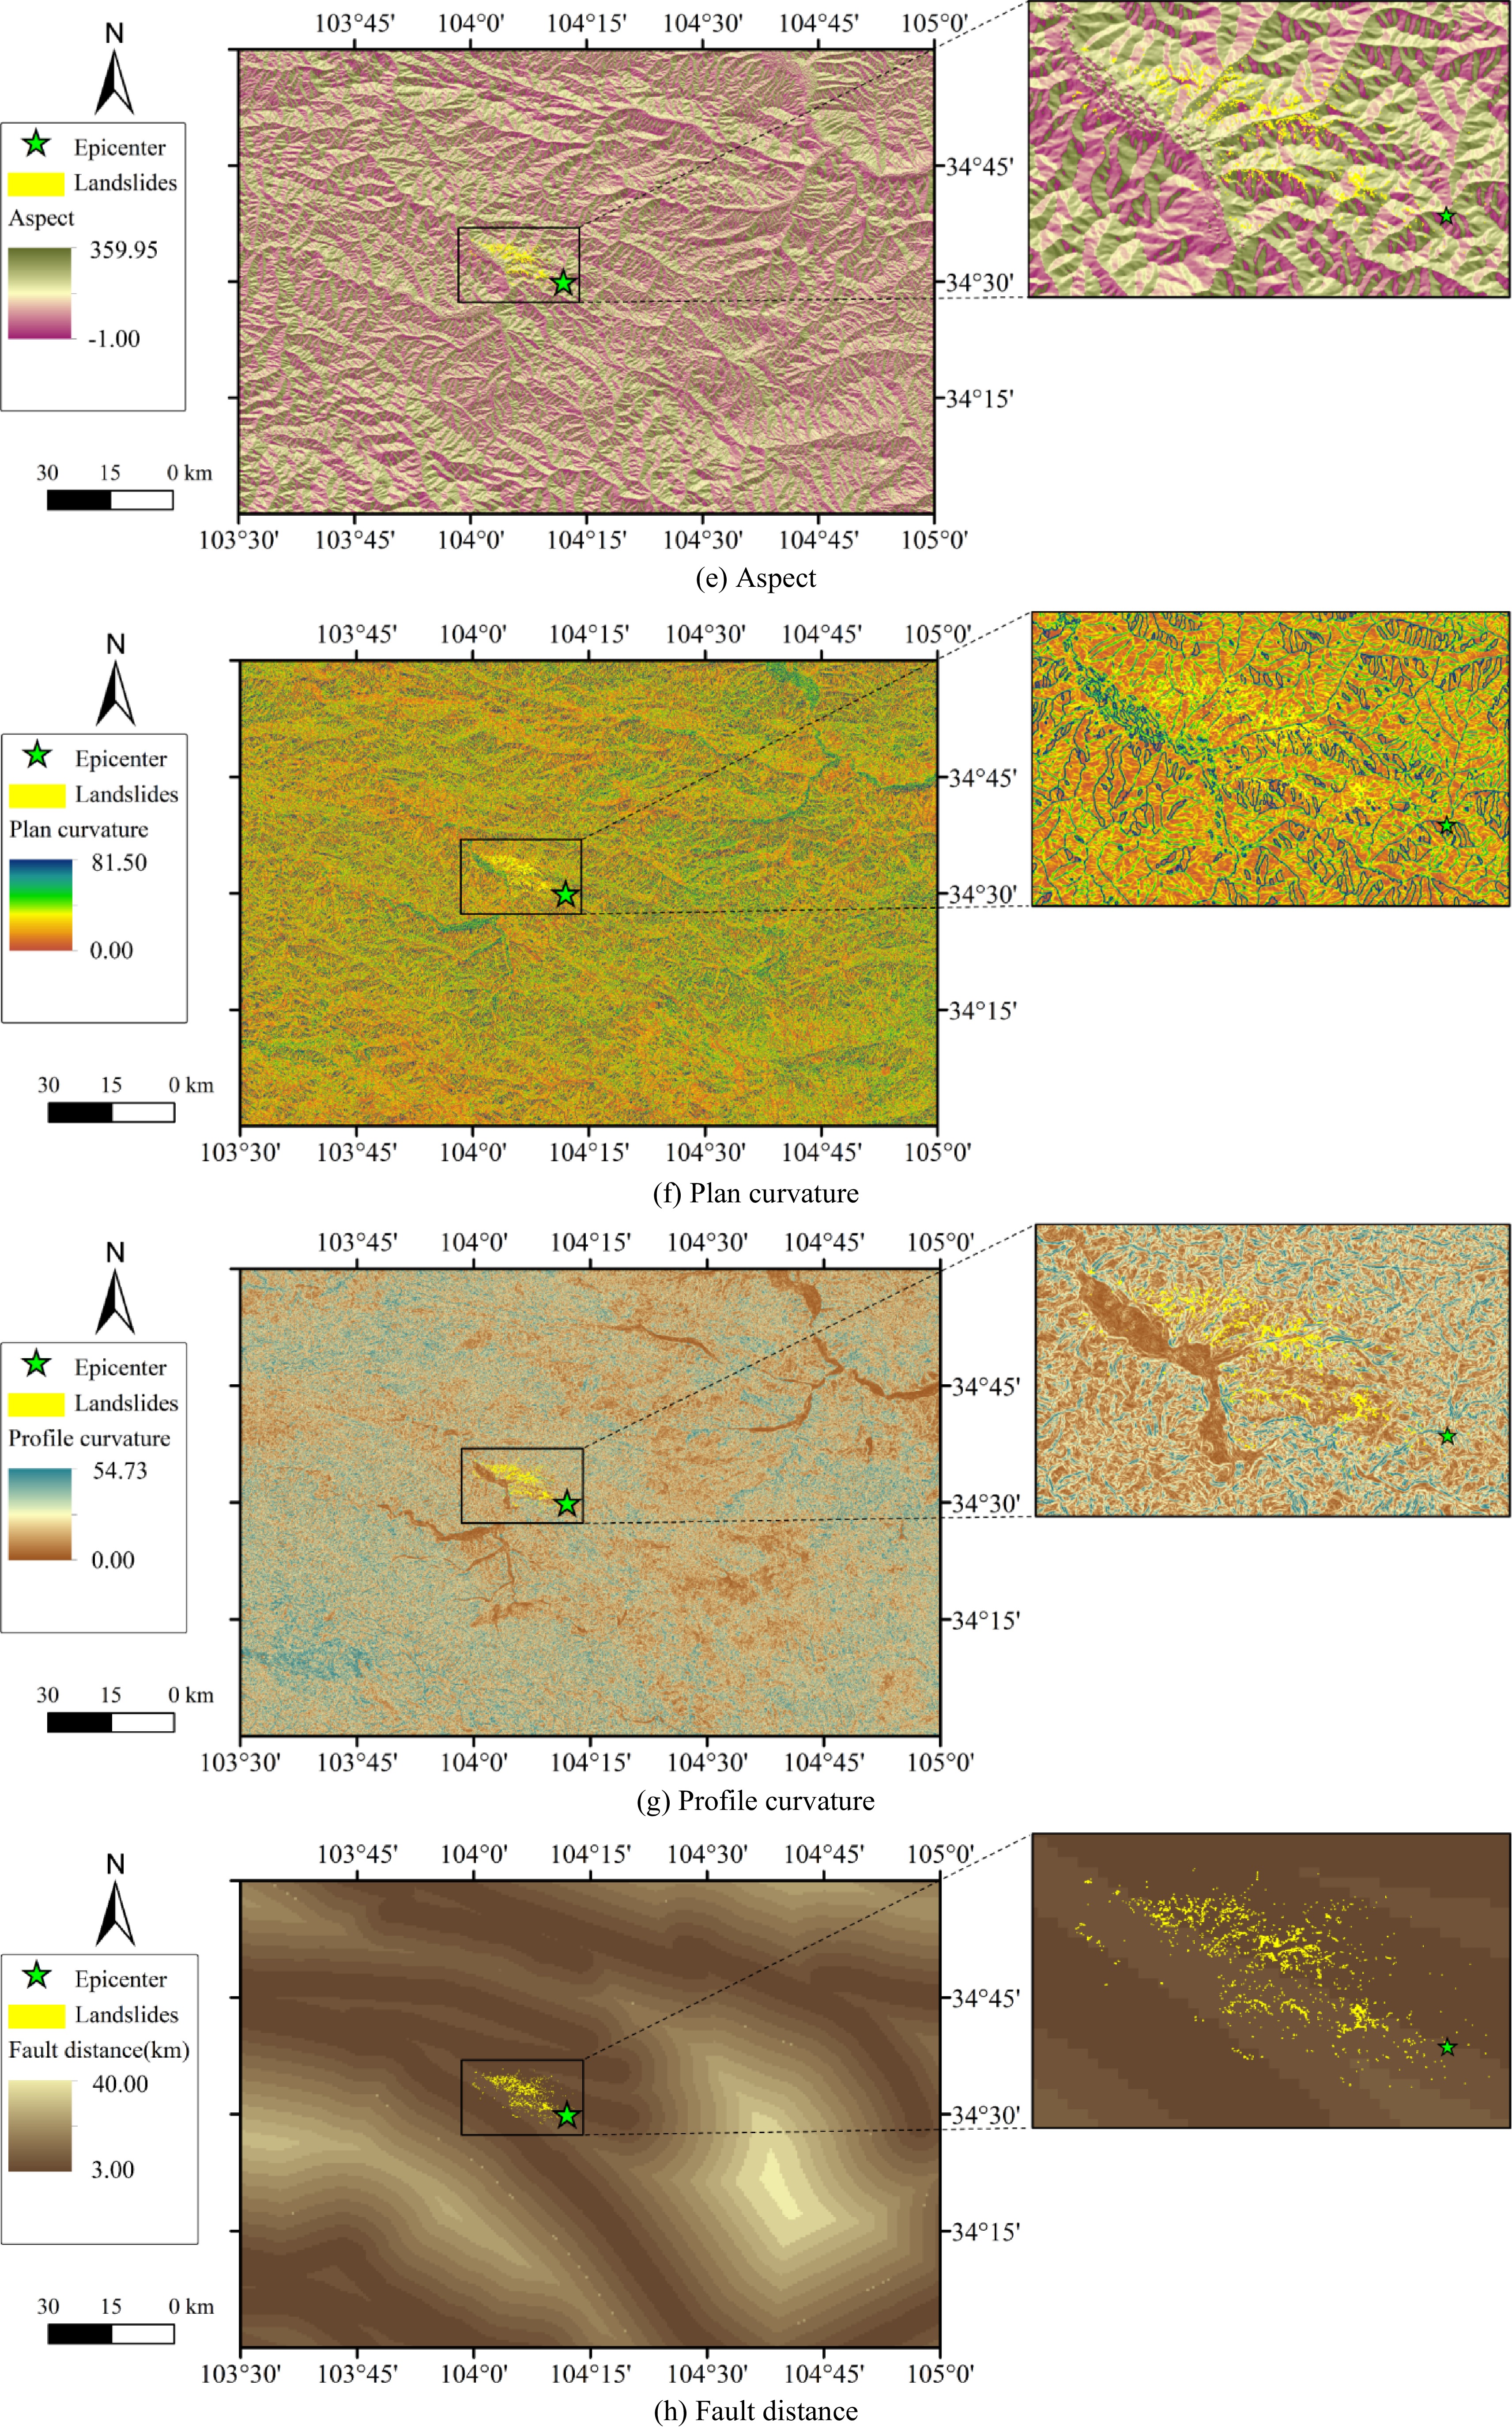
Figure 4.
(continued).
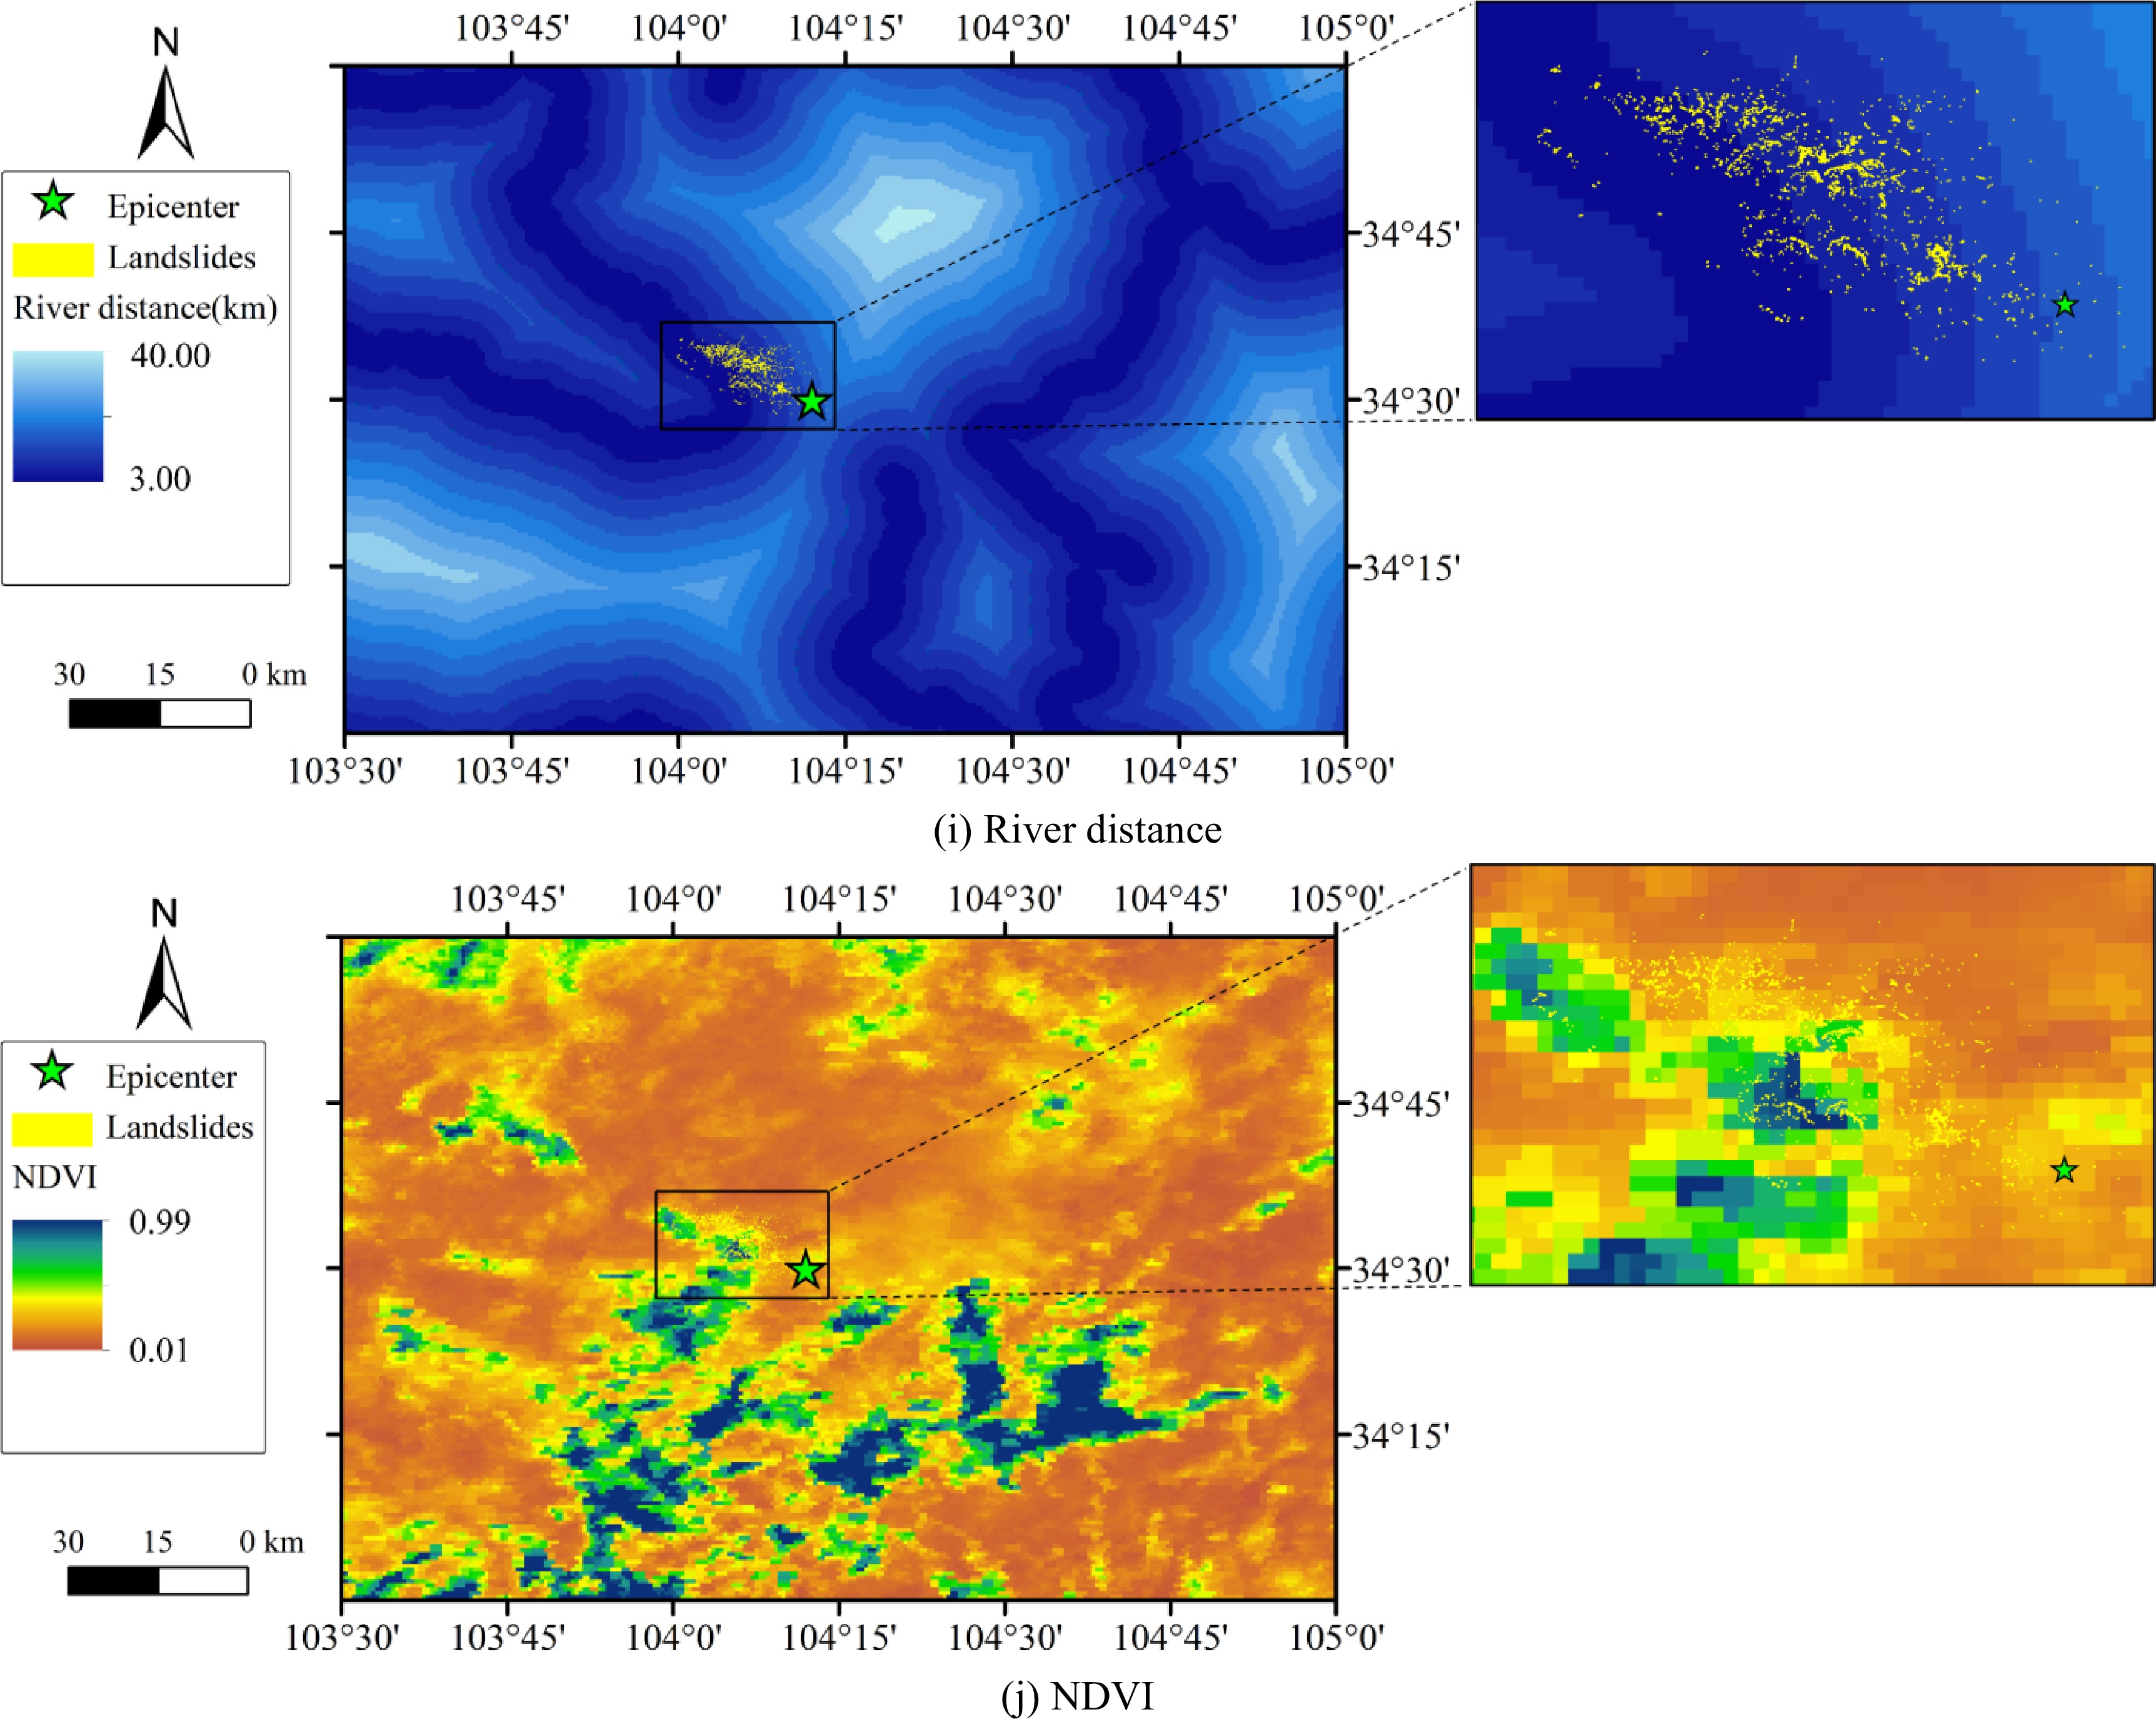
Figure 4.
(continued).
(b) Epicenter distance
The epicenter distance is used to measure the relative distance between the study area and the epicenter. The impact of earthquake disaster gradually reduced with the increase of epicenter distance. The epicenter distance is shown in Fig. 4b and was mapped using the ArcMap software buffers. The maximum epicentral distance in the study area was approximately 100 km.
(c) Elevation
Elevation is considered as an important factor for landslide susceptibility analysis[30]. The elevation map is a typical parameter to characterize the topography and geomorphology of study area. The elevation map of the Min-Zhang earthquake study area is shown in Fig. 4c. The range of elevation in the study area is between 884 and 4866 m, having a large span.
(d) Slope
Slope measures the steepness of the terrain. The greater the slope, the higher the possibility of landslide occurrence[30]. Therefore, slope angle is a geomorphic parameter that has an important impact on seismic geological disasters. The slope map is illustrated in Fig. 4d. The maximum value of slope reached 88°, and the minimum value was close to 0.
(e) Aspect
The aspect of slope is defined as the direction of the projection of slope normal on the horizontal plane, representing the direction of the terrain slope[31]. The aspect is measured counterclockwise in degrees, and the angle range is between 0 and 360°. And flat slope has no direction, and the aspect value of flat slope is specified as −1. The aspect map is shown in Fig. 4e.
(f) Plan curvature
Plan curvature is the horizontal component of ground curvature, and describes the bending and change of ground surface along the horizontal direction[31]. The plan curvature of study area is shown in Fig. 4f. For the area with concave contour, the plan curvature is positive; For areas with convex contours, the plan curvature is negative. Plan curvature can be used to distinguish ridges and valleys.
(g) Profile curvature
Profile curvature is the vertical component of ground curvature, and it affects the flow velocity of the drainage surface and affects erosion and sedimentation[31]. The profile curvature map of the study area is shown in Fig. 4g. At locations with negative profile curvature, erosion will prevail, and deposit settles at the position of positive profile curvature.
(h) Fault distance
Fault distance is another significant factor influencing seismic landslide. The rock and soil mass near the fault zone is more broken, being more susceptible to weathering and sliding[31]. The fault distance map of the study area is illustrated in Fig. 4h. The maximum fault distance within the study area was 40 km.
(i) River distance
River distance can also influence the susceptibility of slope failures. Erosion of rivers can weaken the support of slope toe and expand the empty face of slope[32]. The river distance map of the study area is shown in Fig. 4i. The buffer zones were created around the rivers to study the relationship between landslides and river distance. The maximum value of river distance in the study area was 40 km.
(j) Normalized difference vegetation index (NDVI)
NDVI plays an important role in the seismic landslide susceptibility mapping. NDVI measures the vegetation by the difference between near-infrared (strong vegetation reflection) and red light (vegetation absorption). The closer the NDVI is to +1, the better the vegetation coverage in the study region, and the lower the degree of urbanization[33]. The NDVI map was from the Landsat 7 ETM+ satellite images shot in 2012 from the Geospatial Data Cloud site, Computer Network Information Center, Chinese Academy of Sciences (Fig. 4j).
-
Five commonly used supervised learning algorithm including K Nearest Neighbors (KNN), Naive Bayes (NB), Random Forest (RF), Logistic Regression (LR), and Support Vector Machine (SVM) are utilized for seismic landslide susceptibility evaluation model building in the present study. Among the mentioned commonly used algorithms, the KNN is the simplest algorithm for a nonparametric, supervised, and pattern classifier. The NB is robust to noise and easy to apply. The RF and SVM model usually have a more predictive capability to identify landslide susceptibility zones than other models in previous researches[34]. And the LR can be considered as the most commonly used classifier of machine learning in landslide susceptibility assessment. Herein, the Scikit-learn machine learning repository based on Python was adopted for model construction. The hyperparameters of machine learning algorithms were optimized using the grid search method based on k-fold Cross Validation, and the value of fold k was 10.
K Nearest Neighbors (KNN)
-
The KNN algorithm is one of the most basic and simple algorithms in machine learning. It can be applied for both data classification and regression problems. KNN is also referred to as a lazy algorithm because it has no general learning process. Each sample corresponds to a point in the feature space. The prediction object has the same label value as most of the k samples with the nearest Euclidean distance in the feature space. The hyperparameter of the KNN algorithm is the value of k. The smaller the k value, the more complex the whole model becomes and the easier it is to over-fit. When the amount of data is small but the data is representative, the classification effect of the KNN algorithm is better.
Naive Bayes (NB)
-
The NB method is a probability classification algorithm based on Bayes theorem and independence assumption feature conditions. NB algorithm is based on the assumption that variables are independent of each other and do not interfere with each other. Therefore, the conditional probability can be calculated by:
$ P\left( {f{\text{ | }}c} \right) = \prod\limits_{i = 1}^n {P\left( {{f_i}|c} \right)} $ (1) where c is the classification label value, f is the feature vector. And the Bayes theorem is represented by:
$ P\left( {c{\text{ | }}F} \right) = \frac{{P\left( c \right) \cdot P\left( {F{\text{ | }}c} \right)}}{{P\left( F \right)}} $ (2) where F is the feature and c is the class.
$ P\left( c \right) $ $ P\left( {c{\text{ | }}F} \right) $ The NB algorithm is still effective when there is less data, and can handle multi-category classification problems. However, it is sensitive to the input data (training samples). If the features of training data are related, the classification effect may be poor. On the contrary, if the correlation between the features is not strong, the classification effect can be good.
Random Forest (RF)
-
RF is a supervised algorithm that integrates multiple trees through the idea of ensemble learning. The basic unit of the RF algorithm is the decision tree, and it belongs to a major branch of machine learning – Ensemble learning method. From an intuitive point of view, each decision tree is a simple classifier, then for an input sample, N trees will have N classification results. The RF algorithm integrates all the classification voting results, and specifies the category with the most voting times as the final output. And the selection of the optimal partition feature in the decision tree algorithm is obtain by training the parameter at nodes based on the information gain of entropy. The RF algorithm solves the problem of the weak generalization ability of a decision tree. The model training of RF can be highly parallelized, resulting in its advantages in training speed for high-dimensional and large numbers of samples. The disadvantage of the RF algorithm is that in some noisy sample sets, the model easily falls into over-fitting.
Logistic Regression (LR)
-
LR is a supervised machine learning method for solving binary classification problems. Although there is regression in the name, LR is a classification algorithm. LR can be seen as a model combining multiple linear regression and nonlinear activation function. The activation function commonly used in LR is the sigmoid function, whose expression is:
$ g\left( z \right) = \frac{{\text{1}}}{{{\text{1}} + {e^{ - z}}}} $ (3) where z is the result of multiple linear regression,
$ g\left( z \right) $ The training parameter of the LR algorithm is the feature coefficient of multiple linear regression, solved by the gradient descent method of loss function. The loss function of the LR algorithm is constructed using log-likelihood loss function to measure the gap between predicted value and actual value. Moreover, L2 regularization is added into the loss function to reduce the value of training parameters, helping the model avoid over-fitting. The LR algorithm is very fast in calculation, strong in anti-noise ability, and very good in fitting the linear relationship.
Support Vector Machine (SVM)
-
SVM is a generalized linear classifier that classifies data in a binary way according to supervised learning, which can be applied not only in classification prediction, but also in regression analysis. Its decision boundary is the maximum margin hyperplane for learning samples. The SVM algorithm maps the sample feature space into a high-dimensional feature space through a nonlinear mapping, so that the nonlinear separable problem in the original sample feature space can be transformed into a linear separable problem. The SVM algorithm realizes linear partition in high-dimensional feature space through linear hyperplane, and maximizes the minimum distance from any sample on both sides to the hyperplane.
In addition to the hyperplane, another fundamental element of the SVM algorithm is the selection of kernel function. The kernel function is utilized to transform the sample features into high dimensional space, so that different types of samples can be separated linearly. The four kernel functions commonly used in the SVM algorithm are linear, polynomial, radial basis, and sigmoid. Radial basis function is selected as the kernel function in the present research.
SVM algorithm can solve the classification and regression problems in the case of small samples. And it is sensitive to the missing data and the selection of kernel functions
-
The sample database contained the spatial position of seismic landslide and non-landslide with a total number of 4660. The Arcmap of GIS was adopted to extract the feature value of each sample from the influencing factor layers. The value of influencing factor of samples referred to the feature value of samples. The label value of seismic landslide sample was 1 and the label value of non-landslide sample was 0. Five target machine learning models were trained based on the landslide and non-landslide samples using Python Script Language. The performance of five landslide susceptibility evaluation models were compared in the presented sections.
ROC curve for model testing
-
To quantitively evaluate the accuracy of five machine learning algorithms on seismic landslide susceptibility assessment, the coefficient of determination R2 is adopted for judging the fitting degree of classification models. The coefficient of determination R2 is calculated as:
$ {R^2} = 1 - \frac{{\displaystyle\sum {{{\left( {{y_i} - {{\hat y}_i}} \right)}^2}} }}{{\displaystyle\sum {{{\left( {{y_i} - \bar y} \right)}^2}} }} $ (4) where y is the actual label value,
$ \hat y $ $ \bar y $ Table 3. Prediction performance for KNN, NB, RF, LR, and SVM.
Model R2 AUC KNN 0.988 0.986 NB 0.811 0.988 RF 0.995 0.999 LR 0.989 0.997 SVM 0.990 0.998 It can be seen that the R2 values of five target models were all greater than 0.8, suggesting the validity of seismic landslide susceptibility evaluation models using the machine learning method. The minimum value of R2 was 0.811, for the results of the NB algorithm. The R2 values of the RF and SVM algorithm were relatively higher, corresponding to 0.995 and 0.990, respectively. It indicated that compared to other machine learning algorithms, the RF and SVM algorithms had more accurate results of testing set.
The receiver operating characteristic (ROC) curve was adopted to further evaluate and compare the performance of five algorithms. The abscissa of the ROC curve is a false positive rate (FPR), and the ordinate is true positive rate (TPR). When the prediction result is random, the ROC curve is connected by (0,0) and (1,1). Therefore, the ROC curve of the model prediction result should be above the line connected by (0,0) and (1,1). The closer the ROC curve is to the fixed point at the upper left corner, the better the effect of the classifier. The performance of the established models using the testing dataset has been illustrated in Fig. 5. It can be seen that all five algorithms have good performance of prediction ability in the testing dataset.
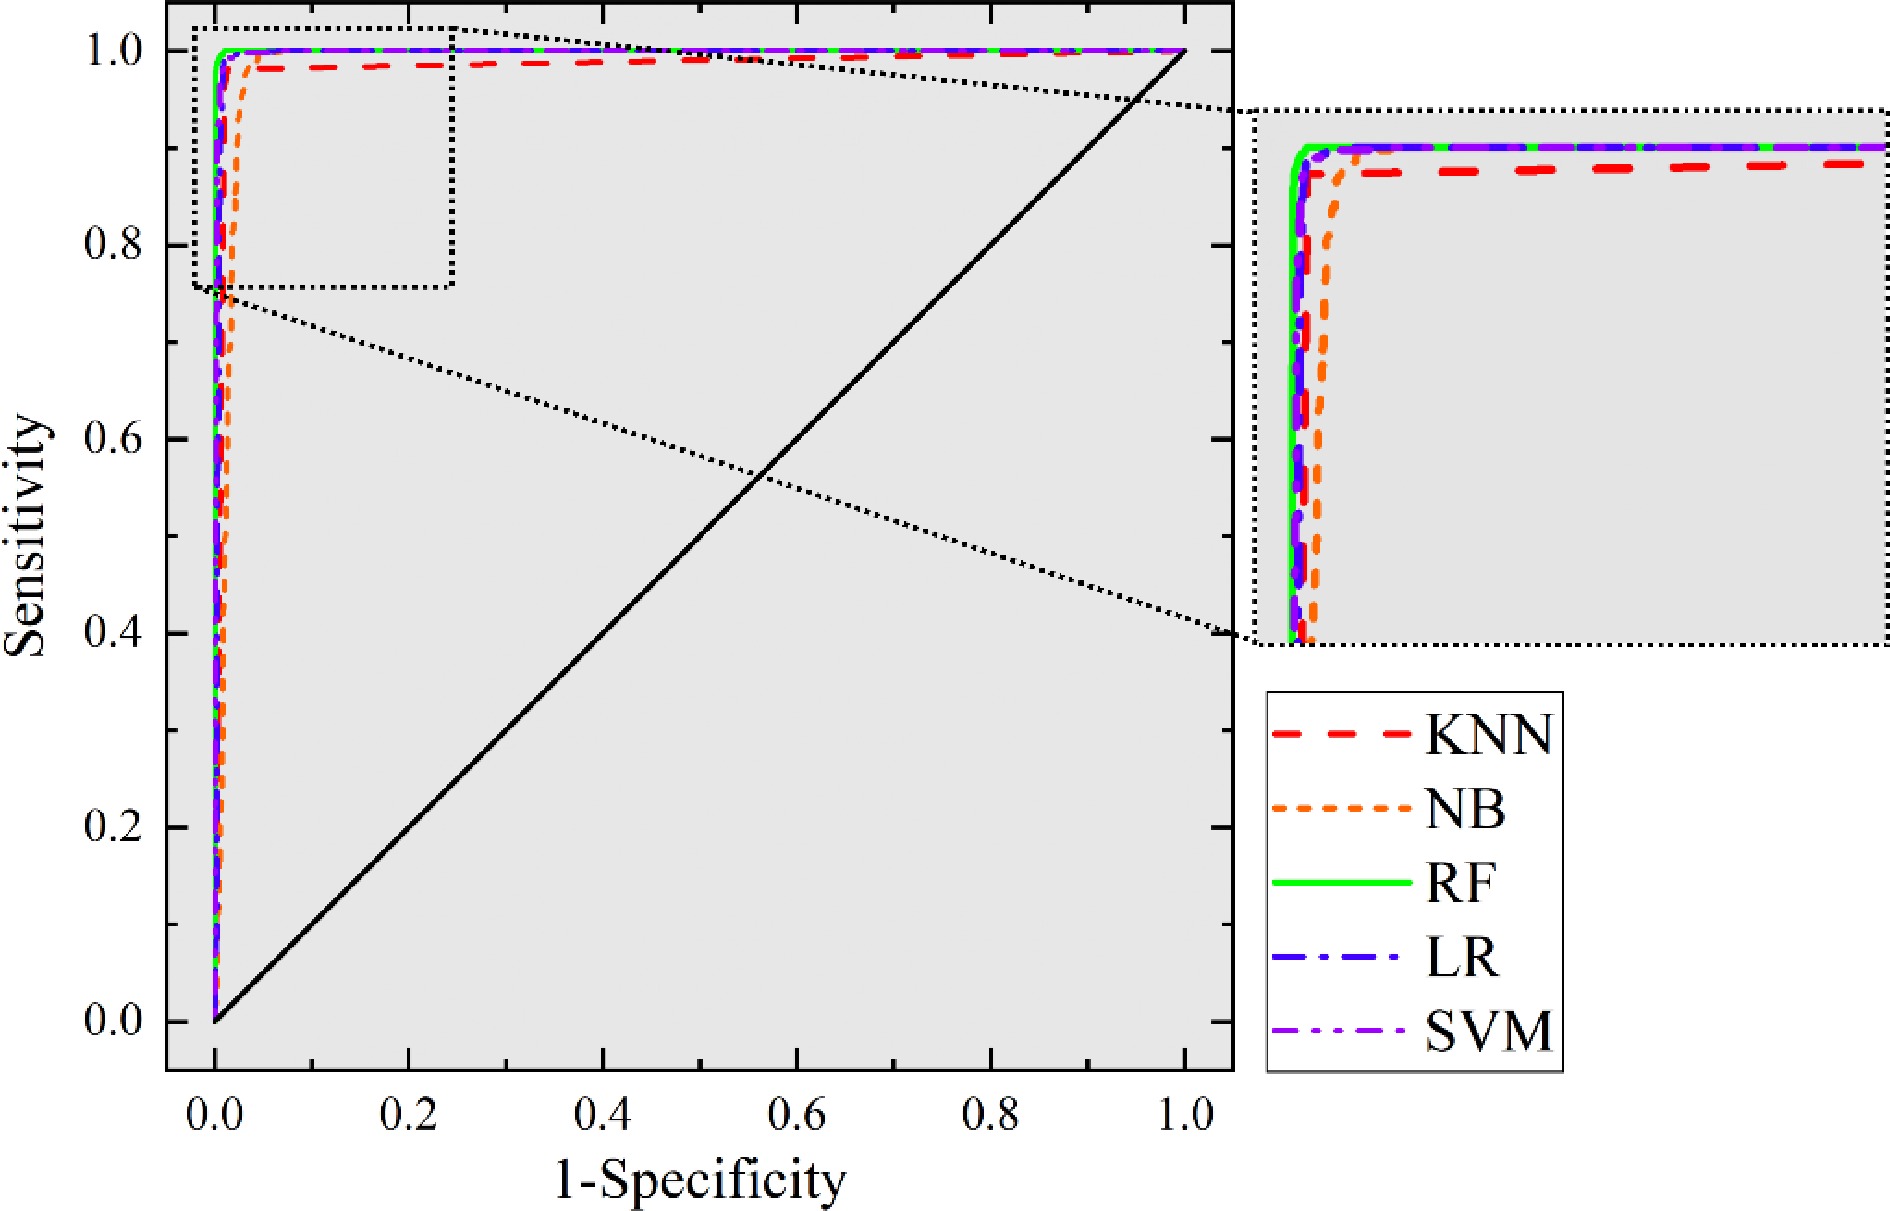
Figure 5.
ROC curve for model testing.
In order to quantitatively evaluate the accuracy of target classifiers, the Area Under Curve (AUC) is adopted. The AUC value represents the area under the ROC curve. Generally, the AUC value is between 0.5 and 1.0. The higher the AUC value, the better the classification effect of the model. The AUC values of testing set for five machine learning algorithms are listed in Table 3. Similar to the result of R2, the AUC values of the prediction results of RF and SVM models were greater, corresponding to 0.999 and 0.998, respectively. The minimum value of AUC is 0.986 of the KNN model. The values of AUC results revealed that the RF and SVM models fit the input data better and had better predictive performance than KNN, NB, and LR models in seismic landslide susceptibility evaluation.
Landslide susceptibility mapping
-
In addition to verifying the prediction ability of the models to the testing set, it is also necessary to verify the generalization ability of models. Therefore, all the points in the study area were selected as the input data of the five trained models, and the seismic susceptibility zonation under Min-Zhang earthquake was mapped based on the output data of five trained models, to verify the generalization ability of models using data other than training and testing dataset.
The seismic landslide susceptibility map under Min-Zhang earthquake using machine learning methods is given in Fig. 6. The susceptibility results were divided into five categories including very low, low, moderate, high, and very high, using the natural breaks classification method. Classes are based on natural groupings inherent in the data, and categories are created in a way that best groups similar values together and maximizes the differences between categories. The area labeled as very low can be considered as almost free from seismic landslide, which was not show in Fig. 6. It can be observed from the seismic landslide susceptibility map of the Min-Zhang earthquake that the results of five machine learning models showed the relative position of the area susceptible to seismic landslide, which was located in the northwest of the epicenter. However, there are differences between the area size of the region labeled as very high evaluated by the various models and the actual landslide area. The evaluation results of RF and SVM models were closest to the actual seismic landslide distribution, showing consistence with the result of R2 and AUC of ROC curve. It indicated that the RF and SVM model have more accurate prediction ability in comparison to other machine learning methods. In addition, the difference between the result of NB model and the actual seismic landslide distribution was the largest. The possible reason for this phenomenon was that the NB algorithm is based on the assumption that each influencing factor is independent of each other. But obviously, there was correlation between some influencing factors, such as elevation and slope, PGA and epicenter distance, etc. When using the NB algorithm to map seismic landslide susceptibility, it is necessary to consider the impact of the correlation between influencing factors on the evaluation results.
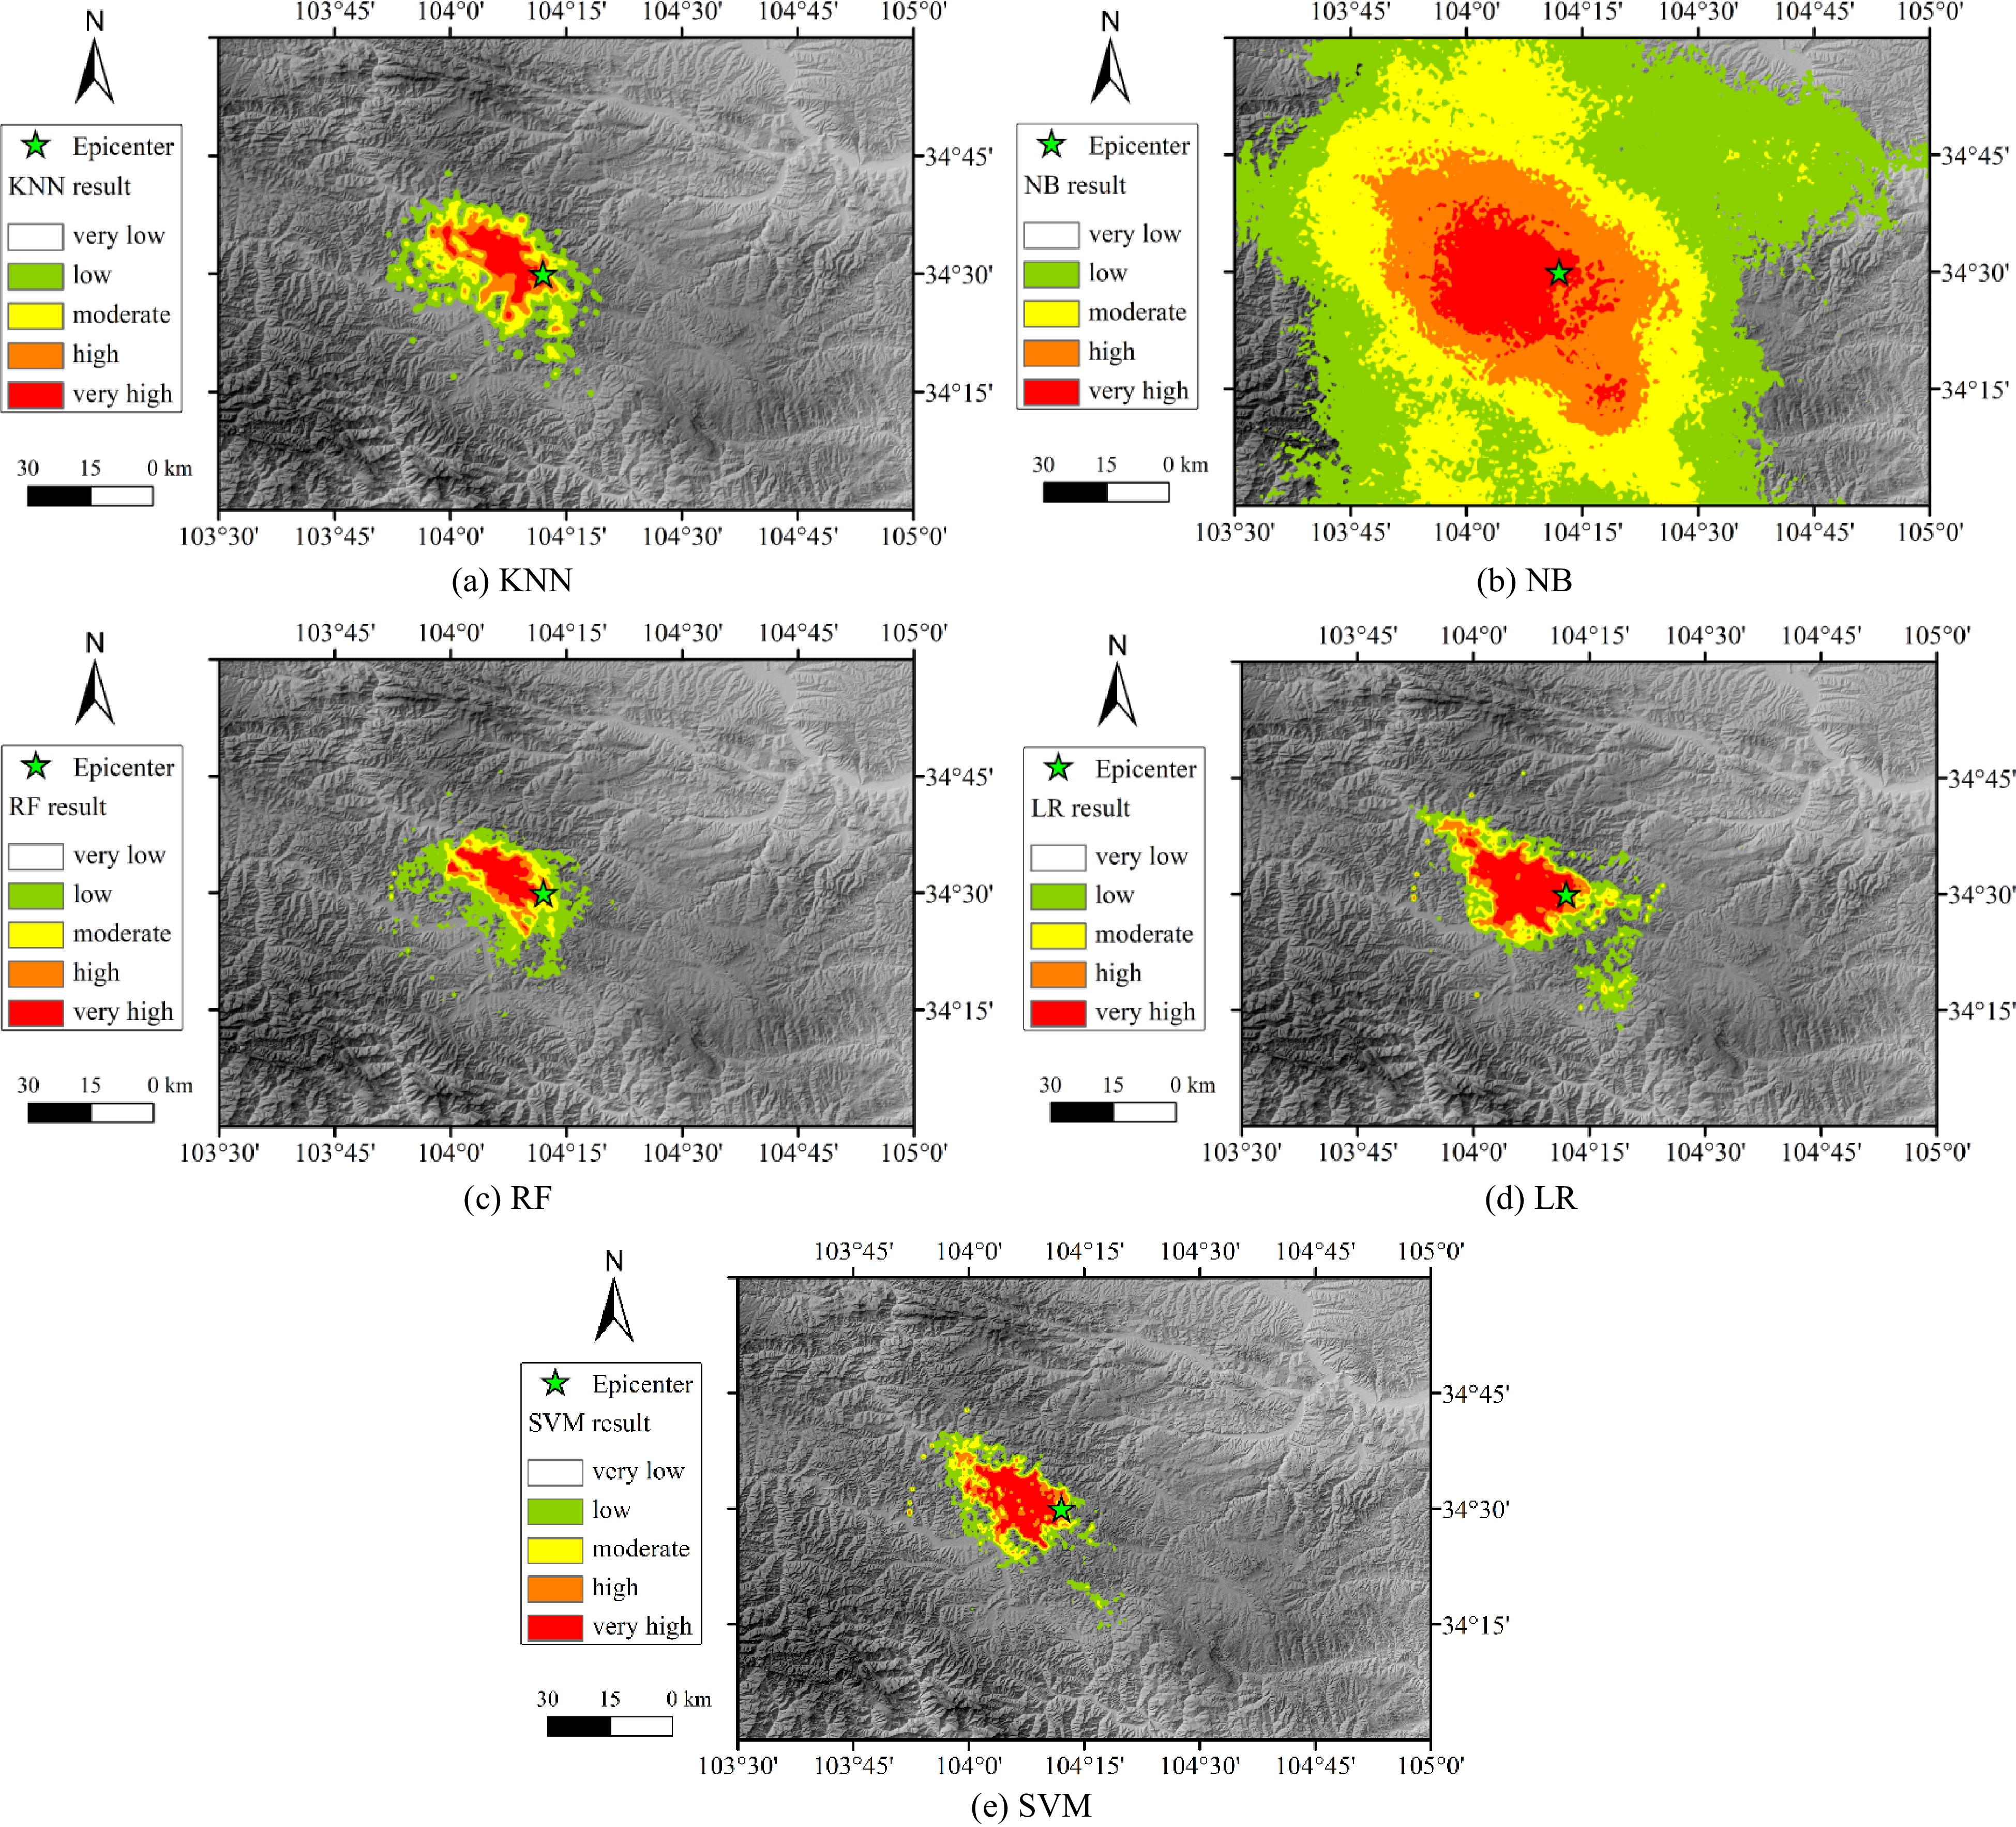
Figure 6.
Results of the predicted landslide susceptibility.
-
The present study aimed to map the spatial distribution of seismic landslide susceptibility in the affected area by Min-Zhang earthquake using different machine learning algorithms.
Ten influencing factors of seismic landslide including peak ground acceleration (PGA), epicenter distance, elevation, slope, aspect, plan curvature, profile curvature, fault distance, river distance, and normalized difference vegetation index (NDVI) were considered. Based on the landslide inventory map interpreted using pre- and post-earthquake aerial photographs, a sample database containing 2,330 seismic landslide points and 2,330 non-landslide points were collected. And the sample database was split into training set (70%) and testing set (30%) to construct and test different machine learning methods. Five machine learning algorithms were adopted, including K Nearest Neighbors (KNN), Naive Bayes (NB), Random Forest (RF), Logistic Regression (LR), and Support Vector Machine (SVM). Out of five machine learning models, the RF and SVM were found to be more competent, with higher determination coefficient and AUC value of ROC curve. The R2 and AUC value of the RF model results was 0.995 and 0.999, and the R2 and AUC value of the SVM model result was 0.990 and 0.998, respectively. Comparatively, the results of the NB algorithm had poor accuracy, resulting from the potential correlation of various influencing factors. The results revealed that in the present study, the RF and SVM model have more accurate prediction ability to map seismic landslide susceptibility in comparison to other machine learning methods.
This work is supported by the Scientific Research Fund of Institute of Engineering Mechanics, China Earthquake Administration (Grant No. 2021EEEVL0209).
-
The authors declare that they have no conflict of interest.
- Copyright: © 2023 by the author(s). Published by Maximum Academic Press on behalf of Nanjing Tech University. This article is an open access article distributed under Creative Commons Attribution License (CC BY 4.0), visit https://creativecommons.org/licenses/by/4.0/.
-
About this article
Cite this article
Zhou H, Che A. 2023. Seismic landslide susceptibility mapping using machine learning methods: A case study of the 2013 Ms6.6 Min-Zhang earthquake. Emergency Management Science and Technology 3:5 doi: 10.48130/EMST-2023-0005 

Seismic landslide susceptibility mapping using machine learning methods: A case study of the 2013 Ms6.6 Min-Zhang earthquake
- Received: 19 January 2023
- Accepted: 15 May 2023
- Published online: 30 May 2023
Abstract: Seismic landslides are characterized by wide distribution and strong destructiveness. On July 22, 2013, the Min-Zhang earthquake occurred and a large number of casualties and building burying were caused by the geological disasters induced by seismic motion. The present research aims to generate seismic landslides susceptibility prediction maps of Min-Zhang earthquake using different machine learning algorithms, providing reference for disaster prevention and reduction in earthquake-affected areas. Five machine learning algorithms including K Nearest Neighbors (KNN), Naive Bayes (NB), Random Forest (RF), Logistic Regression (LR), and Support Vector Machine (SVM) are implemented and the sample dataset was prepared based on the landslide inventory map from open data repository. A total number of 4660 samples containing seismic landslides and non-landslide were collected. The influencing factors of seismic landslide include peak ground acceleration (PGA), epicenter distance, elevation, slope, aspect, plan curvature, profile curvature, fault distance, river distance, and normalized difference vegetation index (NDVI). The performance of five target machine learning algorithms is evaluated and compared using determination coefficient R2 and AUC value of ROC curve. The results indicate that the RF and SVM model have more accurate prediction ability with higher AUC value reaching 0.999 and 0.998, respectively, and the NR model has relatively poor performance resulting from the potential correlation of various influencing factors. Finally, the seismic landslide susceptibility of the Min-Zhang earthquake was mapped using the five trained models and it could offer useful information for seismic hazard management in the future.
-
Key words:
- seismic landslide /
- susceptibility /
- machine learning /
- GIS /
- Min-Zhang earthquake.