ARTICLE   Open Access    

Environmental heterogeneity determines beta diversity and species turnover for woody plants along an elevation gradient in subtropical forests of China

More Information
  • To understand how diversity change with environmental gradients is a fundamental aim for clarifying biodiversity pattern and underlying mechanisms. Here, we studied the characteristics of beta diversity and its partitioning components for woody plant communities along an elevation gradient in subtropical forests of China, and thus explored the effects of environment and space on beta diversity. By using the Classification Method, we divided the species of Daiyun Mountain into four groups, namely generalists, high-elevation specialists, low-elevation specialists and rare species. We then calculated beta diversity, and partitioned it into species turnover and species nestedness. dbRDA was conducted to analyze the impact of spatial and environmental distance on the beta diversity and its partitioning components. Beta diversity comprised of two components: species turnover and species nestedness. Species turnover was the larger contributor to total beta diversity, and it tended to increase as elevation changed. This pattern can be attributed to environmental heterogeneity, resulting in the differentiation of specialized species and an increase in species turnover and beta diversity. Environmental factors, specifically the air temperature and slope, played a significant role in explaining the variation of turnover and beta diversity. However, spatial variables did not have a significant influence on these patterns. The maintenance of biodiversity in Daiyun Mountain was mainly governed by environmental filtering. Future conservation efforts should focus on strengthening the protection of specialized species in high elevation areas.
  • Lignification is a crucial process of fruit development that plays various roles in different types of fruits[1]. In angiosperms, the lignification of the pericarp is essential for seed protection and their dispersal. In the dry-fruit crop walnut, the extensive lignification of endocarp (known as the nutshell) is a key economic trait; impaired development of the nutshell often adversely affects the quality of walnut kernel, leading to malformed seed kernels. In fleshy fruits, the lignin process is mostly overlooked or considered negligible; however, unexpected lignification of fruit tissues could be caused by disease and stress conditions, which can affect the taste and quality of fruits[2].

    The accumulation of lignin leads to the lignification of fruit, which is essential for maintaining the integrity of the plant cell wall and resisting plant pathogens[3]. During the hardening process of the pericarp, lignin conjugates with the cellulose and hemicellulose network to provide rigidity and tensile strength to secondary walls, in a process similar to wood formation[4]. Lignin is a type of secondary metabolite derived from phenylpropane. After a series of biochemical reactions, including deamination, hydroxylation and methylation, phenylalanine is finally transformed into three types of lignin monomers[2]. These are then separately polymerized to form p-hydroxyphenyl lignin, guaiacyl lignin, and syringyl lignin[5]. The lignin biosynthesis pathway in plants has been extensively investigated. The enzymes involved in its two major processes — monolignol biosynthesis and monolignol polymerization — have been characterized through genetic and biochemical studies[6]. A cascade of conserved core enzymes is fundamental for the biosynthesis of lignin in diverse plant species[7,8].

    In recent years, several transcription factors (TFs) have been identified which control the plant lignification process via direct or indirect regulation of lignin biosynthesis genes. The transcription regulation network of lignin biosynthesis, which is primarily based upon studies of Arabidopsis thaliana and Populus trichocarpa, is highly complex, with extensive feedback among different types of transcription factors[9,10]. Various studies have shown that plant-specific NAM, ATAF and CUC (NAC) and Myeloblastosis (MYB) TFs play important roles in the regulation of secondary cell wall biosynthesis in A. thaliana and P. trichocarpa[11]. In A. thaliana, the genes MYB58 and MYB63 encoded transcriptional activators of the lignin biosynthetic pathway[12]. In P. trichocarpa, those of PtrMYB28, PtrMYB4, PtrMYB3 and PtrMYB20 found to activate lignin biosynthesis during the wood formation process[13,14]. The NAC SECONDARY WALL THICKENING PROMOTING FACTOR (NST) genes were demonstrated to function as master regulators for initiating the lignin biosynthesis during secondary cell wall formation[11]. In A. thaliana, the loss-of-function mutants of nst1 nst3/snd1, and nst1 nst2 nst3/snd1 impaired lignin biosynthesis in xylem and interfascicular fiber cells[15,16]. Further, NST1, NST2, and NST3 were found to directly target the expression of downstream TFs including MYB46, SND3, MYB103, and KNAT7[9,17].

    The formation pattern of fruit lignification requires the timely coordination of multiple types of TFs[18]. In A. thaliana, specific fruit lignification is indispensable for seed dispersal[19]. Three MADS-box TFs, namely FRUITFUL (FUL), SHATTERPROOF1 (SHP1) and SHATTERPROOF2 (SHP2), were shown to determine the formation of fruit dehiscence zone[20]. Later, the FUL-SHP regulatory module was found conserved across different plant species to control the expression of key genes involved in fruit development [2124]. In fruit crops, several key TFs involved in lignin biosynthesis have been identified and characterized. EjMYB8, a MYB family TF from loquat, activates the expression of lignin biosynthesis genes, including EjPAL1, Ej4CL1, and Ej4CL5, through direct binding to their promoters[25]. In citrus, overexpression of CsMYB85 significantly increases the expression of Cs4CL1, leading to a greater lignin content of fruits[26]. In pear, PpNAC187, a NST homolog, operates as an important regulator of stone cell formation that directly activates the expression of lignin biosynthesis genes[26]. In loquat, EjNAC1, the NAC type TF, are able to activate the lignin biosynthesis genes in response to temperature changes during the postharvest storage period[27].

    Oil-Camellia is an important woody edible crop predominately cultivated in China. Camellia-oil refers to a suite of species in the genus Camellia, such as C. oleifera, C. meiocarpa, and C. chekiangoleosa, whose main purpose for cultivation is to produce seed oil. Currently, C. oleifera is the main one cultivated for Camellia-oil production[28, 29]. Nevertheless, C. chekiangoleosa — closely-related to C. oleifera — is emerging as a favorable cultivation plant because of its high-quality oil; further, the oil content of its seed kernel is 5%−10% higher than that of C. oleifera[30]. Unlike C. oleifera, C. chekiangoleosa fruits have a very low level of lignin, which plays a prominent role in regulating the rate of fruit expansion, the size of seeds, and seed oil production[31]. In the present study, a tissue-specific transcriptome analysis of C. chekiangoleosa was conducted to elucidate its fruit lignification pattern. Through gene expression analysis and functional verification of transgenic A. thaliana and poplar, the NAC domain transcription factor, CcNST1, was revealed as a key regulator of fruit lignin biosynthesis. This work presents a genome-wide gene expression profile underlying the patterning of fruit lignification and characterizes the functions of CcNST1 in the regulation of fruit lignin biosynthesis.

    The experiment materials of C. chekiangoleosa were obtained from the Research Institute of Subtropical Forestry of the Chinese Academy of Forestry (RISF, CAF; Hangzhou City, Zhejiang Province, China; 119°57′22'' N, 30°03′30'' E). The flower buds and different tissues of the fruits (exocarp, mesocarp, endocarp, seed coat, and seed kernel samples) were collected and placed into liquid nitrogen and stored at –80 °C before use. To distinguish the stages of fruit growth, the materials of C. chekiangoleosa were collected from the Jinhua ‘Dongfanghong’ Forest Farm (Jinhua City, Zhejiang Province, China; 119°30′12'' E, 29°1′55'' N). Arabidopsis thaliana (Columbia ecotype) was grown and maintained in a growth chamber under an 8-h light/16-h dark photoperiod at 21 °C and 40% humidity. The hybrid poplar ‘Nanlin895’ (Populus deltoides × P. euramericana cv. ‘Nanlin895’) was obtained from the Nanjing Forestry University (Nanjing, Jiangsu Province, China) and preserved as cuttings in the greenhouse of RISF. The transgenic poplar plants were initially grown in the growth chamber for about 2 months and then transferred into the greenhouse.

    Total RNA of bud and each tissue was extracted using an RNAprep Pure Plant Kit (Tiangen, Beijing, China). The concentration and integrity of the total RNA were checked by a Nanodrop 2000 spectrophotometer (Thermo Fisher, CA, USA). The sequencing libraries were constructed using the TruSeq RNA library Prep Kit v2, after which transcriptome sequencing was carried out by an Illumina HiSeq4000 using the 2 × 150 bp sequencing pipeline. Both the library construction and sequencing were performed externally, by the Hangzhou LC-Bio Co., Ltd (Hangzhou, China). The raw reads were filtered to remove any low quality reads and adapter sequences, leaving only clean reads used for the assembly of unigenes of C. chekiangoleosa by Trinity v2.4.0[32]. All original sequencing reads were deposited into the National Center for Biotechnology Information (NCBI) SRA database, under Bioproject PRJNA565081. The transcriptome assembly of C. chekiangoleosa is available in the NCBI TSA database under accession number GISO00000000.

    To identify the differentially expressed genes (DEGs), the expression levels of transcripts were calculated as reads per kilobase per million (RPKM). DESeq2 was used to identify DEGs according to two criteria: an absolute fold-change > 2 and FDR adjusted p-value < 0.05[33]. For real-time quantitative PCR (qRT-PCR) analysis, the total RNA was reverse-transcribed by the Prime Script RT reagent Kit (Takara, Dalian, China). The qRT-PCR was run on an ABI PRISM 7300 Real-Time PCR System (Foster City, CA, USA) which used SYBR Premix Ex Taq (Code No. RR420A, Takara, China); relative expression levels calculated according to the 2−ΔΔCᴛ method[34]. The gene-specific primers were designed in PrimerExpress 2.0 software (Supplemental Table S1), and three biological replicates, each with 2 or 3 technical replicates, were used to quantify gene expression.

    Total RNA was reverse-transcribed by using a cDNA synthesis kit (Fermentas, Canada). To identify the homologs of NST-like genes, sequence alignments were performed using the NST1 (AT2g46770) protein sequence (BLASTp, e-value cutoff: E-15). Candidate transcripts were evaluated according to their sequences and expression profiles (Supplemental Table S2). Each full-length sequence was cloned by PCR amplification and then ligated to the T-vector pMDTM20 (Code No. 3270, Takara, Dalian, China) for its sequence verification. Then a CcNST1-Green Fluorescence Protein (GFP) fusion construct was obtained by cloning into the pEXT06/g vector (Cat. exv09, BIOGLE, Hangzhou, China), using specific corresponding primers (Supplemental Table S1). To construct the expression vector for poplar, the pEXT06/g-CchNST1-GFP plasmid was digested by BamHI and PstI and ligated into the pCambia2301 backbone.

    The Agrobacterium tumefaciens strain C58 (pGV3101) harboring the constructs were transformed into A. thaliana by the floral-dip method[35]. Seeds of the ensuing T0 generation were collected and sown on 1/2 MS medium that contained 50 mg/L hygromycin. The independent T1 lines were verified by DNA amplification and gene expression analysis. The subcellular localization analysis was conducted using the root tips. The GFP signals were observed under a Zeiss LSM 800 confocal microscope. To observe the nucleus, each root sample was stain with 0.1 μg/mL DAPI (Sigma, Shanghai, China). The transgenic of hybrid poplar was performed according to the method as described by Kumar & Fladung [36].

    Cross-sections of Arabidopsis and poplar tissues were prepared and stained with safranin and fast green, as previously described by Yin et al.[37]. The root and stem tissues were collected from the wild type and transgenic lines at ca. 38 d post-germination. Stem tissues were sampled between 0.5 and 1.0 cm in length to the basal area, and the mature zone of roots collected ca. 1 cm away from the root tip. For the analysis of poplar, its stem tissues were prepared using the middle part of the fourth internode. The lignin accumulation in fruits for different periods was observed by staining the cross section of fruits with phloroglucinol-hydrochloric acid[15].

    In order to identify the genes involved in the lignification of fruits, we performed a detailed tissue-specific transcriptome analysis of C. chekiangoleosa. Six tissue types with three biological replicates were collected: floral bud (FB), exocarp (EX), mesocarp (ME), endocarp (EN), seed coat (SC), and seed kernel (SK), to determine the global expression patterning of genes (Fig. 1a). In the developmental stage of fruit expansion, both EN and SC were lignified (Fig. 1a) whereas EX and SK were not; a high level of lignified cells were present in SC and EN (Fig. 1a).

    Figure 1.  Tissue-specific transcriptomics in fruit of Camellia chekiangoleosa. (a) Morphology of tissues used for RNA sequencing. On the left is the incipient floral bud; its outside scale leaves are removed before a sample’s preparation. On the right are fruit tissue types at the stage of fruit enlargement; for each, three biological replicates were used for independent library construction and sequencing. FB, floral bud; EX, exocarp; ME, mesocarp; EN, endocarp; SC, seed coat; SK, seed kernel. The red-stained areas indicate the lignified tissues stained by phloroglucinol-hydrochloric acid. Yellow arrows indicate the tissues that were collected for sampling. Three biological replicates were used for library preparation and sequencing analysis. (b) Numbers of differentially expressed transcripts between tissue types. Red and green colors indicate the up-regulated and down-regulated genes, respectively, in each comparison.

    We obtained an average of ca. 79 million reads per RNA sequencing library for the de novo construction of the transcriptome (Supplemental Table S3). The assembled transcriptome consisted of 40,042 unigenes with a N50 value of 1,676 bp (Supplemental Table S4). The transcriptome assembly was annotated using multiple public databases; only those transcripts (unigenes) annotated in at least one database were retained for gene identification (Supplemental Fig. S1ac). Next, the transcriptome was used as a reference to identify the DEGs). We first obtained the expression levels based on the mapping of RNA sequencing reads and then designated the transcripts with > 2-fold change in expression (False Discovery Rate [FDR] corrected p-value < 0.05) as DEGs. Many DEGs were detected between each comparison of different tissue types; in particular, EX-ME and EX-EN displayed relatively fewer DEGs (Fig. 1b), which was consistent with their tissue homology.

    To analyze the expression pattern of genes associated with lignin accumulation in C. chekiangoleosa, EN and SC tissues were selected (due to their high lignin levels); these were also used to distinguish the pertinent genes in the lignification process (Fig. 2a). There were 2,368 and 3,451 common DEGs in the EN-group and SC-group, respectively (Fig. 2a). Integrative analysis revealed 1,083 common DEGs by comparing these two groups (Fig. 2b); in further evaluating the expression patterns of these common DEGs, 568 of them were highly expressed in SC and EN (Fig. 2b). The functional annotation of these highly expressed DEGs revealed that the KEGG pathway 'phenylpropanoid pathway' was significantly enriched, suggesting an early initiation of the lignin biosynthesis (Fig. 2c & d). This result yielded a pool of potential genes likely involved in the lignification of fruits.

    Figure 2.  Functional characterization of differentially expressed genes (DEGs) that are involved in the lignification of the endocarp and seed coat of Camellia chekiangoleosa. (a) Venn diagrams of the DEGs in comparison to EN (left) and SC (right), which revealed 2348 and 3451 unigenes in the EN-group (left red circle) and SC-group (right red circle), respectively. (b) The EN-group and SC-group analysis yielded 1083 DEGs for gene expression analysis. The heatmap analysis of these 1083 genes identified clusters of them highly expressed in various tissue types. The red bar indicates the highly lignified EN and SC tissues. The blue bar indicates those genes highly expressed in EN and SC (568 DEGs); C, KEGG enrichment analysis of 568 DEGs that were highly expressed in EN and SC. D, Distribution of the number of genes that are enriched in 'Biosynthesis of other secondary metabolites'.

    Both the lignin biosynthesis pathway and its transcriptional regulation have been extensively studied[15,18]. Here, potential key genes involved in the regulation of lignin biosynthesis were identified based upon a sequence similarity analysis between C. chekiangoleosa and A. thaliana (Supplemental Table S5). Combined with the DEGs analysis, we screened out 15 lignin biosynthesis genes and six TF genes that could be involved in fruit lignification (Fig. 3a). The proposed biosynthesis and transcriptional regulation pathways were reconstructed to elucidate the lignification process in C. chekiangoleosa fruits (Fig. 3b). This revealed that different types of relevant transcription factors were possibly operating under a hierarchical regulatory network to induce lignin biosynthesis, among which the NAC transcription factor (NST ortholog) might direct a master switch given its intensive expression levels in both SC and EN tissue (Fig. 3b).

    Figure 3.  Tissue-specific expression analysis of lignin biosynthesis and transcriptional regulation gene in Camellia chekiangoleosa. (a) Heatmap of gene expression patterns for lignin-related genes that were identified based on sequence similarity. The gene symbols from Arabidopsis are used to indicate the potential homologs in C. chekiangoleosa. The red arrow indicates the NST homolog. Mean expression levels of transcripts are used for the expression analysis. (b) The key genes participating in lignin biosynthesis and its transcriptional regulation are presented according to known pathways identified in Arabidopsis. The master switch of secondary cell wall formation as regulated by NAC family TFs are highlighted in the red-dashed square.

    To identify the key factors governing fruit lignification, we performed a gene expression analysis during the development of C. chekiangoleosa fruits by focusing on the establishment of lignified tissues (Fig. 4a). A growth curve of fruit development was derived based on the fruit size and lignification patterns (Supplemental Fig. S2). According to the levels of lignin, four critical stages of C. chekiangoleosa fruit development were discernible: stage 1, not lignified; stage 2, initiation of lignification; stage 3, fruit expansion and maintenance of lignification; stage 4, lignification completed (Supplemental Fig. S2; Fig. 4a). Next, the fruit pericarp (P) and seed-associated (S) tissues were dissected to verify the expression profiles of 20 candidate genes, including lignin biosynthesis and transcriptional regulators. The expression of these candidates agreed well with the transcriptomic results (Fig. 4b); notably, the CcNST1 displayed high correlations with the degree of lignification of both the endocarp and seed coat (Fig. 4b). To further verify the contribution from the NST-like gene in C. chekiangoleosa, we evaluated the transcriptome and identified 15 potential NST homologs with full-length ORF (open read frame) (Supplemental Table S2; Supplemental Fig. S3b). We cloned the full-length coding regions of CcNST1 and performed a phylogenetic analysis, which indicated that CcNST1 was an ortholog of the SND1/NST gene (Supplemental Fig. S3a & c). These results suggested that CcNST1 was an important regulator controlling the fruit lignification process in C. chekiangoleosa.

    Figure 4.  Expression analysis of genes involved in the regulation of lignin biosynthesis in pericarp and seed tissues during the fruit development of Camellia chekiangoleosa. (a) Staining of the vertical section of C. chekiangoleosa fruit in different periods. The purple stain signals from phloroglucinol-HCl indicate the lignified cells; the red arrowheads indicate the respective pericarp and seed tissue portions sampled at different stages of fruit development. The selection of the sampling is based on the developmental curves of C. chekiangoleosa fruits. P denotes mixed pericarp tissues; S denotes the mixed seed tissues. The arrows point to the areas of mixed tissues sampled at different developmental stages. (b) The qRT-PCR analysis of expression patterns of lignin biosynthesis genes at the four critical stages of P and S tissues. The expression of CchNST1 was significantly up-regulated at 75 to 93 d post-fertilization in the P and S samples, corresponding to the lignification of the endocarp and seed coat. Values are means ± s.d. of three biological replicates.

    To investigate the roles of CcNST1, overexpression lines in Arabidopsis were generated. The T2 lines were identified via PCR using construct-specific primers (Supplemental Table S1; Supplemental Fig. S4a). Three lines displaying strong phenotypic alterations and high expression levels were used for further analyses (Supplemental Fig. S4b). We found that the overexpression lines displayed pleiotropic growth defects in different tissues, including a smaller size, upward curling of leaves, and distorted stems (Fig. 5a). Histological analysis of the wild type versus transgenic lines was carried out to understand the cellular changes of the CcNST1 overexpression lines. Evidently, the overexpression lines displayed markedly enhanced lignified vascular bundles (Fig. 5e & f), and the vascular tissue possessed more lignified cell layers and enlarged areas than did the wild type (Fig. 5cf & i). Furthermore, the mature zone of root tissues contained many more lignified cells in the transgenic lines than the wild type (Fig. 5gh & j). Subcellular analysis of the CcNST1-GFP fusion protein revealed that CcNST1 was localized in the nucleus (Fig. 5b). To investigate the downstream events, we analyzed the expression levels of AtBLH6, AtMYB46, and AtMYB83 (downstream targets of AtNST1). All three tested genes were significantly up-regulated in the transgenic lines, while the expression of AtNST1 went unchanged (Fig. 5k). These results indicated CcNST1 was a potential key regulator for initiating the lignin biosynthesis pathway and that it therefore might play important roles in fruit lignification.

    Figure 5.  Overexpression of CcNST1 in Arabidopsis. (a) Overexpression lines displayed various growth defects. Scale bar = 1 cm. The arrows indicate the striking curling leaves. (b) Subcellular localization analysis of the CcNST1:GFP fusion protein by confocal microscopy. Arrows indicate the signals in the nucleus. From left to right, the panels depict the DAPI signal, GFP signal, bright field, and superimposed images; scale bars = 5 µm. (c) & (d) Histological analysis of stem morphology in wild-type stems. (e) & (f) Histological analysis of stem morphology in the transgenic lines; scale bars = 100 µm. Histological analysis of root morphology in the transgenic lines (g) and (h) wild type; scale bars = 100 µm. (i) Statistical analysis of lignified cells in stem and root tissues. n indicated the independent measurements; values are means ± s.d.. (j) Statistical analysis of lignified areas in root tissues. The number of samples used for each statistical analysis is indicated by n. (k) Relative expression levels of Arabidopsis NST1, BLH6, MYB46 and MYB83 genes between the wild type and transgenic lines. Three independent transgenic lines were used for gene expression analysis. The expression of endogenous AtNST1 was not significantly changed. Asterisks indicate significant p-values (< 0.05) for the Student’s t-test.

    The NST-type transcription factor has been shown to possess conserved functions in the model tree species P. trichocarpa[16]. Accordingly, it is interesting to know whether the function of CcNST1 is conserved across woody species. We performed a transgenic analysis using hybrid poplar ('Nanlin895') and generated overexpression lines of CcNST1. Expression of CcNST1 in independent poplar lines was confirmed and the enhanced expression of CcNST1 was detectable at the early stage of leaf development (Fig. 6b). During vegetative growth, the transgenic poplar featured consistent phenotypes, including drooping leaves and disordered leaf veins (Fig. 6a). By contrast, no obvious stem phenotypes were distinguishable. Then a histological analysis was performed to characterize the leaf midrib and stem tissue of the wild type versus overexpression lines in poplar. This showed that, transgenic line, their midribs at the distorted position had abnormal vascular tissues: some lignified cells formed irregular vascular-like tissues (Fig. 6c & d). The anatomy of stem structures was investigated further by using the fourth internode where the vascular system is established[38]. We found that the transgenic lines displayed enhanced lignified cells in their xylems (Fig. 6di), similar to the results for A. thaliana (Fig. 5cf). Further, the transgenic lines evidently contained condensed parenchyma cells (Fig. 6gi), suggesting a role for secondary cell wall formation. To evaluate the potential functioning of CcNST1, the downstream TFs of the NST homolog in P. trichocarpa were tested: the expression levels of SND1, MYB21 and MYB74 were all significantly up-regulated in the overexpression lines (Fig. 6j). Taken together, from these results we concluded that CcNST1 harbors conserved functions of lignin biosynthesis and secondary cell wall formation in woody plant species.

    Figure 6.  Ectopic expression of CchNST1 in hybrid poplar (‘Nanlin 895’). (a) Comparison of overall morphology between the control and transgenic poplar plants. On the left is a transgenic plant of the empty vector as a control; middle and right are plants of independent lines of 35s:CcNST1. The inset shows a close-up view of the distorted leaf midvein in the transgenic lines. Scale bar = 10 cm. (b) Expression level of CcNST1 in different independent transgenic lines. ND, not detected. (c) Vertical sections of the midrib in control (left) and 35s:CcNST1 (right) lines. (d)-(f) Cross sections of the fourth internode of control lines. Red arrows indicate the phloem fiber cells and xylem cells. Black scale bars = 250 µm, white scale bars = 100 µm. (g)-(i) Cross sections of the fourth internode of the 35s:CcNST1 lines. The enhanced secondary cell wall in phloem fiber cells and xylem cells are shown. Black scale bars = 250 µm, white bars 100 = µm. (j) Expression of downstream genes PtSND1, PtMYB21, and PtMYB74 in the control and transgenic CcNST1 lines. Three independent transgenic lines were used for gene expression analysis. Asterisks indicate a significant Student’s t-test (p < 0.05). In (b) and (j) values are means ± s.d. of three biological replicates.

    Tissue-specific transcriptomics analysis is widely used to identify regulators involved in plant development, growth, and responses to environmental stress[39]. Lignification of specific fruit tissues is an evolutionary significant process that affects seed dispersal, whose regulation is also of great economic importance in fruit crops. Although a vast number of transcriptomic studies of various fruit types have been reported in recent years, the comprehensive analysis of fruit tissue-specific transcriptomics remains relatively scarce. In the present work, we performed a detailed tissue-specific transcriptome analysis of C. chekiangoleosa based on its fruit lignification pattern (Fig. 1a). The DEGs’ analysis focused on those genes associated with the highly lignified EN and SC tissue, which revealed thousands of them that were potentially involved in the fruit lignification process (Fig. 1). Functional analysis suggested the enriched DEGs were related to various biological pathways including the phenylpropanoid biosynthesis pathway (Fig. 2c & d), which implicates a central role for lignin biosynthesis during fruit tissue patterning. In peach fruit, for example, a genome-wide characterization of its transcriptome during the phase of stone cell formation in endocarp found evidence for the induction of prominent phenylpropanoid, lignin, and flavonoid pathway genes[40,41]. Likewise, a transcriptomics study of three developmental stages of pear fruit demonstrated that up-regulation of Cinnamoyl-CoA Reductase (CCR) was involved in stone cell formation[42]. Our results from the gene expression analyses are largely consistent with previous work (Fig. 3), which suggests that common regulatory pathways are involved in establishing fruit lignification patterns.

    The formation of a specific lignification pattern in fruits is regulated by the coordination of several types of TFs active during the developmental stages of fruit. Camellia plants form typical capsular fruits that undergo two independent lignification events, that of fruit peels and that of the seed coat[31]. A genetic model for how lignification of C. chekiangoleosa fruits is directed has been proposed: a cascade of TFs, starting with the SHP-FUL MADS-box TFs through to bHLH-type TFs, NAC, MYB, and BLH TFs work together to regulate the biosynthesis of the cell wall and secondary metabolites during fruit development[40]. We showed that the expression patterns of different types of TFs, including NAC, MYB, and BLH-like families, are correlated with the lignin accumulation in C. chekiangoleosa fruits (Fig. 3b). Hence, our results provided empirical evidence of the transcriptional network underlying that fruit’s lignification pattern. We also found that Camellia fruits are diverse in their size, secondary metabolites, and seed oil contents[31]. But little is known about genetic regulation of fruit development in Camellia species, probably because of insufficient molecular biology tools. In the future, the functional characterizations of those TFs in C. chekiangoleosa will be essential for elucidating the regulatory mechanism responsible for that plant’s specific lignification pattern.

    Lignification is a unique process contributing critically toward the maintenance and regulation of plants growth and development and their responses to biotic/abiotic stresses. Although lignin biosynthesis and its transcriptional regulation have been extensively studied for wood formation, lignification's regulation during fruit development is not yet well characterized, especially in fruit crops. The genus Camellia contains many species whose seed oil production is economically valuable. The fruit lignification is also a critical breeding trait associated with fruit size, seed dispersal, and oil yield[31]. Recent work on C. japonica characterized the homolog gene of SHP1/2 (CjPLE) and revealed its potential role in regulating the pattern of fruit lignification; however, based on the callus-transformation assay, direct activation of lignin biosynthesis genes by CjPLE was not proved[24]. Here we evaluated the key lignin biosynthesis genes and TFs in C. chekiangoleosa, finding that major lignin-related genes were highly expressed in both EN and SC tissues (Fig. 3). Therefore, we proposed that the activation of lignin biosynthesis in specified tissues requires a hierarchical interaction of TFs during fruit development.

    The NST-like TFs are recognized as master regulators in the regulation of lignin biosynthesis for secondary cell wall formation in two well studied plants, A. thaliana and P. trichocarpa[15]. Research on fruit crops has uncovered conserved functions of homologs of NST-like NAC genes for regulating the fruit lignification process[43]. In loquat fruits, four NAC TFs (EjNAC1-4) are correlated with lignin accumulation in response to low temperature storage and heat stress[27]. Functional analyses showed that EjNAC1 and EjNAC3 are capable of directly activating the expression of lignin biosynthesis genes[27]. We found that CcNST1 was highly expressed in EN and SC tissues, whose levels correlated with the lignification pattern (Figs 1 & 3). Further, we showed that ectopic expression of CcNST1 in A. thaliana and hybrid poplar augmented tissue lignification (Figs 5 & 6). These results provided evidence that CcNST1 acts as a positive regulator of lignin biosynthesis in C. chekiangoleosa. Also, in the transgenic lines of poplar, the expression of SND1, MYB21, and MYB74 — downstream TFs of the poplar NST gene — was significantly up-regulated (Fig. 6). This result suggests CcNST1 is a high hierarchical activator of lignin biosynthesis during fruit development. Future work using the Camellia-based genetic transformation systems is now required to uncover the downstream genes regulated by CcNST1.

    This work was supported by Nonprofit Research Projects (CAFYBB2021QD001) of Chinese Academy of Forestry and National Key R&D Program of China (2019YFD1001602). We would like to thank Dr. Zhifeng Wang from Northeast Forestry University, China, for help with the poplar experiments.

  • The authors declare that they have no conflict of interest.

  • Supplemental Tables S1 Model comparison of linear and polynomial regression.
    Supplemental Tables S2 Forward selection of explained variables.
    Supplemental Tables S3 Significance test of PCNM.
    Supplemental Fig. S1 Multiple collinearity analysis of environmental variables.
    Supplemental Fig. S2 Community beta diversity and its components between neighboring community.
  • [1]

    Whittaker RH. 1960. Vegetation of the Siskiyou Mountains, Oregon and California. Ecological Monographs 30:279−338

    doi: 10.2307/1943563

    CrossRef   Google Scholar

    [2]

    Chesson P. 2000. Mechanisms of maintenance of species diversity. Annual Review of Ecology and Systematics 31:343−66

    doi: 10.1146/annurev.ecolsys.31.1.343

    CrossRef   Google Scholar

    [3]

    Chesson P. 2018. Updates on mechanisms of maintenance of species diversity. Journal of Ecology 106:1773−94

    doi: 10.1111/1365-2745.13035

    CrossRef   Google Scholar

    [4]

    Rosindell J, Hubbell SP, Etienne RS. 2011. The unified neutral theory of biodiversity and biogeography at age ten. Trends in Ecology and Evolution 26:340−48

    doi: 10.1016/j.tree.2011.03.024

    CrossRef   Google Scholar

    [5]

    Catano CP, Dickson TL, Myers JA. 2017. Dispersal and neutral sampling mediate contingent effects of disturbance on plant beta-diversity: a meta-analysis. Ecology Letters 20:347−56

    doi: 10.1111/ele.12733

    CrossRef   Google Scholar

    [6]

    Mori AS, Isbell F, Seidl R. 2018. β-diversity, community assembly, and ecosystem functioning. Trends in Ecology & Evolution 33:549−64

    doi: 10.1016/j.tree.2018.04.012

    CrossRef   Google Scholar

    [7]

    Torres I, Parra A, Moreno JM. 2022. Effects of spatial distance and woody plant cover on beta diversity point to dispersal limitation as a driver of community assembly during postfire succession in a Mediterranean shrubland. Ecology and Evolution 12:e9130

    doi: 10.1002/ece3.9130

    CrossRef   Google Scholar

    [8]

    Hu D, Jiang L, Hou Z, Zhang J, Wang H, et al. 2022. Environmental filtration and dispersal limitation explain different aspects of beta diversity in desert plant communities. Global Ecology and Conservation 33:e01956

    doi: 10.1016/j.gecco.2021.e01956

    CrossRef   Google Scholar

    [9]

    Soininen J, McDonald R, Hillebrand H. 2007. The distance decay of similarity in ecological communities. Ecography 30:3−12

    doi: 10.1111/j.0906-7590.2007.04817.x

    CrossRef   Google Scholar

    [10]

    Lande R. 1996. Statistics and partitioning of species diversity, and similarity among multiple communities. Oikos 76:5−13

    doi: 10.2307/3545743

    CrossRef   Google Scholar

    [11]

    Wilson MV, Shmida A. 1984. Measuring beta diversity with presence-absence data. Journal of Ecology 72:1055−64

    doi: 10.2307/2259551

    CrossRef   Google Scholar

    [12]

    Koleff P, Gaston KJ, Lennon JJ. 2003. Measuring beta diversity for presence–absence data. Journal of Animal Ecology 72:367−82

    doi: 10.1046/j.1365-2656.2003.00710.x

    CrossRef   Google Scholar

    [13]

    Leinster T, Cobbold CA. 2012. Measuring diversity: the importance of species similarity. Ecology 93:477−89

    doi: 10.1890/10-2402.1

    CrossRef   Google Scholar

    [14]

    Baselga A. 2010. Partitioning the turnover and nestedness components of beta diversity. Global Ecology and Biogeography 19:134−43

    doi: 10.1111/j.1466-8238.2009.00490.x

    CrossRef   Google Scholar

    [15]

    Eibes PM, Oldeland J, Irl SDH, Twerski A, Kühne N, et al. 2021. Partitioned beta diversity patterns of plants across sharp and distinct boundaries of quartz habitat islands. Journal of Vegetation Science 32:e13036

    doi: 10.1111/jvs.13036

    CrossRef   Google Scholar

    [16]

    Qian H. 2009. Beta diversity in relation to dispersal ability for vascular plants in North America. Global Ecology and Biogeography 18:327−32

    doi: 10.1111/j.1466-8238.2009.00450.x

    CrossRef   Google Scholar

    [17]

    Guo Y, Xiang W, Wang B, Li D, Mallik AU, et al. 2018. Partitioning beta diversity in a tropical karst seasonal rainforest in Southern China. Scientific Reports 8:17408

    doi: 10.1038/s41598-018-35410-7

    CrossRef   Google Scholar

    [18]

    Alahuhta J, Kosten S, Akasaka M, Auderset D, Azzella MM, et al. 2017. Global variation in the beta diversity of lake macrophytes is driven by environmental heterogeneity rather than latitude. Journal of Biogeography 44:1758−69

    doi: 10.1111/jbi.12978

    CrossRef   Google Scholar

    [19]

    Nanda SA, Haq MU, Singh SP, Reshi ZA, Rawal RS, et al. 2021. Species richness and β-diversity patterns of macrolichens along elevation gradients across the Himalayan Arc. Scientific Reports 11:20155

    doi: 10.1038/s41598-021-99675-1

    CrossRef   Google Scholar

    [20]

    Novillo A, Ojeda R. 2020. Turnover, richness difference and nestedness of rodent assemblages along the southern Andes elevation gradient. Austral Ecology 46:239−48

    doi: 10.1111/aec.12974

    CrossRef   Google Scholar

    [21]

    Britton AJ, Beale CM, Towers W, Hewison RL. 2009. Biodiversity gains and losses: evidence for homogenisation of Scottish alpine vegetation. Biological Conservation 142:1728−39

    doi: 10.1016/j.biocon.2009.03.010

    CrossRef   Google Scholar

    [22]

    Bevilacqua S, Plicanti A, Sandulli R, Terlizzi A. 2012. Measuring more of β-diversity: quantifying patterns of variation in assemblage heterogeneity an insight from marine benthic assemblages. Ecological Indicators 18:140−48

    doi: 10.1016/j.ecolind.2011.11.006

    CrossRef   Google Scholar

    [23]

    Cordeiro AAC, Klanderud K, Villa PM, Neri AV. 2023. Patterns of species richness and beta diversity of vascular plants along elevation gradient in Brazilian páramo. Journal of Mountain Science 20:1911−20

    doi: 10.1007/s11629-022-7480-9

    CrossRef   Google Scholar

    [24]

    Tan L, Fan C, Zhang C, Gadow KV, Fan X. 2017. How beta diversity and the underlying causes vary with sampling scales in the Changbai mountain forests. Ecology and Evolution 7:10116−23

    doi: 10.1002/ece3.3493

    CrossRef   Google Scholar

    [25]

    Morueta-Holme N, Enquist BJ, McGill BJ, Boyle B, Jørgensen PM, et al. 2013. Habitat area and climate stability determine geographical variation in plant species range sizes. Ecology Letters 16:1446−54

    doi: 10.1111/ele.12184

    CrossRef   Google Scholar

    [26]

    Steege HT, Pitman NCA, Sabatier D, Baraloto C, Salomão RP, et al. 2013. Hyperdominance in the Amazonian tree flora. Science 342:1243092

    doi: 10.1126/science.1243092

    CrossRef   Google Scholar

    [27]

    McFadden IR, Sandel B, Tsirogiannis C, Morueta-Holme N, Svenning JC, et al. 2019. Temperature shapes opposing latitudinal gradients of plant taxonomic and phylogenetic β diversity. Ecology Letters 22:1126−35

    doi: 10.1111/ele.13269

    CrossRef   Google Scholar

    [28]

    Soininen J, Heino J, Wang J. 2018. A meta-analysis of nestedness and turnover components of beta diversity across organisms and ecosystems. Global Ecology and Biogeography 27:96−109

    doi: 10.1111/geb.12660

    CrossRef   Google Scholar

    [29]

    Rahbek C, Borregaard MK, Colwell RK, Dalsgaard B, Holt BG, et al. 2019. Humboldt's enigma: what causes global patterns of mountain biodiversity? Science 365:1108−13

    doi: 10.1126/science.aax0149

    CrossRef   Google Scholar

    [30]

    Crimmins SM, Dobrowski SZ, Greenberg JA, Abatzoglou JT, Mynsberge AR. 2011. Changes in climatic water balance drive downhill shifts in plant species' optimum elevations. Science 331:324−27

    doi: 10.1126/science.1199040

    CrossRef   Google Scholar

    [31]

    Sundqvist MK, Sanders NJ, Wardle DA. 2013. Community and ecosystem responses to elevational gradients: processes, mechanisms, and insights for global change. Annual Review of Ecology, Evolution, and Systematics 44:261−80

    doi: 10.1146/annurev-ecolsys-110512-135750

    CrossRef   Google Scholar

    [32]

    da Silva PG, Lobo JM, Hensen MC, Vaz-de-Mello FZ, Hernández MIM. 2018. Turnover and nestedness in subtropical dung beetle assemblages along an elevational gradient. Diversity & Distributions 24:1277−90

    doi: 10.1111/ddi.12763

    CrossRef   Google Scholar

    [33]

    Jiang X, Chen J, Xie Z. 2019. Different roles of elevational and local environmental factors on abundance-based beta diversity of the soil Enchytraeidae on the Changbai Mountain. Ecology and Evolution 9:2180−88

    doi: 10.1002/ece3.4913

    CrossRef   Google Scholar

    [34]

    Si X, Baselga A, Ding P. 2015. Revealing beta-diversity patterns of breeding bird and lizard communities on inundated land-bridge islands by separating the turnover and nestedness components. PLoS ONE 10:e0127692

    doi: 10.1371/journal.pone.0127692

    CrossRef   Google Scholar

    [35]

    Baselga A. 2013. Separating the two components of abundance-based dissimilarity: balanced changes in abundance vs. abundance gradients. Methods in Ecology and Evolution 4:552−57

    doi: 10.1111/2041-210X.12029

    CrossRef   Google Scholar

    [36]

    Baselga A, Orme CDL. 2012. betapart: an R package for the study of beta diversity. Methods in Ecology and Evolution 3:808−12

    doi: 10.1111/j.2041-210X.2012.00224.x

    CrossRef   Google Scholar

    [37]

    Legendre P, Mi X, Ren H, Ma K, Yu M, et al. 2009. Partitioning beta diversity in a subtropical broad-leaved forest of China. Ecology 90:663−74

    doi: 10.1890/07-1880.1

    CrossRef   Google Scholar

    [38]

    Su S, Liu J, He Z, Zheng S, Hong W, et al. 2015. Ecological species groups and interspecific association of dominant tree species in Daiyun Mountain National Nature Reserve. Journal of Mountain Science 12:637−46

    doi: 10.1007/s11629-013-2935-7

    CrossRef   Google Scholar

    [39]

    Li M, He Z, Jiang L, Gu X, Jin M, et al. 2021. Distribution pattern and driving factors of species diversity and phylogenetic diversity along altitudinal gradient on the south slope of Daiyun Mountain. Acta Ecologica Sinica 41:1148−57

    doi: 10.5846/stxb201910082091

    CrossRef   Google Scholar

    [40]

    Anderson MJ, Crist TO, Chase JM, Vellend M, Inouye BD, et al. 2011. Navigating the multiple meanings of β diversity: a roadmap for the practicing ecologist. Ecology Letters 14:19−28

    doi: 10.1111/j.1461-0248.2010.01552.x

    CrossRef   Google Scholar

    [41]

    Chen B, Chen L, Jiang L, Zhu J, Chen J, et al. 2022. C:N:P stoichiometry of plant, litter and soil along an elevational gradient in subtropical forests of China. Forests 13:372

    doi: 10.3390/f13030372

    CrossRef   Google Scholar

    [42]

    Jiang L, He Z, Gu X, Liu J, Feng X, et al. 2020. Classification and Ordination of the Pinus taiwanensis forest on Daiyun Mountain, Fujian Province, China. Taiwania 65:119−28

    doi: 10.6165/tai.2020.65.119

    CrossRef   Google Scholar

    [43]

    Chazdon RL, Chao A, Colwell RK, Lin S, Norden N, et al. 2011. A novel statistical method for classifying habitat generalists and specialists. Ecology 92:1332−43

    doi: 10.1890/10-1345.1

    CrossRef   Google Scholar

    [44]

    Godsoe W, Bellingham PJ, Moltchanova E. 2022. Disentangling Niche Theory and Beta Diversity Change. The American Naturalist 199:510−22

    doi: 10.1086/718592

    CrossRef   Google Scholar

    [45]

    Ahmad M, Uniyal SK, Batish DR, Singh HP, Jaryan V, et al. 2020. Patterns of plant communities along vertical gradient in Dhauladhar mountains in Lesser Himalayas in North-Western India. Science of The Total Environment 716:136919

    doi: 10.1016/j.scitotenv.2020.136919

    CrossRef   Google Scholar

    [46]

    Marini L, Bertolli A, Bona E, Federici G, Martini F, et al. 2013. Beta-diversity patterns elucidate mechanisms of alien plant invasion in mountains. Global Ecology and Biogeography 22:450−60

    doi: 10.1111/geb.12006

    CrossRef   Google Scholar

    [47]

    Fontana V, Guariento E, Hilpold A, Niedrist G, Steinwandter M, et al. 2020. Species richness and beta diversity patterns of multiple taxa along an elevational gradient in pastured grasslands in the European Alps. Scientific Reports 10:12516

    doi: 10.1038/s41598-020-69569-9

    CrossRef   Google Scholar

    [48]

    McCain CM. 2009. Vertebrate range sizes indicate that mountains may be 'higher' in the tropics. Ecology Letters 12:550−60

    doi: 10.1111/j.1461-0248.2009.01308.x

    CrossRef   Google Scholar

    [49]

    Ghalambor CK, Huey RB, Martin PR, Tewksbury JJ, Wang G. 2006. Are mountain passes higher in the tropics? Janzen's hypothesis revisited. Integrative and Comparative Biology 46:5−17

    doi: 10.1093/icb/icj003

    CrossRef   Google Scholar

    [50]

    Zhang Q, Wang J, Wang Q. 2021. Effects of abiotic factors on plant diversity and species distribution of alpine meadow plants. Ecological Informatics 61:101210

    doi: 10.1016/j.ecoinf.2021.101210

    CrossRef   Google Scholar

    [51]

    Yu C, Fan C, Zhang C, Zhao X, Gadow KV. 2021. Decomposing spatial β-diversity in the temperate forests of Northeastern China. Ecology and Evolution 11:11362−72

    doi: 10.1002/ece3.7926

    CrossRef   Google Scholar

    [52]

    Rejmánek M. 2000. Invasive plants: approaches and predictions. Austral Ecology 25:497−506

    doi: 10.1046/j.1442-9993.2000.01080.x

    CrossRef   Google Scholar

    [53]

    Plotkin JB, Muller-Landau HC. 2002. Sampling the species composition of a landscape. Ecology 83:3344−56

    doi: 10.1890/0012-9658(2002)083[3344:STSCOA]2.0.CO;2

    CrossRef   Google Scholar

    [54]

    Beck J, Schwanghart W. 2010. Comparing measures of species diversity from incomplete inventories: an update. Methods in Ecology and Evolution 1:38−44

    doi: 10.1111/j.2041-210x.2009.00003.x

    CrossRef   Google Scholar

    [55]

    Cassey P, Lockwood JL, Olden JD, Blackburn TM. 2008. The varying role of population abundance in structuring indices of biotic homogenization. Journal of Biogeography 35:884−92

    doi: 10.1111/j.1365-2699.2007.01827.x

    CrossRef   Google Scholar

    [56]

    Barwell LJ, Isaac NJB, Kunin WE. 2015. Measuring β-diversity with species abundance data. Journal of Animal Ecology 84:1112−22

    doi: 10.1111/1365-2656.12362

    CrossRef   Google Scholar

    [57]

    Angeler DG. 2013. Revealing a conservation challenge through partitioned long-term beta diversity: increasing turnover and decreasing nestedness of boreal lake metacommunities. Diversity and Distributions 19:772−81

    doi: 10.1111/ddi.12029

    CrossRef   Google Scholar

    [58]

    Hermant M, Prinzing A, Vernon P, Convey P, Hennion F. 2013. Endemic species have highly integrated phenotypes, environmental distributions and phenotype-environment relationships. Journal of Biogeography 40:1583−94

    doi: 10.1111/jbi.12095

    CrossRef   Google Scholar

    [59]

    Cordeiro AAC, Neri AV. 2019. Spatial patterns along an elevation gradient in high altitude grasslands, Brazil. Nordic Journal of Botany 37

    doi: 10.1111/njb.02065

    CrossRef   Google Scholar

    [60]

    Araujo LS, Komonen A, Lopes-Andrade C. 2015. Influences of landscape structure on diversity of beetles associated with bracket fungi in Brazilian Atlantic Forest. Biological Conservation 191:659−66

    doi: 10.1016/j.biocon.2015.08.026

    CrossRef   Google Scholar

  • Cite this article

    Jiang L, Zhang X, Zhu J, Wei X, Chen B, et al. 2023. Environmental heterogeneity determines beta diversity and species turnover for woody plants along an elevation gradient in subtropical forests of China. Forestry Research 3:26 doi: 10.48130/FR-2023-0026
    Jiang L, Zhang X, Zhu J, Wei X, Chen B, et al. 2023. Environmental heterogeneity determines beta diversity and species turnover for woody plants along an elevation gradient in subtropical forests of China. Forestry Research 3:26 doi: 10.48130/FR-2023-0026

Figures(4)  /  Tables(2)

Article Metrics

Article views(5101) PDF downloads(957)

ARTICLE   Open Access    

Environmental heterogeneity determines beta diversity and species turnover for woody plants along an elevation gradient in subtropical forests of China

Forestry Research  3 Article number: 26  (2023)  |  Cite this article

Abstract: To understand how diversity change with environmental gradients is a fundamental aim for clarifying biodiversity pattern and underlying mechanisms. Here, we studied the characteristics of beta diversity and its partitioning components for woody plant communities along an elevation gradient in subtropical forests of China, and thus explored the effects of environment and space on beta diversity. By using the Classification Method, we divided the species of Daiyun Mountain into four groups, namely generalists, high-elevation specialists, low-elevation specialists and rare species. We then calculated beta diversity, and partitioned it into species turnover and species nestedness. dbRDA was conducted to analyze the impact of spatial and environmental distance on the beta diversity and its partitioning components. Beta diversity comprised of two components: species turnover and species nestedness. Species turnover was the larger contributor to total beta diversity, and it tended to increase as elevation changed. This pattern can be attributed to environmental heterogeneity, resulting in the differentiation of specialized species and an increase in species turnover and beta diversity. Environmental factors, specifically the air temperature and slope, played a significant role in explaining the variation of turnover and beta diversity. However, spatial variables did not have a significant influence on these patterns. The maintenance of biodiversity in Daiyun Mountain was mainly governed by environmental filtering. Future conservation efforts should focus on strengthening the protection of specialized species in high elevation areas.

    • Beta diversity is an important spatial measure of biodiversity that assesses the differences in species composition among different communities across habitat gradients[1]. It is used to quantify the species composition differences among various environmental gradients or regions. Beta diversity not only reflects the pattern of regional biodiversity, but also provides insight into the relationship between species and the environment, which can be used to infer the processes underlying community assembly. Community assembly can be explained by two theories, niche theory and neutral theory[2,3]. Niche theory predicts that environmental variables are the main factors influencing species diversity patterns, while neutral theory suggests that spatial distance better explains species diversity patterns[46]. The spatial pattern of beta diversity is influenced by both environmental filtering and dispersal limitation, although their respective contributions differ. Therefore, understanding the underlying mechanisms that drives the variation of beta diversity is of great significance[7,8].

      A variety of methods have been proposed to measure beta diversity, which has expanded the application of beta diversity in ecology and conservation biology[1,9,10]. Among these methods, the Jaccard and Sørensen dissimilarity index are widely utilized[1113]. Baselga was the first to propose a method of beta diversity partitioning based on the Sørensen index. This method can separate beta diversity into two components: species turnover and species nestedness[14]. Species turnover refers to the replacement of species between communities, which may be a result of niche differentiation, evolutionary processes or dispersal limitation[15,16]. Species nestedness reflects changes in species richness caused by species loss or gain, often related to historical processes such as selective extinction and selective colonization[17]. Most studies have consistently indicated that turnover is the primary component of beta diversity[1820]. This implies that the ecological processes shaping the spatial distribution of beta diversity can be approached from the perspective of turnover. Habitat heterogeneity hypothesis suggests that greater heterogeneity is more likely to have a greater species occupancy, leading to higher species diversity and more specialized species[21,22]. This, in turn, contributes to greater community turnover and beta diversity[23]. Dispersal limitation also contributes to turnover by promoting species aggregation[24], with lower dispersal capacity associated with higher species turnover and beta diversity[16]. Both environmental filtering and dispersal limitation play a crucial role in influencing species range size, consequently changing the balance between specialized and generalized species within a community. These factors have an impact on species turnover and, ultimately, the level of beta diversity within a community[25,26]. Investigating the relationship between beta diversity and different types of species enable deeper exploration of the potential causes of community spatial variation[6].

      High habitat heterogeneity along the environmental gradient provides an ideal platform for the study of beta diversity and its component decomposition[18,27,28]. However, previous research has primarily focused on the latitudinal gradient, there has been relatively limited research on the elevation gradients in mountains. Mountains only account for 25% of the total area of terrestrial ecosystems on earth, but they conserve more than 85% of the global biological taxa[29]. The elevation gradients in mountains lead to extreme environmental variations over relatively short distances. For instance, temperature can change 1,000 times faster in mountains compared to latitudinal gradients[30]. McFadden et al.[27] has shown that these rapid environmental changes in mountains contribute to a higher variation in beta diversity compared to local regions, with the environmental influence on beta diversity of mountain communities being more pronounced. Mountains therefore provide natural experimental sites for studying community and ecosystem processes, making them crucial areas for biodiversity research and conservation[31]. Currently, research on beta diversity along elevation gradients primarily focus on the variation in diversity of different taxa[28], the distribution pattern of beta diversity[20,32,33], the partitioning of beta diversity[3436], and the separation of spatial and environmental effects[33,37]. There exists a certain relationship between species, beta diversity, turnover, and the environment. Integrating these factors is crucial for gaining a comprehensive understanding of beta diversity.

      Daiyun Mountain, located in the transitional zone between central and south tropical regions, has a large elevation change where the highest elevation reaches 1,856 m. With the increase of elevation, mountain evergreen broad-leaved forest (700−1,000 m), coniferous‐broadleaf mixed forest (1,000−1,400 m), coniferous forest (1,400−1,650 m) and moss pygmy forest (> 1,650 m) are distributed successively, forming a natural vertical vegetation spectrum[38]. Research on biodiversity in Daiyun Mountain has primarily focused on α diversity and phylogenetic diversity[39]. However, limited studies have been conducted on beta diversity. Understanding beta diversity and its partitioning components along elevational gradients is crucial for comprehending the mechanisms behind changes in species composition[40]. Thus, our study aimed to investigate the elevational pattern of beta diversity and its partitioning components, and analyze the influence of spatial and environmental factors on beta diversity and its components. Specifically, we sought to answer the following three questions: (1) How do beta diversity and its partitioning components vary along the elevation gradient in Daiyun Mountain? (2) What are the relative contributions of environmental filtering and dispersal limitation to the distribution pattern of beta diversity? (3) What is the relationship between environment, species, beta diversity and its decomposing components?

    • Daiyun Mountain National Nature Reserve (25°38'07″−25°43'40″N, 118°05'22″−118°20'15″N) is located in Dehua County, Fujian Province, China. With a maximum elevation of 1,856 m, it exemplifies a typical coastal mountainous forest ecosystem in southeastern China. The region boasts diverse topography, noticeable elevation gradients, moderate temperatures, and a distinctive microclimate. The predominant vegetation type is subtropical evergreen broad-leaved forest, while the primary soil type is mountain Ferric acrisols soil[41].

    • Eight 20 m × 30 m plant community sampling plots were set at intervals of 100 m at an elevation of 900−1,600 m of Daiyun Mountain. Each plot was further divided into three 10 m × 20 m quadrats (see Fig. 1). All woody plants within the quadrats with DBH ≥ 1 cm were identified for species by Flora of China (http://www.iplant.cn/foc), the abundance was recorded, and the DBH and height were measured.
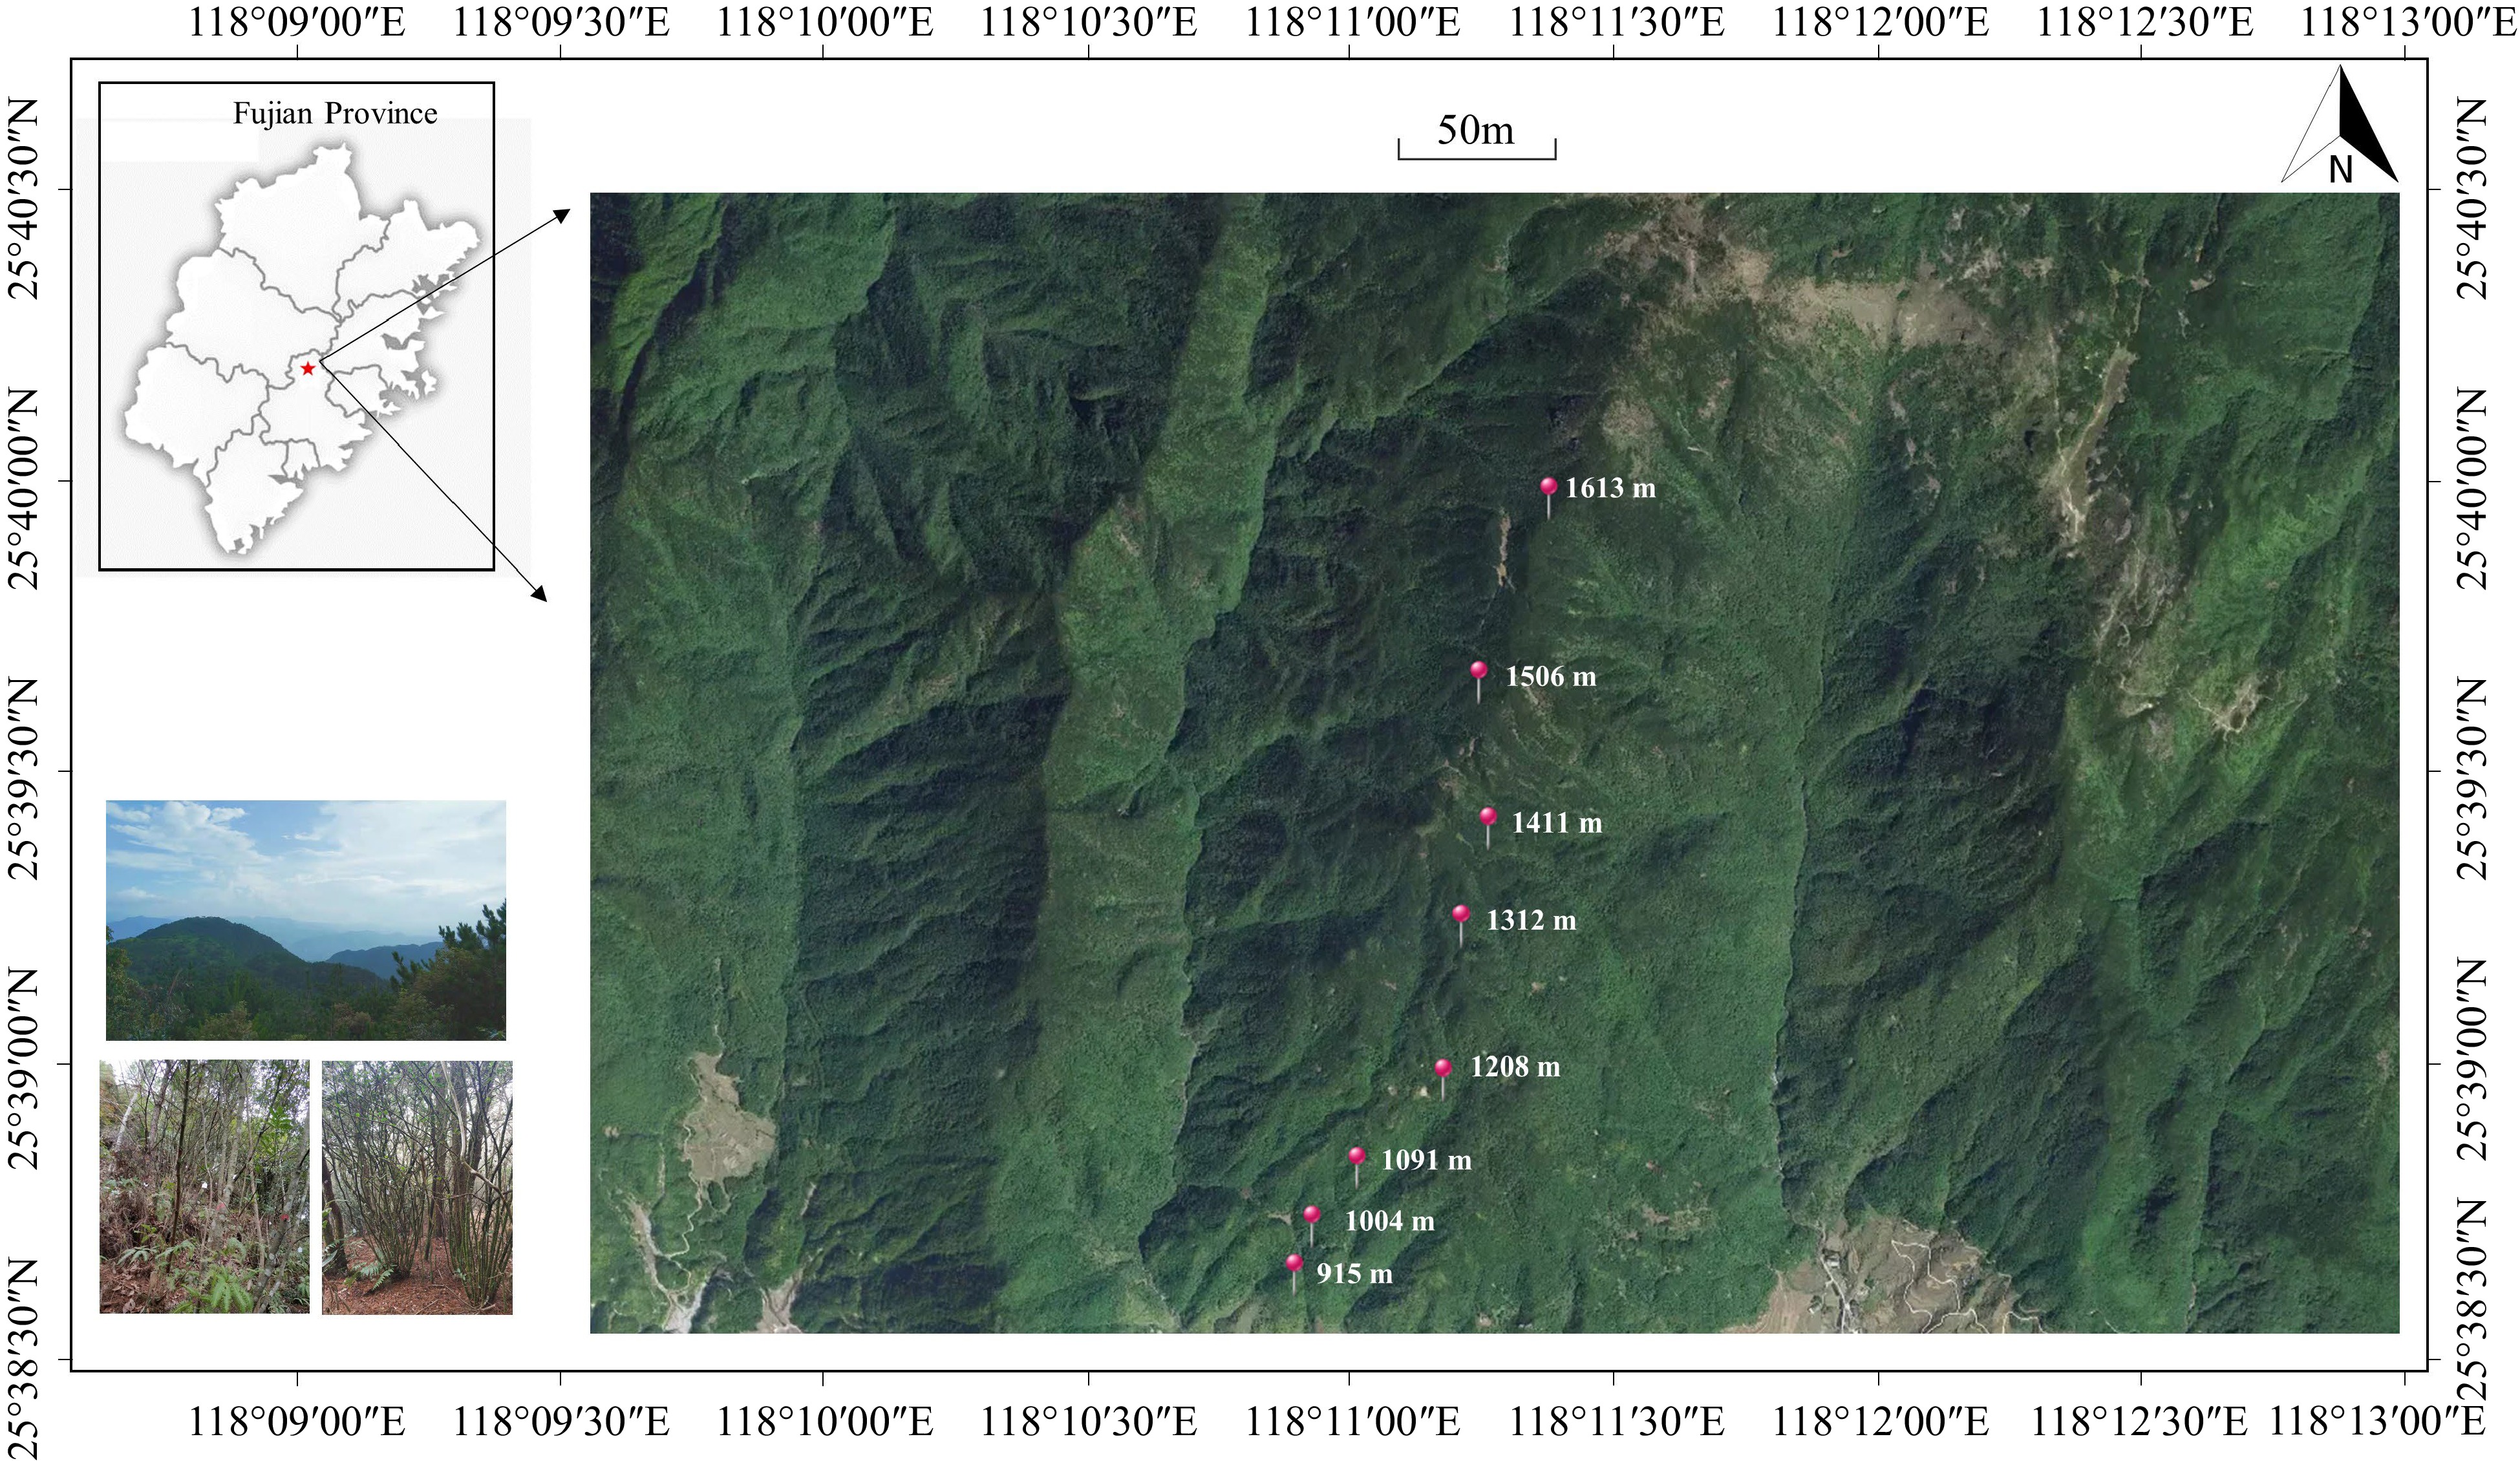
      Figure 1. 

      Distribution of sampling plots along the elevation gradient in Daiyun Mountain.

      Longitude, latitude and elevation are regarded as spatial factors. Environmental factors can be broadly categorized into three groups: topographic factors, climate factors and soil factors. Topographic factors include slope and aspect. Climate factors include soil temperature and air temperature. Soil factors include soil water content, total carbon, total nitrogen, total phosphorus, total potassium, soil pH, hydrolyzed nitrogen and available phosphorus content. For detailed information on environmental factors measured refer to Chen et al.[41].

    • Species composition of each community was characterized by species abundance, richness and importance value. The importance value was evaluated by the sum of species relative abundance, frequency and dominance. The calculation details of importance value are as per the methods of Jiang et al.[42].

    • To investigate the distribution pattern of different types of species along elevational gradients, species were categorized into generalists (species with a widespread distribution range) and specialists (species with a restricted distribution range), based on their abundance and distribution range. The two-habitat approach of CLAM (Classification Method) is well-suited for classifying the generalists and specialists within compared habitats[43]. By using CLAM, species along the elevation gradient in Daiyun Mountain could be classified into four groups: generalists, high-elevation specialists, low-elevation specialists, and rare species. Generalists refers to species distributed at two elevational communities, such as Adinandra millettii, which is abundant at both elevations of 900 m and 1,000 m. Specialists, on the other hand, have a high distribution in one community but little or no distribution in another. Based on the relative elevation of the two communities, high-elevation specialists and low-elevation specialists were distinguished. For example, Castanopsis faberi is distributed at an elevation of 900 m, but not at an elevation of 1,000 m, and therefore, it is considered a low-elevation specialist. Conversely, Symplocos stellaris is mainly distributed at an elevation of 1,000 m, with only one individual found at an elevation of 900 m, indicating it is a high-elevation specialist. Lastly, rare species are species that are too rare to be classified within a specific community. The advantage of this model is that it can increase the number of habitat specialists, which is highly consistent with other methods.

      There are two main influencing parameters. One is the K value, which determines whether the threshold is strict or not. It is recommends to select K = 2/3 for small samples[43]. The other is p value to test whether the classification is significant, which can be 0.05, 0.01, 0.005 or 0.001. Affected by the number of tests, the p value should be adjusted, and p = 0.005 or 0.001 is recommended. To classify species in Daiyun Mountain, we selected a super-majority threshold of K = 2/3 and p = 0.005. Community species classification was analyzed by the CLAM program (http://purl.oclc.org/clam).

      To investigate the difference in species composition with increasing elevation change, a linear regression analysis was conducted. The elevation change was used as the explanatory variable, while the number of species from CLAM served as the response variable.

    • Beta diversity along the elevation gradient in Daiyun Mountain was calculated using Sørensen heterogeneity and Bray-Curtis indices based on presence-absence data and abundance data, respectively. To determine the source of species composition between paired communities, total beta diversity based on presence-absence data (βsor) was partitioned into components of turnover (βsim) and nestedness (βsne)[14]. Similarly, the total beta diversity based on abundance data (dBC) was partitioned into balanced changes in species abundances(dBC-bal) and abundance gradients(dBC-gra)[35]. The data analysis was computed using the betapart package in R 4.0.3[36].

      A regression model was employed to analyze the variation of beta diversity and its partitioning components with increasing elevation change. Both simple linear regression and binomial regression were found to better fit the relationship between elevation change and beta diversity. The goodness of fit of the two models was compared using the 'anova' function. The results indicated that for beta diversity and its partitioning component with presence-absence data, linear regression was the better choice. For beta and turnover with abundance data, binomial models provided a better fit, while linear models were more suitable for nestedness (Supplemental Table S1).

    • Firstly, the horizontal position is determined utilizing PCNM, which quantifies the spatial arrangement of sample units by calculating principal coordinates based on a truncated distance matrix[33]. The PCNM axes with positive eigenvalues were subsequently used as spatial explanatory variables in constraint ordination analysis. Environmental variables considered included air temperature, slope, slope aspect, soil water content, soil temperature, total carbon, total nitrogen, total phosphorus, soil pH, hydrolyzed nitrogen and available phosphorus content. Secondly, forward selection based on 999 permutations was used to identify the spatial and environmental variables with significant influence as explanatory variables. Among these variables, only air temperature (AT) and slope (SLOP) were retained (Supplemental Table S2), while spatial factors were found to have no significant influence (Supplemental Table S3). Before the forward selection, clustering method of Hmisc package was used to evaluate multicollinearity relationship among explanatory variables, and ten explanatory variables were retained (Supplemental Fig. S1). Finally, the logarithm of air temperature and slope were used to analyze the environmental effect on beta diversity and its components using the method of dbRDA. This analysis was conducted by vegan package in R 4.2.3.

    • A total of 5,926 woody plants individuals with the total of 91 species were found along the elevation gradient in Daiyun Mountain. Cyclobalanopsis glauca or Cunninghamia lanceolata was the dominant species at lower elevation (Table 1). The dominant species at the middle elevation were mainly C. lanceolata, Machilus thunbergii, Eurya rubiginosa var. attenuata and Pinus taiwanensis, while the P. taiwanensis was the dominant species at higher elevation.

      Table 1.  Community structure and species composition of wood plant community in Daiyun Mountain.

      PlotsAbundanceSpecies richnessDominant species
      (importance value)
      DYS900 68233Cyclobalanopsis glauca (34.816)
      DYS100050935Cunninghamia lanceolata (34.672)
      DYS110043231C. lanceolata (33.510)
      DYS120033339C. lanceolata (17.609); Machilus thunbergii (14.473)
      DYS130080932Eurya rubiginosa var. attenuata (16.141); Pinus taiwanensis (15.129)
      DYS14001,00731P. taiwanensis (27.780)
      DYS150086425P. taiwanensis (32.591)
      DYS16001,29024P. taiwanensis (31.874)
    • With the increasing elevation change, the number of generalists significantly decreased, while the number of specialists increased gradually (Fig. 2). The number of rare species was consistently highest at each elevation, but this was not significantly correlated with the elevation change.
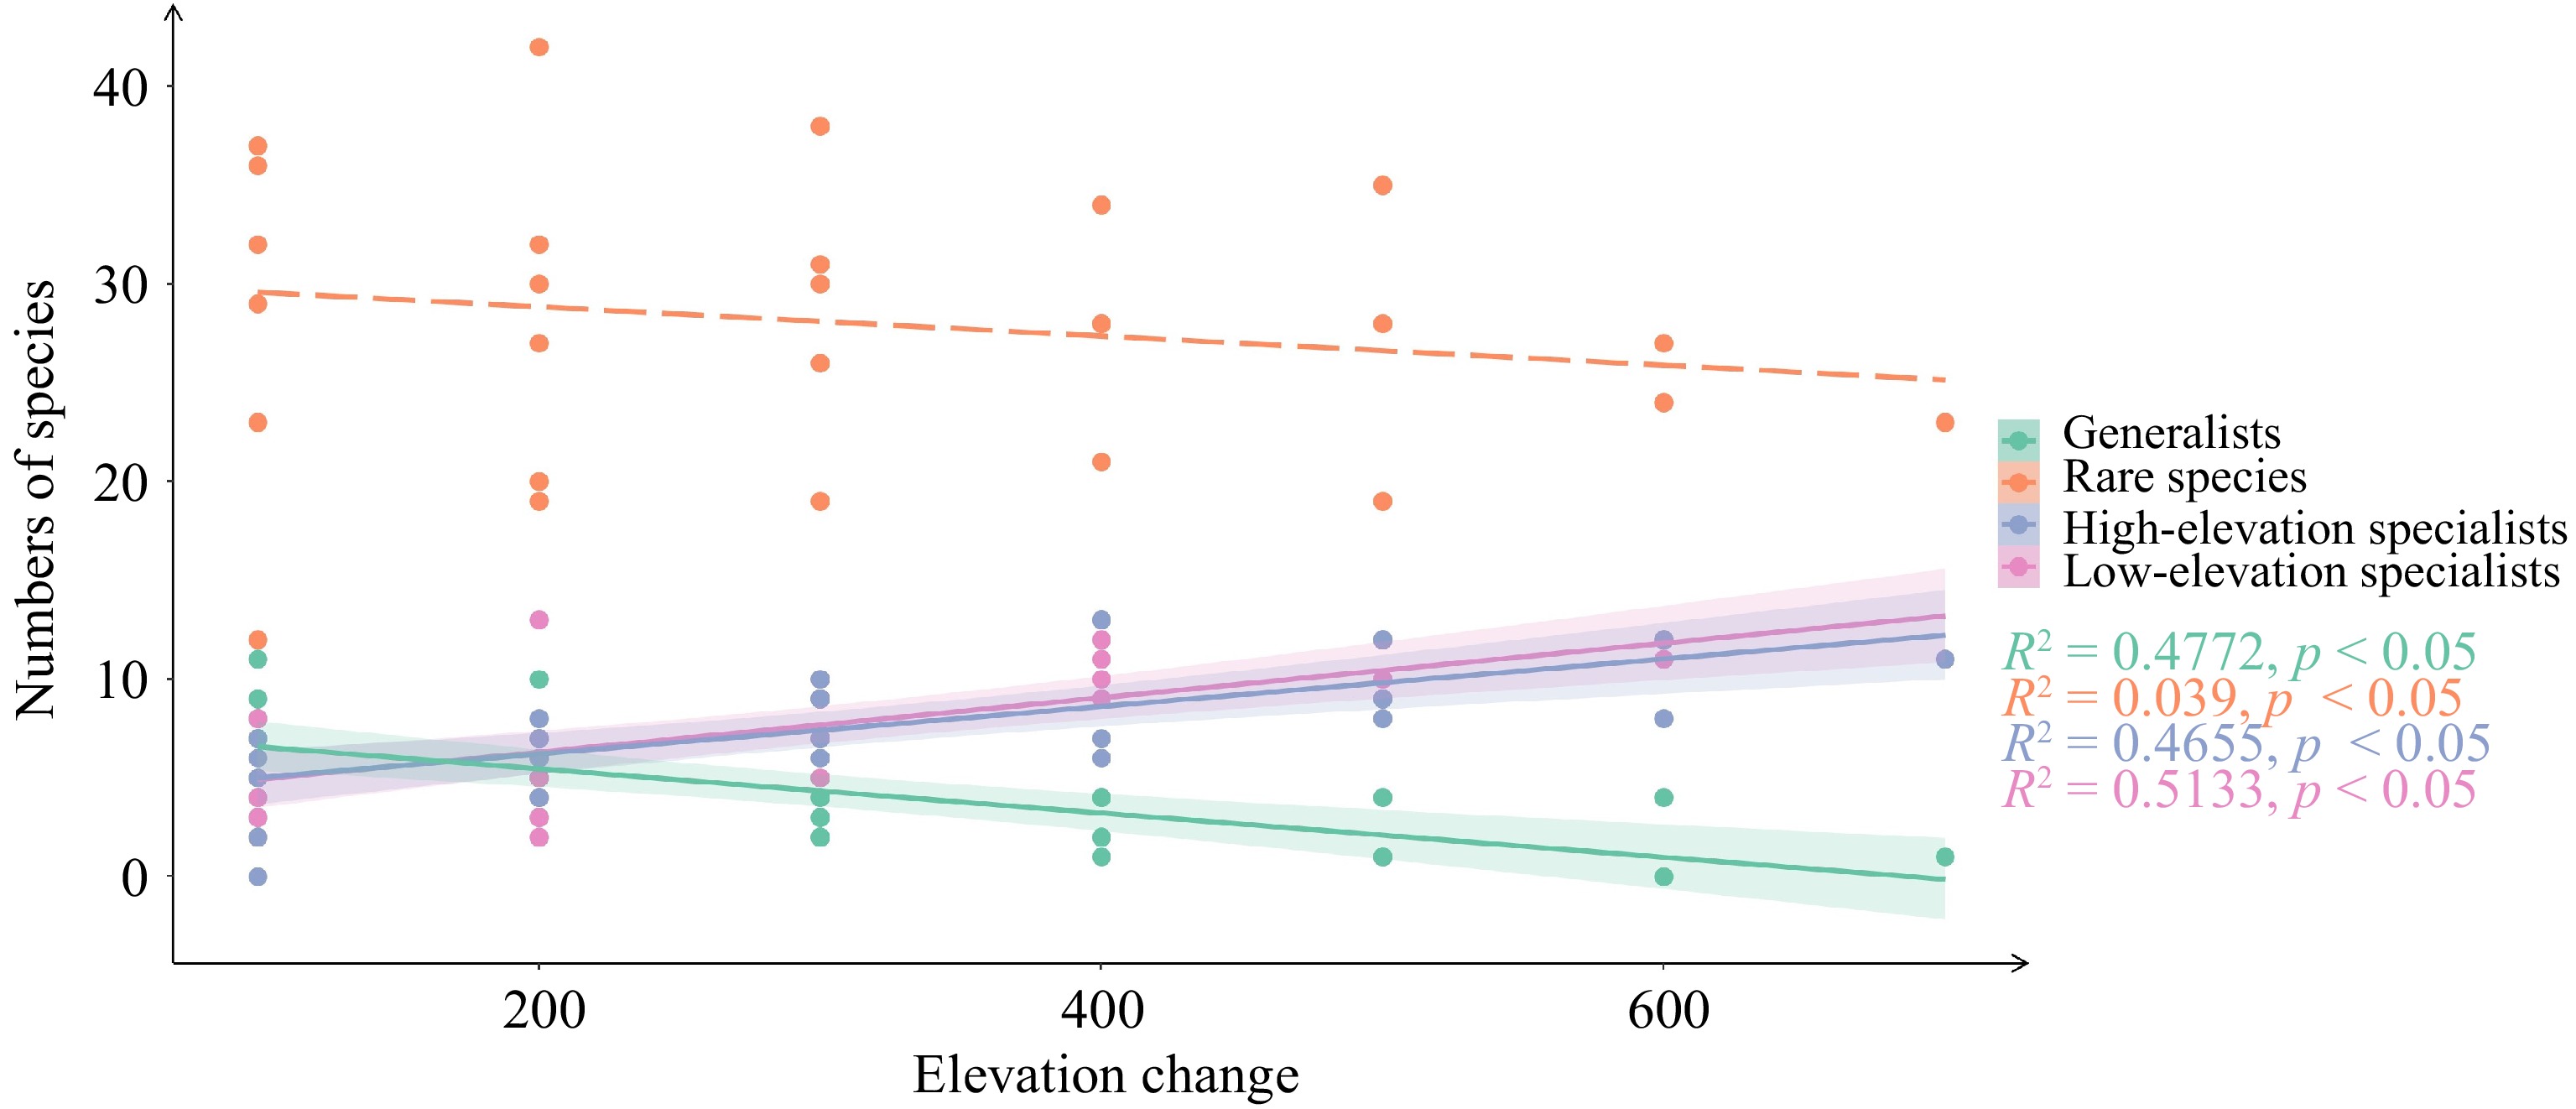
      Figure 2. 

      Community species composition with the increase of elevation changes. The elevation changes refer to the vertical difference in height between two paired elevations.

    • Beta diversity in Daiyun Mountain, as measured using presence-abundance data and abundance data, was found to be 0.564 and 0.754, respectively (Fig. 3). The beta diversity and turnover obtained from abundance data were higher than those obtained from presence-abundance data. Regardless of the type of data used, turnover was identified as the major component to beta diversity.
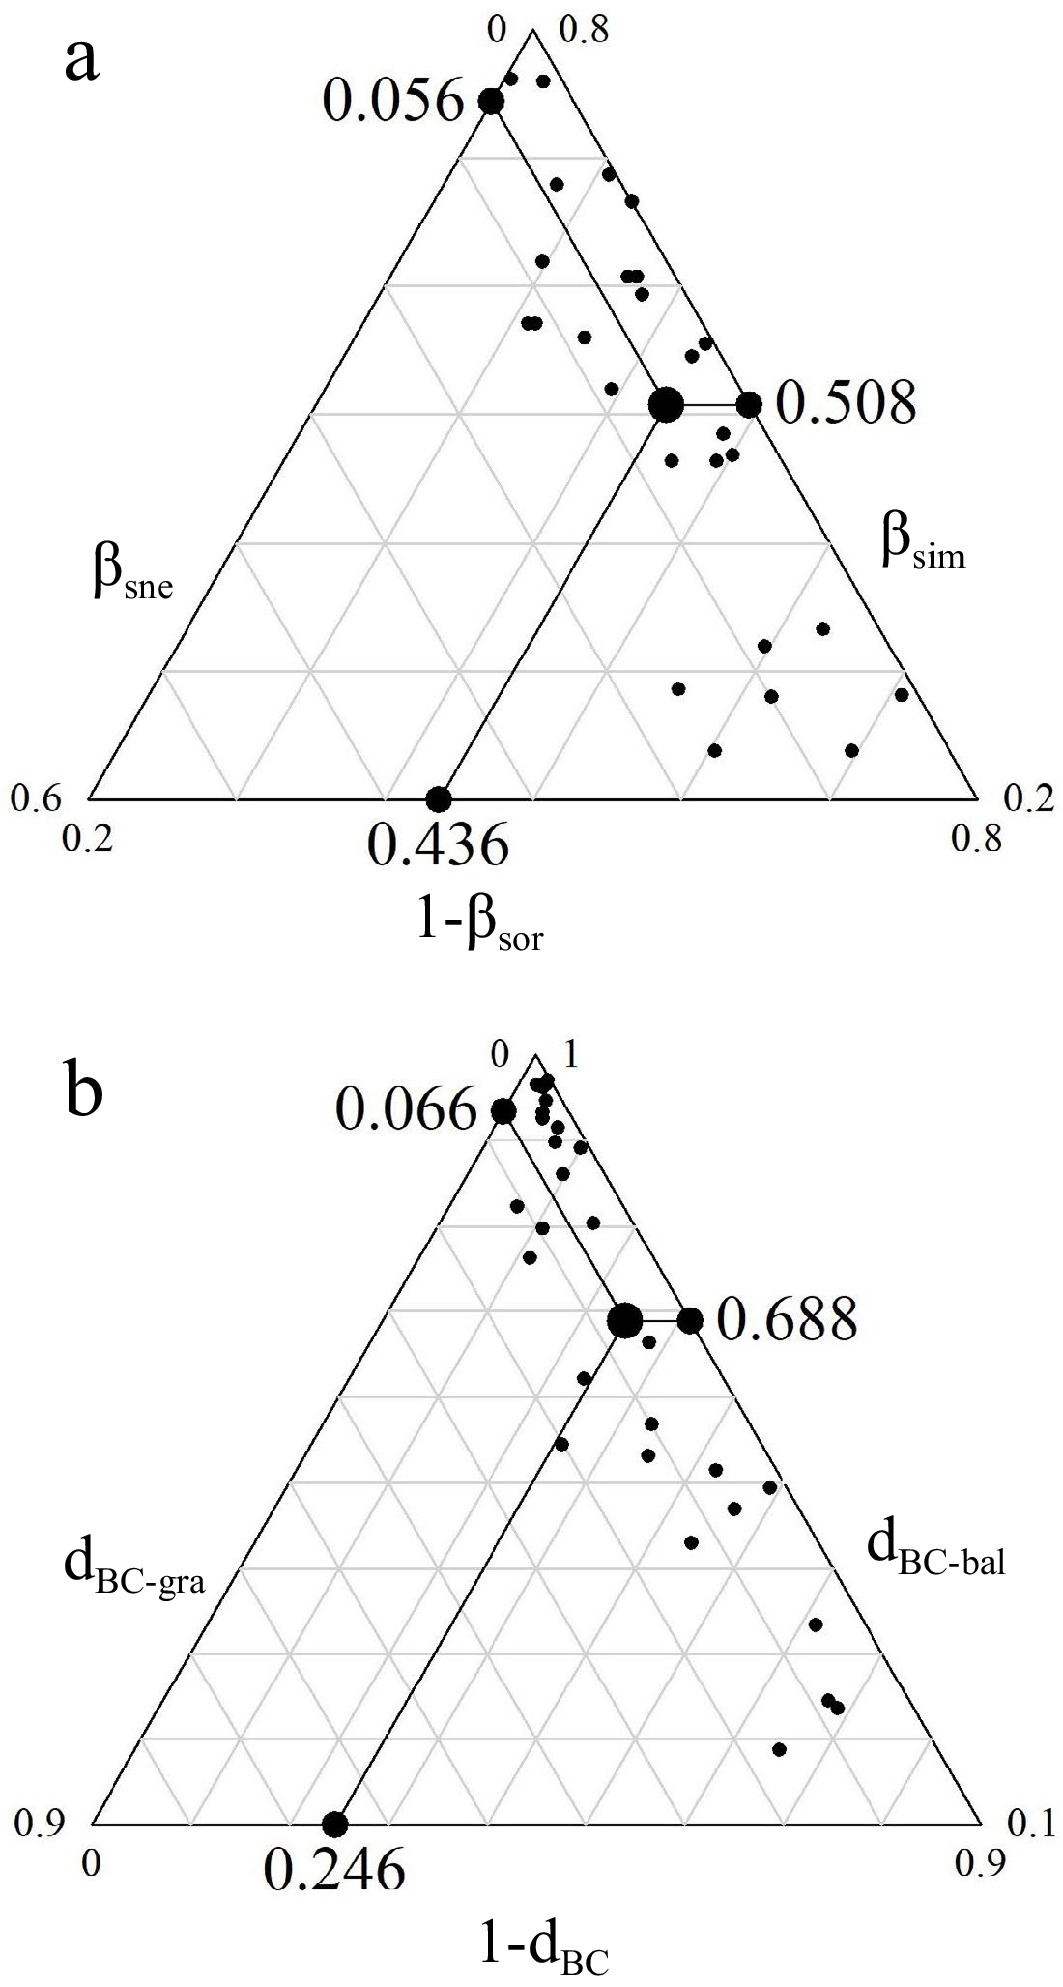
      Figure 3. 

      Community beta diversity and its components in Daiyun Mountain. (a) Displays the beta diversity (βsor), species turnover (βsim), and species nestedness (βsne) using presence-absence data. (b) Presents the Bray-Curtis distance (dBC), balanced variation (dBC-bal), and abundance gradient (dBC-gra) using abundance data.

      Both beta diversity and turnover increased with elevation change, with significantly higher values at higher elevations compared to lower elevations (Fig. 4). However, there were differences in beta diversity and turnover between presence-absence data and abundance data. Beta diversity and turnover, when measured using presence-absence data, increased linearly with elevation change. In contrast, when measured using abundance data, beta diversity and turnover showed a significant quadratic regression as elevation change increased. With respect to nestedness components, as elevation change increased, there was a significant decrease in nestedness based on abundance data. However, there was no significant distribution pattern observed between nestedness based on presence-absence data and increasing elevation change.
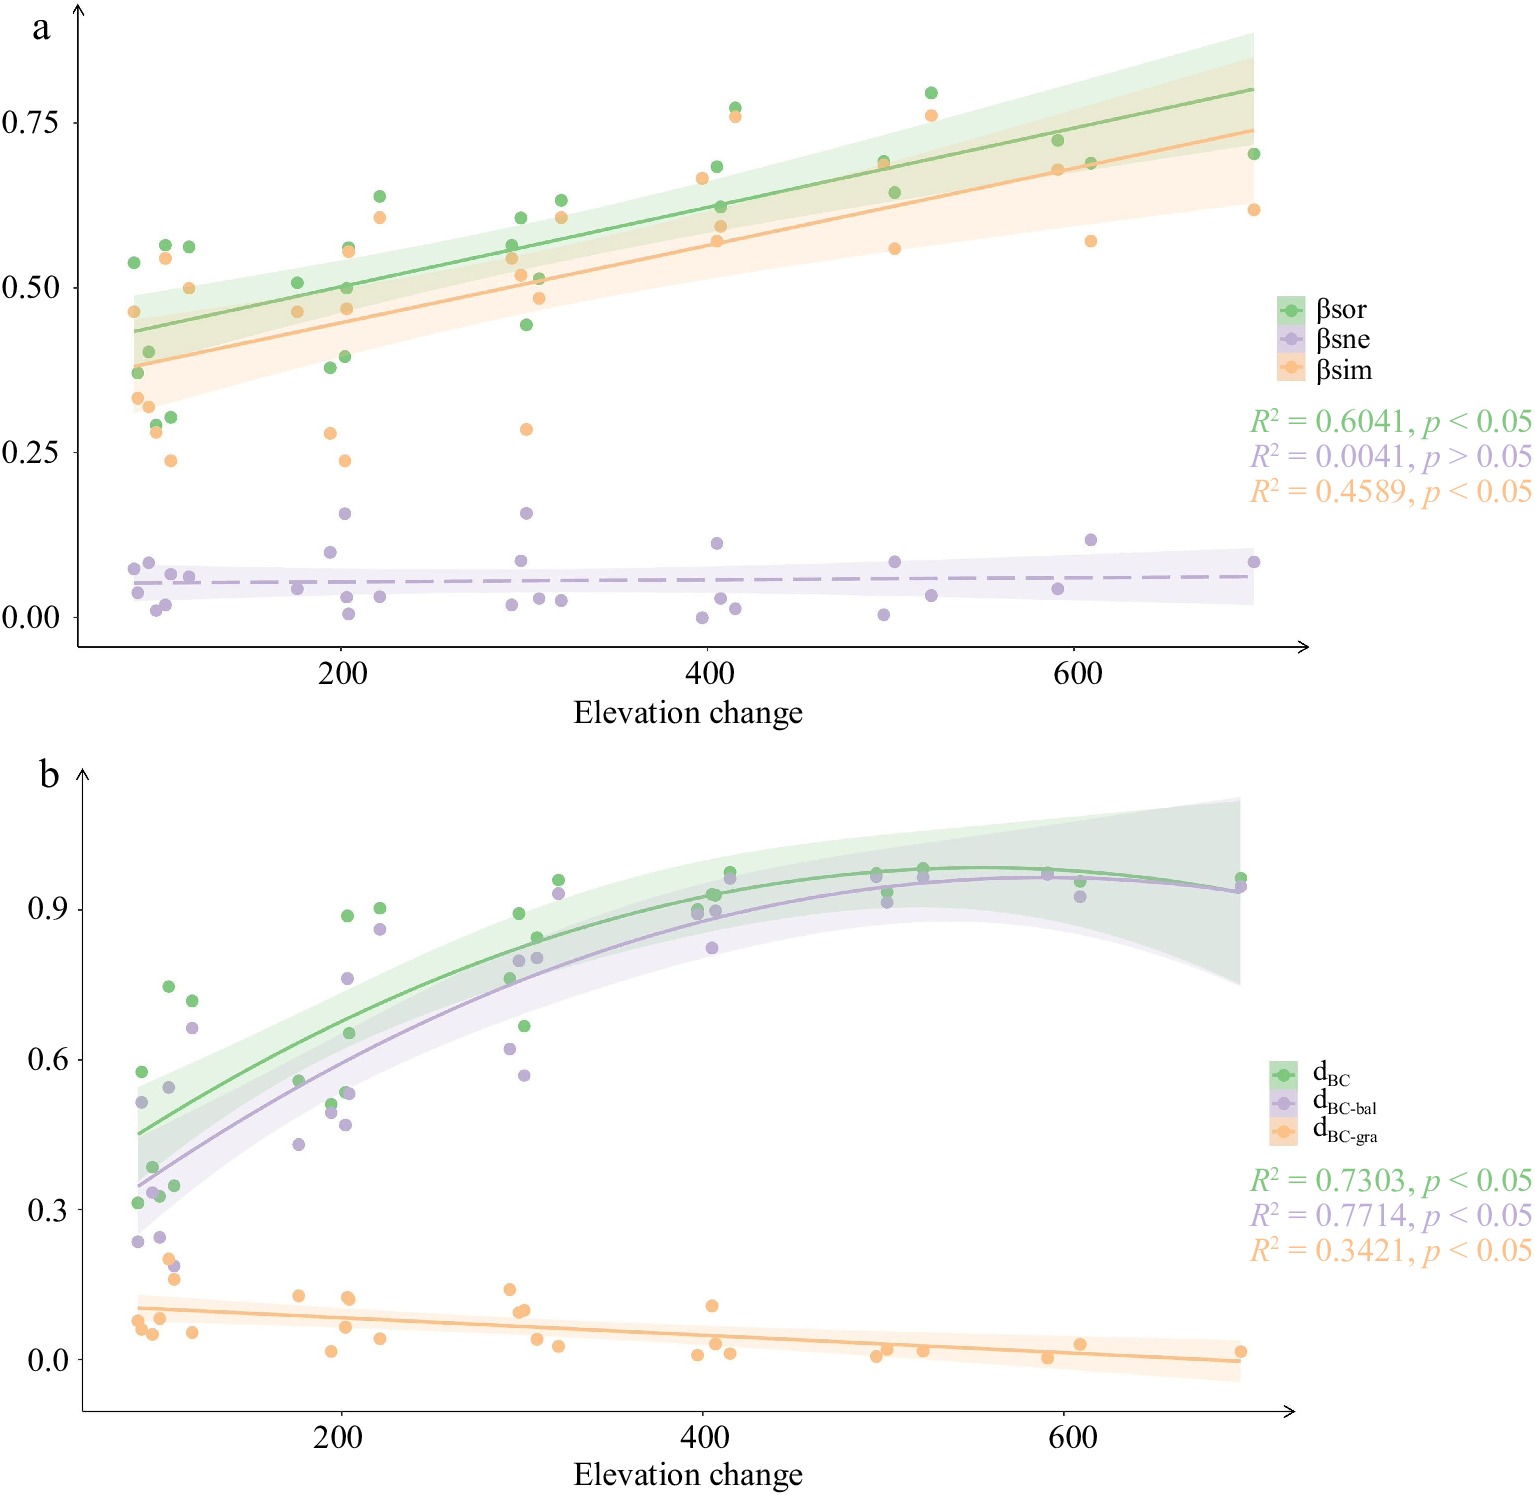
      Figure 4. 

      Community beta diversity and its components changed with the increase of elevation change. (a) Presence-absence data. (b) Abundance data.

    • Spatial variables had no significant effect on species distribution in Daiyun Mountain (Supplemental Table S3). During the forward selection process, only AT and SLOP of environmental variables were retained (Supplemental Table S2). Environmental variables explained 56.0% and 64.7% of the variation in beta diversity (Table 2), as indicated by presence-absence data and abundance data, respectively. Among the environmental variables, air temperature emerged as the most important factor in shaping beta diversity and turnover. When considering the full model including air temperature and slope, the nestedness components did not show any significant effect. However, the independent model that only included slope showed a significant effect on nestedness.

      Table 2.  dbRDA analysis based on presence-absence data and abundance data.

      DatasetResponsible
      variable
      ModelR2p
      Presence-absenceβsor~AT+SLOP0.5600.006
      AT0.9230.002
      SLOP0.6010.097
      βsim~AT+SLOP0.5650.005
      AT0.8830.008
      SLOP0.6570.066
      βsne~AT+SLOP0.1780.950
      AT0.2800.417
      SLOP0.9160.001
      AbundancedBC~AT+SLOP0.6470.002
      AT0.8840.005
      SLOP0.7820.017
      dBC-bal~AT+SLOP0.6690.004
      AT0.8380.010
      SLOP0.6020.106
      dBC-gra~AT+SLOP0.2280.872
      AT0.1430.690
      SLOP0.8600.009
      AT and SLOP are air temperature and slope, respectively.
    • The species composition of woody plants in Daiyun Mountain exhibited significant variation along the elevation gradient, with a noticeable change in dominant species occurring between elevations of 1,200 m and 1,300 m. Below an elevation of 1,200 m, the dominant species was C. lanceolate, whereas above 1,300 m it transformed into P. taiwanensis. This transition zone also marks the upper limit of the coniferous-broadleaf mixed forest, as the vegetation types above 1,300 m transform into coniferous forests dominated by P. taiwanensis. Furthermore, the highest of beta diversity of neighboring elevations was observed at elevations between 1,200−1,300 m (Supplemental Fig. S2), which means that this area had the largest difference of community species composition. It can be inferred that the elevation range of 1,200−1,300 m serves as a transition zone for species distribution along the elevation gradient, where many species meet and replacement, resulting in the peak of species richness. This was supported by the study of Li et al.[39], which found that species diversity showed a unimodal pattern, peaking at an elevation of 1,200 m.

      The composition of generalists and specialists was found to undergo significant changes with elevation change increase. Notably, there was a significant reduction in the number of generalists, whereas the number of specialists experienced a significant increase. These findings suggest that as elevation change increases, community species composition tends to shift towards an increased abundance of specialists and a reduced abundance of generalists. Compared to specialized species, generalized species exhibit a broader ecological tolerance and a wider distribution range[44]. As a result, an increase in the number of generalists results in a greater number of shared species among communities. In contrast, specialists have a narrow ecological tolerance, and the variations in environmental conditions along elevation gradients contribute to the differentiation of specialists and increase the dissimilarity between paired communities[20, 45]. The introduction of specialized species leads to an increase in beta diversity, whereas the introduction of generalized species is associated with a decrease in beta diversity[27].

    • In Daiyun Mountain, the distribution pattern of species beta diversity along the elevational gradient was predominantly composed of species turnover, while nestedness contributed only a small portion. This finding aligns with the beta diversity and its components observed in the majority of previous studies[23, 28, 45]. Both abundance data and presence-absence data revealed a dominant role of turnover component, indicating that variation of species composition between communities in Daiyun Mountain involved both species turnover and abundance changes. The turnover of species between neighboring pairs of communities was influenced by both generalists and specialists, while turnover between distant communities was primarily driven by specialists (Fig. 2). Changes in species abundance also contributed to the shift in species dominance. For instance, the importance value of C. lanceolata gradually declined from an elevation of 1,000 m to 1,200 m, while the importance value of P. taiwanensis gradually increased from an elevation of 1,300 m to 1,600 m. Overall, the changes in species composition along elevation gradient were primarily driven by species turnover and abundance changes.

      The beta diversity and turnover were found to increase with elevation change, which was consistent with previous studies[46, 47]. Environmental factors were found to have a primary influence on the distribution patterns of beta diversity and turnover, explaining 56.0% and 64.7% of the variation based on presence-absence data and abundance data, respectively. These findings suggest that environment filtering dominates community assembly in Daiyun Mountain, with niche processes playing a significant role. With the increase in elevation change, there was a corresponding increase in environmental heterogeneity. This increased heterogeneity leads to environmental filtering, where species are constrained to suitable habitats, resulting in alterations to their range size[19, 48]. Consequently, this process promotes the differentiation of specialized species, leading to heightened species turnover and ultimately enhancing beta diversity[44, 45]. Among the environmental factors considered, air temperature and slope are found to be the most important factors driving changes in beta diversity and turnover. Air temperature plays a crucial role in species distribution due to its impact on the thermal tolerance of organisms[49]. In particular, the harsher climate in higher elevations enhances species' sensitivity to temperature, consequently affecting their elevational distribution[18]. On the other hand, slope, as a topographic factor, primarily influences species distribution by altering topographic and soil nutrient conditions[50]. The combined influence of these climatic and topographic factors drives the distribution of species diversity along the elevation gradient in Daiyun Mountain.

      Spatial variables also play a crucial role in shaping the distribution pattern of beta diversity, particularly in stochastic processes that are dominated by dispersal limitation. Qian [16] demonstrated that spatial distance primarily accounts for the variation in beta diversity, indicating a negative relationship between beta diversity and dispersal ability. In the case of mountains of temperate forest in China, Yu et al. have found that spatial distance has a greater impact than environmental factors in explaining beta diversity[51]. However, spatial factors did not have a significant impact on beta diversity in Daiyun Mountain. This could be attributed to the limited horizontal spatial extent of the sampling plots in Daiyun Mountain, which may not be sufficient to observe the distance-decay effect on beta diversity. On a finer scale, the importance of environmental factors outweighs that of spatial factors[52]. Additionally, the sampling plots in Daiyun Mountain were strategically placed along the ridgelines, leading to a strong spatial connectivity. This allows species to disperse smoothly to suitable habitats, minimizing the influence of spatial factors on turnover and beta diversity of Daiyun Mountain. Consequently, studies focusing on local-scale biodiversity highlight the influence of environmental impacts.

    • Compared to presence-absence data, the use of abundance data resulted in higher values of beta diversity and turnover. Furthermore, a significant linear relationship between nestedness and elevation change was observed, along with a higher model R2 for environmental variables in db-RDA. Presence-absence data are recognized for higher sensitivity to rare species, often leading to an overestimation of beta-diversity[53]. As a result, presence-absence data is not suitable for research conducted in a small area with a higher abundance of rare species[54]. In contrast, abundance data provides a more comprehensive information of community and is more robust in cases of inadequate samplings[55, 56]. Therefore, it is advisable to prioritize the use of abundance data in beta diversity.

    • In terms of conserving species diversity, the difference in species turnover and species nestedness components has implications for conservation measures[57]. When nestedness is dominant, conservation planning should prioritize regions with higher species richness[34, 57]. When communities are primarily characterized by species turnover, multi-regional conservation becomes important[34, 57]. However, the dominant role of turnover is widely recognized, and implementing a multi-regional conservation strategy can complicate conservation efforts significantly. Cordeiro et al. suggested that in cases where beta diversity is mainly determined by turnover, species-poor communities do not simply represent a subset of species-rich communities[23]. Instead, these communities exhibit distinct species compositions across different sites. As a result, when turnover is the primary factor, species-poor sites hold greater conservation value than species-rich sites. Expanding on this perspective, the preservation of biodiversity in Daiyun Mountain should prioritize the high elevation region. Specifically, specialized species plays a key role in species turnover and beta diversity. These species tend to have restricted distributions, smaller populations, and limited phenotypic plasticity, making them less adaptable to environmental changes[58,59]. As a result, specialized species are more vulnerable to extinction in a changed environment[60]. Therefore, conservation of specialized species becomes a primary objective in maintaining biodiversity. In this context, specialized species at high elevation deserve special attention.

    • The plant community in Daiyun Mountain displayed significant variation in turnover and beta diversity. With the increase of elevation change, the environment becomes more heterogeneous, leading to differentiation of specialized species and consequently an increase in species turnover and beta diversity. The variation in turnover and beta diversity is mainly explained by environmental factors, with no significant influence from spatial variables. Specifically, air temperature and slope were identified as the main factors affecting community assembly of woody plants in Daiyun Mountain. This suggested that community assembly in the area was predominantly governed by environmental filtering. To conserve biodiversity in Daiyun Mountain, it is important to focus on specialized species and prioritize the protection of high elevation areas. In future, efforts should be directed towards strengthening the protection of specialized species in these high elevation areas.

    • The authors confirm contribution to the paper as follows: study conception and design: Jiang L, Liu J, He Z; data collection: Jiang L, Zhu J, Wei X, Chen B, Zheng S, He Z; analysis and interpretation of results: Jiang L, Zhang X, He Z; draft manuscript preparation: Jiang L, Zhang X. All authors reviewed the results and approved the final version of the manuscript.

    • The datasets used and/or analyzed during the current study are available from the corresponding author on reasonable request.

      • This research was funded by the National Natural Science Foundation of China (NSFC), grant numbers 31700550 and 31770678; Forestry Technology Research Project of Fujian Province, grant number 2022FKJ11; Forestry Peak Discipline Construction Project of Fujian Agriculture and Forestry University, grant number 72202200205; Special Fund Project for Science and Technology Innovation of Fujian Agriculture and Forestry University, grant number KFb22030XA. We wish to express our thanks for the support received from the Daiyun Mountain Nature Reserve in Dehua City, Fujian Province to allow us to collect samples. The authors would like to thank Dingliang Xing for writing-review, and Xinguang Gu, Cong Xing, Chensi Wei and Xuelin Wang in the field work.

      • The authors declare that they have no conflict of interest.

      • Copyright: © 2023 by the author(s). Published by Maximum Academic Press, Fayetteville, GA. This article is an open access article distributed under Creative Commons Attribution License (CC BY 4.0), visit https://creativecommons.org/licenses/by/4.0/.
    Figure (4)  Table (2) References (60)
  • About this article
    Cite this article
    Jiang L, Zhang X, Zhu J, Wei X, Chen B, et al. 2023. Environmental heterogeneity determines beta diversity and species turnover for woody plants along an elevation gradient in subtropical forests of China. Forestry Research 3:26 doi: 10.48130/FR-2023-0026
    Jiang L, Zhang X, Zhu J, Wei X, Chen B, et al. 2023. Environmental heterogeneity determines beta diversity and species turnover for woody plants along an elevation gradient in subtropical forests of China. Forestry Research 3:26 doi: 10.48130/FR-2023-0026

Catalog

  • About this article

/

DownLoad:  Full-Size Img  PowerPoint
Return
Return