Processing math: 100%
ARTICLE   Open Access    

Overexpression of the Arabidopsis SHN3 transcription factor compromises the rust disease resistance of transgenic switchgrass plants

More Information
  • Switchgrass can generate large amounts of renewable biomass and hence is one of the most promising bioenergy crops. Improving the quality of switchgrass lignocellulosic biomass will enable its utilization for biofuels. Arabidopsis SHINE family of transcription factor SHN2 was previously identified as a master regulator of cell wall deposition in transgenic rice. However, it is unclear if the Arabidopsis SHN genes also have a similar biological function in switchgrass. Here, we generated transgenic switchgrass overexpressing the Arabidopsis SHN3 transcription factor. Compared with the wild-type, AtSHN3-overexpressing switchgrass plants were stunted in their growth. There were no significant differences in terms of lignin and cellulose content between the SHN transgenics and wild-type switchgrass plants. However, two AtSHN3 transgenic lines SHN7-2 and SHN5-2, displayed significant changes in several matrix polysaccharide monomers. Overexpression of AtSHN3 in switchgrass did not alter the stem mechanical strength when subjected to tensile-torsion analysis. Interestingly, the AtSHN3-overexpressing transgenic lines were more susceptible to switchgrass rust (Puccinia emaculata) than wild-type plants. Therefore, AtSHN3 may have a negative role in regulating disease resistance in switchgrass.
  • The merit of science journals has always been judged by peer review, but it is a time-consuming burden on experts. Consequently, the impact factor (IF), as an accessible quantitative method, needs to be explored in the evaluation of journals in the academic community. The IF refers to the citation of a journal, invented in 1955 by the famous bibliometrician Eugene Garfiled, and is defined as the total number of citations received in a particular year to the source items published in a journal in the previous 2 y divided by the number of 'citable' items published during these 2 y[1]. Since then, the IF has come to play a significant role in the assessment of scientific journals due to its convenience, sufficient accuracy and novelty. However, due to the increasing application of IF, a lot of people have recognised several flaws with impact factors, of which includes an inappropriate definition of citable items in the calculating formulas of IF, large gaps of IFs between disciplines, and strong bias in favour of U.S. journals[2], inherent limitations to the SCI database, a too short of a time window for slowly developing research areas[3] among other factors, so, in 1998, Dr. Garfield proposed the concept of cumulative IF (CIF) in order to modify the short-term time window of the 2-y IF[4,5]. On the other hand, the original IF in 1955 sought by Dr. Garfield was an IF specific to a year according to its definition, for example, Nature has an IF of 41.456 in 2014, and the Lancet around 35 in 2006, which was named as the annual IF (AIF). And the IFs calculated by Thomson Scientific (Clarivate Analytics at present) every year belong to the scope of AIFs.

    In fact, many associated studies have been conducted on the AIF and CIF at home and abroad. In his two papers, Dr. Garfield calculated 7-y CIF and 15-y CIF for the top 100 and 101−200 journals in the annual Journal Citation Report of 1995, followed by the comparison of the differences between 7-y/15-y CIF and the 2-y IF of these journals[4,5]. In 2010, Haddow et al.[6] of Curtin University of Technology in Australia proposed to modify the time window of CIF based on the concept of IF. After that, the notion of 'cumulative impact factor', mentioned by a large number of scholars was completely different from Garfield's CIF[711] ; for example, Oelrich et al.[7] made a comparison of the total number of publications and the cumulative impact factor (short for CuIF for distinction) that were determined for the first 15 E.U. member states (E.U.15), the U.S., and the world in 19 international urological journals in the Web of Science (WoS) database, and its CuIF was determined by the sum of the articles published multiplied with the IF of the individual journal and year. In China, Yang & Ye[12] were the first to apply Garfield's CIF for journal evaluation in 2001, followed by Du & Tang[13], who used the calculation of Garfield's CIF to conduct an empirical analysis of the CIF of the physical, chemical, pharmaceutical and surgical journals abstracted in China Scientific and Technical Papers and Citations Database (CSTPCD) of the Institute of Scientific and Technical Information of China. Meanwhile, some attention has been paid to CuIF in several other domestic research [14,15].

    However, the then-current research is limited to the comparisons of CIF with IF, h-index and g-index, thus leading to the changeable ranking of journals. In view of this situation, we decided to perform a comparison analysis of AIF and CIF with peer review scores of U.S. ophthalmological journals between 2007 and 2016. This paper's aims were to: (1) analyze the efficacy of journal evaluation by AIF and CIF, and (2) to compare the CIF with different window times for the assessment of science journals.

    A total of 25 ophthalmologic journals were included in the present study as they met the following the inclusive criteria, including (1) U.S. ophthalmological journals, (2) journals which were indexed in the Clarivate WoS database with citation data during 2007−2016, and (3) journals which had been given to peer review scores by U.S. ophthalmologists via questionnaires, while the exclusive criteria, including (i) journals which were scored by less than 60 U.S. ophthalmologists during questionnaire survey, (ii) journals which were included in the Clarivate WoS database less than 10 y until 2016. The journals which met the above criteria are presented in Table 1. These journals are arranged in alphabetical order.

    Table 1.  The general metric information of the collected journals in this study.
    Journal nameJCR abbreviation2020 JIF5 Year JIF
    American Journal of OphthalmologyAm J Ophthalmol5.2585.729
    CorneaCornea2.6512.774
    Current Opinion in OphthalmologyCurr Opin Ophthalmol3.7613.700
    Cutaneous and Ocular ToxicologyCutan Ocul Toxicol1.8201.619
    Experimental eye ResearchExp Eye Res3.4673.811
    Graefes Archive for Clinical and Experimental OphthalmologyGraef Arch Clin Exp3.1172.970
    Investigative Ophthalmology & Visual ScienceInvest Ophth Vis Sci4.7994.847
    JAMA OphthalmologyJAMA Ophthalmol7.3897.977
    Journal of AAPOSJ AAPOS1.2201.519
    Journal of Cataract and Refractive SurgeryJ Cataract Refr Surg3.3513.595
    Journal of GlaucomaJ Glaucoma2.5032.277
    Journal of Neuro-OphthalmologyJ Neuro-Ophthalmol3.0422.893
    Journal of Ocular Pharmacology and TherapeuticsJ Ocul Pharmacol Th2.6712.397
    Journal of Pediatric Ophthalmology & StrabismusJ Pediat Ophth Strab1.4021.404
    Journal of Refractive SurgeryJ Refract Surg3.5733.885
    Journal of VisionJ Vision2.1542.519
    Molecular VisionMol Vis2.3673.037
    Ocular SurfaceOcul Surf5.03310.030
    Ophthalmic GeneticsOphthalmic Genet1.8031.815
    Ophthalmic Plastic and Reconstructive SurgeryOphthal Plast Recons1.7461.623
    OphthalmologyOphthalmology12.07911.015
    Optometry and Vision ScienceOptometry Vision Sci1.9732.217
    Retina-the Journal of Retinal and Vitreous DiseasesRetina-J Ret Vit Dis4.2564.742
    Survey of OphthalmologySurv Ophthalmol6.0485.703
    Visual NeuroscienceVisual Neurosci3.2412.869
     | Show Table
    DownLoad: CSV

    Peer review is recognized as the golden criterion for testing the true impact of journals which can be directly reflected by the peer review scores obtained through filling in questionnaires by experts[16,17]. Therefore, the self-designed questionnaire, in English, was implemented and issued only to U.S. ophthalmologists and researchers, who were allowed to give the credits to U.S. ophthalmologic journals based on their opinions about these journals' academic impact and quality, considering the fact that scholars in a certain country were not well acquainted with the journals of other countries. In this study, our time was limited so we had to adopt the previous peer review score from the results of the questionnaire survey we conducted in 2016. The procedures of this questionnaire were introduced briefly in the following manner. At first, the e-mail addresses of U.S. ophthalmologic authors (corresponding authors) whose publications were included in WoS-indexed journals were obtained due to the WoS database providing the corresponding author e-mail addresses. Secondly, a questionnaire, in English, was designed (see: www.askform.cn/survey) provided by the supplier of AskForm, and the e-mails were sent to the correspondents by politely informing them of the following information, including (1) a web site, to provide the questionnaire, where the questionnaire can be completed (see: http://app.askform.cn/b8e560ec-16ec-4b35-9267-f895e3915e51.aspx?Type=2), (2) the aim of this survey, which was to achieve the academic impact of U.S. ophthalmologic journals among U.S. ophthalmologic scholars, and (3) the strategies for filling in the questionnaire, which were taken by giving credit to each journal in the questionnaire according to its academic impact or quality in their mind ranging from 1.0 point to 10.0 points, (with 1.0 being the lowest and 10.0 being the highest, fractions with one decimal place were allowed, e.g., 1.1−9.9). Additionally, the journals in the questionnaire were ranked in alphabetical order to keep the questionnaire scoring untouched by the influence of journals' ranking. The 'academic impact' in the questionnaire did not equal the IF or any other indicators, and it solely reflects the journals' academic quality in the field of ophthalmology. Thirdly, the peer review scores were calculated. A total of 7,077 e-mail addresses were harvested, and we received 124 replies, of which the questionnaire in which only three journals or lower were scored, and all journals were given the highest or the lowest credits, as well as the journals that were scored according to the journals' ranking, were excluded. And finally, 112 questionnaires were valid a validity rate of 90.3%. Additionally, the journals that were not scored were recorded as 0 when calculated. The statistics for journal scores given by the ophthalmologic experts were sorted and calculated, and the sum of scores for each journal were recognized as the peer review scores; all the calculations were accurate to 1 decimal place. The survey was conducted between August 4th, 2015 to September 15th, 2015[18].

    The database of WoS was searched for acquiring citations and citable items (the number of Review Article and Articles) to these journals via their ISSNs. After signing in to access WoS, we chose 'WoS Core Collection' on the tab of 'Select a database' and 'Advanced search', and then typed the query equations 'IS = XXXX − XXXX AND PY = 2007−2016', thus harvesting results in the search history table at the bottom of the page. Then, all the citation data needed in this study were available and could be downloaded by creating a citation report. On the other hand, the citable items including Review Article and Articles can be refined and their number sorted by publication year was obtained by using the 'Analyze Results' tool attached to the database. The research date was 27th October, 2018.

    Two calculations were carried out based on the citations in the WoS for each journal: an AIF and a CIF. The calculation of Dr. Garfiled's IF is well known, and, in this present study, the AIFs with a 1-y time window to 10-y time window for a journal was calculated similarly to Garfiled's IF. For example, AIFs were calculated for all journals using the following equation of the form:

    n-yearAIF=Numberofcitationsreceivedin2017tojournalsourceitemspublishedfrom(2017n)to2016Numberofcitableitemspublishedinjournalfrom(2017n)to2016

    In the equation, n = 1, 2, 3, 4, 5, 6, 7, 8, 9, 10. According to the equations, 1-y AIF to 10-y AIF can be achieved.

    While as for CIFs, we adopted the calculation of Haddow's extended impact factor[6] for a journal in a particular year. The CIFs for all journals were calculated using the equation as follows:

    n-yearCIF=Numberofcitationsreceivedfrom(2017n)to2017tojournalsourceitemspublishedfrom(2017n)to2016Numberofcitableitemspublishedinjournalfrom(2017n)to2016

    In the equation, n = 1, 2, 3, 4, 5, 6, 7, 8, 9, 10. Therefore, 1-y CIF to 10-y CIF can be computed according to the above equation.

    Statistical analysis was performed with SPSS19.0 for Windows (SPSS Inc, USA). A Shapiro-Wilk test was used to assess the normality of the distribution of AIFs and CIFs of each journal. The correlation of peer review scores with AIFs and CIFs was performed using Spearman rank correlation. A P value of < 0.05 was considered statistically significant.

    The AIFs of a total of 25 U.S. ophthalmologic journals were calculated based on the source data from the WoS database, and their AIFs with different time windows presented in Table 2. As shown in Table 2, we could see that the ranking of these journals by peer review was different from that obtain by sorting by the AIFs, and even differently ranked within AIFs at different time windows, the AIFs were greatly different with 1-y to 10-y time windows. Furthermore, the AIFs produced an interesting alteration in the journals that they initially increased and then decreased with a change in trend, and there were six journals reaching the maximum at the 4-y AIF. On the other hand, a Spearman rank correlation was conducted between the peer review scores and the AIFs, and the results presented in Table 3. The correlation results showed that the AIFs were positively correlated with peer review scores in the U.S. ophthalmologic journals (r > 0.664, all P = 0.000), and the 2-y AIF had the highest correlation with peer review score (r = 0.691, P = 0.000).

    Table 2.  List of U.S. ophthalmologic journals with peer review score and AIFs by time window.
    Journal titlesaPeer review score1-year AIFb2-year AIFb3-year AIFb4-year AIFb5-year AIFb6-year AIFb7-year AIFb8-year AIFb9-year AIFb10-year AIFb
    Invest Ophth Vis Sci825.42.8573.2893.5383.6583.6703.7653.7363.6663.6253.580
    Am J Ophthalmol740.74.2694.7734.7214.6494.6674.5834.4894.5094.4804.268
    Ophthalmology723.06.6557.2737.9387.6697.5967.4847.2547.0016.8176.608
    JAMA Ophthalmol/Arch Ophthalmology636.25.4746.4315.9465.7055.5365.2935.0004.9274.7054.510
    Exp Eye Res517.02.6263.0853.3063.3843.2963.2473.2083.1653.0743.007
    Surv Ophthalmol476.63.3223.6643.6204.1814.4484.4054.3794.3884.2594.317
    Graef Arch Clin Exp456.31.9642.1882.2652.2542.2362.1982.1512.1392.0922.027
    Cornea431.41.9272.4462.4352.4122.4422.3732.2952.2322.1872.154
    Retina-J Ret Vit Dis421.32.3543.7993.5593.4913.3813.3443.2423.1123.0362.942
    Curr Opin Ophthalmol418.21.7682.5872.8042.9322.9182.8972.8962.8402.7802.732
    J Cataract Refr Surg410.22.0932.7302.9683.1193.0993.1353.0182.9762.8802.770
    J Glaucoma350.81.5051.6731.7371.7501.8741.8811.8461.8511.8881.853
    Mol Vis350.81.8262.1362.2492.3272.3162.3082.2842.2572.2142.145
    J Neuro-Ophthalmol325.51.5972.0301.9852.1452.2182.1732.0641.9891.9391.921
    J Vision316.51.3531.7382.0102.1232.1192.2462.2832.4012.4312.461
    Visual Neurosci292.41.2351.7321.8111.9902.0082.0402.0052.0081.8051.734
    J AAPOS275.60.6200.9230.9831.0361.1231.1031.11.0981.1161.098
    J Pediat Ophth Strab266.00.5630.8090.8760.9260.8900.8450.7950.7630.7500.766
    Optometry Vision Sci251.61.1281.4761.6111.7811.8581.8231.8691.8541.8451.864
    J Ocul Pharmacol Th248.51.8001.8931.9642.0411.9611.8751.8431.8201.7651.704
    J Refract Surg237.42.3742.6933.3573.2953.3763.2093.0822.9912.8372.650
    Ophthal Plast Recons210.70.8111.1181.1411.1031.0951.0791.0521.0281.0090.981
    Ocul Surf194.85.0735.5005.7735.7735.7135.6225.585.6165.4577.389
    Ophthalmic Genet190.91.1271.3101.3521.2981.3161.2821.2181.2511.2251.169
    Cutan Ocul Toxicol137.50.7230.7460.9950.9420.9230.9050.8980.9110.8950.901
    Meidan350.81.8262.1882.2652.3272.3162.3082.2842.2572.2142.154
    a Journals indicated by their abbreviations were arranged according to the alphabetical order as in Table 2
    b AIF: annual impact factor
     | Show Table
    DownLoad: CSV
    Table 3.  Spearman rank correlation between peer review scores and the AIFs.
    Parameter1-year AIFc2-year AIFc3-year AIFc4-year AIFc5-year AIFc6-year AIFc7-year AIFc8-year AIFc9-year AIFc10-year AIFc
    Peer review score0.669a0.691a0.665a0.667a0.666a0.677a0.673a0.664a0.679a0.667a
    0.000b0.000b0.000b0.000b0.000b0.000b0.000b0.000b0.000b0.000b
    1-year AIFc0.976a0.978a0.977a0.973a0.965a0.958a0.948a0.952a0.942a
    0.000b0.000b0.000b0.000b0.000b0.000b0.000b0.000b0.000b
    2-year AIFc0.992a0.993a0.990a0.985a0.981a0.968a0.970a0.967a
    0.000b0.000b0.000b0.000b0.000b0.000b0.000b0.000b
    3-year AIFc0.995a0.994a0.991a0.988a0.979a0.978a0.974a
    0.000b0.000b0.000b0.000b0.000b0.000b0.000b
    4-year AIFc0.997a0.993a0.992a0.983a0.982a0.980a
    0.000b0.000b0.000b0.000b0.000b0.000b
    5-year AIFc0.996a0.994a0.985a0.982a0.978a
    0.000b0.000b0.000b0.000b0.000b
    6-year AIFc0.998a0.993a0.992a0.988a
    0.000b0.000b0.000b0.000b
    7-year AIFc0.995a0.992a0.991a
    0.000b0.000b0.000b
    8-year AIFc0.994a0.991a
    0.000b0.000b
    9-year AIFc0.996a
    0.000b
    a correlation coefficient (r)
    b P value
    c AIF: annual impact factor
     | Show Table
    DownLoad: CSV

    The CIFs of these 25 journals were calculated based on the equations described above and shown in Table 4. According to Table 4, we could make conclusions: (1) the CIFs were larger than the AIFs at the same time window, and this is because, at the condition of the same denominator in the both kinds of equations of AIF and CIF, the numerator in the calculation of AIF was the number of citations received in 2017, which was obviously less than that in the equation of CIFs, (2) with the lag in the time window becoming larger, the CIFs of all selected journals increased gradually. The relation between peer review scores and CIFs among the U.S. ophthalmologic journals was analyzed by Spearman rank correlation in Table 5. As shown in Table 5, we could see that the CIFs, ranging from 1-y CIF to 10-y CIF, were positively correlated with peer review scores of the U.S. ophthalmologic journals, and the 7-y CIF had the highest correlation with peer review score (r = 0.706, P = 0.000).

    Table 4.  List of U.S. ophthalmologic journals with peer review score and CIF by time window.
    Journal titlesaPeer review score1-year CIFb2-year CIFb3-year CIFb4-year CIFb5-year CIFb6-year CIFb7-year CIFb8-year CIFb9-year CIFb10-year CIFb
    Invest Ophth Vis Sci825.43.3705.3157.5029.74811.85214.54716.17217.50518.94720.420
    Am J Ophthalmol740.75.4108.30710.52712.50014.71816.42418.17321.22223.92025.823
    Ophthalmology723.08.39612.22117.52420.73924.55627.84329.98932.37734.88136.988
    JAMA Ophthalmol/Arch Ophthalmology636.27.34211.26013.06014.83717.14219.38420.90123.53025.15026.818
    Exp Eye Res517.03.5465.1216.9648.6889.72110.99312.72914.79215.73617.067
    Surv Ophthalmol476.64.5256.0827.39210.39813.24214.51216.41218.91321.16523.918
    Graef Arch Clin Exp456.32.6343.6754.8736.1297.0328.0678.93210.06711.23512.139
    Cornea431.42.3853.7974.6605.9397.1588.1558.8989.76110.81812.008
    Retina-J Ret Vit Dis421.32.9976.3517.4698.98210.43012.28513.42914.29715.58016.523
    Curr Opin Ophthalmol418.22.1594.2636.1278.1149.54911.25612.72414.08415.37217.066
    J Cataract Refr Surg410.22.3444.4286.2048.2389.80411.79313.06114.76216.30517.690
    J Glaucoma350.81.9522.7063.5784.4315.5836.2756.9628.0779.45210.431
    Mol Vis350.82.1823.1784.5546.5278.1439.81211.13712.29913.63714.495
    J Neuro-Ophthalmol325.52.1643.6444.3475.9576.9908.0418.3788.8449.1879.760
    J Vision316.51.7362.9824.2325.4076.1367.6569.28411.44312.68113.574
    Visual Neurosci292.41.4122.3904.6765.7486.8798.2038.67410.65811.39912.212
    J AAPOS275.60.7911.5322.1442.8623.6684.2634.8995.5786.3366.809
    J Pediat Ophth Strab266.00.6461.3301.8532.5052.8983.0363.3513.5853.9394.400
    Optometry Vision Sci251.61.6892.5893.5004.6045.7266.4087.3398.3569.17910.147
    J Ocul Pharmacol Th248.52.0242.8433.9005.3766.0146.6547.4568.2918.7069.228
    J Refract Surg237.42.8094.4747.5599.09311.21812.41013.16414.71015.78916.340
    Ophthal Plast Recons210.71.1262.0122.5043.0303.6704.1884.4534.8465.2605.670
    Ocul Surf194.86.3178.13610.23911.98213.51214.60816.13418.08718.78028.918
    Ophthalmic Genet190.91.3522.1712.6363.0483.7714.2824.7235.2455.9616.333
    Cutan Ocul Toxicol137.51.0001.2912.4612.8413.2553.5623.9844.2844.5054.828
    Median350.82.1823.6754.6766.1297.1588.2039.28411.44312.68113.574
    a Journals indicated by their abbreviations were arranged according to the alphabetical order as in Table 4.
    b CIF: cumulative impact factor
     | Show Table
    DownLoad: CSV
    Table 5.  Spearman rank correlation between peer review score and the CIF.
    Parameters1-year CIFc2-year CIFc3-year CIFc4-year CIFc5-year CIFc6-year CIFc7-year CIFc8-year CIFc9-year CIFc10-year CIFc
    Peer review score0.688a0.703a0.646a0.671a0.670a0.659a0.706a0.694a0.700a0.671a
    0.000b0.000b0.000b0.000b0.000b0.000b0.000b0.000b0.000b0.000b
    1-year CIFc0.976a0.947a0.964a0.961a0.932a0.936a0.925a0.913a0.907a
    0.000b0.000b0.000b0.000b0.000b0.000b0.000b0.000b0.000b
    2-year CIFc0.964a0.978a0.978a0.958a0.966a0.948a0.940a0.935a
    0.000b0.000b0.000b0.000b0.000b0.000b0.000b0.000b
    3-year CIFc0.984a0.983a0.984a0.967a0.958a0.957a0.944a
    0.000b0.000b0.000b0.000b0.000b0.000b0.000b
    4-year CIFc0.997a0.989a0.984a0.977a0.969a0.958a
    0.000b0.000b0.000b0.000b0.000b0.000b
    5-year CIFc0.993a0.985a0.976a0.972a0.960a
    0.000b0.000b0.000b0.000b0.000b
    6-year CIFc0.984a0.978a0.976a0.966a
    0.000b0.000b0.000b0.000b
    7-year CIFc0.988a0.987a0.972a
    0.000b0.000b0.000b
    8-year CIFc0.992a0.986a
    0.000b0.000b
    9-year CIFc0.986a
    0.000b
    a correlation coefficient (r)
    b P value
    cCIF: cumulative impact factor
     | Show Table
    DownLoad: CSV

    To validate the research performance parameters, AIF and CIF, we took the peer review score as the 'golden criteria' for journal evaluation, and made a Spearman rank correlation to analyze the coefficient of correlation of peer review score with AIF and CIF, respectively, and we found that (1) either AIF or CIF was highly correlated with the peer review score, with the correlation coefficient above 0.646, (2) except for 3-y CIF and 6-y CIF, all CIFs with peer review score had the larger correlation coefficient than AIFs with peer review score at the same time window, and (3) the closer the time window, the higher correlation the CIFs had. However, one confusing point of the results was that there wasn't any regular changeable pattern in the correlation of peer review score with AIF and CIF in the present study.

    As described above, the CIFs increased as the time window went by, which depended on the calculation equation. And CIFs, only ranging from 1-y time window to 10-y time window were computed due to the limitation of the citation data of the 25 journals available in the WoS database. To investigate whether the CIF grew persistently or not, we conducted the calculations of CIF with longer time windows of four journals, including Ophthalmology, Surv Ophthalmol, Retina-J Ret Vit Dis, Am J Ophthalmol, which have been indexed in the WoS database for a longer time period, and the results are shown in Table 6, which indicated that the CIFs of the four journals did not grow persistently. We could see that the CIF of Am J Ophthalmol began to decrease at the 36-y time window, followed by a drop from 36.084 at the 38-y time window to 29.715 at the 72-y time window, while CIF of Surv Ophthalmol dwindling from 47.313 at the 36-y time window to 46.356 at the 40-y time window and CIF of Ophthalmology from 47.877 at the 36-y time window to 46.890 at the 39-y time window, respectively. Moreover, Retina-J Ret Vit Dis also presented a decline in CIFs at different time windows.

    Table 6.  CIFs of four journals with longer time windows.
    CIFaAm J OphthalmolSurv OphthalmolOphthalmologyRetina-J
    Ret Vit Dis
    11-year CIF26.81726.19838.53917.949
    12-year CIF27.80328.46539.74918.170
    13-year CIF28.54930.92540.97818.195
    14-year CIF29.40333.78942.22718.308
    15-year CIF29.98535.17742.95918.225
    16-year CIF30.35037.17443.89318.209
    17-year CIF30.87640.30944.55318.260
    18-year CIF31.11041.43445.32718.212
    19-year CIF31.41443.61846.09818.162
    20-year CIF31.58643.42446.29718.074
    30-year CIF35.23247.62448.32618.658
    31-year CIF35.43147.56248.15318.627
    32-year CIF35.51947.33248.10818.645
    33-year CIF35.71647.79848.25918.670
    34-year CIF35.96547.47048.16418.648
    35-year CIF36.30847.49548.22518.693
    36-year CIF36.20247.31347.877N/A
    37-year CIF36.23346.84547.702N/A
    38-year CIF36.08446.71847.111N/A
    39-year CIF36.05646.49346.890N/A
    40-year CIF35.92646.356N/AN/A
    50-year CIF34.289N/AN/AN/A
    60-year CIF31.479N/AN/AN/A
    61-year CIF31.289N/AN/AN/A
    62-year CIF31.126N/AN/AN/A
    70-year CIF29.942N/AN/AN/A
    71-year CIF29.818N/AN/AN/A
    72-year CIF29.715N/AN/AN/A
    a CIF: cumulative impact factor
     | Show Table
    DownLoad: CSV

    As presented in this study, the results showed although both AIFs and CIFs were positively correlated with the peer review score, the correlation coefficient of CIFs with peer review score overweighed that of AIFs with peer review score at the same time window excluding 3-y CIF and 6-y CIF. There are two possible explanations for this consequence. On the one hand, annual parameters, including 1-y AIF to 10-y AIF, solely involve the number of citations received in a particular year, such as the raw citation counts in 2017, resulting in the omission of a large number of citations in the previous years after the source items were published, which contributes considerably to the impact and scientific quality of journals, especially for journals in less highly active and rapidly developing research fields. On the other hand, the indicators of CIFs relate to all citations accumulating from the year when the source items were published to a particular year, which contributes to the merits of AIFs and the total citations for journal assessment. This consequence suggests that the accumulative total citation should be considered in journal evaluation.

    From the correlation analysis, the 7-y CIF had the highest correlation with peer review score (r = 0.706, P = 0.000), so CIF at the 7-y time window was the optimum parameter with regards to U.S. ophthalmologic journal evaluation in this research. However, the citation rate varied in different research fields, thus leading to the variable optimum time window[19,20], of which the evidence can be studied further.

    Testing the long-term impact of citation is one of the research objectives of this paper, so, in order to investigate whether the CIF grew persistently or not, we conducted the calculations of CIF with longer time windows of four journals, which have been indexed in the WoS database for a longer time period. The results showed that the CIFs of the four journals did not grow persistently as time went by. This phenomenon maybe due to the aging pattern, including rate of maturation and rate of decline in terms of citations, tending to be specific for individual journals, even in the same subject field[21]. On the other hand, the CIFs were increasing continually until the 36-y time window in Am J Ophthalmol, whereas this occurred by the 15-y time window in Retina-J Ret Vit Dis. Why did this happen, and was it related to the high impact and quality of the journals or the cited half-life of journals? These hypotheses deserve further investigation.

    In conclusion, the intention of the study is to weigh up the AIFs and CIFs of U.S. ophthalmologic journals using bibliometric methods, and this consequence results in the focus of the scholar's attention that should not only be given to the citation counts made in a particular year but the accumulative collection of citations received after the source items are published. More importantly, these results may be only appear in the U.S. ophthalmologic journals, and may be not consistent with journals in other fields.

  • The authors declare that they have no conflict of interest.

  • [1]

    Sanderson MA, Adler PR. 2008. Perennial forages as second generation bioenergy crops. International journal of molecular sciences 9:768−88

    doi: 10.3390/ijms9050768

    CrossRef   Google Scholar

    [2]

    Perlack RD, Wright LL, Turhollow AF, Graham RL, Stokes BJ, et al. 2005. Biomass as feedstock for a bioenergy and bioproducts industry: the technical feasibility of a billion-ton annual supply. Technical Report. ORNL/TM-2005/66, Oak Ridge National Laboratory, Oak Ridge, Tennessee. www.osti.gov/biblio/1216415

    [3]

    Naik SN, Goud VV, Rout PK, Dalai AK. 2010. Production of first and second generation biofuels: a comprehensive review. Renewable and Sustainable Energy Reviews 14:578−97

    doi: 10.1016/j.rser.2009.10.003

    CrossRef   Google Scholar

    [4]

    Jørgensen H, Kristensen JB, Felby C. 2007. Enzymatic conversion of lignocellulose into fermentable sugars: challenges and opportunities. Biofuels, Bioproducts and Biorefining 1:119−34

    doi: 10.1002/bbb.4

    CrossRef   Google Scholar

    [5]

    Sun Y, Cheng J. 2002. Hydrolysis of lignocellulosic materials for ethanol production: a review. Bioresource Technology 83:1−11

    doi: 10.1016/S0960-8524(01)00212-7

    CrossRef   Google Scholar

    [6]

    Lovell JT, MacQueen AH, Mamidi S, Bonnette J, Jenkins J, et al. 2021. Genomic mechanisms of climate adaptation in polyploid bioenergy switchgrass. Nature 590:438−44

    doi: 10.1038/s41586-020-03127-1

    CrossRef   Google Scholar

    [7]

    Porter CL Jr. 1966. An analysis of variation between upland and lowland switchgrass, Panicum virgatum L., in central Oklahoma. Ecology 47:980−92

    doi: 10.2307/1935646

    CrossRef   Google Scholar

    [8]

    Wullschleger SD, Davis EB, Borsuk ME, Gunderson CA, Lynd LR. 2010. Biomass production in switchgrass across the United States: database description and determinants of yield. Agronomy Journal 102:1158−68

    doi: 10.2134/agronj2010.0087

    CrossRef   Google Scholar

    [9]

    McLaughlin SB, Adams Kszos L. 2005. Development of switchgrass (Panicum virgatum) as a bioenergy feedstock in the United States. Biomass and Bioenergy 28:515−35

    doi: 10.1016/j.biombioe.2004.05.006

    CrossRef   Google Scholar

    [10]

    Bouton JH. 2007. Molecular breeding of switchgrass for use as a biofuel crop. Current opinion in genetics & development 17:553−58

    doi: 10.1016/j.gde.2007.08.012

    CrossRef   Google Scholar

    [11]

    Sanderson MA, Reed RL, McLaughlin SB, Wullschleger SD, Conger BV, et al. 1996. Switchgrass as a sustainable bioenergy crop. Bioresource Technology 56:83−93

    doi: 10.1016/0960-8524(95)00176-X

    CrossRef   Google Scholar

    [12]

    McLaughlin S, Bouton J, Bransby D, Conger B, Ocumpaugh W, et al. 1999. Developing switchgrass as a bioenergy crop. In Perspectives on New Crops and New Uses, ed. Janick J. vol 282. Alexandria, VA: ASHS Press. pp. 282-99. www.researchgate.net/profile/W-Ocumpaugh-2/publication/47649519_Developing_Switchgrass_as_a_Bioenergy_Crop/links/54ca74970cf2c70ce521d8e5/Developing-Switchgrass-as-a-Bioenergy-Crop.pdf

    [13]

    Hopkins AA, Vogel KP, Moore KJ. 1993. Predicted and realized gains from selection for in vitro dry matter digestibility and forage yield in switchgrass. Crop Science 33:253−58

    doi: 10.2135/cropsci1993.0011183X003300020007x

    CrossRef   Google Scholar

    [14]

    Taliaferro CM, Hopkins A. 2002. Breeding and selection of new switchgrass varieties for increased biomass production. Technical Report. ORNL/SUB-02-19XSY162C/01, Oak Ridge National Laboratory, Oak Ridge, Tennessee, USA. www.osti.gov/biblio/814564/

    [15]

    Sanderson MA, Adler PR, Boateng AA, Casler MD, Sarath G. 2006. Switchgrass as a biofuels feedstock in the USA. Canadian Journal of Plant Science 86:1315−25

    doi: 10.4141/P06-136

    CrossRef   Google Scholar

    [16]

    Xu B, Escamilla-Treviño LL, Sathitsuksanoh N, Shen Z, Shen H, et al. 2011. Silencing of 4-coumarate: coenzyme A ligase in switchgrass leads to reduced lignin content and improved fermentable sugar yields for biofuel production. The New Phytologist 192:611−25

    doi: 10.1111/j.1469-8137.2011.03830.x

    CrossRef   Google Scholar

    [17]

    Fu C, Xiao X, Xi Y, Ge Y, Chen F, et al. 2011. Downregulation of cinnamyl alcohol dehydrogenase (CAD) leads to improved saccharification efficiency in switchgrass. BioEnergy Research 4:153−64

    doi: 10.1007/s12155-010-9109-z

    CrossRef   Google Scholar

    [18]

    Saathoff AJ, Sarath G, Chow EK, Dien BS, Tobias CM. 2011. Downregulation of cinnamyl-alcohol dehydrogenase in switchgrass by RNA silencing results in enhanced glucose release after cellulase treatment. PloS One 6:e16416

    doi: 10.1371/journal.pone.0016416

    CrossRef   Google Scholar

    [19]

    Fu C, Mielenz JR, Xiao X, Ge Y, Hamilton CY, et al. 2011. Genetic manipulation of lignin reduces recalcitrance and improves ethanol production from switchgrass. Proceedings of the National Academy of Sciences, USA 108:3803−8

    doi: 10.1073/pnas.1100310108

    CrossRef   Google Scholar

    [20]

    Xu B, Huang L, Shen Z, Welbaum GE, Zhang X, et al. 2011. Selection and characterization of a new switchgrass (Panicum virgatum L.) line with high somatic embryogenic capacity for genetic transformation. Scientia Horticulturae 129:854−61

    doi: 10.1016/j.scienta.2011.05.016

    CrossRef   Google Scholar

    [21]

    Mele G, Ori N, Sato Y, Hake S. 2003. The knotted1-like homeobox gene BREVIPEDICELLUS regulates cell differentiation by modulating metabolic pathways. Genes & Development 17:2088−93

    doi: 10.1101/gad.1120003

    CrossRef   Google Scholar

    [22]

    Kubo M, Udagawa M, Nishikubo N, Horiguchi G, Yamaguchi M, et al. 2005. Transcription switches for protoxylem and metaxylem vessel formation. Genes & Development 19:1855−60

    doi: 10.1101/gad.1331305

    CrossRef   Google Scholar

    [23]

    Zhong R, Demura T, Ye Z. 2006. SND1, a NAC domain transcription factor, is a key regulator of secondary wall synthesis in fibers of Arabidopsis. The Plant Cell 18:3158−70

    doi: 10.1105/tpc.106.047399

    CrossRef   Google Scholar

    [24]

    Zhong R, Ye Z. 2009. Transcriptional regulation of lignin biosynthesis. Plant Signaling & Behavior 4:1028−34

    doi: 10.4161/psb.4.11.9875

    CrossRef   Google Scholar

    [25]

    Wuddineh WA, Mazarei M, Zhang J, Turner GB, Sykes RW, et al. 2016. Identification and overexpression of a Knotted1-like transcription factor in switchgrass (Panicum virgatum L.) for lignocellulosic feedstock improvement. Frontiers in Plant Science 7:520

    doi: 10.3389/fpls.2016.00520

    CrossRef   Google Scholar

    [26]

    Aharoni A, Dixit S, Jetter R, Thoenes E, van Arkel G, et al. 2004. The SHINE clade of AP2 domain transcription factors activates wax biosynthesis, alters cuticle properties, and confers drought tolerance when overexpressed in Arabidopsis. The Plant Cell 16:2463−80

    doi: 10.1105/tpc.104.022897

    CrossRef   Google Scholar

    [27]

    Shi JX, Adato A, Alkan N, He Y, Lashbrooke J, et al. 2013. The tomato SlSHINE3 transcription factor regulates fruit cuticle formation and epidermal patterning. The New phytologist 197:468−80

    doi: 10.1111/nph.12032

    CrossRef   Google Scholar

    [28]

    Meng S, Cao Y, Li H, Bian Z, Wang D, et al. 2019. PeSHN1 regulates water-use efficiency and drought tolerance by modulating wax biosynthesis in poplar. Tree Physiology 39:1371−86

    doi: 10.1093/treephys/tpz033

    CrossRef   Google Scholar

    [29]

    Djemal R, Khoudi H. 2016. TdSHN1, a WIN1/SHN1-type transcription factor, imparts multiple abiotic stress tolerance in transgenic tobacco. Environmental and Experimental Botany 131:89−100

    doi: 10.1016/j.envexpbot.2016.07.005

    CrossRef   Google Scholar

    [30]

    Martins APB, dos Santos Brito M, Mayer JLS, Llerena JPP, Oliveira JF, et al. 2018. Ectopic expression of sugarcane SHINE changes cell wall and improves biomass in rice. Biomass and Bioenergy 119:322−34

    doi: 10.1016/j.biombioe.2018.09.036

    CrossRef   Google Scholar

    [31]

    Yang Y, Shi J, Chen L, Xiao W, Yu J. 2022. ZmEREB46, a maize ortholog of Arabidopsis WAX INDUCER1/SHINE1, is involved in the biosynthesis of leaf epicuticular very-long-chain waxes and drought tolerance. Plant Science 321:111256

    doi: 10.1016/j.plantsci.2022.111256

    CrossRef   Google Scholar

    [32]

    Ambavaram MMR, Krishnan A, Trijatmiko KR, Pereira A. 2011. Coordinated activation of cellulose and repression of lignin biosynthesis pathways in rice. Plant Physiology 155:916−31

    doi: 10.1104/pp.110.168641

    CrossRef   Google Scholar

    [33]

    Liu Y, Wei M, Hou C, Lu T, Liu L, et al. 2017. Functional characterization of populus PsnSHN2 in coordinated regulation of secondary wall components in tobacco. Scientific Reports 7:42

    doi: 10.1038/s41598-017-00093-z

    CrossRef   Google Scholar

    [34]

    Bres C, Petit J, Reynoud N, Brocard L, Marion D, et al. 2022. The SlSHN2 transcription factor contributes to cuticle formation and epidermal patterning in tomato fruit. Molecular Horticulture 2:14

    doi: 10.1186/s43897-022-00035-y

    CrossRef   Google Scholar

    [35]

    Xu B, Sathitsuksanoh N, Tang Y, Udvardi MK, Zhang J, et al. 2012. Overexpression of AtLOV1 in switchgrass alters plant architecture, lignin content, and flowering time. PLoS One 7:e47399

    doi: 10.1371/journal.pone.0047399

    CrossRef   Google Scholar

    [36]

    Shen H, Poovaiah CR, Ziebell A, Tschaplinski TJ, Pattathil S, et al. 2013. Enhanced characteristics of genetically modified switchgrass (Panicum virgatum L.) for high biofuel production. Biotechnology for Biofuels 6:71

    doi: 10.1186/1754-6834-6-71

    CrossRef   Google Scholar

    [37]

    Wuddineh WA, Mazarei M, Turner GB, Sykes RW, Decker SR, et al. 2015. Identification and molecular characterization of the switchgrass AP2/ERF transcription factor superfamily, and overexpression of PvERF001 for improvement of biomass characteristics for biofuel. Frontiers in Bioengineering and Biotechnology 3:101

    doi: 10.3389/fbioe.2015.00101

    CrossRef   Google Scholar

    [38]

    Jiang F, Guo M, Yang F, Duncan K, Jackson D, et al. 2012. Mutations in an AP2 transcription factor-like gene affect internode length and leaf shape in maize. PLoS One 7:e37040

    doi: 10.1371/journal.pone.0037040

    CrossRef   Google Scholar

    [39]

    Molina A, Miedes E, Bacete L, Rodríguez T, Mélida H, et al. 2021. Arabidopsis cell wall composition determines disease resistance specificity and fitness. Proceedings of the National Academy of Sciences 118:e2010243118

    doi: 10.1073/pnas.2010243118

    CrossRef   Google Scholar

    [40]

    Buxdorf K, Rubinsky G, Barda O, Burdman S, Aharoni A, Levy M. 2014. The transcription factor SlSHINE3 modulates defense responses in tomato plants. Plant molecular biology 84:37−47

    doi: 10.1007/s11103-013-0117-1

    CrossRef   Google Scholar

    [41]

    Al-Abdallat AM, Al-Debei HS, Ayad JY, Hasan S. 2014. Over-expression of SlSHN1 gene improves drought tolerance by increasing cuticular wax accumulation in tomato. International journal of molecular sciences 15:19499−515

    doi: 10.3390/ijms151119499

    CrossRef   Google Scholar

    [42]

    Ching A, Dhugga KS, Appenzeller L, Meeley R, Bourett TM, et al. 2006. Brittle stalk 2 encodes a putative glycosylphosphatidylinositol-anchored protein that affects mechanical strength of maize tissues by altering the composition and structure of secondary cell walls. Planta 224:1174−84

    doi: 10.1007/s00425-006-0299-8

    CrossRef   Google Scholar

    [43]

    Wan G, Frazier T, Jorgensen J, Zhao B, Frazier CE. 2018. Rheology of transgenic switchgrass reveals practical aspects of biomass processing. Biotechnology for Biofuels 11:57

    doi: 10.1186/s13068-018-1056-5

    CrossRef   Google Scholar

    [44]

    Li R, Qu R. 2011. High throughput Agrobacterium-mediated switchgrass transformation. Biomass and Bioenergy 35:1046−54

    doi: 10.1016/j.biombioe.2010.11.025

    CrossRef   Google Scholar

    [45]

    Porebski S, Bailey LG, Baum BR. 1997. Modification of a CTAB DNA extraction protocol for plants containing high polysaccharide and polyphenol components. Plant Molecular Biology Reporter 15:8−15

    doi: 10.1007/BF02772108

    CrossRef   Google Scholar

    [46]

    Pradhan Mitra P, Loqué D. 2014. Histochemical staining of Arabidopsis thaliana secondary cell wall elements. Journal of Visualized Experiments:e51381

    doi: 10.3791/51381

    CrossRef   Google Scholar

    [47]

    Sluiter A, Ruiz R, Scarlata C, Sluiter J, Templeton D. 2005. Determination of extractives in biomass. Laboratory Analytical Procedure, Technical Report NREL/TP-510-42619. 1617: 1−16. www.nrel.gov/docs/gen/fy08/42619.pdf

    [48]

    Bartley LE, Peck ML, Kim SR, Ebert B, Manisseri C, et al. 2013. Overexpression of a BAHD acyltransferase, OsAt10, alters rice cell wall hydroxycinnamic acid content and saccharification. Plant Physiology 161:1615−33

    doi: 10.1104/pp.112.208694

    CrossRef   Google Scholar

    [49]

    Gustafson DM, Boe A, Jin Y. 2003. Genetic variation for Puccinia emaculata infection in switchgrass. Crop Science 43:755−59

    doi: 10.2135/cropsci2003.7550

    CrossRef   Google Scholar

  • Cite this article

    Frazier TP, Lin F, Wang G, Norris A, Toro C, et al. 2023. Overexpression of the Arabidopsis SHN3 transcription factor compromises the rust disease resistance of transgenic switchgrass plants. Grass Research 3:4 doi: 10.48130/GR-2023-0004
    Frazier TP, Lin F, Wang G, Norris A, Toro C, et al. 2023. Overexpression of the Arabidopsis SHN3 transcription factor compromises the rust disease resistance of transgenic switchgrass plants. Grass Research 3:4 doi: 10.48130/GR-2023-0004

Figures(7)  /  Tables(4)

Article Metrics

Article views(4243) PDF downloads(693)

ARTICLE   Open Access    

Overexpression of the Arabidopsis SHN3 transcription factor compromises the rust disease resistance of transgenic switchgrass plants

Grass Research  3 Article number: 4  (2023)  |  Cite this article

Abstract: Switchgrass can generate large amounts of renewable biomass and hence is one of the most promising bioenergy crops. Improving the quality of switchgrass lignocellulosic biomass will enable its utilization for biofuels. Arabidopsis SHINE family of transcription factor SHN2 was previously identified as a master regulator of cell wall deposition in transgenic rice. However, it is unclear if the Arabidopsis SHN genes also have a similar biological function in switchgrass. Here, we generated transgenic switchgrass overexpressing the Arabidopsis SHN3 transcription factor. Compared with the wild-type, AtSHN3-overexpressing switchgrass plants were stunted in their growth. There were no significant differences in terms of lignin and cellulose content between the SHN transgenics and wild-type switchgrass plants. However, two AtSHN3 transgenic lines SHN7-2 and SHN5-2, displayed significant changes in several matrix polysaccharide monomers. Overexpression of AtSHN3 in switchgrass did not alter the stem mechanical strength when subjected to tensile-torsion analysis. Interestingly, the AtSHN3-overexpressing transgenic lines were more susceptible to switchgrass rust (Puccinia emaculata) than wild-type plants. Therefore, AtSHN3 may have a negative role in regulating disease resistance in switchgrass.

    • To meet growing energy demands, it is estimated that 22.3 million acres of arable cropland will need to be allocated to biofuel production by the year 2030[1,2]. Perennial forage grasses grown in marginal lands are an attractive source of sustainable energy, and as such, they have been extensively studied as promising second-generation bioenergy crops[1]. These second-generation biofuel feedstocks, such as switchgrass, contain large amounts of lignocellulosic biomass that can provide an inexpensive and abundant source of renewable energy[3].

      Lignocellulosic feedstock material is comprised of three major components: lignin, matrix polysaccharides, and cellulose. In conjunction with minor components, such as minerals and proteins, these molecules function together to form the structural base of the plant cell wall[4]. The concentrations of lignin, matrix polysaccharides, and cellulose vary among plant species[4]. Grasses typically contain 25%−40% cellulose, 35%−50% hemicellulose, and 10-30% lignin[5].

      Switchgrass is a C4 perennial grass that used to be commonly found growing across the vast prairie region of North America. There are three ecotypes of switchgrass, lowland, upland, and coastal, that differ in their habitat preference[6]. Lowlands and coastals are typically found growing across the warm southern plains of the United States whereas uplands tend to grow across the northern prairies into the southern parts of Canada[7]. Morphologically, lowland ecotypes have thicker stems, wider leaves, and taller tillers than their upland counterparts[7]; whereas coastals have thin, but tall stems. The two better studied ecotypes vary significantly in overall biomass production. Lowland varieties have been shown to produce on average 12.9 Mg·ha−1 of biomass per year, while the upland varieties have been shown to produce on average 8.7 Mg·ha−1 of biomass per year[8]. Currently, several commercial varieties of switchgrass have been released that are suitable for large-scale sustainable biomass production, including lowland varieties 'Alamo' and 'Kanlow', as well as upland cultivars 'Cave-In-Rock' and 'Summer'[9,10].

      For switchgrass to be fully utilized as a bioenergy crop, the quality of the lignocellulosic component of the biomass must be improved. Significant effort has been put into identifying elite switchgrass germplasm from already existing cultivars and into developing the best management practices for optimal biomass output[11,12]. In addition, traditional breeding methods have been employed to enhance certain characteristics of switchgrass feedstock, including biomass production and forage digestibility[13,14]. Considering the time constraints of current breeding practices, it takes approximately ten years to develop a new switchgrass cultivar with enhanced characteristics using traditional methods[15].

      Recently, genetic engineering practices have been used to create transgenic switchgrass lines with altered cell wall compositions. Since lignin is a limiting factor in the use of lignocellulosic biomass for bioethanol production, several studies in switchgrass have used RNAi technology to knock down genes coding for key enzymes in the lignin biosynthesis pathway, including 4-coumarate:coenzyme A ligase (4CL)[16], cinnamyl alcohol dehydrogenase (CAD)[17,18], and caffeic acid O-methyltransferase (COMT)[19]. Xu et al. found that in comparison to the wild-type plants, transgenic switchgrass lines with reduced 4CL activity had a 22% reduction in overall lignin and released 57.2% more fermentable sugar with dilute acid pretreatment[20]. Alternatively, two independent studies found that down-regulating CAD in switchgrass results in 23% less lignin and cutin[18] or 14%−22% less lignin[17], respectively. Finally, down-regulation of the COMT gene in switchgrass produced up to 38% more ethanol using current biomass fermentation practices[19].

      An alternative to directly targeting components of the lignin pathway is to manipulate the master regulator that plays a role in regulation of cell wall composition. Several transcription factors have been identified as key regulators of cell wall biosynthesis[2125]. The Arabidopsis SHNE family belongs to the APETALA2/ Ethylene Responsive Factor (AP2/ERF) transcription factor family that consists of three members (AtSHN1, AtSHN2, and AtSHN3)[26]. Arabidopsis shn mutants have aberrant deposition of epicuticular wax and altered flower morphology[26,27]. AtSHN1 and its orthologues can regulate wax deposition and drought tolerance in plants[26,2831]. AtSHN2 and its orthologues function as key regulators of cutin, polysaccharides, and lignin deposition[3234]. Overexpression of AtSHN2 in rice resulted in transgenic plants with a 34% increase in cellulose content and a 45% decrease in lignin[32]. However, unlike AtSHN1 and AtSHN2, the biological function of AtSHN3 has not been intensively characterized.

      Despite its importance as a promising bioenergy crop, only a handful of studies in switchgrass have aimed to identify transcriptional control mechanisms underlying cell wall deposition[3537]. In this study, we created transgenic switchgrass plants overexpressing the AtSHN3 cDNA sequence from Arabidopsis. The transgenic switchgrass lines consistently displayed stunted growth, but alterations in several matrix polysaccharide monomers varied between AtSHN3 transgenic lines and the wild-type plants. Additionally, we report that overexpressing AtSHN3 in switchgrass compromised rust disease resistance. The results of this study provide insights into the biological functions of AtSHN3 that may negatively regulate the rust disease resistance in switchgrass.

    • Following Agrobacterium transformation of somatic embryogenic switchgrass callus, a total of 49 potential ZmUbi10pro: AtSHN3-overexpressing switchgrass plants were regenerated and transplanted into soil. These 49 plants were derived from seven independent transformation events. Four plants, representing four independent transformation events, were selected for further analysis. DNA samples for all four transgenic lines, as well as the wild-type HR8 control, were analyzed by Southern blot. Southern blot analysis showed that three of the four selected lines contained multiple transgene insertions (Fig. 1). SHN4-1 contained three copies of the transgene, whereas SHN5-2 and SHN7-2 contained two copies of the transgene. SHN6-3 was the only line with a single insertion copy of the transgene.
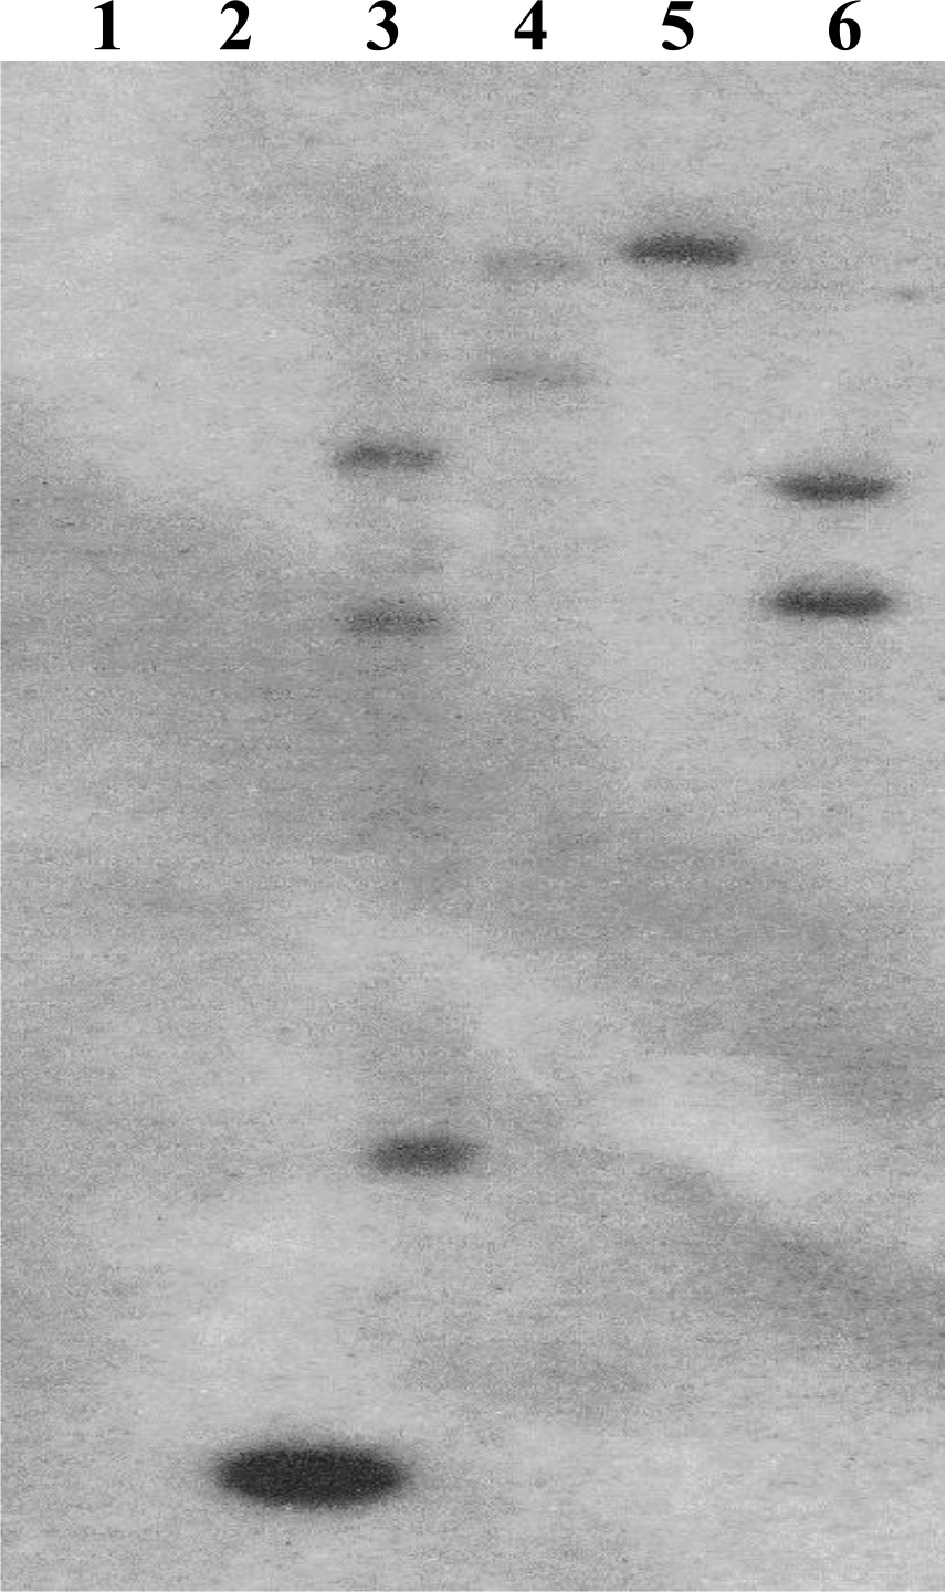
      Figure 1. 

      Southern blot confirmation of transgene insertion. A portion of the hygromycin selection gene was used as a probe. (1) HR8 negative control, (2) 1 kb positive standard, (3) SHN4-1, (4) SHN5-2, (5) SHN6-3, (6) SHN7-2.

    • Growth and development were compared between greenhouse-grown transgenic AtSHN3-overexpressing plants and the wild-type HR8 control plants after three months. Two of the AtSHN3-overexpressing transgenic plants, SHN4-1 and SHN7-2, appeared shorter than the HR8 control (Fig. 2). Several agronomic traits were measured for all plants with three replicates to evaluate the degree of stunting. These included the number of tillers, tiller height, leaf length, leaf width, stem size, and overall biomass. The number of tillers produced was not statistically different (p > 0.01) between the transgenic lines and the wild-type plants (Table 1). All of the plants in this study possessed between 6 and 12 tillers per line. Tiller height measurements revealed that the SHN4-1 and the SHN7-2 plants were significantly shorter (p < 0.01) than the wild-type plants (Table 1).
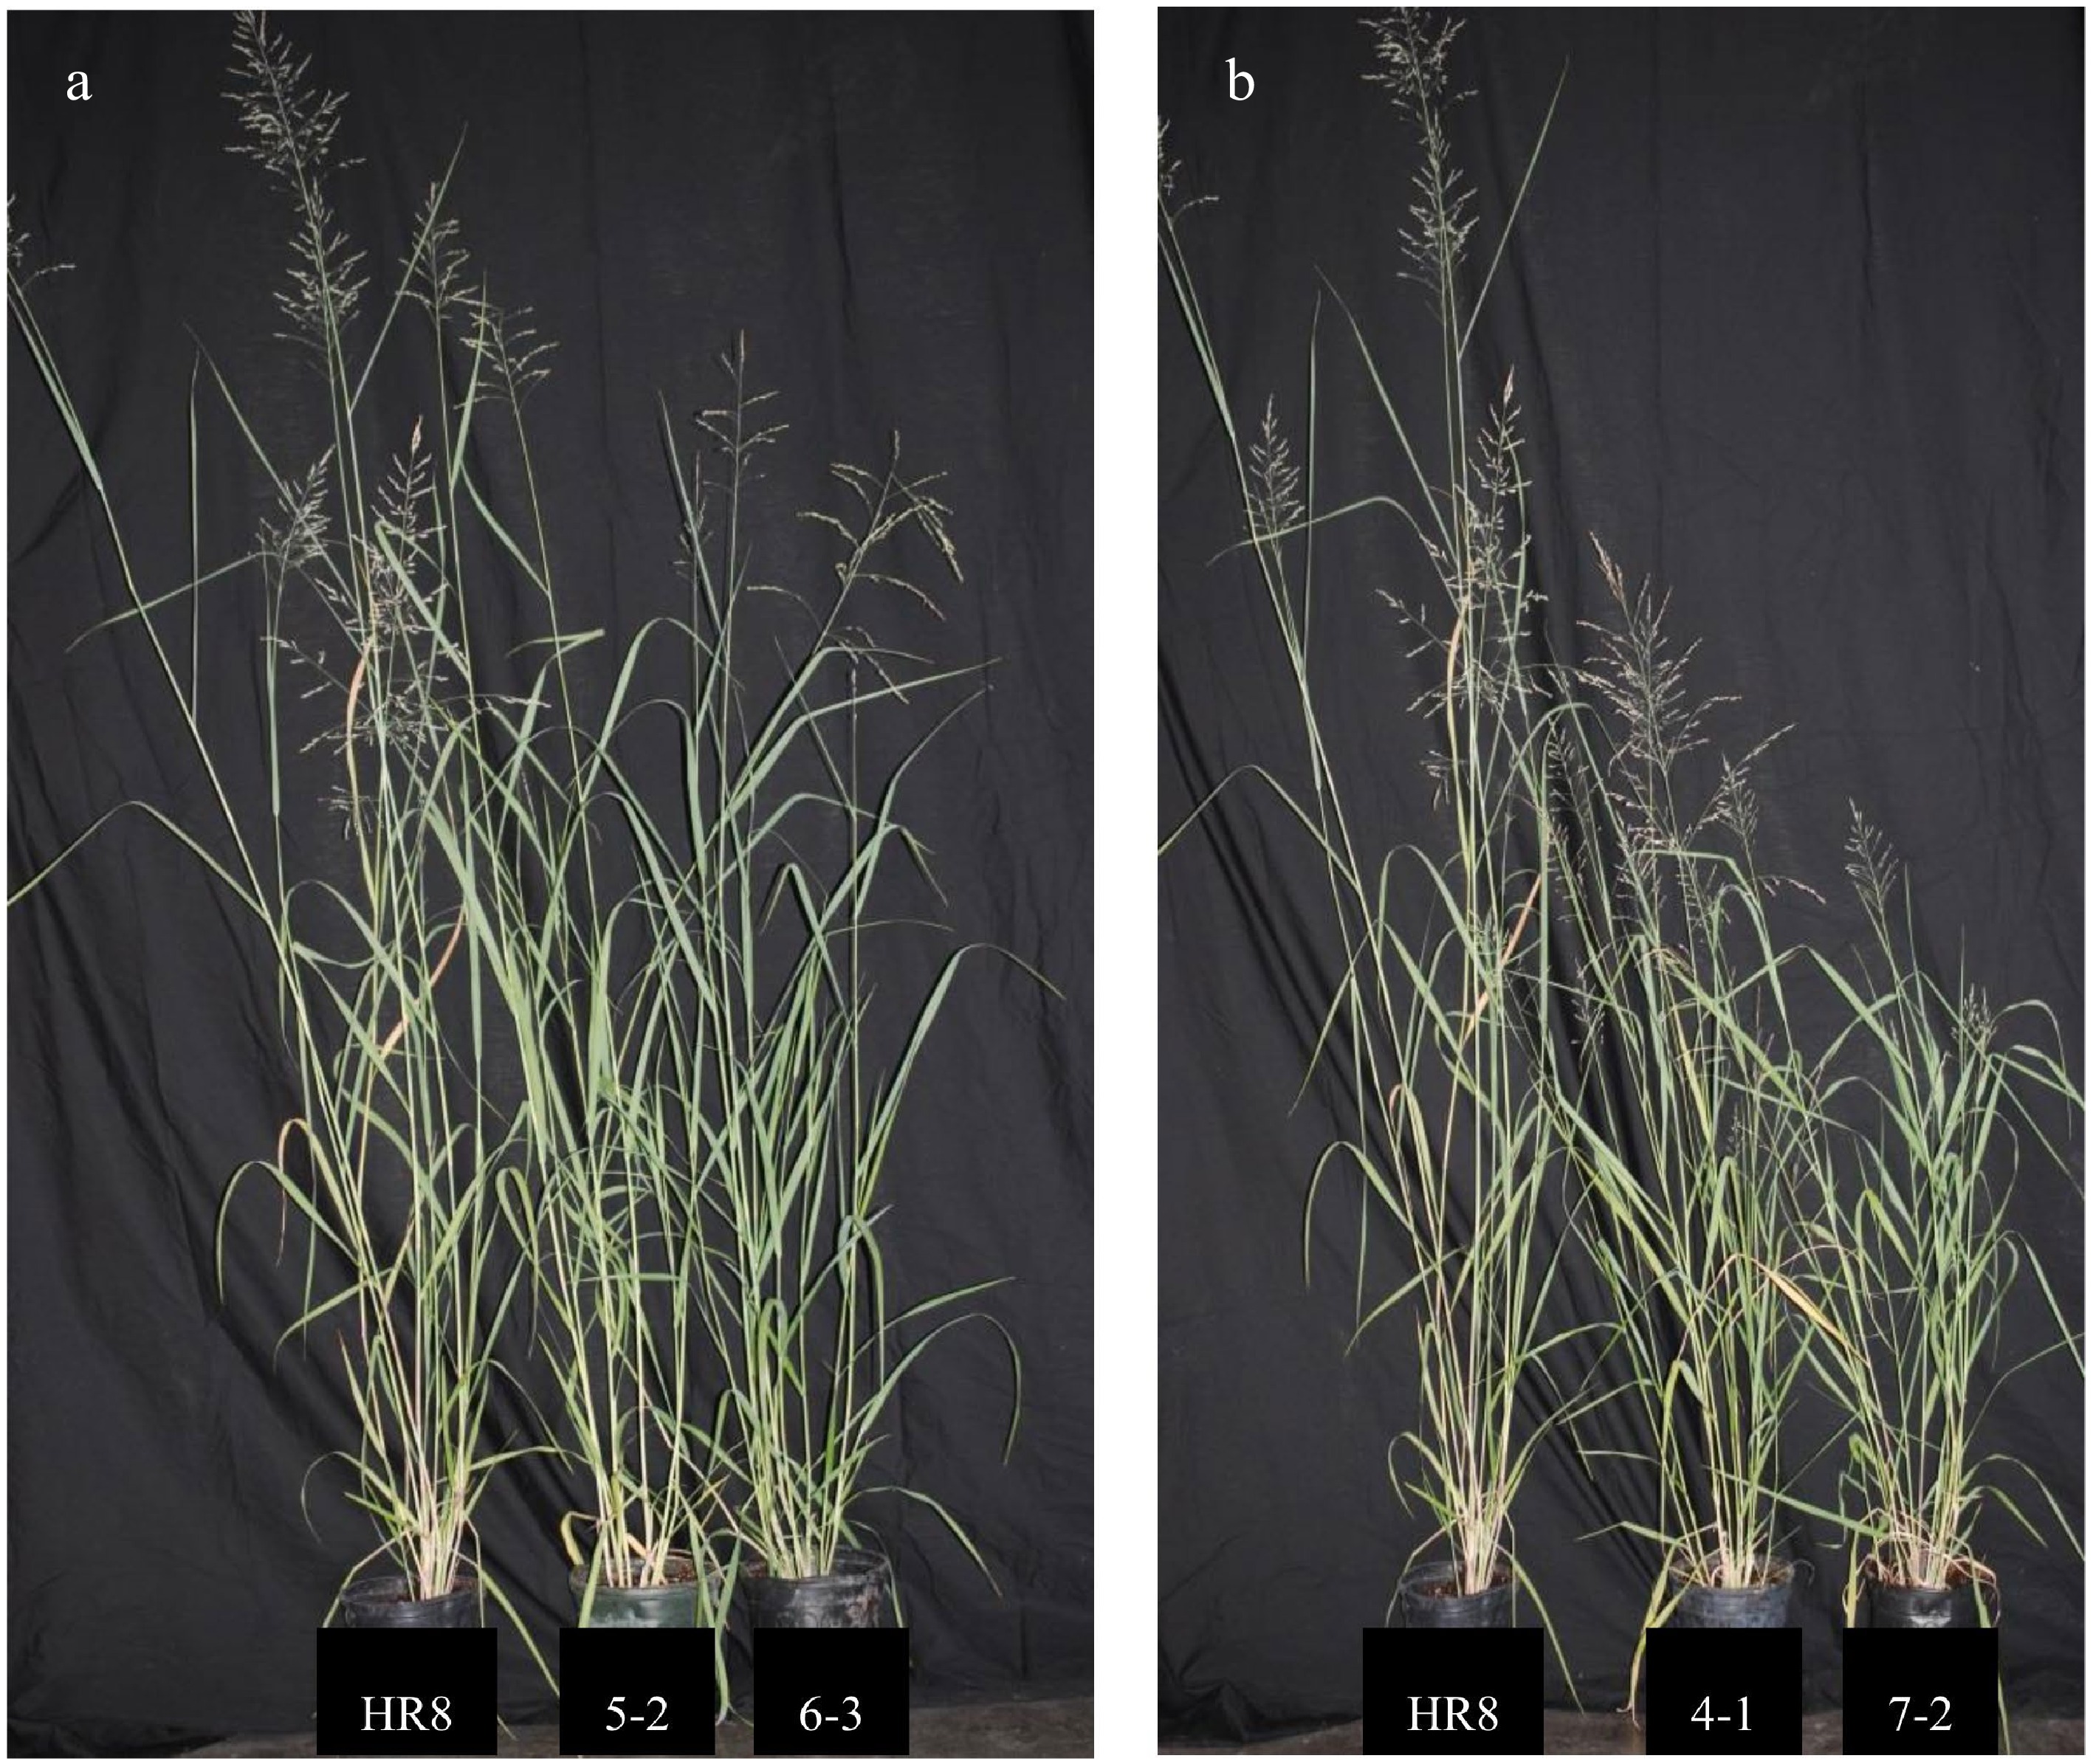
      Figure 2. 

      AtSHN3-overexpressing transgenic switchgrass lines are smaller than wild-type plants. (a) HR8 control plant (left) in comparison to SHN 5-2 (middle) and SHN 6-3 (right). (b) HR8 control plant (left) in comparison to SHN 4-1 (middle) and SHN 7-2 (right).

      Table 1.  Comparison of agronomic trait measurements for AtSHN3-overexpressing transgenic switchgrass and HR8 control plants. Trait means were not statistically significantly different unless stated, i.e., p > 0.01.

      T0 plantsTiller numberTiller height (cm)Flag leaf length (cm)Flag leaf width (mm)Stem width (mm)Biomass (kg)*
      HR812126.0433.39.334.090.096
      SHN4-110.585.25**25.277.23**3.290.069
      SHN5-26.8126.5032.1710.134.350.087
      SHN6-39.2104.5923.478.013.930.066
      SHN7-210.675.46**24.777.993.580.073
      * = biomass of plant fresh weight; ** = statistically different at p < 0.01.

      Despite the difference in overall height, the flag leaf lengths of all transgenic lines were not statistically distinguishable from the control plants (p > 0.01, Table 1). SHN4-1 plants had a significantly smaller leaf width (p < 0.01) compared to the HR8 control (Table 1). Both the transgenic AtSHN3-overexpressing lines and the HR8 control plants had similar stem sizes (Table 1). An indicator of change in cell wall composition is the abnormal lengthening of internode stem segments[38]. In this study, we found that the second internode from the base of the plant was shorter for the SHN4-1 and SHN7-2 plants (Fig. 2). Surprisingly, despite their stunted growth, the AtSHN3-overexpressing lines produced comparable biomass to the wild-type plants under greenhouse conditions (Table 1).

    • Since the SHN4-1, SHN5-2, and SHN7-2 plants have multiple copies of the transgene (Fig. 1), qPCR was performed to determine if there was a correlation between the transgene copy number and AtSHN3 gene expression. In comparison to SHN6-3, which has a single copy of the transgene, we found that AtSHN3 gene expression increased with increasing transgene copy numbers. SHN4-1 has at least three copies of transgenes (Fig. 1), and it exhibited the highest transgene expression. SHN5-2 and SHN7-2 both have two copies of transgenes. However, their expression was not statistically different from that of SHN6-3 (Fig. 3). SHN4-1 was the shortest among all of the transgenic lines. Thus, differences in the expression levels of AtSHN3 may be contributing to the stunted growth phenotype observed in SHN4-1 switchgrass plants.
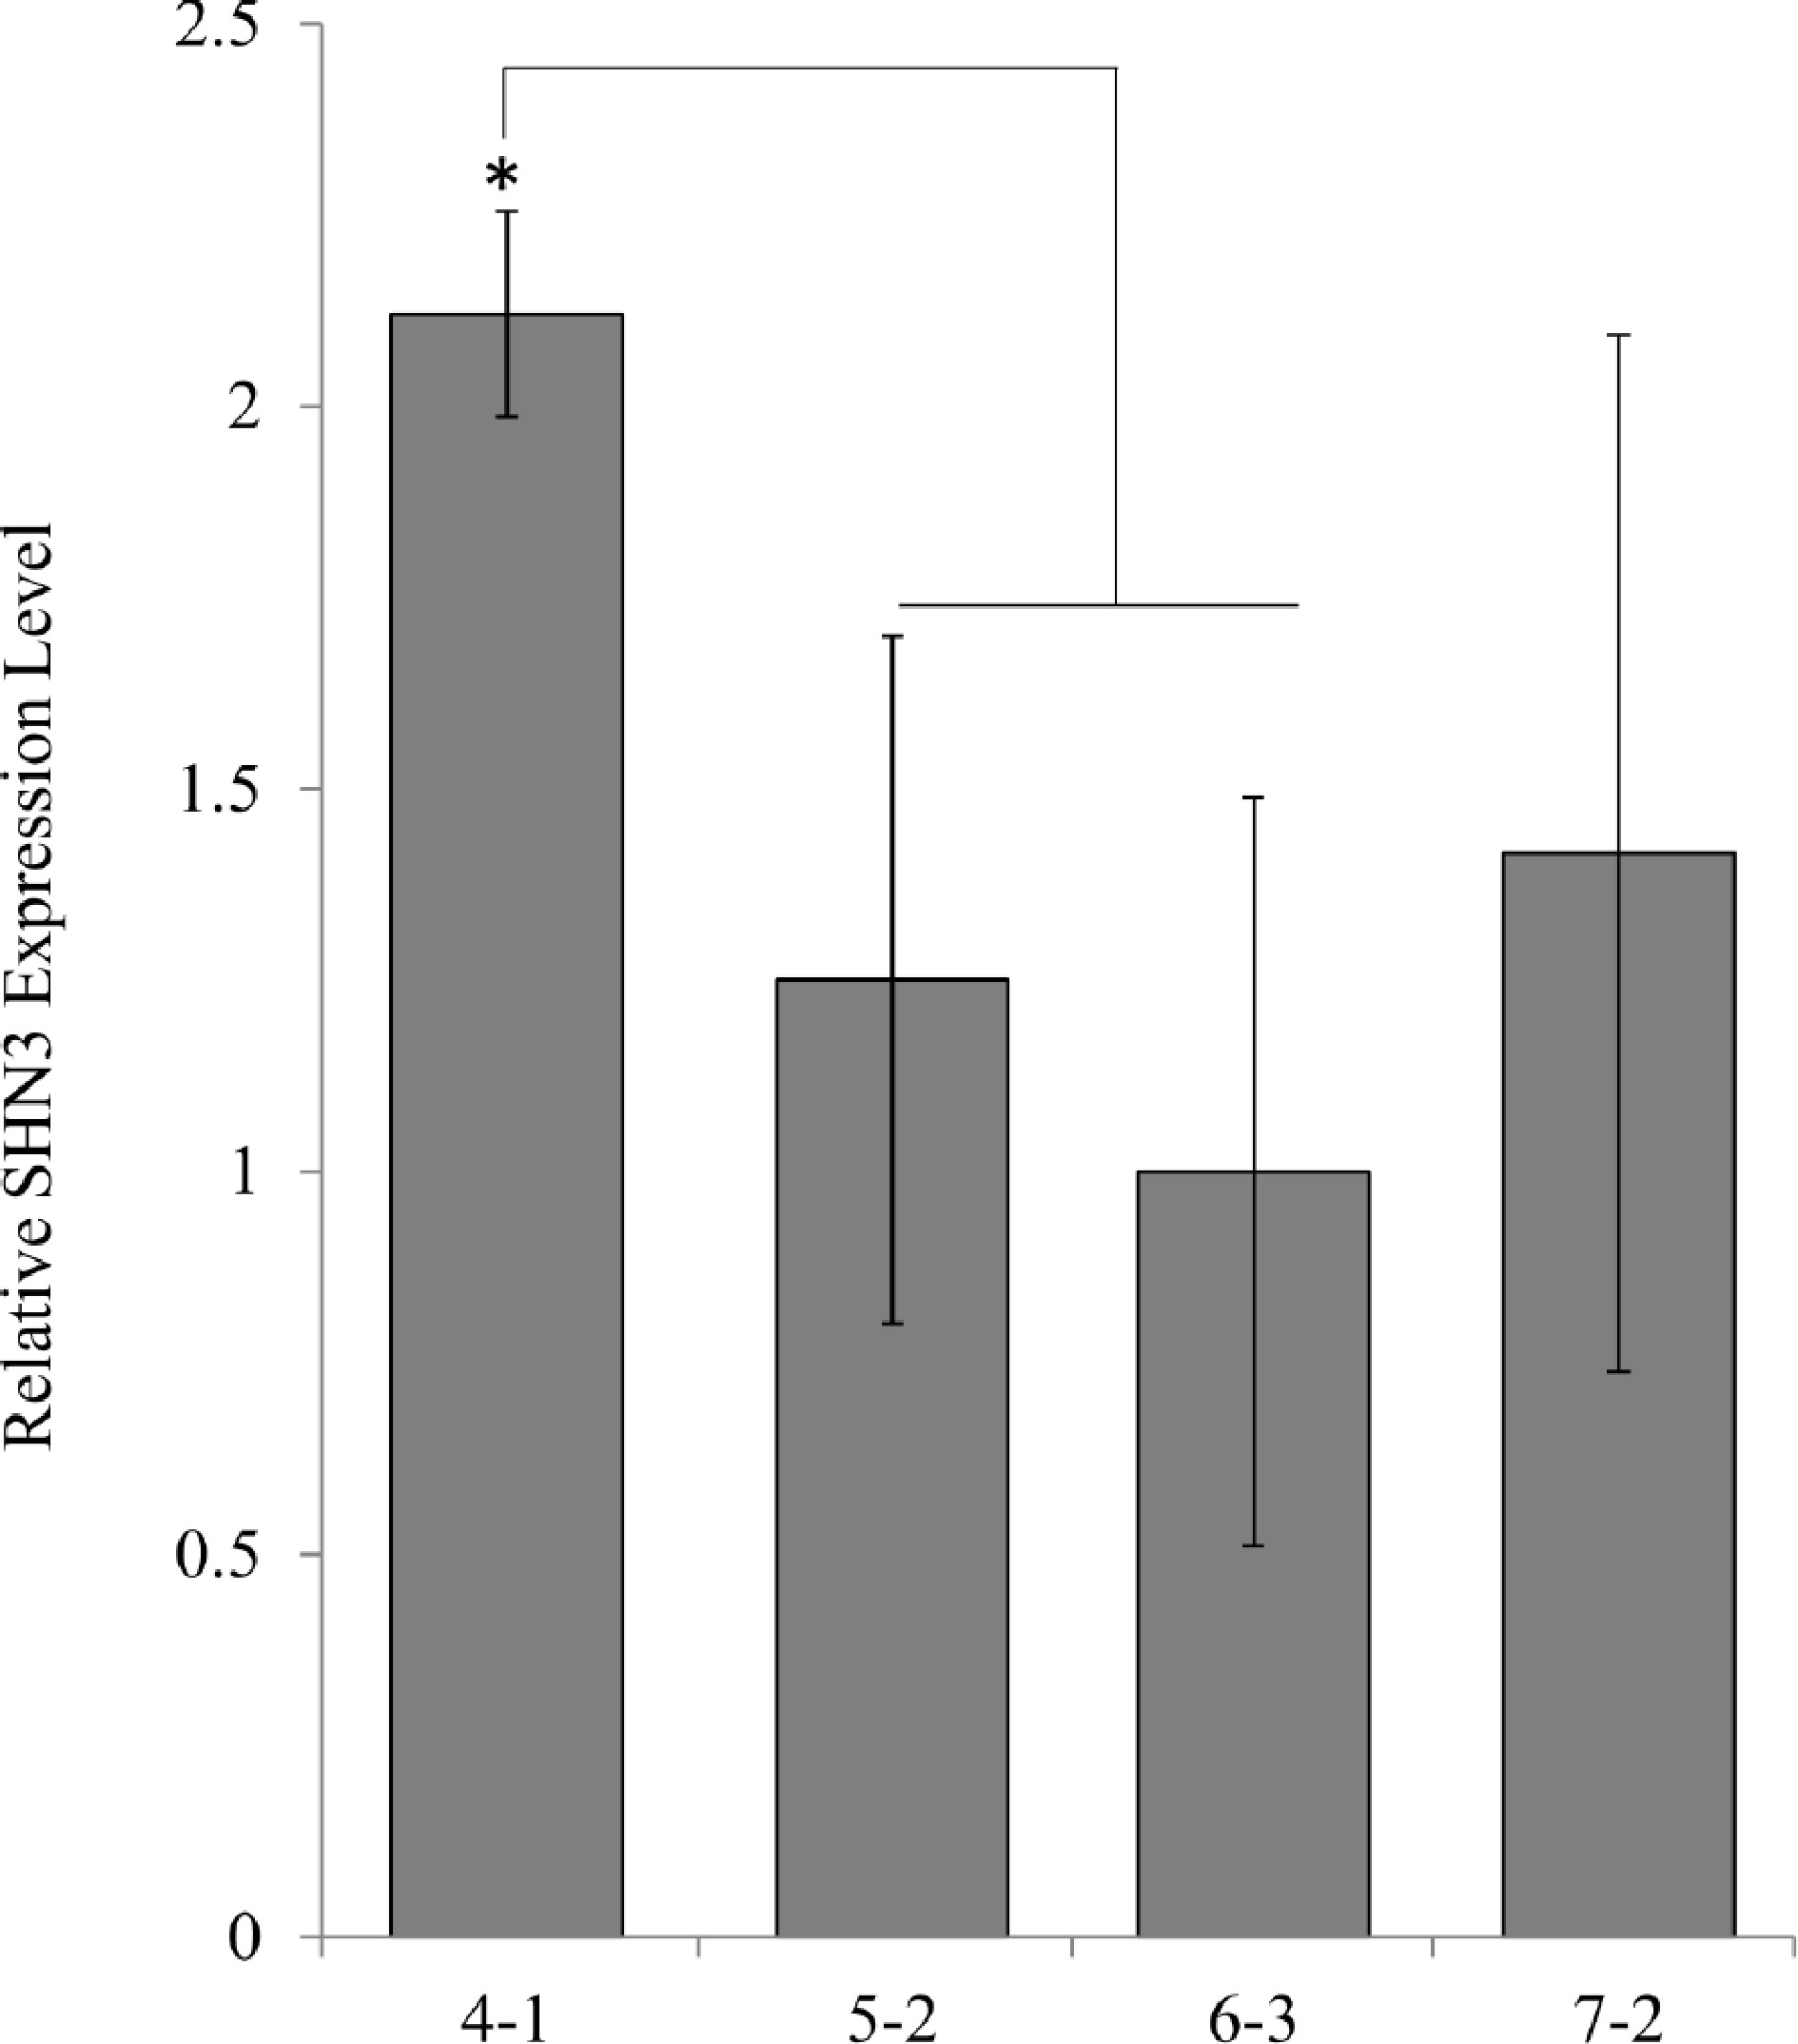
      Figure 3. 

      qPCR analysis of transgene expression levels in AtSHN3 transgenic plants. Expression levels were normalized to the values obtained for SHN3 6-3, which contains one transgene insertion. N = 3, the error bars are standard deviations.

    • Phloroglucinol staining of I2 sections of transgenic and wild-type switchgrass stems suggested that overexpression of AtSHN3 in switchgrass might alter lignin and cellulose content (Fig. 4). Therefore, I2 stem fragments were subjected to quantify the amount of acid-soluble and acid-insoluble lignin and overall lignin content via sulfuric acid hydrolysis assays. However, the acid-soluble and acid-insoluble lignin contents were not statistically significantly altered between the wild-type and transgenics (Table 2).
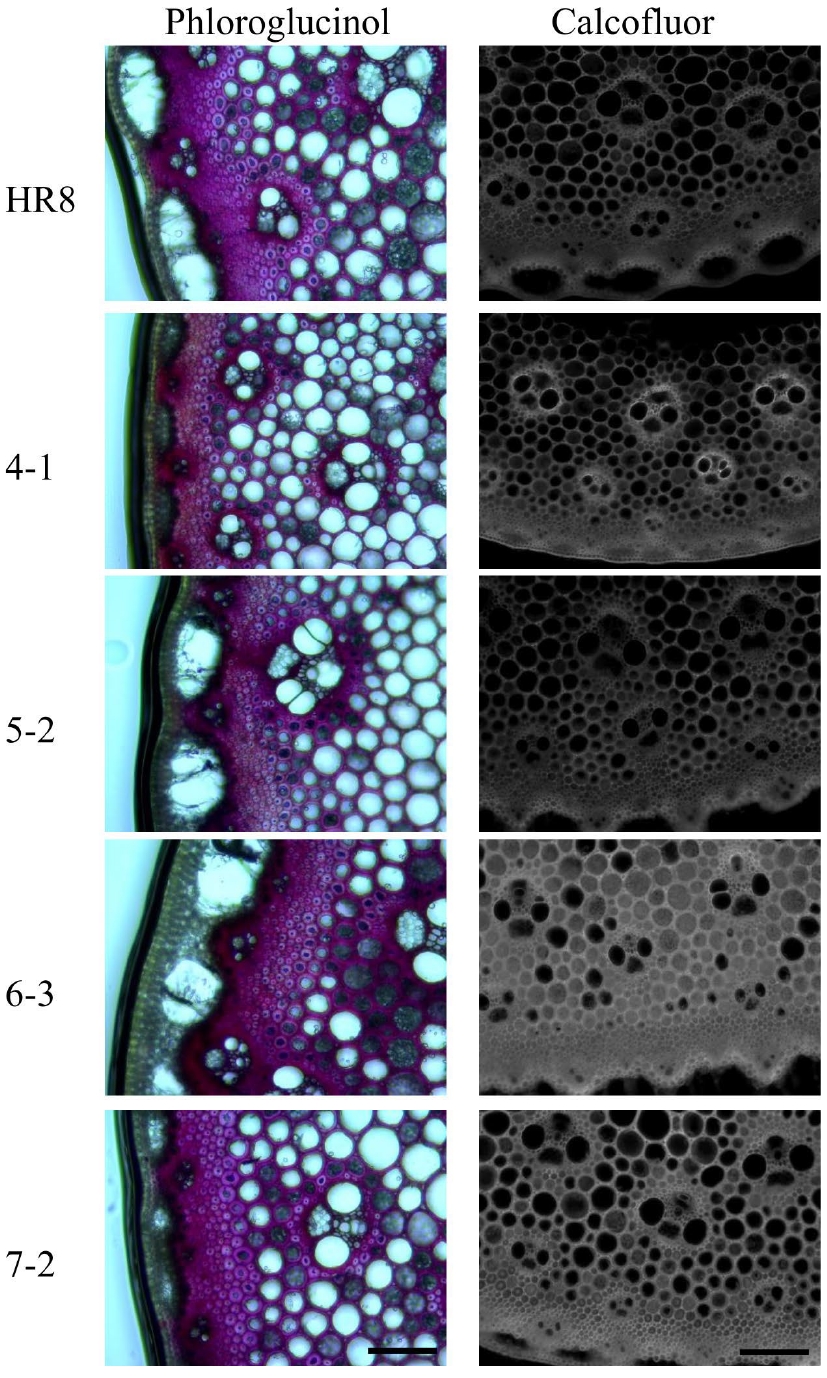
      Figure 4. 

      Phloroglucinol and calcofluor staining of I2 stem sections of wild-type and AtSHN3 transgenics. The tiller segment sections of wild-type and AtSHN3 transgenics were stained with either Phloroglucinol or calcofluor white, and observed under a microscope. Lignin stained with Phloroglucinol is in cherry pink color and the cellulose stained with calcofluor white is showing fluorescence under UV light. All experiments were performed at least twice with similar results.

      Table 2.  Acid-soluble lignin and acid-insoluble lignin measurement for the AtSHN3-overexpressing transgenic plants and the wild-type control. N = 3, error represents standard deviation.

      Switchgrass line% Acid soluble lignin% Acid insoluble lignin% Total lignin
      HR815.5 ± 1.12.2 ± 0.217.7 ± 1.0
      SHN4-113.1 ± 0.02.1 ± 0.215.2 ± 0.4
      SHN5-215.8 ± 1.12.5 ± 0.118.3 ± 1.1
      SHN6-315.1 ± 0.32.1 ± 0.417.2 ± 0.7
      SHN7-214.2 ± 0.72.1 ± 0.216.4 ± 0.9

      The cellulosic glucose content of I2R3 stem segments was also measured to determine if the transgenic lines had an increase in cellulose. However, there is no statistically difference between the wild-type and AtSHN3 transgenic plants at p < 0.01 level (Fig. 5). We further analyzed the SHN transgenics of matrix polysaccharide monomers, including arabinose, galactose, glucose, xylose, galacturonic acid, and glucuronic acid. Interestingly, we detected there were significant changes in a few of these hemicellulose sugars between the AtSHN3-overexpressing lines and the HR8 wild-type plants (Fig. 6). For example, SHN7-2 transgenic internodes had 31% more arabinose and 90% more xylose than HR8 control plants (p < 0.01). Also, SHN5-2 transgenic plants had 43% less matrix polysaccharide glucose than the wild-type HR8 plants (p < 0.01).
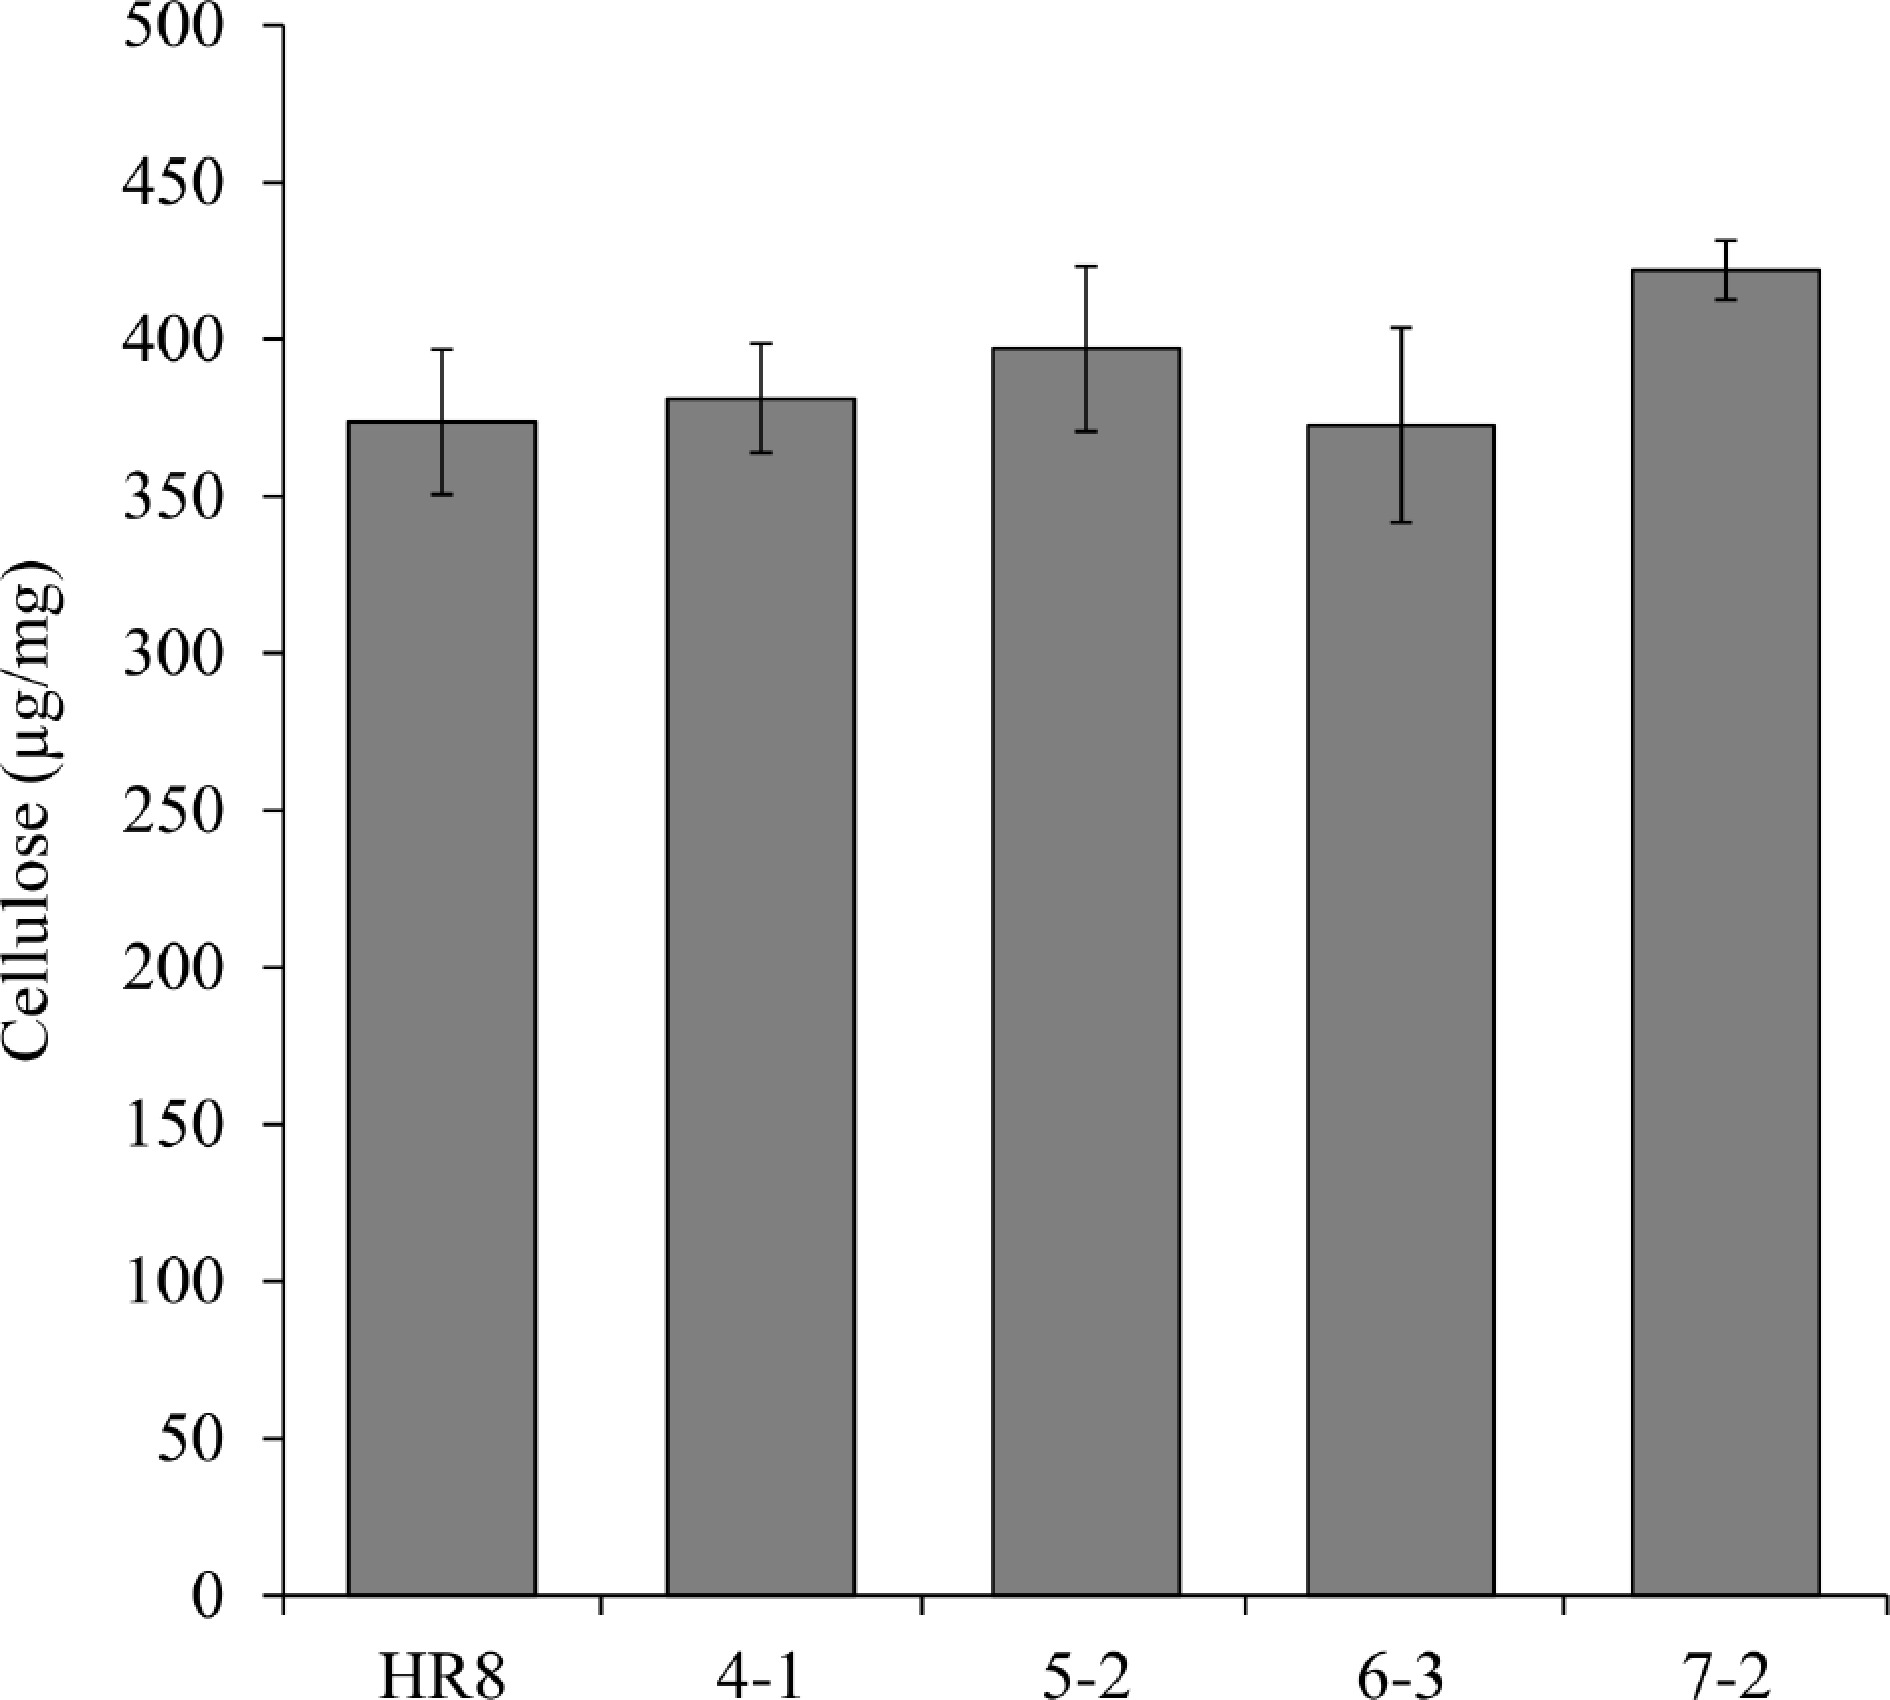
      Figure 5. 

      Measurement of cellulose content between AtSHN3-overexpressing transgenic switchgrass and HR8 wild-type. The cellulose content of the transgenic plants was not statistically different from the wild-type (p < 0.01). N = 3, the error bars are standard deviation.
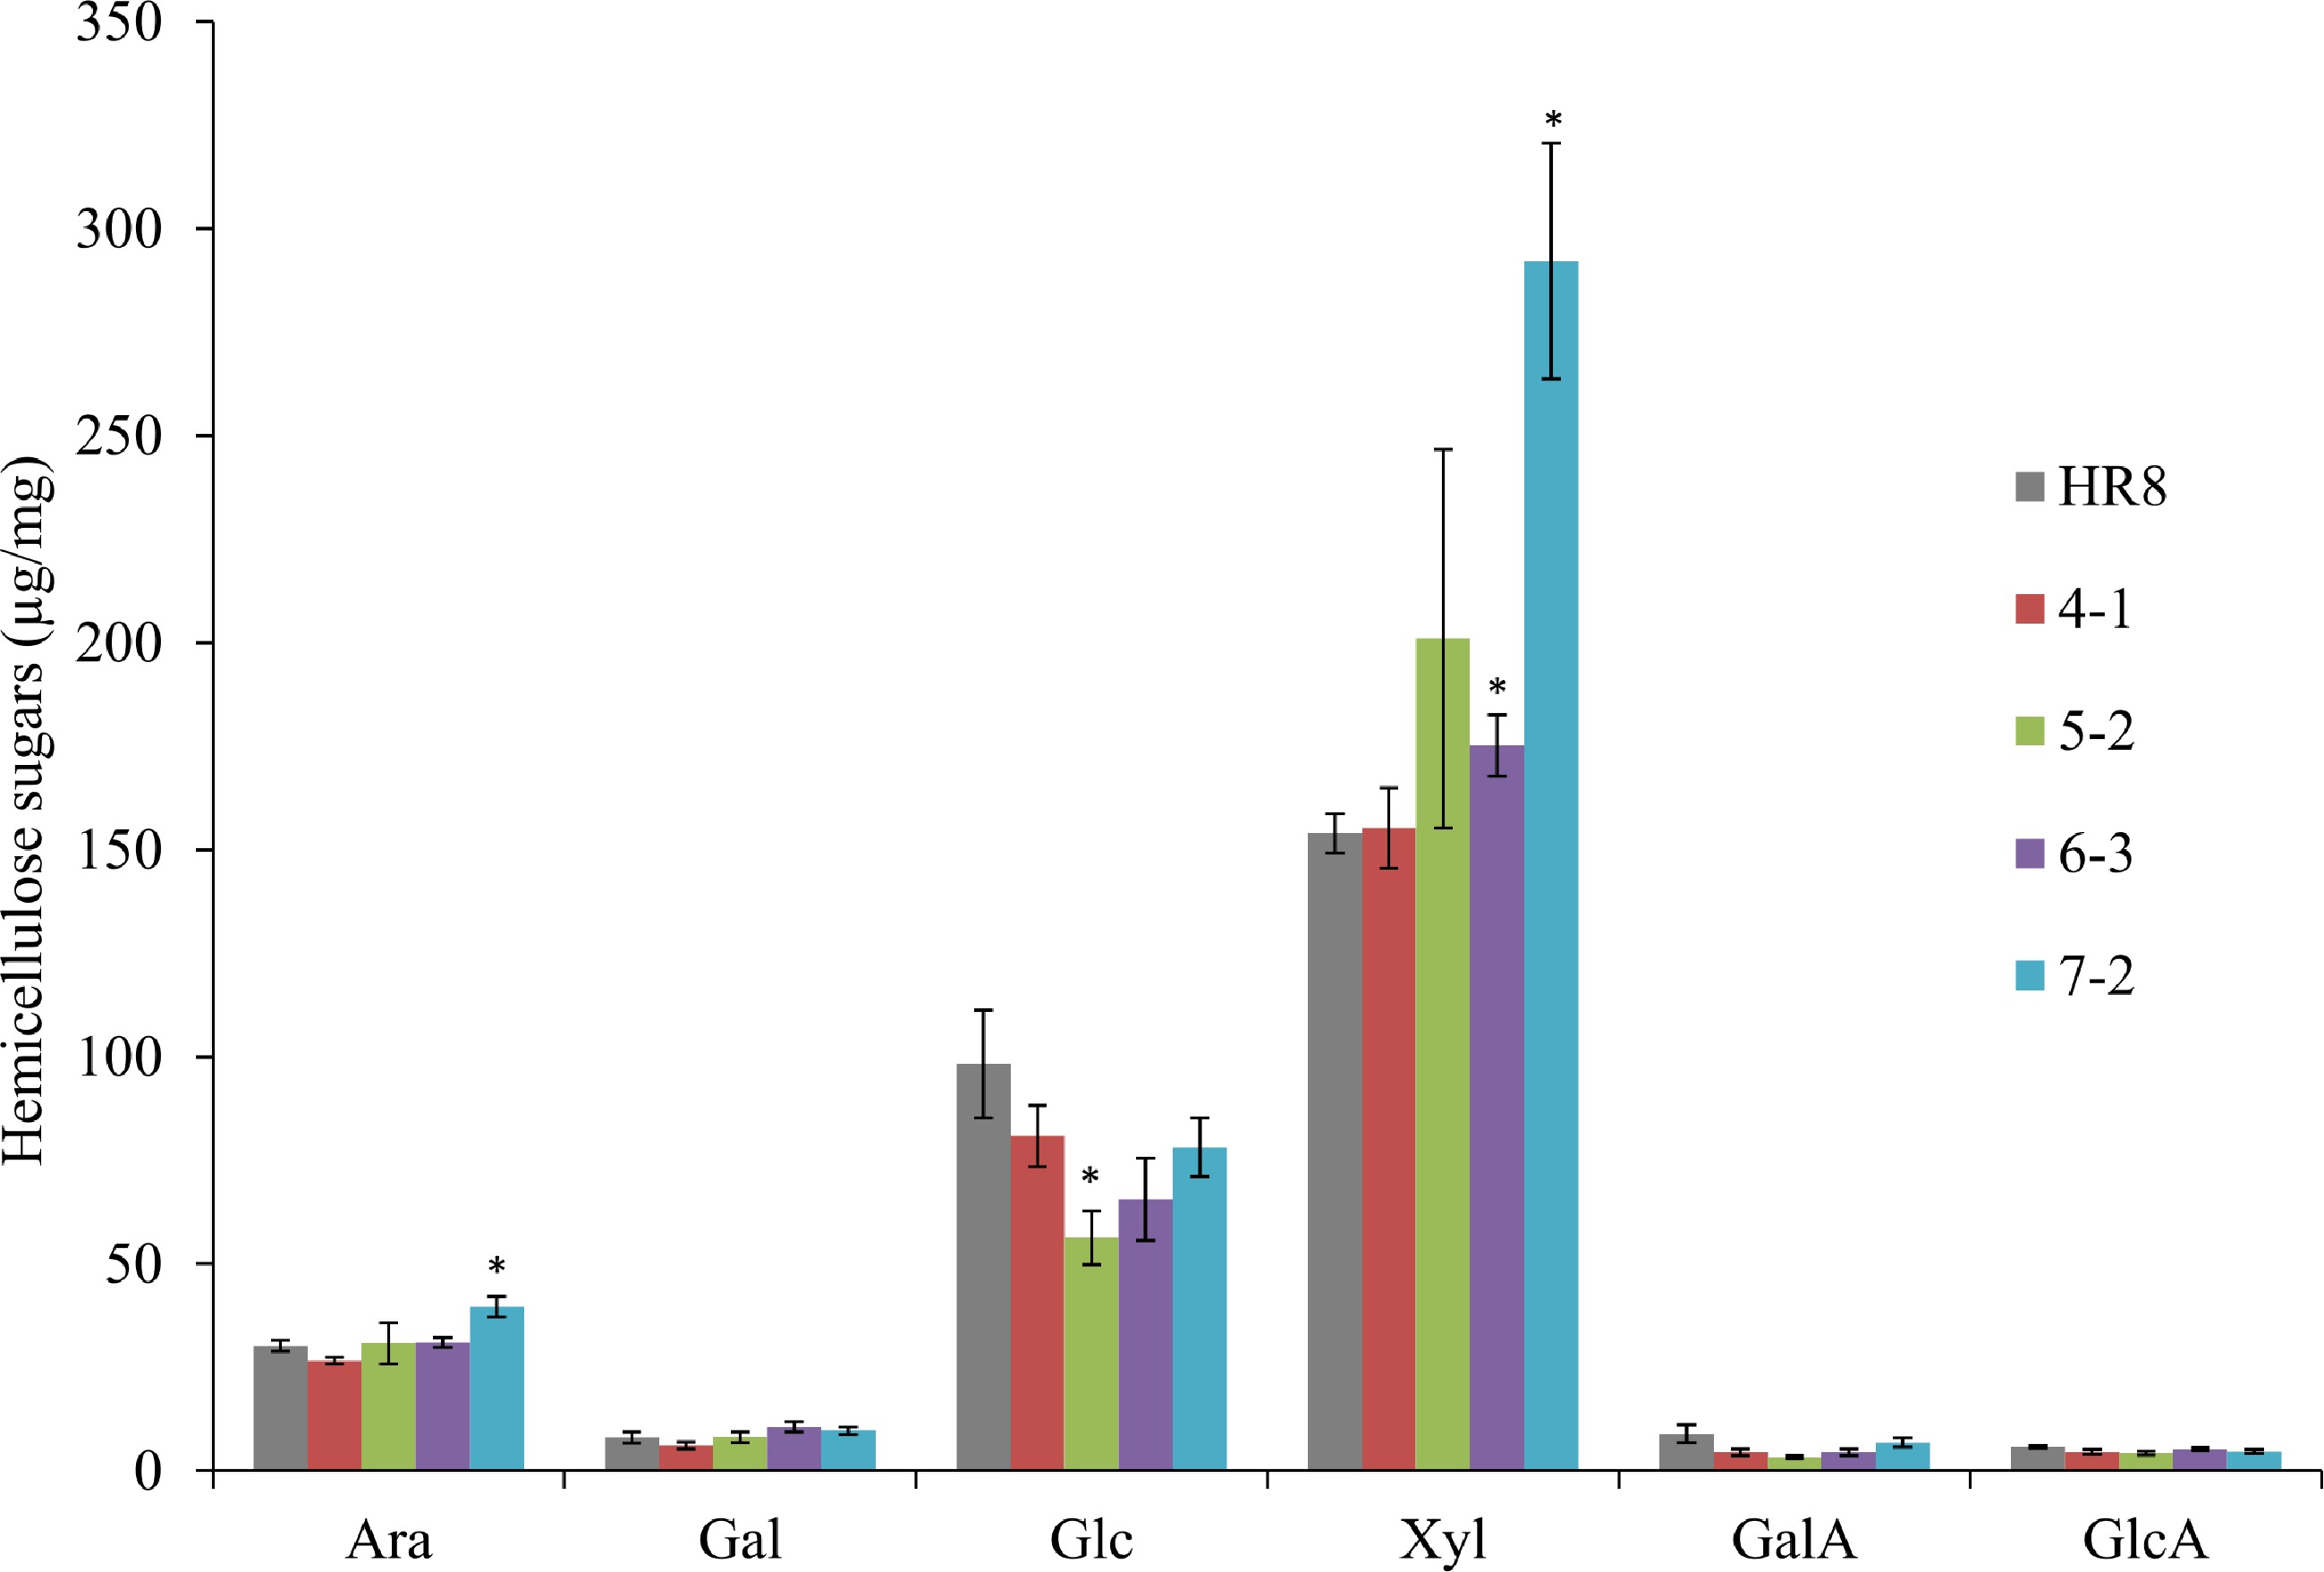
      Figure 6. 

      Matrix polysaccharide sugars in AtSHN3-overexpressing transgenic switchgrass and HR8 wild-type. SHN7-2 transgenic plants were found to have 31% more arabinose and 90% more xylose than HR8 control plants (p < 0.01). SHN5-2 transgenic plants were found to have 43% less glucose than the wild-type HR8 plants (p < 0.01). N = 3, the error bars are standard deviations. The asterisks are the indicators of significant differences between wild-type and transgenics. Arabinose (Ara), Galactose (Gal), Glucose (Glc), Xylose (Xyl), Galacturonic acid (GalA) and Glucuronic acid (GlcA).

      Taken together, the overexpression of AtSHN3 does not significantly change the lignin and cellulose contents in switchgrass cell wall biomass; instead, it can alter the deposition of hemicellulose sugars in switchgrass.

    • A change in cell wall composition could alter the strength of the stem, which helps the plant maintain an upright growth habit and to withstand abiotic stress such as wind. Storage modulus tests were conducted to measure if the altered hemicellulose contents of the AtSHN3 transgenics could also affect the stiffness of the AtSHN3-overexpressing stems. The test was performed by applying an oscillating stress to the sample and measuring the responding strength. Our results suggest there is no significant difference between the AtSHN3 transgenics lines and the wild-type control plants at the p <0.01 level (Table 3).

      Table 3.  Average storage modulus derived from stress sweeps at 25ºC for AtSHN3-overexpressing transgenic plants and HR8 wild-type control. The number of repetitions for this experiment is n = 2 for all biological samples.

      Storage modulus G’ (Pa)HR8SHN4-1SHN5-2SHN6-3SHN7-2
      Strain2.1E82.2E82.2E81.5E81.8E8
      Standard deviation1.8E71.1E82.9E71.5E72.6E7
      p-value0.060.890.850.34

      In addition to the stiffness, we also tested if changing the hemicellulose content of cell walls affected the overall mechanical strength of the transgenic switchgrass stems. To accomplish this, fracture tests were performed on switchgrass stem sections by continuously increasing levels of torsion force applied to the stem sections until the stems broke. From the fracture tests, two parameters correlated to the overall mechanical strength of the stem: 1) the slope of the linear region, which reflects the stiffness of the stem, and 2) the breaking point, which correlates to the strength of the stem. The results from both the linear region and breaking point analyses suggest that there was no significant difference between the transgenics and the wild-type control plants (Table 4).

      Table 4.  Initial linear strength measurement and shear stress at breaking point for the AtSHN3-overexpressing transgenic lines and the HR8 control. The number of repetitions used for this analysis was n = 5.

      MeasurementHR8SHN4-1SHN5-2SHN6-3SHN7-2
      Initial linear strength (Pa)2.0E61.7E61.3E61.7E61.6E6
      Standard deviation9.3E53.1E55.6E57.7E53.9E5
      p-value0.530.240.650.47
      Shear stress at breaking
      point (Pa)
      1.9E71.6E71.7E71.4E71.8E7
      Standard deviation5.7E62.5E63.5E64.3E68.1E5
      p-value0.390.570.270.61
    • The plant cell wall is the first physical barrier encountered by plant pathogens upon initiation of infection[39]. Since three of these AtSHN3-overexpressing plants (SHN5-2, SHN 6-3, and SHN7-2) have altered hemicellulose content in the cell wall biomass, we further investigated whether or not the SHN3 transgenic plants were more or less susceptible to a rust fungal pathogen. After inoculating both the transgenic lines and the wild-type control with Puccinia emaculata urediniospores, we found that all AtSHN3-overexpressing plants were more susceptible to rust than the HR8 control plants (Fig. 7).
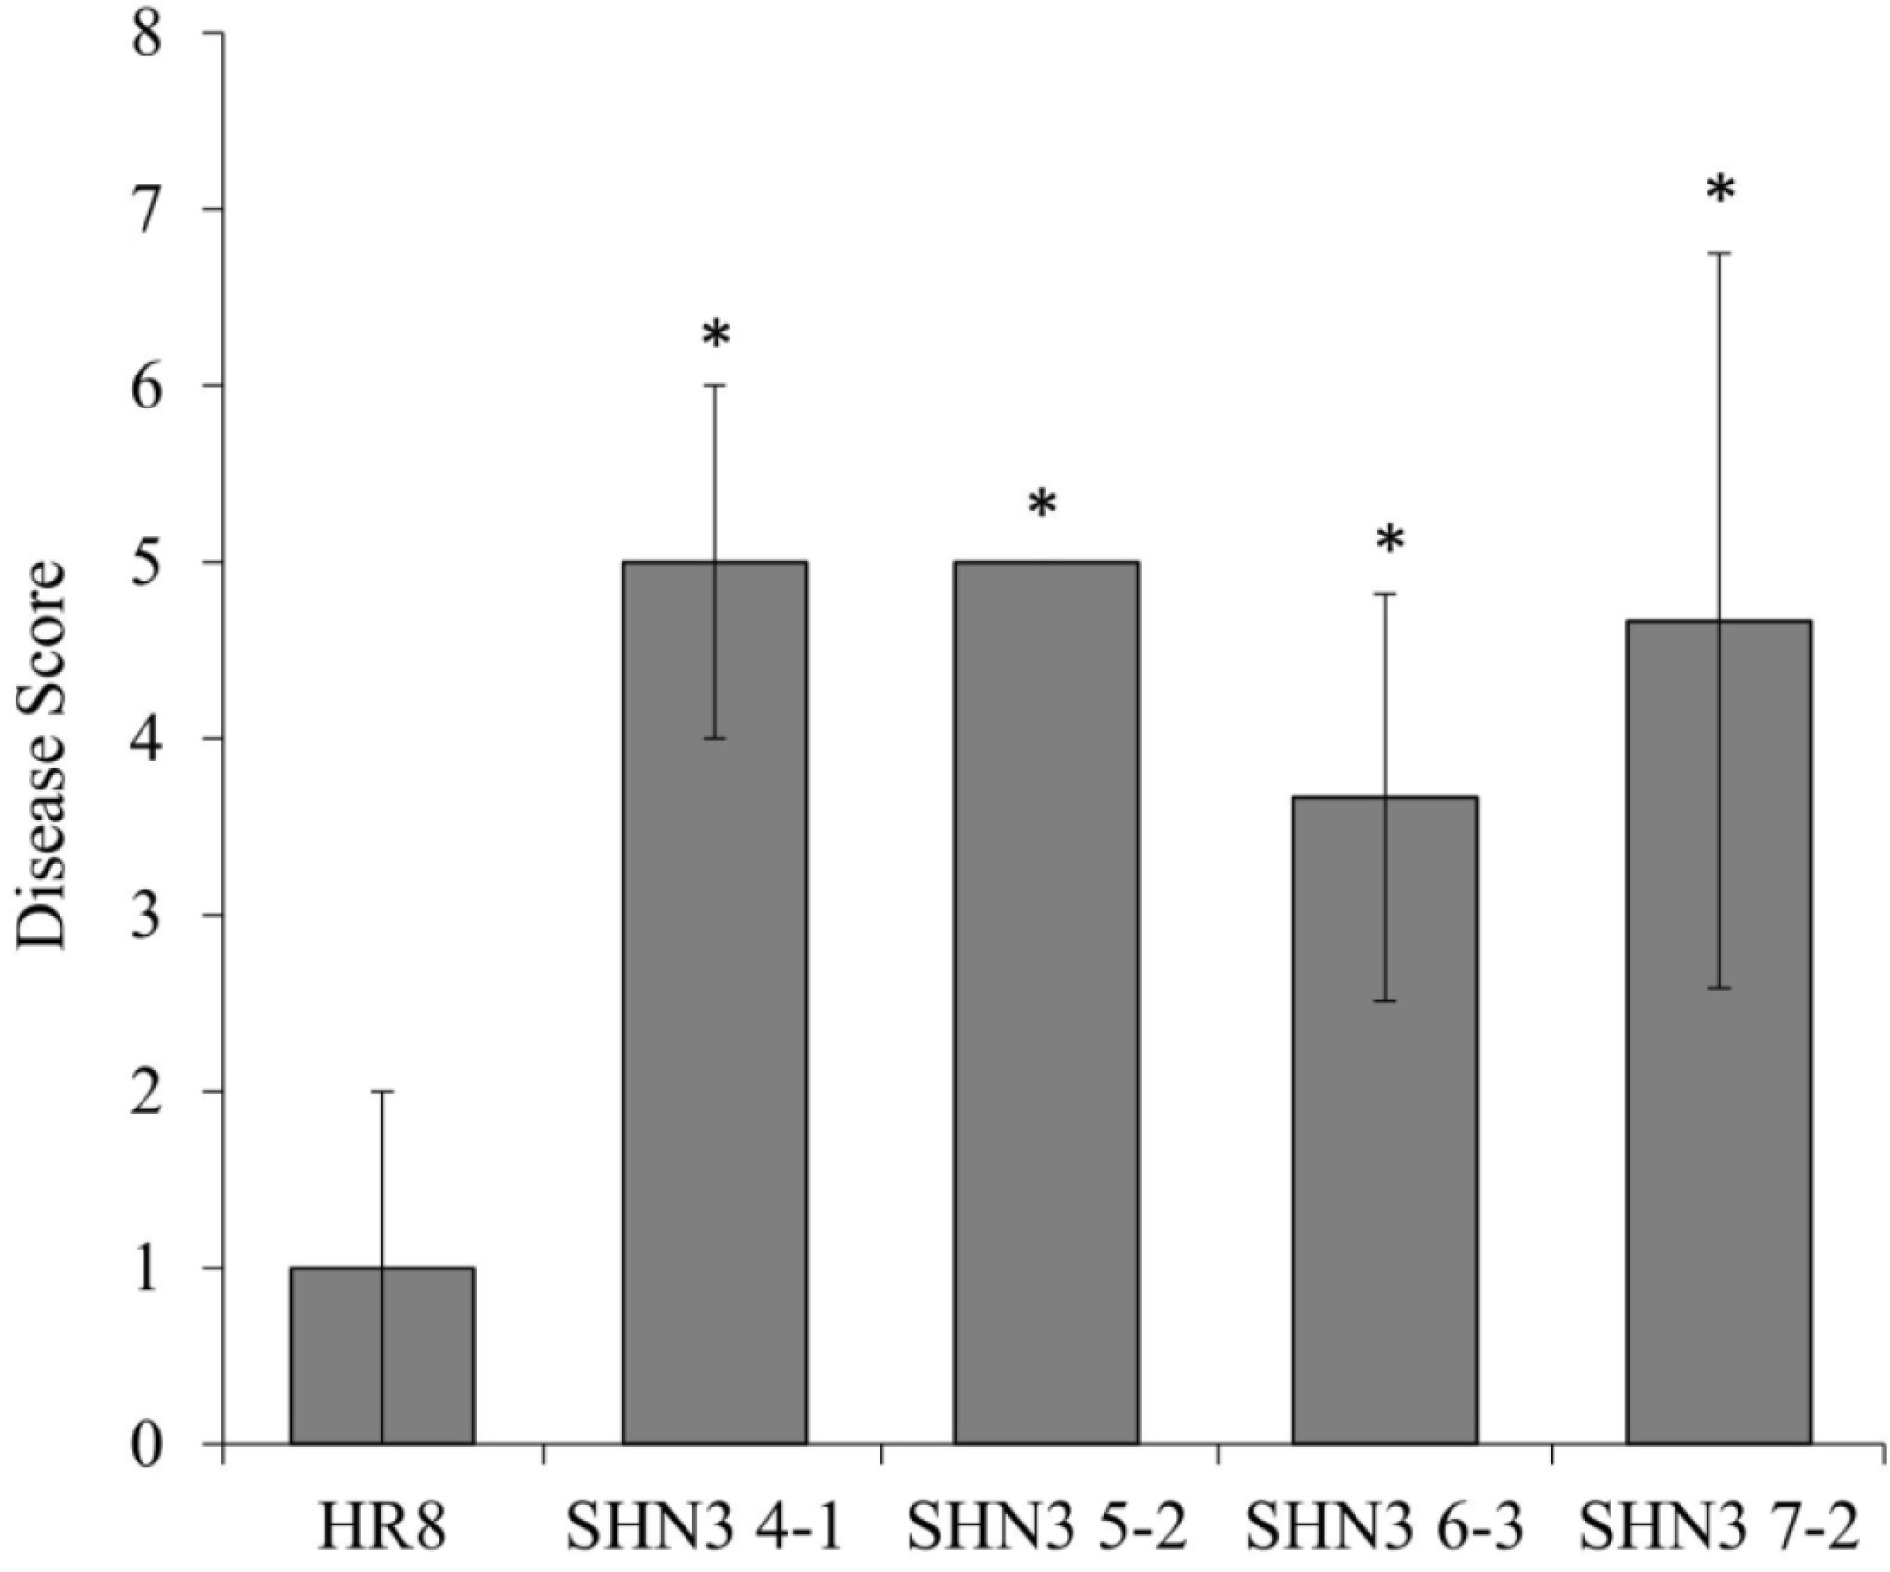
      Figure 7. 

      Switchgrass rust disease assays of AtSHN3-overexpressing transgenic switchgrass plants and wild-type control. * Indicates lines significantly different from the wild-type at p < 0.01. N = 3, the error bars are standard deviations.

    • Switchgrass is a promising bioenergy crop, and switchgrass cultivars that contain reduced levels of lignin and increased cellulose are desirable for cost-effective and efficient bioethanol production. It is possible to coordinate the activation and repression of these two cell wall components through genetic manipulation of specific master regulators[32]. A previous report suggests that the overexpression of Arabidopsis transcription factor AtSHN2 in rice could increase cellulose and decrease lignin contents of cell wall biomass[32]. AtSHN2 belongs to a small gene family with three members (AtSHN1, 2, and 3) that vary in their developmental and tissue-specific gene expression patterns[26]. AtSHN3 has the broadest expression pattern that is active in almost all plant organs[26]. Despite its proven role in wax accumulation, the other biological functions of AtSHN3 genes have not yet been explored. It is also unclear if AtSHN3, similar to AtSHN2, functions as a master regulator of lignin and cellulose biosynthesis in monocots.

      In this study, the Arabidopsis SHN3 cDNA was cloned and transformed into switchgrass. While others have reported a glossy phenotype of the leaf surface upon overexpression of SHN genes[26,40], this phenotype was not observed in any of the transgenic switchgrass plants created in this study. AtSHN3-overexpressing switchgrass plants, however, exhibited stunted growth in comparison to wild-type plants (Fig. 2). Transgenic tomato plants over-expressing SlSHN3, the tomato ortholog of AtSHN3, also displayed stunted growth[40]. Interestingly, the stunted growth phenotype of tomato plants was more severe in SlSHN3-overexpressing plants than in SlSHN1-overexpressing plants[41]. This suggests that while the SHN-family proteins may have similar functions, their tissue-specific expression patterns are essential for proper cell wall development.

      The SHN genes regulate wax deposition on both leaf and fruit cuticle surface[26,27]. In addition, members of the SHN family function in cell elongation and secondary cell wall thickening[27,32]. AtSHN2-overexpression can reduce lignin and increase cellulose in transgenic rice plants[32]. The overexpression of AtSHN3 in switchgrass stems might alter the lignin and cellulose contents based on the phloroglucinol and calcofluor staining (Fig. 4). However, the quantitive measurements of cellulose content did not reveal a statistically significant difference between the wild-type and transgenic plants (Fig. 5, Table 2). The phloroglucinol and calcofluor staining methods are relatively easy and cost-effective, but the data interpretation is more subjective, therefore, it is always valuable to obtain quantitative measurement as described in this study. In the future, it will be worthy to re-quantify the cellulose content by using more sample replicates that may reduce the experimental variations. Interestingly, the SHN7-2 plants possessed significantly more arabinose and xylose in their matrix polysaccharide compared to wild-type control plants (HR8). The SHN5-2 line, however, had a significant reduction in the amount of glucose present in its matrix polysaccharide, which is likely due to a reduction in amorphous cellulose or mixed linkage glucan. Further studies are needed to determine if the changes in the hemicellulose content in these lines result in enhanced bioethanol production.

      Changes in the cell wall compositions of plant stems could compromise the plant's ability to withstand extracellular forces associated with abiotic forces such as wind and rain that cause lodging. For instance, brittle stalk (bk2) mutants of maize contain less cellulose and more lignin, have compromised the mechanical strength of stems, and are easily broken with minimal applied force[42]. In this study, storage modulus and fracture tests were performed on transgenic and wild-type switchgrass lines to assess the stem stiffness and mechanical strength, respectively. These tests were recently developed and optimized for plant biology research[43]. Storage modulus tests can evaluate the stiffness of the stem by analyzing the % strain output as it correlates to a specific stress. Fracture tests utilize tensile-torsion force to apply stress to a sample, and the % strain is measured during the linear region and at the sample breaking point[43]. Our results suggest that there is no statistical difference in terms of stem stiffness and mechanical strength between the wild-type and transgenic plants (Tables 3 & 4). Therefore, the altered hemicellulose content in the AtSHN3 transgenic plants does not significantly reduce the stem stiffness and mechanical strength.

      Overexpression of SHN1 genes in transgenic Arabidopsis, tomato, and rice plants conferred greater tolerance to water restriction compared to wild-type plants[26,32,41]. This could be attributed to the accumulation of excess epicuticular waxes on the leaf surface, which contributes to the glossy leaf phenotype or to the reduced numbers of stomata in transgenic plants[41]. More studies will need to be conducted to determine if AtSHN3 can promote the accumulation of epicuticular waxes that may enhance drought tolerance in switchgrass.

      The first physical barrier that foliar pathogens encounter is the plant cell wall. Thus, we investigated if AtSHN3 over-expression affected the disease resistance response of switchgrass rust. All AtSHN3 transgenic switchgrass lines were significantly more susceptible to the rust pathogen than the wild-type controls (Fig. 7). Because there are no consistent patterns of the altered polysaccharide monomers in the AtSHN3 transgenic plants, the variation of polysaccharide monomers cannot explain the AtSHN3-mediated disease susceptibility. A previous report suggests that overexpression of SlSHN3 in tomato leaves allowed the leaves to uptake toluidine blue, suggesting that SlSHN3-overexpressing plants contained a more permeable cuticle than the wild-type[40]. It is possible that overexpression of AtSHN3 in switchgrass could also increase permeable cuticle, which might explain the disease susceptibility phenotype of the AtSHN3 transgenic plants. Thus, it will be worth measuring the permeable cuticle in the AtSHN3 transgenic plants in the future.

    • Although Arabidopsis AtSHN3 shares high homology with AtSHN2 and AtSHN1, overexpression of AtSHN3 in switchgrass does not significantly alter the stem lignin and cellulose contents in transgenic switchgrass. Therefore, AtSHN3 may not have a similar function as AtSHN1 and AtSHN2 when they are overexpressed in a monocot plant species. In the future, a comprehensive analysis of all three switchgrass-specific SHN members will be necessary to understand their biological roles in switchgrass.

    • A plasmid containing the AtSHN3 (TAIR accession: U51209, AT5G25390) cDNA was obtained from TAIR-ABRC. The AtSHN3 open reading frame was amplified using a 50 µl PCR reaction with the following components: 25 µl High-Fidelity iProof master mix (Bio-Rad, Hercules, CA, USA), 10 µl plasmid DNA, 10 µl ddH2O, 2.5 µl 10 µM forward primer (5'-CACCGAATTCATGGTACATTCGAAGAAGTTCC-3'), and 2.5 µL 10 µM reverse primer (5'-CGTCTGCAGGACCTGTGCAATGGATCCAGATC-3'). The PCR reaction was run with an initial denaturation step at 98 °C for 3 min, followed by 30 cycles of denaturation at 98 °C for 30 s, annealing at 57 °C for 45 s, and extension at 72 °C for 1 min, and then completed with a final extension at 72 °C for 7 min. Successful amplification of the PCR product was visualized using a 0.8% agarose gel, and the PCR product was purified using a QIAquick Gel Extraction kit (QIAGEN Sciences Inc, Germantown, MD, USA).

    • The purified AtSHN3 PCR product was cloned into the pENTR/D-TOPO vector (Invitrogen, Waltham, MA, USA). The AtSHN3 gene sequence was confirmed by DNA sequencing at the core facility at Virginia Tech. By using a Gateway LR® cloning kit (Invitrogen Inc), the AtSHN3 DNA fragment was subcloned into the pVT1629 destination vector that carries a maize Ubi10 promoter[16]. The final construct, pVT1629-AtSHN3, was conjugated into Agrobacterium tumefacient strain AGL1.

    • The method for Agrobacterium-mediated transformation of switchgrass followed that previously described[20,44]. In brief, mature seeds of the HR8 genotype of the switchgrass cv. Alamo was dehusked with 60% sulfuric acid and sterilized with 50% bleach. The sterilized seeds were transferred to callus induction mediums. After 4−6 weeks, embryogenic calli were subcultured onto the callus induction mediums containing 20 g·l−1 proline. Ten days before transformation, embryogenic calli were subcultured again onto callus induction mediums containing proline and 200 µM acetosyringone. After two rounds of culture on selection mediums, the actively growing calli were subcultured to regeneration mediums. Following regeneration and root formation, regenerated plantlets were transplanted into pots containing MiracleGro Moisture Control soil and maintained in a greenhouse at Virginia Tech.

    • In the middle of July 2015, individual E2 to E3 stage tillers from all transgenic SHN3 switchgrass lines, along with the HR8 control, were clonally propagated by splitting a single tiller and re-planted in gallon-size pots containing Miracle-Gro® Moisture Control potting mix. The plants were maintained in a greenhouse at a 16 h photoperiod with supplemental lighting used as needed. After three months of growth, the overall height, flag leaf length, flag leaf width, and I2 stem width of four R3 stage tillers were measured for three biological replicates of each transgenic line as well as the wild-type control. Finally, all plants were harvested at ground level and weighed to determine fresh biomass yield.

    • Leaves of putative transgenic and wild-type switchgrass plants were collected and immediately frozen in liquid nitrogen. Genomic DNA was extracted using a modified 2× CTAB protocol as previously described[45]. The quality and quantity of the DNA was assessed using agarose gels and a Nanodrop-D1000 (Nanodrop, Wilmington, DE, USA). The switchgrass DNA was then sent to Lofstrand Labs Ltd (Gaithersburg, MD, USA) for Southern blot analysis. Briefly, a total of 10 µg of genomic DNA was restriction enzyme digested with HindIII. DNA fragments were separated using gel electrophoresis and probed with a portion of the hygromycin selection gene to detect transgene insertion[16].

    • Flag leaves of R3 stage switchgrass tillers were collected from greenhouse-grown switchgrass plants and immediately frozen in liquid nitrogen. The tissue was stored at −80 °C until further analysis. Tissue samples were collected for three biological replicates of both the transgenic and wild-type plants. Total RNA was extracted using the TRIzol reagent (Invitrogen, Grand Island, NY, USA) according to the manufacturer's protocol. The quality and quantity of the RNA was assessed using a Nanodrop-D1000 (Nanodrop, Wilmington, DE, USA).

      The relative expression AtSHEN3 in transgenic plants was analyzed by qPCR with primers pPCRfor, 5'-TCTCTTGAAGAGAAGAGTGT-3', and qPCRrev, 5'-ACGGTGTCTGGTCTTTACAG-3'. The switchgrass ELF1a gene was used as the reference gene (5'-TCAGGATGTGTACAAGATTGGTG-3' and 5'-GCCTGTCAATCTTGGTAATAAGC-3'). First strand cDNA was synthesized using a DyNAmo cDNA synthesis kit (Thermo Fisher, Waltham, MA, USA). Quantitative Real Time-PCR (qPCR) was performed using an Applied Biosystems Power SYBR Green PCR Master Mix (Grand Island, NY, USA). The PCR reactions were performed on an Applied Biosystems 7300 Real-Time PCR machine with the following conditions: 1) an initial denaturation and enzyme activation step at 95 °C for 10 min and 2) 40 cycles of denaturation (95 °C for 30 s), annealing (60 °C for 30 s), and extension (72 °C for 1 min and 30 s). After the reactions had completed, the threshold was manually set to 3.0, and the data was exported for analysis.

    • The second internode (I2) of R3 stage tillers was selected for histochemical staining. I2 was characterized as the first full-length stem segment, located between the first and second distinguishable nodes, from the base of the plant. The I2 segments of transgenic and wild-type plants were cut into 40 µm sections using a microtome. The lignin and polysaccharide content of the transgenic switchgrass plants was visualized using Weisner (phloroglucinol) reactions and calcofluor staining, respectively. The protocols for these reactions were performed as previously described[46]. The Weisner stained stem sections were visualized using a Zeiss compound light microscope and the calcofluor stained stem sections were visualized using a fluorescence Zeiss AxioImager.M1 microscope mounted with a Zeiss AxioCam MRm (Carl Zeiss Microscopy Inc, Oberkochen, Germany).

    • I2 segments of R3 stage tillers for three biological replicates of each transgenic line, as well as the HR8 control, were dried in an oven at 48 °C and then ground into a coarse powder using a coffee grinder. Acid-soluble and insoluble lignin content were determined using the procedure established by the National Renewable Energy Laboratory[47]. In brief, 300 mg of ground switchgrass samples were added to a pressure tube along with 3 mL of 72% sulfuric acid to hydrolyze the tissue. The tubes were incubated at 30 °C for 1 h with manual stirring every 5 min. Following incubation, 84 mL of deionized water was added to each tube to dilute the sulfuric acid to a concentration of 4%. The tubes were then autoclaved at 121 °C for 1 h. Next, the tubes were cooled to room temperature, and the mixture was vacuum-filtered through a porcelain crucible. The filtrate, which contained the acid-soluble lignin, was collected and diluted to a volume sufficient to obtain a UV absorption value of 0.7−1.0 at 205 nm. The acid-insoluble reside, which remained in the porcelain crucible, was dried in an oven at 105 °C overnight and then weighed to determine the acid-insoluble lignin content.

    • A second set of I2 samples of R3 stage tillers for three biological replicates of control and transgenic plants were also dried in an oven at 48 °C. The samples were ground with a SPEX 2010 GenoGrinder (SPEX SamplePrep, Metuchen, NJ, USA) at 1,500 rpm. The fine powder was then made into alcohol insoluble residue (AIR) and de-starched as described previously[48]. The de-starched AIR was used for cellulose and hemicellulose assays. Hemicellulose monosaccharides were released by 4M TFA treatment for 2 h and then measured by HPLC. The pellets after TFA treatment were used for an anthrone cellulose assay as described previously[48]. Briefly, pellets were hydrolyzed by 72% sulfuric acid to release cellulosic glucose. The cellulosic glucose was quantified by a colorimetric reaction with an anthrone reagent and read on a plate reader at OD625nm.

    • Fresh I2 stem segments of R3 stage switchgrass tillers were subjected to solvent-submersion tensile-torsion analysis using an AR G2 rheometer (TA Instruments, New Castle, DE, USA). The I2 segments were cut into 2 cm long fragments and then split longitudinally into four different sections. The samples were then fully saturated with ethylene glycol and stored at room temperature for future analysis. On the day of analysis, the samples were secured with tension clamps using 15cNxm torque and 1N static tensile force.

      All of the testing steps were operated at a frequency of 0.5 Hz and a stress setting of 50,000 Pa. Storage modulus analysis, which is a reflection of stem stiffness, was conducted at room temperature by equilibrating the samples at 25 ºC for 5 min and then running the stress sweep. At least three observations were recorded for each sample type. Ultimate fracture tests of ethylene glycol saturated stem samples were conducted in tensile-torsion mode at room temperature. The specimens were clamped at both ends with slight tensile force (1N) to hold the sample vertically straight. Fracture tests were performed under continuous flow conditions with shear stress increasing from 1E5 Pa to 1E8 Pa. The tests were performed four times per sample. Data acquisition was performed in linear mode with a total collection time of 33 min and a total point set at 300. Tests were concluded once the specimens failed.

    • The AtSHN3-overexpressing transgenic lines and the HR8 control plant were clonally split into three biological replicates. Each biological replicate was planted in a pot containing MiracleGro Moisture Control soil and grown in the greenhouse under a 16 h photoperiod. Freshly collected Puccinia emaculata urediniospores were mixed 1:10 with talcum powder and hand inoculated on the first fully expanded leaf of E2 stage tillers. The plants were placed in a chamber with a humidifier and kept under 100% humidity for 16 h. Ten days post-inoculation, the severity of rust disease was scored according to the scale established by Gustafson et al.[49]

    • All statistical analyses were performed using Student's ANOVA-tests with a significance level of 0.01, chosen to compensate for multiple testing.

      • The project was supported by USDA-NIFA Grant Number 2011-67009-30133 (B. Zhao). The project was also partially supported by a Virginia Tech CALS integrative grant, a seed grant of the Institute for Critical Technology and Applied Science at Virginia Tech, and Virginia Agricultural Experiment Station (VA135872) to B. Zhao, and by a USDA South Central Sungrant to L. Bartley.

      • The authors declare that they have no conflict of interest.

      • Copyright: © 2023 by the author(s). Published by Maximum Academic Press, Fayetteville, GA. This article is an open access article distributed under Creative Commons Attribution License (CC BY 4.0), visit https://creativecommons.org/licenses/by/4.0/.
    Figure (7)  Table (4) References (49)
  • About this article
    Cite this article
    Frazier TP, Lin F, Wang G, Norris A, Toro C, et al. 2023. Overexpression of the Arabidopsis SHN3 transcription factor compromises the rust disease resistance of transgenic switchgrass plants. Grass Research 3:4 doi: 10.48130/GR-2023-0004
    Frazier TP, Lin F, Wang G, Norris A, Toro C, et al. 2023. Overexpression of the Arabidopsis SHN3 transcription factor compromises the rust disease resistance of transgenic switchgrass plants. Grass Research 3:4 doi: 10.48130/GR-2023-0004

Catalog

  • About this article

/

DownLoad:  Full-Size Img  PowerPoint
Return
Return