ARTICLE   Open Access    

Integrated analysis of transcriptome, small RNA, and phytohormonal content changes between Artemisia annua Linn. and Nicotiana benthamiana Domin in heterogeneous grafting

More Information
  • Grafting, one of the artificial propagation methods used in plants, is now widely used in flower breeding, vegetable cultivation and stress response research. In order to discover the reason for success of heterograft and information exchange mechanisms, we used Artemisia annua (Aa) as scion and Nicotiana benthamiana (Nb) as rootstock to build a grafting model. After grafting 30 days co-growth, 7,794 DEGs (different expression genes) and 8,214 DEGs were identified in Aa scion and Nb rootstock, respectively. Most of the DEGs belong to defense response and signal transduction in scion and substance metabolism in rootstock, which indicate that the diverging response mechansim of grafted parts. Fifty Nb genes and 20 Aa genes were detected in Aa scion and Nb rootstock, which were regarded as potentially active genes during the grafting process. The most abundant miRNAs are miR159 and miR166, which may be closely related to their conservation and physiological functions. Besides, miR159 and miR166 could quickly respond to internal change, therefore the two miRNAs should be considered as biomarkers of successful grafting models. And then, as simultaneously screened miRNAs, miR396 and miR6149 could be potential biomarker in Aa and Nb, respectively. Through the analysis of the miRNA-target gene network in differentially expressed miRNAs, transcription factor R2R3-MYB, bHLH, GRAS, GAMYB, SBP-box, MADS-box, IIS in scion and NF-Y in rootstock were regarded as key genes involved in growth and development of grafted plants. The content of ABA, JA, CK was calculated in grafted plants and showed its respective functions.
  • In a recent report on Latin America's next petroleum boom, The Economist refers to the current and future situation in oil producing countries in the region. In the case of Argentina, the increase in oil and gas output 'have led to an increase in production in Vaca Muerta, a mammoth field in Argentina's far west. It holds the world's second-largest shale gas deposits and its fourth-largest shale oil reserves… Rystad Energy expects shell-oil production in Argentina will more than double by the end of the decade, to over a million barrels per day'[1].

    Oil production in Argentina is currently dominated by three Patagonian areas: Neuquén, San Jorge, and Austral. Based on 2021 information, 49% of oil reserves of Argentina are located in Neuquén, whereas San Jorge has 46%. Neuquén is also the largest source of oil (57%) and gas (37%) in the country. According to 2018 data, conventional oil produced in Argentina amounts to 87%, whereas non-conventional, shale production represents 13%; however, non-conventional oil is increasing due to Vaca Muerta shale oil exploitation.

    This increase of production in the Patagonian fields requires the use of a large fluid storage capacity by means of vertical oil storage tanks having different sizes and configurations. Tanks are required to store not just oil but also water. The exploitation of nonconventional reservoirs, such as Vaca Muerta, involves massive water storage to carry out hydraulic stimulation in low-permeability fields, and for managing the return fluid and production water at different stages of the process (storage, treatment, and final disposal).

    Storage tanks in the oil industry are large steel structures; they may have different sizes, and also different shell configurations, such as vertical cylinders with a fixed roof or with a floating roof and opened at the top[2]. It is now clear that such oil infrastructure is vulnerable to accidents caused by extreme weather events[35].

    Data from emergencies occurring in oil fields shows that accidents due to regional winds, with wind speed between 150 and 240 km/h, may cause severe tank damage. Seismic activity in the region, on the other hand, is of less concern to tank designers in Patagonia.

    Damage and failure mechanisms of these tanks largely depend on tank size and configuration, and their structural response should be considered from the perspective of shell mechanics and their consequences. In a report on damage observed in tanks following hurricanes Katrina and Rita in 2005[6,7], several types of damage were identified. The most common damage initiation process is due to shell buckling[811], which may progress into plasticity at higher wind speeds. In open-top tanks, a floating roof does not properly slide on a buckled cylindrical shell, and this situation may lead to different failure mechanisms. Further, damage and loss of integrity have the potential to induce oil spills, with direct consequences of soil contamination and also of fire initiation.

    Concern about an emergency caused by such wind-induced hazards involves several stakeholders, because the consequences may affect the operation of oil plants, the local and regional economies, the safety of the population living in the area of a refinery or storage farm, and the environment[6]. In view of the importance of preserving the shell integrity and avoiding tank damage, there is a need to evaluate risk of existing tanks at a regional level, such as in the Neuquén and San Jorge areas. This information may help decision makers in adopting strategies (such as structural reinforcement of tanks to withstand expected wind loads) or post-event actions (like damaged infrastructure repair or replacement).

    The studies leading to the evaluation of risk in the oil infrastructure are known as vulnerability studies, and the most common techniques currently used are fragility curves[12]. These curves evaluate the probability of reaching or exceeding a given damage level as a function of a load parameter (such as wind speed in this case).

    Early studies in the field of fragility of tanks were published[13] from post-event earthquake damage observations. Studies based on computational simulation of tank behavior under seismic loads were reported[14]. The Federal Emergency Management Administration in the US developed fragility curves for tanks under seismic loads for regions in the United States, and more recently, this has been extended to hurricane and flood events in coastal areas[15]. Seismic fragility in Europe has been reviewed by Pitilakis et al.[16], in which general concepts of fragility are discussed. Bernier & Padgett[17] evaluated the failure of tanks due to hurricane Harvey using data from aerial images and government databases. Fragility curves were developed based on finite element analyses and damage of the tank population was identified in the Houston Ship Channel. Flood and wind due to hurricane Harvey were also considered[18] to develop fragility curves.

    Because fragility curves for tanks under wind depend on the wind source (either hurricane or regional winds), and the type and size of tanks identified in a region, fragility curves developed for one area are not possible to be directly used in other areas under very different inventory and wind conditions.

    This paper addresses problems of shell buckling and loss of integrity of open top tanks, with wind-girders and floating roof and it focuses on the development of fragility curves as a way to estimate damage states under a given wind pressure. The region of interest in this work covers the oil producing areas in Patagonia, Argentina. Damage of tanks under several wind pressures are evaluated by finite element analyses together with methodologies to evaluate the structural stability.

    The construction of fragility curves requires information from the following areas: First, an inventory of tanks to be included in the analysis; second, data about the loads in the region considered; third, data about structural damage, either observed or computed via modeling; and fourth, a statistical model that links damage and load/structure data. This section describes the main features of the tank population considered in the study.

    The construction of an inventory at a regional level is a very complex task, which is largely due to a lack of cooperation from oil companies to share information about their infrastructure. Thus, to understand the type of tanks in an oil producing region, one is left collecting a limited number of structural drawings and aerial photography. A detailed inventory of the Houston Ship Channel was carried out by Bernier et al.[19], who identified 390 floating roof tanks. An inventory for Puerto Rico[20] identified 82 floating roof tanks. Although both inventories used different methodologies and addressed very different tank populations, some common features were found in both cases.

    An alternative strategy to carry out fragility studies is to develop a database using a small number of tanks, for which a detailed structural behavior is investigated using finite element analysis. This is a time-consuming task, but it allows identification of buckling pressures, buckling modes, and shell plasticity. This information serves to build approximate fragility curves, and it can also be used to develop what are known as meta-models, which predict structural damage based on tank/load characteristics. Such meta-models take the form of equations that include the tank geometry and wind speed to estimate damage. Meta-models were used, for example, in the work of Kameshwar & Padgett[18].

    This work employs a simplified strategy, and addresses the first part of the procedure described above. The use of a limited number of tanks in a database, for which a finite element structural analysis is carried out. This leads to fragility curves based on a simplified tank population (reported in this work) and the development of a meta-model together with enhanced fragility results will be reported and compared in a future work.

    Partial information of tanks in the Patagonian region was obtained from government sources, and this was supplemented by aerial photography showing details of tank farms in the region. As a result of that, it was possible to establish ranges of tank dimensions from which an artificial database was constructed.

    The present study is restricted to open-top tanks with a wind girder at the top. They are assumed to have floating roofs, which are designed and fabricated to allow the normal operation of the roof without the need of human intervention. The main characteristics of tanks investigated in this paper, are illustrated in Fig. 1.

    Figure 1.  Geometric characteristics of open-topped oil storage considered in this paper.

    The range of interest in terms of tank diameter D was established between 35 m < D < 60 m. Based on observation of tanks in the region, the ratios D/H were found to be in the range 0.20 < D/H < 0.60, leading to cylinder height H in the range 12 m < H < 20 m. These tanks were next designed using API 650[21] regulations to compute their shell thickness and wind girder dimensions. A variable thickness was adopted in elevation, assuming 3 m height shell courses. The geometries considered are listed in Table 1, with a total of 30 tanks having combinations of five values of H and six values of D. The volume of these tanks range between 55,640 and 272,520 m3.

    Table 1.  Geometry and course thickness of 30 tanks considered in this work.
    H
    (m)
    CoursesThickness t (m)
    D = 35 mD = 40 mD = 45 mD = 50 mD = 55 mD = 60 m
    12V10.0140.0160.0180.0180.0200.022
    V20.0120.0120.0140.0160.0160.018
    V30.0080.0100.0100.0100.0120.012
    V40.0060.0080.0080.0080.0080.008
    14V10.0160.0180.0200.0220.0250.025
    V20.0140.0140.0160.0180.0200.020
    V30.0100.0120.0120.0140.0140.016
    V40.0080.0080.0080.0100.0100.010
    V50.0060.0080.0080.0080.0080.008
    16V10.0180.0200.0220.0250.0280.028
    V20.0160.0180.0180.0200.0220.025
    V30.0120.0140.0160.0160.0180.020
    V40.0100.0100.0120.0120.0140.014
    V50.0060.0080.0080.0080.0080.010
    V60.0060.0080.0080.0080.0080.010
    18V10.0200.0220.0250.0280.0300.032
    V20.0180.0200.0220.0250.0250.028
    V30.0140.0160.0180.0200.0200.022
    V40.0120.0120.0140.0160.0160.018
    V50.0080.0100.0100.0100.0120.012
    V60.0080.0100.0100.0100.0120.012
    20V10.0220.0250.0280.0300.0320.035
    V20.0200.0220.0250.0280.0280.032
    V30.0160.0180.0200.0220.0250.028
    V40.0140.0140.0160.0180.0200.020
    V50.0100.0120.0120.0140.0140.016
    V60.0100.0120.0120.0140.0140.016
    V70.0100.0120.0120.0140.0140.016
     | Show Table
    DownLoad: CSV

    The material assumed in the computations was A36 steel, with modulus of elasticity E = 201 GPa and Poisson's ratio ν = 0.3.

    For each tank, a ring stiffener was designed as established by API 650[21], in order to prevent buckling modes at the top of the tank. The minimum modulus Z to avoid ovalization at the top of the tank is given by

    Z=D2H17(V190)2 (1)

    where V is the wind speed, in this case taken as V = 172.8 km/h for the Patagonian region. Intermediate ring stiffeners were not observed in oil tanks in Patagonia, so they were not included in the present inventory.

    Because a large number of tanks need to be investigated in fragility studies, it is customary to accept some simplifications in modeling the structure to reduce the computational effort. The geometry of a typical ring stiffener at the top is shown in Fig. 2a, as designed by API 650. A simplified version was included in this research in the finite element model, in which the ring stiffener is replaced by an equivalent thickness at the top, as suggested in API Standard 650[21]. This approach has been followed by most researchers in the field. The equivalent model is shown in Fig. 2b.

    Figure 2.  Ring stiffener, (a) design according to API 650, (b) equivalent section[22].

    The pressure distribution due to wind around a short cylindrical shell has been investigated in the past using wind tunnels and computational fluid dynamics, and a summary of results has been included in design regulations.

    There is a vast number of investigations on the pressures in storage tanks due to wind, even if one is limited to isolated tanks, as in the present paper. For a summary of results, see, for example, Godoy[11], and only a couple of studies are mentioned here to illustrate the type of research carried out in various countries. Wind tunnel tests were performed in Australia[23], which have been the basis of most subsequent studies. Recent tests in Japan on small scale open top tanks were reported[24,25]. In China, Lin & Zhao[26] reported tests on fixed roof tanks. CFD models, on the other hand, were computed[27] for open top tanks with an internal floating roof under wind flow. Although there are differences between pressures obtained in different wind tunnels, the results show an overall agreement.

    The largest positive pressures occur in the windward meridian covering an angle between 30° and 45° from windward. Negative pressures (suction), on the other hand, reach a maximum at meridians located between 80° and 90° from windward. An evaluation of US and European design recommendations has been reported[28,29], who also considered the influence of fuel stored in the tank.

    The circumferential variation of pressures is usually written in terms of a cosine Fourier series. The present authors adopted the series coefficients proposed by ASCE regulations[30], following the analytical expression:

    q=λinCicos(iφ) (2)

    in which λ is the amplification factor; the angle φ is measured from the windward meridian; and coefficients Ci represent the contribution of each term in the series. The following coefficients were adopted in this work (ASCE): C0 = −0.2765, C1 = 0.3419, C2 = 0.5418, C3 = 0.3872, C4 = 0.0525, C5 = 0.0771, C6 = −0.0039 and C7 = 0.0341. For short tanks, such as those considered in this paper, previous research reported[31] that for D/H = 0.5 the variation of the pressure coefficients in elevation is small and may be neglected to simplify computations. Thus, the present work assumes a uniform pressure distribution in elevation at each shell meridian.

    In fragility studies, wind speed, rather than wind pressures, are considered, so that the following relation from ASCE is adopted in this work:

    qz=0.613KztKdV2IV=qz0.613KztKdI (3)

    in which I is the importance factor; Kd is the directionality factor; and Kzt is the topographic factor. Values of I = 1.15, Kd = 0.95 and Kzt = 1, were adopted for the computations reported in this paper.

    Because shell buckling was primarily investigated in this work using a bifurcation analysis, the scalar λ was increased in the analysis until the finite element analysis detected a singularity.

    Fragility curves are functions that describe the probability of failure of a structural system (oil tanks in the present case) for a range of loads (wind pressures) to which the system could be exposed. In cases with low uncertainty in the structural capacity and acting loads, fragility curves take the form of a step-function showing a sudden jump (see Fig. 3a). Zero probability occurs before the jump and probability equals to one is assumed after the jump. But in most cases, in which there is uncertainty about the structural capacity to withstand the load, fragility curves form an 'S' shape, as shown in Fig. 3a and b probabilistic study is required to evaluate fragility.

    Figure 3.  Examples of fragility curves, (a) step-function, (b) 'S' shape function.

    The construction of fragility curves is often achieved by use of a log-normal distribution. In this case, the probability of reaching a certain damage level is obtained by use of an exponential function applied to a variable having a normal distribution with mean value μ and standard deviation σ. If a variable x follows a log-normal distribution, then the variable log(x) has a normal distribution, with the following properties:

    • For x < 0, a probability equal to 0 is assigned. Thus, the probability of failure for this range is zero.

    • It can be used for variables that are computed by means of a number of random variables.

    • The expected value in a log-normal distribution is higher than its mean value, thus assigning more importance to large values of failure rates than would be obtained in a normal distribution.

    The probability density function for a log-normal distribution may be written in the form[32]:

    f(xi)=12πσ21xexp[(lnxµ)2/(2σ2)] (4)

    in which f(xi) depends on the load level considered, and is evaluated for a range of interest of variable x; and μ* is the mean value of the logarithm of variable x associated with each damage level. Damage levels xi are given by Eqn (5).

    µ(xi)=1NNn=1ln(xin) (5)

    where the mean value is computed for a damage level xi, corresponding to I = DSi; summation in n extends to the number of tanks considered in the computation of the mean value. Damage levels in this work are evaluated using computational modeling and are defined in the next section. Variance is the discrete variable xi 2), computed from:

    σ2(xi,µ)=1NNn=1(ln(xin)µ)2=1NNn=1ln(xin)2µ2 (6)

    The probability of reaching or exceeding a damage level DSi is computed by the integral of the density function using Eqn (7), for a load level considered (the wind speed in this case):

    P[DS/x]=x=V0x=0f(x)dx (7)

    where V0 is the wind speed at which computations are carried out, and x is represented by wind speed V.

    Various forms of structural damage may occur as a consequence of wind loads, including elastic or plastic deflections, causing deviations from the initial perfect geometry; crack initiation or crack extension; localized or extended plastic material behavior; and structural collapse under extreme conditions. For the tanks considered in this work, there are also operational consequences of structural damage, such as blocking of a floating roof due to buckling under wind loads that are much lower than the collapse load. For this reason, a damage study is interested in several structural consequences but also in questions of normal operation of the infrastructure. Several authors pointed out that there is no direct relation between structural damage and economic losses caused by an interruption of normal operation of the infrastructure.

    Types of damage are usually identified through reconnaissance post-event missions, for example following Hurricanes Katrina and Rita[6,7]. Damage states reported in Godoy[7] include shell buckling, roof buckling, loss of thermal insulation, tank displacement as a rigid body, and failure of tank/pipe connections. These are qualitative studies, in which damage states previously reported in other events are identified and new damage mechanisms are of great interest in order to understand damage and failure modes not taken into account by current design codes.

    In this work, in which interest is restricted to open top tanks having a wind girder at the top, four damage states were explored, as shown in Table 2. Regarding the loss of functionality of a tank, several conditions may occur: (1) No consequences for the normal operation of a tank; (2) Partial loss of operation capacity; (3) Complete loss of operation.

    Table 2.  Damage states under wind for open-top tanks with a wind girder.
    Damage states (DS)Description
    DS0No damage
    DS1Large deflections on the cylindrical shell
    DS2Buckling of the cylindrical shell
    DS3Large deflections on the stiffening ring
     | Show Table
    DownLoad: CSV

    DS1 involves displacements in some area of the cylindrical body of the tank, and this may block the free vertical displacement of the floating roof. Notice that this part of the tank operation is vital to prevent the accumulation of inflammable gases on top of the fluid stored. Blocking of the floating roof may cause a separation between the fuel and the floating roof, which in turn may be the initial cause of fire or explosion.

    DS2 is associated with large shell deflections, which may cause failure of pipe/tank connections. High local stresses may also arise in the support of helicoidal ladders or inspection doors, with the possibility of having oil spills.

    DS3 is identified for a loss of circularity of the wind girder. The consequences include new deflections being transferred to the cylindrical shell in the form of geometrical imperfections.

    In summary, DS1 and DS3 may affect the normal operation of a floating roof due to large shell or wind-girder deflections caused by buckling.

    Tank modeling was carried out in this work using a finite element discretization within the ABAQUS environment[33] using rectangular elements with quadratic interpolation functions and reduced integration (S8R5 in the ABAQUS nomenclature). Two types of shell analysis were performed: Linear Bifurcation Analysis (LBA), and Geometrically Nonlinear Analysis with Imperfections (GNIA). The tank perimeter was divided into equal 0.35 m segments, leading to between 315 and 550 elements around the circumference, depending on tank size. Convergence studies were performed and errors in LBA eigenvalues were found to be lower than 0.1%.

    The aim of an LBA study is to identify a first critical buckling state and buckling mode by means of an eigenvalue problem. The following expression is employed:

    (K0+λCKG)ΦC=0 (8)

    where K0 is the linear stiffness matrix of the system; KG is the load-geometry matrix, which includes the non-linear terms of the kinematic relations; λC is the eigenvalue (buckling load); and ΦC is the critical mode (eigenvector). For a reference wind state, λ is a scalar parameter. One of the consequences of shell buckling is that geometric deviations from a perfect geometry are introduced in the shell, so that, due to imperfection sensitivity, there is a reduced shell capacity for any future events.

    The aim of the GNIA study is to follow a static (non-linear) equilibrium path for increasing load levels. The GNIA study is implemented in this work using the Riks method[34,35], which can follow paths in which the load or the displacement decrease. The geometric imperfection was assumed with the shape of the first eigenvector at the critical state in the LBA study, and the amplitude of the imperfection was defined by means of a scalar ξ [10]. To illustrate this amplitude, for a tank with D = 45 m and H = 12 m, the amplitude of imperfection is equal to half the minimum shell thickness (ξ = 4 mm in this case).

    It was assumed that a damage level DS1 is reached when the displacement amplitudes do not allow the free vertical displacement of the floating roof. Based on information from tanks in the Patagonian region, the limit displacement was taken as 10 mm. This state was detected by GNIA, and the associated load level is identified as λ = λDS1.

    The load at which damage state DS2 occurs was obtained by LBA, leading to a critical load factor λC and a buckling mode. An example of damage levels is shown in Fig. 4.

    Figure 4.  Damage computed for a tank with D = 45 m and H = 12 m. (a) Deflected shape for damage DS1; (b) Equilibrium path for node A (DS1); (c) Deflected shape for damage DS2 (critical mode).

    An LBA study does not account for geometric imperfections. It is well known that the elastic buckling of shells is sensitive to imperfections, so that a reduction in the order of 20% should be expected for cylindrical shells under lateral pressure. This consideration allows to estimate DS0 (a state without damage) as a lower bound of the LBA study. An approach to establish lower bounds for steel storage tanks is the Reduced Stiffness Method (RSM)[3640]. Results for tanks using the RSM to estimate safe loads show that λDS0 = 0.5λDS2 provides a conservative estimate for present purposes.

    DS3 was computed using a linear elastic analysis to evaluate the wind pressure at which a 10 mm displacement of the wind girder is obtained.

    In a similar study for tanks with a fixed conical roof, Muñoz et al.[41] estimated a collapse load based on plastic behavior. However, in the present case the top ring has a significant stiffness, and this leads to extremely high wind speeds before reaching collapse (higher than 500 km/h). For this reason, the most severe damage level considered here was that of excessive out-of-plane displacements of the wind girder, and not shell collapse.

    The methodology to construct fragility curves has been presented by several authors[42,43]. The following procedure was adapted here[44]: (1) Establish qualitative damage categories (Table 2). (2) Compute a data base for different tanks, using LBA and GNIA. In each case, the damage category based on step (1) was identified (Table 3). (3) Approximate data obtained from step (2) using a log-normal distribution. (4) Plot the probabilities computed in step (3) with respect to wind speed x.

    Table 3.  Wind speed for each tank considered reaching a damage level.
    HDIDDS0DS1DS2DS3
    H12D351137.76162.06194.82336.02
    D402160.62181.31227.16360.73
    D453153.32174.19216.82374.04
    D504145.23165.27205.39373.76
    D555152.76180.83216.03374.75
    D606145.11170.75205.22370.98
    H14D357145.57162.05205.87295.03
    D408148.55166.20210.08311.24
    D459136.42153.72192.92334.54
    D5010155.36177.51219.71339.86
    D5511145.24165.34205.39343,17
    D6012141.89167.26200.67338.77
    H16D3513131.32161.94185.71262.20
    D4014146.95163.99207.82277.08
    D4515150.58170.90212.95293.37
    D5016138.97161.05196.54303.62
    D5517138.51174.17195.88313.97
    D6018156.34182.78221.10326.83
    H18D3519146.80160.79207.60223.18
    D4020159.01177.71224.87243.63
    D4521157.10179.51222.17265.32
    D5022152.54172.17215.72293.32
    D5523164.93188.10233.25305.94
    D6024163.69180.32231.49315.63
    H20D3525163.64199.59231.42195.03
    D4026171.24195.14242.18216.47
    D4527171.58203.68242.64293.32
    D5028182.46209.43258.03259.41
    D5529178.95208.23253.07272.48
    D6030174.47196.11246.74290.86
     | Show Table
    DownLoad: CSV

    Wind speeds for each tank, obtained via Eqn (3), are shown in Table 3 for the pressure level associated with each damage level DSi. A scalar ID was included in the table to identify each tank of the population in the random selection process. Wind speed was also taken as a random variable, so that wind speed in the range between 130 and 350 km/h have been considered at 5 km/h increase, with intervals of −2.5 and +2.5 km/h.

    Out of the 30-tank population considered, a sample of 15 tanks were chosen at random and were subjected to random wind forces. The random algorithm allowed for the same tank geometry to be chosen more than once as part of the sample.

    The type of damage obtained in each case for wind speed lower or equal to the upper bound of the interval were identified. Table 4 shows a random selection of tanks, together with the wind speed required to reach each damage level. For example, for a wind speed of 165 km/h, the wind interval is [162.5 km/h, 167.5 km/h]. This allows computation of a damage matrix (shown in Table 5). A value 1 indicates that a damage level was reached, whereas a value 0 shows that a damage level was not reached. In this example, 13 tanks reached DS0; six tanks reached DS1; and there were no tanks reaching DS2 or DS3. The ratio between the number of tanks with a given damage DSi and the total number of tanks selected is h, the relative accumulated frequency. The process was repeated for each wind speed and tank selection considered.

    Table 4.  Random tank selection for V = 165 km/h, assuming wind interval [162.5 km/h, 167.5 km/h].
    IDDS0DS1DS2DS3
    11145.2165.3205.4343.2
    6145.1170.7205.2371.0
    3153.3174.2216.8374.0
    9136.4153.7192.9334.5
    28182.5209.4258.0259.4
    22152.5172.2215.7293.3
    13131.3161.9185.7262.2
    19146.8160.8207.6223.2
    3153.3174.2216.8374.0
    12141.9167.3200.7338.8
    30174.5196.1246.7290.9
    23164.9188.1233.2305.9
    2160.6181.3227.2360.7
    17138.5174.2195.9314.0
    11145.2165.3205.4343.2
     | Show Table
    DownLoad: CSV
    Table 5.  Damage matrix for random tank selection (V = 165 km/h), assuming wind interval [162.5 km/h, 167.5 km/h].
    DS0DS1DS2DS3
    1100
    1000
    1000
    1100
    0000
    1000
    1100
    1100
    1000
    1100
    0000
    1000
    1000
    1000
    1100
    Total13600
    hi0.870.400
     | Show Table
    DownLoad: CSV

    Table 6 shows the evaluation of the fragility curve for damage level DS0. This requires obtaining the number of tanks for each wind speed (fi), the cumulative number as wind speed is increased (Fi), and the frequency with respect to the total number of the sample of 15 tanks is written on the right-hand side of Table 6, for relative frequency (hi) and accumulated frequency (Hi).

    Table 6.  Damage DS0: Wind speed intervals [km/h] shown on the left; logarithm of wind speed; and relative and absolute frequencies (shown on the right).
    V inf
    (km/h)
    V m
    (km/h)
    V sup
    (km/h)
    Ln
    (Vm)
    fiFihiHi
    127.5130132.54.87000.0000
    132.5135137.54.91220.1330.133
    137.5140142.54.94130.0670.200
    142.5145147.54.98360.2000.400
    147.5150152.55.01170.0670.467
    152.5155157.55.044110.2670.733
    157.5160162.55.080110.0000.733
    162.5165167.55.112130.1330.867
    167.5170172.55.140130.0000.867
    172.5175177.55.160130.0000.867
    177.5180182.55.192150.1331.000
     | Show Table
    DownLoad: CSV

    With the values of mean and deviation computed with Eqns (5) & (6), it is possible to establish the log normal distribution of variable V for damage level DS0, usually denoted as P[DS0/V]. Values obtained in discrete form and the log-normal distribution are shown in Fig. 5a for DS0. For the selection shown in Table 6, the media is μ* = 5.03 and the deviation is σ = 0.09.

    Figure 5.  Probability of reaching a damage level P[DSi/V], (a) DS0, (b) DS0, DS1, DS2 and DS3.

    The process is repeated for each damage level to obtain fragility curves for DS1, DS2, and DS3 (Fig. 5b). Notice that the wind speeds required to reach DS3 are much higher than those obtained for the other damage levels. Such values should be compared with the regional wind speeds in Patagonia, and this is done in the next section.

    The oil producing regions in Argentina having the largest oil reserves are the Neuquén and the San Jorge regions, both located in Patagonia. This needs to be placed side by side with wind loads to understand the risk associated with such oil production.

    Figure 6 shows the geographical location of these regions. The Neuquén region includes large areas of four provinces in Argentina (Neuquén, south of Mendoza, west of La Pampa, and Río Negro). The San Jorge region is in the central Patagonia area, including two provinces (south of Chubut, north of Santa Cruz). Another area is the Austral region covering part of a Patagonian province (Santa Cruz).

    Figure 6.  Oil producing regions in Argentina. (Adapted from IAPG[47]).

    A map of basic wind speed for Argentina is available in the Argentinian code CIRSOC 102[45], which is shown in Fig. 7. Notice that the highest wind speeds are found in Patagonia, and affect the oil-producing regions mentioned in this work. For the Neuquén region, wind speeds range from 42 to 48 m/s (151.2 to 172.8 km/h), whereas for San Jorge Gulf region they range between 52 and 66 m/s (187.2 and 237.6 km/h).

    Figure 7.  Wind speed map of Argentina. (Adapted from CIRSOC 102[45]).

    The wind values provided by CIRSOC 102[45] were next used to estimate potential shell damage due to wind. Considering the fragility curves presented in Fig. 4, for damage levels DS0, DS1, DS2 and DS3 based on a log-normal distribution, it may be seen that it would be possible to have some form of damage in tanks located in almost any region of Argentina because CIRSOC specifies wind speeds higher than 36 m/s (129.6 km/h). The fragility curve DS0 represents the onset of damage for wind speeds higher than 130 km/h, so that only winds lower than that would not cause tank damage.

    Based on the fragility curves shown in Fig. 8, it is possible to estimate probable damage levels for the wind speed defined by CIRSOC. Because design winds in Patagonia are higher than 165.6 km/h (46 m/s), it is possible to conclude that there is 81% probability to reach DS0 and 25% to reach DS1.

    Figure 8.  Probability P[DSi/V] to reach damage levels DS1, DS2 and DS3 in tanks located in the Patagonia region of Argentina.

    For the geographical area of the Neuquén region in Fig. 6, together with the wind map of Fig. 7, the expected winds range from 150 to 172.8 km/h (42 to 48 m/s). Such wind range is associated with a DS0 probability between 41% and 92%, whereas the DS1 probability is in the order of 48%.

    A similar analysis was carried out for the San Jorge region, in which winds between 187.2 and 237 km/h (52 and 66 m/s). The probability of reaching DS1 is 87%, and the probability of DS2 is 88%. Wind girder damage DS3 could only occur in this region, with a lower probability of 18%.

    This work focuses on open top tanks having a floating roof, and explores the probability of reaching damage levels for wind loads, using the methodology of fragility curves. A population of 30 tanks was defined with H/D ratios between 0.2 and 0.6; such aspect ratios were found to be the most common in the oil producing regions of Patagonia. The data employed assumed diameters D between 35 and 60 m, together with height between 12 and 20 m. The tanks were designed using current API 650 regulations which are used in the region, in order to define the shell thickness and wind girder. All tanks were assumed to be empty, which is the worst condition for shell stability because a fluid stored in a tank has a stabilizing effect and causes the buckling load to be higher.

    Both structural damage (shell buckling) and operational damage (blocking of the floating roof due to deflections of the cylindrical shell) were considered in the analysis. The qualitative definition of damage levels in this work was as follows: The condition of no damage was obtained from a lower bound of buckling loads. This accounts for geometric imperfections and mode coupling of the shell. Shell buckling was evaluated using linear bifurcation analysis to identify damage level DS2. A geometrically non-linear analysis with imperfections was used to identify deflection levels that would block a floating roof, a damage level identified as DS1. Finally, deflections in the wind girder were investigated using a linear elastic analysis to define damage DS3.

    The present results were compared with the wind conditions of Patagonia, to show that several damage levels may occur as a consequence of wind speeds higher than 130 km/h, which is the expected base value identified for the region. The most frequent expected damage is due to the loss of vertical displacements of the floating roof due to large displacements in the cylindrical shell of the tank, and this may occur for wind speed up to 200 km/h. Damage caused by shell buckling may occur for wind speeds higher than 190 km/h, and for that wind speed, further damage due to displacements in the wind girder may also occur, but with a lower probability. This latter damage form requires much higher wind speed to reach a probability of 20%, and would be more representative of regions subjected to hurricanes.

    The number of tanks considered in the present analysis was relatively low, mainly because the aim of this work was to collect data to build a meta-model, i.e. a simple model that may estimate damage based on shell and load characteristics[46]. In future work, the authors expect to develop and apply such meta-models to a larger number of tank/wind configurations, in order to obtain more reliable fragility curves.

    Fragility studies for an oil producing region, like those reported in this work, may be important to several stakeholders in this problem. The fragility information links wind speed levels to expected infrastructure damage, and may be of great use to government agencies, engineering companies, and society at large, regarding the risk associated with regional oil facilities. At a government level, this helps decision makers in allocating funding to address potential oil-related emergencies cause by wind. This can also serve as a guide to develop further modifications of design codes relevant to the oil infrastructure. The engineering consequences may emphasize the need to strengthen the present regional infrastructure to reduce risk of structural damage and its consequences. The impact of damage in the oil infrastructure on society was illustrated in the case of Hurricane Katrina in 2005, in which a large number of residents had to be relocated due to the conditions created by the consequences of infrastructure failure.

    The authors confirm contribution to the paper as follows: study conception and design: Jaca RC, Godoy LA; data collection: Grill J, Pareti N; analysis and interpretation of results: Jaca RC, Bramardi S, Godoy LA; draft manuscript preparation: Jaca RC, Godoy LA. All authors reviewed the results and approved the final version of the manuscript.

    All data generated or analyzed during this study are included in this published article.

    The authors are thankful for the support of a grant received from the National Agency for the Promotion of Research, Technological Development and Innovation of Argentina and the YPF Foundation. Luis A. Godoy thanks Prof. Ali Saffar (University of Puerto Rico at Mayaguez) for introducing him to the field of fragility studies.

  • The authors declare that they have no conflict of interest.

  • Supplemental Fig. S1 Flow chart of experimental analysis in Aa/Nb graft model.
    Supplemental Fig. S2 (a) Annotated GO terms and KEGG pathway enrichment analysis of 7794 DEGS in A. annua scion (b) Annotated GO terms among 50 mobile N. benthamiana genes detected in A. annua scion. Red, bule, and green color represents biological process, cellular component, molecular function, respectively. The ordinate showed the Go serial number and function. The horizontal ordinate represents the number of genes in each Go term category. GO enrichment bar plot in upper left corner inflected the number and distribution of genes with significant differences located in biological process, cellular component and molecular function. The top25, top15, top 10 were orderly chosen for drawing the part of GO bar plot. In upper right corner, the x-coordinate rich factor means the number of differential genes or total number located in corresponding GO, ordinate is the GO functional annotation. Similarly, the KEGG photos in the bottom part included KEGG difference analysis of the system level (left) and the number of DEGs in top20 of KEGG pathway (right).
    Supplemental Fig. S3 (a) Annotated GO terms and KEGG pathway enrichment analysis of 8214 DEGS in N. benthamiana rootstock. (b) Annotated GO terms among 20 mobile A. annua genes detected in N. benthamiana rootstock.
  • [1]

    Liu Y. 2006. Historical and modern genetics of plant graft hybridization. Advances in Genetics 56:101−29

    doi: 10.1016/S0065-2660(06)56003-1

    CrossRef   Google Scholar

    [2]

    Cookson SJ, Clemente Moreno MJ, Hevin C, Nyamba Mendome LZ, Delrot S, et al. 2013. Graft union formation in grapevine induces transcriptional changes related to cell wall modification, wounding, hormone signalling, and secondary metabolism. Journal of Experimental Botany 64(10):2997−3008

    doi: 10.1093/jxb/ert144

    CrossRef   Google Scholar

    [3]

    Wada M, Nishitani C, Komori S. 2020. Stable and efficient transformation of apple. Plant Biotechnol 37:163−70

    doi: 10.5511/plantbiotechnology.20.0602a

    CrossRef   Google Scholar

    [4]

    Bisognin C, Schneider B, Salm H, Grando MS, Jarausch W, et al. 2008. Apple proliferation resistance in apomictic rootstocks and its relationship to phytoplasma concentration and simple sequence repeat genotypes. Phytopathology 98:153−58

    doi: 10.1094/PHYTO-98-2-0153

    CrossRef   Google Scholar

    [5]

    Expósito A, Pujolà M, Achaerandio I, Giné A, Escudero N, et al. 2020. Tomato and melon Meloidogyne resistant rootstocks improve crop yield but melon fruit quality is influenced by the cropping season. Frontiers in Plant Science 11:560024

    doi: 10.3389/fpls.2020.560024

    CrossRef   Google Scholar

    [6]

    Xu Q, Guo S, Li L, An Y, Shu S, et al. 2016. Proteomics analysis of compatibility and incompatibility in grafted cucumber seedlings. Plant Physiology and Biochemistry 105:21−28

    doi: 10.1016/j.plaphy.2016.04.001

    CrossRef   Google Scholar

    [7]

    Goldschmidt EE. 2014. Plant grafting: new mechanisms, evolutionary implications. Frontiers in Plant Science 5:727

    doi: 10.3389/fpls.2014.00727

    CrossRef   Google Scholar

    [8]

    Chen Z, Zhao J, Hu F, Qin Y, Wang X, et al. 2017. Transcriptome changes between compatible and incompatible graft combination of Litchi chinensis by digital gene expression profile. Scientific Reports 7:3954

    doi: 10.1038/s41598-017-04328-x

    CrossRef   Google Scholar

    [9]

    Loupit G, Cookson SJ. 2020. Identifying molecular markers of successful graft union formation and compatibility. Frontiers in Plant Science 11:610352

    doi: 10.3389/fpls.2020.610352

    CrossRef   Google Scholar

    [10]

    Ribeiro LM, Nery LA, Vieira LM, Mercadante-Simões MO. 2015. Histological study of micrografting in passionfruit. Plant Cell, Tissue and Organ Culture 123:173−81

    doi: 10.1007/s11240-015-0824-1

    CrossRef   Google Scholar

    [11]

    Yin H, Yan B, Sun J, Jia P, Zhang Z, et al. 2012. Graft-union development: a delicate process that involves cell–cell communication between scion and stock for local auxin accumulation. Journal of Experimental Botany 63:4219−32

    doi: 10.1093/jxb/ers109

    CrossRef   Google Scholar

    [12]

    Wang J, Jiang L, Wu R. 2017. Plant grafting: how genetic exchange promotes vascular reconnection. New Phytologist 214:56−65

    doi: 10.1111/nph.14383

    CrossRef   Google Scholar

    [13]

    Xia C, Zheng Y, Huang J, Fei Z, Zhang C. 2019. Identification of phloem mobile mRNAs using the Solanaceae heterograft system. In Phloem. Methods in Molecular Biology, ed. Liesche J. vol 2014. New York: Humana, NY. pp. 421−31. https://doi.org/10.1007/978-1-4939-9562-2_32

    [14]

    Liu W, Wang Q, Zhang R, Liu M, Wang C, et al. 2022. Rootstock-scion exchanging mRNAs participate in the pathways of amino acids and fatty acid metabolism in cucumber under early chilling stress. Horticulture Research 9:uhac031

    doi: 10.1093/hr/uhac031

    CrossRef   Google Scholar

    [15]

    Saliminejad K, Khorram Khorshid HR, Soleymani Fard S, Ghaffari SH. 2019. An overview of microRNAs: Biology, functions, therapeutics, and analysis methods. Journal of Cellular Physiology 234:5451−65

    doi: 10.1002/jcp.27486

    CrossRef   Google Scholar

    [16]

    Deng Z, Wu H, Li D, Li L, Wang Z, et al. 2021. Root-to-Shoot long-distance mobile miRNAs identified from Nicotiana rootstocks. International Journal of Molecular Sciences 22:12821

    doi: 10.3390/ijms222312821

    CrossRef   Google Scholar

    [17]

    Li S, Wang X, Xu W, Liu T, Cai C, et al. 2021. Unidirectional movement of small RNAs from shoots to roots in interspecific heterografts. Nature Plants 7:50−59

    doi: 10.1038/s41477-020-00829-2

    CrossRef   Google Scholar

    [18]

    Pagliarani C, Vitali M, Ferrero M, Vitulo N, Incarbone M, et al. 2017. The accumulation of miRNAs differentially modulated by drought stress is affected by grafting in grapevine. Plant Physiology 173:2180−95

    doi: 10.1104/pp.16.01119

    CrossRef   Google Scholar

    [19]

    Ahsan MU, Hayward A, Alam M, Bandaralage JH, Topp B, et al. 2019. Scion control of miRNA abundance and tree maturity in grafted avocado. BMC Plant Biology 19:382

    doi: 10.1186/s12870-019-1994-5

    CrossRef   Google Scholar

    [20]

    Sharma A, Zheng B. 2019. Molecular responses during plant grafting and its regulation by auxins, cytokinins, and gibberellins. Biomolecules 9:397

    doi: 10.3390/biom9090397

    CrossRef   Google Scholar

    [21]

    Tan H, Xiao L, Gao S, Li Q, Chen J, et al. 2015. TRICHOME AND ARTEMISININ REGULATOR 1 is required for trichome development and artemisinin biosynthesis in Artemisia annua. Molecular Plant 8:1396−411

    doi: 10.1016/j.molp.2015.04.002

    CrossRef   Google Scholar

    [22]

    Yan T, Li L, Xie L, Chen M, Shen Q, et al. 2018. A novel HD-ZIP IV/MIXTA complex promotes glandular trichome initiation and cuticle development in Artemisia annua. New Phytologist 218:567−78

    doi: 10.1111/nph.15005

    CrossRef   Google Scholar

    [23]

    Alejos-Gonzalez F, Qu G, Zhou L, Saravitz CH, Shurtleff JL, et al. 2011. Characterization of development and artemisinin biosynthesis in self-pollinated Artemisia annua plants. Planta 234:685−97

    doi: 10.1007/s00425-011-1430-z

    CrossRef   Google Scholar

    [24]

    Wilding EI, Brown JR, Bryant AP, Chalker AF, Holmes DJ, et al. 2000. Identification, evolution, and essentiality of the mevalonate pathway for isopentenyl diphosphate biosynthesis in gram-positive cocci. Journal of Bacteriology 182:4319−4327

    doi: 10.1128/JB.182.15.4319-4327.2000

    CrossRef   Google Scholar

    [25]

    Rohdich F, Kis K, Bacher A, Eisenreich W. 2001. The non-mevalonate pathway of isoprenoids: genes, enzymes and intermediates. Current Opinion in Chemical Biology 5:535−40

    doi: 10.1016/S1367-5931(00)00240-4

    CrossRef   Google Scholar

    [26]

    Lv Z, Zhang L, Tang K. 2017. New insights into artemisinin regulation. Plant Signaling & Behavior 12:e1366398

    doi: 10.1080/15592324.2017.1366398

    CrossRef   Google Scholar

    [27]

    Fu X, Peng B, Hassani D, Xie L, Liu H, et al. 2021. AaWRKY9 contributes to light- and jasmonate-mediated to regulate the biosynthesis of artemisinin in Artemisia annua. New Phytologist 231:1858−74

    doi: 10.1111/nph.17453

    CrossRef   Google Scholar

    [28]

    Xia C, Zheng Y, Huang J, Zhou X, Li R, et al. 2018. Elucidation of the mechanisms of long-distance mRNA movement in a Nicotiana benthamiana/Tomato heterograft system. Plant Physiology 177:745−58

    doi: 10.1104/pp.17.01836

    CrossRef   Google Scholar

    [29]

    Notaguchi M, Kurotani KI, Sato Y, Tabata R, Kawakatsu Y, et al. 2020. Cell-cell adhesion in plant grafting is facilitated by β-1,4-glucanases. Science 369:698−702

    doi: 10.1126/science.abc3710

    CrossRef   Google Scholar

    [30]

    Shen Q, Zhang L, Liao Z, Wang S, Yan T, et al. 2018. The genome of Artemisia annua provides insight into the evolution of Asteraceae family and artemisinin biosynthesis. Molecular Plant 11:776−88

    doi: 10.1016/j.molp.2018.03.015

    CrossRef   Google Scholar

    [31]

    Buoso S, Loschi A. 2019. Micro-Tom tomato grafting for Stolbur-phytoplasma transmission: different grafting techniques. In Phytoplasmas. Methods in Molecular Biology, ed. Musetti R, Pagliari L. vol 1875. New York: Humana Press, NY. pp. 9−19. https://doi.org/10.1007/978-1-4939-8837-2_2

    [32]

    Owens NDL, De Domenico E, Gilchrist MJ. 2019. An RNA-Seq Protocol for Differential Expression Analysis. Cold Spring Harbor Protocols Published in Advance

    doi: 10.1101/pdb.prot098368

    CrossRef   Google Scholar

    [33]

    Zhou X, Oshlack A, Robinson MD. 2013. miRNA-Seq normalization comparisons need improvement. RNA 19:733−34

    doi: 10.1261/rna.037895.112

    CrossRef   Google Scholar

    [34]

    Lv Z, Li J, Qiu S, Qi F, Su H, et al. 2022. The transcription factors TLR1 and TLR2 negatively regulate trichome density and artemisinin levels in Artemisia annua. Journal of Integrative Plant Biology 64:1212−28

    doi: 10.1111/jipb.13258

    CrossRef   Google Scholar

    [35]

    Dong B, Wang X, Jiang R, Fang S, Li J, et al. 2021. AaCycTL regulates cuticle and trichome development in Arabidopsis and Artemisia annua L. Frontiers in Plant Science 12:808283

    doi: 10.3389/fpls.2021.808283

    CrossRef   Google Scholar

    [36]

    Kim D, Langmead B, Salzberg SL. 2015. HISAT: a fast spliced aligner with low memory requirements. Nature Methods 12:357−60

    doi: 10.1038/nmeth.3317

    CrossRef   Google Scholar

    [37]

    Robinson MD, McCarthy DJ, Smyth GK. 2009. edgeR: a Bioconductor package for differential expression analysis of digital gene expression data. Bioinformatics 26:139−40

    doi: 10.1093/bioinformatics/btp616

    CrossRef   Google Scholar

    [38]

    Wu H, Ma Y, Chen T, Wang M, Wang X. 2012. PsRobot: a web-based plant small RNA meta-analysis toolbox. Nucleic Acids Research 40:W22−W28

    doi: 10.1093/nar/gks554

    CrossRef   Google Scholar

    [39]

    Ashburner M, Ball CA, Blake JA, Botstein D, Butler H, et al. 2000. Gene ontology: tool for the unification of biology. Nature Genetics 25:25−29

    doi: 10.1038/75556

    CrossRef   Google Scholar

    [40]

    Consortium TGO, Carbon S, Douglass E, Good BM, Unni DR, et al. 2021. The Gene Ontology resource: enriching a GOld mine. Nucleic Acids Research 49:D325−D334

    doi: 10.1093/nar/gkaa1113

    CrossRef   Google Scholar

    [41]

    Kanehisa M, Furumichi M, Sato Y, Ishiguro-Watanabe M, Tanabe M. 2021. KEGG: integrating viruses and cellular organisms. Nucleic Acids Research 49:D545−D551

    doi: 10.1093/nar/gkaa970

    CrossRef   Google Scholar

    [42]

    Šimura J, Antoniadi I, Široká J, Tarkowská D, Strnad M, et al. 2018. Plant hormonomics: multiple phytohormone profiling by targeted metabolomics. Plant Physiology 177:476−89

    doi: 10.1104/pp.18.00293

    CrossRef   Google Scholar

    [43]

    Miao L, Li S, Shi A, Li Y, He C, et al. 2021. Genome-wide analysis of the AINTEGUMENTA-like (AIL) transcription factor gene family in pumpkin (Cucurbita moschata Duch.) and CmoANT1.2 response in graft union healing. Plant Physiology and Biochemistry 162:706−15

    doi: 10.1016/j.plaphy.2021.03.036

    CrossRef   Google Scholar

    [44]

    Dubois M, van den Broeck L, Inzé D. 2018. The pivotal role of ethylene in plant growth. Trends in Plant Science 23:311−23

    doi: 10.1016/j.tplants.2018.01.003

    CrossRef   Google Scholar

    [45]

    Cebrián G, Iglesias-Moya J, García A, Martínez J, Romero J, et al. 2021. Involvement of ethylene receptors in the salt tolerance response of Cucurbita pepo. Horticulture Research 8:73

    doi: 10.1038/s41438-021-00508-z

    CrossRef   Google Scholar

    [46]

    Crouzet J, Roland J, Peeters E, Trombik T, Ducos E, et al. 2013. NtPDR1, a plasma membrane ABC transporter from Nicotiana tabacum, is involved in diterpene transport. Plant Molecular Biology 82:181−92

    doi: 10.1007/s11103-013-0053-0

    CrossRef   Google Scholar

    [47]

    Gräfe K, Schmitt L. 2021. The ABC transporter G subfamily in Arabidopsis thaliana. Journal of Experimental Botany 72:92−106

    doi: 10.1093/jxb/eraa260

    CrossRef   Google Scholar

    [48]

    Zhao J, Yu N, Ju M, Fan B, Zhang Y, et al. 2019. ABC transporter OsABCG18 controls the shootward transport of cytokinins and grain yield in rice. Journal of Experimental Botany 70:6277−91

    doi: 10.1093/jxb/erz382

    CrossRef   Google Scholar

    [49]

    Wang B, Kashkooli AB, Sallets A, Ting HM, de Ruijter NCA, et al. 2016. Transient production of artemisinin in Nicotiana benthamiana is boosted by a specific lipid transfer protein from A. annua. Metabolic Engineering 38:159−69

    doi: 10.1016/j.ymben.2016.07.004

    CrossRef   Google Scholar

    [50]

    Zhao Y, Wang S, Wu W, Li L, Jiang T, et al. 2018. Clearance of maternal barriers by paternal miR159 to initiate endosperm nuclear division in Arabidopsis. Nature Communications 9:5011

    doi: 10.1038/s41467-018-07429-x

    CrossRef   Google Scholar

    [51]

    Clepet C, Devani RS, Boumlik R, Hao Y, Morin H, et al. 2021. The miR166–SlHB15A regulatory module controls ovule development and parthenocarpic fruit set under adverse temperatures in tomato. Molecular Plant 14:1185−98

    doi: 10.1016/j.molp.2021.05.005

    CrossRef   Google Scholar

    [52]

    Yu Y, Sun F, Chen N, Sun G, Wang C, et al. 2021. MiR396 regulatory network and its expression during grain development in wheat. Protoplasma 258:103−13

    doi: 10.1007/s00709-020-01556-3

    CrossRef   Google Scholar

    [53]

    Bukhari SAH, Shang S, Zhang M, Zheng W, Zhang G, et al. 2015. Genome-wide identification of chromium stress-responsive micro RNAs and their target genes in tobacco (Nicotiana tabacum) roots. Environmental Toxicology and Chemistry 34:2573−82

    doi: 10.1002/etc.3097

    CrossRef   Google Scholar

    [54]

    Rao S, Balyan S, Jha S, Mathur S. 2020. Novel insights into expansion and functional diversification of MIR169 family in tomato. Planta 251:55

    doi: 10.1007/s00425-020-03346-w

    CrossRef   Google Scholar

    [55]

    Zhao H, Wu D, Kong F, Lin K, Zhang H, et al. 2017. The Arabidopsis thaliana nuclear factor Y transcription factors. Frontiers in Plant Science 7:2045

    doi: 10.3389/fpls.2016.02045

    CrossRef   Google Scholar

    [56]

    Matías-Hernández L, Jiang W, Yang K, Tang K, Brodelius PE, et al. 2017. AaMYB1 and its orthologue AtMYB61 affect terpene metabolism and trichome development in Artemisia annua and Arabidopsis thaliana. The Plant Journal 90:520−34

    doi: 10.1111/tpj.13509

    CrossRef   Google Scholar

    [57]

    Tan X, Calderon-Villalobos LIA, Sharon M, Zheng C, Robinson CV, et al. 2007. Mechanism of auxin perception by the TIR1 ubiquitin ligase. Nature 446:640−45

    doi: 10.1038/nature05731

    CrossRef   Google Scholar

    [58]

    Rensing SA, Lang D, Zimmer AD, Terry A, Salamov A, et al. 2008. The Physcomitrella genome reveals evolutionary insights into the conquest of land by plants. Science 319:64−69

    doi: 10.1126/science.1150646

    CrossRef   Google Scholar

    [59]

    Hagen G, Guilfoyle T. 2002. Auxin-responsive gene expression: genes, promoters and regulatory factors. Plant Molecular Biology 49:373−85

    doi: 10.1023/A:1015207114117

    CrossRef   Google Scholar

    [60]

    Cortleven A, Leuendorf JE, Frank M, Pezzetta D, Bolt S, et al. 2019. Cytokinin action in response to abiotic and biotic stresses in plants. Plant, Cell & Environment 42:998−1018

    doi: 10.1111/pce.13494

    CrossRef   Google Scholar

    [61]

    Acheampong AK, Shanks C, Cheng CY, Schaller GE, Dagdas Y, et al. 2020. EXO70D isoforms mediate selective autophagic degradation of type-A ARR proteins to regulate cytokinin sensitivity. PNAS 117:27034−43

    doi: 10.1073/pnas.2013161117

    CrossRef   Google Scholar

    [62]

    Fujii H, Verslues PE, Zhu JK. 2007. Identification of two protein kinases required for abscisic acid regulation of seed germination, root growth, and gene expression in Arabidopsis. The Plant Cell 19:485−94

    doi: 10.1105/tpc.106.048538

    CrossRef   Google Scholar

    [63]

    Kuroha T, Nagai K, Gamuyao R, Wang D, Furuta T, et al. 2018. Ethylene-gibberellin signaling underlies adaptation of rice to periodic flooding. Science 361:181−86

    doi: 10.1126/science.aat1577

    CrossRef   Google Scholar

  • Cite this article

    Dong B, Li S, Wang X, Fang S, Li J, et al. 2023. Integrated analysis of transcriptome, small RNA, and phytohormonal content changes between Artemisia annua Linn. and Nicotiana benthamiana Domin in heterogeneous grafting. Medicinal Plant Biology 2:2 doi: 10.48130/MPB-2023-0002
    Dong B, Li S, Wang X, Fang S, Li J, et al. 2023. Integrated analysis of transcriptome, small RNA, and phytohormonal content changes between Artemisia annua Linn. and Nicotiana benthamiana Domin in heterogeneous grafting. Medicinal Plant Biology 2:2 doi: 10.48130/MPB-2023-0002

Figures(6)  /  Tables(3)

Article Metrics

Article views(4182) PDF downloads(705)

ARTICLE   Open Access    

Integrated analysis of transcriptome, small RNA, and phytohormonal content changes between Artemisia annua Linn. and Nicotiana benthamiana Domin in heterogeneous grafting

Medicinal Plant Biology  2 Article number: 2  (2023)  |  Cite this article

Abstract: Grafting, one of the artificial propagation methods used in plants, is now widely used in flower breeding, vegetable cultivation and stress response research. In order to discover the reason for success of heterograft and information exchange mechanisms, we used Artemisia annua (Aa) as scion and Nicotiana benthamiana (Nb) as rootstock to build a grafting model. After grafting 30 days co-growth, 7,794 DEGs (different expression genes) and 8,214 DEGs were identified in Aa scion and Nb rootstock, respectively. Most of the DEGs belong to defense response and signal transduction in scion and substance metabolism in rootstock, which indicate that the diverging response mechansim of grafted parts. Fifty Nb genes and 20 Aa genes were detected in Aa scion and Nb rootstock, which were regarded as potentially active genes during the grafting process. The most abundant miRNAs are miR159 and miR166, which may be closely related to their conservation and physiological functions. Besides, miR159 and miR166 could quickly respond to internal change, therefore the two miRNAs should be considered as biomarkers of successful grafting models. And then, as simultaneously screened miRNAs, miR396 and miR6149 could be potential biomarker in Aa and Nb, respectively. Through the analysis of the miRNA-target gene network in differentially expressed miRNAs, transcription factor R2R3-MYB, bHLH, GRAS, GAMYB, SBP-box, MADS-box, IIS in scion and NF-Y in rootstock were regarded as key genes involved in growth and development of grafted plants. The content of ABA, JA, CK was calculated in grafted plants and showed its respective functions.

    • As one of the most important techniques in horticulture, in China, grafting dates from 7000 BC[1]. During the natural grafting process, people found that scion and rootstock from two different species could join together, the interface junction named the callus, which subsequently differentiates into vascular tissue to refactor material translocation[2,3]. With the improvement in the success rate of plant grafting, the technique is now widely used in fruit, crop and vegetables, for propagating superior strains[4], reducing disease and insect infection rates, and increasing crop yields[5].

      Population compatibility between scion and rootstock is the most important prerequisite for survival of grafted species, which includes the growing and regeneration of callus, and establishment of symbiotic relationships between scion and rootstock[6]. In general, grafting survival rate of intraspecies is higher than interspecies, which means grafting incompatibility increases with taxonomic distance[7]. Compared with incompatible graft combination, compatible combination could induce genes expression involved in auxin signal transduction, wound healing, and secondary metabolism[8]. Besides, proteomics differences can also reflect the physiological status between compatible-rootstock grafting and incompatible-rootstock grafting. Proteins related to the Calvin cycle, carbohydrate metabolism, photosynthetic organs are relatively enriched in graft-compatible cucumber/pumpkin[6], which would contribute to superior photosynthetic capacity, growth performance and biomass. During the grafting process, the accumulation of phenolic compounds, especially coumaric acids and flavonoid, may result in incompatible graft phenomenon. Actually, successful graft combination could manifest several markers like transcripts changes, metabolite differences, and redox status[9], and the markers can be used for screening affinity plants in horticultural research.

      Micrografting experiments[10] have revealed the healing process of graft union, including callus formation and then generating new vascular connections. During the first 3 d after grafting, scion and rootstock may attach to each other through adhesion of parenchyma. As the cells increased in value, callus formed between rootstock and scion, and then producing cell differentiation and organ regeneration[11]. Through formed plasmodesmata[3,12], scion and rootstock may produce a clear cell-to-cell transfer action, including not just RNA, small RNAs, metabolites, and protein, which are the focus point we have perpetually focused.

      Messenger RNA (mRNA) is a critical role in the transmission of genetic information and regulating physiological function. In the tobacco/tomato grafted model[13], the mobile mRNAs in phloem can be easily identified owing to its large phylogenetic distance. Meanwhile, in the grafting process of cucumber and pumpkin[14], four mRNAs related to chilling-induced in pumpkin could move to chilling-tolerant cucumber, and then regulate the fatty acid β-oxidative degradation metabolism in its internal, thus promoting the ability to resist cold. It is expected that through the transfer of mRNAs between scion and rootstock, a new allopolyploid species may be created, thus providing a method to asexual reproduction.

      Plant microRNAs (miRNAs) are a class of small non-coding RNAs, 21 to 23 nucleotides in length, which belong to pivotal regulatory elements of gene expression[15]. In heterografted plants, miRNA could produce unidirectional or bidirectional movement, especially from shoot to root, which included metabolic pathways and phytohormone signal transduction[16,17]. The directional long distance movement of miRNAs could induce phenotypic changes of scion[16], which illustrates that miRNAs play an important role in epigenetic inheritance. Through the movement of miRNAs, we could use the pattern for cultivating the modified crops of higher tolerance to drought and salt[18]. Moreover, in grafted avocado[19], a miR156-SPL4-miR172 model could act as a marker for plant affinity in response.

      Whatever the model of homo- or hetero-grafting, it will both induce the damage response mechanisms in scion and rootstock. During the grafting process, endogenous hormones in plants always play its role in callus formation, and respond to biotic or abiotic stress[20]. There are dozens of hormones and their derivatives in plants, which performs their respective functions in concert or antagonism. In grafted apples, the development of rootstock was not only affected by sugar metabolism, but the signal pathway of auxin and cytokinin also played an important role.

      Artemisia annua, Artemisia of the Compositae family, it is well-known for producing artemisinin, a sesquiterpene lactone with an endoperoxide bridge[21,22]. Artemisinin is a special compound for treating malaria used in Artemisinin-based Combination Therapy (ACT), specially synthesized in glandular trichomes of leaves and flowers[23]. However, the content of artemisinin in dry weight of A. annua is 0.5%−1.2%, so it is still a scarce resource. At present, the artemisinin biosynthetic pathway has only been very basically understood. Through the action of the MVA pathway[24] and the MEP pathway[25], farnesyl diphosphate can be recognized as a key compound for producing artemisinin. Subsequently, ADS, CYP71AV1, DBR2, ALDH1 were reported as four critical genes for participating in artemisinin synthesis. In order to devise powerful methods to improve content of artemisinin, researchers mostly focused on various types of transcription factors[26], phytohormone[27]. Owing to the enormity and complexity of the A. annua genome, it is hard to obtain targeted transgenic plants or ideal mutants, which makes it difficult to research plant resistance or physiology.

      Nicotiana benthamiana is a model plant of Solanaceae and commonly used for grafting analysis due to its detailed genomic information[13,28]. Owing to the mature transient transformation system of Agrobacterium rhizogenes, transgenic N. benthamiana lines can be easily obtained for investigating mRNAs transmission in the case of graft. Through the interfamily grafting results of N. benthamiana with a variety of plants, β-1,4-glucanases produced by N. benthamiana was found to accomplish cell-cell adhesion and facilitate success rate of grafting[29], thus N. benthamiana can be expected to be an excellent material for interspecific or interfamily grafting.

      In this study, we developed a heterograft system using A. annua as scion and N. benthamiana as rootstock to investigate possible elements involved in graft compatibility. We used this model to carry out three parts: mRNA, miRNA, and phytohormone. The expression level and movement of mRNAs before and after grafting were compared, we can easily obtain the crucial genes that affect the normal growth and development of plants. The mobile mRNAs may play an important role in host plants, which may act as a basis for predicting its physiological function. Further investigation of miRNAs could supplement evidence of physiological activity in the Aa/Nb graft model. The regulatory network of miRNAs may help us better understand the physiological changes in heterograft plants. Meanwhile, changes in gene expression associated with phytohormones along with content analysis would provide a more accurate and detailed information for compatibility grafting. We summarized the changing trend of Aa/Nb heterografted plants at the molecular and metabolic level, not just find genes that make plants obtain better physiological status, but provide research materials in heterograft plants.

    • Seedlings of Artemisia annua cultivar (Aa)[30] named as 'Huhao 1' with high artemisinin content and Nicotiana benthamiana (Nb) were sown on nutrient soil under a 16/8 h light/dark photoperiod at 25 °C of plant incubator. The nutrient soils are formulated in a ratio of 4:1:1 with peat, perlite and vermiculite and are slightly acidic, where the pH value is 6.5. Considering the long growth cycle of A. annua, the seeds of N. benthamiana were cultivated immediately when A. annua sprouted. The apical wedge grafting technique was performed (Fig. 1) as described by Buoso & Loschi[31]. In addition, the leaves of A. annua scion and N. benthamiana rootstock were all cut off to avoid interference of old leaves during sampling. The grafted plants were still placed in plant incubator for growing together for 30 d. Through 30 d after grafting (DAG) growth, 16 successful Aa/Nb grafted plants were obtained.
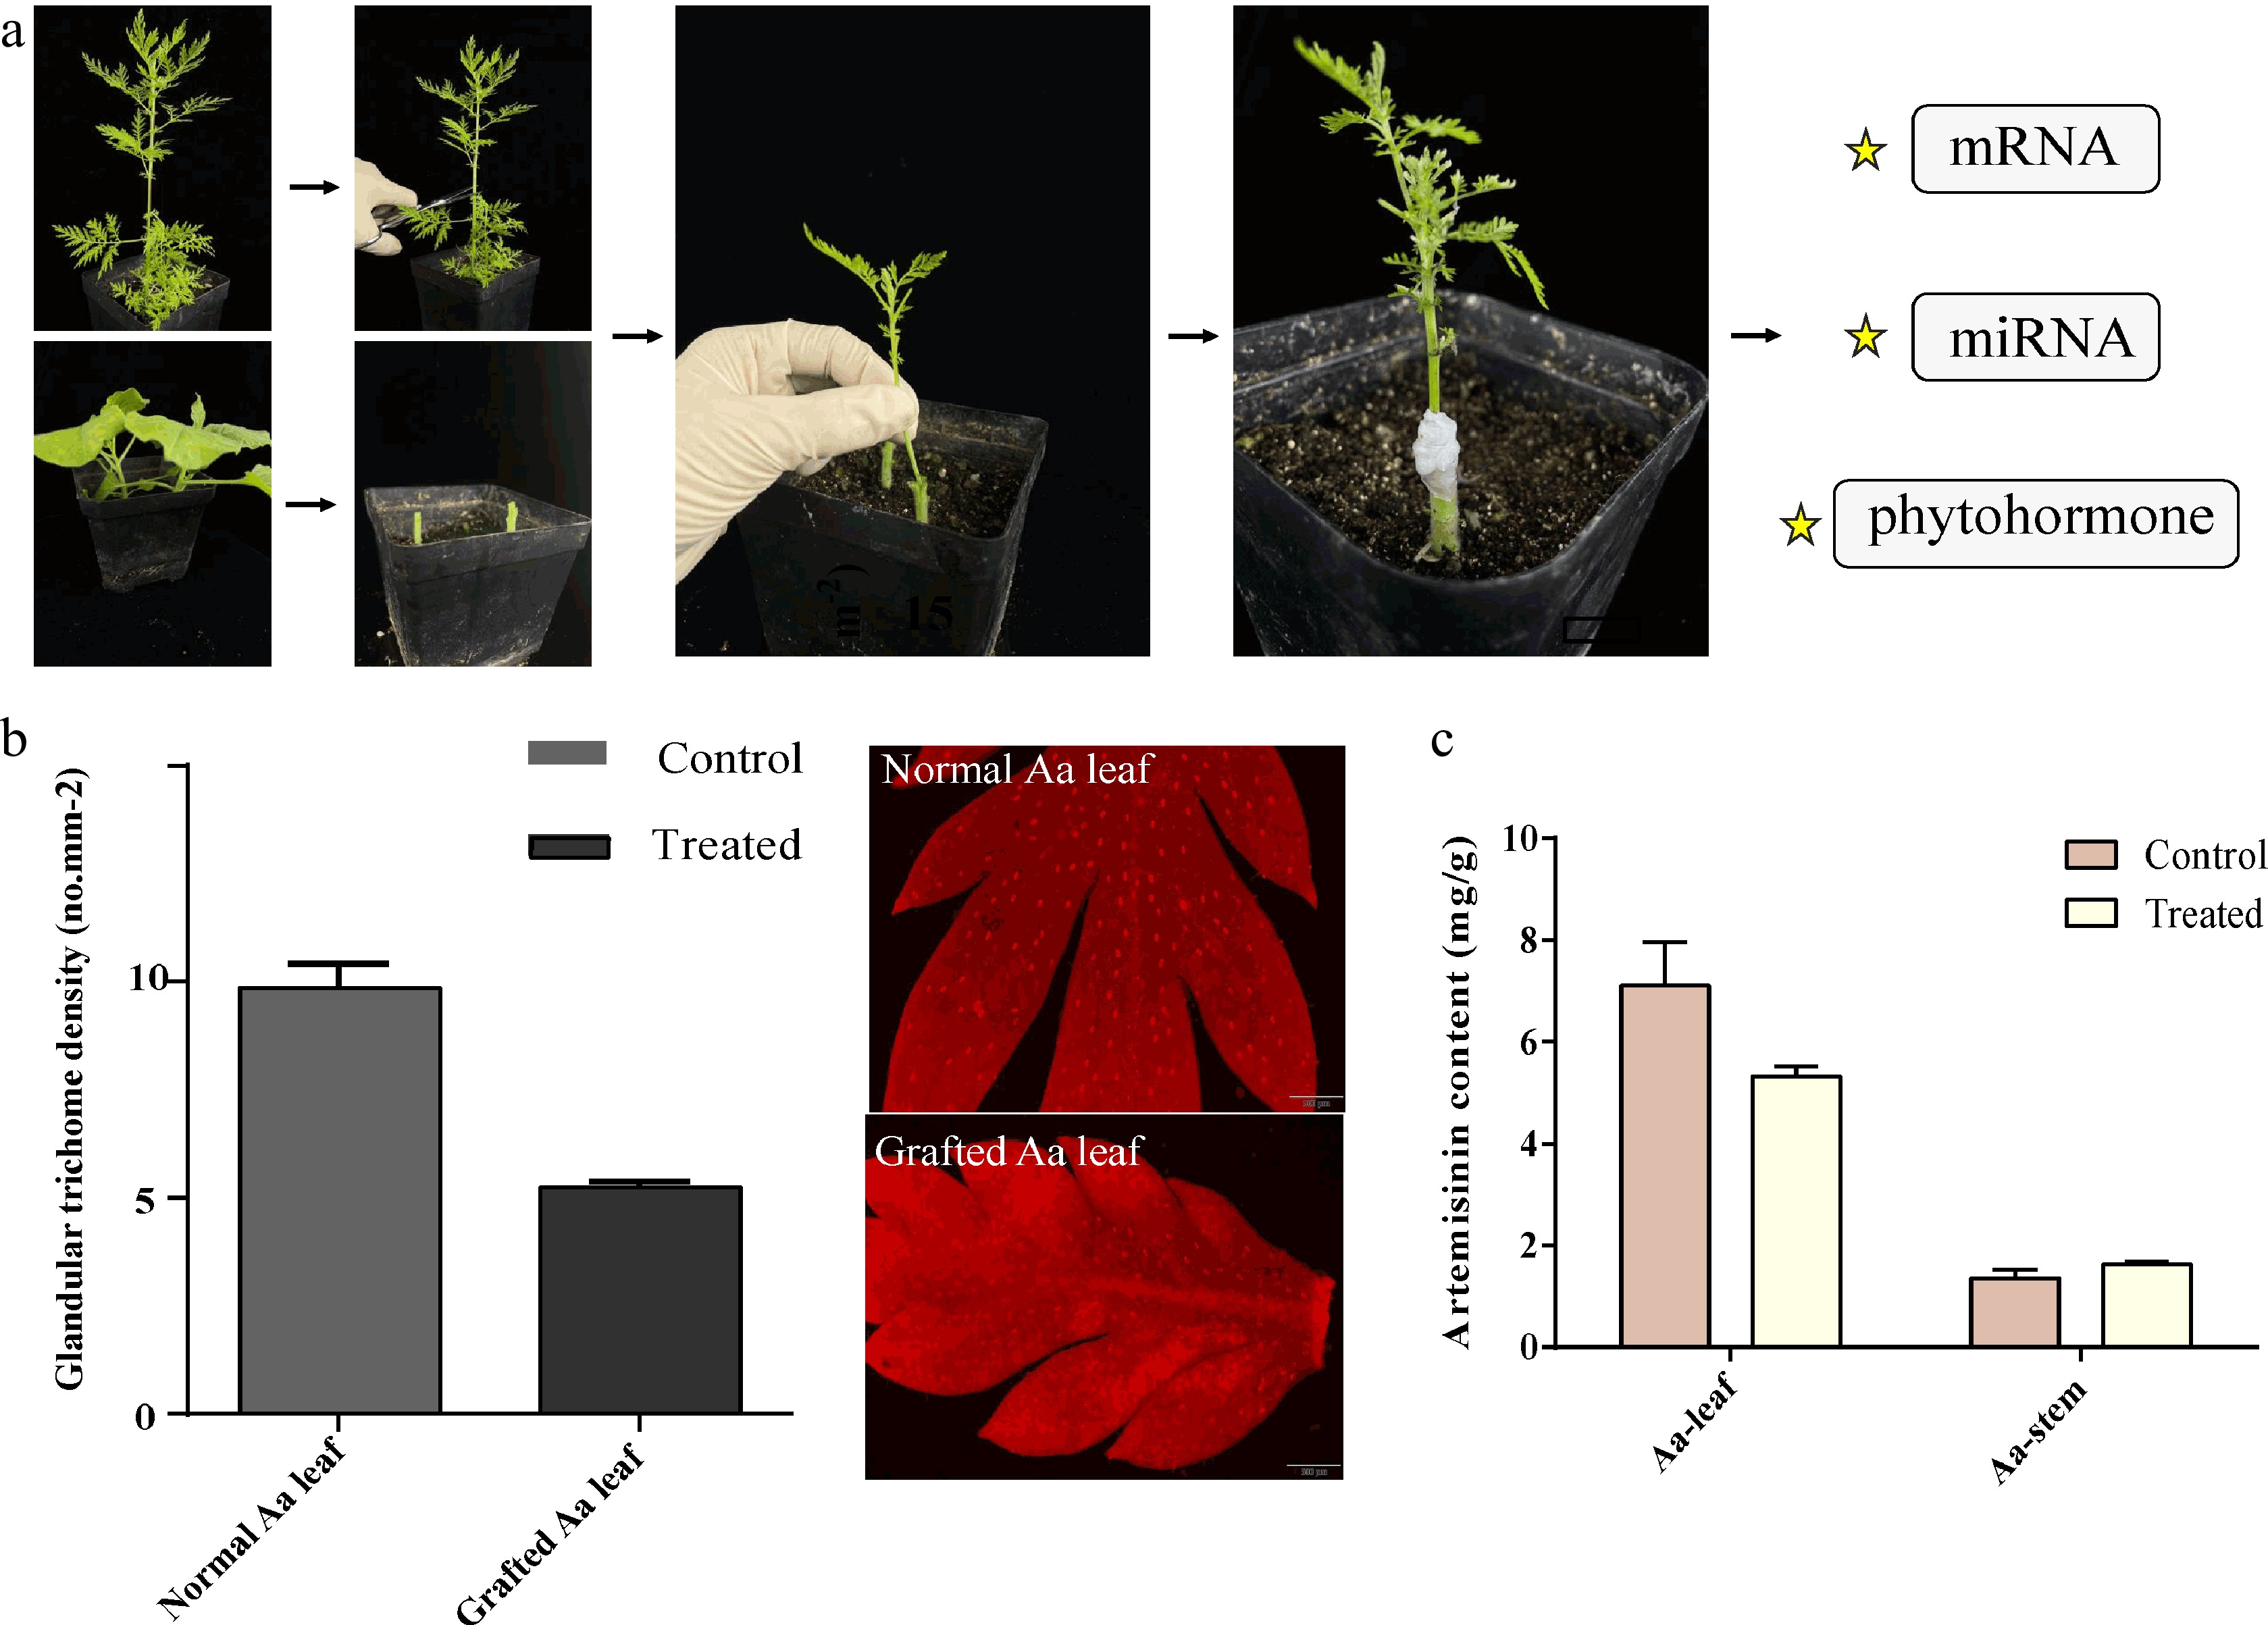
      Figure 1. 

      A heterograft model of A. annua scion and N. benthamiana rootstock. (a) The upper half of A.annua and bottom half of N. benthamiana were cut using a sharp knife. Through the apical wedge grafting technique, the two part were combined and co-grown for a month. (b) The density of gladular trichome in leaves and (c) artemisinin content were calculated as shown in the histogram, no less than three biological replicates were performed for each data.

      A. annua scion and N. benthamiana rootstock were respectively sampled from growing vigorously Aa/Nb grafted plants for RNA-seq[32] and miRNA-seq[33] (Supplemental Fig. S1). The samples were collected and frozen immediately in liquid nitrogen and stored at −80 °C to avoid RNA degradation. Each of the samples was derived from one single plant with at least three biological replicates.

      Meanwhile, in order to elaborate the changes of phytohormone content in each tissue, the leaves and stem of A. annua scion, the leaves, stem and root of N. benthamiana rootstock were sampled for determining the changes of phytohormone content. The samples of phytohormone testing were firstly washed in distilled water for preventing disturbance of constituents, and then similarly deposited at −80 °C to prevent degradation. Besides, non-grafted A. annua and N. benthamiana plants with the same growth cycles were sampled as the control group. Each of the samples was derived from one single plant with at least three biological replicates.

    • After 30 DAG, we observed the whole plant phenotype, including glandular trichome of newborn Aa leaves, Nb leaves and Nb roots by fluorescence microscope[34]. The density of trichomes of Aa leaves is calculated by ImageJ. The same part of the leaf was taken for each count, and there were at least three biological replicates. Due to the related artemisinin content, we used Aa leaves and stems to measure the content. Leaves and stems were deposited into the vacuum freeze drier for draining water. We used 100 mg of dry materials to extract the compound with methanol as a solvent, with ultrasound twice at 40 w. After centrifugation, the supernatant was taken and sampled through 0.22 um filter membrane. Samples were analyzed by HPLC-MS (1200-G6410A) with Aglient system in positive ion models[35]. Besides, the mobile phase includes acetonitrile and water solution containing 0.1% formic acid. The content of artemisinin is based on 1, 10, 50, 100, 1,000 μg/ml. MassHunter software was used for identifying the sample correctness and calculating relative content.

    • Total RNA of each sample was extracted from frozen materials using TRIzol reagent (Invitrogen, USA) and the quality of isolated RNA was guaranteed by Bioanalyzer 2100 (Agilent, USA) and NanoDrop ND-1000 (NanoDrop, USA). The integrity of RNA was confirmed through Bioanalyzer 2100 (Agilent, CA, USA) with RIN number > 7.0 and electrophoresis with denaturing agarose gel. And then mRNA contained PolyA were specifically captured using Dynabeads Oligo (dT)25-61005 (Thermo Fisher, CA, USA) by two rounds of purification. Through Magnesium RNA Fragmentation Module (NEB, cat.e6150, USA) under 94 °C 5−7 min, the poly(A) RNA was fragmented. After reverse transcribing by SuperScriptTM II Reverse Transcriptase, we got the final cDNA library with 300 ± 50 bp fragments. Finally, based on IIIumina NovaseqTM 6000 (LC-Bio Technology, China), the library was sequenced through 2× 150 bp paired-end sequencing. The preparation of library and sequencing experiments of miRNA are identical with mRNA protocol as mentioned above. The reads contained adaptor contamination, low quality bases and undetermined bases were removed by https://github.com/OpenGene/fastp. Using HISAT2 software[36] (https://daehwankimlab.github.io/hisat2/), the reads were mapped to the reference genome like A. annua and N. benthamiana. The mapped reads of each sample were assembled using StringTie (https://ccb.jhu.edu/software/stringtie) with default parameters. All mapped transcriptomes were merged to construct a comprehensive transcriptome by gffcompare (https://github.com/gpertea/gffcompare/). Through StringTie, the expression levels of all transcripts was estimated by calculating FPKM (FPKM = [total_exon_fragments / mapped_reads (millions) × exon_length (kB)]) and R package edgeR[37]. Differentially expressed mRNAs were chosen with fold change > 2 or < 0.5, along with the parametric F-test comparing nested linear models (p value < 0.05) by R package edgeR (https://bioconductor.org/packages/release/bioc/html/edgeR.html). And then GO enrichment and KEGG enrichment were analyzed based on differentially expressed mRNAs by DAVID (https://david.ncifcrf.gov/).

      In this project, we use fold change (FC ≥ 2 or FC ≤ 0.5, i.e. absolute value of log2FC ≥ 1) as change threshold, p < 0.05 as the standard for screening differential genes. Results of differential expression gene analysis, GO enrichment analysis and KEGG pathway enrichment analysis of differential expression gene were obtained in the set comparison group. To better explore the differential genes and potential mobile mRNAs, measured transcriptome data were compared with two databases: A. annua genome and N. benthamiana genome. Mobile mRNAs were confirmed seriatim in the way that genes were never present in the normal plant but were detected in grafted plants. For every sequence a comparison was made through Local BLAST and NCBI database.

    • The validate library of miRNA was constructed using TruSeq Small RNA Sample Prep Kits (IIIumina, USA) and then sequenced through 1× 50 bp single-end method based on Illumina Hiseq2000/2500. The raw reads of miRNA were subjected into an in-house program named ACGT101-miR (LC, USA) to obtain clean reads after removing adapter dimers, junk reads and repeats. Subsequently, length screening was performed to preserve the unique sequence with base length between 18 and 25 nucleotides in miRbase 22.0 (www.mirbase.org). The mapping procedure was performed on pre-miRNA against A. annua and N. benthamiana genome data, respectively. Sequences were compared with mRNA, Repbase, and RFAM databases to filter to obtain valid data, and the precursor and genome were compared for miRNA identification. To identify the results of putative miRNAs in A. annua and N. benthamiana, all the obtained miRNAs were used to predict the secondary structures using RNAfold software (http://rna.tbi.univie.ac.at/cgi-bin/RNAWebSuite/RNAfold.cgi).

      After normalizing deep-sequencing counts, differentially expressed miRNAs were analyzed using Fisher's exact test. The significance threshold was set to be 0.05 in the test.

      To predict the targeted genes by differentially expressed miRNAs, PsRobot[38] (http://omicslab.genetics.ac.cn/psRobot/) was used to make sure the binding sites of miRNA. The software predicts targets using a plant-based target penalty strategy (the default threshold is Score ≤ 2.5). Meanwhile, GO terms[39, 40] and KEGG pathway[41] of miRNA were also calculated and annotated. According to screened the most different expression miRNAs and its target gene, a correlation network diagram was manufactured through OmicStudio tools at www.omicstudio.cn/tool.

    • In order to learn more about the hormonal changes in the plant during grafting, we firstly collected seven hormones for statistical analysis, including auxin, cytokinin, gibberellin, ABA, ethylene, JA and SA. Genes associated with phytohormone signal transduction were extracted owing to the pathways involved. The changes in the amount of expression during each transduction process were determined by the genes in that module.

      The extraction protocol of phytohormones was followed using the simultaneous targeted profiling of Simura et al.[42] Five plant tissues were contained in the quantitative experiment, including Aa leaf, Aa stem, Nb leaf, Nb stem, and Nb root with non-grafted samples as control. After pretreating of solid phase extraction, samples were analyzed by HPLC-MS with Aglient system in positive and negative ion models, respectively. Besides, the mobile phase includes acetonitrile and water solution containing 0.05% formic acid. Each tissue sample contains three biological repeats. Abscisic acid (ABA, neg263), jasmonic acid-isoleucine (JA-L-ILE, neg322.1), trans-Zeatin-riboside (tZR, pos352.1), and N6-isopentenyladenine riboside (IPR, pos336.1) were chosen for representative indicators with warfarin (307.1, 308.9) as the internal standard. MassHunter software was used for identifying the type of phytohormone and calculating relative content.

    • We firstly constructed a grafting model involved with A. annua as scion and N. benthamiana as rootstock to investigate heterograft changes at molecular and metabolic levels (Fig 1, Supplemental Fig. S1).

      After observing the morphology of Aa and Nb in both heterograft and non-graft plants, we found no significant difference in phenotype, which may be the cause of short growth time. And then, we observed the trichomes by OLYMPUS microscope (Fig. 1b). Through the contrast the density of leaves, we found after grafting, the newborn leaves showed a marked state of stunting, and decreased the number of trichomes, which was about half with before. Through quantitative measurement of artemisinin, we found that the content showed a significant drop in Aa leaves as expected. However, the content in Aa stem was slightly increased (Fig. 1c).

    • In order to distinguish the differentially expressed genes during graft process, we analyzed transcriptome database of scion and rootstock part with non-grafted samples, respectively. Meanwhile, as the development of graft union, genes in the plant infiltrated into each other, thus resulting in changing of gene regulation and physiological activity. Therefore, we used the measured transcriptome database of scion and rootstock to compare with non-graft Nb and Aa genome to search potential mobile mRNAs.

      In the graft process, a total of 7,794 DEGs (Differentially Expressed Genes) of A. annua scion were detected. Among those DEGs, 4,754 genes were up-regulated and 3,040 genes were down-regulated (Fig. 2). Through Gene Ontology (GO) and Kyoto Encyclopedia of Genes and Genomes (KEGG) analysis of DEGs (Supplemental Fig. S2), mostly GO-enriched genes were distributed in 'DNA-templated', 'protein phosphorylation', 'defense response' and 'signal transduction'. Besides, KEGG pathways were significantly enriched in plant-pathogen interaction, plant hormone signal transduction and metabolism process.
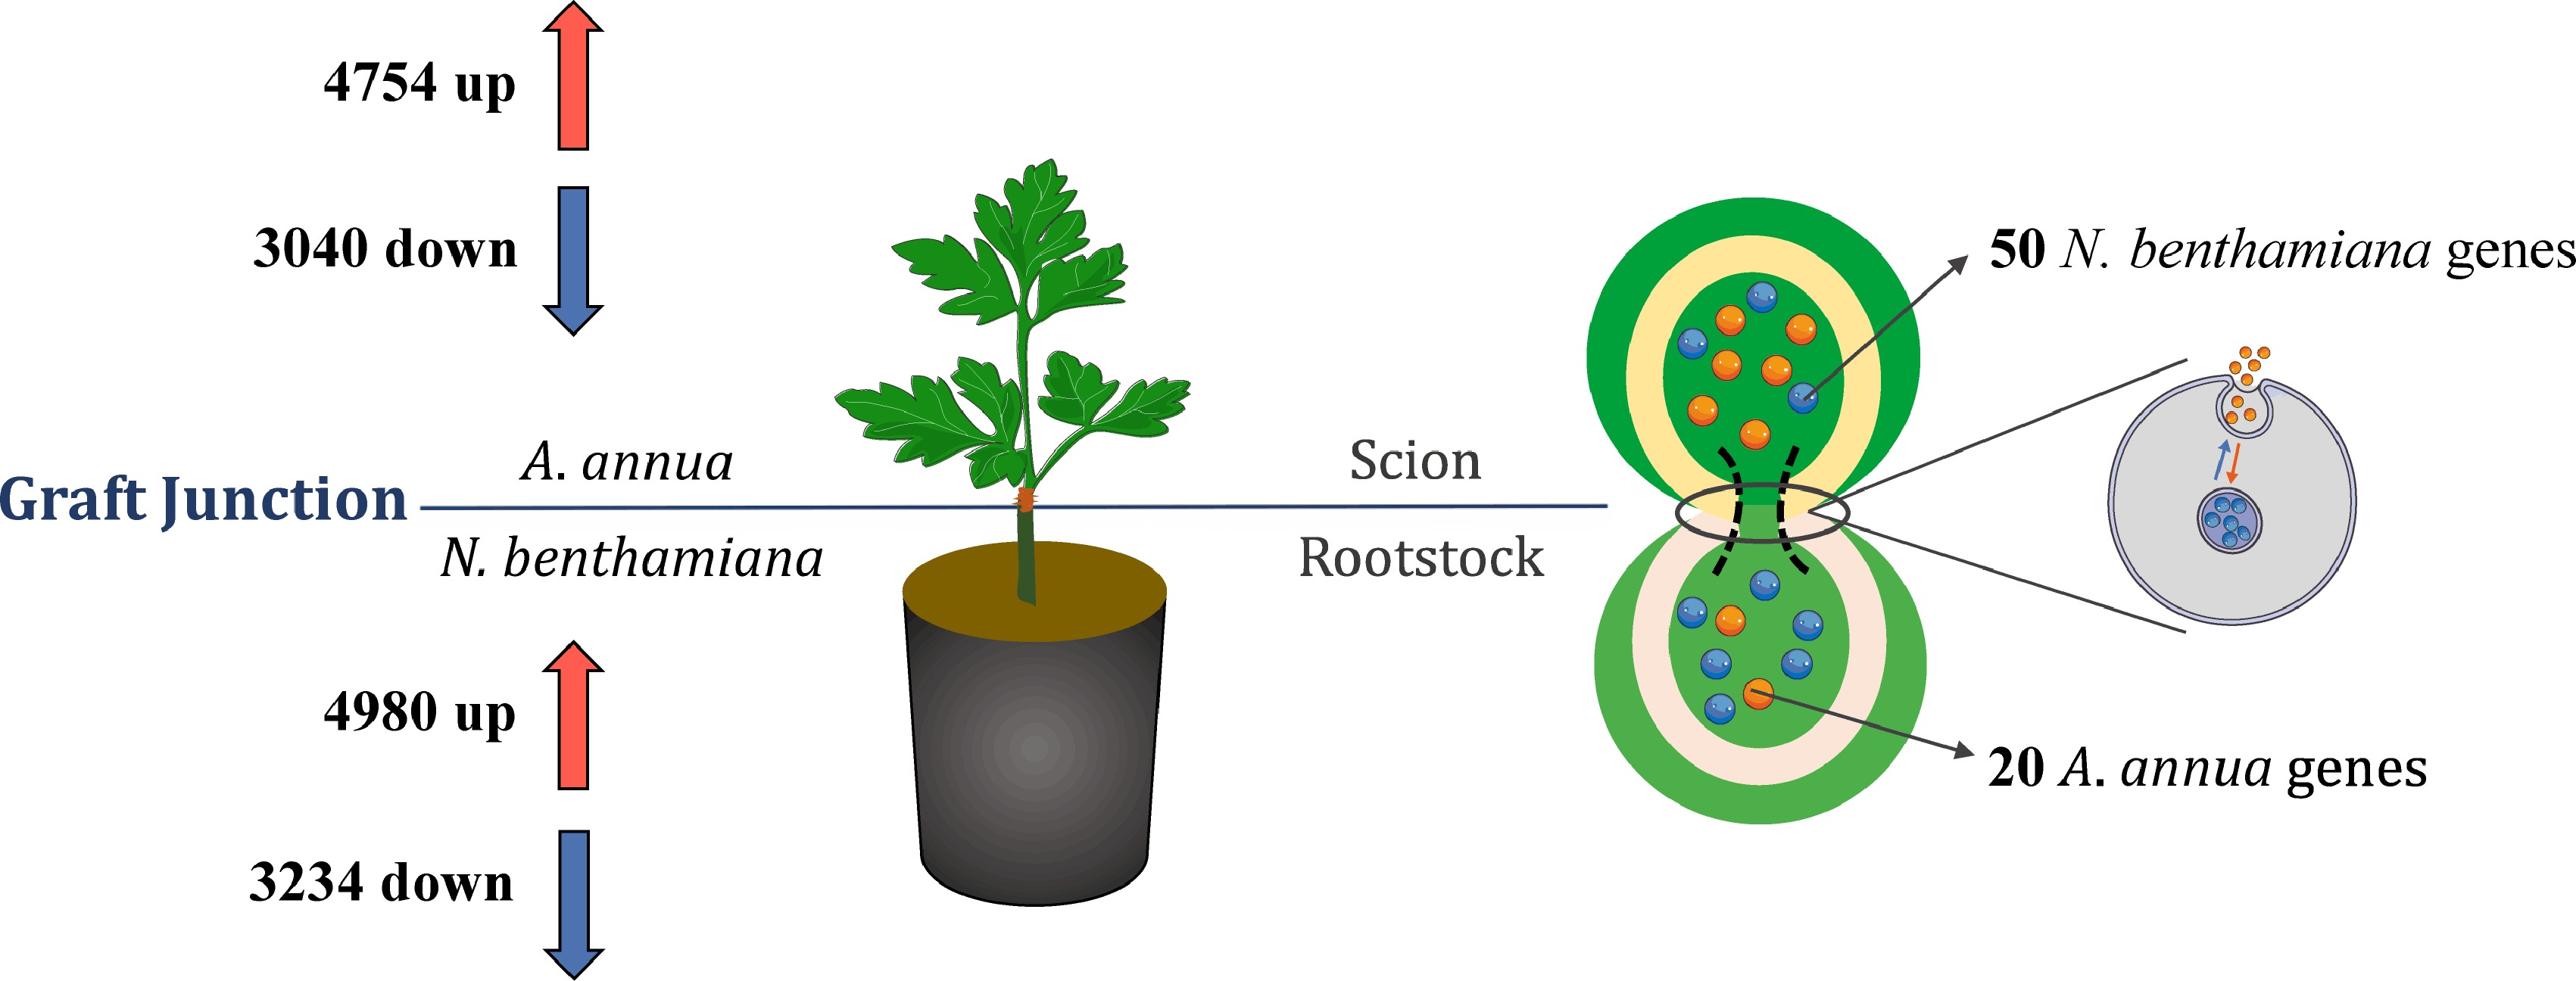
      Figure 2. 

      DEGs and potential mobile mRNAs identified from the Aa/Nb heterograft model. The upper scion part belonged to A. annua, and the bottom rootstock part was N. benthamiana as separated with horizontal line. The left half of the information was the number of up-regulated and down-regulated of different expression genes related to comparing with the same plant. The right half of the photo exhibited the movement process of mRNAs and identification of non-homologous genes.

      To identify root-to-shoot mobile mRNAs from N. benthamiana grown in A. annua, measured transcriptome were compared with tabacco genome again, 50 genes of N. benthamiana were identified as mobile mRNA. GO analysis (Supplemental Fig. S2) of these mobile mRNAs reveal that the most overrepresented proportion is molecular function (42.6%), which contained binding of ATP, GTP and calcium ion, 'structural constituent of ribosome', 'calcium ion binding', activity involved in ATPase, catalytic, and hydrolase accounted as the major part. Within the biological process (36.1%) category, 'cell wall macromolecule catabolic process', 'translational elongation', and 'oxidation-reduction process' occupied the main position. Moreover, intracellular, ribosome and membrane were overrepresented in the cellular component (21.3%) category. Meanwhile, the most significant pathways (Table 1), in which movement genes are primarily located, were ko03010 (ribosome), ko04141 (protein processing in endoplasmic reticulum), ko03040 (spliceosome) and ko01200 (carbon metabolism). It is worth nothing that there was an ABC transport gene named Niben101Scf01719g08010 obtained in mobile mRNA. Owing to the important role in the transport and accumulation of secondary metabolites in plants, we could transfer that the mobile Niben101Scf01719g08010 may also be involved in the diterpenes metabolic process in A. annua.

      Table 1.  KEGG pathway enrichment analysis of 50 Nb genes obtained from the Aa scion.

      PathwayPathway_IDGene nameGene number
      Protein processing in endoplasmic reticulumko04141Niben101Scf01834g01011;
      Niben101Scf12154g01009;
      Niben101Scf03138g01010
      3
      Ubiquitin mediated proteolysisko04120Niben101Scf01002g130021
      Spliceosomeko03040Niben101Scf09268g00007;
      Niben101Scf12154g01009;
      Niben101Scf05678g01001
      3
      ABC transportersko02010Niben101Scf01719g080101
      Carbon metabolismko01200Niben101Scf05270g01002;
      Niben101Scf14996g00009;
      Niben101Scf02480g02012
      3
      Biosynthesis of amino acidsko01230Niben101Scf05270g010021
      Glyoxylate and dicarboxylate metabolismko00630Niben101Scf02480g02012;
      Niben101Scf14996g00009
      2
      Amino sugar and nucleotide sugar metabolismko00520Niben101Scf16022g04004;
      Niben101Scf03036g03023
      2
      Tryptophan metabolismko00380Niben101Scf14996g000091
      Phagosomeko04145Niben101Scf03370g070041
      Isoflavonoid biosynthesisko00943Niben101Scf03016g000081
      Arginine and proline metabolismko00330Niben101Scf01580g050041
      Ribosome biogenesis in eukaryotesko03008Niben101Scf13167g00007;
      Niben101Scf02944g01014
      2
      RNA transportko03013Niben101Scf02944g010141
      Plant hormone signal transductionko04075Niben101Scf06996g020051
      Glycine, serine and threonine metabolismko00260Niben101Scf02480g020121
      Cysteine and methionine metabolismko00270Niben101Scf05270g010021
      Other glycan degradationko00511Niben101Scf05643g050011
      Glutathione metabolismko00480Niben101Scf01580g05004;
      Niben101Scf02562g00020
      2
      Ribosomeko03010Niben101Scf06081g02016;
      Niben101Scf05490g00015;
      Niben101Scf03365g04007;
      Niben101Scf13429g02004;
      Niben101Scf02102g01016
      5
      Sulfur metabolismko00920Niben101Scf05270g010021
      Photosynthesisko00195Niben101Scf01116g010041
      Peroxisomeko04146Niben101Scf14996g000091
      Endocytosisko04144Niben101Scf12154g0100971
      Plant-pathogen interactionko04626Niben101Scf02581g04013;
      Niben101Scf05565g02013
      2
      Oxidative phosphorylationko00190Niben101Scf01460g040181
      Polyketide sugar unit biosynthesisko00523Niben101Scf16022g040041
      Phosphatidylinositol signaling systemko04070Niben101Scf05565g020131

      In addition, a total of 8,214 DEGs of N. benthamiana rootstock were identified after grafting, in which 4,980 genes were up-regulated, whereas 3,234 DEGs were down-regulated. GO and KEGG analysis of the DEGs (Supplemental Fig. S3) revealed that the gene type and pathway involved in rootstock were both significantly different with scion, indicating that within the metabolic flux of the two exists a wide discrepancy. The top3 GO enrichment terms were oxidation-reduction process, oxidoreductase activity and regulation of transcription, DNA-templated. Furthermore, substance metabolism took up the majority in KEGG pathways, which includes metabolism of terpenoids and polyketides, metabolism of cofactors and vitamins, and lipid metabolism. During the formation process of Aa/Nb, we found 20 mobile genes of A. annua in the rootstock. Through GO analysis (Supplemental Fig. S3), 39.5% of mobile genes located in molecular function, such as 'protein binding', 'fatty-acyl-CoA reductase (alcohol-forming) activity' and 'transporter activity'. In the category of biological process, above 35.8% genes have the function, in which 'oxidation-reduction process' and 'response to cadmium ion' were enriched. The most remarkable terms of cellular component (24.7%) were cytosol, nucleus and cytoplasm. The mobile Aa transcripts may be involved in a variety of biosynthesis and substance metabolism (Table 2) in N. benthamiana, photosynthesis (ko00195), cutin, suberine and wax biosynthesis (ko00073) and oxidative phosphorylation (ko00190) for instance.

      Table 2.  KEGG pathway enrichment analysis of 20 A. annua genes obtained from N. benthamiana rootstock.

      PathwayPathway_IDGene nameGene number
      Lysine degradationko00310CTI12_AA0353301
      Cutin, suberine and wax biosynthesisko00073CTI12_AA4768101
      Peroxisomeko04146CTI12_AA4768101
      Photosynthesisko00195CTI12_AA113120
      CTI12_AA297310
      CTI12_AA400200
      3
      Phagosomeko04145CTI12_AA6213401
      mRNA surveillance pathwayko03015CTI12_AA4156901
      RNA degradationko03018CTI12_AA4156901
      RNA transportko03013CTI12_AA4156901
      Oxidative phosphorylationko00190CTI12_AA2973101
      Steroid biosynthesisko00100CTI12_AA1067601
      Ribosomeko03010CTI12_AA1172302
    • We constructed four miRNA libraries named Aa, Aa scion, Nb, Nb rootstock from grafted union. As shown in Table 3, the raw reads obtained from four database were 14,833,433 14,976,061, 14,057,479, 13,596,666, respectively. After removing 3' adaptor and junk reads, following screening and retaining reads with base length from 18 to 25 bp and RNA database comparison, a total of 10,043,761, 9,486,686, 8,143,546, 5,473,716 valid reads were obtained.

      Table 3.  Overview of miRNA sequencing data from Aa/Nb heterograft plants.

      AaAa scionNbNb rootstock
      Raw reads14,833,43314,976,06114,057,47913,596,666
      Rfam279,235351,738712,4231,801,176
      mRNA1,663,7421,523,1611,118,3621,698,556
      Valid reads10,043,7619,486,6868,143,5465,473,716

      The overall distribution of differentially expressed miRNA was analyzed using a volcano figure (Fig. 3). Most miRNAs were not differentially expressed during grafting. Additionally, in grafted union, the total number of differentially expressed miRNAs in Aa scion is more than Nb rootstock. Besides, the number of up-regulated miRNAs were both higher down-regulated ones, whether for scion or rootstock. The top three most abundant miRNAs in scion and rootstock are miR159, miR396, miR166 and miR159, miR6149, miR166, respectively.
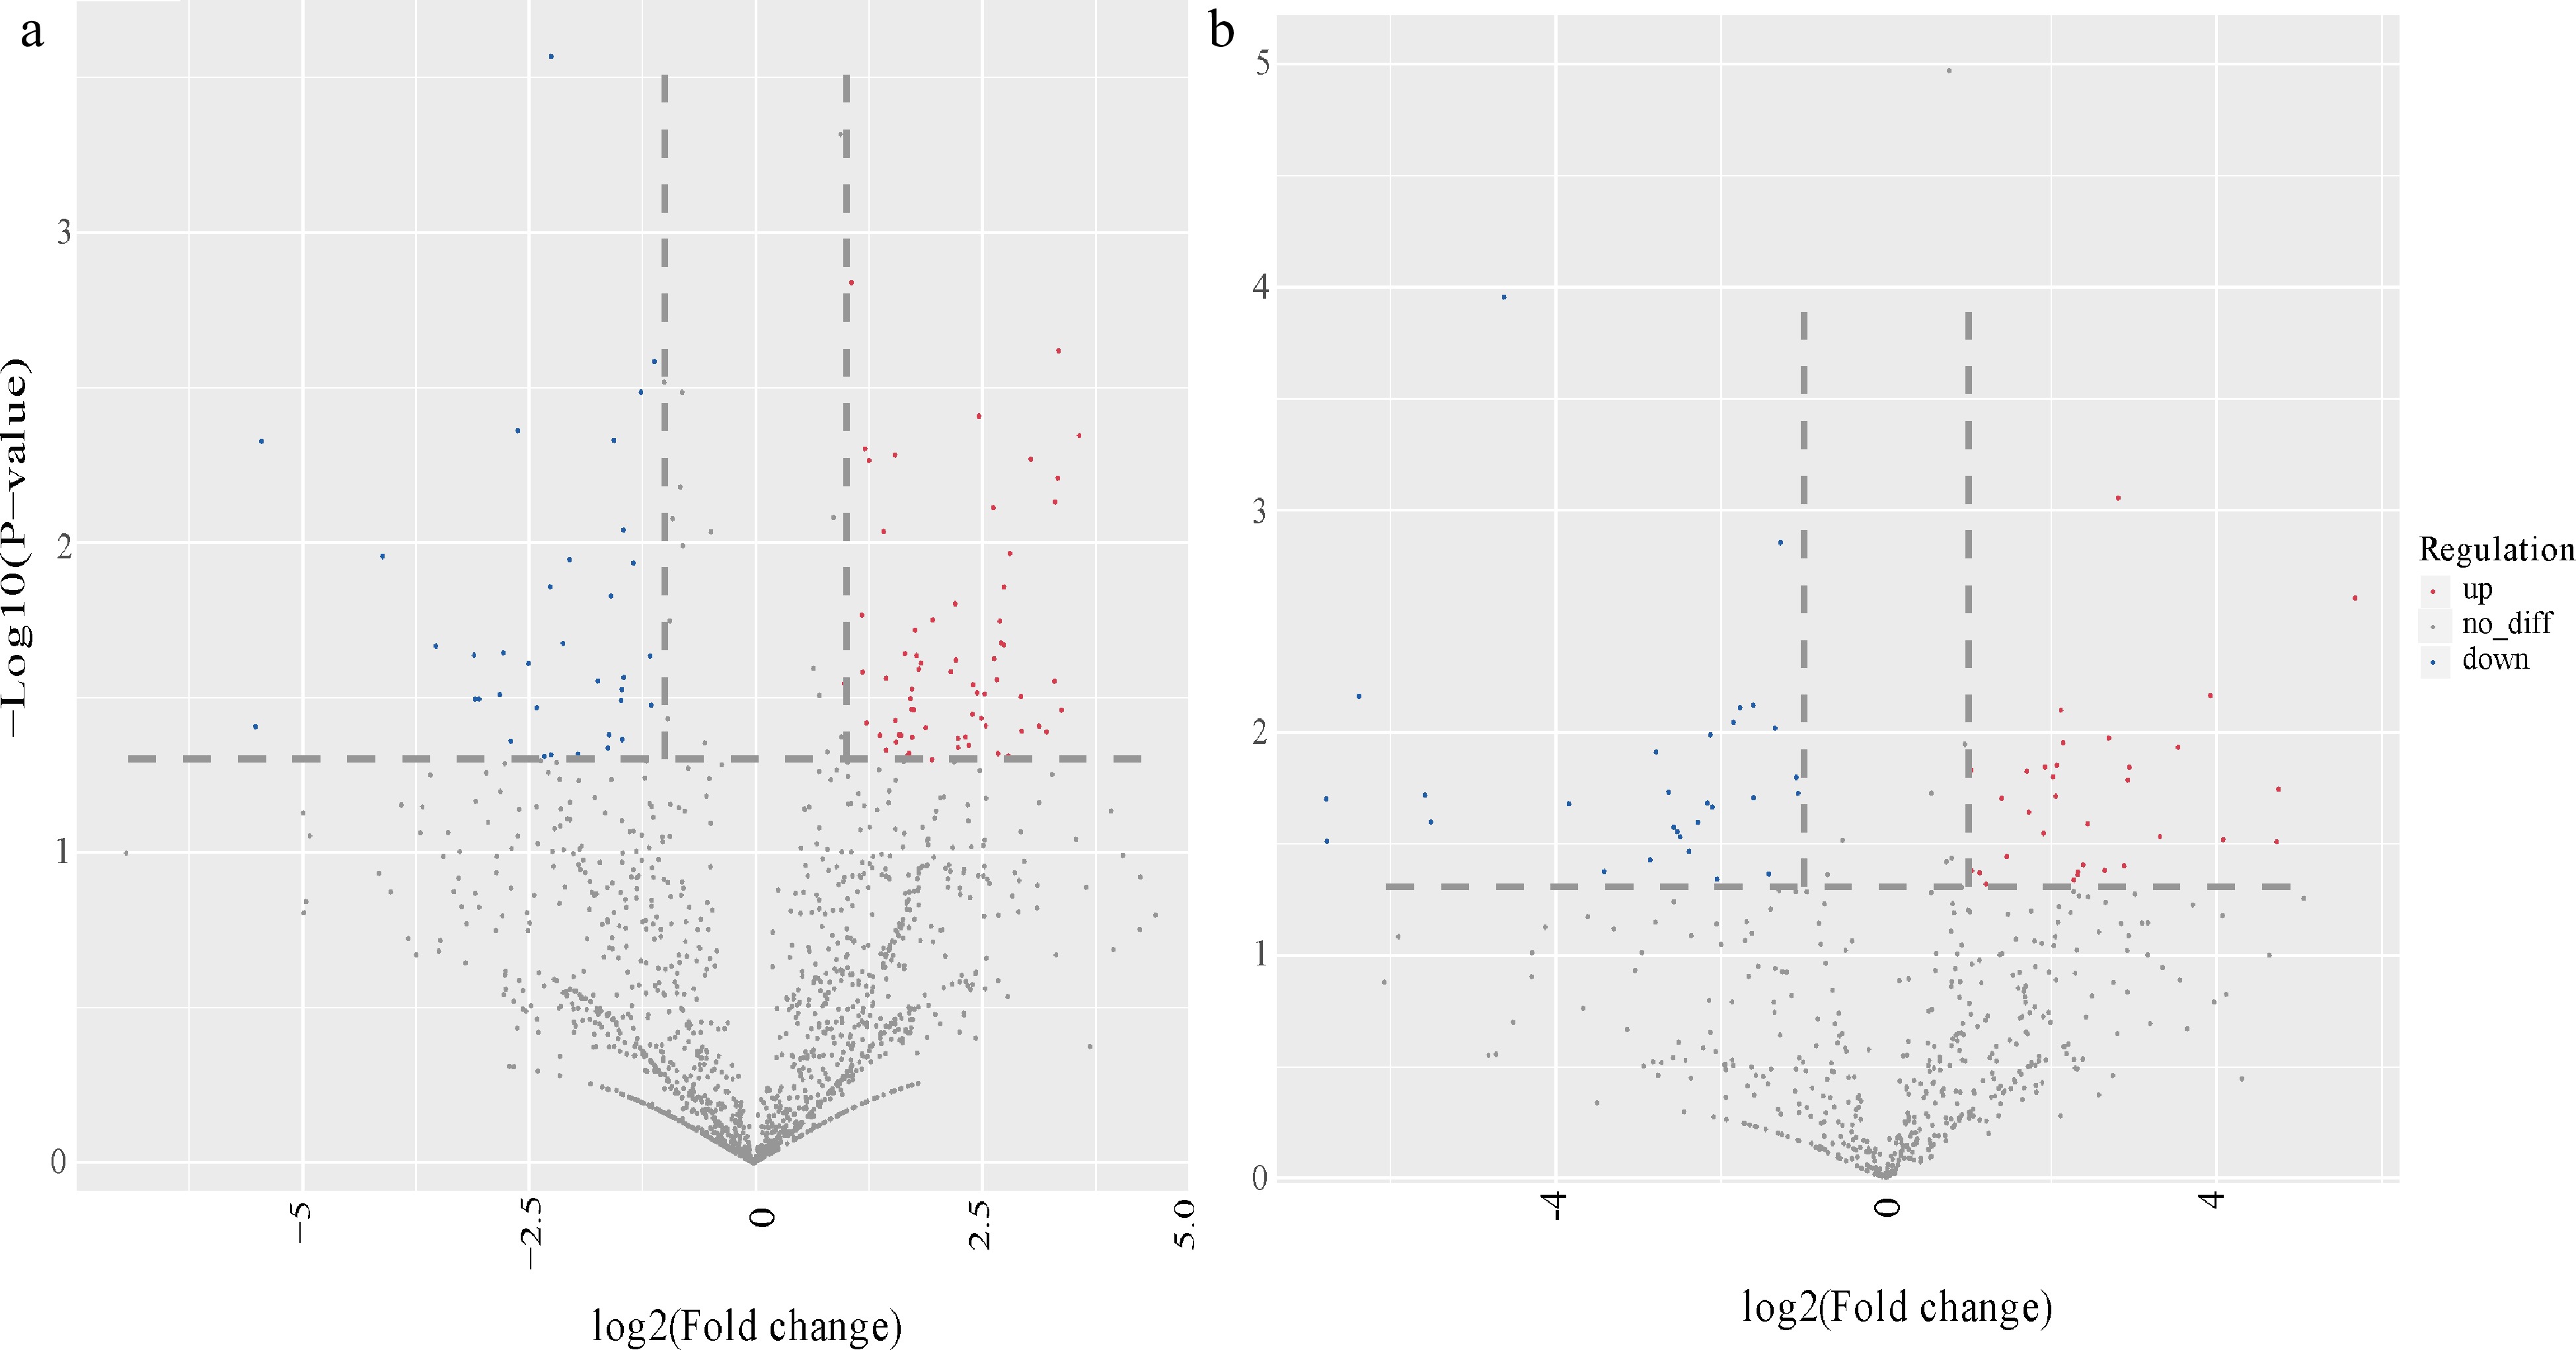
      Figure 3. 

      Volcano photo of differentially expressed miRNAs in scion and rootstock. Overall distribution of differentially expressed miRNA in (a) Aa scion and (b) Nb rootstock. The abscissa represents the differential expression multiple changes of miRNA in different samples. The ordinate represents the statistical significance of miRNA expression changes. Red dots represent significantly up-regulated differentially expressed genes, blue dots represent significantly down-regulated differentially expressed genes, and gray dots represent non-significantly differentially expressed genes.

    • To determine types of differently expressed miRNAs, we chose p values < 0.01 and higher expression level miRNAs to analysis its potential function. Through psRobot[38] software, we can predict the target genes of miRNAs with significant differences.

      As expected, most of the difference miRNAs were located in plant-pathogen interaction (ko04626) and monoterpenoid biosynthesis (ko00902) of Aa scion, aminoacyl-tRNA biosynthesis (ko00970), plant hormone signal transduction (ko04075) and pentose and glucuronate interconversions (ko00040) of Nb rootstock, respectively. Thus, we can infer that most miRNAs we obtained may be involved in the recovery of grafted union physiological function and transduction of information.

      Considering the crucial physiological function of Transcription Factors (TF) in plant development[43], we focused the miRNA-TF network as a key point to analyze the regulation mode. According to the significant expression difference, 142 miRNAs predicted to be transcription factors of Aa scion were obtained firstly by screening. Among the miRNAs, seven types of TF were classified as shown in Fig. 4a, which contain R2R3-MYB, bHLH, GRAS, GAMYB, SBP-box, MASD-box, IIS.

      Figure 4. 

      Regulatory network research of transcription factors in differentially expression miRNAs and heatmap analysis of target gene among Aa scion and Nb rootstock. (a) Network plot of different expression miRNAs in A. annua scion. (b) Heatmap of different expression miRNAs targets in A. annua scion. (c) Network plot of different expression miRNAs in N. benthamiana rootstock. (d) Heatmap of different expression miRNAs targets in N. benthamiana rootstock. The legend at the bottom of the left figure marks the miRNA name, target gene name and gene type in different colors and shapes, respectively. Heatmap of target genes was used FPKM as expression quantity. Different colors indicate different gene expression levels, from blue to white to red, indicating low to high expression levels, with red indicating high expression genes and blue indicating low expression genes. The group of each gene corresponds to the color bar on the left.

      In the Aa scion, the most difference expression miRNAs belong to hormone transduction and plant resistance. We combined the expression quantity of target genes to analyze the regulatory trends. Fifteen genes related to miRNAs were obtained for constructing the heatmap and mostly of genes demonstrating the up-regulated after grafting, which is the reason why miRNA promoted its expression.

      Additionally, the expression level of MYC2 gene, named AA518540 and AA477190, was always very high throughout, indicating the jasmonate signaling factor could play an important role in the graft process or development of grafted plants. Based on this, we can primarily speculate that the 15 target genes are essential for the normal growth and development of A. annua, which is worth further research.

      By contrasting the miRNA database of Nb rootstock with non-grafted Nb, we preliminarily obtained 52 different expression miRNAs related to transcription factor, which actually belonged to only one type miRNA, named miR169 (Fig. 4). Through the heatmap of target genes, we can clearly find that the expression level of each gene was increased, which may be related to the cleavage effect of miR169. During grafting, miR169 and its target gene NF-Y in N. benthamiana expressed the most outstanding role, which told us the prominent impact of miR169 in the grafting model.

    • Phytohormones, found in auxin, cytokinin, gibberellin, and abscisic acid, play a key role in graft union and act as signal molecules related to graft development. Considering the different effects related to graft union of every plant hormone, we chose seven kinds of hormones to investigate its changing mechanism as shown in Fig. 5.

      Figure 5. 

      Changes of genes involved in phytohormone signal transduction. (a) Phytohormone transduction pathway of A. annua scion. (b) Phytohormone transduction pathway of N. benthamiana rootstock. Changes in DEGs were mapped in boxes, green and red boxes represent down-regulated and up-regulated, respectively. Orange boxes represents genes in the pathway indicting bidirectional regulation. Purple boxes illustrate no DEG.

    • In the grafted model we built, DEGs of auxin transduction pathway basically showed a consistent change trend of expression including A. annua scion and N. benthamiana rootstock except TIR1 and GH3. In the heatmap, we can infer that genes of A. annua in GH3 were subject to positive regulation, however, some of GH3 genes in rootstock display down-regulated, this may be related to negative feedback regulation. In the other two primary-response genes, AUX/IAA and SAUR both show bidirectional regulation. AUX1 is an important auxin influx carrier, which mainly regulates root hair development and root gravitropism. In the process of grafting, scion and rootstock reveal the down-regulation of AUX1 expression. In conclusion, ARF family consists of up-regulated and down-regulated genes, which may be concerned with their role in the metabolism pathway.

    • CRE1 is a cytokinin receptor, it can be activated by CKs to initiate the phosphorylation signal. The down-regulation of CRE1 of scion and rootstock may result in vascular bundle cells differentiate into xylem cells. AHP is a histidine-containing phosphate transfer protein, which may involve in drought stress or cold signal regulation through redundantly negative manner. In scion part, AHP is up-regulated, whereas down-regulated in rootstock. During the graft process, B-ARRs reveal identical expression model in scion and rootstock, in which members may exhibit different transcription function, whereas A-ARR is down-regulated in scion and up-regulated in rootstock. On the one hand, it may be affected by the regulatory effect of B-ARR on it. On the other hand, it may be closely related to the growth condition and development of grafted plants.

      In the Aa/Nb grafted model, genes involved in ABA transduction reveal a clear upward trend, especially PP2C and ABF in scion, PYR/PYL and ABF in rootstock. PP2C, actually a kind of serine-threonine phosphatases type 2C protein, act as a negative regulator of ABA transduction.

    • In the scion part, the expression level of GID1 and GID2 was significantly up-regulated. However, the expression trend of these two pathways was not obvious in rootstock. Besides, GID2 could repress DELLA, which may influence the expression of downstream gibberellin signal during grafting process.

      The ETR gene family as an ethylene receptor, can play a role in seed germination and be induced by physiological process such as plant senescence through Ca2+ and ABA signal[44,45]. We have found surprising discovered that the controlling model of ETR is reverse in graft union, representing the scion and rootstock reveal enormous differences in ethylene signal transduction. Moreover, ethylene insensitive 3 (EIN3) is a crucial transcription factor in ethylene signal transduction and biosynthesis. According to our measured data, EIN3 reveals identical expression models of up-regulation, which may be consistent with its positive effect.

    • In scion tissue, MYC2 is up-regulated, which indicates that the intensity of JA signal may improve during grafting. Additionally, JAZ is up-regulated in both scion and rootstock. The JAZ gene family is a series of Jasmonate-zim domain protein, which can act as transcription repressors and JA co-receptors. The expression model of JAZ may be closely related to its various effects in physiological function.

      SA signal transduction did not show a strong trend of change. In the scion part, the three pathways in SA contain up-regulated genes and down-regulated genes, whereas in rootstock, NPR1, the critical role in SA transduction, demonstrate down-regulated trends leading to overexpression of TGA. Besides, NPR1 could perform antagonistic effect of JA and SA. Down-regulated of NPR1 may result in enhancement of JA signal. The up-regulated of TGA can lead to a positive response to SA signals, and then respond to plant pathology as soon as possible.

    • According to our focus phytohormones and testing instrument, we finally obtained three types of hormones to analysis its regulation process in scion and rootstock, including ABA, JA and CK in Fig. 6. In order to accurately measure changes in each plant part, five tissues were obtained for quantitative determination, including two scion parts and three rootstock parts.

      Figure 6. 

      The content of measured ABA, JA and CK in A. annua scion and N. benthamiana rootstock. The abscissa represents the sampling site, and the ordinate represents the phytohormone concentration. The error bar represents the standard error for three independent experiments.

      N6-isopentenyladenine riboside (IPR) and trans-zeatin-riboside (tZR) are two crucial CKs, which can regulate and control plant growth and differentiation although the amount is low. In the background of grafting, we can clearly find that the content of IPR and tZR is both enriched in stem, which may be related to its physiological effect. Moreover, the trend of content change is identical in IPR and tZR. In the scion part, the purity of IPR and tZR is elevated among A. annua leaf and stem, whereas in rootstock, IPR and tZR show a downward trend.

      After the graft stage, the content of ABA is mainly down-regulated except N. benthamiana stem, which is clearly higher than before. Besides, the relative content of ABA is highest in N. benthamiana leaf and stem. JA plays an important role in defending plant resistance, plant pathology and pest disaster, thus it is clearly show that the content of JA derivative, named JA-LIE, represent substantial increases in each part after grafting.

    • Heterografting always have identical effects on finding coding RNA through different constructed systems. However, there are individual differences among each species. Before the systematic understanding of mechanisms involved in the grafting process, the changing patterns of individual species should be analyzed. Although there was no various epigenetic characteristic change, endogenous physiology and components may already be occurring and changing. We speculated that the artemisinin may create a mobile behavior forwardly or passively from scion to rootstock during grafting. This phenomenon showed that the heterografted plant tends to grow less than normal, and need more nutrients to keep its physiological activity.

      Nicotiana benthamiana is common model plant used in genetic modification, subcellular localization and grafting. β-1,4-glucanases[29] produced by N. benthamiana could facilitate reconstruction of cell walls in graft union, thus using N. benthamiana as rootstock may greatly improve graft compatibility. ATP binding cassette (ABC) was an enormous family and widely existed in plants, like tobacco, Arabidopsis, rice[4648]. It can play an important role in response biotic stress, especially ABCG subfamily. In tobacco, NtPDR1, the members of ABCG subfamily, could transport diterpenes, thus promoting the ability of plant defense. In our grafted model, the expression level showed no obvious changes, which may be related to the existing good grafting conditions for both.

      Artemisia annua is an important traditional Chinese medicine, and it is famous for its effect of healing malaria. The content of artemisinin has been the focus of research. Through the grafted model, we preliminary understood the genes involved in resistance of A. annua. By using the genes related to plant growth and stress resistance, we may find an effective way to research biological properties in heterografted plants.

      After 30 DAG, most of the grafted samples could still survive, with some deaths due to the influence of the external environment or original sample situation. However, it is not possible to determine whether A. annua and N. benthamiana exhibit graft compatibility due to the short co-growth time. Through the analysis of the transcriptome of scion and rootstock, we can obtain a large amount of information. Most of DEGs belong to plant resistance and growth, which is consistent with what we suspected. We found mobile mRNAs moved from rootstock to scion or scion to rootstock. These genes may play a key role in the grafting process. Among the mobile genes in A. annua scion, AA476810 caught our attention owing to the function of cutin and wax biosynthesis. In A. annua, the biosynthesis of cutin and wax could directly influence the development of secretory trichome in leaf, thus affecting the content of artemisinin. It is not sure if the movement of AA476810 caused the lower artemisinin level in grafted scion. In addition, it is not known whether the movement of this gene will result in impaired growth of new A. annua leaves or affect the growth of tobacco leaves. In 50 mobile N. benthamiana genes, an ABC transporter named Niben101Scf01719g08010 was brought forward for research. The ABC transporter family could participate in various physiological processes, especially the transport of terpenoids[49]. So, we guess that the mobile of ABC transporter may influence the biosynthesis of artemisinin derivative. The transport function of the N. benthamiana gene was validated by constructing into the PDR196 vector, whereas lacking good repeatability, we failed to obtain clear results.

    • Until a few years ago, owing to technical limitations and inadequate knowledge of miRNA, the important situation of small RNA has not received enough attention. However, with the successful blowout of related research, the importance of miRNA is becoming increasingly known. In plants, miRNA always influences morphological development of leaves, and could participate in plant hormone signal transduction and cope with environmental stress. We analyzed the different expression of miRNAs in scion and rootstock, finding that the number of up-regulated miRNAs is more than the down-regulated. We then chose the transcription factor belonging to high expression abundance and significant differences in miRNAs for miRNA-gene-GO analysis. In A. annua scion, the screened TFs can be separated into three classes, including plant development, phytohormone transduction and abiotic stress responses. The 15 target genes may play an important role in the growth and development of A. annua. However, only one type of TF was present in N. benthamiana rootstock, NF-Y, which is the key point for miR169 binding. The class of NF-Y is able to take part in a variety of plant physiological activities, such as hypocotyl elongation, flowering process and responding to abiotic stress, thus we speculated that miR169 and NF-Y played an indispensable role in the grafting process.

      Firstly, miR159, miR396, miR166 and miR159, miR6149, miR166 were screened owing to the high abundance in Aa scion and Nb rootstock, respectively. The different expression miRNAs like miR159 and miR166 have been reported in other grafted models, which indicated the conservative and importance of these miRNAs. It is well known that miRNAs could participate in various plant physical activity and responding to environmental change[18]. Owing to its short nucleotide sequence, miRNA can transfer from root to shoot to exercise the role, vice versa[16,17]. In Aa/Nb grafted model, miR159 and miR166 are the same high expression abundance. It has been marked that the two microRNA are vital network hubs in plant stress response, indicating it may participate in callus formation and plant physiological activity. Besides, miR159 and miR166 also have the function of plant fertility[50,51] and parthenocarpy, respectively. Additionally, miR396[52] and miR6149[53] are both ancient non-coding small RNAs, which can play crucial roles in various activities and stress response.

      To date, miR169 has been regarded as a ubiquitous regulator to responding various abiotic stress by obtaining new promoter[54]. And the target gene of miR169 in plants is nuclear transcription factor Y. Nuclear transcription factor Y is widely present in eukaryotes and can specifically bind CCAAT-box[55]. As a conserved transcription factor, NF-Y plays an important role in plant growth, tissue development and responding to stress. It has been reported that 3'UTR of NF-YA (subunit A) has a cleavage target for miR169, thus miR169 could regulate the expression level of NF-Y via transcript cleavage. The tobacco rootstock not only inputs nutrients from roots into scion, but endures grafting and external stress during the graft process.

      As is well known, MYB TF is one of the largest plant families and can clearly influence the trichome formation and content of artemisinin[56]. Additionally, GAMYB could encode R2R3MYB domain TF in plants, which is the target gene of miR159. Owing to the conservatism and universality of miR159, GAMYB plays a key role in inhibition of plant development. Besides, MADS-box, MYC2 and GRAS TFs are key nodes of ABA, JA and SA, JA, respectively. Thus, we can speculate that due to the different abundance of miRNAs, the expression of target genes may show huge changes, which further influence hormone levels and growth of Aa. Additionally, SBP-box and IIS transcription factor mainly play roles in defending abiotic stress and improve tolerance in adversity.

      Combined with existing reports and the results of this experiment, we put forward that the six miRNAs can act as potential biomarkers in successful heterografted plants. We conferred that there also existed mobile miRNAs during the grafting process, however, because of the short length and conservative between different samples of miRNAs, we cannot clearly identify the movement trajectory. The mobile miRNAs may perform an important function in grafted plants.

    • Hormones are also important for proper growth and development in plants, especially in promoting blood vessel growth and responding stress signal. We analyzed seven types of phytohormone transduction pathway and three types of hormone levels to realize its changing tendency during the grafting process.

      As a hormone that can regulate a variety of life activities, auxin could canalize the pathway to rebuild vascular tissue in graft union[11]. Additionally, it can regulate expansion of cortex cells and cell proliferation of vascular tissue during graft tissue remodeling, including differentiation of xylem and phloem. TIR1 possesses a F-box protein, part of formation of the SCFTIR1 ubiquitin-ligase complex[57], which interacts with Aux/IAA transcriptional repressor and mediates its degradation in the presence of auxin, thus controlling the initiation of adventitious root. In A. annua scion, the expression of TIR1 in the whole pathway showed an obvious up-regulation trend, whereas there is no evidence of significant genetic differences in tobacco during grafting. After auxin treatment, AUX/IAA, most of the GH3 genes and SAUR are all immediately expressed, this is the reason why these three were considered as primary-response genes[58]. The effect of GH3 family genes on plant growth and development is visible in plants. For instance, the mutation of GH3.9 in Arabidopsis thaliana leads to taproot length increase, suggesting members of the GH3 family may be involved in root development. Furthermore, GH3 can also exhibit the ability to alter leaf phenotypes and response to biotic or abiotic stress. ARF, short for auxin response factors, are considered as a new family formed during the evolution of land plants[59]. ARF genes are included in the control of many physiological effects, such as cell division and leaf morphology. ARF act as both transcriptional activators and repressors.

      It has been noticed that CKs (cytokinin) could regulate shoot regeneration, plant morphogenesis, biotic and abiotic stress. In addition, the role of CKs during the graft process is the focus point. Through regulatory networks of CKs, it can influence cell division and promote graft interface healing, thus leading to successful grafting[60]. A-ARR and B-ARR are mainly response regulators of cytokinin transduction. Type A-ARRs member, play a crucial role in negatively regulating the transduction of cytokinin, thus influencing multiple plant phenotypes and developmental process[61]. Type B-ARRs are positive regulators of cytokinin response, it can control the expression of downstream genes. Besides, B-ARR could also influence shoot development by constructing a hormone transcriptional network.

      According to our transcriptome data, the expression pattern of genes on the ABA transduction pathway appears to be an up-regulated stream, which is consistent with ABA physiological function. However, phytohormones do not always exhibit their role alone, especially ABA and auxin CKs, thus gene expression should be studied from a more comprehensive and systematic perspective[58]. As is well known, ABA (abscisic acid) refers to a kind of plant hormone that causes bud dormancy, leaf shedding and inhibit cell growth. In addition, many researchers have demonstrated that ABA, auxin, CKs have antagonistic action[42]. PYR/PYLs is a family of START proteins, which can directly influence pyrabactin and ABA signal. Besides, PYR/PYL act as receptors of ABA, which can in turn influence the expression of PP2C. SnRK2 (SNF1-related protein kinase2), mediates positive effects of ABA signal transduction, and then regulates root growth and seed germination[62]. ABFs are a series of transcription factors that could act in coordination on the ABA signal pathway.

      Gibberellin and ethylene have been identified to collaboratively trigger a variety of plant development processes, such as response to abiotic stress and regulation of ovule death[63]. GID1, short by GA receptor protein, and GID2 (a F-box protein), were successively proved to participate in GA signal transduction, which protein complex bind to the key factor DELLA protein.

      Through the synergistic or antagonistic action of JA and SA, many plant pathogen diseases could be defended. Besides, JA and SA also play an important role in the synthesis of metabolites respectively and adaptation to biotic and abiotic stress. MYC2, a bHLH transcription factor, has been recognized as the most essential role in JA signal transduction. During plant development and defence against pathogens, MYC2 could integrate multifaceted hormone signals to balance physical activity.

      However, in the analysis of transcriptome, owing to the positive and negative feedback adjustment among plants, genes in each signaling pathway did not show a consistent trend. At the level of gene expression, we can only focus on the key points reported, such as DELLA in gibberellin, MYC2 in JA. Additionally, through the pathway of hormone transduction, it is clearly that the regulation process of hormones is in a dynamic change law, which is closely linked to plant physiological state and changes in the external environment. The change trend of different phytohormones is not well understood, it is often coordinated by a variety of physiological and environmental factors. However, through the quantitative experiment we built, we can make a preliminary judgment that the changes of hormones in scion part and rootstock part were identical, and then the up-regulated content in scion did not show the same trend in rootstock. Additionally, phytohormone is always in a dynamic process in terms of content, the sampling of 30DAG just represents the hormonal equilibrium of grafted plant after a period of symbiosis.

      The content of endogenous phytohormone is always low, to clearly understand the changing pattern among grafted plants, five parts were divided. As shown in the bar chart of hormone content, hormone levels vary in each part of the plant (Fig. 6). ABA could promote leaf abscission and inhibit cell elongation. In Aa scion, Nb leaf and root, there was no significant gap in control group and treated group. However, it is clear that in Nb stem, the content of ABA is substantially increased after grafting, which may be related to the fact that plants perceive changes in the outside world as a factor that inhibits their own growth as rootstocks.

      Similarly, the content of iPR and tZR in Aa stem and Nb stem also showed huge dynamic change. Surprisingly, the content of JA was a substantial improvement in five parts, indicating JA may be involved in various physiological development among whole plants.

    • Heterografting is an important method to understand regulatory mechanisms of plant stress response, including long-distance transport small RNA, coding RNA, phytohormones and other metabolites. In the present study, we aimed to find out more new potential mechanisms during the grafting process of A. annua and N. benthamiana. We constructed an Aa/Nb grafting model to analyze its change in mRNA, miRNA and phytohormone level. A month of co-growth will help us understand quickly the molecular and metabolic changes occurring in plants. 7,794 DEGs (different expression genes) and 8,214 DEGs were identified in Aa scion and Nb rootstock, respectively, which mainly belong to defense response and signal transduction in scion and substance metabolism in rootstock. During the grafting process, 50 Nb genes and 20 Aa genes were identified as potentially active genes. miR159 and miR166 were considered as biomarkers of successful grafting plants owing to its conservation and physiology. Besides, R2R3-MYB, bHLH, GRAS, GAMYB, SBP-box, MADS-box, IIS in scion and NF-Y were regarded as key genes involved in growth and development of grafted plants. The target genes screened may be important for improving plant stress resistance and regulating metabolite production in vivo, which could be used for directional breeding.

      • This work was funded by National Key Research and Development Program of China (2022YFC3501700), the Shanghai Natural Science Foundation in China (20ZR1453800), and National Natural Science Foundation of China (32070332).

      • Wansheng Chen and Zongyou Lv are the Editorial Board members of journal Medicinal Plant Biology. They were blinded from reviewing or making decisions on the manuscript. The article was subject to the journal's standard procedures, with peer-review handled independently of these Editorial Board members and their research groups.

      • Supplemental Fig. S1 Flow chart of experimental analysis in Aa/Nb graft model.
      • Supplemental Fig. S2 (a) Annotated GO terms and KEGG pathway enrichment analysis of 7794 DEGS in A. annua scion (b) Annotated GO terms among 50 mobile N. benthamiana genes detected in A. annua scion. Red, bule, and green color represents biological process, cellular component, molecular function, respectively. The ordinate showed the Go serial number and function. The horizontal ordinate represents the number of genes in each Go term category. GO enrichment bar plot in upper left corner inflected the number and distribution of genes with significant differences located in biological process, cellular component and molecular function. The top25, top15, top 10 were orderly chosen for drawing the part of GO bar plot. In upper right corner, the x-coordinate rich factor means the number of differential genes or total number located in corresponding GO, ordinate is the GO functional annotation. Similarly, the KEGG photos in the bottom part included KEGG difference analysis of the system level (left) and the number of DEGs in top20 of KEGG pathway (right).
      • Supplemental Fig. S3 (a) Annotated GO terms and KEGG pathway enrichment analysis of 8214 DEGS in N. benthamiana rootstock. (b) Annotated GO terms among 20 mobile A. annua genes detected in N. benthamiana rootstock.
      • Copyright: © 2023 by the author(s). Published by Maximum Academic Press, Fayetteville, GA. This article is an open access article distributed under Creative Commons Attribution License (CC BY 4.0), visit https://creativecommons.org/licenses/by/4.0/.
    Figure (6)  Table (3) References (63)
  • About this article
    Cite this article
    Dong B, Li S, Wang X, Fang S, Li J, et al. 2023. Integrated analysis of transcriptome, small RNA, and phytohormonal content changes between Artemisia annua Linn. and Nicotiana benthamiana Domin in heterogeneous grafting. Medicinal Plant Biology 2:2 doi: 10.48130/MPB-2023-0002
    Dong B, Li S, Wang X, Fang S, Li J, et al. 2023. Integrated analysis of transcriptome, small RNA, and phytohormonal content changes between Artemisia annua Linn. and Nicotiana benthamiana Domin in heterogeneous grafting. Medicinal Plant Biology 2:2 doi: 10.48130/MPB-2023-0002

Catalog

  • About this article

/

DownLoad:  Full-Size Img  PowerPoint
Return
Return