Processing math: 100%
REVIEW   Open Access    

Metabolic regulation and engineering of artemisinin biosynthesis in A. annua

More Information
  • Artemisinin is a potent anti-malarial sesquiterpene lactone that is naturally biosynthesized in glandular trichomes of a Chinese herbal plant, Artemisia annua. Although semi-synthesis of artemisinin in yeast has been feasible, at present the A. annua plant is still the main commercial source of artemisinin. The content of artemisinin however is low in A. annua, limiting its supply to malarial victims. So it's crucial to elevate artemisinin production in A. annua. Up to date artemisinin biosynthetic pathway has been completely elucidated. And many regulatory factors, mediating diverse plant hormone or environmental signaling routes, have been identified to get involved in the regulation of artemisinin biosynthesis and glandular trichome formation. Understanding the regulatory mechanisms of artemisinin biosynthesis and glandular trichome formation will be conducive to our practice for improving artemisinin production by metabolic engineering. In this review, the metabolic regulatory network with regard to artemisinin biosynthesis and glandular trichome formation is summarized, and the advance on metabolic engineering to increase artemisinin content in A. annua is also discussed.
  • Ridership figures in subway systems worldwide indicate the preference of travelers toward subway lines[1]. For instance, the Beijing subway carries more than 10.5 million passengers daily[2], and many stations have been suffering from very high passenger density. Crowds with high-level density may endanger the safety of passengers and the security of the subway's operation. Indeed, several statistical analyses of accident data performed in Europe and the United States of America[3] show that a lot of injuries occur because of crowding[4]. Some crucial stations are overloaded and overcrowded. Moreover, when passengers come into a narrow area or change their walking direction (see Fig. 1), the passengers distribute unevenly and the facility capacity is insufficiently utilized, which will increase their swings, arching, and clogging behaviors[5]. Due to the significant difference between the capacities of the adjacent facilities, there will be waiting and swinging passengers in the junction of facilities[6], and the efficiencies of station operation and passenger evacuation will be lessened substantially[7].

    Figure 1.  Discrepancy of passenger density in a corner.

    Overcrowding and crushing incidents have occurred around the world[7]. In subway stations, congestion forms frequently at corners, junctions, and entrances of escalators and staircases. With the increase of passenger density, the interference among passengers are more serious, which decreased walking efficiency and passenger comfort. However, arrival intervals of passengers at facilities in subway stations are different from that of other enclosed buildings. In general, the inbound passengers arrive at the entrance of the facility in a Poisson distribution[8], and the alighted passengers arrive at the entrance of the subsequent facility of the platform in a Phase Type distribution[9]. Under emergencies, the evacuation efficiency of passengers is influenced by both the facility capacities and the initial distribution of passengers in subway stations. Therefore, investigating the more efficient gathering-scattering manner of passengers has become an emergent task for subway operational management[10]. Subject to the narrow room, the angled corner has to be constructed, which could decrease performance of a corridor. A discrete field cellular automaton (CA) model was proposed to reproduce the unidirectional pedestrian movement in a channel[11]. Considering speeds of passengers in merging areas decreased with turning angle increase, the social force model (SFM) is improved to describe their turning process[1]. Based on captured microscopic walking behaviors during the turning process, Dias reproduced pedestrians' walking behaviors on angled corridors[12]. However, few studies focused on passengers' walking behaviors at merging junctions in subway stations. Additionally, most of the studies considered that arrival intervals of the inbound passengers and passengers on intermediate facilities follow exponential distribution or uniform distribution[13,14], which differs from the actual scenario in a subway station. While the time interval of the alighted outbound passengers moving from platform to the merging junction generally follows a phase-type distribution[15]. To reproduce passengers' walking behaviors in subway stations, the queueing network model is proposed by taking different walking behaviors in various scenarios into account. In addition, the performance of typical corner corridors with various dimensions will be evaluated to improve managerial efficiency of subway stations.

    This paper aims to investigate the law involved in the circulation efficiency of the corners in subway stations. The remainder of this paper is organized as follows: the next provides an overview of the relevant literature. The statement about this problem is given subsequently. Then, the state of passenger flow on the corners is analyzed based on the queueing model proposed. To verify the approach, we exemplify simulations with a typical corner of the Beijing subway station. Finally, we finish with concluding remarks.

    According to related research, occupants' walking behaviors are subject to the capacity of the walking facility, which is determined by the width of the facility[12]. Many bottleneck experiments have studied the relationship between the width of the bottleneck and the speed of passenger flow[13]. Experiments were carried out to study the relationship between walking speed and population density, and the characteristic of the fundamental diagram in corridors with various widths. To study how the layout of the facility impacts passengers walking, controlled experiments with human participants[14] and non-human organisms are conducted[15]. Parameters of walking behaviors (speed, walking time, etc.) in regular facilities, such as corridors, stairs, and plazas are estimated[16]. In addition, some experiments focused on collective phenomena, such as jamming, oscillations[5], and spatial and temporal separation rules[17]. The flow increases with the increasing distance between the bottleneck and the holding area[18]. With the initial density of passengers in the holding area increasing, the passenger flow will increase correspondingly, but the rate of the increase will decrease[19]. Moreover, a modified version of the cumulative sum control chart algorithm is proposed to robustly detect steady states from density and speed time series of bottleneck experiments[20]. In addition, most research focuses on pedestrian walking behavior at bottlenecks or junctions of facilities.

    Some macroscopic models construct the physical environment as a network of nodes connected by arcs, and passengers are modeled as flow. The models are generally based on the queueing network[21] or fluid dynamics model[22]. Passenger flow moves from a source to a sink node via arcs without exceeding the capacity of each node and arc. Learning from the hydrodynamic model in vehicle movement, Hoogendoorn & Daament[18] presented a pedestrian dynamic model describing pedestrian movement.

    The above studies regarding bottlenecks, to a certain extent, help ease the congestion in the subway station. The research also provides helpful studies on the evacuation of specific stations, passenger travel organization in stations, optimization of station structure design, and rehabilitation of existing stations. Based on the studies, many simulation experiments of passenger evacuation from subway stations were also carried out[23]. When passengers traverse corners, they have to adjust their speed because of the change of walking direction, which increases interactions among passengers and decreases walking efficiency[20,24]. Their walking time increases by 2.15%−6.59% because of the congestion and turning[7]. However, the process of passenger gathering and scattering in the corners of the subway station is rarely explored. In this study, based on queueing theory, theoretical analysis is conducted to investigate the impact of the corner on passenger behavior and the influence of facility capacity on circulation efficiency. It is meaningful to develop the theoretical basis and practical reference for subway station designers and managers.

    Arrival intervals of passengers at subway stations are different from that of other enclosed buildings. Facilities in the subway station and passenger flow comprise a type of unique system with diversified arrival interval distributions[9]. To describe the circulation process of passengers in the facility, the movement model is presented based on the queueing theory. The circulation facility and passengers are considered as the server and items, respectively. Each queueing system is characterized by Markovian arrival rates, Markovian service times, and some parallel servers[25]. A realistic methodology for modeling the corner with uni-directional inbound passenger flow as a system of M/M/C/K queues is proposed in this paper, and the PH/PH(n)/C/C state-dependent queuing model[9] is established to analyze the process of alighted passengers (Fig. 2).

    Figure 2.  Framework of passenger gathering-scattering analysis.

    Facility capacity can be defined as the maximum number of passengers that can be served in a given period of time. While passengers walk in the facility, they should keep a distance from the wall and barrier, and the effective width of the circulation facility is 0.75 m less than its actual width[21]. To maximize the utilization of facility capacity, passengers line up orderly and walk in straight lines, which is similar to vehicle operations on the road. Thus, circulation facilities are divided into Pedestrian Lanes (PLs, see Fig. 3). The width of a PL is the lateral spacing required for an adult moving, that is, wd equals the mean shoulder width of the adult. Therefore, the number of PLs in the facility is denoted as pl, and calculated as Eqn (1).

    Figure 3.  Self-organizing passenger line method in the facility.
    pl=[W0.75wd=Weffwd] (1)

    where [ ] stands for rounding the number down. W is the actual width of the corridor, Weff is feasible width of the corridor, and wd is the shoulder width of a passenger and equals 0.6 m[8].

    The lengthwise PL is divided into Pedestrian Segments (PSs) to represent servers in the queueing system. The length of a PS is the longitudinal distance per capita, which equals the safety margin needed to avoid interference with the prior passenger. The length of the facility and a PS are Le and le, respectively. The number of servers in a queue can be calculated as:

    ns=[Lele] (2)

    The total number of servers in a state-dependent queueing model is:

    Ns=pl×ns (3)

    When passenger density approaches 5 peds/m2, the passengers' walking will be seriously disturbed, and the passenger flow will come to a halt[25]. Therefore, the facility accommodating capacity N can be expressed as:

    N=[5LW] (4)

    where L denotes the length of the corridor.

    However, there may still be some forward movement at n = N, and a population of n = N+1 is an impossibility, and VN+1= 0[25].

    When n passengers occupy a single corridor, they travel at an average walking speed, Vn, for n = 1, 2,…, Ns. We examined the walking speed, Vn, as a function of the number of pedestrians occupying the facility. With no influence of other participants and barriers, the average expected walking speed in the facility is free-flow speed, Vf, which is typically 1.34 m/s. When passenger density is greater than 0.54 peds/m2, passengers will interact with others and the walking speed will decrease with density increase. The average walking speed of n passengers on the facility is:

    Vn=1.5×exp[(n1β)γ] (5)

    where n is the number of passengers in the facility, n=1,2,,c,,N.

    Furthermore, the algebraic relationship between β and γ is shown below[25]:

    γ=ln[ln(Va/1.5)ln(Vb/1.5)]/ln(a1b1) (6)
    β=a1[ln(1.5/Va)]1/γ=b1[ln(1.5/Vb)]1/γ (7)

    where a=2×Le×W, b=4×Le×W, Va=0.64, and Vb=0.25.

    Because of the change in the corridor width or walking direction (see Fig. 4), the walking speed of passengers will slow down at the junction of facilities. With the density increasing, passengers in free flow will turn into the crowded flow, which easily leads to congestion. To describe the circulation process of passengers in the corners, passengers are divided into three categories according to the current location.

    Figure 4.  Schematic diagrams of occupant states at corners.

    (1) Waiting passengers are denoted as S. They wait for available PSs in the buffer area when all PSs are occupied;

    (2) Active passengers are denoted as A. They are walking at a certain speed passing through the facility;

    (3) Blocked passengers are denoted as B. Their target facilities are occupied, and the buffer area is full of waiting occupants. They halt and wait for the buffer area or target facility.

    The state space of passengers in the prior facility is represented as follows:

    x(i)=(ai,bi,si) (8)

    where ai, bi, and si are the number of active, blocked, and waiting passengers, respectively. The sample space of this triplet of random variables (Ai,Bi,Si) is called the state space and defined as P(i)={(a,b,s)N3,a+bNs,a+b+sNi}. Ni is the accommodating or jam capacity of the prior facility.

    The M/M/C/C queueing system mentioned above is based on the following assumptions:

    (1) Passengers distribute evenly on the PLs because of crowding;

    (2) Active passengers walk in line in the same lane, that is, passengers will select the adjacent queue at route transfer probability when it comes to the junctions of facilities;

    (3) Blocked passengers creep along with queues;

    (4) Passengers are served with a first in first out (FIFO) mechanism in the M/M/C/C system.

    In the M/M/C/C system, the time spent by each passenger in the facility is exponentially distributed with the rate Mn, and the service rate μ is a function of the number of passengers, which can be defined as:

    μ=le×Vf×dc (9)

    where Vf is the free flow speed of passengers in the corridor, and dc is population density when the number of passengers equals the capacity of corridor C.

    Then, the overall service rate U in the queueing model is:

    U=Ns×μ (10)

    When there are n passengers occupying the facility, the service rate μ can be defined as a function of walking speed and passenger density:

    μn=le×Vn×dn (11)

    where Vn is the average walking speed when there are n passengers in the facility, for n = 1, 2, …, C, …,N. dn is the prevailing passenger density.

    Assume that the random number of items is n (nN), and the arrival of passenger flow is a Poisson process. The expected throughput of the facility is Mn or n×μ, the average service time is:

    ts=1n×μ (12)

    The limiting probability for the random number of items n (nC) in an M/M/C/K queueing model, pn=Pr{n=N}, is as follows[21]:

    pn=λλλ(μ)(2μ)(nμ)p0=(λ/μ)nn!p0 (13)

    where n = 1, 2, …, C.

    When n >C, the average service time is:

    t's=1U (14)

    The steady-state probability is calculated as follows:

    pn=(λ/μ)np!pnpp0 (15)

    According to the formula of total probability equals 1:

    p0+(λ/μ)nn!p0+(λ/μ)np!pnpp0=1 (16)

    where p0 is the empty system probability and given by Eqn (17):

    p0=[1+p1n1(λ/μ)nn!+n=p(λ/μ)np!pnp]1=[p1n=0(λ/μ)nn!+(λ/μ)pp!(1λ/pμ)]1 (17)

    The passenger steady-state probability pn is denoted as πn. Thus, the passenger steady-state probability on the prior facility is π(i)n. The global balance equations along with the use of a normalizing constraint are shown as follows:

    {π(i)Q(i)=0xX(i)π(i)x=1 (18)

    where π(i)x is an element of π(i), which denotes the stationary distribution of x passengers.

    The matrix Q(i) contains the transition rates between all pairs of states in p(i). All rates are rates averaged over time according to Q(i). The non-diagonal elements, Q(i)sj,(sj), represent the rates at which the transition between the state s and j takes place. The diagonal elements are defined as Q(i)ss=jsQ(i)sj. Thus, Q(i)ss represents the departure rate from the state s. Each equation of the system of global balance equations can be written as:

    jsπ(i)jQ(i)js=π(i)sQ(i)ss (19)

    It, therefore, balances the inflow and the outflow for a given state s. We define Q(i) as a function of the following structural parameters:

    (1) λi: the arrival rate to queue i;

    (2) μi: the service rate of a server at queue i;

    (3) ˜μib: the unblocking rate at queue i given that there are b blocked passengers. The vector considers that all possible values of b are denoted ˜μi;

    (4) pKi: the blocked probability of queue i, where Ki equals to Ns.

    The above four parameters allow us to describe the transition rates between different states of queue i. Then, we describe the possible transition rates as:

    Q(i)=f(λi,μi,˜μi,pKi) (20)

    The transition rates are different in different passengers states, and Q(i):

    (1) is λi, when the initial state i is a+b+1<Ci. The arrival rate of entrance in front of queue i is λi, and the new state j is (a+1,b,s);

    (2) is λi, when the initial state i is a+b+1==Ci and s+1NsCi. The arrival rate of entrance in front of queue i is λi, and the new state j is (a+1,b,s);

    (3) is ˜μib, whens==0. And the new state j is (a,b1,s);

    (4) is μi(1pKi) or aμs(1pKi), when s==0. The new state j is (a,b1,s);

    (5) is ˜μib, when s1. And the new state j is (a+1,b1,s1);

    (6) is μi(1pKi), when s1. And the new state j is μi(1pKi);

    (7) is μi(pKi), when the initial state is (a,b,s)). And the new state j is (a1,b+1,s).

    A PL i is considered as a queue i for the corner, which is regarded as a series-parallel queue. There would be a routing decision to be made at each queueing system. When passengers transfer from the queueing system of the prior corridor to that of the target corridor, the transfer probability is denoted as pij.

    When the volume of passengers is greater than the number of servers, passenger blocking will occur, and there are some waiting passengers in the junction. We assume 'blocking after service' (BAS)[26] in the M/M/C/K system. The passenger leaves the prior queueing system i, and the target queueing system j may be blocked with probability pKi. pKi is approximated by the weighted average of the blocking probabilities of all target queues:

    pKi=jpijP(Nj=Kj) (21)

    Based on the equation of conservation of passenger flow, pij is the selection probability of passenger bounding for queueing system j from i. When the prior queueing system i is blocked, the arrival rate of its target queueing system j will decrease. Assume that the arrival rate is less than the service rate of i, and the effective arrival rate of i is approximated as follows[22]:

    λeffi=wd×dc×vin (22)

    where vin is the walking speed of n passengers in the queueing system i.

    Meanwhile, the effective arrival rate of the target queue is obtained via the flow conservation equations. It can be approximated as follows:

    λeffj=(1p(Ni=Ni))+ipijλeffi (23)

    Based on the general expansion method (GEM)[27], we can approximate the effective service rate at the upstream queueing system i to take into account all blocking after service caused by the target queueing system j. When blocking occurs, a virtual vertex hj is added preceeding the finite vertex j. The virtual queueing system is added to register the blocked passengers at j, and modeled as a M/M/∞ queue, as shown in Fig. 5.

    Figure 5.  Virtual queue when the target queue is blocked.

    The effective service rate of queueing system i is μeffi. Queueing system hj helps to accumulate the time passengers wait before entering queueing system j and to compute the effective arrival rate to queue j:

    (˜μeffi)1=μ1i+pkj(μhj)1 (24)

    where μhj is the corrected exponential service rate at hj. The mean probability of occupant being blocked at queue i, ˜pij, is calculated as Eqn (25):

    ˜pij=pijp(Nj=Cj)pji=pijp(Nj=Nj)lpilp(Nl=kl)pijlpil (25)

    Each target facility unblocks passengers in facility i at its own rate, which is the acceptance rate of blocked occupants. We approximate the acceptance rate of a target facility by the average acceptance rate ˜μai (the average is taken across the different target facilities), and can be calculated by Eqn (26):

    1˜μai=j˜pij1rij˜μefficj (26)

    Let D(i,b) denoting the number of distinct target queueing systems that are blocking b occupants at facility i, and the average unblocking rate at queueing system i is D(i,b)טμai. Suppose that there are no special walking behaviors, such as surpassing, or lateral walking. The mean unblocking time at facility i 1/˜μ(i,b) is calculated according to the FIFO unblocking mechanism[28]:

    1˜μ(i,b)=min(b,card(I+))d=1p(D(i,b)=d)1d˜μai (27)

    where I+ represents the set of target facilities of facility i, and card(I+)is its cardinality. p(D(i,b)=d) is the blocking probability of b occupants of d queues at facility i, and calculated as follows:

    p(D(i,b)=d)=l(i,b,d)L(i,b,d)b!jJ+l(i,b,d)j!jJ+˜pl(i,d,d)jij (28)

    where l(i,b,d)jL(i,b,d)j . The set of L(i,b,d)j is defined as:

    L(i,b,d)j{jJ+l(i,b,d)j=bjJ+II(l(i,b,d)j>0)=dl(i,b,d)j0,jJ+ (29)

    where II(l(i,b,d)j>0) is the indicator function. The first equation in Eqn (29) means that there is a total of b items blocked at queueing system i. The second means that these jobs are blocked by d different target queueing systems. For a given vector l(i,b,d)j satisfying the system of Eqn (29), there are b!jJ+l(i,b,d)j! different realizations associated with δ(i,b,d). That corresponds to the number of permutations of a vector of b elements where element j is repeated l(i,b,d)j times.

    Putting Eqn (24) and (27) together, we obtain:

    1˜μib=1˜μaimin(b,card(p+))d=11dl(i,b,d)L(i,b,d)b!jJ+l(i,b,d)j!jJ+˜pl(i,d,d)jij (30)

    where J+ is the set of queues.

    There are b blocked passengers at facility i, and tbi represents the random vector of blocking time of passengers. The effective service rate μeffiof facility i is calculated as follows:

    μeffi=1μi+PfiE[tbi] (31)

    where PfiE[tbi] is the mean blocking time of b blocked occupants at facility i. E[tbi] is the expected blocking time and can be computed as follows[28]:

    E[tbi]=b1P(bi=b)P(bi>0)E[tbi|bi=b]=1bbj=1E[t(i,b)j] (32)

    where t(i,b)j represents the blocking time of the passenger that is unblocked in the jth position given that there were b blocked passengers.

    The average time between successive passenger departure is given that there are b blocked passengers at queueing system i is represented by 1˜μib, that of the jth passenger to be unblocked by:

    E[tbi|bi=b]=1bbk=1k˜μ(i,k) (33)

    Furthermore:

    E[tbi]=b1P(bi=b)P(bi>0)bk=1kb×1˜μ(i,k) (34)

    The traffic capacity of facility i is μeffici, and the proportion of arrivals to queueing system j that arises from the blocked passengers from queue i is rij, which is calculated as follows[28]:

    rij=˜pijλeffiλeffj (35)

    The throughput of passengers via facility i is:

    θi=rijμeffici (36)

    E(Lq) is the average number of passengers waiting in the queue in the equilibrium condition (peds), and can be calculated as:

    E(Lq)=(np)nπ0ρn!(1ρ)2[1(n+1)ρNn+(Nn)ρNn+1] (37)

    where ρ denoted service intensity of the facility, and is calculated as follows:

    ρ=μeffλeff (38)

    The mean length of the queue is computed as follows:

    E(L)=λμ(1πn)+(np)nπ0ρn!(1ρ)2[1(Nn+1)ρNn+(Nn)ρNn+1] (39)

    The model is used to investigate the walking characteristics of passengers at corners in subway stations. Passengers are modeled as items and facilities as severs. The layout of the corner of facilities in HUIXINXIJIENANKOU station (abbreviated as H station) of Beijing subway station is given and shown in Fig. 6.

    Figure 6.  The topology of the corner in H station.

    The corner is defined as a two-node network as shown in Fig. 7. The virtual queue vk is added to register the blocked passengers at target queueing system k and is modeled as an M/M/∞ queue.

    Figure 7.  Model network structure of a corner between walking facilities.

    We carried out the field survey in H station. The corner (queueing system) is characterized by Poisson arrivals, general service, and multiple servers. According to the dimension of the corner, the parameters of queueing systems are tabulated in Table 1. The exogenous parameters λi and pij are estimated according to field survey data, respectively.

    Table 1.  Configuration of the queueing network of a corner.
    NodeLength
    (m)
    Width
    (m)
    NsNμUK
    Corridor i104.61702300.4373176
    Corner j44.692920.5954146
    Corridor k84721600.4331146
     | Show Table
    DownLoad: CSV

    The field surveys at rush-hour durations were conducted from the 9th April, 2018 to the 12th July, 2018 at H station of Beijing subway system. Passenger volumes and speeds in three durations (7:30−8:00, 8:00−8:30, and 8:30−9:00) were taken into consideration. To analyze passenger behavior in an automated fashion, a digital camera was attached to the ceiling. Video footage at a unidirectional flow bottleneck was extracted. The data consisted of 95 groups of occupant flow (the data of each day is a group), and the most crowded group had an average number of passengers of 170 peds/min (see Fig. 8). The cumulative 83% of the rush hour volume is 8,800 peds/h at the stations. Hence, 8,800 peds/h and above capacities are considered, and speeds at corners are shown in Table 2.

    Figure 8.  The observation of volumes of passenger flow in subway stations.
    Table 2.  Descriptive statistics of the speed of passengers at the corner.
    Observation
    region
    Mean (m/s)Median (m/s)Max
    (m/s)
    Min
    (m/s)
    Standard deviation (m/s)
    Prior corridor0.4490.3760.7590.2300.163
    Corner junction0.2480.2010.4950.1600.119
    Target corridor0.5790.5051.0550.3800.127
     | Show Table
    DownLoad: CSV

    The observation of the paired comparisons of arrival rate and average speeds of the passengers are statistically analyzed using the binomial test (confidence level 95%). Figure 9 presents all the pairwise scatter plots. The first row of the scatter plots shows that the average speeds of passengers are associated with a negative arrival rate. In the second row, the third and the fourth column show the relationship between the coefficient of the average speeds, the average speeds of the prior corridor is associated positively with that of the junction and the target corridor. Likewise, the third and the fourth row show similar relationships.

    Figure 9.  Pairwise scatter plots between coefficients of arrival rate and speeds.

    Speeds of passengers at the prior corridor are higher than that of the corner junction and vary greatly. When passengers enter the corner, the speed change is less than before, and the average speed at the corner is about 37% lower than that of the prior corridor. When passenger volume is close to the corner capacity, the follow-up will sway and congestion occurs. The swaying range and the walking speed turned out to be negatively correlated in the normal situation[29]. Entering the corner, passengers tend to choose the shortest path and often sidle up to the wall along the turning angle[30], and they will slow down and congestion is observed. Through the corner junction, passengers will speed up, and the average speed in the target corridor will increase by 156% compared to that of the corner junction. The average speed of passengers and expected time traversing the corner are shown in Fig. 10 with various arrival rates.

    Figure 10.  Relationship between arrival rate and average speed and expected time. (a) Average speed of passengers at prior corriodor. (b) Average speed of passengers at the junction. (c) Average speed of passengers at target corridor. (d) Average speed of passgengers traversing the facility.

    The passenger flow is strongly correlated with the train arrival, which will cause passenger volume to increase sharply during the train dwelling phase. Because field surveys were conducted during peak hours, the observations showed that the maximum volume of the alighting passenger amounted to 364 during train dwelling at H station, and the minimum volume of alighting passengers was 81. Three different processes were observed: alighting, alighting and boarding simultaneously and boarding. Alighting and boarding simultaneously mean alighting and boarding at the same time and passengers interweave to change their position outbound and inbound. The correlation of passenger volume and speed at α = 0.05 significance level is shown in Table 3.

    Table 3.  Correlation analysis between the volume of passengers and their speed.
    CorrelationPassenger volume (peds)Mean time (s)Mean speed (peds/s)r
    Alighting passengers14019.196.2250.237
    Boarding passengers3812.982.9270.236
    Total passengers17823.917.6700.039
     | Show Table
    DownLoad: CSV

    According to Table 3, there is a correlation between the volume and speed, and the correlation r0.05/2= 0.232. The number of alighting and boarding passengers of the whole train is 6 peds/s to 8 peds/s. When entering the corner, the arrival rate of the queuing network ranges from 3 peds/s to 11 peds/s because passengers adjust their speed. The walking performance is analyzed with various arrival rates when passengers traverse the corner. The walking parameters of the queueing network, such as blocking probability, throughput, and expected time are discussed.

    During peak hours, most passengers are commuters and they are strongly purpose-oriented. The head of the alighted passengers walks at free-flow speed. Their speeds are relatively higher, and the arrival rate of passengers at the corner is nearly 3 peds/s. The blocking probability of the corner is zero. With the arrival rates increasing, the speed of passengers decreases continuously. When the arrival rate is about 5 peds/s, the blocking at the corner occurs and the blocking probability is about 0.2. As the arrival rate increases continually, the blocking probability increases correspondingly. When the arrival rate comes up to 7 peds/s, the blocking probability of the corner tends to be constant and not increase further (see Fig. 11). The speed of passengers is concentrated in 0.55 m/s at the arrival rate being 7 peds/s and then declines to 0.37 m/s at 11peds/s. The statistics of the case of 364 passengers demonstrate that the higher arrival rate of passengers could diminish the corner performance.

    Figure 11.  The blocking probability with various arrival rates.

    In the case of 364 passengers, the throughput of the corner is increasing with the arrival rate at first because of their higher speed. Then, the throughput begins to decrease under 6 peds/s arrival rate because of crowding (see Fig. 12). With the arrival rate increasing, the facility capacity will be fully utilized. However, when the arrival rate exceeds 7 peds/s, the queueing system will be more crowded, and the follow-up occupants have to swing at the rear of the queue. And the expected time of passengers traversing the corner will be prolonged, and the number of waiting passengers in the buffer area will increase with the arrival rate increasing.

    Figure 12.  The throughput and expected time with various arrival rates.

    The average speed calculated by the queueing model is compared with the results of the field survey in Fig. 13. With the arrival rate increasing, the average speed of passengers decreases because of the congestion in the corner. In the arrival rate ranging from 3 to 11 peds/s, the average speed obtained by queueing system is about 14% more than that of the field survey. On the one hand, the error between the two results lies in the queueing model itself. The queueing model is macroscopic and cannot illustrate the walking behaviors of individuals in subway stations. Based on the field survey data, the average speed calculated by queueing model is consistent with the results of the field survey.

    Figure 13.  The comparison of average speeds vary with arrival rates.

    Here we investigate the corner performance with various widths of the target corridor, which could improve or diminish the circulation efficiency. According to advice from subway managers, the width of the target corridor ranges from 3.5 m to 5.0 m. In the case of 364 passengers, the blocking probability (BP), throughput, and expected time are used to analyze passengers' walking behaviors under various widths of the target corridor. According to Supplemental Fig. S1, the blocking probability increases rapidly when the width of the target corridor (4 m) is 10% less than that of the prior corridor (4.6 m), and the steady states of passenger flow is congested with the arrival rate increasing. When the width is 3.5 m, the steady state of blocking probability will increase to 0.6130. It is100% more than that of the corridor with 4.0 m. However, if the width of the target corridor was enlarged by 10%, the steady state of passenger flow will be less crowded. Even though the arrival rate mounts up to 11 peds/s, the blocking probability will decrease by 99%. Therefore, the augment of the target corridor has a large influence on the blocking probability of passenger flow.

    The throughput of the queueing system and arrival rate are highly correlated before congestions occur. The throughput increases with the arrival rate increasing at first. Once congestion occurs, the throughput will decrease rapidly, which is following the faster-is-slower effect. If the width of the target corridor is 10% less than that of the proper corridor, the performance of the corner could degrade by a large margin. In the proper width of the target corridor (4.4 m), the throughput will increase by about 20% of that of the width of the target corridor being 4.0 m. However, if the width of the target corridor is larger than the proper width, the growth of throughput is not significant. With the arrival rate increasing, the decline of throughput of the queueing system is mainly because congestions occur at the prior corridor. When the arrival rate is more than 7 peds/s, the throughput could fluctuate slightly because of the prior corridor crowding.

    When the arrival rate is 3 peds/s, the throughput rises with the increase of the width of the target corridor and gets to the highest (3 peds/s, the red dot shown in Fig. 14). Then, the throughput is kept constant despite the width increasing. Likewise, the blue and yellow dots indicate the highest throughputs with the arrival rate being 5 peds/s (3.9 peds) and 7 peds/s (4.8 peds) respectively. The throughput begins to decline when the arrival rate is 8 peds/s (the green dot) and is about 4.2 peds/s. With the arrival rate increases, the throughput will decline slightly and be illustrated by black (2.8 peds/s), grey (3.1 peds/s), and purple dots (3.4 peds/s) shown in Supplemental Fig. S1 because of the prior corridor crowding.

    Figure 14.  The throughput of queueing network changes with the width of the target corridor.

    The expected time of passengers traversing the queueing system has a strong relationship with the throughput. From Supplemental Fig. S2, if the width of the target corridor (4.0 m) is 13% less than that of the prior corridor (4.6 m), the expected time will prolong by 3%, and the corridor will be more crowded. Otherwise, if the width of the target corridor is larger by 8.7% (5 m) than that of the prior corridor, the expected time will decrease by about 5%. Besides, with the increasing arrival rate, the expected time will increase by a wide margin and is merely related to the width of the prior corridor.

    Simulation experiments in the case of various widths of the target corridor were ran with different arrival rates ranging from 3 to 11 peds/s for model validation. The simulation experiments of the corner in H subway station are conducted by AnyLogic considering different parameters, including the width of the target corridor and the arrival rate of passenger flow. The model is verified by comparing the simulation results with the parameters calculated by the queueing model.

    As shown in Fig. 15, relative deviations of simulation results compared with queueing model data are used to measure the differences. The queueing model presented in this paper exhibits a range of collective phenomena at the subway station corner. The larger the arrival rate, the longer the expected walking time of passengers. In the beginning, the expected walking time reduced rapidly with the target facility width increasing, and then the change is relatively slow. Furthermore, the expected time calculated by the queueing system is less than that of the simulation results. That is because the simulation results in Anylogic are based on the Social Force Model, which is a microscopic model considering the interaction among pedestrians (see Supplemental Fig. S3). However, the trend of expected time by queueing system is similar to that of field survey with the target corridor width increasing. The simulation results show the ability of the queueing model to capture the characteristics of passenger walking movement in the corners of subway stations.

    Figure 15.  The comparison results for model verification. (a) Walking speeds of passengers in various scenarios. (b) The walking time of passengers in various scenarios.

    Congestion is a common phenomenon at corners in subway stations, which decreases passengers circulation efficiency and prolongs evacuation duration under unexpected adverse conditions. The queueing model in this paper exhibits a range of the parameters of walking behavior. The simulation results show the validity of the proposed model to emulate passenger movement, which can help managers to assess the bottleneck of the circulation facility in subway stations. To promote the circulation efficiency, station managers would guide passengers to select the appropriate evacuation or traversing routes to avoid overcrowding. In addition, the model also captures the relationship between congestion and the arrival rate of passengers, which can help station managers establish a targeted passenger flow control scheme to avoid excessive passengers in stations and trains. When the arrival rate exceeds 7 peds/s, the blocking probability increases significantly, and congestion occurs. Reasonable passenger flow control is helpful to ease the jam and keep passengers walking safer. Corridor width is critical to the circulation efficiency of passengers in the subway stations. If the width of the target corridor is enlarged by 10%, the steady state of passenger flow will be less crowded. The model provides an effective method and tool for passenger organization and safe design practices in subway stations. It is also an effective way to investigate the passenger behavior under similar circumstances. However, the field data and experiments are limited for model calibration and validation in this paper, and focus on the plane corner. Further research needs to perform more observations and obtained more real walking data of passengers, and extend the scenario of corners with vertical facilities (such as stairs and ramps). Other detailed behavior that may influence passenger walking performance should be also considered and analyzed. When passenger flow increases sharply, the changeable corridor should be reassigned to change walking direction or prolong walking time in broad walking facilities, such as hallways, which decreases congestion probability of passenger flow. When passenger flow is slightly congested, loitering passengers should be fast to reduce mean speed, which helps to increase throughput of corridors in subway stations.

    This research is supported by the National Key R&D Program of China (No. 2020YFB1600701).

  • The authors declare that they have no conflict of interest. Jie Xu is the Editorial Board member of Journal Digital Transportation and Safety. He was blinded from reviewing or making decisions on the manuscript. The article was subject to the journal’s standard procedures, with peer-review handled independently of this Editorial Board member and his research groups.

  • [1]

    Tu Y. 2011. The discovery of artemisinin (qinghaosu) and gifts from Chinese medicine. Nature Medicine 17:1217−20

    doi: 10.1038/nm.2471

    CrossRef   Google Scholar

    [2]

    Mutabingwa TK. 2005. Artemisinin-based combination therapies (ACTS): best hope for malaria treatment but inaccessible to the needy! Acta Tropica 95:305−15

    doi: 10.1016/j.actatropica.2005.06.009

    CrossRef   Google Scholar

    [3]

    Weathers PJ, Arsenault PR, Covello PS, McMickle A, Teoh KH, et al. 2011. Artemisinin production in Artemisia annua: studies in planta and results of a novel delivery method for treating malaria and other neglected diseases. Phytochemistry Reviews 10:173−83

    doi: 10.1007/s11101-010-9166-0

    CrossRef   Google Scholar

    [4]

    Jiang Y, Shui J, Zhang B, Chin JW, Yue R. 2020. The potential roles of artemisinin and its derivatives in the treatment of type 2 diabetes mellitus. Frontiers in Pharmacology 11:585487

    doi: 10.3389/fphar.2020.585487

    CrossRef   Google Scholar

    [5]

    Lee AS, Hur HJ, Sung MJ. 2020. The effect of artemisinin on inflammation-associated lymphangiogenesis in experimental acute colitis. International Journal of Molecular Sciences 21:8068

    doi: 10.3390/ijms21218068

    CrossRef   Google Scholar

    [6]

    Efferth T. 2007. Willmar Schwabe Award 2006: Antiplasmodial and antitumor activity of artemisinin from bench to bedside. Planta Medica 73:299−309

    doi: 10.1055/s-2007-967138

    CrossRef   Google Scholar

    [7]

    Zhu C, Cook SP. 2012. A concise synthesis of (+)-artemisinin. Journal of the American Chemical Society 134:13577−79

    doi: 10.1021/ja3061479

    CrossRef   Google Scholar

    [8]

    Ro DK, Paradise EM, Ouellet M, Fisher KJ, Newman KL, et al. 2006. Production of the antimalarial drug precursor artemisinic acid in engineered yeast. Nature 440:940−43

    doi: 10.1038/nature04640

    CrossRef   Google Scholar

    [9]

    Ro DK, Ouellet M, Paradise EM, Burd H, Eng D, et al. 2008. Induction of multiple pleiotropic drug resistance genes in yeast engineered to produce an increased level of anti-malarial drug precursor, artemisinic acid. BMC Biotechnology 8:83

    doi: 10.1186/1472-6750-8-83

    CrossRef   Google Scholar

    [10]

    Paddon CJ, Westfall PJ, Pitera DJ, Benjamin K, Fisher K, et al. 2013. High-level semi-synthetic production of the potent antimalarial artemisinin. Nature 496:528−32

    doi: 10.1038/nature12051

    CrossRef   Google Scholar

    [11]

    Duke MV, Paul RN, Elsohly HN, Sturtz G, Duke SO. 1994. Localization of artemisinin and artemisitene in foliar tissues of glanded and glandless biotypes of Artemisia annua L. International Journal of Plant Sciences 155:365−72

    doi: 10.1086/297173

    CrossRef   Google Scholar

    [12]

    Kumar S, Gupta SK, Singh P, Bajpai P, Gupta MM, et al. 2004. High yields of artemisinin by multi-harvest of Artemisia annua crops. Industrial Crops & Products 19:77−90

    doi: 10.1016/j.indcrop.2003.07.003

    CrossRef   Google Scholar

    [13]

    Newman JD, Chappell J. 1999. Isoprenoid biosynthesis in plants: carbon partitioning within the cytoplasmic pathway. Critical Reviews in Biochemistry and Molecular Biology 34:95−106

    doi: 10.1080/10409239991209228

    CrossRef   Google Scholar

    [14]

    Bouvier F, Rahier A, Camara B. 2005. Biogenesis, molecular regulation and function of plant isoprenoids. Progress in Lipid Research 44:357−429

    doi: 10.1016/j.plipres.2005.09.003

    CrossRef   Google Scholar

    [15]

    Ram M, Khan MA, Jha P, Khan S, Kiran U, et al. 2010. HMG-CoA reductase limits artemisinin biosynthesis and accumulation in Artemisia annua L. plants. Acta Physiologiae Plantarum 32:859−66

    doi: 10.1007/s11738-010-0470-5

    CrossRef   Google Scholar

    [16]

    Towler MJ, Weathers PJ. 2007. Evidence of artemisinin production from IPP stemming from both mevalonate and non-mevalanate pathways. Plant Cell Reports 26:2129−36

    doi: 10.1007/s00299-007-0420-x

    CrossRef   Google Scholar

    [17]

    Mercke P, Bengtsson M, Bouwmeester HJ, Posthumus MA, Brodelius PE. 2000. Molecular cloning, expression, and characterization of amorpha-4,11-diene synthase, a key enzyme of artemisinin biosynthesis in Artemisia annua L. Archives of Biochemistry and Biophysics 381:173−80

    doi: 10.1006/abbi.2000.1962

    CrossRef   Google Scholar

    [18]

    Teoh KH, Polichuk DR, Reed DW, Nowak G, Covello PS. 2006. Artemisia annua L. (Asteraceae) trichome-specific cDNAs reveal CYP71AV1, a cytochrome P450 with a key role in the biosynthesis of the antimalarial sesquiterpene lactone artemisinin. FEBS Letters 580:1411−16

    doi: 10.1016/j.febslet.2006.01.065

    CrossRef   Google Scholar

    [19]

    Zhang Y, Teoh KH, Reed DW, Maes L, Goossens A, et al. 2008. The molecular cloning of artemisinic aldehyde Δ11(13) reductase and its role in glandular trichome-dependent biosynthesis of artemisinin in Artemisia annua. Journal of Biological Chemistry 283:21501−8

    doi: 10.1074/jbc.M803090200

    CrossRef   Google Scholar

    [20]

    Teoh KH, Polichuk DR, Reed DW, Covello PS. 2009. Molecular cloning of an aldehyde dehydrogenase implicated in artemisinin biosynthesis in Artemisia annua. Botany 87:635−42

    doi: 10.1139/B09-032

    CrossRef   Google Scholar

    [21]

    Sy LK, Brown GD. 2002. The mechanism of the spontaneous autoxidation of dihydroartemisinic acid. Tetrahedron 58:897−908

    doi: 10.1016/S0040-4020(01)01193-0

    CrossRef   Google Scholar

    [22]

    Brown GD, Sy LK. 2004. In vivo transformations of dihydroartemisinic acid in Artemisia annua plants. Tetrahedron 60:1139−59

    doi: 10.1016/j.tet.2003.11.070

    CrossRef   Google Scholar

    [23]

    Olsson ME, Olofsson LM, Lindahl AL, Lundgren A, Brodelius M, et al. 2009. Localization of enzymes of artemisinin biosynthesis to the apical cells of glandular secretory trichomes of Artemisia annua L. Phytochemistry 70:1123−28

    doi: 10.1016/j.phytochem.2009.07.009

    CrossRef   Google Scholar

    [24]

    Olofsson L, Engström A, Lundgren A, Brodelius PE. 2011. Relative expression of genes of terpene metabolism in different tissues of Artemisia annua L. BMC Plant Biology 11:45

    doi: 10.1186/1471-2229-11-45

    CrossRef   Google Scholar

    [25]

    Zheng H, Fu X, Shao J, Tang Y, Yu M, et al. 2023. Transcriptional regulatory network of high-value active ingredients in medicinal plants. Trends in Plant Science 28:429−46

    doi: 10.1016/j.tplants.2022.12.007

    CrossRef   Google Scholar

    [26]

    Licausi F, Ohme-Takagi M, Perata P. 2013. APETALA2/Ethylene Responsive Factor (AP2/ERF) transcription factors: mediators of stress responses and developmental programs. New Phytologist 199:639−49

    doi: 10.1111/nph.12291

    CrossRef   Google Scholar

    [27]

    Van der Fits L, Memelink J. 2000. ORCA3, a jasmonate-responsive transcriptional regulator of plant primary and secondary metabolism. Science 289:295−97

    doi: 10.1126/science.289.5477.295

    CrossRef   Google Scholar

    [28]

    Sears MT, Zhang H, Rushton PJ, Wu M, Han S, et al. 2014. NtERF32: a non-NIC2 locus AP2/ERF transcription factor required in jasmonate-inducible nicotine biosynthesis in tobacco. Plant Molecular Biology 84:49−66

    doi: 10.1007/s11103-013-0116-2

    CrossRef   Google Scholar

    [29]

    Yu Z, Li J, Yang C, Hu W, Wang L, et al. 2012. The jasmonate-responsive AP2/ERF transcription factors AaERF1 and AaERF2 positively regulate artemisinin biosynthesis in Artemisia annua L. Molecular Plant 5:353−65

    doi: 10.1093/mp/ssr087

    CrossRef   Google Scholar

    [30]

    Lu X, Zhang L, Zhang F, Jiang W, Shen Q, et al. 2013. AaORA, a trichome-specific AP2/ERF transcription factor of Artemisia annua, is a positive regulator in the artemisinin biosynthetic pathway and in disease resistance to Botrytis cinerea. New Phytologist 198:1191−202

    doi: 10.1111/nph.12207

    CrossRef   Google Scholar

    [31]

    Tan H, Xiao L, Gao S, Li Q, Chen J, et al. 2015. TRICHOME AND ARTEMISININ REGULATOR 1 is required for trichome development and artemisinin biosynthesis in Artemisia annua. Molecular Plant 8:1396−411

    doi: 10.1016/j.molp.2015.04.002

    CrossRef   Google Scholar

    [32]

    Ma Y, Xu D, Li L, Zhang F, Fu X, et al. 2018. Jasmonate promotes artemisinin biosynthesis by activating the TCP14-ORA complex in Artemisia annua. Science Advances 4:eaas9357

    doi: 10.1126/sciadv.aas9357

    CrossRef   Google Scholar

    [33]

    Ma Y, Xu D, Yan X, Wu ZK, Kayani SI, et al. 2021. Jasmonate- and abscisic acid-activated AaGSW1-AaTCP15/AaORA transcriptional cascade promotes artemisinin biosynthesis in Artemisia annua. Plant Biotechnology Journal 19:1412−28

    doi: 10.1111/pbi.13561

    CrossRef   Google Scholar

    [34]

    Phukan UJ, Jeena GS, Shukla RK. 2016. WRKY transcription factors: molecular regulation and stress responses in plants. Frontiers in Plant Science 7:760

    doi: 10.3389/fpls.2016.00760

    CrossRef   Google Scholar

    [35]

    Ma D, Pu G, Lei C, Ma L, Wang H, et al. 2009. Isolation and characterization of AaWRKY1, an Artemisia annua transcription factor that regulates the amorpha-4, 11-diene synthase gene, a key gene of artemisinin biosynthesis. Plant & Cell Physiology 50:2146−61

    doi: 10.1093/pcp/pcp149

    CrossRef   Google Scholar

    [36]

    Jiang W, Fu X, Pan Q, Tang Y, Shen Q, et al. 2016. Overexpression of AaWRKY1 leads to an enhanced content of artemisinin in Artemisia annua. BioMed Research International 2016:7314971

    doi: 10.1155/2016/7314971

    CrossRef   Google Scholar

    [37]

    Chen M, Yan T, Shen Q, Lu X, Pan Q, et al. 2017. GLANDULAR TRICHOME-SPECIFIC WRKY 1 promotes artemisinin biosynthesis in Artemisia annua. New Phytologist 214:304−16

    doi: 10.1111/nph.14373

    CrossRef   Google Scholar

    [38]

    Fu X, Peng B, Hassani D, Xie L, Liu H, et al. 2021. AaWRKY9 contributes to light- and jasmonate-mediated to regulate the biosynthesis of artemisinin in Artemisia annua. New Phytologist 231:1858−74

    doi: 10.1111/nph.17453

    CrossRef   Google Scholar

    [39]

    Vom Endt D, Kijne JW, Memelink J. 2002. Transcription factors controlling plant secondary metabolism: what regulates the regulators? Phytochemistry 61:107−14

    doi: 10.1016/s0031-9422(02)00185-1

    CrossRef   Google Scholar

    [40]

    Morohashi K, Zhao M, Yang M, Read B, Lloyd A, et al. 2007. Participation of the Arabidopsis bHLH factor GL3 in trichome initiation regulatory events. Plant Physiology 145:736−46

    doi: 10.1104/pp.107.104521

    CrossRef   Google Scholar

    [41]

    Qian Y, Zhang T, Yu Y, Gou L, Yang J, et al. 2021. Regulatory mechanisms of bHLH transcription factors in plant adaptive responses to various abiotic stresses. Frontiers in Plant Science 12:677611

    doi: 10.3389/fpls.2021.677611

    CrossRef   Google Scholar

    [42]

    Ji Y, Xiao J, Shen Y, Ma D, Li Z, et al. 2014. Cloning and characterization of AabHLH1, a bHLH transcription factor that positively regulates artemisinin biosynthesis in Artemisia annua. Plant & Cell Physiology 55:1592−604

    doi: 10.1093/pcp/pcu090

    CrossRef   Google Scholar

    [43]

    Hong G, Xue X, Mao Y, Wang L, Chen X. 2012. Arabidopsis MYC2 interacts with DELLA proteins in regulating sesquiterpene synthase gene expression. The Plant Cell 24:2635−48

    doi: 10.1105/tpc.112.098749

    CrossRef   Google Scholar

    [44]

    Shen Q, Lu X, Yan T, Fu X, Lv Z, et al. 2016. The jasmonate-responsive AaMYC2 transcription factor positively regulates artemisinin biosynthesis in Artemisia annua. New Phytologist 210:1269−81

    doi: 10.1111/nph.13874

    CrossRef   Google Scholar

    [45]

    Shu G, Tang Y, Yuan M, Wei N, Zhang F, et al. 2022. Molecular insights into AabZIP1-mediated regulation on artemisinin biosynthesis and drought tolerance in Artemisia annua. Acta Pharmaceutica Sinica B 12:1500−13

    doi: 10.1016/j.apsb.2021.09.026

    CrossRef   Google Scholar

    [46]

    Xiang L, Jian D, Zhang F, Yang C, Bai G, et al. 2019. The cold-induced transcription factor bHLH112 promotes artemisinin biosynthesis indirectly via ERF1 in Artemisia annua. Journal of Experimental Botany 70:4835−48

    doi: 10.1093/jxb/erz220

    CrossRef   Google Scholar

    [47]

    Kim SY, Kim SG, Kim YS, Seo PJ, Bae M, et al. 2006. Exploring membrane-associated NAC transcription factors in Arabidopsis: implications for membrane biology in genome regulation. Nucleic Acids Research 35:203−13

    doi: 10.1093/nar/gkl1068

    CrossRef   Google Scholar

    [48]

    Mao X, Zhang H, Qian X, Li A, Zhao G, et al. 2012. TaNAC2, a NAC-type wheat transcription factor conferring enhanced multiple abiotic stress tolerances in Arabidopsis. Journal of Experimental Botany 63:2933−46

    doi: 10.1093/jxb/err462

    CrossRef   Google Scholar

    [49]

    Chen X, Wang Y, Lv B, Li J, Luo L, et al. 2014. The NAC family transcription factor OsNAP confers abiotic stress response through the ABA pathway. Plant & Cell Physiology 55:604−19

    doi: 10.1093/pcp/pct204

    CrossRef   Google Scholar

    [50]

    Lv Z, Wang S, Zhang F, Chen L, Hao X, et al. 2016. Overexpression of a novel NAC domain-containing transcription factor gene (AaNAC1) enhances the content of artemisinin and increases tolerance to drought and Botrytis cinerea in Artemisia annua. Plant & Cell Physiology 57:1961−71

    doi: 10.1093/pcp/pcw118

    CrossRef   Google Scholar

    [51]

    Zhang F, Fu X, Lv Z, Lu X, Shen Q, et al. 2015. A basic leucine zipper transcription factor, AabZIP1, connects abscisic acid signaling with artemisinin biosynthesis in Artemisia annua. Molecular Plant 8:163−75

    doi: 10.1016/j.molp.2014.12.004

    CrossRef   Google Scholar

    [52]

    Tang Y, Li L, Yan T, Fu X, Shi P, et al. 2018. AaEIN3 mediates the downregulation of artemisinin biosynthesis by ethylene signaling through promoting leaf senescence in Artemisia annua. Frontiers in Plant Science 9:413

    doi: 10.3389/fpls.2018.00413

    CrossRef   Google Scholar

    [53]

    Hao X, Zhong Y, Nützmann HW, Fu X, Yan T, et al. 2019. Light-induced artemisinin biosynthesis is regulated by the bZIP transcription factor AaHY5 in Artemisia annua. Plant & Cell Physiology 60:1747−60

    doi: 10.1093/pcp/pcz084

    CrossRef   Google Scholar

    [54]

    Vernoud V, Laigle G, Rozier F, Meeley RB, Perez P, et al. 2009. The HD-ZIP IV transcription factor OCL4 is necessary for trichome patterning and anther development in maize. The Plant Journal 59:883−94

    doi: 10.1111/j.1365-313X.2009.03916.x

    CrossRef   Google Scholar

    [55]

    Zhu H, Sun X, Zhang Q, Song P, Hu Q, et al. 2018. GLABROUS (CmGL) encodes a HD-ZIP IV transcription factor playing roles in multicellular trichome initiation in melon. Theoretical and Applied Genetics 131:569−79

    doi: 10.1007/s00122-017-3019-9

    CrossRef   Google Scholar

    [56]

    Yan T, Chen M, Shen Q, Li L, Fu X, et al. 2017. HOMEODOMAIN PROTEIN 1 is required for jasmonate-mediated glandular trichome initiation in Artemisia annua. New Phytologist 213:1145−55

    doi: 10.1111/nph.14205

    CrossRef   Google Scholar

    [57]

    Xie L, Yan T, Li L, Chen M, Ma Y, et al. 2021. The WRKY transcription factor AaGSW2 promotes glandular trichome initiation in Artemisia annua. Journal of Experimental Botany 72:1691−701

    doi: 10.1093/jxb/eraa523

    CrossRef   Google Scholar

    [58]

    Yan T, Li L, Xie L, Chen M, Shen Q, et al. 2018. A novel HD-ZIP IV/MIXTA complex promotes glandular trichome initiation and cuticle development in Artemisia annua. New Phytologist 218:567−78

    doi: 10.1111/nph.15005

    CrossRef   Google Scholar

    [59]

    Shi P, Fu X, Shen Q, Liu M, Pan Q, et al. 2018. The roles of AaMIXTA1 in regulating the initiation of glandular trichomes and cuticle biosynthesis in Artemisia annua. New Phytologist 217:261−76

    doi: 10.1111/nph.14789

    CrossRef   Google Scholar

    [60]

    Kirik V, Simon M, Huelskamp M, Schiefelbein J. 2004. The ENHANCER OF TRY AND CPC1 gene acts redundantly with TRIPTYCHON and CAPRICE in trichome and root hair cell patterning in Arabidopsis. Developmental Biology 268:506−13

    doi: 10.1016/j.ydbio.2003.12.037

    CrossRef   Google Scholar

    [61]

    Stracke R, Ishihara H, Huep G, Barsch A, Mehrtens F, et al. 2007. Differential regulation of closely related R2R3-MYB transcription factors controls flavonol accumulation in different parts of the Arabidopsis thaliana seedling. The Plant Journal 50:660−77

    doi: 10.1111/j.1365-313X.2007.03078.x

    CrossRef   Google Scholar

    [62]

    Wester K, Digiuni S, Geier F, Timmer J, Fleck C, et al. 2009. Functional diversity of R3 single-repeat genes in trichome development. Development 136:1487−96

    doi: 10.1242/dev.021733

    CrossRef   Google Scholar

    [63]

    Matías-Hernández L, Jiang W, Yang K, Tang K, Brodelius PE, et al. 2017. AaMYB1 and its orthologue AtMYB61 affect terpene metabolism and trichome development in Artemisia annua and Arabidopsis thaliana. The Plant Journal 90:520−34

    doi: 10.1111/tpj.13509

    CrossRef   Google Scholar

    [64]

    Martin C, Paz-Ares J. 1997. MYB transcription factors in plants. Trends in Genetics 13:67−73

    doi: 10.1016/S0168-9525(96)10049-4

    CrossRef   Google Scholar

    [65]

    Dubos C, Stracke R, Grotewold E, Weisshaar B, Martin C, et al. 2010. MYB transcription factors in Arabidopsis. Trends in Plant Science 15:573−81

    doi: 10.1016/j.tplants.2010.06.005

    CrossRef   Google Scholar

    [66]

    Zhou Z, Tan H, Li Q, Li Q, Wang Y, et al. 2020. TRICHOME AND ARTEMISININ REGULATOR 2 positively regulates trichome development and artemisinin biosynthesis in Artemisia annua. New Phytologist 228:932−45

    doi: 10.1111/nph.16777

    CrossRef   Google Scholar

    [67]

    Qin W, Xie L, Li Y, Liu H, Fu X, et al. 2021. An R2R3-MYB transcription factor positively regulates the glandular secretory trichome initiation in Artemisia annua L. Frontiers in Plant Science 12:657156

    doi: 10.3389/fpls.2021.657156

    CrossRef   Google Scholar

    [68]

    Xie L, Yan T, Li L, Chen M, Hassani D, et al. 2021. An HD-ZIP-MYB complex regulates glandular secretory trichome initiation in Artemisia annua. New Phytologist 231:2050−64

    doi: 10.1111/nph.17514

    CrossRef   Google Scholar

    [69]

    Aquil S, Husaini AM, Abdin MZ, Rather GM. 2009. Overexpression of the HMG-CoA reductase gene leads to enhanced artemisinin biosynthesis in transgenic Artemisia annua plants. Planta Medica 75:1453−58

    doi: 10.1055/s-0029-1185775

    CrossRef   Google Scholar

    [70]

    Nafis T, Akmal M, Ram M, Alam P, Ahlawat S, et al. 2011. Enhancement of artemisinin content by constitutive expression of the HMG-CoA reductase gene in high-yielding strain of Artemisia annua L. Plant Biotechnology Reports 5:53−60

    doi: 10.1007/s11816-010-0156-x

    CrossRef   Google Scholar

    [71]

    Xiang L, Zeng L, Yuan Y, Chen M, Wang F, et al. 2012. Enhancement of artemisinin biosynthesis by overexpressing DXR, CYP71AV1 and CPR in the plants of Artemisia annua L. Plant Omics J 5:503−7

    Google Scholar

    [72]

    Han J, Liu B, Ye H, Wang H, Li Z, et al. 2006. Effects of overexpression of the endogenous farnesyl diphosphate synthase on the artemisinin content in Artemisia annua L. Journal of Integrative Plant Biology 48:482−87

    doi: 10.1111/j.1744-7909.2006.00208.x

    CrossRef   Google Scholar

    [73]

    Banyai W, Kirdmanee C, Mii M, Supaibulwatana K. 2010. Overexpression of farnesyl pyrophosphate synthase (FPS) gene affected artemisinin content and growth of Artemisia annua L. Plant Cell, Tissue and Organ Culture 103:255−65

    doi: 10.1007/s11240-010-9775-8

    CrossRef   Google Scholar

    [74]

    Ma C, Wang H, Lu X, Wang H, Xu G, et al. 2009. Terpenoid metabolic profiling analysis of transgenic Artemisia annua L. by comprehensive two-dimensional gas chromatography time-of-flight mass spectrometry. Metabolomics 5:497−506

    doi: 10.1007/s11306-009-0170-6

    CrossRef   Google Scholar

    [75]

    Shen Q, Chen YF, Wang T, Wu SY, Lu X, et al. 2012. Overexpression of the cytochrome P450 monooxygenase (cyp71av1) and cytochrome P450 reductase (cpr) genes increased artemisinin content in Artemisia annua (Asteraceae). Genetics and Molecular Research 11:3298−309

    doi: 10.4238/2012.September.12.13

    CrossRef   Google Scholar

    [76]

    Alam P, Abdin MZ. 2011. Over-expression of HMG-CoA reductase and amorpha-4,11-diene synthase genes in Artemisia annua L. and its influence on artemisinin content. Plant Cell Reports 30:1919−28

    doi: 10.1007/s00299-011-1099-6

    CrossRef   Google Scholar

    [77]

    Chen Y, Shen Q, Wang Y, Wang T, Wu S, et al. 2013. The stacked overexpression of FPS, CYP71AV1 and CPR genes leads to the increase of artemisinin level in Artemisia annua L. Plant Biotechnology Reports 7:287−95

    doi: 10.1007/s11816-012-0262-z

    CrossRef   Google Scholar

    [78]

    Lu X, Shen Q, Zhang L, Zhang F, Jiang W, et al. 2013. Promotion of artemisinin biosynthesis in transgenic Artemisia annua by overexpressing ADS, CYP71AV1 and CPR genes. Industrial Crops & Products 49:380−85

    doi: 10.1016/j.indcrop.2013.04.045

    CrossRef   Google Scholar

    [79]

    Shi P, Fu X, Liu M, Shen Q, Jiang W, et al. 2017. Promotion of artemisinin content in Artemisia annua by overexpression of multiple artemisinin biosynthetic pathway genes. Plant Cell, Tissue and Organ Culture 129:251−59

    doi: 10.1007/s11240-017-1173-z

    CrossRef   Google Scholar

    [80]

    Wang Y, Jing F, Yu S, Chen Y, Wang T, et al. 2011. Co-overexpression of the HMGR and FPS genes enhances artemisinin content in Artemisia annua L. Journal of Medicinal Plants Research 5:3396−403

    Google Scholar

    [81]

    Cheng A, Lou Y, Mao Y, Lu S, Wang L, et al. 2007. Plant terpenoids: Biosynthesis and ecological functions. Journal of Integrative Plant Biology 49:179−86

    doi: 10.1111/j.1744-7909.2007.00395.x

    CrossRef   Google Scholar

    [82]

    Lv Z, Zhang F, Pan Q, Fu X, Jiang W, et al. 2016. Branch pathway blocking in Artemisia annua is a useful method for obtaining high yield artemisinin. Plant & Cell Physiology 57:588−602

    doi: 10.1093/pcp/pcw014

    CrossRef   Google Scholar

  • Cite this article

    Tang Y, Xiang L, Zhang F, Tang K, Liao Z. 2023. Metabolic regulation and engineering of artemisinin biosynthesis in A. annua. Medicinal Plant Biology 2:4 doi: 10.48130/MPB-2023-0004
    Tang Y, Xiang L, Zhang F, Tang K, Liao Z. 2023. Metabolic regulation and engineering of artemisinin biosynthesis in A. annua. Medicinal Plant Biology 2:4 doi: 10.48130/MPB-2023-0004

Figures(2)  /  Tables(1)

Article Metrics

Article views(4776) PDF downloads(1194)

REVIEW   Open Access    

Metabolic regulation and engineering of artemisinin biosynthesis in A. annua

Medicinal Plant Biology  2 Article number: 4  (2023)  |  Cite this article

Abstract: Artemisinin is a potent anti-malarial sesquiterpene lactone that is naturally biosynthesized in glandular trichomes of a Chinese herbal plant, Artemisia annua. Although semi-synthesis of artemisinin in yeast has been feasible, at present the A. annua plant is still the main commercial source of artemisinin. The content of artemisinin however is low in A. annua, limiting its supply to malarial victims. So it's crucial to elevate artemisinin production in A. annua. Up to date artemisinin biosynthetic pathway has been completely elucidated. And many regulatory factors, mediating diverse plant hormone or environmental signaling routes, have been identified to get involved in the regulation of artemisinin biosynthesis and glandular trichome formation. Understanding the regulatory mechanisms of artemisinin biosynthesis and glandular trichome formation will be conducive to our practice for improving artemisinin production by metabolic engineering. In this review, the metabolic regulatory network with regard to artemisinin biosynthesis and glandular trichome formation is summarized, and the advance on metabolic engineering to increase artemisinin content in A. annua is also discussed.

    • Malaria is a life-threatening disease that is particularly epidemic in sub-Saharan Africa and South-East Asia. According to the World Malaria Report, approximately 2.2 billion people were at the risk of malaria; of them, an estimated 219 million cases occurred worldwide, and consequently 435,000 people, mostly children, were killed by malaria (World Malaria Report 2018, WHO). Fortunately, artemisinin, a kind of sesquiterpene lactone, which was first found by Chinese scientists from a traditional Chinese herbal plant Artemisia annua, can effectively cure malaria[1]. To date, artemisinin-based combination therapies (ACTs) have been recommended as the first-choice treatment method for drug-resistant malaria by the World Health Organization (WHO)[2, 3]. Besides the anti-malarial effect, artemisinin also exhibits pharmaceutical activities in the treatment of diabetes[4], inflammatory response[5] and tumor[6].

      Different strategies were applied for increasing artemisinin supply such as chemical synthesis, semi-synthesis from microbially sourced artemisinic acid, and metabolic engineering in A. annua. Chemical synthesis of artemisinin is difficult and costly. Although a concise synthesis of artemisinin from inexpensive cyclohexanone was reported, which reached the gram scale, there is still quite a lot to do before large-scale production can be achieved[7]. Semi-synthesis of artemisinin has achieved success. Artemisinic acid, the precursor for chemically synthesizing artemisinin, can be biosynthesized through successive enzymatic reactions in engineered yeast cells at 25 g/L, ensuring artemisinin production can reach an industrial scale[810]. But the semi-synthesis by yeast is still relatively high in cost and low in production, limiting its extensive application. Therefore, at present, Artemisia annua plants remain the primary source for obtaining artemisinin.

      Artemisinin is mainly extracted from A. annua leaves, but its content in wild A. annua is low (0.1%–1% dry weight)[11, 12], unable to meet global demand. It is therefore of great importance to elevate artemisinin production in A. annua and develop new A. annua lines with high yield artemisinin by metabolic engineering and genetic breeding.

      Over a decade ago, the artemisinin biosynthetic pathway has been completely elucidated at the molecular level. The precursor for artemisinin biosynthesis is farnesyl diphosphate (FDP) containing three isoprenyl 5-carbon (C5) units, which is formed by the condensation of three isopentenyl diphosphates (IPPs) through the catalysis of farnesyl diphosphate synthase (FPS). Isopentenyl diphosphate (IPP) and its isomer dimethylally diphosphate (DMAPP) are the general 5-carbon precursors for all terpenoids, including monoterpenes, sesquiterpenes, diterpenes and so on. IPP can be synthesized through two distinct pathways in the plant: the cytosolic mevalonate pathway (MVA) and the plastidial methylerythritol phosphate (MEP) pathway[13, 14]. In the MVA pathway, HMG-CoA reductase (HMGR) is the rate-limiting enzyme[15], while in the MEP pathway, DXR is the rate-limiting enzyme[16]. The two enzymes are the preferred target enzymes for metabolically engineering artemisinin biosynthesis in the upstream pathway of artemisinin biosynthesis.

      After the formation of FDP, amorpha-4,11-diene synthase (ADS), which is believed to be the first committed step in artemisinin biosynthesis, catalyzes the cyclization of FDP into cyclic amorpha-4,11-diene as the unique precursor for artemisinin[17]. Then a multiple-function enzyme CYP71AV1 converts amorpha-4,11-diene into artemisinic alcohol, artemisinic aldehyde and artemisinic acid sequentially[18]. Subsequently, artemisinic aldehyde is reduced to dihydroartemisinic aldehyde under the catalysis of artemisinic aldehyde Δ11 (13) reductase (DBR2)[19]. Then dihydroartemisinic aldehyde is converted into dihydroartemisinic acid by aldehyde dehydrogenase (ALDH1)[20]. Dihydroartemisinic acid is the direct precursor for artemisinin, which is transformed into artemisinin by photo oxidative reaction without enzymes[21, 22]. Meanwhile, artemisinic acid can be converted into arteannuin B via a photo-oxidative non-enzymatic reaction[21, 22]. The four genes, including ADS, CYP71AV1, DBR2 and ALDH1, which are artemisinin-specific biosynthetic genes, are specifically expressed in glandular trichomes of A. annua[23, 24]. The complete elucidation of the artemisinin biosynthetic pathway provides the biosynthetic genes necessary for engineering artemisinin biosynthesis, and facilitates the development of new A. annua varieties with a high-yield of artemisinin.

      Besides the elucidation of the artemisinin biosynthetic pathway, huge progress has been made in dissecting the complicated regulatory networks of artemisinin biosynthesis at the transcriptional and post-translational levels. Many transcription factors, which mediate different signaling pathways from plant hormones and other environmental factors like light, coldness etc, are involved in the regulation of artemisinin biosynthesis. To date, a variety of regulatory genes, such as those encoding transcription factors and kinases, have been characterized to play important parts in regulating artemisinin biosynthesis. These identified regulatory genes are valuable in developing A. annua plant lines with high-yield artemisinin and certain beneficial horticultural traits. In a recently published review, Zheng et al. made a comprehensive description of transcriptional regulatory network of artemisinin biosynthesis induced by diverse phytohormones and environmental factors, which would be helpful for better understanding the regulatory mechanism of artemisinin biosynthesis[25].

      Moreover, as artemisinin is exclusively synthesized and stored in glandular trichomes (GT) of A. annua[23, 24], the density and number of GTs has a large effect on the content of artemisinin in A. annua plants. Therefore, it is also necessary to dissect the regulatory mechanism of glandular trichome formation and identify the regulatory factors involved.

      In this review, we summarize the accomplishments in the study of the molecular regulation of artemisinin biosynthetic pathway and glandular trichome initiation, and also discuss biotechnological approaches toward higher artemisinin production in A. annua plants.

    • Plant hormones, like jasmonate (JA), abscisic acid (ABA), salicylic acid (SA) etc, and other environmental signals regulate artemisinin biosynthesis via the mediation of transcription factors (TF), and they form a cascade signaling network. Among the hormones, jasmonate (JA) signaling is most extensively studied. A number of transcription factors, which are responsive to these signals, have been identified to be involved in regulating artemisinin biosynthesis. These transcription factors belong to different TF families respectively, such as APETALA2/ethylene-response factors (AP2/ERF), WRKY, basic helix-loop-helix (bHLH), NAC and so on (Fig. 1).
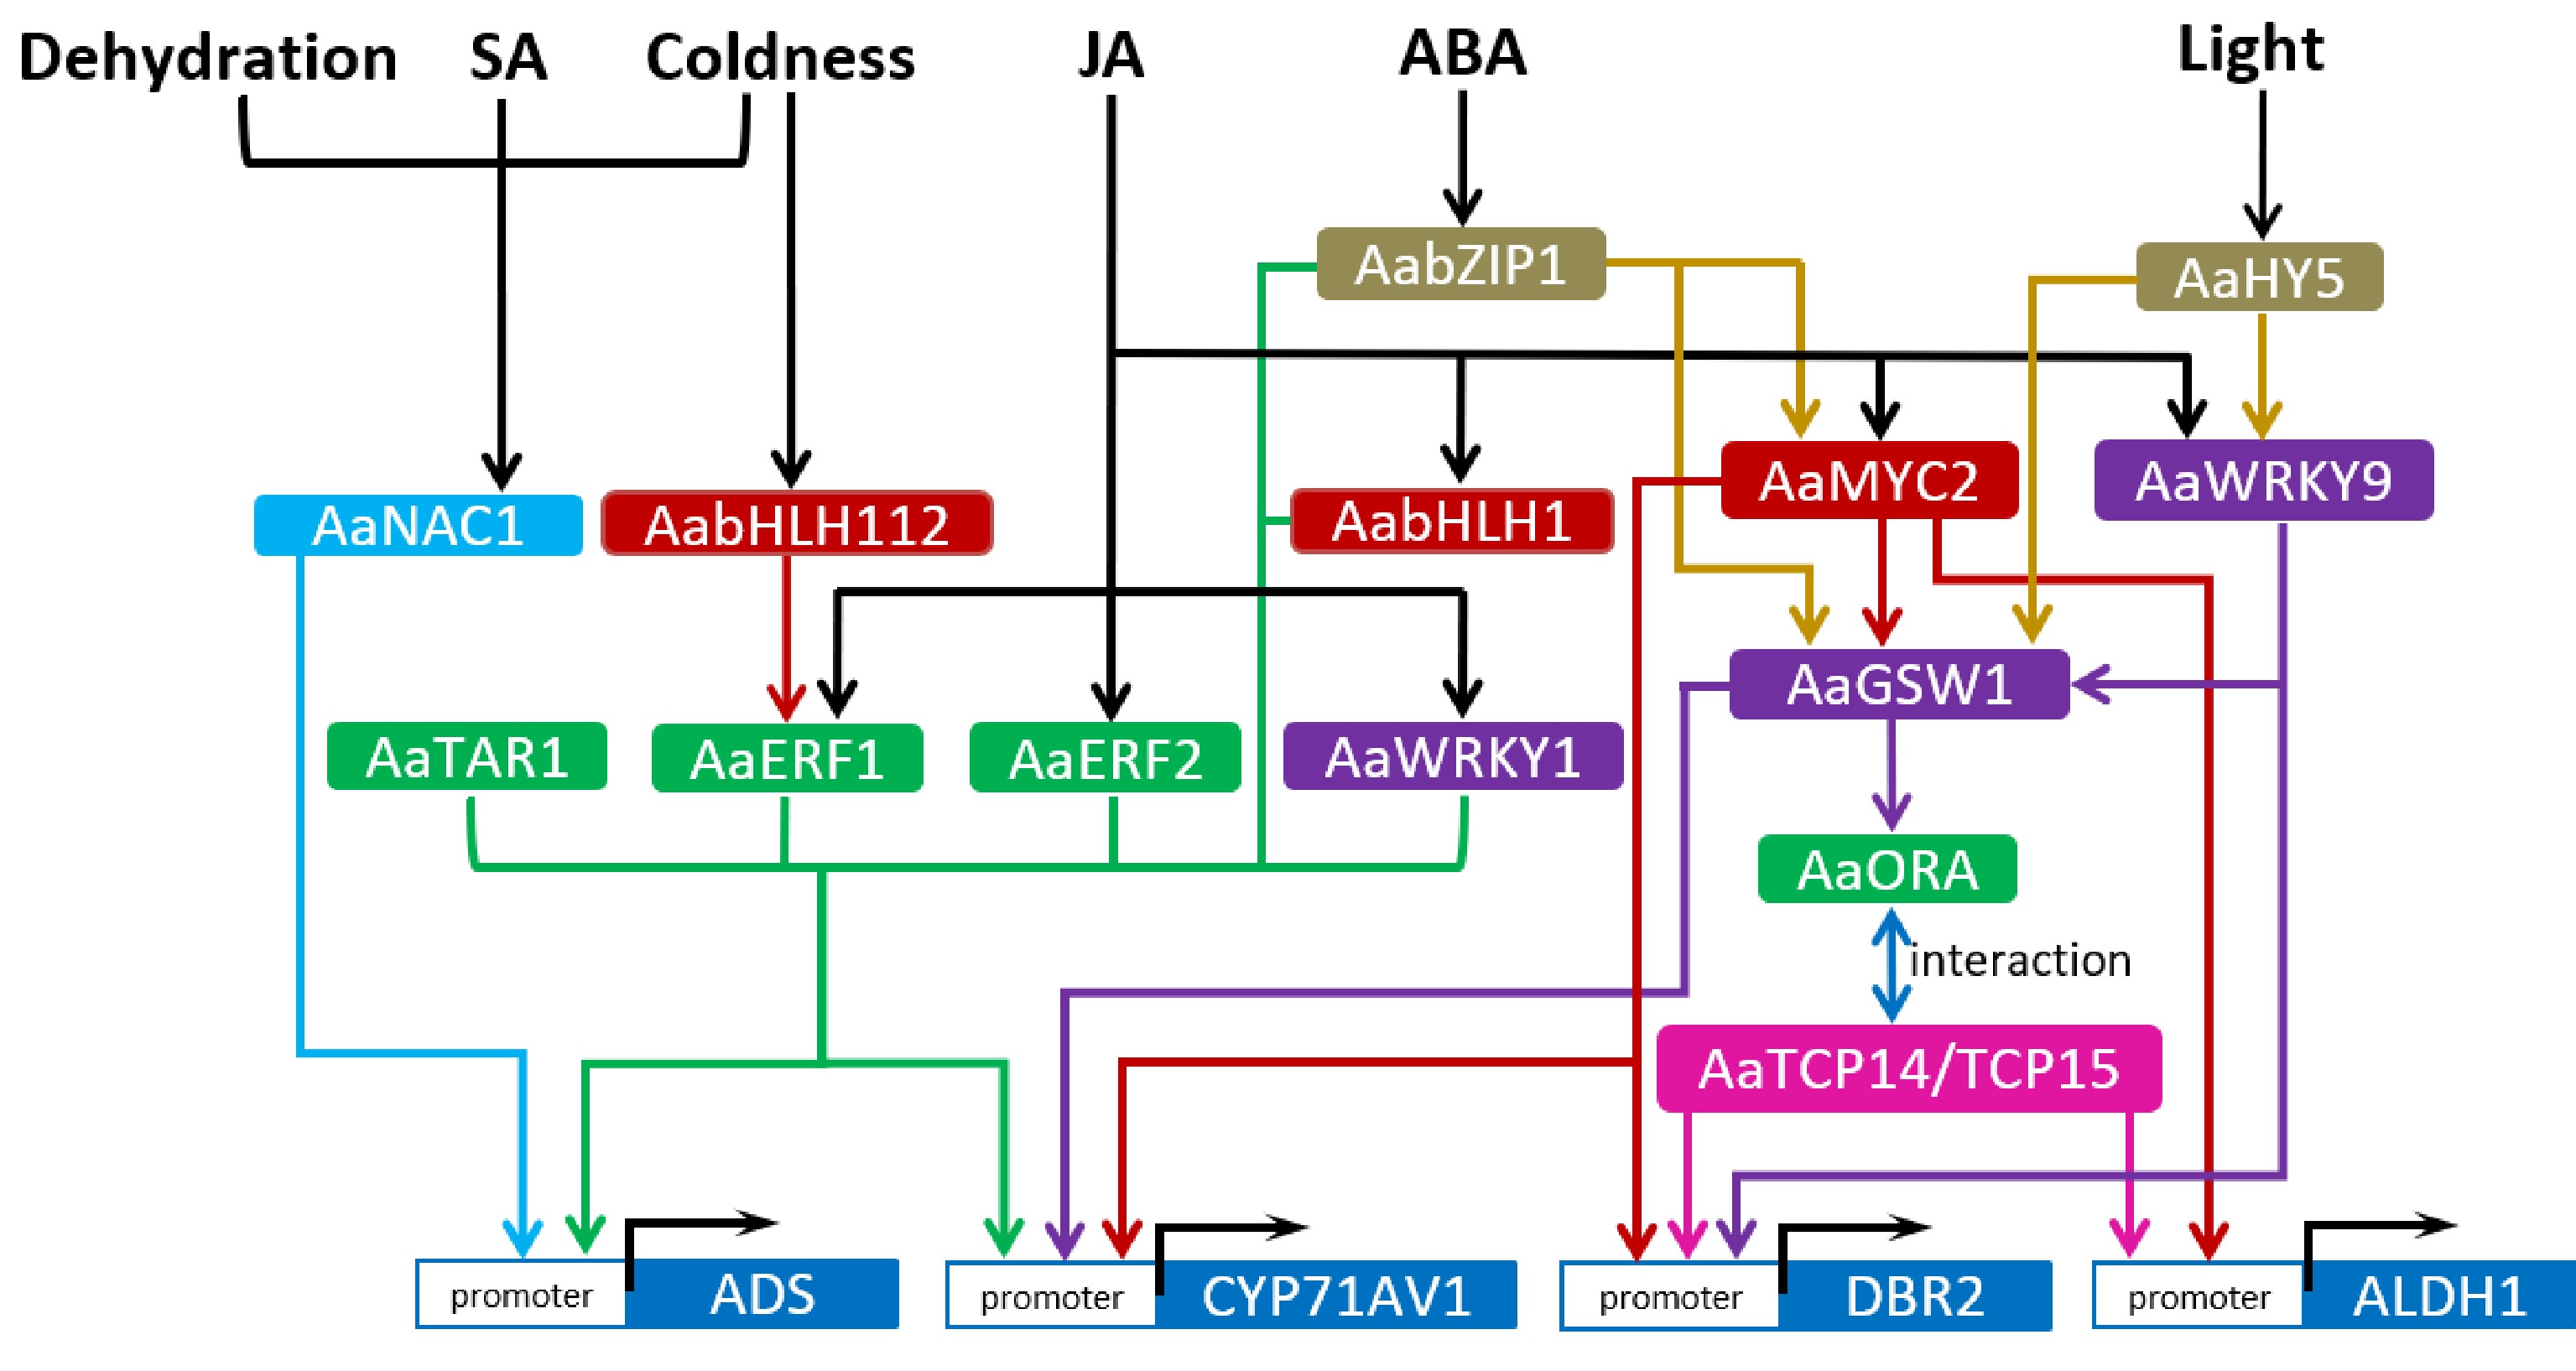
      Figure 1. 

      Regulatory network of artemisinin biosynthetic pathway. The arrows represent direct upregulation of downstream targets. Arrows started from the common upstream regulators or directed toward the common downstream targets are in one colour. Transcription factors of the same family are marked with the same colour.

    • The APETALA2/Ethylene-Responsive Factors (AP2/ERFs) are one of the most important TF families that participate in stress response, developmental process and the regulation of secondary metabolism[26]. Some of them have been reported to regulate the biosynthesis of secondary metabolites, such as ORCA3 regulating the biosynthesis of monoterpenoid indole alkaloids (MIAs) in Catharanthus roseus[27] and NtERF32 regulating nicotine biosynthesis in tobacco[28]. In Artemisia annua, four AP2/ERF TFs (AaERF1, AaERF2, AaORA and AaTAR1) have been sequentially reported to be involved in regulating artemisinin biosynthesis[2931]. Three of them, including AaERF1, AaERF2 and AaORA, are markedly induced by JA. AaERF1, AaERF2 and AaTAR1 are capable to bind to the CBF2 and RAA motifs in ADS and CYP71AV1 promoters, and activate the two genes’ expression[29, 31]. Besides, the trichome morphology/shape and cuticle composition are also regulated by AaTAR1 in A. annua[31]. AaORA is specifically expressed in the glandular and non-glandular T-shaped trichomes of A. annua, and positively regulates artemisinin biosynthesis and resistance to the fungal pathogen Botrytis cinerea[30]. However, AaORA was found not to directly bind to the promoters of the four artemisinin biosynthetic genes; rather, it interacts with AaTCP14 or AaTCP15, two Teosinte branched1/Cycloidea/Proliferating Cell Factors, to form a complex and enhance the transactivation activity of the two TCPs on their target genes such as DBR2 or ALDH1[32, 33], thereby promoting artemisinin biosynthesis.

    • WRKY transcription factors (TFs) make up a large family specific to plant species. WRKY TFs, with a conserved WRKY domain, regulate target genes’ expression through directly binding to their cis-elements called W-box[34]. AaWRKY1 is the first reported TF controlling artemisinin biosynthesis in A. annua[35]. AaWRKY1, highly expressed in GTs and induced by JA, could bind to the W-box of ADS and CYP71AV1 promoters and activate their expression[35, 36]. Then another WRKY TF, namely GLANDULAR TRICHOME-SPECIFIC WRKY 1 (AaGSW1), was identified to activate the expression of CYP71AV1 and AaORA by binding to their promoters, thus upregulating artemisinin biosynthesis[37]. AaGSW1 is responsive to both JA and ABA signals, and can be transactivated by AaMYC2 (a JA-responsive bHLH TF) and AabZIP1 (an ABA-responsive bZIP TF). Therefore, AaGSW1 integrates JA and ABA signaling pathways to regulate artemisinin biosynthesis. Furthermore, a recently reported AaWRKY9, which integrates JA and light signals, positively regulates artemisinin biosynthesis by activating the expression of AaGSW1 and DBR2[38]. Hence WRKY TFs are widely involved in mediating the regulation of artemisinin biosynthesis by diverse signals.

    • The basic helix-loop-helix (bHLH) TFs play an important part in the regulation of growth and development, secondary metabolism, stress response in plants[3941]. So far many bHLH TFs have been functionally identified. AabHLH1, identified from A. annua, is responsive to JA and transactivates ADS and CYP71AV1 through binding to the E-box cis-elements in their promoters[42]. MYC2, another member of the bHLH family, plays a crucial role in regulating terpene biosynthesis in plants[43]. In A. annua, AaMYC2 is induced by JA and upregulates the expression of CYP71AV1, DBR2 and ALDH1 by binding to the G-box in their promoters[44, 45]. AaMYC2 could also directly activate AaGSW1 expression. At the post-translational level, the JASMONATE ZIM-DOMAIN (JAZ) proteins in JA signaling pathway and DELLA proteins in gibberellin signaling pathway could interact with AaMYC2, probably suppressing its transactivating function. Transgenic results indicated that AaMYC2 upregulated the biosynthesis of artemisinin and anthocyanins in A. annua plants[44]. Besides, AabHLH112, highly expressed in glandular trichomes of A. annua, is induced by coldness and upregulates the expression of AaERF1 by binding to its promoter, thus promoting artemisinin biosynthesis[46].

    • The NAC transcription factors are of a large plant-specific family that regulate stress response and cell development[4749]. In A. annua, a NAC TF, AaNAC1, was identified to promote artemisinin production by enhancing ADS expression, as well as to enhance drought tolerance and resistance to Botrytis cinerea[50]. AaNAC1 can be induced by SA, JA, dehydration and coldness respectively, suggesting that this transcription factor may integrate diverse signaling pathways[50]. Moreover, AabZIP1, a transcription factor of basic leucine zipper (bZIP) family, is responsive to ABA signals and upregulates artemisinin biosynthesis through directly activating the expression of ADS, CYP71AV1 and AaMYC2[45, 51]. In addition, ETHYLENE-INSENSITIVE 3 (EIN3), a key TF involved in ethylene signaling, was found to negatively regulate the expression of artemisinin biosynthetic genes. Therefore, AaEIN3 is a negative regulator of artemisinin biosynthesis[52]. HY5, a key TF in light signaling, was found to transactivate AaWRKY9 and AaGSW1, thereby upregulating artemisinin biosynthesis[53]. These findings indicate that artemisinin biosynthesis can be regulated by diverse transcription factors that mediate diverse signaling pathways.

    • Artemisinin is specifically synthesized and stored in glandular secretory trichomes (GT) composed of 10 cells, due to GT-specific expression of artemisinin biosynthetic genes[23, 24]. The amount of GT has a determinative effect on the content of artemisinin in A. annua plants. So it is important to reveal the regulatory mechanism of glandular trichome formation, which would provide candidate regulatory factors valuable for increasing GT formation and elevating artemisinin production. So far, the identified regulatory factors involved in regulating GT formation in A. annua are mainly homeodomain-leucine zipper (HD-ZIP) IV and R2R3-MYB TFs (Fig. 2).
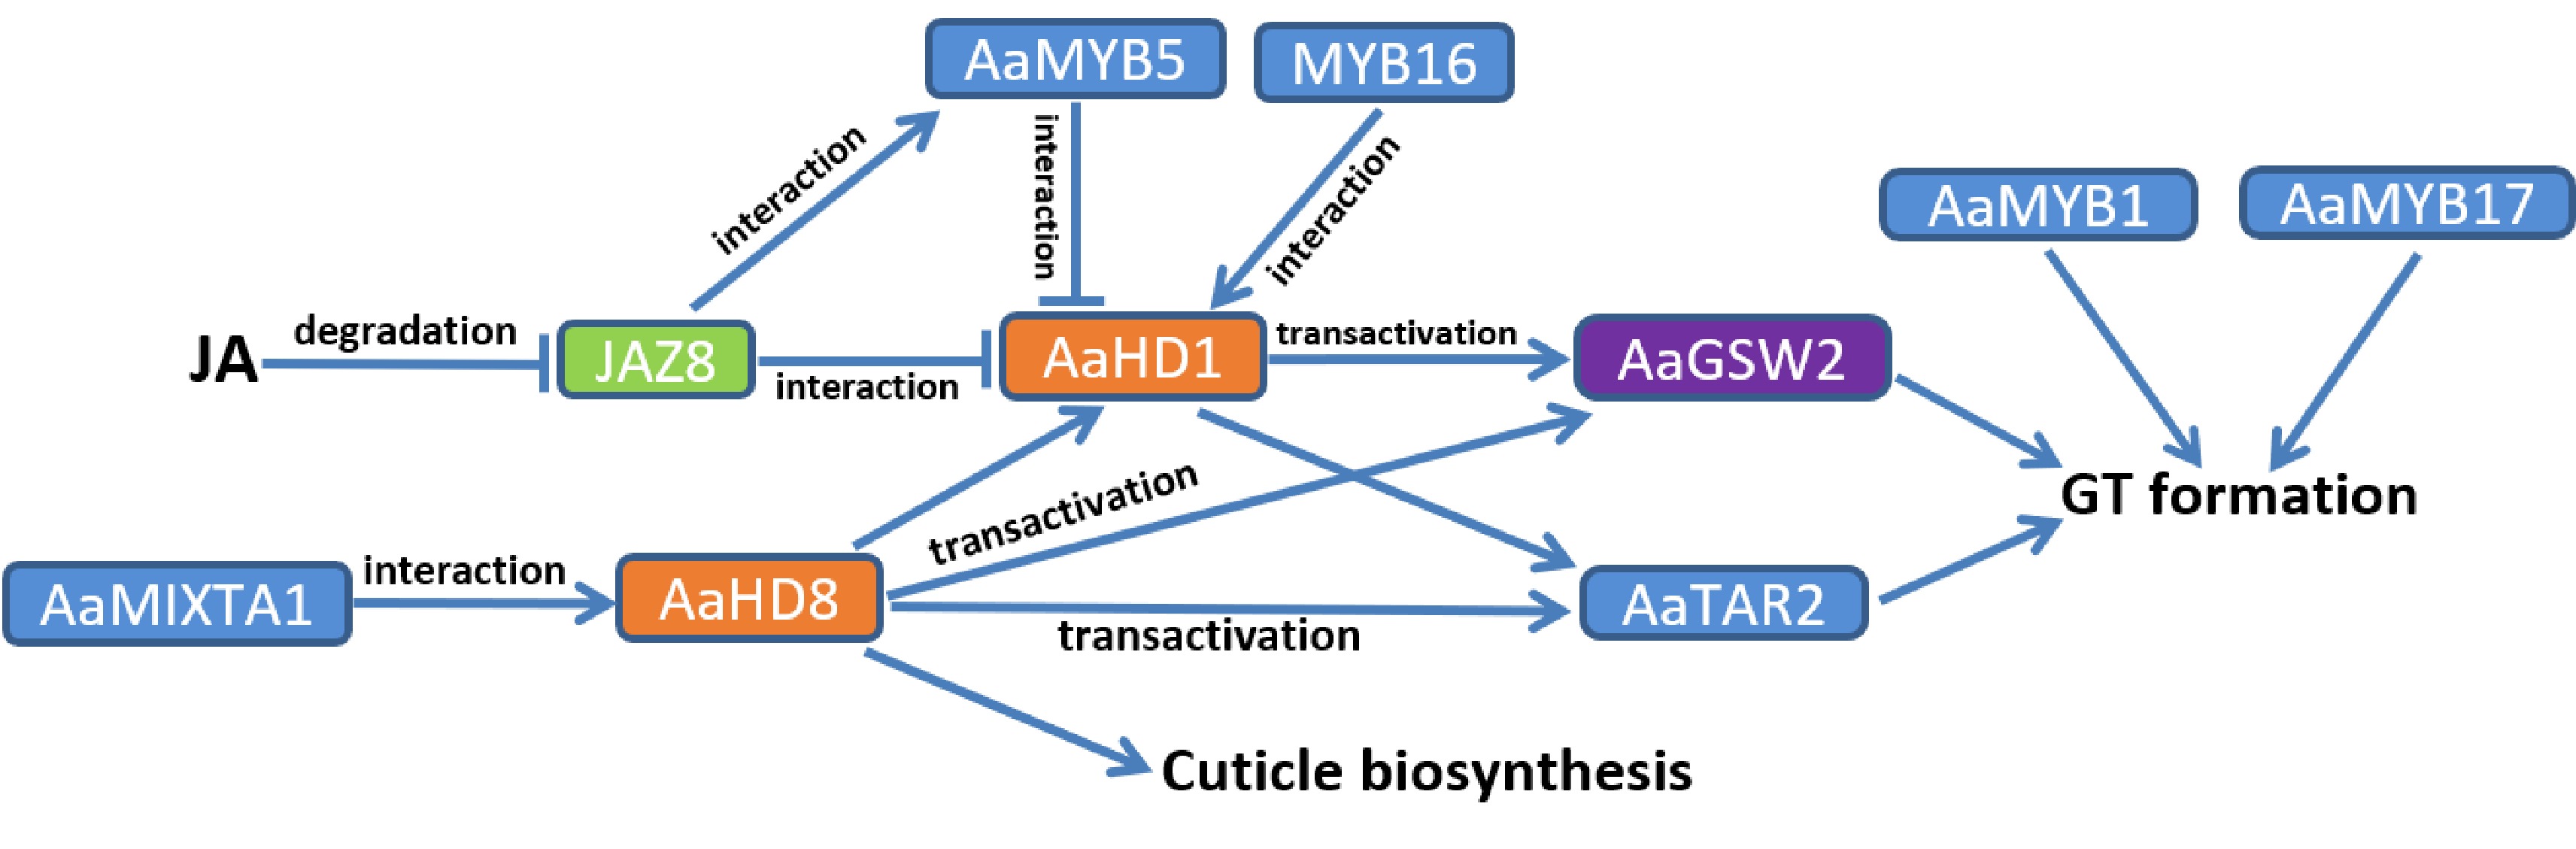
      Figure 2. 

      Identified regulation of glandular trichome (GT) formation in A. annua. The arrows represent upregulation of downstream targets, while short lines represent inhibition or downregulation of downstream targets. Transcription factors of the same family are marked with the same colour.

    • Homeodomain-leucine zipper (HD-ZIP) TFs, especially the IV (HD-ZIP IV) subfamily, were reported to regulate trichome development in plants[54, 55]. Two HD-ZIP IV transcription factors, AaHD1 and AaHD8, were sequentially identified to be positive regulators of trichome formation in A. annua. The JA-responsive AaHD1, specifically expressed in the basal cells of glandular and non-glandular trichomes of young A. annua leaves, positively regulates trichome formation through activating the expression of AaGSW2, a GT-specific WRKY TF that promotes GT initiation[56, 57]. Biochemical assays demonstrated that AaJAZ8 physically interacted with AaHD1 and suppressed its transactivating function[56]. AaHD8, highly expressed in trichomes, could bind to the L1-box of AaHD1 promoter and activate its expression; besides, it can activate the expression of cuticle biosynthesis genes[58]. AaMIXTA1 (a R2R3 MYB TF) interacted with AaHD8 and enhanced the function of AaHD8 in transactivating AaHD1 and cuticle biosynthesis genes[59]. These findings reflect the complicated associations between cuticle biosynthesis and trichome formation.

    • As the largest TF family in plants, the myeloblastosis (MYB) proteins regulate trichome development, root hair density, secondary metabolism, and stress response[6063]. Among the MYB family, the R2R3 MYB TFs are of the largest subfamily, which contain two MYB domain repeats[64, 65]. Some R2R3 MYB TFs, including AaMYB1, AaMIXTA1, AaTAR2, AaMYB17, were sequentially identified to positively regulate glandular trichome formation, thereby elevating artemisinin content in A. annua[59, 63, 66, 67]. Overexpression of AaMYB1 led to an increase in the trichome density, probably by affecting gibberellin metabolism[63]. AaMIXTA1, mainly expressed in the GT basal cells of A. annua, positively regulated trichome initiation and cuticles biosynthesis through interacting with AaHD8 to strengthen its transactivation function[59]. AaTAR2 is mainly expressed in glandular and non-glandular trichome cells. Both AaHD1 and AaHD8 were found to be able to promote the expression of AaTAR2 by binding to its promoter[66]. Besides, two R2R3 MYB factors, AaMYB5 and AaMYB16, were reported to competitively interact with AaHD1 and affect its transactivation function on AaGSW2 promoter, thereby regulating GT initiation in A. annua[68]. AaMYB16 enhanced the transactivation function of AaHD1, while AaMYB5 weakened this function. Therefore, AaMYB16 is a positive regulator of GT initiation, while AaMYB5 is a negative regulator of GT formation[68]. These results show that the MYB proteins get involved in regulating GT initiation not only at the transcriptional level, but also at the post-translational level.

    • The elucidation of the artemisinin biosynthetic pathway as well as its regulatory network provided theoretical basis and potentially useful genes for engineering artemisinin production in A. annua. Based on these discoveries, several strategies are designed for promoting artemisinin production in A. annua, including: (1) overexpressing key enzymes in biosynthesis pathway, (2) repressing the competitive metabolic branch pathway, (3) making use of transcription factors (to regulate the biosynthetic pathway), and (4) increasing the glandular trichome density.

    • Generally, the common strategy for enhancing artemisinin production in A. annua is to overexpress rate-limiting enzymes in the biosynthetic pathway to break through the committed steps, in order for more metabolic flux to flow toward artemisinin biosynthesis. The cytosolic MVA pathway and the plastidial MEP pathway provide 5-carbon precursors (IPP and DMAPP) for artemisinin biosynthesis. HMGR is the rate-limiting enzyme in MVA pathway. When HMGR gene from Catharanthus roseus was overexpressed in A. annua, the transgenic lines displayed an increase of 22.5%–38.9% in artemisinin content, compared with wild-type plants[69, 70]. DXR is the rate-limiting enzyme in the MEP pathway, and overexpression of DXR caused a maximum of 1.3 fold increase of artemisinin content in A. annua[71]. Besides, overexpression of FPS, which catalyzes the condensation of IPPs to form FDP, led to a maximum of 1.5 fold increase in artemisinin level in A. annua[72, 73].

      ADS is the first key enzyme in the artemisinin specific biosynthetic pathway. The content of artemisinin was increased by about 82% in ADS-overexpressing transgenic A. annua lines, compared to that in wild type plants[74]. Likewise, the genes of CYP71AV1 and its redox partner CPR were co-overexpressed in A. annua, and artemisinin content in transgenic lines was about 38% higher than that in the controls[71, 75].

      Overexpressing a single pathway gene can enhance artemisinin accumulation only to a limited extent. Co-overexpression of two or more key enzyme genes in artemisinin biosynthetic pathway would be more effective to elevate artemisinin production. For example, co-overexpression of HMGR and ADS led to a maximum of 7.65 fold higher artemisinin content in transgenic A. annua lines than in the control lines[76]. Transgenic A. annua plants overexpressing the combination of FPS, CYP71AV1 and CPR had the artemisinin level 2.6 fold higher than that of the control plants[77]. In addition, co-overexpressing ADS, CYP71AV1 and CPR genes caused a maximum of 2.4 fold increase in artemisinin content in transgenic A. annua, compared to the control plants[78]. Meanwhile, co-overexpression of four genes including ADS, CYP71AV1, CPR and ALDH1 in A. annua caused an increase of artemisinin content by 2.4 fold at the most[79]. Exceptionally, co-overexpression of HMGR and FPS, which increased artemisinin level merely by 80% relative to the control[80], did not bring about a more significant elevation in artemisinin content compared with the single-gene (HMGR or FPS) overexpression in A. annua plants (Table 1). More combinations of target genes could be tried in the future for metabolic engineering of artemisinin production, and these combinations should be well evaluated and compared to identify the optimal one that can most effectively enhance artemisinin biosynthesis.

      Table 1.  Summary of genes used for metabolic engineering of artemisinin in A. annua.

      Strategies for metabolic engineering of artemisininTarget genes usedArtemisinin increment relative to controlReferences
      Overexpressing key enzymes in artemisinin biosynthesisHMGR22.5%−38.9%[69, 70]
      DXR1.3 fold[71]
      FPS1.5 fold[72, 73]
      ADS82%[74]
      CYP71AV1/CPR38%[71, 75]
      HMGR + FPS80%[80]
      HMGR + ADS7.65 fold[76]
      ADS + CYP71AV1/CPR2.4 fold[78]
      FPS + CYP71AV1/CPR2.6 fold[77]
      ADS + CYP71AV1/CPR+ ALDH12.4 fold[79]
      Repressing competitive pathwaysSQS71%[82]
      CPS77%[82]
      BFS77%[82]
      GAS1.03 fold[82]
      Overexpressing transcription factorsAaERF168%[29]
      AaERF250%[29]
      AaORA53%[30]
      AaTAR138%[31]
      AaTCP14Nearly 1 fold[32]
      AaTCP15Nearly 1 fold[33]
      AaTCP14+AaORA1.8 fold[32]
      AaWRKY11.3-2 fold[36]
      AaGSW10.5-1 fold[37]
      AaWRKY90.6-1.2 fold[38]
      AaMYC223%−55%[44]
      AabHLH11248%−70%[46]
      AaNAC146%−79%[50]
      AaEIN3(repression)About 35%[52]
      AabZIP10.7-1.5 fold[51]
      AaHY5Nearly 1 fold[53]
      Increasing glandular trichome densityAaHD150%[56]
      AaHD835%[58]
      AaMIXTA11 fold[59]
      AaMYB11 fold[63]
      AaTAR250%[66]
      AaMYB1787%[67]
      AaMYB5(knockdown)45%−84%[68]
      AaMYB1643%−56%[68]
      AaGSW21 fold[57]
    • Farnesyl diphosphate (FDP) acts as a common precursor for the biosynthesis of artemisinin and other sesquiterpenes like β-farnesene, β-caryophyllene, squalene and so on[14, 81]. These diverse metabolic pathways are in competition for the same precursor. Repressing other sesquiterpenes' biosynthetic pathways would conduce to more metabolic flux into artemisinin biosynthetic pathway. For example, squalene synthase (SQS) is the key enzyme converting FDP into squalene, an intermediate in sterol biosynthesis[14]. Suppressing SQS expression by antisense technology in A. annua increased artemisinin biosynthesis by 71%. Repressing the expression of β-caryophyllene synthase (CPS), an enzyme converting FDP into β-caryophyllene, led to a 77% increase of artemisinin content in A. annua[82]. Likewise, repression of β-farnesene synthase (BFS), which converts FDP into β-farnesene, caused the artemisinin content to increase by 77% in A. annua. And repression of germacrene A synthase (GAS), an enzyme converting FDP into germacrene A, caused the artemisinin content to increase by 103%[82] (Table 1).

    • Transcription factors can usually regulate the expression of multiple genes in a certain pathway, and overexpression of these factors has been proposed as a promising way for efficiently upregulating a target metabolic pathway. At present, many transcription factors of different families have been identified to positively regulate artemisinin biosynthesis, which are potentially useful for engineering artemisinin production. For example, overexpression of AaORA in A. annua led to a maximum of 53% increase in artemisinin level, compared to wild type plants[30]; overexpressing AaMYC2 in A. annua increased artemisinin content by 23%–55% compared to the wild type[44]. The artemisinin level in AabHLH112-overexpression lines was 48%–70% higher than that in the control lines[46]. The artemisinin content in AabZIP1-overexpressing A. annua lines was increased by 0.7–1.5 fold compared with the wild-type[51]. In addition, transgenic lines overexpressing AaWRKY9 produced 0.6–1.2 fold more artemisinin than the control[38]. More examples of transcription factors overexpressed for elevating artemisinin yield are listed in Table 1.

    • Since artemisinin is exclusively synthesized and stored in glandular trichomes of A. annua, enhancing the formation of glandular trichomes would conduce to elevating artemisinin content in A. annua plants. Many regulatory factors related to glandular trichome formation have been identified, which are potentially useful for increasing glandular trichome density. For example, overexpression of AaHD1 in A. annua led to about 50% increase in glandular trichome density on mature leaves, with a concomitant increase of 50% in artemisinin content, compared to the control[56]. Overexpressing AaMYB17 in A. annua made the number of GTs on the adaxial leaf side increase by 30%–60% with a concomitant increase of artemisinin content, compared to the control[67]. The GT number on the leaf adaxial side in AaMIXTA1-overexpessing lines increased by approximately 50%, with the artemisinin content also rising by 1 fold, compared with that of the control[59]. Besides, overexpression of AaGSW2 in A. annua caused the GT density on the leaves to be double that of the wild type, with the artemisinin content also 2-fold that of wild-type controls[57]. More examples of regulatory factors used for increasing GT density are listed in Table 1.

    • Although artemisinin production by chemical synthesis or semi-synthesis in yeast has become successful, the A. annua plant remains the main commercial source of artemisinin. So it is of great importance to elevate artemisinin content in A. annua and develop new A. annua lines with high yield artemisinin by metabolic engineering and genetic breeding. To date, the artemisinin biosynthetic pathway has been completely elucidated, and many regulatory factors regulating artemisinin biosynthesis and glandular trichome formation have been identified. Many of these genes involved in artemisinin biosynthesis or its regulation have been used in the study for metabolic engineering of artemisinin production, and exhibited good potential for developing A. annua lines with high-yield artemisinin.

      However, the complicated regulatory mechanism of artemisinin biosynthesis and GT initiation is still far from clear and requires further exploration. The majority of TFs identified to regulate artemisinin biosynthesis are related to JA signaling pathway. Those TFs involved in signaling pathways from other hormones like SA, ABA, ethylene, or environmental factors such as temperature, light, etc, have not been thoroughly characterized. Moreover, the presently identified regulators that regulate GT formation mostly lie upstream of the regulatory cascade pathways, and their targets downstream directly participating in the process of GT formation remain unknown. For example, what are the target genes downstream of AaGSW2? How do these genes function in the GT initiation process? The lack of such knowledge limits our comprehensive grasp of regulatory network of artemisinin biosynthesis and GT development. Elucidation of the above issues would provide more solid theoretical foundation for genetic engineering of artemisinin.

      According to the present data, it appears that the single strategy adopted above for metabolic engineering have a relatively limited effect on the elevation of artemisinin content in A. annua. To further increase artemisinin production, the combination of multiple strategies could be tried, such as overexpressing multiple key enzyme genes in artemisinin biosynthetic pathway, combined with repressing competitive pathways and increasing the trichome number by genetic manipulation. Besides, it is also important to find out the optimal environmental parameters (such as light, temperature and humidity conditions) that are most suitable for A. annua growth. To conclude, more in-depth study is required to ultimately solve the shortage of artemisinin.

      • Zhihua Liao is the Editorial Board member of journal Medicinal Plant Biology. He was blinded from reviewing or making decisions on the manuscript. The article was subject to the journal's standard procedures, with peer-review handled independently of this Editorial Board member and his research groups.

      • Copyright: © 2023 by the author(s). Published by Maximum Academic Press, Fayetteville, GA. This article is an open access article distributed under Creative Commons Attribution License (CC BY 4.0), visit https://creativecommons.org/licenses/by/4.0/.
    Figure (2)  Table (1) References (82)
  • About this article
    Cite this article
    Tang Y, Xiang L, Zhang F, Tang K, Liao Z. 2023. Metabolic regulation and engineering of artemisinin biosynthesis in A. annua. Medicinal Plant Biology 2:4 doi: 10.48130/MPB-2023-0004
    Tang Y, Xiang L, Zhang F, Tang K, Liao Z. 2023. Metabolic regulation and engineering of artemisinin biosynthesis in A. annua. Medicinal Plant Biology 2:4 doi: 10.48130/MPB-2023-0004

Catalog

  • About this article

/

DownLoad:  Full-Size Img  PowerPoint
Return
Return