


-
Chrysanthemum × morifolium is one of the most important floriculture crops in the world and has a large proportional share in the floriculture trade[1]. Chrysanthemum is extremely rich in flower color[2]. Carotenoids and anthocyanins accumulate in different proportions and determine the petal color scheme of chrysanthemum cultivars[2,3]. Therefore, studying the molecular mechanism and accumulation of these two pigments can set new directions for future modification of petal color in chrysanthemum.
Anthocyanins are important secondary metabolites that are water soluble and give pink to purple-red colors to chrysanthemum petals[4−7]. Anthocyanins are the sugar-containing counterparts of anthocyanidins and contain 3-glucosides. They possess a C6-C3-C6 skeleton and can be divided into anthocyanin glycosides, sugar-free aglycones and anthocyanidins. Anthocyanidin possesses two aromatic benzene rings linked by an oxygenated heterocycle[8]. Petal color is largely determined by the presence of hydroxyl groups in the skeletal benzene ring and change in number of hydroxyl groups controls color shift[8,9]. The most prevalent anthocyanidins in flowers include delphinidin, cyanidin, and pelargonidin[7]. It is reported that cyanidin content regulates pink to purple-red petal color[10]. Although the molecular mechanism of anthocyanin biosynthesis is conserved among species, the mechanism of anthocyanin degradation remains elusive[8,11,12]. As flavonoid biosynthesis precursor, malonyl CoA, and 4-coumaroyl CoA are converted to naringenin chalcone by CHS (chalcone synthase) and to dihydrokaempferol by F3H (flavanone 3-hydroxylase) and CHI (chalcone isomerase). DFR (dihydroflavanol 4-reductase) and ANS (anthocyanidin synthase) convert dihydrokaempferol to pelargonidin, a pink anthocyanidin[7]. Several reports have documented that the accumulation of pelargonidin, and cyanidin generally imparts orange to red[13], and red to purple[14] colors, respectively.
Carotenoids are synthesized through the isoprenoid pathway. The main enzymes involved in this pathway include PSY (phytoene synthase), PDS (phytoene desaturase), ZDS (ζ-carotene desaturase), and CRTISO (carotene isomerase)[2]. These enzymes drive the synthesis of linear carotenes, such as phytoene, Z-carotene and lycopene. LCYB (Lycopene β-cyclase) and LCYE (lycopene ε-cyclase) cyclize lycopene to produce α- or β-carotene, which forms carotenoids such as violaxanthin, zeaxanthin, neoxanthin and lutein with the catalysis of carboxylation and cyclooxygenase such as CHYB (β-carotene hydroxylase), CYP97A (cytochrome P450-type carotenoid β-hydroxylase), CYP97C (cytochrome P450-type carotenoid ε-hydroxylase), VDE (violaxanthin de-epoxidase) and ZEP (zeaxanthin epoxidase)[15]. CCDs (carotenoid cleavage dioxygenases) are the key enzymes causing carotenoid oxidative damage to form apocarotenoids[2]. CCDs also catalyze carotenoid degradation into volatiles, such as strigolactone and abscisic acid[16]. Carotenoids are mainly synthesized and stored in plastids and, therefore, carotenoid accumulation is largely affected by plastid development and differentiation. Mutation of Or (plastid differentiation-related gene) caused β-carotene accumulation in orange color cauliflower, suggesting the important role of plastid differentiation genes in the regulation of carotenoid biosynthesis[17,18]. PAP (plastid-lipid association protein) affected the accumulation of carotenoid through plastid differentiation[19−21]. Overexpression of PAP significantly altered the ultrastructure of chromoplasts in the petals of tobacco and sweet pepper[22]. Moreover, overexpression of PAP affected the ultrastructure of plastids and increased the lycopene content in tomato[23].
Three TF families have been known to regulate the biosynthesis of anthocyanins. These include MYB, bHLH and WD40 (WD40-repeat domain containing proteins)[24]. MYBs play crucial roles to drive downstream genes, allowing tissue specific anthocyanin accumulation[25−27]. The bHLHs regulate MYBs through transcription or by stabilizing the protein complexes[28]. The WDR proteins regulate the biosynthesis of anthocyanins by interacting with MYBs and bHLHs[29]. Therefore, complex formed by MYB, bHLH and WD40 (MBW) primarily controls anthocyanin biosynthesis genes[27,30].
Stable natural mutants are important resources for the study of the genetic control of color metabolism in flowers. This helps to discover important hub genes that regulate pigmentation cascade in flowers. Selection through bud sprout mutants is one of the most important methods to introduce novelty in chrysanthemum[2]. Surprisingly, we found a bud mutant in the chrysanthemum cultivar 'Hanluhong' (HLH). The original cultivar produces red flowers. However, in mutant (hlh), the petal tip turns golden yellow and as the flower opens, it turns yellow from tip to base. We separated the mutants and stabilized the mutant character by recurrent growing of the mutated buds for two years. Then, the present study was designed to compare the original (HLH) and the mutant (hlh) through RNA sequencing at three stages of flower development (S1, S3 and S5) to find genetic regulators of chemical fluctuations in flowers. The genes regulating the biosynthesis of carotenoids and anthocyanins were mainly focused. This molecular digging was also supported by the quantification of some key carotenoids and anthocyanins in the petals of both the cultivars. Therefore, this study can give applicable clues to strengthen the breeding programs for valuable color modification of floriculture crops.
-
The original parent cultivar produces red flowers (Red group, 45A) (Fig. 1a, b). A mutant was observed in which the flower petals turned yellow at the tip and gradually the whole petal turned yellow (Yellow group, 9B) along the flower development (Fig. 1c). In order to maintain the mutant character, the mutant plant shoot cuttings containing buds were isolated from the original parent and cultured into plants. After two consecutive years of observation, the variation was stable. The flower development was divided into five stages[31], the flower color change was then compared. Ray florets wrapped in the bract define stage 1 (S1). In this stage, the apex of hlh flower color was yellow and the rest of ray floret area was red. Stage 2 (S2) starts when the ray floret barely outgrows the bract. In this stage, the yellow area at the tip is gradually expanding in hlh. Stage 3 (S3) defines the complete outgrowth of ray floret out of bract. At this stage, nearly all the tip area of hlh turned yellow. Stage 4 (S4) shows the fully opened ray florets. At this stage, almost all the petal area except for a few parts of the base area of hlh turned yellow. Stage 5 (S5) defines the start of the decay process. Here, the whole ray floret of hlh turned yellow; at the same time, a small amount of red color is accompanied. However, the flower color of HLH maintained red from S1 to S5 (Fig. 1c). Bright field microscopic pictures of petal cuttings further show the clear difference of colors between original (HLH) and the mutant cultivars (hlh) (Fig. 1d).
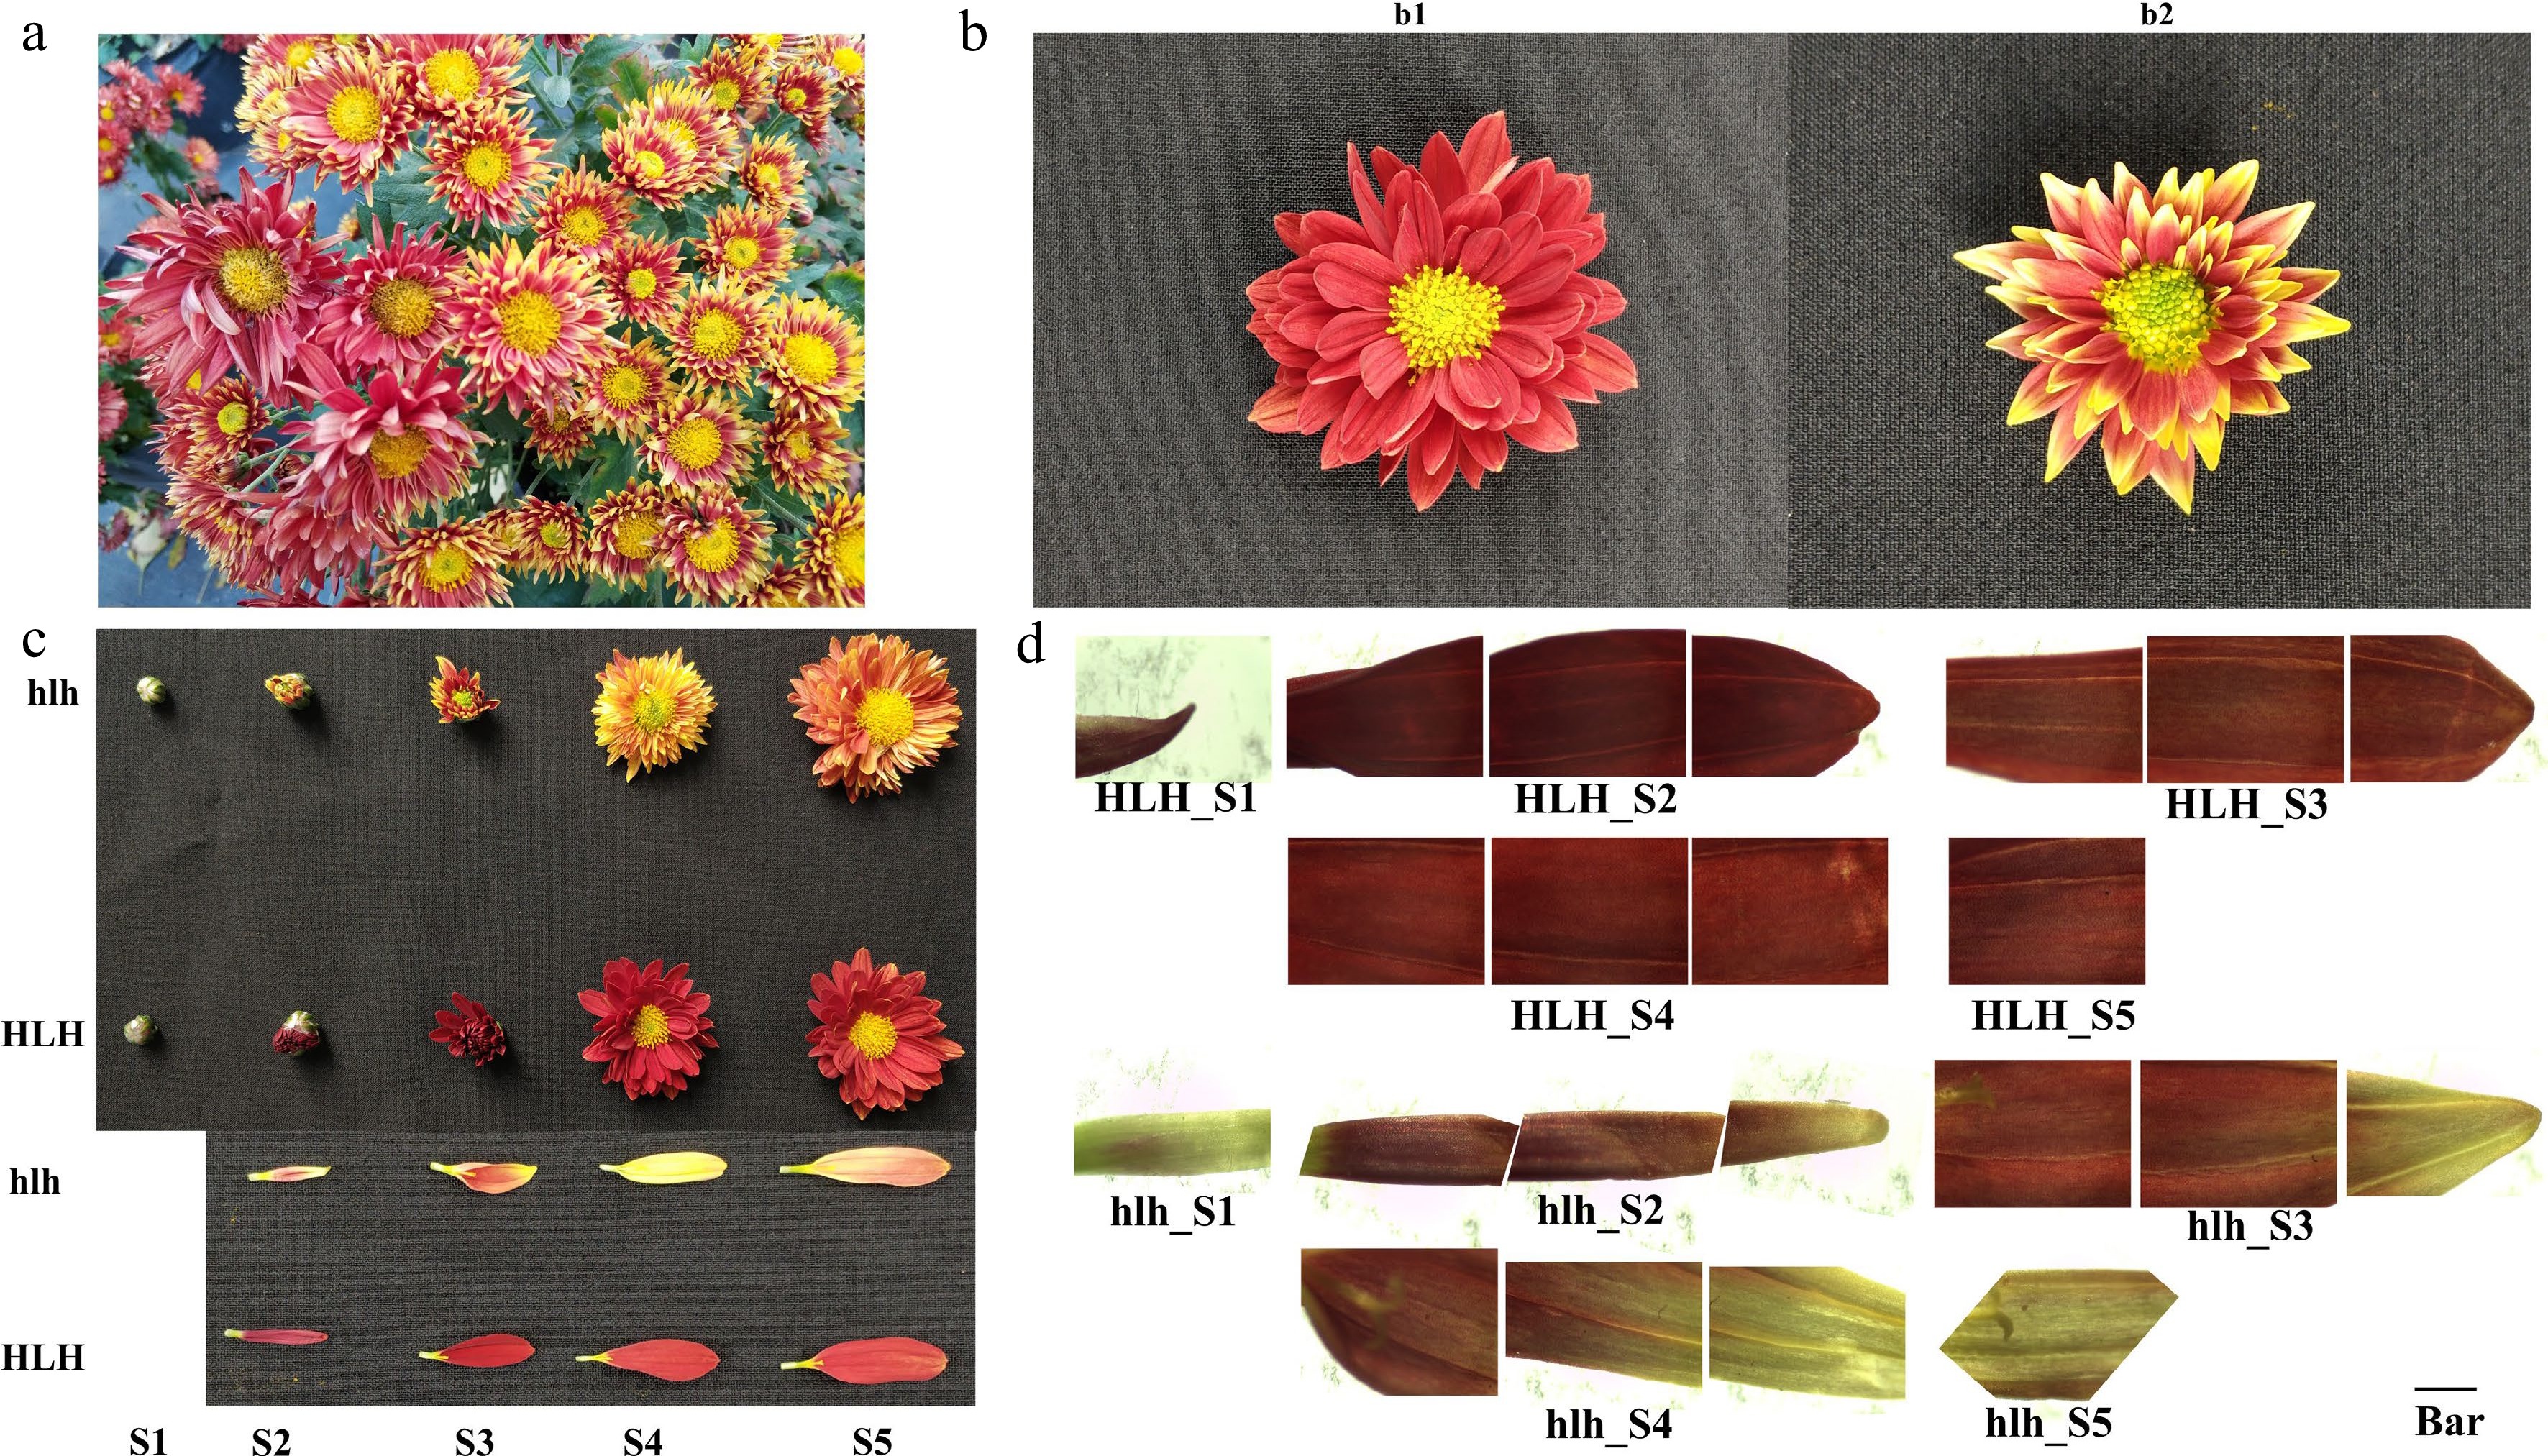
Figure 1.
Appearance of mutant and stabilization of mutant character, (a) first appearance of flower color mutant in C. morifolium. The different shoots displayed varied flower colors in the same plant; (b) the mutation was fixed by using micro-cutting technology. (b1) Original parent flower (HLH); (b2) stabilized mutant flower (hlh); (c) comparison of flower color changes between HLH and hlh at five development stages; (d) representative bright field microscopic images of petal sections for five stages of flower development. From left to right in each stage are the base, middle and tip of the ray floret; Bar = 1 cm, The microscope magnification = 35 ×.
Quantitative evaluation of carotenoids and anthocyanidins
-
To further dissect the pigment components that are involved in petal color change, the concentrations of carotenoids (α-carotene, β-carotene, lutein and lycopene) and anthocyanidins (cyanidin, pelargonidin, peonidin and delphinidin) were detected by HPLC-MS/MS. The results showed that carotenoid concentration in hlh changed significantly compared with HLH, and lutein was the main changing component (Fig. 2b, c). The concentration of lutein was significantly higher in hlh as compared to HLH (Fig. 2c). Levels of α-carotene, β-carotene and lycopene were also significantly altered, showing significantly low concentrations (Fig. 2d−f). Similarly, significantly higher content of lutein was accumulated in the yellow tip of the hlh petal (hlh-Y) than that in the red base (hlh-R) (Fig. 2c).
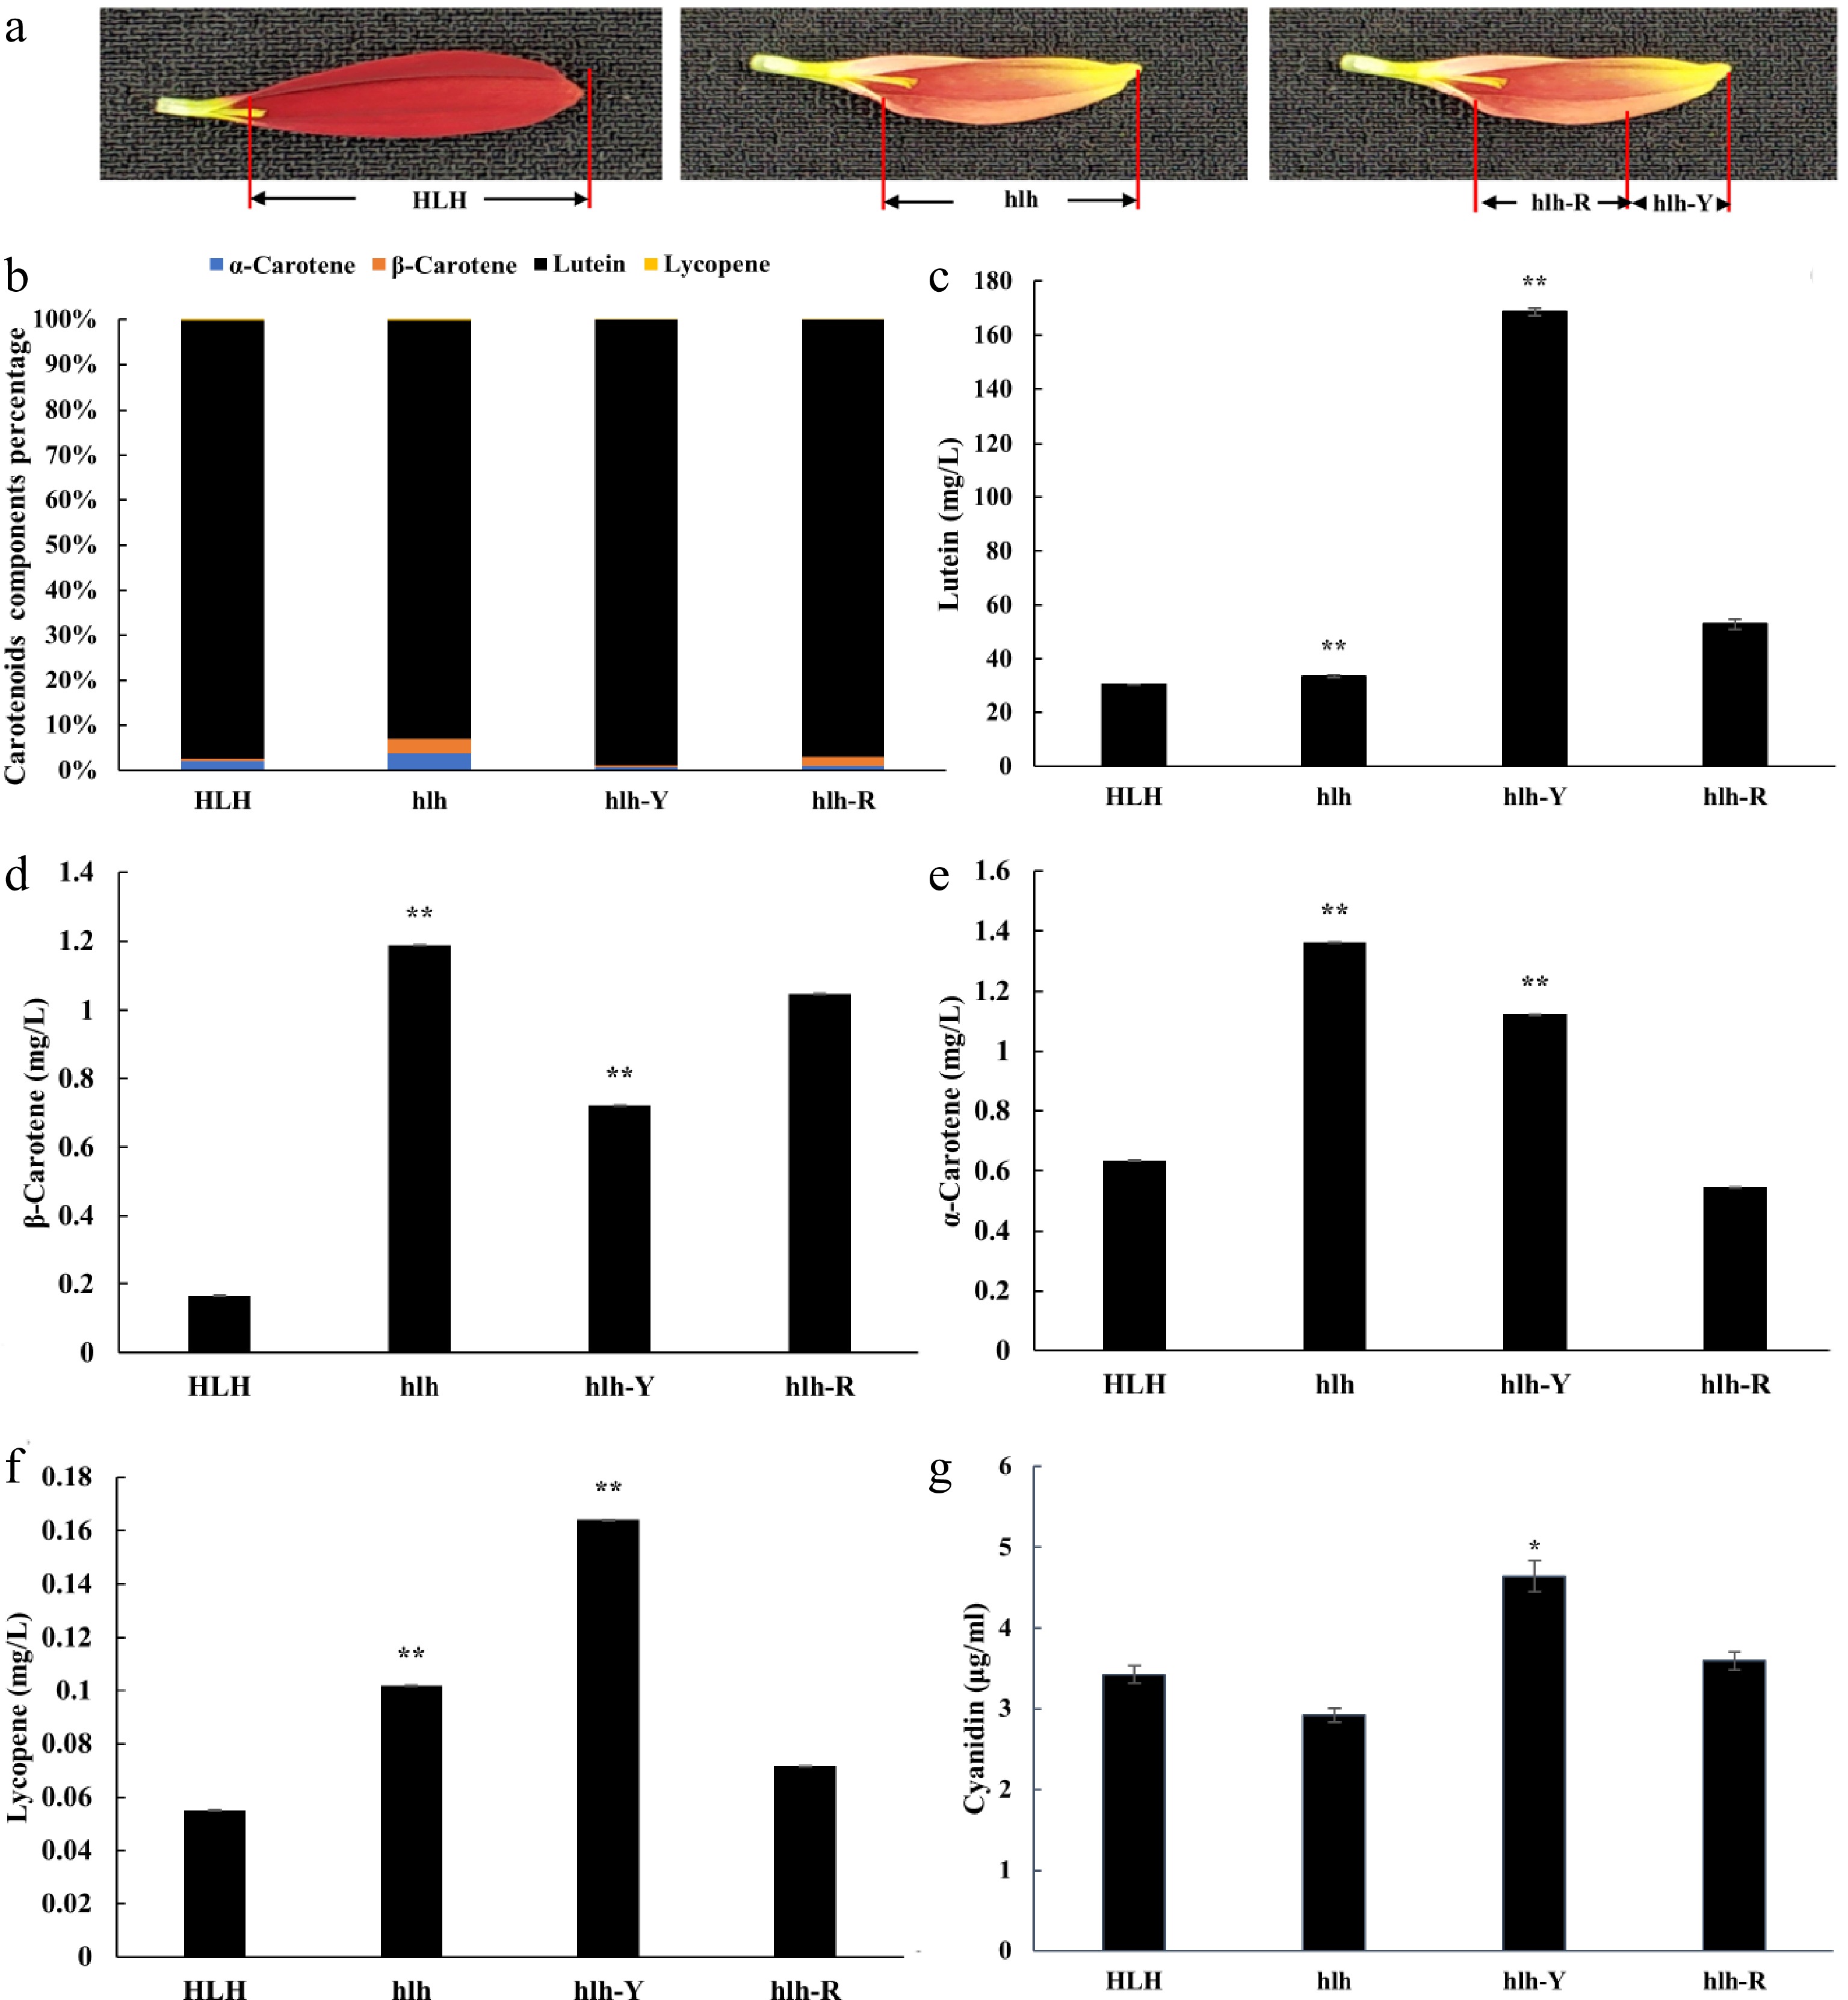
Figure 2.
The HPLC-MS/MS concentrations of carotenoids (α-carotene, β-carotene, lutein and lycopene) and anthocyanidins (cyanidin). Distribution of pigments were compared with parent (HLH) and mutant (hlh) at the whole flower petal level and distinct position level within the petal of mutant flowers at third stage of development. (a) Schematic diagram of sample collection of hlh-R and hlh-Y, hlh-R represents the red base samples collected from the petals of mutant flower, hlh-Y represents the yellow tip samples collected from the petals of mutant flower; (b) represents percentage of each carotenoids components; (c) represents changes in lutein content; (d) represents changes in β-carotene content; (e) represents changes in α-carotene content; (f) represents changes in lycopene content; (g) represents changes in cyanidin content. Significance is shown at p < 0.05 (*) and p < 0.01 (**).
For anthocyanidins, the concentration of cyanidin in the yellow tip of the hlh petal (hlh-Y) was significantly higher than that in the red base (hlh-R). However, it was a little lower in hlh as compared to HLH (Fig. 2g). However, there was no significant difference in the content of cyanidin between HLH and hlh (Fig. 2g).
Transcriptome sequencing and functional annotation
-
To understand the molecular mechanism of flower color change in chrysanthemum, ray florets of HLH and hlh at three representative stages (stage I, S1; stage III, S3 and stage V, S5) were used to build libraries for high-throughput sequencing. A total of 101,125 unigenes were assembled with a size of 78,786,561 bp. PCA analysis shows that floral development stages were different from each other in the original and mutant cultivars (Fig. 3a). A number of stage-specific DEGs were found that expressed to particular stages of flower development in both the cultivars (Fig. 3b). Higher number of stage specific DEGs were found in mutant cultivars as compared to the original. In total, 1,691 stage specific differentially expressed genes (DEGs) were identified in pairwise comparisons of three stages between wild type HLH and mutant hlh (Fig. 3c). Nine pairs were made between HLH and hlh to further analyze the relationships among different FD stages between the cultivars and within the cultivar (Fig. 3c). The highest number (3,042) of unique DEGs was found between hlh_S1 and hlh_S5 within hlh, while the highest number (1,778) was found between HLH_S3 and HLH_S5 within HLH. Higher number of DEGs (790) was expressed between HLH_S5 and hlh_S5 as compared to other inter-cultivar comparisons (Fig. 3c).
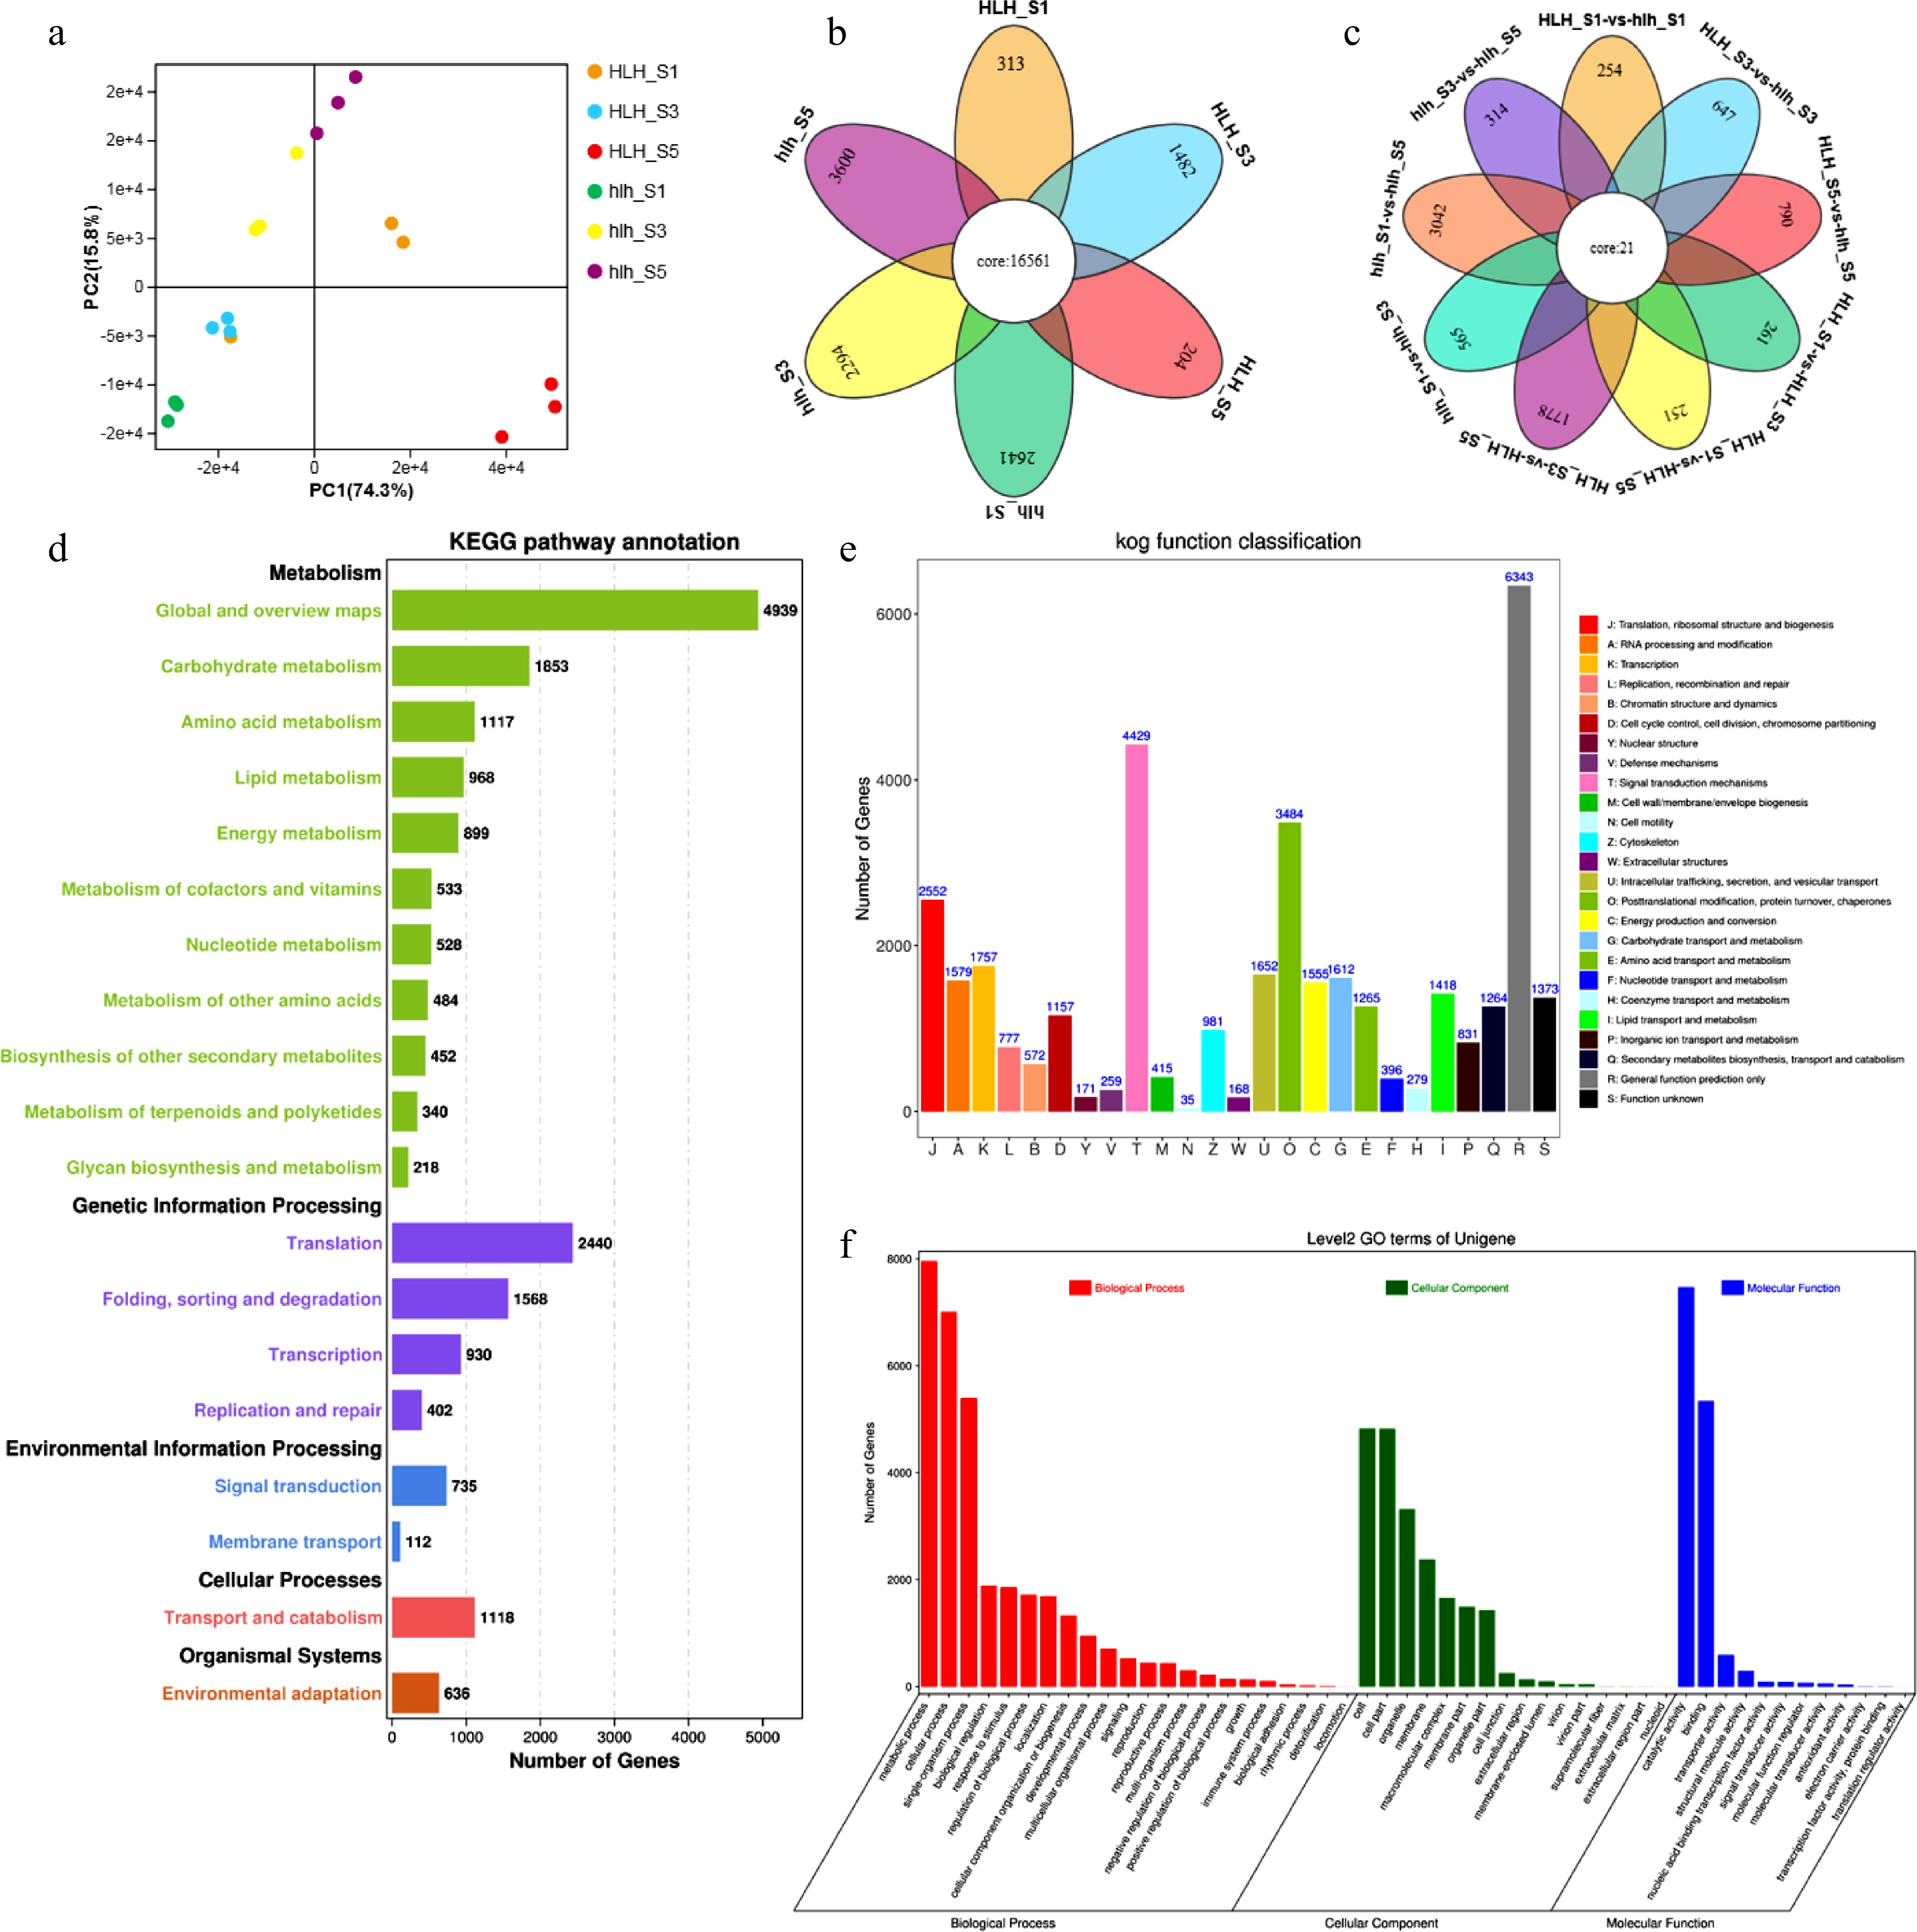
Figure 3.
Transcriptomic features for HLH and hlh, (a) principal component analysis; (b) Venn diagram for stage specificity of DEGs for FD stages 1, 3, and 5; (c) Venn diagram for multiple comparisons among different stages of flower development between HLH and hlh; (d) KEGG pathway annotation for HLH and hlh; (e) KOG/COG functional annotation for mutant and original cultivars; (f) biological process enrichment of DEGs.
A total of 52,947 unigenes were annotated using BLASTx (E-value < 1 × 10⁻⁵) searches against KEGG, GO, KOG/COG, Pfam, SwissProt and Nr databases. A total of 46,564 unigenes were annotated to KEGG database, 33,959 to SwissProt database, and 29,373 unigenes were annotated to COG database. We used KEGG, COG/KOG, and GO annotations to predict functional classifications of unigenes. Carbohydrate metabolism, amino acid metabolism and lipid metabolism were the major KEGG categories related to metabolism (Fig. 3d). Regarding the genetic information processing, translation was the major KEGG category shown by most of the DEGs. Signal transduction and membrane transport were the important KEGG pathways for environmental information processing and cellular processes were manifested in transport and catabolism pathways. In the KOG/COG categorization, the highest number of genes was enriched in signal transduction mechanisms, followed by posttranslational modification, protein turnover and chaperones (Fig. 3e). In the GO annotation, metabolic process was the most enriched process; cell was the abundant cellular component, while catalytic activity was the molecular function shown by most of the DEGs (Fig. 3f).
Stage-specific comparison of KEGG and GO pathways
-
Among the intra-cultivar comparisons, the highest number of DEGs expressed between hlh_S1 and hlh_S5 for major KEGG pathways, while minimum DEGs expressed between HLH_S1 and HLH_S3 (Supplemental Fig. S1a). The comparison for 5th stage of flower development between original and the mutant showed significant enrichment for KEGG pathways. The minimum pathway terms were enriched between HLH_S1 and hlh_S1.
Significantly up- and down-regulated DEGs can be seen for biological processes between the 1st and 5th stage of flower development in the mutant flower (Supplemental Fig. S1b) as compared to 1st and 5th stage comparison of non-mutant flower, wherein only few DEGs expressed for biological processes. The highest number of up-regulated DEGs was observed between HLH_S5 and hlh_S5, and the highest number of downregulated DEGs were observed between HLH_S3 and HLH_S5 for various biological processes (Supplemental Fig. S1b).
Up- and down-regulated DEGs and transcription factors
-
Up- and down-regulated DEGs were found for nine comparisons between HLH and hlh (Supplemental Fig. S2a). The comparison between FD5 of both the cultivars showed the maximum difference of up- and down-regulated DEGs, where 8,822 genes showed up-regulation and 1,004 genes showed down-regulation. The highest number of intra-cultivar up- and down-regulated DEGs was found between hlh_S1 and hlh_S5.
A number of transcription factor families were present in our transcriptome data. The C2H2-type Zinc finger transcription factors were abundant as compared to other TF families (Supplemental Fig. S2b). In addition to ZF TFs, ERF, bHLH, MYB, bZIP, and NAC were the important transcription factor families. These TF families play important roles in regulating the biosynthesis and transport of carotenoids and anthocyanins.
Three TF families have been known to regulate the biosynthesis of anthocyanins. These include MYB, bHLH and WD40. We found highly differential sets of MYB TFs. Most of them were upregulated in hlh_S1 as compared to other stages; while, most of MYBs were downregulated in HLH_S5 (Supplemental Fig. S2c). Similarly, bHLH TFs were also upregulated mainly in hlh_S1 as compared to rest of the stages and downregulated in HLH_S5. However, WD40 were mainly upregulated in hlh_S3 and they were completely downregulated in HLH_S5 (Supplemental Fig. S2c). Interestingly, a general downregulation trend can be seen in HLH_S5 for these three TF families.
Weighted gene coexpression network analysis (WGCNA)
-
The top 1,000 significantly expressed DEGs were selected to show the relationship between different stages of flower development for original and mutant cultivars. A heatmap shows that there are distinct groups of genes that were either upregulated or downregulated in particular FD stages (Fig. 4a). Distinguished groups of upregulated and downregulated genes can be seen in hlh_S5 and HLH_S5, respectively.
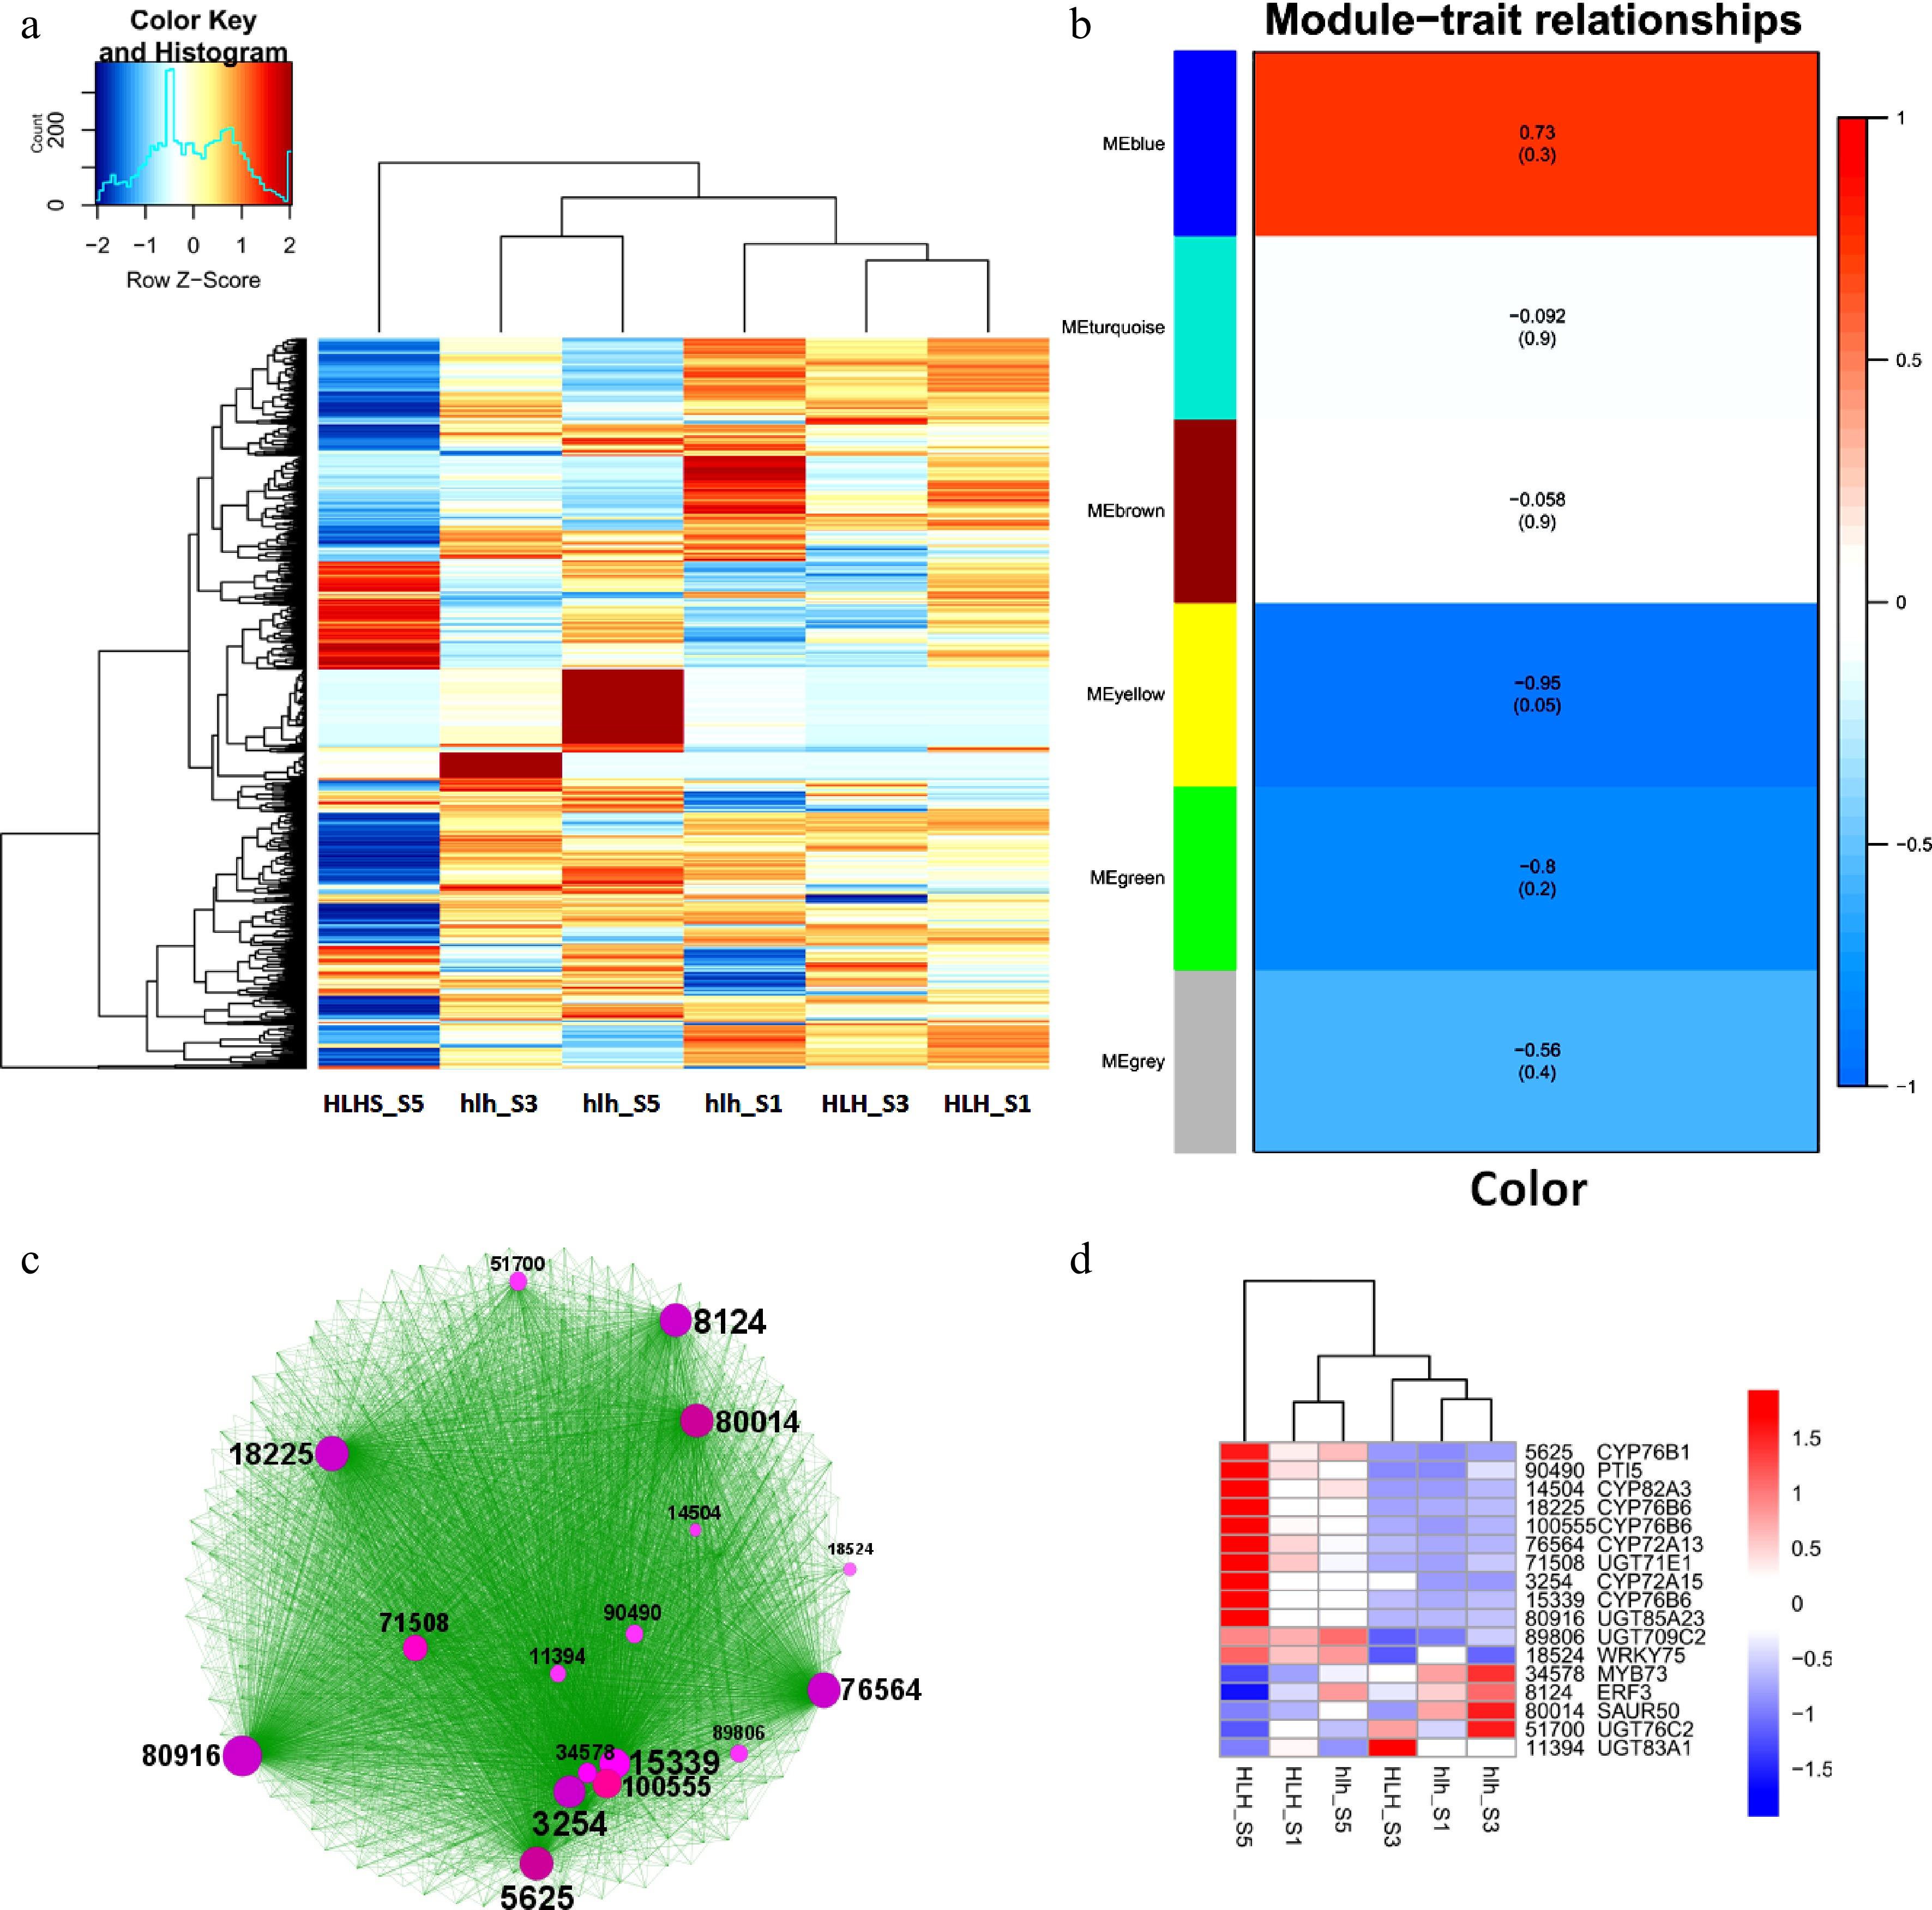
Figure 4.
Top 1,000 highly expressed DEGs, (a) heatmap of top 1,000 highly expressed DEGs; (b) WGCAN modules of highly expressed DEGs; (c) clustering analysis of WGCNA-based coexpressed modules and identification of hub genes (circle size shows the gene interaction intensity of hub genes); (d) heatmap of FPKM expression of hub genes.
A WGCNA was performed for top 1,000 DEGs and found contrasting modules regarding the color regulation (Fig. 4b). MEblue is the most significant module containing the highly expressed genes related to color modification. Genes for this module were laid on Cytoscape to find a number of hubs related to metabolism of flavonoids, carotenoids, and anthocyanins (Fig. 4c). Expression profiles of these hub genes show that their differential expression among FD stages between the original and the mutant cultivars (Fig. 4d).
DEGs for the chemical homeostasis color stimulants
-
About 200 DEGs were filtered related to the metabolism of flavonoids, carotenoids, terpenoids, and anthocyanins. Their expression profiles were different for different FD stages. Most of them showed high expressions in the early stages of flower development and showed downregulation in late stages of flower development for both the cultivars (Fig. 5a). Coexpressed modules were constructed for these genes and found key genes that may play pivotal roles in the regulation of carotenoids and anthocyanins for petal color (Fig. 5b). These hubs involve key genes for the synthesis of carotenoids and anthocyanins and also the degradation of carotenoids.
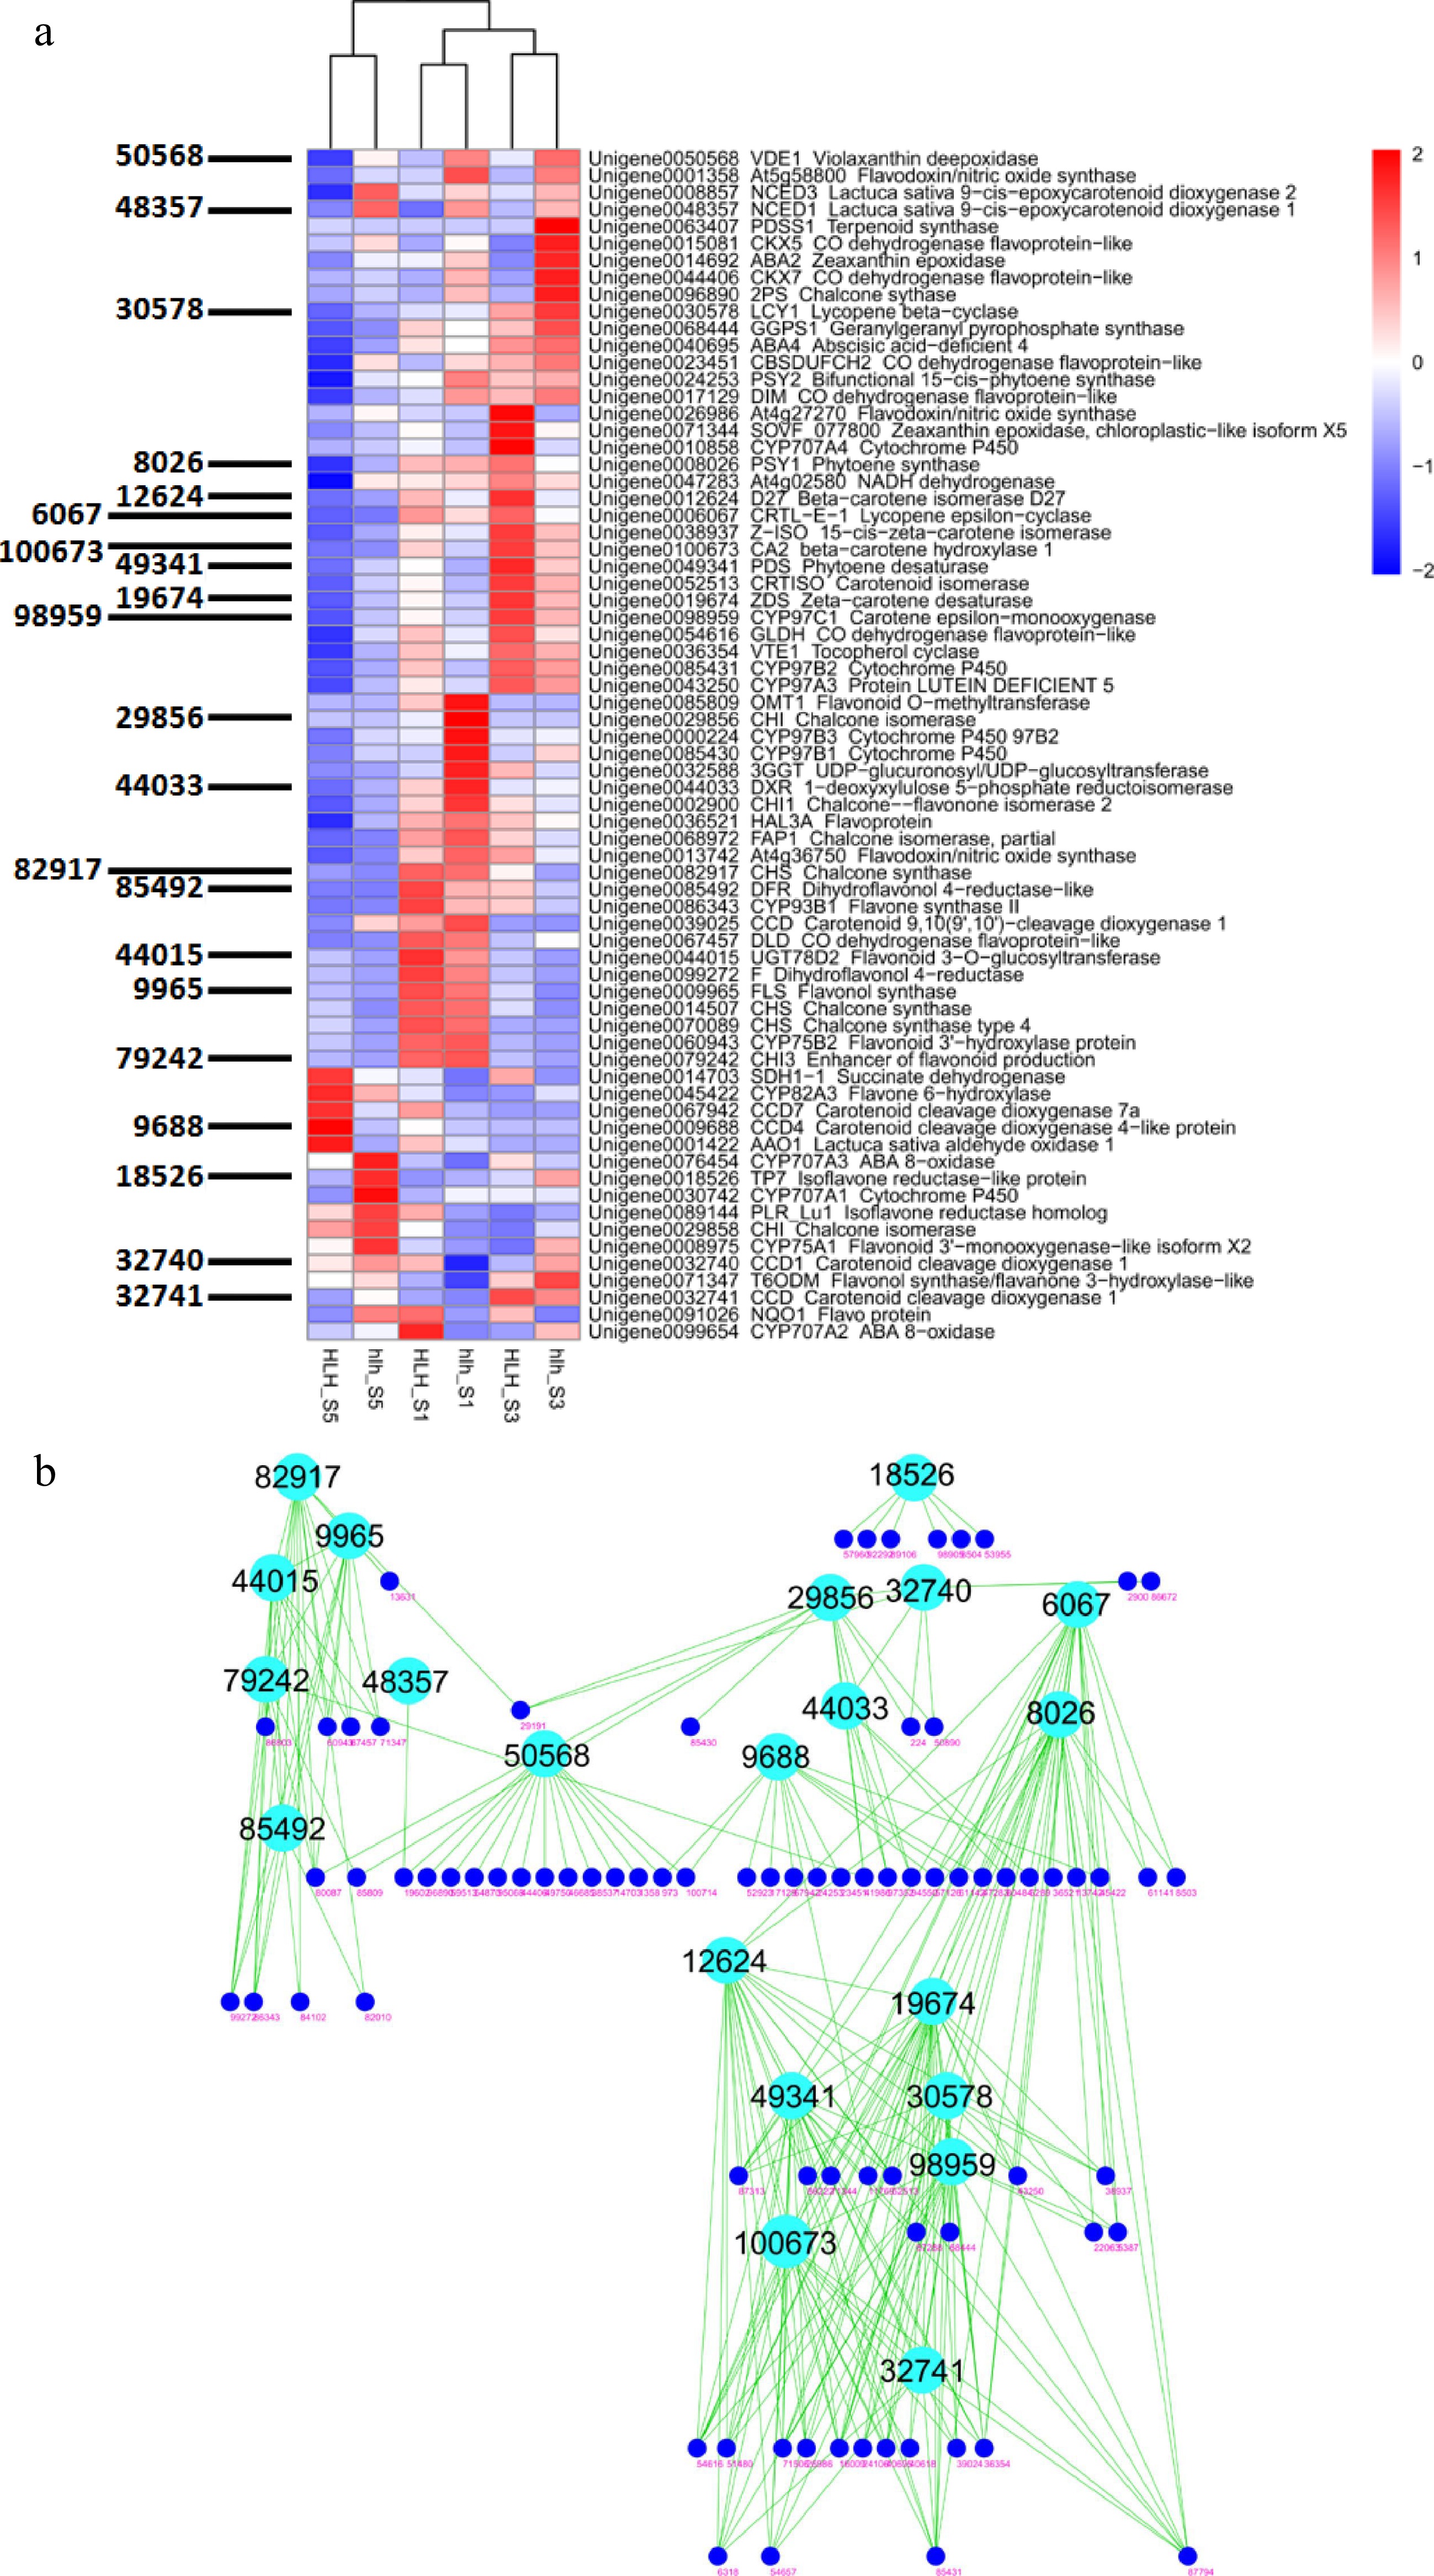
Figure 5.
(a) Heatmap of all important DEGs related to biosynthetic pathways of carotenoids, flavonoids, anthocyanins and other such compounds and WGCNA-based identification of hub genes (gene IDs shown on left side); (b) clustering analysis of coexpressed modules and identification of candidate genes for chemical homeostasis.
Molecular regulation of important pigments biosynthesis
-
Lycopene, α-carotene, β-carotene, and lutein are the important pigments that are documented to regulate petal color development. We found key genes in the carotenoid pathway, such as ZDS (19,674), LCY1 (30,578) and CYP97C1 (98,959), that regulate the biosynthesis of lycopene, α/β-carotene and lutein, respectively (Fig. 6a). Cyanidin and pelargonidin are the important anthocyanidin pigments. Key enzymes were found to regulate anthocyanin pathway, such as CHS (82,917), CHI (29,856), DFR (85,492) and flavonol pathway, such as FLS (9,966). Moreover, ANS (98,176) and ANT17 (98,174) were found to regulate cyanidin and pelargonidin biosynthesis (Fig. 6b). Expression profiling of key genes for carotenoid and anthocyanin homeostasis shows their expression in the early stages (FD1 and FD3) of flower development as compared to FD5 (Fig. 6c).
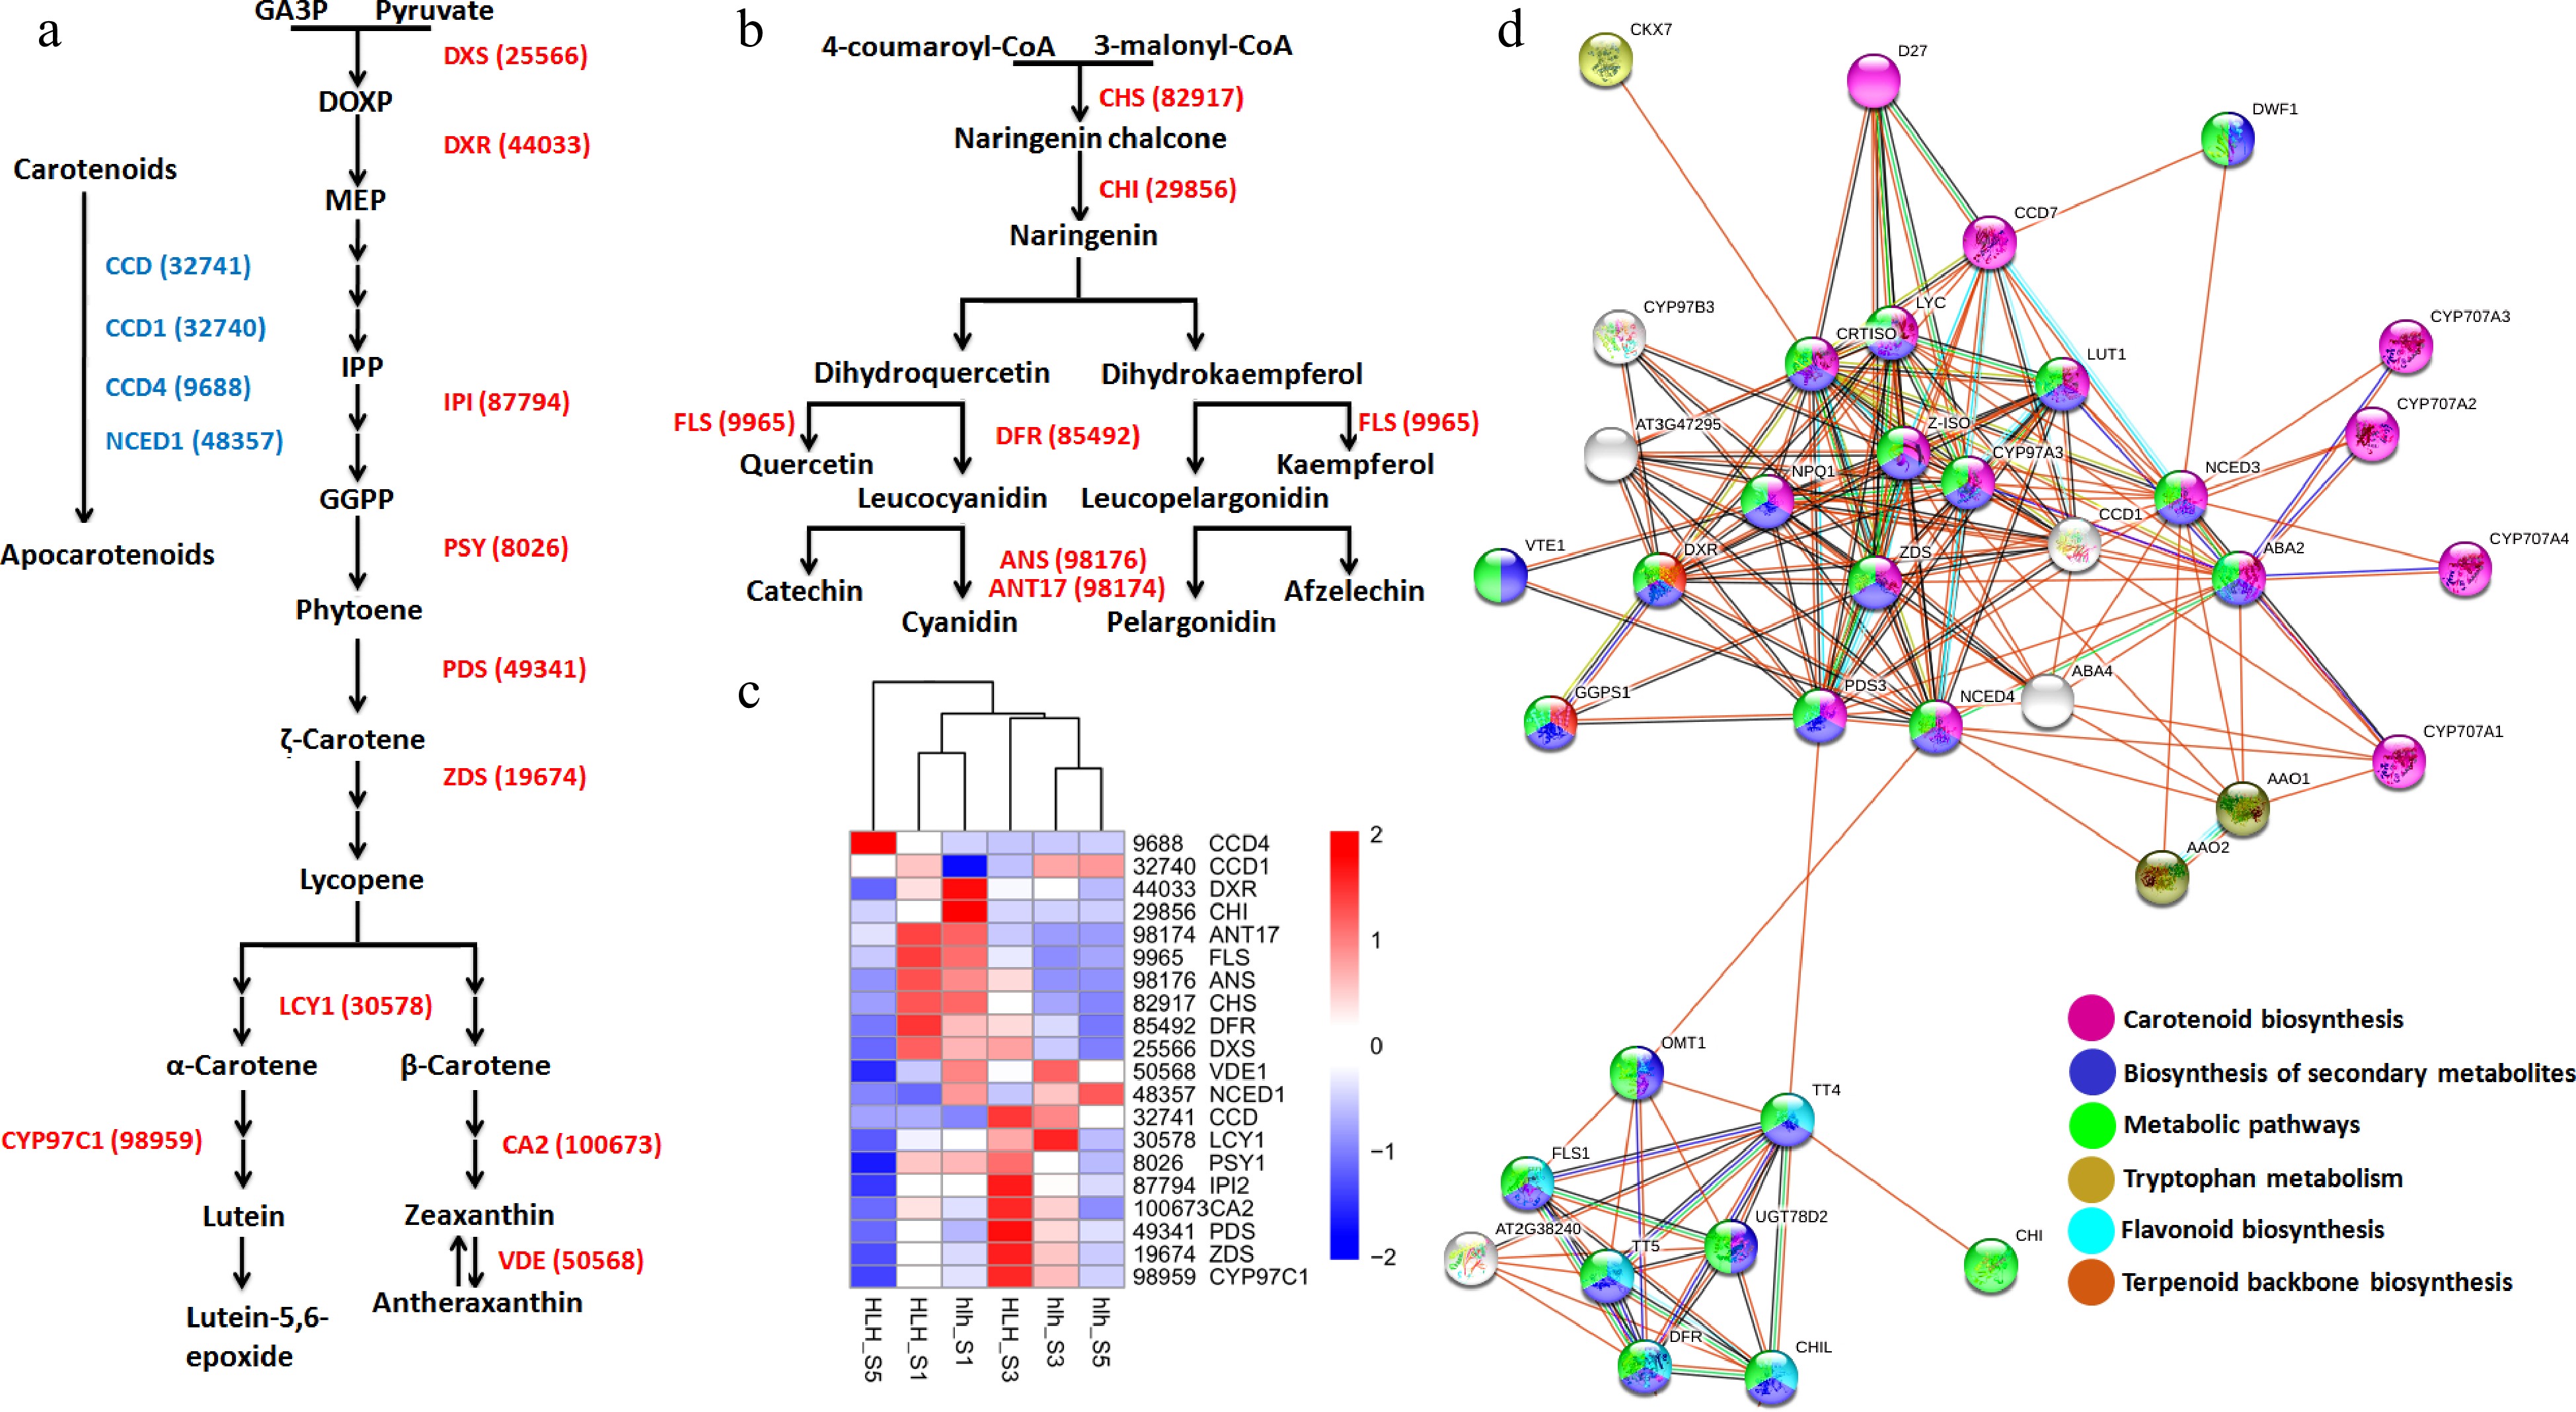
Figure 6.
(a) Carotenoid biosynthesis pathway driven by different enzymes (red color) and carotenoid degradation pathway driven by different enzymes (blue color); (b) anthocyanin biosynthesis pathway driven by different enzymes (red); (c) heatmap of all the genes involved in the carotenoid and anthocyanin pathways; (d) protein-protein interaction of carotenoid and anthocyanin related genes.
The STRING-based protein-protein interaction networking shows the important relationships among different key enzymes that regulate carotenoids and anthocyanins. The KEGG pathways enriched by these proteins include carotenoid biosynthesis, biosynthesis of secondary metabolites, flavonoid biosynthesis, and terpenoid backbone biosynthesis (Fig. 6d).
Validation of selected genes by qRT-PCR
-
Combined with transcriptome analysis and gene co-expression network analysis, 16 key genes of anthocyanin and carotenoid pathways (DXS, DXR, IPI, PSY, PDS, ZDS, LCY1, CYP97C1, CHS, CHI, FLS, DFR, ANS, ANT17, CCD4 and CCD1) were selected to verify their expression in five developmental stages (S1−S5) of mutant (hlh) and wild-type (HLH). In general, the expression levels of carotenoid and anthocyanin pathway genes were decreased in the mutant hlh compared with the wild-type parent HLH. In terms of development period, the gene expression level was high in S1−S3 stage, while it was low in S4−S5 stages, showing a general trend of first increasing and then decreasing (Supplemental Fig. S3). The gene expression levels of CHI, ANS, DFR and CCD4 were significantly changed in the mutant hlh compared with the wild-type parent HLH (Fig. 7). The expression level of CHI gene was significantly increased in hlh in S1. In contrast, the expression levels of ANS and DFR were significantly decreased in hlh in early stages (Fig. 7). In the S1−S5 stages, the expression level of DFR gene in hlh gradually decreased, and then decreased sharply from S3 stage. On the contrary, the expression level of DFR gene in HLH increased sharply in the S1−S2 stages, then decreased, and maintained at a low expression level in the S4-S5 stages (Fig. 7). The expression levels of CCD4 genes related to carotenoid degradation were also significantly decreased in hlh. In HLH, the expression level of CCD4 increased during S1−S2 and maintained at an extremely high level in S5. In hlh, the expression level of CCD4 was extremely low during S1−S5 (Fig. 7).
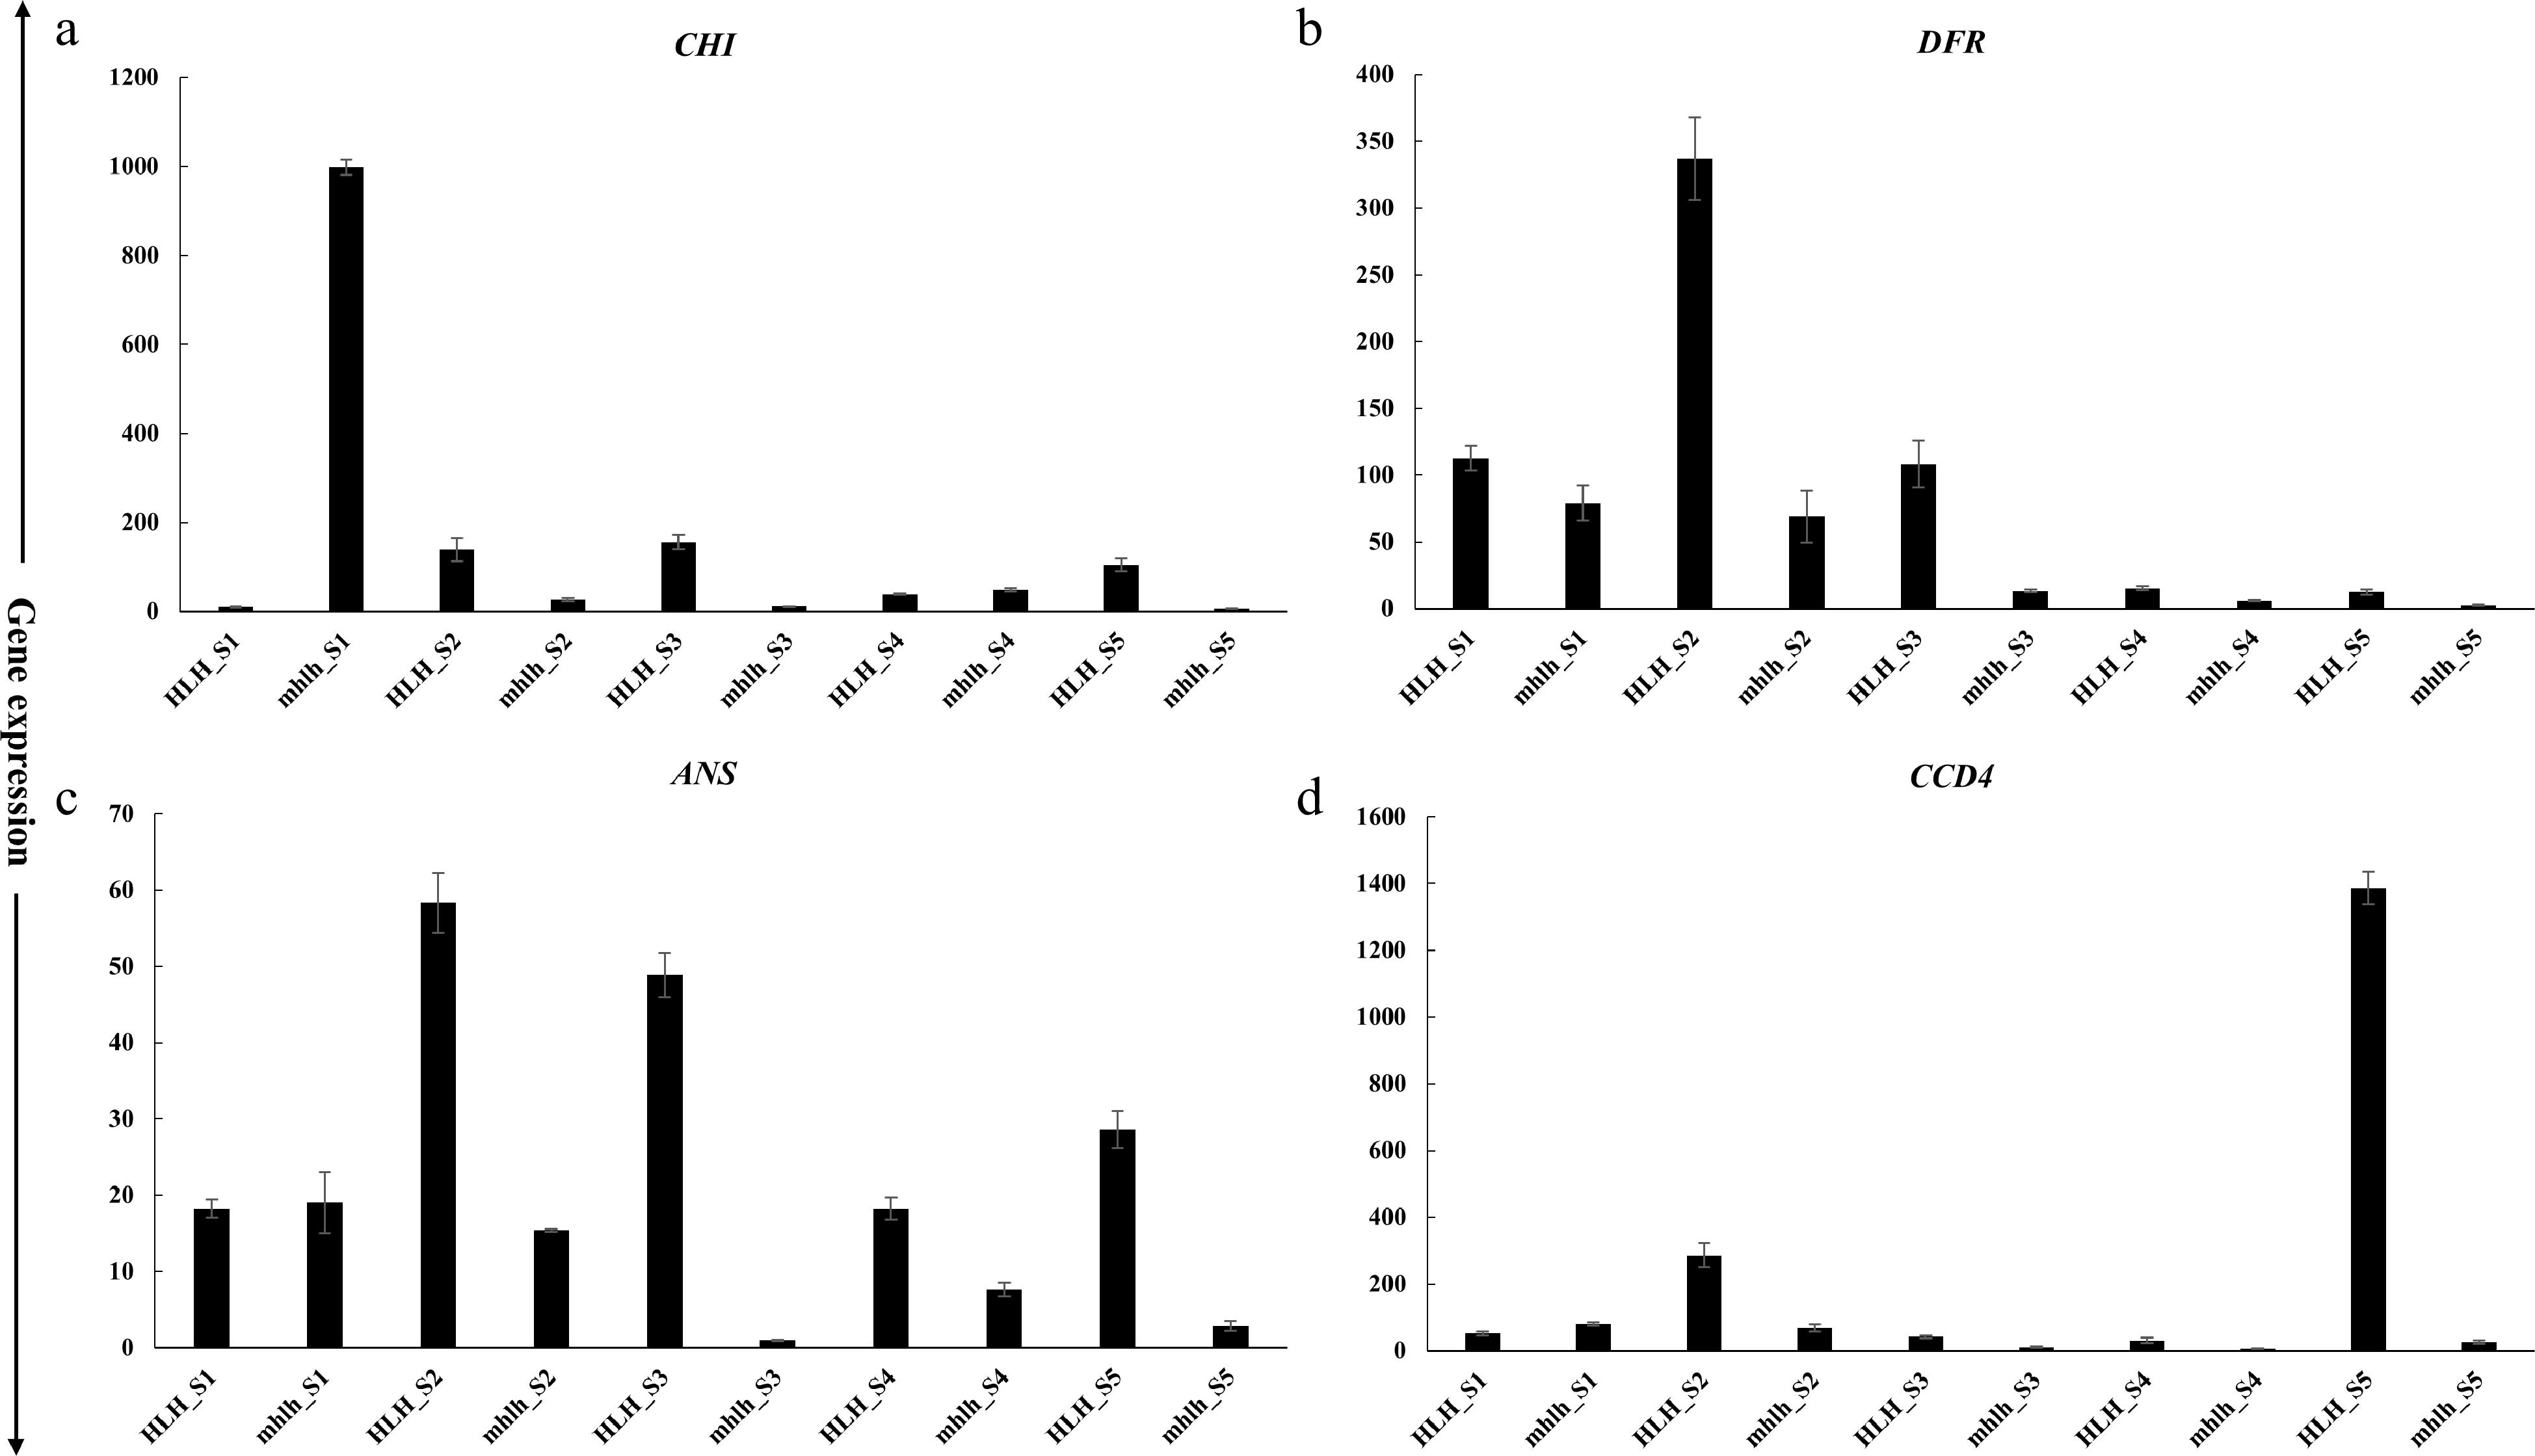
Figure 7.
qRT-PCR expression of candidate genes at five petal development stages for HLH and hlh. (a)−(c) represent anthocyanins pathway genes; (d) represents carotenoid degradation pathway related gene.
-
Flowers speak their own language using their scheme and color of bloom. Therefore, petal color is an important horticultural trait that affects the aesthetic and ornamental values of flowers. The pathways involving the determination of petal color phenotypes are traced from genetic levels to the phenotypic levels. A number of genes that determine the enzymatic components of anthocyanin and flavonoid biosynthesis are redundant, however, despite this complexity, there is a possibility that individual genes are associated with discrete floral phenotypes. Mutations over time may cause multiple phenotypic effects. The interaction among petal color, anthocyanins and carotenoids has been discussed for a long time[32,33]. It is documented that flower color is regulated by four natural pigment classes, including carotenoids, chlorophylls, betalains, and flavonoids[34]. Accumulation of anthocyanins and flavonoids has been shown to support color formation and enhancement in petals[34]. Currently, gene regulation has been discussed for flower color arrangement and the accumulation of flavonoids in flowers, such as Camellia nitidissima[35] and Camellia chekiangoleos[36], although the mechanisms of carotenoids and anthocyanins are not well elucidated for color mutants in chrysanthemum.
The present study correlates transcriptome data with the accumulation of important carotenoids and anthocyanidins in the color mutant of C. morifolium. The results showed that carotenoid concentration in hlh changed significantly compared with that in HLH, and lutein was the main changing component (Fig. 2b). The concentration of lutein was significantly higher in hlh as compared to HLH (Fig. 2c). Similarly, significantly higher content of lutein was accumulated in the yellow tip of the hlh petal (hlh-Y) than that in the red base (hlh-R) (Fig. 2c). Gentiana lutea accumulates lutein and other carotenoids in its petals to reflect yellow color[37,38]. Three ways have been proposed for petal color development. These include the high accumulation of carotenoids, the specific accumulation of red-colored carotenoids, and the accumulation of red-colored anthocyanins[39]. The appearance of orange color due to increased carotenoids is common in Tagetes erecta[40], T. petula and Helianthus annuus[39]. Yellow and orange varieties of these species show minor changes in the carotenoid and anthocyanin profiles but the total content of carotenoids is higher in the orange petals as compared to yellow petals. Secondly, orange color appears by specific accumulation of red-pigment carotenoids, such as lycopene. In this way, the orange petals are formed in the Eschscholzia californica, Gazania spp. and Osteospermum ecklonis. Thirdly, more anthocyanins are accumulated in the orange petals of Chrysanthemum morifolium, Gerbera jamesonii and Zinnia elegans. Orange and yellow varieties of these species exhibit slight difference in carotenoid content, but higher anthocyanin levels are present in the orange petals[39,40]. In our study, higher levels of carotenoid (lutein) can be seen in yellow parts of mutant petals (Fig. 2). Although there was no significant change in anthocyanin content between HLH and hlh, the concentration of cyanidin in the yellow tip of the hlh petal (hlh-Y) was significantly higher than that in the red base (hlh-R). Of course, due to the limitation of sample collection, we only collected samples in one period and did not collect samples in the whole period of flower development. Therefore, we believe that the data reflected by pigment content may not be comprehensive enough. In fact, during the microscopic observation of petal surface, we found that the density of red plastid on the upper surface of hlh petals was lower than that of HLH at different developmental stages, and it was more obvious between the yellow tip of the hlh petal (hlh-Y) and red base (hlh-R) (Fig. 1d). Therefore, based on the results of pigment content detection and petal microscopic observation, we believe that carotenoid pigments especially lutein and anthocyanins jointly affect the color change. The gene expression results also support our conjecture.
Marigold flowers are a rich source of lutein, which gives yellow color to petals[41]. A number of carotenogenics (PSY, PDS, LCYs, CRISTO and DXS) have been cloned in the carotenoid pathways[40]. Bright yellow flowers of Gentiana lutea are a rich source of β-carotene[38]. Bright yellow petals of C. morifolium Ramat reflect the accumulation of lutein[42]. Genes regulating enzymes involved in carotenoid biosynthesis (PSY, PDS, ZDS and LCYs) and carotenoid cleavage (CCD1, CCD4 and NCED1) have been isolated from immature petals[43]. Yellow color flower of Narcissus pseudonarcissus reflects the abundance of lutein and reduction of β-carotene[41]. We also observed high concentration of lutein in the mutant chrysanthemum hlh as compared to HLH (Fig. 2). In contrast, the expression levels of carotenoid biosynthesis genes were significantly decreased in the mutant hlh compared with the wild-type parent HLH. However, the expression levels of CCD4 gene related to carotenoid degradation were significantly decreased in hlh, especially in S5 (Fig. 6 & 7), indicating that the carotenoid degradation process in the hlh may be affected. The color of C. morifolium 'Jimba' was modified from white to yellow by introducing CCD4α RNAi constructs[44].
The difference in the accumulation of anthocyanidins in petals between natural and mutant cultivars is determined by the transcriptional gene regulators encoding anthocyanin-pathway enzymes. The gene expression levels of CHI, ANS and DFR were significantly changed in the mutant hlh compared with the wild-type parent HLH (Fig. 6 & 7). The expression levels of CHI gene were significantly increased in hlh in S1. In contrast, the expression levels of ANS and DFR were significantly decreased in hlh in the early stages (Fig. 6 & 7). The substrate specificity of DFR determines the accumulation of anthocyanin types. DFR shows strict substrate specificity in some flowers, such as Cymbidium hybrida and Petunia hybrida, where it cannot make an efficient use of dihydrokaempferol (DHK)[45,46], causing the lack of orange or brick red petal colors.
The MBW (MYB, bHLH and WD40) TF complex play key roles in the regulation of anthocyanin biosynthesis genes[24]. Research has shown that WD40 TF COP1 regulates anthocyanin biosynthesis by interacting with MYB TFs PAP1 and PAP2[47]. MYB17, MYB73, MYB61, bHLH128, and WD40 TF COP1 may regulate the yellow color appearance in Paeonia 'Coral Sunset'[47]. MYB73 regulates anthocyanin pigmentation in potato[48]. TTGI is a WD40-repeat TF that regulates the biosynthesis of anthocyanins in Dendrobium candidum[49]. The bHLH62 may involve anthocyanin biosynthesis in eggplant[50]. Thus, our data showed considerable variation of MBW TF complex and the candidate TFs exhibited significant expression intensities between the two cultivars (Supplemental Fig. S2c).
Based on the above results and analyses, we conclude that mutation in the flower color of the mutant (hlh) is probably caused by changes in a range of anthocyanins and carotenoids accumulation, especially for the accumulation of lutein and cyanidin, which may result from the expression changes of biosynthesis and degradation related genes particularly the CHI, DFR, ANS and CCD4 genes (Fig. 8).
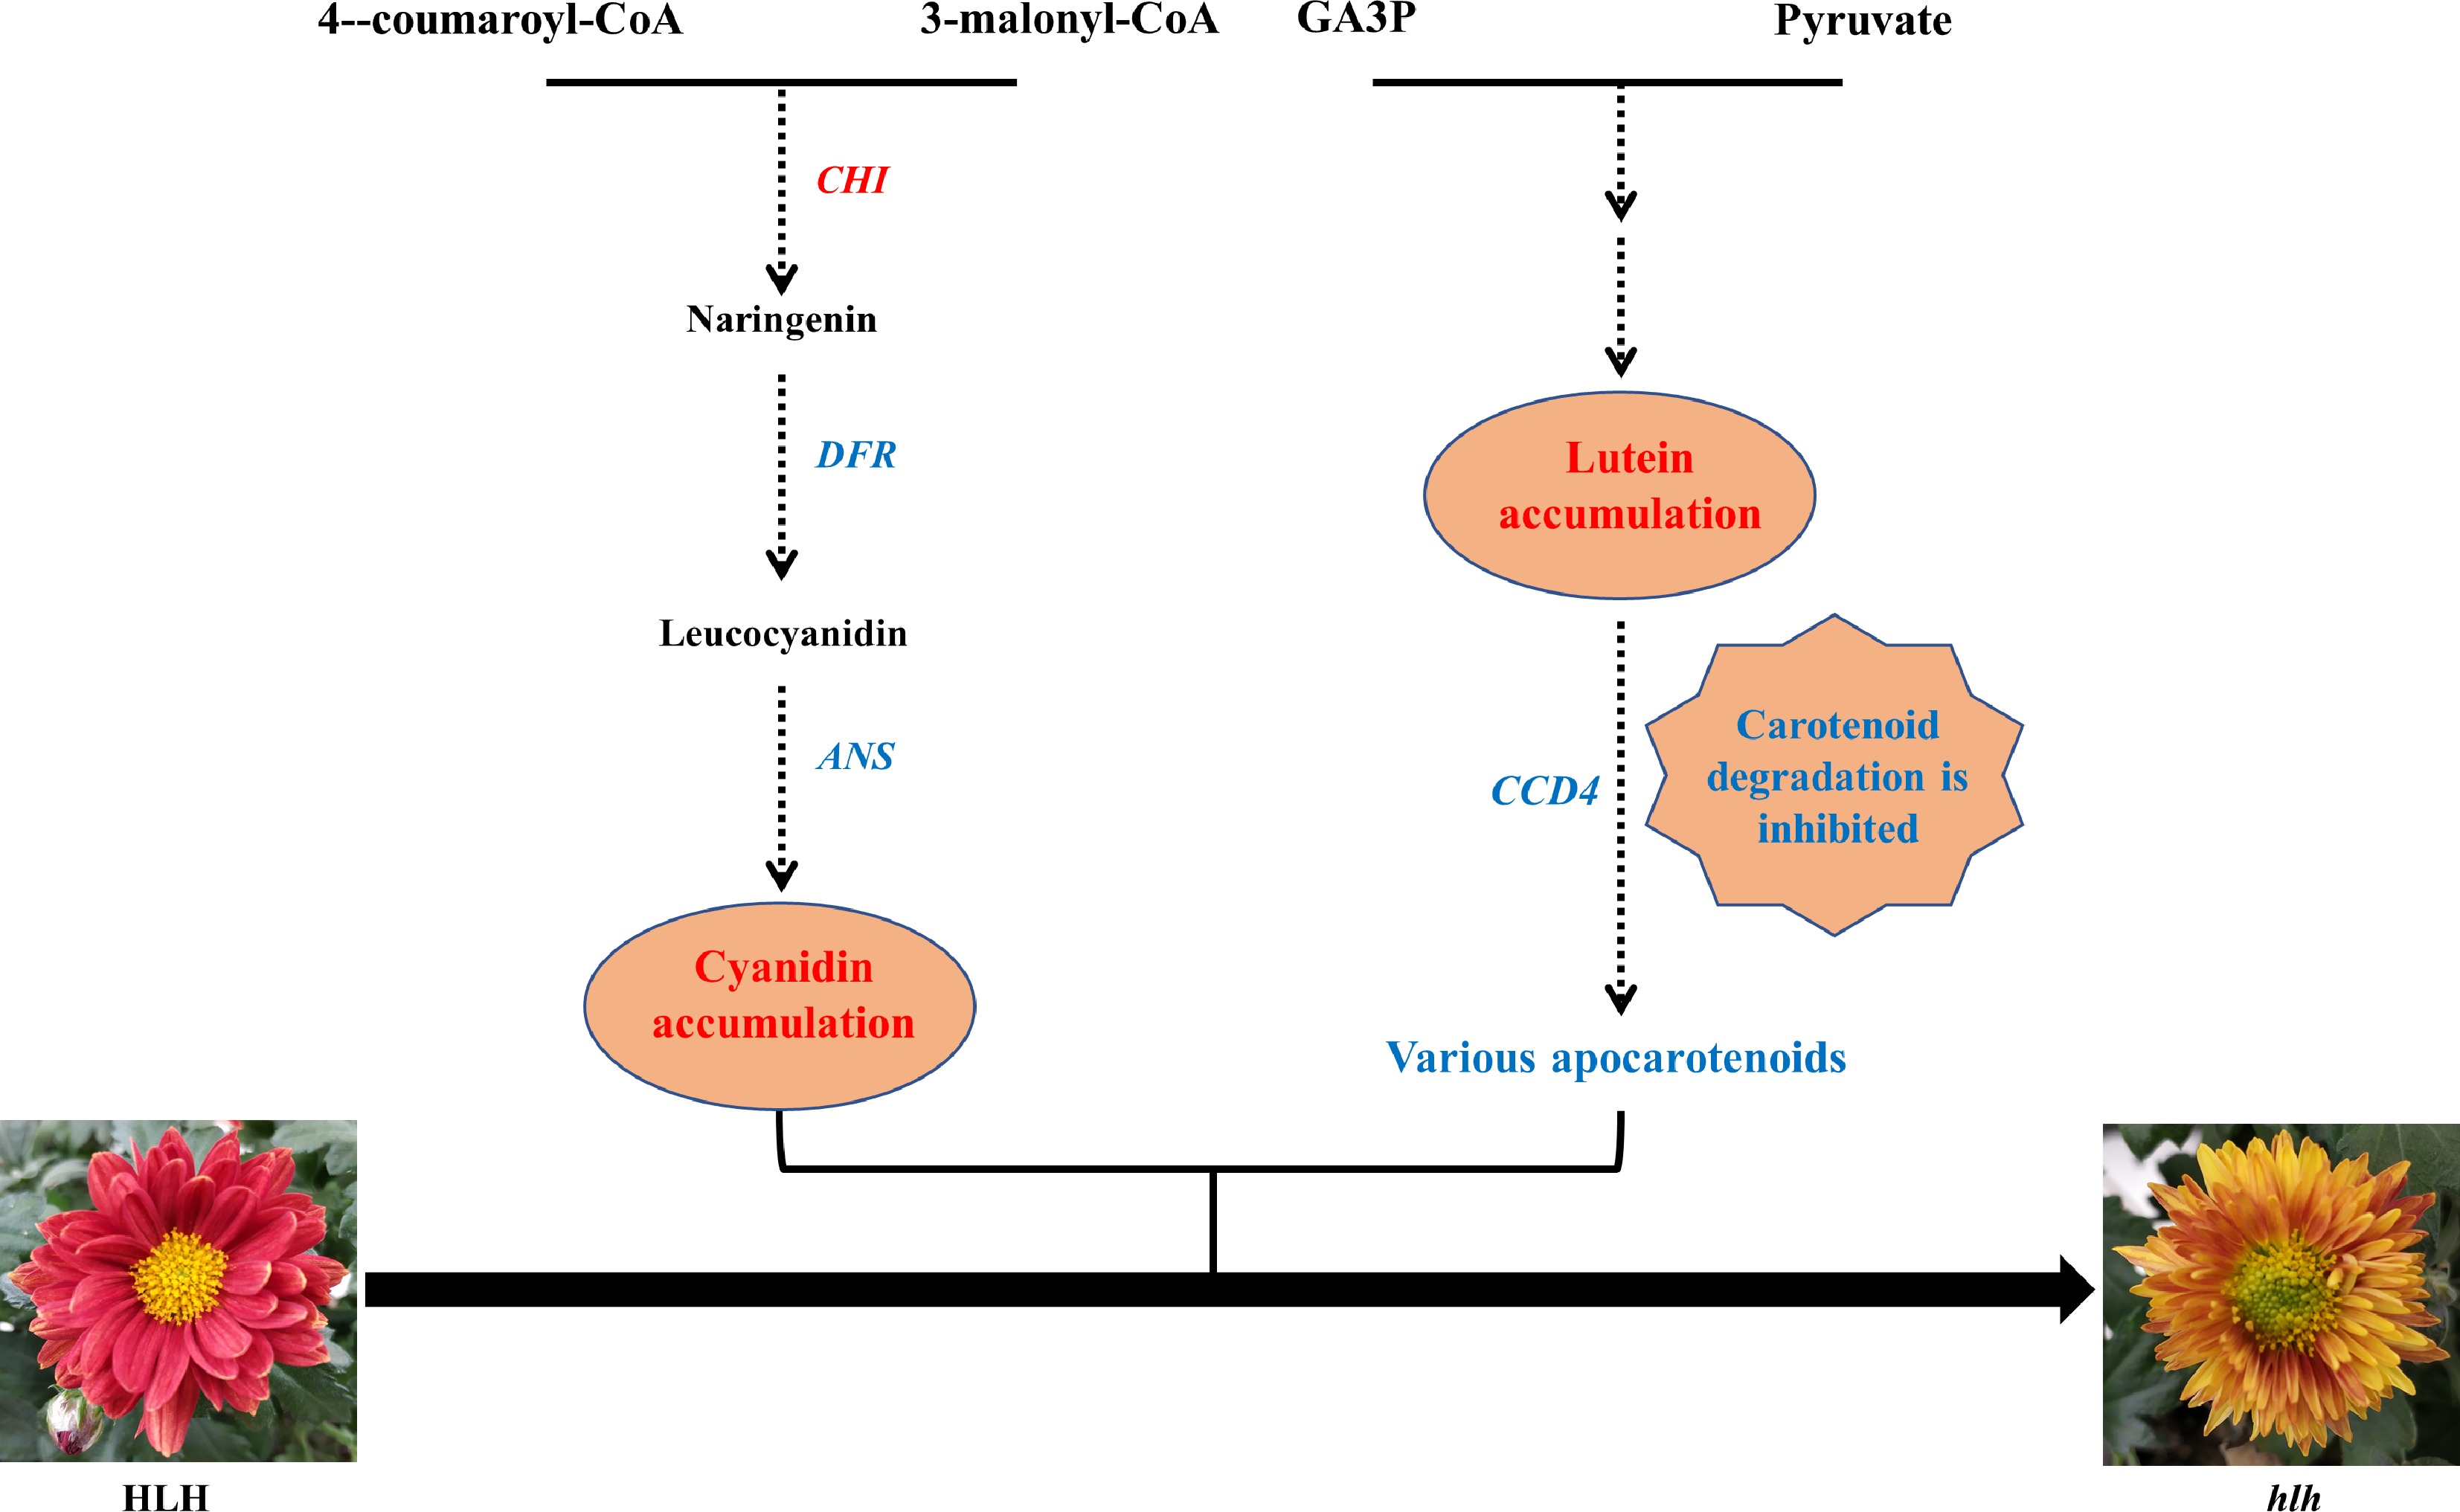
Figure 8.
A putative model of the flower color change in hlh. Genes in the pathway are candidate hub genes. The increased pigment content and up-regulated gene in the mutant (hlh) was marked in red, while the decreased and down-regulated was marked in blue, as compared with the original parent (HLH).
Bud mutants serve as an important source to understand the regulation of flower color in precious flowers. The current study uses bud mutants to stabilize the mutation causing color shift in C. morifolium and after 2 y of stabilization, transcriptomic analysis was performed to compare the genetic variations between the original and the mutant cultivar at three stages of flower development (FD stages 1, 3, and 5). Moreover, the concentrations of important carotenoids and anthocyanidins were ascertained through HPLC-MS/MS to quantitatively analyze the color shift. Findings of this study, thus, lay the theoretic basis for the further understanding of the mechanism of flower color transition in chrysanthemum.
-
After two years of recurrent growth through cuttings, the original cultivar (HLH) and the stable mutant (hlh) were selected for RNA-seq and chemical analysis. The flower development was divided into five stages[31]. Ray florets wrapped in the bract define S1. S2 starts when the ray floret barely outgrows the bract. S3 defines the complete outgrowth of ray floret out of bract. S4 shows the fully opened ray florets, and S5 defines the start of decay process. Outer floral whorls were selected for pigmentation and sequencing analyses.
Pigment analysis through high performance liquid chromatography coupled with mass spectrometry (HPLC-MS/MS)
-
Ray florets were collected at the third stage of flower development to evaluate the concentrations of carotenoids and anthocyanidins for both the cultivars. Evaluation was performed in two groups. In the first group, the whole petals of HLH and hlh were selected, and in the second group the tips and bases of hlh flower petals were collected for evaluation. Three replicates were used for each sample. After removing one group of abnormal data for HLH whole petal sample, the data with two replicates was finally used for analysis.
In this experiment, the carotenoids were extracted using the acetone extraction method and detected by Waters ACQUITY UPLC. Detailed steps are as follows: samples were ground to a pulp in liquid nitrogen, and 1.0 g samples were accurately weighed into the tubes. Then the samples were cleared with 10 mL acetone and ultrasonicated in a water bath for 15 min. After centrifugation, the supernatant was filtered and collected, and the sample was repeatedly extracted until it was colorless. All supernatants were combined and evaporated to dry by rotary evaporation at 35 °C. The solution was dissolved in 1 mL methanol, passed through 0.22 μm filter membrane, and detected by HPLC. The HPLC conditions are as follows: The chromatographic column was Waters Symmetry Shield RP18 (4.6 × 250 mm, 5 μm); The column temperature was 30 °C; A: Methanol + acetonitrile + methylene chloride = 20 + 75 + 5 (V: V: V); Gradient parameters of HPLC is 0 min (100% A, 0% B) and 30 min (100% A, 0% B) with a flow rate of 1.0 mL/min. Injection volume is 10 μL.
In this experiment, the anthocyanidins were extracted by ethanol/hydrochloric acid extraction and concentrated hydrochloric acid hydrolysis, and the anthocyanidins were detected by Agilent 1290 HPLC chromatograph Series AB Qtrap6500 mass spectrometer. Detailed steps are as follows: samples were ground to a pulp in liquid nitrogen, and 1.0 g samples were accurately weighed into the tubes. Then, 15 mL ethanol/hydrochloric acid extraction buffer was added to the powder, and the powder was sonicated for 30 min. The supernatant was removed by centrifugation at 13,000 RPM at 4 °C for 5 min. The residue was extracted again and the extract was combined twice. After that, 10 mL volume of concentrated hydrochloric acid was added, and the mixture was bathed in 90 °C water for 40 min. After cooling, the membrane was filtered at 0.22 μm and detected by HPLC-MS/MS. Using methanol (0.1% formic acid) as a solvent, standard solutions of CC, DC, PelC, PeoC with the gradient of 0.5 μg/mL, 1 μg/mL, 2 μg/mL, 5 μg/mL, 10 μg/mL, 20 μg/mL and 100 μg/mL were prepared. The details of HPLC-MS/MS are as follows: the chromatographic column was poroshell 120 SB-C18 (2.1 × 150 mm, 2.7 μm); column temperature was 30 °C; Mobile phase: A:B = (methanol /0.1% formic acid) : (water /0.1% formic acid); Elution gradient: 0−2 min, A = 20%; After 2−14 min, A was increased to 80%; 14−15 min, A = 80%; At 15.1 min, A decreases to 20%; 15.1−20 min, A = 20%. Injection volume is 2 μL. Mass spectrometry conditions are as follows: Air curtain gas was 15 psi; Spray voltage was 4,500 V; Atomizing gas pressure was 65 psi; Auxiliary air pressure was 70 psi; Atomization temperature was 400 °C.
Preparation of RNA-seq library and sequencing
-
Total RNA was extracted from ray florets at three stages of flower development (S1, S3, and S5) from both the cultivars using Mini-BEST extraction kit (Beijing, TaKaRa). The 18 libraries (six samples in three replicates) were sequenced using Illumina sequencing platform (HiSeq 2000). The raw reads were subjected to various quality assessment checks and the high-quality reads were selected using the NGS QC Toolkit (v2.3). The de novo transcriptome assembly was generated using Trinity with default parameters[51]. Cufflinks (v2.0.2) was used to determine FPKM (fragments per kilobase of transcript length per million mapped reads) values. The correlation between the samples was determined through SCC (Spearman correlation coefficient). R-utilities of prcomp and corrplot were used to perform PCA (principal component analysis) and hierarchical clustering[1]. Differential gene expression between the samples was ascertained using Cuffdiff. The genes with 2-fold difference in expression, correct p-value < 0.05 were designated as differentially expressed genes (DEGs). Selected gene sets were shown on heatmap using ggplot2 and pheatmap utilities of R.
Gene ontology (GO) and pathway enrichment analyses
-
The DEGs searched on GO and KEGG (Kyoto Encyclopedia of Genes and Genomes) databases. The enrichment of GO/KEGG pathways was ascertained for nine pairs between parent and mutant samples. Significantly enriched terms were selected at p or q value of ≤ 0.05.
Weighted gene coexpression network analysis (WGCNA)
-
The top 1,000 significantly expressed DEGs were selected through edgeR package of R. This set was used to perform WGCNA as previously described[1], and identified modules for flower color and hub genes in carotenoid and anthocyanin pathways. Moreover, all the DEGs related to flavonoids, carotenoids and anthocyanins were filtered and coexpressed modules were found to select candidate genes for carotenoid and anthocyanin pathways. The protein IDs were uploaded on STRING database to determine the protein-protein interactions among important proteins involving carotenoid and anthocyanin pathways.
qRT-PCR analysis
-
The qRT-PCR experiments were performed to validate the key genes related to anthocyanin and flavonoid pathways. Sixteen color related hub genes were selected and their expression patterns during five developmental stages in both HLH and hlh were examined. The analysis was performed using SYBR Premix Ex Taq kit (Takara, Japan) with three replications. The PCRs were performed with a Mini Opticon Real-time PCR system (Bio-Rad, USA) with the following amplification procedure: pre-denaturation at 95 °C for 1 min; 40 cycles at 95 °C for 15 s, annealing at 60 °C for 15 s and 72 °C for 30 s; 95 °C for 5 s, 60 °C for 1 min, 95 °C with an increment of 0.11 °C/s, 50 °C for 30 s. Primer sequences are shown in Supplemental Table S1. Relative gene expression was quantified using the expression of 18s as internal control.
Statistical analysis
-
Statistical significance was checked using SPSS (SPSS Inc., Chicago, IL, USA; ver. 16.0) for one-way ANOVA. Significant difference is shown at p < 0.05 (*) or p < 0.01 (**).
This research was funded by the Fundamental Research Funds for the Central Universities (grant numbers 2021BLRD08, 2021JD03).
-
The authors declare that they have no conflict of interest.
- Supplemental Fig. S1 Comparison of KEGG pathways (a) and biological process enrichment (b) for intra-cultivar and inter-cultivar comparisons of different stages of flower development.
- Supplemental Fig. S1a
- Supplemental Fig. S2 (a) Up- and down-regulated DEGs among the inter-cultivar and intra-cultivar comparisons of different stages of flower development; (b) different transcription factor families and the number of genes in each family; (c) mining of highly differential transcription factors of three families (MYB, bHLH and WD40) that are known to play important role in anthocyanin biosynthesis and accumulation.
- Supplemental Fig. S3 qRT-PCR expression of candidate genes at five petal development stages for HLH and hlh.
- Supplemental Table S1 Primer sequence for qRT-PCR.
- Copyright: © 2022 by the author(s). Published by Maximum Academic Press, Fayetteville, GA. This article is an open access article distributed under Creative Commons Attribution License (CC BY 4.0), visit https://creativecommons.org/licenses/by/4.0/.
-
About this article
Cite this article
Ahmad S, Yuan C, Cong T, Yang Q, Yang Y, et al. 2022. Transcriptome and chemical analyses identify candidate genes associated with flower color shift in a natural mutant of Chrysanthemum × morifolium. Ornamental Plant Research 2:19 doi: 10.48130/OPR-2022-0019 

Transcriptome and chemical analyses identify candidate genes associated with flower color shift in a natural mutant of Chrysanthemum × morifolium
- Received: 24 April 2022
- Accepted: 27 October 2022
- Published online: 18 November 2022
Abstract: Flower color variation in Chrysanthemum × morifolium is an important horticultural trait. This study identifies a natural bud sprout mutant of chrysanthemum cultivar Hanluhong (HLH) which normally produces red flowers. In the mutant (hlh), the tip of the petals turn golden yellow and gradually turn yellow from tip to the base. After two years of consecutive propagation through cuttings, the mutant traits were stable. Here, the contents of carotenoids and anthocyanidins were determined by HPLC-MS/MS. Compared to HLH, the hlh displayed significantly higher contents of lutein. Then we comparatively analyzed the transcriptome of the ray florets tissues during three flower developmental stages. Higher number of stage specific DEGs were found in mutant cultivar as compared to wild type. About 200 DEGs were filtered related to the metabolism of flavonoids, carotenoids, terpenoids, and anthocyanins. Combined with weighted gene co-expression network analysis (WGCNA) and qRT-PCR verification, CHI, DFR, ANS and CCD4 genes involved in anthocyanins biosynthesis and carotenoids degradation were identified as candidate genes. Among the transcription factors, MYB, bHLH and WD40 members showed significant expression variations between the two cultivars. These results improve our understanding of flower color variation especially red and yellow color transition in chrysanthemum.
-
Key words:
- Color mutant /
- Chrysanthemum /
- Carotenoids /
- Anthocyanins