ARTICLE   Open Access    

Physiological and transcriptome analyses to infer regulatory networks in flowering transition of Rosa rugosa

  • # These authors contributed equally: Xiaobin Wang, Fei Zhao

More Information
  • Rosa rugosa is a famous Chinese traditional flowering species with high economic value. Flowering transition is an important process in plant growth and development. Although characterization of the flowering transition process has made great progress in some plants such as model plants, the process in R. rugosa has not been rigorously characterized to establish a mechanism. In this study, the changes of buds during flowering transition in R. rugosa ‘Duoji Huangmei’ were analyzed through transcriptomic sequencing combined with morphological and physiological index determinations. Results showed that with the morphology changes of buds, both sugar and starch content showed a similar up-down pattern while phytohormones content displayed various trends, which implied that sugar, starch and phytohormones might play diverse roles during flowering transition in R. rugosa. Moreover, a total of 4363 differentially expressed genes (DEGs) were identified at three developmental stages. Among them, 74 DEGs were involved in metabolism, transport, and signal transduction of sugar, starch, and phytohormones, as well as photoperiod and vernalization response. We proposed that these DEGs were not regulated independently but interacted with each other to construct a gene-gene network to regulate flowering transition of R. rugosa, and the regulatory network from vegetative growth stage (S1) to flowering transition stage (S2) was more complicated. These results further enriched the study of flowering transition in Rosa and lay an important foundation for breeding new varieties with desired floral traits.
  • Agricultural management practices impact soil physicochemical properties to a remarkable extent. Degradation of soil health has led to a contraction in agricultural production and soil biodiversity particularly due to conventional farming practices, indiscriminate use of inorganic fertilizers (INF) and inadequate input of residues[1]. Organic or inorganic fertilizers have been regarded as a critical component of agriculture to accomplish global food security goals[2]. The exogenous supply of fertilizers could easily alter soil properties by restoring the nutrients that have been absorbed by the plants[2]. Thus, implementing adequate nutrient management strategies could boost plant yield and sustain plant health. Tillage affects the soil, especially for crop production and consequently affects the agro-ecosystem functions. This involves the mechanical manipulation of the soil to modify soil attributes like soil water retention, evapotranspiration, and infiltration processes for better crop production. Thus, tillage practices coupled with fertilizer inputs may prove a viable strategy to improve soil health components such as nutrient status, biodiversity, and organic carbon.

    Soil serves as a major reservoir of nutrients for sustainable crop production. Intensive cultivation due to growing population burden has led to the decline of soil nutrient status that has adversely affected agricultural production. Various researchers have assessed the soil nutrient budget and the reasons behind decline of nutrient content in soil[3]. Soil management strategies have assisted in overcoming this problem to a greater extent. Tillage practices redistribute soil fertility and improve plant available nutrient content due to soil perturbations[4]. Different tillage and fertilization practices alter soil nutrient cycling over time[5]. Fertilization is an important agricultural practice which is known to increase nutrient availability in soil as well as plants[6]. A report has been compiled by Srivastava et al.[7], which assessed the effectiveness of different fertilizers on soil nutrient status in Indian soils.

    Soil biota has a vital role in the self-regulating functions of the soil to maintain soil quality which might reduce the reliance on anthropogenic activities. Soil microbial activities are sensitive to slight modifications in soil properties and could be used as an index of soil health[8]. Maintenance of microbial activity is essential for soil resilience as they influence a diverse range of parameters and activities including soil structure formation, soil SOM degradation, bio-geochemical cycling of nutrients etc.[9]. Various researchers have identified microbial parameters like microbial biomass carbon (MBC), potentially mineralizable nitrogen (PMN), soil respiration, microbial biomass nitrogen (MBN), and earthworm population as potential predictors of soil quality. Geisseler & Scow[10] have compiled a review on the affirmative influence of long-term mineral fertilization on the soil microbial community.

    Being the largest terrestrial carbon (C) reservoir, soil organic carbon (SOC) plays a significant role in agricultural productivity, soil quality, and climate change mitigation[11]. Manure addition, either solely or along with INF augments SOC content which helps in the maintenance and restoration of SOM more effectively as compared to the addition of INF alone[12]. Enhancement of recalcitrant and labile pools of SOC could be obtained through long-term manure application accentuating the necessity of continuous organic amendments for building up C and maintaining its stability[13]. Generally, compared with manure addition, INF application is relatively less capable of raising SOC and its labile fractions[14]. Alteration in SOC content because of management strategies and/or degradation or restoring processes is more prominent in the labile fraction of soil C[15]. Several fractions of soil C play vital roles in food web and nutrient cycles in soils besides influencing many biological properties of soil[16]. Thus, monitoring the response of SOC and its fractions to various management practices is of utmost importance.

    A positive impact on SOC under manure application coupled with INF in rice-wheat systems has been reported, as compared to sole applications of INFs[17]. Although ploughing and other mechanical disturbances in intensive farming cause rapid OM breakdown and SOC loss[18], additional carbon input into the soil through manure addition and rational fertilization increases carbon content[13]. Wei et al.[19] in light sandy loam soil of China found that the inclusion of crop straw together with inorganic N, P and K fertilizers showed better results for improving soil fertility over sole use of inorganic fertilizers. Zhu et al.[20] studied the influence of soil C through wheat straw, farmyard manure (FYM), green manure, and rice straw on plant growth, yield, and various soil properties and found that the recycling of SOM under intensive cultivation is completely reliant on net OM input and biomass inclusion. However, most of the studies on residue management and organically managed systems could not provide clear views regarding the relations between the quality of OM inputs and biological responses towards it. The disintegration of soil aggregates due to ploughing, use of heavy machinery, and residue removal has been reported widely under conventional tillage (CT) practices[21]. On the contrary, improvement in SOC stabilization has also been observed by some scientists[22]. Under CT, the disintegration of macro-aggregates into micro-aggregates is a prominent phenomenon, while conservation tillage has been identified as a useful practice for increasing macro-aggregates as well as carbon sequestration in agricultural soils[23]. By and large, the ploughing depth (0–20 cm) is taken into consideration for evaluating the impact of tillage and straw retention on soil aggregation[24], while degradation in deeper layers of soil is becoming a major constraint towards soil quality together with crop yield[25].

    Hence, the present review would be useful in determining how tillage practices and inorganic and organic fertilization impact nutrient availability in the soil, microbial composition and SOC fractions besides stocks under different land uses.

    Agricultural production is greatly influenced by nutrient availability and thus nutrient management is required for sustaining higher yields of crop. The term 'nutrient availability' refers to the quantity of nutrients in chemical forms accessible to plant roots or compounds likely to be converted to such forms throughout the growing season in lieu of the total amount of nutrients in the soil. For optimum growth, different crops require specifically designed nutrient ratios. Plants need macronutrients [nitrogen (N), phosphorus (P), potassium (K) in higher concentrations], secondary nutrients [calcium (Ca), magnesium (Mg), sulphur (S) in moderate amounts as compared to macronutrients] and Micronutrients [Zn (zinc), Fe (iron), Cu (copper), B (boron), Mn (manganese), Mo (molybdenum) in smaller amounts] for sustainable growth and production[26]. Fertilizers assist the monitoring of soil nutrient levels by direct addition of required nutrients into the soil through different sources and tillage practices may alter the concentration of available plant nutrients through soil perturbations. Various studies on the influence of fertilization and tillage practices on available plant nutrients have been discussed below.

    Yue et al.[27] reported that long-term fertilization through manure/INF improved the macronutrient content of Ultisol soil in China. Two doses of NPK (2NPK) considerably improved soil properties over a single dose (NPK). Combined application (NPK + OM) resulted in higher hydrolysable N and available P over the sole OM application. The total K content was higher under the treatments NPK, 2NPK and NPK + OM than sole OM treatment, whereas available K was higher in treatments NPK + OM and 2NPK over the sole OM and NPK. Likewise, OM, INF, and OM + INF were evaluated for their potential to regulate the soil macronutrient dynamics. Organic manure significantly improved the soil N content, whereas INF showed comparable results to that of the control treatment. Besides, all the treatments improved available P and exchangeable K concentration[28].

    Hasnain et al.[29] performed comparative studies of different ratios of INF + compost and different application times for the chemical N fertilizer on silty loamy soils of China. The available nitrogen and phosphorous content were greater in conjoint OM + INF application over the bare INF and control application irrespective of N application time. Soil quality substantially improved with increasing ratio of compost and 70:30 (INF to compost ratio) was found to be most suitable to maintain soil fertility and nutrient status. Another study by Liu et al.[30] reported the superior effects of NPK + pig manure and NPK + straw to improve soil available P and K over the control and sole NPK treatments. However, total N concentration did not exhibit any significant variation under any treatment.

    Shang et al.[31] accounted the positive impact of vermicompost and mushroom residue application on grassland soil fertility in China. The addition of organic manures improved available P and K content to a considerable extent. Under moisture-deficit winter wheat-fallow rotation, another study quantified the influence of residue management approaches and fertilizer rate on nutrient accrual. Residue burning resulted in no decline in soil macronutrient content, whereas the perpetual addition of FYM for 84 years significantly improved total N and extractable K and P concentration. Thus, residue incorporation along with FYM application may prove beneficial in reducing the temporal macronutrient decline[32].

    Ge et al.[33] examined the effects of NPK and NPK along with manure (NPKM) addition on the macronutrient status of Hapli-Udic Cambisol soil. The NPKM application resulted in the highest increase in total N, available-P and K concentration as compared to NPK and control. Likewise, mineral fertilization reduction and partial substitution with organic amendments have posed a significant influence on soil macronutrient status. Soil available P and K decreased after INF reduction[34]. Chen et al.[35] evinced that integrated application of manure and mineral fertilizers to red clay soil (typical Ultisols) improved hydrolyzed nitrogen and available P due to an increase in the decomposition of organic matter (OM) and N bio-fixation than sole mineral fertilizers and control.

    A long-term experiment was carried out out by Shiwakoti et al.[36] to ascertain the influence of N fertilization and tillage on macronutrient dynamics in soil. Nitrogen fertilization produced higher crop biomass which might have improved total N and P concentration in soil. Moreover, the reduced interaction between soil colloids and residue or greater cation exchange sites due to tillage practices could have augmented K concentration in 0−10 cm soil depth. Likewise, among tillage systems combined organic (poultry manure) and inorganic (lime and fertilizers) fertilization, no-tillage, and reduced tillage with organic fertilization resulted in higher availability of P owing to minimal disturbance of soil which decreases contact surface between phosphate ions and adsorption sites. Greater losses of K in runoff water under NT resulted in lower K availability under NT than CT[37].

    The influence of tillage systems on soil nutrient dynamics showed that minimal soil disturbances under zero tillage prohibited redistribution of soil nutrients and resulted in the highest available N, P, and K in the surface soil[38]. The influence of tillage timing on soil macronutrient status has also been assessed under tillage treatments that are fall tillage (FT), spring tillage (ST), no tillage (NT), and disk/chisel tillage (DT/CT) on mixed mesic Typic Haploxerolls soil. All the tillage systems differed in the quantity of residues generated. Thus, variation in the decomposition of crop residue and mineralization of SOM resulted in variable rates of nutrient release. The FT and ST had the highest N content over DT/CT and NT systems at corresponding depth. The N content also decreased with soil depth irrespective of tillage treatment. The available P and extractable K were highest under NT at the top 10 cm soil depth and increased over time[39]. Residue management in combination with tillage treatments (ST and CT) has been reported to affect the soil macronutrient status in Bangladesh. Tillage treatments enhanced the total N content to a considerable extent. Moreover, 3 years of residue retention led to a higher concentration of total N, available P and K in the soil.

    The combinations of N, P, and K in different ratios together with two rates of organic fertilizer (OF) applied on the aquic Inceptisol having sandy loam texture influenced the micronutrient status of the soil[40]. Soil Zn content decreased with time when no fertilizer was applied as compared to organic fertilizer (OF) application. The mineral fertilizer treatments led to a substantial increase in DTPA-extractable micronutrients in the soil. The higher micronutrient concentration due to higher OM highlights the importance of maintaining OM for soil fertility and higher crop production. Further studies revealed that long-term application of sole N fertilizers led to a significant decline in total Zn and Cu, whereas Mn and Fe status improved through atmospheric deposition. Phosphorus and OF addition along with straw incorporation markedly increased total Zn, Cu, Fe, and Mn. The DTPA-extractable Mn, Zn, Fe, and Cu were also higher in OF treatment, thus demonstrating the beneficial effects of constant OM application for maintaining the nutrient status of soil[41].

    López-Fando & Pardo[42] quantified the impact of various tillage practices including NT, CT, minimum tillage (MT), and zone-tillage (ZT) on soil micronutrient stocks. Tillage systems did exhibit a significant influence on plant available Fe stocks in the topsoil; however, diminished with depth under ZT, NT and MT. Manganese was higher in NT and ZT at all depths and increased with soil depth. Zinc was highest under NT and other results did not vary significantly as in the case of Cu. The SOC levels were also found to be responsible to affect micronutrients due to tillage practices. Likewise, in Calciortidic Haploxeralf soil the distribution of soil micronutrients (Zn, Mn, Fe, Cu) was ascertained under different tillage practices (CT, MT, and NT). The micronutrient status was highest under NT in the upper layers due to the higher SOC level[43].

    Sharma & Dhaliwal[44] determined that the combined application of nitrogen and rice residues facilitated the transformation of micronutrients (Zn, Mn, Fe, Cu). Among different fractions, the predominant fractions were crystalline Fe bound in Zn, Mn, and Cu and amorphous Fe oxide in Fe with 120 kg N ha˗1 and 7.5-ton rice residue incorporation. The higher content of occluded fractions adduced the increment in cationic micronutrient availability in soil with residue incorporation together with N fertilization due to increased biomass. Rice straw compost along with sewage sludge (SS) and INF also affected the micronutrient availability under the RW cropping system. Nitrogen fertilization through inorganic fertilizers and rice straw compost and sewage sludge (50% + 50%) improved soil micronutrient status due to an increase in SOM over sole NPK fertilizers[45]. Earlier, Dhaliwal et al.[46] in a long-term experiment determined that different combinations of NPK along with biogas slurry as an organic source modified the extractable micronutrient status of the soil.

    A comparative study was carried out by Dhaliwal et al.[47] to ascertain the long-term impact of agro-forestry and rice–wheat systems on the distribution of soil micronutrients. The DTPA-extractable and total Cu, Zn, Fe, and Mn were greater in the RW system due to the reduced conditions because of rice cultivation. Under the RW system Zn removal was higher which was balanced by continuous Zn application. The higher availability of Fe under the RW system was due to reduced conditions. Contrarily, Mn was greater under the agro-forestry system owing to nutrient recycling from leaf litter.

    The long-term impact of integrated application of FYM, GM, WCS (wheat-cut straw) and INF on the soil micronutrients (Zn, Mn, Cu, and Fe) have been studied by Dhaliwal et al.[48]. The FYM application substantially improved DTPA-extractable Zn status followed by GM and WCS, whereas Cu content was maximum in the plots with OM application. The highest Fe concentration was recorded in treatment in which 50% recommended N supplied through FYM. This could be ascribed to the release of micronutrients from OM at low soil pH.

    Shiwakoti et al.[49] studied the dual effects of tillage methods (MP, DP, SW) and variable rates of N (0, 45, 90, 135 and 180 kg ha−1) on the distribution of micronutrients under a moisture-deficit winter wheat-fallow system. The soil Mn content was highest under the DP regime. Inorganic N application reduced Cu content in the soil. Comparative studies with adjacent undisturbed grass pasture indicated the loss of Zn and Cu to a significant extent. Thus, DP along with nitrogen added through inorganic fertilizers could improve micronutrient concentration in the soil. Moreover, the results implied that long-term cultivation with nitrogen fertilization and tillage results in the decline of essential plant nutrients in the soil. Thus, organic amendments along with INF may prove an effective approach to increase soil micronutrient content. In another study conducted by Lozano-García & Parras-Alcántara[50] tillage practices such as NT under apple orchard, CT with the wheat-soybean system and puddling (PD) in the rice-rice cropping system were found to affect nutrient status. Under CT, Cu content was lowest and Zn content was highest. On the contrary, puddling caused an increase in Fe and Mn concentration owing to the dispersion of soil aggregates which reduced the percolation of water and created an anaerobic environment thereby enhancing the availability of Fe and Mn.

    Tillage practices along with gypsum fertilization have been known to affect secondary nutrient concentrations in soil. In a long-term experiment, FYM application showed maximum response to increased S concentration due to the maximum addition of OM through FYM over other treatments as S is an essential component of OM and FYM[32]. Higher Mg content was recorded in FYM and pea vine treatments because the application of organic matter through organic manure or pea vines outright led to Mg accrual. The lower Mg concentration in topsoil than the lower layers was due to the competition between Mg and K for adsorbing sites and thus displacement of Mg by K. Han et al.[28] while ascertaining the impact of organic manures and mineral fertilizers (NPK) on soil chemical attributes determined that INF application reduced exchangeable calcium, whereas no significant changes were exhibited in the magnesium concentrations. The OM application significantly increased both the calcium and magnesium concentrations in the soil.

    While ascertaining the effect of different tillage treatments such as CT, NT, and MT on exchangeable and water-soluble cations, Lozano-García & Parras-Alcántara[50] recorded that NT had greater content of exchangeable Ca2+ and Mg2+ than MT and CT. The exchangeable Ca2+ decreased with depth, however, opposite results were observed for Mg2+ which might be due to the higher uptake of Mg2+ by the crop. On another note, there might be the existence of Mg2+-deficient minerals on the surface horizon. Alam et al.[51] studied the temporal effect of tillage systems on S distribution in the soil and observed that available S was 19%, 31%, and 34% higher in zero tillage than in minimum tillage, conventional tillage, and deep tillage, respectively.

    Kumar et al.[38] appraised the impact of tillage systems on surface soil nutrient dynamics under the following conditions: conventional tillage, zero till seeding with bullock drawn, conventional tillage with bullock drawn seeding, utera cropping and conservation tillage seeding with country plough and observed that tillage had a significant impact on the available S content. Compared with conventional tillage, zero and minimum tillage had higher S content as there was none or limited tillage operations which led to the accumulation of root stubble in the soil that decomposed over time and increased S concentration.

    Soil is considered a hotspot for microbial biodiversity which plays an important role in building a complex link between plants and soil. The microbial components exhibit dynamic nature and, therefore, are characterized as good indicators of soil quality[52]. These components include MBC, MBN, PMN and microbial respiration which not only assist in biological transformations like OM conversion, and biological nitrogen fixation but also increase nutrient availability for crop uptake. Management strategies such as fertilizer inputs and tillage practices may exert beneficial effects on soil biota as discussed below.

    Soil is an abode to a considerable portion of global biodiversity. This biodiversity not only plays a pivotal role in regulating soil functions but also provides a fertile ground for advancing global sustainability, especially agricultural ventures. Thus, the maintenance of soil biodiversity is of paramount importance for sustaining ecosystem services. Soil biodiversity is the diverse community of living creatures in the soil that interact not only with one another but also with plants and small animals to regulate various biological activities[53]. Additionally, it increases the fertility of soil by converting organic litter to SOM thereby enhancing SOC content. Thus, the SOM measures the number and activity of soil biota. Furthermore, the quality and amount of SOC, as well as plant diversity have a considerable impact on the soil microbial community structure[54].

    Dangi et al.[55] ascertained the impact of integrated nutrient management and biochar on soil microbial characteristics and observed that soil amended with biochar or the addition of organic manures influenced microbial community composition and biomass and crop yield. After two years, the higher rates of biochar significantly enhanced the levels of gram-positive and gram-negative bacterial phospholipid fatty acid (PLFA), total arbuscular mycorrhizal fungal (AMF) than lower rates, unfertilized and non-amended soil. Luan et al.[56] conducted a comparison study in a greenhouse to assess the effects of various rates of N fertilizer and kinds (inorganic and organic) on enzyme activities and soil microbial characteristics. Microbial growth (greater total PLFAs and microbial biomass carbon) and activity were promoted by manure substitution of mineral fertilizer, particularly at a higher replacement rate. On account of lower response in bacterial over fungal growth, manure addition led to a greater fungi/bacteria ratio. Furthermore, manure application significantly enhanced microbial communities, bacterial stress indicators and functional diversity. Lazcano et al.[57] determined the influence of different fertilization strategies on microbial community structure and function, soil biochemical properties and crop yield three months after addition of fertilizer. The integrated fertilizer regimes augmented microbial growth with improved enzyme activity as compared to sole inorganic amendments. Bacterial growth showed variable response with variation in fertilizer regime used whereas fungal growth varied with the amount of fertilizer added. Compared to mineral fertilizers, manure application led to a rapid increase in PLFA biomarkers for gram-negative bacteria. The organic amendments exhibited significant effects even at small concentration of the total quantity of nutrients applied through them; thus, confirming the viability of integrated fertilizer strategies in the short term.

    Kamaa et al.[58] assessed the long-term effect of crop manure and INF on the composition of microbial communities. The organic treatments comprised of maize (Zea mays) stover (MS) at 10 t ha−1 and FYM @ 10 t ha−1, INF treatments (120 kg N, 52.8 kg P-N2P2), integrated treatments (N2P2 + MS, N2P2 + FYM), fallow plot and control. The treatment N2P2 exhibited unfavourable effects on bacterial community structure and diversity that were more closely connected to the bacterial structure in control soils than integrated treatments or sole INF. In N2P2, fungal diversity varied differently than bacterial diversity but fungal diversity was similar in the N2P2 + FYM and N2P2 + MS-treated plots. Thus, the total diversity of fungal and bacterial communities was linked to agroecosystem management approaches which could explain some of the yield variations observed between the treatments. Furthermore, a long-term experiment was performed by Liu et al.[59] to study the efficiency of pig manure and compost as a source for N fertilization and found unique prokaryotic communities with variable abundance of Proteobacteria under compost and pig manure treatments.

    Recently, Li et al.[60] assessed the influence of different tillage practices (no-tillage, shallow tillage, deep tillage, no-tillage with straw retention, shallow tillage with straw retention and deep tillage with straw retention) on microbial communities and observed that tillage practices improved the bacterial Shannon index to a greater extent over the no-tillage plots in which the least value was recorded. Another research study by He et al.[61] reported the effect of tillage practices on enzyme activities at various growth stages. Across all the growth stages, enzyme activities of cellobiohydrolase (CBH), β-xylosidase (BXYL), alkaline phosphatase (AP), β-glucosidase (BG), β-N-acetylglucosamines (NAG) were 17%−169%, 7%−97%, 0.12%−29%, 3%−66%, 23%−137% greater after NT/ST, NT, ST, ST/PT, and PT/NT treatments as compared to plow tillage. The NT/ST treatment resulted in highest soil enzyme activities and yield, and thus was an effective and sustainable method to enhance soil quality and crop production.

    Microbes play a crucial role in controlling different soil functions and soil ecology and microbial community show significant variation across as well as within the landscape. On average, the total biomass of microbes exceeds 500 mg C kg soil−1[62]. Microbial biomass carbon is an active constituent of SOM which constitutes a fundamental soil quality parameter because SOM serves as a source of energy for microbial processes and is a measure of potential microbial activity[48,63]. Soil systems that have higher amounts of OM indicate higher levels of MBC. Microbial biomass carbon is influenced by many parameters like OM content in the soil, land use, and management strategies[64]. The MBC and soil aggregate stability are strongly related because MBC integrates soil physical and chemical properties responds to anthropogenic activities.

    Microbial biomass is regarded as a determinative criterion to assess the functional state of soil. Soils having high functional diversity of microbes which, by and large, occurs under organic agricultural practices, acquire disease and insect-suppressive characteristics that could assist in inducing resistance in plants[65]. Dou et al.[66] determined that soil microbial biomass C (SMBC) was 5% to 8% under wheat-based cropping systems and zero tillage significantly enhanced SMBC in the 0−30 cm depth, particularly in the upper 0 to 5 cm. According to Liang et al.[67], SMBC and soil microbial biomass N (SMBN) in the 0−10 cm surface layer were greater in the fertilized plots in comparison to the unfertilized plots on all sampling dates whereas microbial biomass C and N were highest at the grain filling stage. Mandal et al.[68] demonstrated that MBC also varied significantly with soil depth. Surface soil possessed a maximum MBC value than lower soil layers due to addition of crop residues and root biomass on the surface soil. The MBC content was highest with combined application of INF along with farmyard manure and GM, whereas untreated plots showed minimum MBC values. The incorporation of CR slows down the rate of mineralization processes; therefore, microbes require more time to decompose the residues and utilize the nutrients released[69]. On the other hand, incorporation of GR having a narrow C:N ratio enhances microbial activity and consequently accelerates mineralization in the soil. Malviya[70] also recorded that the SMBC contents were significantly greater under RT than CT, regardless of soil depth which was also assigned to residue incorporation which increases microbial biomass on account of higher carbon substrate in RT.

    Naresh et al.[71] studied the vertical distribution of MBC under no-tillage (NT), shallow (reduced) tillage and normal cultivated fields. A shallow tillage system significantly altered the tillage induced distribution of MBC. In a field experiment, Nakhro & Dkhar[72] examined the microbial populations and MBC in paddy fields under organic and inorganic farming approaches. The organic source used was a combination of rock phosphate, FYM and neem cake, whereas a mixture of urea, muriate of potash and single super phosphate was used as an inorganic source. The organically treated plots exhibited the highest MBC compared to inorganically treated plots and control. Organic carbon exhibited a direct and significant correlation with bacterial and fungal populations. The addition of organic fertilizers enhanced the content of SOC and consequently resulted in higher microbial count and MBC. Ramdas et al.[73] investigated the influence of inorganic and organic sources of nutrients (as minerals or INF) applied over a five-year period on SOC, MBC and other variables. It was observed that the addition of FYM and conjoint application of paddy straw (dry) and water hyacinth (PsWh) (fresh) significantly increased the SOC content than vermicompost, Chromolaena adenophorum (fresh) and Glyricidia aculeate (fresh), and Sesbania rostrata (fresh).

    Xu et al.[74] evaluated the influence of long-term fertilization strategies on the SOC content, soil MBN, soil MBC, and soil microbial quotient (SMQ) in a continuous rice system and observed that MBC at the main growth stages of early and late rice under 30% organic matter and 70% mineral fertilizer and 60% organic matter and 40% mineral fertilizer treatments was greater as compared to mineral fertilizer alone (MF), rice straw residues and mineral fertilizer (RF), and no fertilizer (CK) treatments. However, SMBC levels at late growth stages were greater in comparison to early growth stages. A recent study by Xiao et al.[75] demonstrated that increasing tillage frequency (no-tillage, semi-annual tillage, and tillage after every four months, two months, and one month) decreased soil MBC. Microbial biomass carbon content was significantly greater in no-till treatment (597 g kg−1) than in tillage every four months (421 g kg−1), two months (342 g kg−1) and one month (222 g kg−1). The decrease in the content of MBC in association with tillage practices is due to soil perturbations which enhanced soil temperature, diminished soil moisture content, and resulted in the destruction of microbial habitat and fungal hyphae. Therefore, the MBC content eventually affected the N cycle.

    Li et al.[76] reported that in comparison to CT, NT and RT resulted in increased MBC content and NT significantly increased MBC by 33.1% over CT. Furthermore, MBC concentration was 34.1% greater in NT than RT. The increase in MBC concentration was correlated with the results of increase in SOC concentration. Site-specific factors including soil depth and mean annual temperature significantly affected the response ratio of MBC under NT as compared to the duration of NT.

    Microbial biomass nitrogen (MBN) is a prominent indicator of soil fertility as it quantifies the biological status of soil. Soil MBN is strongly associated with organic matter of the soil. The nitrogen in MBN has a rapid turnover rate thereby reflecting the changes in management strategies way before the transformations in total N are discernable[77].

    In an experiment on continuous silage maize cultivation with crop rotation, Cerny et al.[78] observed that organic fertilizers exerted an affirmative influence on the soil MBN. During the application of organic manure MBN decreased, but there was higher MBN content as compared to control. However, addition of mineral nitrogenous fertilizers exerted an adverse effect on MBN content in experiments with maize. El-Sharkawi[79] recorded that organic matter-treated pots resulted in maximum MBN content than urea-treated pots. The sludge application enhanced total MBN and, therefore, could implicitly benefit crop production particularly in poor soils[18]. Sugihara et al.[80] observed that during the grain-filling stage in maize, residue and/or fertilizer addition exerted a pronounced influence on soil microbial dynamics; however, a clear effect of residue and ⁄or fertilizer addition was not observed. Microbial biomass nitrogen reduced dramatically from 63–71 to 18–33 kg N ha˗1 and C:N ratio at the same time increased more than ten-fold in all plots.

    Malik et al.[81] apprised that the organic amendments significantly enhanced MBN concentrations up to 50% more than the unamended soil. Wang et al.[82] evaluated the influence of organic materials on MBN content in an incubation and pot experiment with acidic and calcareous soils. The results revealed that MBN content which was affected by the different forms of organic amendments, increased by 23.37%−150.08% and 35.02%−160.02% in acidic and calcareous soils, respectively. The MBN content of both soils decreased with the increase in the C/N ratio of the organic materials, though a higher C/N ratio was effective for sustaining a greater MBN content for a very long time.

    Dhaliwal & Bijay-Singh[52] observed higher MBN levels in NT soils (116 kg ha−1) than in cultivated soils (80 kg ha−1). Kumar et al.[83] ascertained that in surface layer, MBN content was 11.8 mg kg−1 in CT which increased to 14.1 and 14.4 mg kg−1 in ZT and RT without residue retention and 20.2, 19.1 and 18.2 mg kg−1 in ZT, RT and CT with residue incorporation, respectively (Table 1). In the subsurface layer, the increased tendency on account of tillage and crop residue retention was identical to those of 0−15 cm layer but the magnitude was comparatively meagre (Table 1). In comparison to control, the persistent retention of crop residues led to significant accrual of MBN in the surface layer.

    Table 1.  Effect of different treatments on contents of various fractions of soil organic carbon[38].
    TreatmentsPMN (mg kg−1)MBC (mg kg−1)MBN (mg kg−1)DOC (mg kg−1)
    Depths (cm)
    0−1515−300−1515−300−1515−300−1515−30
    Tillage practices
    ZTR12.411.2562.5471.120.218.9198.6183.6
    ZTWR8.57.6350.4302.114.112.6167.1159.2
    RTR10.69.9490.2399.319.117.2186.4171.6
    RTWR7.66.6318.1299.814.413.7159.5148.7
    CTR9.38.5402.9354.418.216.6175.9168.9
    CT6.75.6307.9289.511.89.7142.5134.6
    Nitrogen management
    Control3.62.8218.3202.910.810.4103.792.3
    80 kg N ha−15.34.4241.1199.414.912.2128.3116.9
    120 kg N ha−18.97.6282.7220.916.516.1136.8123.6
    160 kg N ha−19.88.4343.9262.919.418.1164.8148.9
    200 kg N ha−110.49.7346.3269.622.721.7155.7136.4
    ZTR = Zero tillage with residue retention, ZTWR = Zero tillage without residue retention; RTR = Reduced tillage with residue retention, RTWR = Reduced tillage without residue retention, CTR = Conventional tillage with residue incorporation; CT = Conventional tillage without residue incorporation.
     | Show Table
    DownLoad: CSV

    Xiao et al.[75] determined that the MBN content decreased with tillage treatment having highest value in no tillage treatment, however, the difference among the treatments was negligible. Soil perturbations decreased the aggregate size and thus lower the soil aeration and exposure of fresh organic matter which restricted the growth of microorganisms. The results also concluded that MBN content is highly sensitive to tillage. Ginakes et al.[84] assessed the impact of zone tillage intensity on MBN in a corn-kura clover cropping sequence. Microbial biomass nitrogen was influenced by time and type of tillage treatment. Temporal studies revealed that MBN was higher after tillage treatment than the values possessed before tillage. Under different tillage treatments, higher values were recorded in ST (shank-till) and DT (double-till) over NT and RZT (zone-till) treatments.

    Another biological parameter, PMN, is a crucial parameter of soil fertility due to its association with soil N supply for crop growth. Also, PMN indicates the status of soil microbial community associated with PMN, whether it is improving or degrading. Forest soils are characterized by greater levels of PMN than CT receiving conventional chemical fertilizers which could be assignable to improved microbial activity in the former soils than the latter[48,77]. Aulakh et al.[85] assessed the effect of various combinations of fertilizer N, P, FYM and wheat residue (WR) applied to soybean and soybean residues added to wheat under CT and CA. The added fertilizers of N and P, FYM, and crop residue enhanced the mean weight diameter and water-stable aggregates thus favoured the development of macro-aggregates. The treatment INF + FYM + crop residue performed better among all the treatments. The net flux of mineral nitrogen from the mineralizable fraction is used to measure potentially mineralizable N which indicates the balance between mineralization and immobilization by soil microbes[77]. Nitrogen mineralization is widely used to assess the ability of SOM to supply inorganic nitrogen in the form of nitrate which is the most common form of plant-available nitrogen. Kumar et al.[83] observed an increase in PMN which was higher in surface soil than sub-surface soil thereby implying that high OC accumulation on account of crop residue retention was the most probable cause.

    Verma & Goyal[86] assessed the effect of INM and organic manuring on PMN and observed that PMN was substantially affected by different organic amendments. Potentially mineralizable nitrogen varied between 19.6−41.5 mg kg−1 soil with greater quantity (2.5%) in vermicompost applied plots than FYM treated plots. The INF treatments resulted in lower PMN content which could be due to nutrient immobilization by microbes. Mahal et al.[87] reported that no-till resulted in higher PMN content than conventional tillage treatments. This trend was due to the maintenance of SOM due to the residue cover and reduction of soil erosion under no-tillage system[88]. On the contrary, tillage practices led to the loss of SOC owing to loosened surface soil and higher mineralization of SOM.

    Soil respiration is referred as the sum of CO2 evolution from intact soils because of the respiration by soil organisms, mycorrhizae and roots[89]. Various researchers have proposed soil respiration as a potential indicator of soil microbial activity[52,77]. Gilani & Bahmanyar[90] observed that addition of organic amendments enhanced soil respiration more than the control and synthetic fertilizer treatments. Moreover, among organic amendment treatments, highest soil respiration was observed in sewage-sludge treated soils. Under controlled conditions in saline-sodic soil, Celis et al.[91] reported that sewage sludge resulted in a higher soil respiration rate than mined gypsum and synthetic gypsum. The application of gypsum because of minimal organic matter intake had little effect on soil respiration. The addition of organic matter especially during early spring led to higher microbial biomass and soil respiration albeit diminished levels of nitrate-N. Moreover, SOM hinders the leaching of nitrate ions thereby resulting in a better soil chemical environment[71].

    Faust et al.[92] observed that microbial respiration was associated with volumetric water content. The respiration declined with less availability of water, thus the lesser the tillage intensity, the more the volumetric water content which consequently resulted in higher microbial respiration. Another study by Bongiorno et al.[93] reflected the influence of soil management intensity on soil respiration. Reduced tillage practices resulted in 51% higher basal respiration than CT. Furthermore, this investigation suggested that microbial catabolic profile could be used as a useful biological soil quality indicator. Recently, Kalkhajeh et al.[94] ascertained the impact of simultaneous addition of N fertilizer and straw-decomposing microbial inoculant (SDMI) on soil respiration. The SDMI application boosted the soil microbial respiration which accelerated the decomposition of straw due to N fertilization. The C/N ratio did not affect the microbial respiration at elongation and heading stages, whereas N fertilization enhanced the microbial respiration to a greater extent than the unfertilized control. Additionally, the interaction between sampling time and basal N application significantly affected microbial respiration.

    Gong et al.[95] apprised the effect of conventional rotary tillage and deep ploughing on soil respiration in winter wheat and observed that deep ploughing resulted in a higher soil respiration rate than conventional rotary tillage. Soil moisture content and temperature are the dominating agents influencing soil respiration which is restricted by the soil porosity.

    Soil organic carbon plays a vital role in regulating various soil functions and ecosystem services. It is influenced by numerous factors like tillage practices and fertilization. Moreover, modified management practices may prove beneficial to avoid SOC loss by increasing its content. An exogenous supply of fertilizers may alter the chemical conditions of soil and thus result in transformation of SOC. Tillage practices lead to frequent soil disturbances which reduce the size of soil aggregates and accelerate the oxidation of SOC thereby reducing its content. The literature on the influence of fertilization and tillage practices on the transformation of SOC is discussed below.

    Soil organic carbon is a major part of the global carbon cycle which is associated not only with the soil but also takes part in the C cycling through vegetation, oceans and the atmosphere (Figs 1 & 2). Soil acts as a sink of approximately 1,500 Pg of C up to 1 m depth, which is greater than its storage in the atmosphere (approximately 800 Pg C) and terrestrial vegetation (500 Pg C) combined[96]. This dynamic carbon reservoir is continuously cycling in diverse molecular forms between the different carbon pools[97]. Fertilization (both organic and mineral) is one of the crucial factors that impart a notable influence on OC accretion in the soil. Many researchers have studied the soil C dynamics under different fertilizer treatments. Though inorganic fertilizers possess the advantage of easy handling, application and storage, they do not contribute to soil organic carbon. On the contrary, regardless of management method, plant residues are known to increase organic carbon content.

    Figure 1.  Impact of different fertilization regimes on abundance of the microbial biomarker groups . Error bars represent the standard error of the means and different letters indicate significant differences at p < 0.05 among treatments. Source: Li et al.[60].
    Figure 2.  Soil organic carbon (SOC) dynamics in the global carbon cycle.

    Katkar et al.[98] reported a higher soil quality index under conjunctive nutrient management strategies comprising addition of compost and green leaves along with mineral nutrients. Mazumdar et al.[99] investigated the impact of crop residue (CR), FYM, and leguminous green manure (GM) on SOC in continuous rice-wheat cropping sequence over a 25-year period. At the surface layer, the maximum SOC content was recorded under NPK + FYM than NPK + CR and NPK + GM treatments. SOC was significantly lower under sole application of INFs (NPK) than the mixed application of organic and inorganic treatments. A higher range of SOC content was recorded at a depth of 0.6 m in the rice-wheat system (1.8–6.2 g kg−1) in farmyard manure (FYM)-treated plots than 1.7–5.3 g kg−1 under NPK, and 0.9–3.0 g kg−1 in case of unfertilized plots[100]. In a research study Dutta et al.[101] reported that rice residue had a higher decomposition rate (k¼ 0.121 and 0.076 day−1) followed by wheat (0.073 and 0.042 day−1) and maize residues (0.041 day−1) when their respective residues placed on soil surface than incorporated in the soils. Naresh et al.[102] found FYM and dhaincha as GM/ sulphitation press mud (SPM) treatments are potent enough to enhance the SOC. Maximum SOC content was noted in 0–5 cm depth that reduced gradually along the profile. In surface soil, the total organic content (TOC) under different treatments varied with source used to supply a recommended dose of nitrogen (RDN) along with conventional fertilizer (CF).

    Cai et al.[103] ascertained that long-term manure application significantly improved SOC content in different size fractions which followed the sequence: 2,000–250 μm > 250–53 μm > 53 μm fraction. Naresh et al.[22] determined that mean SOC content increased from 0.54% in control to 0.65% in RDF and 0.82% in RDF + FYM treatment and improved enzyme activity; thus, ultimately influenced nutrient dynamics under field conditions. The treatments RDF + FYM and NPK resulted in 0.28 Mg C ha−1 yr−1 and 0.13 Mg C ha−1 yr−1, respectively and thus higher sequestration than control. Zhao et al.[104] determined that in the surface layer, significant increase in SOC content in each soil aggregate was noticed under straw incorporation treatments over no straw incorporated treatments (Fig. 3). Moreover, the aggregate associated OC was significantly higher in the surface layer than the sub-surface layer. The highest increment in aggregate-associated OC was noted in both maize and wheat straw (MR-WR) added plots followed by MR and least in WR. Besides, all of the three straw-incorporated treatments exhibited notable increase in SOC stock in each aggregate fraction in the surface layer of the soil. In the subsurface (20−40 cm) layer under MR-WR, significant rise in SOC stock of small macro-aggregates was observed, whereas there was a reduction in SOC stock in the silt + clay fraction than other treatments. The straw-incorporated treatments increased the quantity of mineral-associated organic matter (mSOM) and intra-aggregate particulate organic matter, (iPOM) within small macro-aggregates and micro-aggregates especially in the topmost layer of the soil.

    Figure 3.  Distribution of OC in coarse iPOM (intra-aggregate particulate organic matter) fine iPOM, mSOM (mineral-associated matter), and free LF (free light fraction) of small macro-aggregates and micro-aggregates in the 0–20 cm and 20–40 cm soil layers under MR-WR (return of both maize and wheat straw), MR (maize straw return), WR (wheat straw return). Different lowercase and uppercase letters indicate significant differences at p < 0.05 among treatments and depths respectively[104].

    Srinivasarao et al.[105] reported that SOC content was reduced with the addition of INFs (100% RDN) alone as compared to the conjunctive application of inorganic and organic or sole FYM treatments. Earlier, Srinivasarao et al.[106] reported that FYM treated plots exhibited greater per cent increase in SOC stock than mineral fertilized plots and control. Tong et al.[107] ascertained that the application of NP and NPK significantly improved SOC stocks. On the contrary, fertilized soils could also exhibit decrease in carbon content than control. Naresh et al.[108] determined that higher biomass C input significantly resulted in greater particulate organic carbon (POC) content. Zhang et al.[109] ascertained that long-term addition of NPK and animal manures significantly improved SOC stocks by a magnitude of 32%−87% whereas NPK and wheat/ and or maize straw incorporation enhanced the C stocks by 26%−38% than control. Kamp et al.[110] determined that continuous cultivation without fertilization decreased SOC content by 14% than uncultivated soil. However, super optimum dose of NPK, balanced NPK fertilization and integration of NPK with FYM not only improved SOC content but also SOC stocks over the first year. In conventionally tilled cotton-growing soils of southern USA, Franzluebbers et al.[111] estimated that carbon sequestration averaged 0.31 ± 0.19 Mg C ha−1 yr−1. Mandal et al.[112] reported maximum SOC stock in the surface layer of the soil (0–15 cm) which progressively diminished with depth in each land use system. A significant decrease in SOC stock along the profile depth was also observed by Dhaliwal et al.[47] in both croplands and agroforestry. In the topmost soil layer, highest SOC stock was recorded in rice–fallow system while the lowest was in the guava orchard[112].

    Nath et al.[113] determined that there was accrual of higher TOC in surface layers as compared to lower layers of soil under paddy cultivation. This accrual could be adduced to left-over crop residues and remnant root biomass which exhibited a decreasing trend with soil depth. Das et al.[114] determined that integrated use of fertilizers and organic sources resulted in greater TOC as compared to control or sole fertilizer application. Fang et al.[115] observed that the cumulative carbon mineralization differed with aggregate size in top soils of broad-leaved forests (BF) and coniferous forests (CF). However, in deep soil it was greater in macro-aggregates as compared to micro-aggregates in BF but not in CF (Fig. 4). By and large, the percent SOC mineralized was greater in macro-aggregates as compared to micro-aggregates. Dhaliwal et al.[100] ascertained that SOC accrual was considerably influenced by residue levels and tillage in surface soil (0−20 cm); albeit no variation was observed at lower depth (20−40 cm). The SOC content was greater in zero-tilled and permanently raised beds incorporated with residues as compared to puddled transplanted rice and conventionally planted wheat. Pandey et al.[116] reported that no-tillage prior to sowing of rice and wheat increased soil organic carbon by 0.6 Mg C ha–1 yr–1. The carbon sequestration rate on account of no-tillage or reduced tillage ranged between 0−2,114 kg ha–1 yr–1 in the predominant cropping system of South Asia, Xue et al.[117] observed that the long-term conventional tillage, by and large, exhibited a significant decline in SOC owing to degradation of soil structure, exposing protected soil organic matter (intra-soil aggregates) to microbes. Therefore, the adoption of no-tillage could hamper the loss of SOC thereby resulting in a greater or equivalent quantity of carbon in comparison to CT (Fig. 5).

    Figure 4.  (a) Soil aggregate fractions of two depths in two restored plantations of subtropical China, (b) organic carbon and (c) its mineralization from various soil aggregates within 71 d at various soil depths in two restored plantations of subtropical China. Error bars show the standard error of the mean. The different letters represent significant differences among the different soil aggregate fractions within a depth at p < 0.05[115].
    Figure 5.  The concentrations of (a) SOC, (b) total nitrogen (TN), and (c) soil C:N ratio for 0–50 cm profile under different tillage treatments in 2012 and 2013. NT = no-till with residue retention; RT = rotary tillage with residue incorporation; PT = plow tillage with residue incorporation; and PT0 = plow tillage with residue removed. The lowercase letters indicate statistical difference among treatments at p < 0.05[117].

    Singh et al.[118] determined that carbon stock in the 0-40 cm layer increased by 39, 35 and 19% in zero-tilled clay loam, loam, and sandy loam soils, respectively as compared to conventional tilled soils over a period of 15 years. Kuhn et al.[119] also apprised about the advantages of NT over CT vis-a-vis SOC stocks across soil depths. In the surface layer (0−20 cm) NT, by and large, resulted in higher SOC stocks as compared to CT; however, SOC stocks exhibited a declining trend with soil depth, in fact, became negative at depths lower than 20 cm. Sapkota et al.[120] observed that over a period of seven years, direct dry-seeded rice proceeded by wheat cultivation with residue retention enhanced SOC at 0-60 cm depth by a magnitude of 4.7 and 3.0 t C ha−1 in zero-tillage (ZTDSR-ZTW + R) and without tillage (PBDSR-PBW + R), respectively. On the contrary, the conventional tillage rice-wheat cropping system (CTR-CTW) decreased the SOC up to 0.9 t C ha−1 (Table 2).

    Table 2.  Influence of tillage and crop establishment methods on SOC stock and its temporal variation under rice–wheat system[120].
    Tillage and crop establishment methodsDepths (m)
    0–0.050.05–0.150.15–0.30.3–0.60–0.6
    Total SOC (t/ha)
    CTR-CTW3.5e7.1c8.77.026.2c
    CTR-ZTW3.9d7.6bc8.86.526.7c
    ZTDSR-CTW4.2d7.5bc9.26.327.3c
    ZTDSR-ZTW4.9c8.9ab8.26.228.2bc
    ZTDSR-ZTW+R6.1a9.0ab9.86.831.8a
    PBDSR-PBW+R5.5b9.3a9.36.030.1ab
    MSD0.41.72.01.42.49
    Treatment effect
    (p value)
    < 0.0010.040.1580.267< 0.001
    Initial SOC content3.6 ±
    0.15
    8.1 ±
    1.39
    8.78 ±
    1.07
    6.7 ±
    0.73
    27.1 ±
    1.21
    Change in SOC over seven years (t/ha)
    CTR-CTW−0.16−0.99−0.040.28−0.90
    CTR-ZTW0.28−0.500.01−0.20−0.41
    ZTDSR-CTW0.62−0.570.45−0.340.16
    ZTDSR-ZTW1.340.84−0.62−0.461.09
    ZTDSR-ZTW+R2.490.961.040.164.66
    PBDSR-PBW+R1.891.220.51−0.642.98
    CTR-CTW = Conventionally tilled puddled transplanted rice followed by conventionally tilled wheat, CTR-ZTW = Conventionally tilled puddled transplanted rice followed by zero-tilled wheat, ZTDSR-CTW = Zero-tilled direct dry-seeded rice followed by conventionally tilled wheat, ZTDSR-ZTW = Zero-tilled direct dry-seeded rice followed by zero-tilled wheat, ZTDSR-ZTW+R = Zero-tilled direct dry-seeded rice followed by zero-tilled wheat with residue retention, PBDSR-PBW+R = Direct dry-seeded rice followed by direct drilling of wheat both on permanent beds with residue retention, MSD, minimum significant difference. Significant different letters indicate significant differences at p < 0.05.
     | Show Table
    DownLoad: CSV

    Labile organic carbon (LC) is that fraction of SOC that is rapidly degraded by soil microbes, therefore, having the highest turnover rate. This fraction can turn over quickly on account of the change in land use and management strategies. From the crop production perspective, this fraction is crucial as it sustains the soil food cycle and, hence, considerably impacts nutrient cycling thereby altering soil quality and productivity. Short-term management could influence the labile fraction of carbon[121]. However, some site-specific problems and regional factors may influence their distribution in soil layers[102].

    Banger et al.[122] observed significant alteration in labile pools of C, for instance, particulate organic matter (POM), water-soluble C (WSC) and light fraction of C (LFC) because of the addition of fertilizers and/or FYM over a 16-year period. Particulate organic matter, LFC and WSC contributed 24%–35%, 12%–14% and 0.6%–0.8%, respectively, towards SOC. The increase in concentration of SOC including its pools like POC and the sequestration rate due to integrated nutrient management was also reported by Nayak et al.[123]. Gu et al.[124] observed that mulch-treated soils (straw and grass mulch) had significantly greater levels of LOC, POC, DOC and EOC as compared to no mulch-treated soils which could be adduced to the addition of straw, root and its sections into the soil. The content of labile C fractions across all treatments exhibited a decreasing trend with soil depth[23, 102, 125].

    In a long-term experiment, Anantha et al.[126] observed that the total organic carbon apportioned into labile carbon, non-labile, less labile, and very labile carbon constituted around 18.7%, 19.3%, 20.6% and 41.4% of the TOC, respectively (Table 3). Zhu et al.[20] determined that straw incorporation had a substantial impact on TOC and labile C fractions of the soil which were greater in straw incorporated treatments as compared to non-straw treatments across all the depths. Wang et al.[127] reported that the light fraction organic carbon (LFOC) and DOC were significantly greater in the straw-applied treatments than the control by a magnitude of 7%–129% for both the early and late season rice. The treatments NPK + FYM or NPK + GR + FYM resulted in greater content of very labile and labile C fractions whereas non-labile and less labile fractions were greater in control and NPK + CR treatment. There was 40.5% and 16.2% higher C build-up in sole FYM treated plots and 100% NPK + FYM, respectively over control. On the other hand, a net depletion of 1.2 and 1.8 Mg ha−1 in carbon stock was recorded under 50% NPK and control treatments, respectively. Out of the total C added through FYM, only 28.9% was stabilized as SOC, though an external supply of OM is a significant source of soil organic carbon[69]. Hence, to sustain the optimum SOC level at least an input of 2.3 Mg C ha−1 y−1 is required. A comparatively greater quantity of soil C in passive pools was observed in 100% NPK + FYM treatment. The increase in allocation of C into the passive pool was about 33%, 35%, 41% and 39% of TOC in control, suboptimal dose, optimal dose and super optimal dose of NPK which indicates that the concentration of passive pools increased with an increase in fertilization doses. Water-soluble carbon (WSC) was 5.48% greater in the upper soil layer as compared to lower layer of soil. In surface soil (0−15 cm), the values of light fraction carbon (LFC) were 81.3, 107.8, 155.2, 95.7, 128.8, 177.8 and 52.7 mg kg−1 in ZT without residue retention, ZT with 4 t ha−1 residue retention, ZT with 6 t ha−1 residue retention, FIRB without residue addition and FIRB with 4 and 6 t ha−1 residue addition and CT, respectively (Table 4). Tiwari et al.[128] determined that the decrease in POC was due to reduction in fine particulate organic matter in topsoil whereas decrement in dissolved organic carbon was observed largely in subsoil. Therefore, in surface soils fine POC and LFOC might be regarded as preliminary evidence of organic C alteration more precisely, while DOC could be considered as a useful indicator for subsoil. Reduction in allocations of fine POC, LFOC and DOC to SOC caused by tillage and straw management strategies indicated the decline in quality of SOC. A higher SOC concentration was recorded in the conjoint application of INF + FYM (0.82%) and sole application of INF (0.65%) than control (0.54%). Kumar et al.[83] reported that the CT without residue retention had significantly lower labile carbon fractions (27%–48%) than zero-tillage with 6-ton residue retention. Moreover, residue-retained fertilized treatments had significantly greater labile fractions of C than sole fertilized treatments[125]. Kumar et al.[83] reported highest change in DOC in zero-till with residue retention (28.2%) in comparison to conventional tillage practices. In ZT, absence of soil perturbations resulted in sustained supply of organic substrata for soil microbes which increases their activity. On the contrary, CT practices resulted in higher losses of C as CO2 due to frequent disturbances.

    Table 3.  Oxidisable organic carbon fractions in soils (g kg−1) at different layers[126].
    TreatmentDepths (cm)
    0−1515−3030−45Total
    Very Labile C
    Control3.6 ± 0.5c1.4 ± 0.3b1.3 ± 0.2a6.3 ± 0.4b
    50% NPK4.6 ± 0.3bc2.1 ± 0.7ab1.5 ± 0.1a8.1 ± 0.9a
    100% NPK4.4 ± 0.3bc2.3 ± 0.2a1.4 ± 0.5a8.0 ± 0.7a
    150% NPK5.0 ± 0.2ab2.6 ± 0.2a1.5 ± 0.1a9.0 ± 0.3a
    100% NPK + FYM4.8 ± 0.2ab2.0 ± 0.2ab1.3 ± 0.3a8.1 ± 0.2a
    FYM5.9 ± 1.3a2.2 ± 0.2a1.4 ± 0.3a9.5 ± 1.6a
    Fallow4.2 ± 0.7bc1.5 ± 0.5b0.7 ± 0.3b6.3 ± 0.8b
    Lbile C
    Control2.4 ± 0.3a1.0 ± 0.2a0.8 ± 0.4a4.2 ± 0.6a
    50% NPK1.7 ± 0.4ab0.9 ± 0.5a0.7 ± 0.2a3.3 ± 0.7a
    100% NPK1.8 ± 0.4ab0.8 ± 0.5a0.6 ± 0.3a3.2 ± 0.8a
    150% NPK1.2 ± 0.3b0.7 ± 0.2a0.9 ± 0.2a2.8 ± 0.4a
    100% NPK + FYM1.9 ± 0.3ab0.7 ± 0.2a0.7 ± 0.3a3.4 ± 0.2a
    FYM2.5 ± 0.9a0.7 ± 0.3a0.7 ± 0.2a3.9 ± 0.9a
    Fallow2.2 ± 1.0ab1.0 ± 0.3a1.0 ± 0.4a4.1 ± 1.1a
    Less labile C
    Control1.5 ± 0.3c0.6 ± 0.4c0.4 ± 0.0c2.6 ± 0.7d
    50% NPK1.8 ± 0.1c0.4 ± 0.1c0.5 ± 0.2c2.7 ± 0.1cd
    100% NPK2.5 ± 0.3ab0.8 ± 0.1bc1.1 ± 0.2ab4.4 ± 0.1b
    150% NPK2.6 ± 0.2a0.9 ± 0.1bc0.4 ± 0.2c3.9 ± 0.1b
    100% NPK + FYM2.7 ± 0.6a1.5 ± 0.2a1.4 ± 0.1a5.6 ± 0.7a
    FYM1.9 ± 0.7bc1.7 ± 0.2a1.0 ± 0.2b4.5 ± 0.7ab
    Fallow1.5 ± 0.3c1.3 ± 0.7ab0.9 ± 0.4b3.8 ± 1.2bc
    Non labile C
    Control1.2 ± 0.5b1.2 ± 0.3a0.2 ± 0.2b2.6 ± 0.5b
    50% NPK1.2 ± 0.9b1.7 ± 0.8a0.7 ± 0.4ab3.5 ± 1.8ab
    100% NPK1.3 ± 0.6b1.5 ± 0.6a0.5 ± 0.2ab3.3 ± 1.0ab
    150% NPK1.4 ± 0.3b1.5 ± 0.2a0.8 ± 0.1a3.7 ± 0.3ab
    100% NPK + FYM2.0 ± 0.8b1.3 ± 0.1a0.3 ± 0.3ab3.5 ± 0.7ab
    FYM3.7 ± 1.3a1.0 ± 0.2a0.5 ± 0.5ab5.1 ± 1.9a
    Fallow2.1 ± 0.2b1.4 ± 0.7a0.4 ± 0.2ab3.9 ± 0.9ab
    Values in the same column followed by different letters are significantly different at p < 0.001, ± indicates the standard deviation values of the means.
     | Show Table
    DownLoad: CSV
    Table 4.  Influence of tillage and nitrogen management on distribution of carbon fractions in soil[83].
    TreatmentsWSOC
    (g kg−1)
    SOC
    (g kg−1)
    OC
    (g kg−1)
    BC
    (g kg−1)
    POC
    (mg kg)
    PON
    (mg kg−1)
    LFOC
    (mg kg−1)
    LFON
    (mg kg−1)
    Depths (cm)
    0−1515−300−1515−300−1515−300−1515−300−1515−300−1515−300−1515−300−1515−30
    Tillage practices
    ZTR28.826.223.119.39.619.134.694.281342.8967.9119.5108.1194.7154.814.812.3
    ZTWR25.324.618.414.87.877.213.763.19981.1667.494.686.5120.5104.711.810.3
    RTR27.025.922.418.28.688.174.133.871230.2836.9109.797.8170.9144.913.711.6
    RTWR23.721.818.114.27.667.073.122.96869.4604.482.676.6107.197.39.78.6
    CTR26.124.421.817.48.497.963.823.481099.1779.498.489.3143.8115.912.810.9
    CT21.820.916.113.16.215.642.892.63617.5481.869.257.690.873.69.67.9
    Nitrogen management
    Control21.114.916.113.16.135.481.581.07709.7658.631.726.3123.9104.36.45.8
    80 kg N ha−128.321.217.814.76.466.162.461.75860.7785.668.456.2132.8116.17.66.9
    120 kg N ha−129.522.119.116.17.256.713.262.18952.2808.989.578.5150.6127.69.78.6
    160 kg N ha−130.223.120.818.27.757.283.822.661099.5823.896.883.4168.5145.710.29.8
    200 kg N ha−131.125.421.318.77.937.484.153.421153.1898.4103.997.3176.2152.911.710.6
    WSOC = Water soluble organic carbon, SOC = Total soil organic carbon, OC = Oxidizable organic carbon, BC =Black carbon, POC = particulate organic carbon, PON = particulate organic nitrogen, LFOC = labile fraction organic carbon, and LFON = labile fraction organic nitrogen. ZTR = Zero tillage with residue retention, ZTWR = Zero tillage without residue retention; RTR = Reduced tillage with residue retention, RTWR = Reduced tillage without residue retention, CTR = Conventional tillage with residue incorporation; CT = Conventional tillage without residue incorporation.
     | Show Table
    DownLoad: CSV

    The soil characteristics such as plant available nutrients, microbial diversity and soil organic carbon transformation are dwindling on account of intensive cultivation under conventional tillage practices, therefore, demand relevant management approaches for soil and crop sustainability. Long-term application of organic amendments significantly increases soil properties by increasing plant available macro, micro, secondary nutrients and soil organic C, whereas the increase in organic C by INF application is, by and large, due to increment in organic C content within macro-aggregates and in the silt + clay compartments. The soil organic carbon and other plant available nutrients were significantly greater in conservation tillage systems as compared to conventional tillage (CT) that conservation approaches could be an exemplary promoter of soil productivity by modifying soil structure thereby protecting SOM and maintaining higher nutrient content. The mean concentration of different fractions of carbon MBN, PMN and soil respiration under integrated nutrient management treatments was higher as compared with to control. Therefore, the conjoint use of organic manures or retention of crop residues with inorganic fertilizers is imperative to reduce the depletion of SOC while sustaining crop production as a realistic alternative. Future research should focus mainly on the usage of organic and mineral fertilizers in conjunction with conservation tillage approaches to sustain the soil environment.

    The authors confirm contribution to the paper as follows: study conception and design: Dhaliwal SS, Shukla AK, Randhawa MK, Behera SK; data collection: Sanddep S, Dhaliwal SS, Behera SK; analysis and interpretation of results: Dhaliwal SS, Gagandeep Kaur, Behera SK; draft manuscript preparation: Dhaliwal SS, walia, Shukla AK, Toor AS, Behera SK, Randhawa MK. All authors reviewed the results and approved the final version of the manuscript.

    Data sharing not applicable to this article as no datasets were generated or analyzed during the current study.

    The support rendered by the Departemnt of Soil Science, PAU, Ludhiana, RVSKVV, Gwailor, CSSRI, Karnal, IISS, Bhopal, School of Organic Farming, PAU Ludhiana and Washington State University, USA is fully acknowledged .

  • The authors declare that they have no conflict of interest.

  • Supplemental Table S1 The list of qRT-PCR primer sequences.
    Supplemental Table S2 The quality information of transcriptome data.
  • [1]

    Davila-Velderrain J, Martinez-Garcia JC, Alvarez-Buylla ER. 2016. Dynamic network modelling to understand flowering transition and floral patterning. Journal of Experimental Botany 67:2565−72

    doi: 10.1093/jxb/erw123

    CrossRef   Google Scholar

    [2]

    Blümel M, Dally N, Jung C. 2015. Flowering time regulation in crops—what did we learn from Arabidopsis? Current Opinion in Biotechnology 32:121−29

    doi: 10.1016/j.copbio.2014.11.023

    CrossRef   Google Scholar

    [3]

    Foucher F, Chevalier M, Corre C, Soufflet-Freslon V, Legeai F, et al. 2008. New resources for studying the rose flowering process. Genome 51:827−37

    doi: 10.1139/G08-067

    CrossRef   Google Scholar

    [4]

    Xing W, Wang Z, Wang X, Bao M, Ning G. 2014. Over-expression of an FT homolog from Prunus mume reduces juvenile phase and induces early flowering in rugosa rose. Scientia Horticulturae 172:68−72

    doi: 10.1016/j.scienta.2014.03.050

    CrossRef   Google Scholar

    [5]

    Dubois A, Carrere S, Raymond O, Pouvreau B, Cottret L, et al. 2012. Transcriptome database resource and gene expression atlas for the rose. BMC Genomics 13:638

    doi: 10.1186/1471-2164-13-638

    CrossRef   Google Scholar

    [6]

    Randoux M, Jeauffre J, Thouroude T, Vasseur F, Hamama, et al. 2012. Gibberellins regulate the transcription of the continuous flowering regulator, RoKSN, a rose TFL1 homologue. Journal of Experimental Botany 63:6543−54

    doi: 10.1093/jxb/ers310

    CrossRef   Google Scholar

    [7]

    Silva LDS, Cavalcante ÍHL, da Cunha JG, Lobo JT, Carreiro DA, et al. 2022. Organic acids allied with paclobutrazol modify mango tree 'Keitt' flowering. Revista Brasileira de Fruticultura 44:e003

    doi: 10.1590/0100-29452022003

    CrossRef   Google Scholar

    [8]

    Cho LH, Pasriga R, Yoon J, Jeon JS, An G. 2018. Roles of sugars in controlling flowering time. Journal of Plant Biology 61:121−30

    doi: 10.1007/s12374-018-0081-z

    CrossRef   Google Scholar

    [9]

    Cho LH, Yoon J, An G. 2017. The control of flowering time by environmental factors. The Plant Journal 90:708−19

    doi: 10.1111/tpj.13461

    CrossRef   Google Scholar

    [10]

    Emami H, Kempken F. 2019. PRECOCIOUS 1 (POCO 1), a mitochondrial pentatricopeptide repeat protein affects flowering time in Arabidopsis thaliana. The Plant Journal 100:265−78

    doi: 10.1111/tpj.14441

    CrossRef   Google Scholar

    [11]

    Guan H, Huang X, Zhu Y, Xie B, Liu H, et al. 2021. Identification of DELLA Genes and key stage for GA sensitivity in bolting and flowering of flowering Chinese cabbage. International Journal of Molecular Sciences 22:12092

    doi: 10.3390/ijms222212092

    CrossRef   Google Scholar

    [12]

    Wang Y, Li B, Li Y, Du W, Zhang Y, et al. 2022. Application of exogenous auxin and gibberellin regulates the bolting of lettuce (Lactuca sativa L.). Open Life Sciences 17:438−46

    doi: 10.1515/biol-2022-0043

    CrossRef   Google Scholar

    [13]

    Meng X, Li Y, Yuan Y, Zhang Y, Li H, et al. 2020. The regulatory pathways of distinct flowering characteristics in Chinese jujube. Horticulture Research 7:123

    doi: 10.1038/s41438-020-00344-7

    CrossRef   Google Scholar

    [14]

    Cao S, Luo X, Xu D, Tian X, Song J, et al. 2021. Genetic architecture underlying light and temperature mediated flowering in Arabidopsis, rice, and temperate cereals. The New phytologist 230:1731−45

    doi: 10.1111/nph.17276

    CrossRef   Google Scholar

    [15]

    Luo X, He Y. 2020. Experiencing winter for spring flowering: A molecular epigenetic perspective on vernalization. Journal of Integrative Plant Biology 62:104−17

    doi: 10.1111/jipb.12896

    CrossRef   Google Scholar

    [16]

    Lewandowska-Sabat AM, Fjellheim S, Rognli OA. 2012. The continental-oceanic climatic gradient impose clinal variation in vernalization response in Arabidopsis thaliana. Environmental and Experimental Botany 78:109−16

    doi: 10.1016/j.envexpbot.2011.12.033

    CrossRef   Google Scholar

    [17]

    Love MI, Huber W, Anders S. 2014. Moderated estimation of fold change and dispersion for RNA-seq data with DESeq2. Genome Biology 15:550

    doi: 10.1186/s13059-014-0550-8

    CrossRef   Google Scholar

    [18]

    Xue Y, Xue J, Ren X, Li C, Sun K, et al. 2022. Nutrient supply is essential for shifting tree peony reflowering ahead in autumn and sugar signaling is involved. International Journal of Molecular Sciences 23:7703

    doi: 10.3390/ijms23147703

    CrossRef   Google Scholar

    [19]

    Mornya PMP, Cheng FY, Li HY. 2011. Chronological changes in plant hormone and sugar contents in cv. Ao-Shuang autumn flowering tree peony. Horticultural Science 38:104−12

    doi: 10.17221/11/2011-HORTSCI

    CrossRef   Google Scholar

    [20]

    Wu P, Wu C, Zhou B. 2017. Drought stress induces flowering and enhances carbohydrate accumulation in Averrhoa Carambola. Horticultural Plant Journal 3:60−66

    doi: 10.1016/j.hpj.2017.07.008

    CrossRef   Google Scholar

    [21]

    Ma QJ, Hu DG, Lu J, Sun MH, Liu YJ, et al. 2016. Molecular cloning and functional characterization of the apple sucrose transporter gene MdSUT2. Plant Physiology and Biochemistry 109:442−451

    doi: 10.1016/j.plaphy.2016.10.026

    CrossRef   Google Scholar

    [22]

    Patzke K, Prananingrum P, Klemens PAW, Trentmann O, Rodrigues CM, et al. 2019. The plastidic sugar transporter pSuT influences flowering and affects cold responses. Plant physiology 179:569−587

    doi: 10.1104/pp.18.01036

    CrossRef   Google Scholar

    [23]

    Andrés F, Coupland G. 2012. The genetic basis of flowering responses to seasonal cues. Nature Reviews Genetics 13:627−39

    doi: 10.1038/nrg3291

    CrossRef   Google Scholar

    [24]

    Eshghi S, Tafazoli E, Dokhani S, Rahemi M, Emam Y. 2007. Changes in carbohydrate contents in shoot tips, leaves and roots of strawberry (Fragaria × ananassa Duch.) during flower-bud differentiation. Scientia Horticulturae 113:255−260

    doi: 10.1016/j.scienta.2007.03.014

    CrossRef   Google Scholar

    [25]

    Xing LB, Zhang D, Li YM, Shen YW, Zhao CP, et al. 2015. Transcription Profiles Reveal Sugar and Hormone Signaling Pathways Mediating Flower Induction in Apple (Malus domestica Borkh. ). Plant & cell physiology 56:2052−2068

    doi: 10.1093/pcp/pcv124

    CrossRef   Google Scholar

    [26]

    Wu M, Wu J, Gan Y. 2020. The new insight of auxin functions: transition from seed dormancy to germination and floral opening in plants. Plant Growth Regulation 91:169−74

    doi: 10.1007/s10725-020-00608-1

    CrossRef   Google Scholar

    [27]

    Guo XL, Yu C, Luo L, Wan HH, Zhen N, et al. 2018. Developmental transcriptome analysis of floral transition in Rosa odorata var. gigantea. Plant Molecular Biology 97:113−30

    doi: 10.1007/s11103-018-0727-8

    CrossRef   Google Scholar

    [28]

    Hu J, Liu Y, Tang X, Rao H, Ren C, et al. 2020. Transcriptome profiling of the flowering transition in saffron (Crocus sativus L.). Scientific Reports 10:9680

    doi: 10.1038/s41598-020-66675-6

    CrossRef   Google Scholar

    [29]

    Zwiewka M, Bilanovičová V, Seifu YW, Nodzyński T. 2019. The nuts and bolts of PIN auxin efflux carriers. Frontiers in Plant Science 10:985

    doi: 10.3389/fpls.2019.00985

    CrossRef   Google Scholar

    [30]

    Dubey SM, Serre NBC, Oulehlová D, Vittal P, Fendrych M, et al. 2021. No time for transcription-rapid auxin responses in plants. Cold Spring Harbor Perspectives in Biology 13:a039891

    doi: 10.1101/cshperspect.a039891

    CrossRef   Google Scholar

    [31]

    Guo Y, An L, Yu H, Yang M. 2022. Endogenous hormones and biochemical changes during flower development and florescence in the buds and leaves of Lycium ruthenicum Murr. Forests 13:763

    doi: 10.3390/f13050763

    CrossRef   Google Scholar

    [32]

    Villar L, Lienqueo I, Llanes A, Rojas P, Perez J, et al. 2020. Comparative transcriptomic analysis reveals novel roles of transcription factors and hormones during the flowering induction and floral bud differentiation in sweet cherry trees (Prunus avium L. cv. Bing). PLoS One 15:e0230110

    doi: 10.1371/journal.pone.0230110

    CrossRef   Google Scholar

    [33]

    Hsu PK, Dubeaux G, Takahashi Y, Schroeder JI. 2021. Signaling mechanisms in abscisic acid-mediated stomatal closure. The Plant Journal 105:307−21

    doi: 10.1111/tpj.15067

    CrossRef   Google Scholar

    [34]

    Zhang C, Zhou Q, Liu W, Wu X, Li Z, et al. 2022. BrABF3 promotes flowering through the direct activation of CONSTANS transcription in pak choi. The Plant Journal 111:134−48

    doi: 10.1111/tpj.15783

    CrossRef   Google Scholar

    [35]

    An H, Jiang S, Zhang J, Xu F, Zhang X. 2021. Comparative transcriptomic analysis of differentially expressed transcripts associated with flowering time of loquat (Eriobotya japonica Lindl.). Horticulturae 7:171

    doi: 10.3390/horticulturae7070171

    CrossRef   Google Scholar

    [36]

    Qin L, Zhang X, Yan J, Fan L, Rong C, et al. 2019. Effect of exogenous spermidine on floral induction, endogenous polyamine and hormone production, and expression of related genes in ‘Fuji’apple (Malus domestica Borkh.). Scientific Reports 9:12777

    doi: 10.1038/s41598-019-49280-0

    CrossRef   Google Scholar

    [37]

    Li Z, Xiao W, Chen H, Zhu G, Lv F. 2022. Transcriptome analysis reveals endogenous hormone changes during spike development in Phalaenopsis. International Journal of Molecular Sciences 23:10461

    doi: 10.3390/ijms231810461

    CrossRef   Google Scholar

    [38]

    Sheng J, Li X, Zhang D. 2022. Gibberellins, brassinolide, and ethylene signaling were involved in flower differentiation and development in Nelumbo nucifera. Horticultural Plant Journal 8:243−50

    doi: 10.1016/j.hpj.2021.06.002

    CrossRef   Google Scholar

    [39]

    Yi X, Gao H, Yang Y, Yang S, Luo L, et al. 2021. Differentially expressed genes related to flowering transition between once-and continuous-flowering Roses. Biomolecules 12:58

    doi: 10.3390/biom12010058

    CrossRef   Google Scholar

    [40]

    Li Y, Zhang D, Zhang X, Xing L, Fan S, et al. 2018. A transcriptome analysis of two apple (Malus × domestica) cultivars with different flowering abilities reveals a gene network module associated with floral transitions. Scientia Horticulturae 239:269−81

    doi: 10.1016/j.scienta.2018.04.048

    CrossRef   Google Scholar

    [41]

    Yoshida H, Takehara S, Mori M, Ordonio RL, Matsuoka M, et al. 2020. Evolution of GA metabolic enzymes in land plants. Plant and Cell Physiology 61:1919−34

    doi: 10.1093/pcp/pcaa126

    CrossRef   Google Scholar

    [42]

    Bao SJ, Hua CM, Shen LS, Yu H. 2020. New insights into gibberellin signaling in regulating flowering in Arabidopsis. Journal of Integrative Plant Biology 62:118−31

    doi: 10.1111/jipb.12892

    CrossRef   Google Scholar

    [43]

    Karimi M, Ahmadi N, Ebrahimi M. 2022. Photoreceptor regulation of Hypericum perforatum L. (cv. Topas) flowering under different light spectrums in the controlled environment system. Environmental and Experimental Botany 196:104797

    doi: 10.1016/j.envexpbot.2022.104797

    CrossRef   Google Scholar

    [44]

    Kim SK, Park HY, Jang YH, Lee JH, Kim JK, et al. 2013. The sequence variation responsible for the functional difference between the CONSTANS protein, and the CONSTANS-like (COL) 1 and COL2 proteins, resides mostly in the region encoded by their first exons. Plant Science 199:71−78

    doi: 10.1016/j.plantsci.2012.09.019

    CrossRef   Google Scholar

    [45]

    Yang T, He Y, Niu S, Yan S, Zhang Y. 2020. Identification and characterization of the CONSTANS (CO)/CONSTANS-like (COL) genes related to photoperiodic signaling and flowering in tomato. Plant Science 301:110653

    doi: 10.1016/j.plantsci.2020.110653

    CrossRef   Google Scholar

    [46]

    Ponnu J, Hoecker U. 2021. Illuminating the COP1/SPA ubiquitin ligase: fresh insights into its structure and functions during plant photomorphogenesis. Frontiers in Plant Science 12:662793

    doi: 10.3389/fpls.2021.662793

    CrossRef   Google Scholar

    [47]

    Ahmad S, Peng D, Zhou Y, Zhao K. 2022. The genetic and hormonal inducers of continuous flowering in orchids: An emerging view. Cells 11:657

    doi: 10.3390/cells11040657

    CrossRef   Google Scholar

    [48]

    Tanaka C, Itoh T, Iwasaki Y, Mizuno N, Nasuda S, et al. 2018. Direct interaction between VRN1 protein and the promoter region of the wheat FT gene. Genes & Genetic Systems 93:25−29

    doi: 10.1266/ggs.17-00041

    CrossRef   Google Scholar

    [49]

    Tian L, Xie Z, Lu C, Hao X, Wu S, et al. 2019. The trehalose-6-phosphate synthase TPS5 negatively regulates ABA signaling in Arabidopsis thaliana. Plant Cell Reports 38:869−82

    doi: 10.1007/s00299-019-02408-y

    CrossRef   Google Scholar

    [50]

    Ponnu J, Schlereth A, Zacharaki V, Działo MA, AbelC, et al. 2020. The trehalose 6-phosphate pathway impacts vegetative phase change in Arabidopsis thaliana. The Plant Journal 104:768−80

    doi: 10.1111/tpj.14965

    CrossRef   Google Scholar

    [51]

    Ren H, Park MY, Spartz AK, Wong JH, Gray WM, et al. 2018. A subset of plasma membrane-localized PP2C. D phosphatases negatively regulate SAUR-mediated cell expansion in Arabidopsis. PLoS Genetics 14:e1007455

    doi: 10.1371/journal.pgen.1007455

    CrossRef   Google Scholar

    [52]

    Matilla AJ. 2020. Auxin: hormonal signal required for seed development and dormancy. Plants 9:705

    doi: 10.3390/plants9060705

    CrossRef   Google Scholar

    [53]

    Xu D, Jiang Y, Li J, Lin F, Holm M, et al. 2016. BBX21, an Arabidopsis B-box protein, directly activates HY5 and is targeted by COP1 for 26S proteasome-mediated degradation. PNAS 113:7655−7660

    doi: 10.1073/pnas.1607687113

    CrossRef   Google Scholar

  • Cite this article

    Wang X, Zhao F, Wu Q, Xing S, Yu Y, et al. 2023. Physiological and transcriptome analyses to infer regulatory networks in flowering transition of Rosa rugosa. Ornamental Plant Research 3:4 doi: 10.48130/OPR-2023-0004
    Wang X, Zhao F, Wu Q, Xing S, Yu Y, et al. 2023. Physiological and transcriptome analyses to infer regulatory networks in flowering transition of Rosa rugosa. Ornamental Plant Research 3:4 doi: 10.48130/OPR-2023-0004

Figures(10)

Article Metrics

Article views(5208) PDF downloads(555)

ARTICLE   Open Access    

Physiological and transcriptome analyses to infer regulatory networks in flowering transition of Rosa rugosa

Ornamental Plant Research  3 Article number: 4  (2023)  |  Cite this article

Abstract: Rosa rugosa is a famous Chinese traditional flowering species with high economic value. Flowering transition is an important process in plant growth and development. Although characterization of the flowering transition process has made great progress in some plants such as model plants, the process in R. rugosa has not been rigorously characterized to establish a mechanism. In this study, the changes of buds during flowering transition in R. rugosa ‘Duoji Huangmei’ were analyzed through transcriptomic sequencing combined with morphological and physiological index determinations. Results showed that with the morphology changes of buds, both sugar and starch content showed a similar up-down pattern while phytohormones content displayed various trends, which implied that sugar, starch and phytohormones might play diverse roles during flowering transition in R. rugosa. Moreover, a total of 4363 differentially expressed genes (DEGs) were identified at three developmental stages. Among them, 74 DEGs were involved in metabolism, transport, and signal transduction of sugar, starch, and phytohormones, as well as photoperiod and vernalization response. We proposed that these DEGs were not regulated independently but interacted with each other to construct a gene-gene network to regulate flowering transition of R. rugosa, and the regulatory network from vegetative growth stage (S1) to flowering transition stage (S2) was more complicated. These results further enriched the study of flowering transition in Rosa and lay an important foundation for breeding new varieties with desired floral traits.

    • Flowering transition is a process in which the apical meristem gradually develops from the vegetative meristem to the reproductive meristem under the control of complicated genetic networks in response to the internal regulatory factors and external environmental factors[1]. To date, some progress has been made in the study on the molecular mechanism of flowering transition in some plants such as Rosa[2]. Foucher et al. identified 13 potential flowering regulatory genes( RoRGA , RoSLY , RoSOC1 , MASAKO B3 , etc.) in R. hybrida 'Black Baccara' related to flower development, gibberellin, and photoperiodic pathways through EST data[3]. It was found that overexpression of FT genes into R. rugosa 'Bao White' can significantly reduce the juvenile phase of the plant and enable it to flower earlier[4]. By transcriptome sequencing, Dubois et al. found that transcripts of the flowering integrator RcSOC1 accumulate only during the growth stage and flower initiation stage, and are not expressed at the later stages of flowering[5]. Randoux et al. suggested that the expression of RoKSN was inhibited and resulted in the suppression of flowering when a high concentration of Gibberellic acid(GA) was applied to a season of flowering R. chinensis[6]. R. rugosa is a famous Chinese traditional flowering species with aromatic compounds and strong resistance to stress including cold, drought, pest, salt and alkali. However, the regulatory mechanism on the flowering transition of R. rugosa is still unclear. Accordingly, exploring the regulatory mechanism of flowering transition in R. rugosa can lay an important foundation for breeding new varieties with desired floral traits.

      The process of flowering transition was regulated by the change of internal growth regulation substances, including carbohydrates and phytohormones[7]. Sugar molecules, such as sucrose, glucose, fructose, etc, are essential components of carbohydrates in plants, among which sucrose is the main form of long-distance carbohydrate transport in higher plants. As a flowering signal, sucrose is also involved in regulating transport efficiency, distribution of assimilated products, and the activation and repression of specific genes in plants[8]. Starch, which also belongs to carbohydrates, mainly generates sugar molecules through hydrolysis to provide the energy for the flowering transition in the plant. Relevant studies have shown that the decrease of amylose can exhibit a late-flowering phenotype[9]. Abscisic acid(ABA), Indole-3-acetic acid(IAA), and GA are all important phytohormones affecting plant growth and development, such as seed germination, stem elongation, flowering and fruiting, senescence and abscission, and dormancy, etc. Previous findings showed that the three phytohormones all play dual roles in regulating the flowering transition process of plants, namely promoting or inhibiting the flowering transition[1012]. Light and temperature signals are important environmental factors affecting the flowering transition process. Light regulates plant flower bud differentiation and flowering via the photoperiod pathway, an essential pathway for flowering in the plant[13]. The light signal of photoperiod is perceived by leaf, converted into biological signals and then transmitted to the flowering-time genes downstream to regulate the flowering transition process[14]. Nowadays, many studies on the impact of temperature on plant flowering have focused on vernalization, a phase of low temperature that some flowering species must undergo before flowering[15]. The molecular mechanisms underlying the vernalization response in Arabidopsis thaliana are well understood[16].

      In this study, R. rugosa 'Duoji Huangmei', a novel continuous flowering cultivar, was selected as plant material. We explored the changes in morphology and content of sugar, starch, and phytohormones of buds during the flowering transition process. Furthermore, we conducted RNA sequencing (RNA-seq) to analyze the expression patterns of DEGs involved in the pathways related to sucrose, starch, IAA, ABA, GA, photoperiod, and vernalization. Finally, the molecular regulatory networks of flowering transition in R. rugosa was predicted.

    • R. rugosa 'Duoji Huangmei' was a diploid cultivar obtained by interspecific hybridization of R. rugosa and R. xanthina, which blooms from April to September. The tested R. rugosa 'Duoji Huangmei' plants were planted in the Rose Germplasm Nursery, Forestry Experimental Station of Shandong Agricultural University, Tai'an, China (36°10′15″ N, 117°09′25″ E), where they grew under natural conditions. Branches with buds of different sizes from nine different plants were selected randomly and then taken back to the laboratory on February 20th, 2021. After measuring the length using a vernier caliper, the buds were cut longitudinally. For the two halves of each cut bud, one half was used for observation to determine the developmental stage under Olympus SZX2-ILLT stereoscopic microscope (Olympus, Japan) and the other half at different developmental stages were quickly put into different tubes with liquid nitrogen and then stored at −80 °C for physiological index determination and transcriptome analysis. There were three biological replicates for each sample with 60~150 buds.

    • To measure the content of sugar and starch, a total of 200 mg samples were ground and homogenized in 8 mL of deionized water and placed in a boiling water bath for 30 min. After cooling to room temperature, the residue was filtered for subsequent starch content determination. The extracting liquid was transferred to the volumetric flask (25 mL) and the volume was fixed by distilled water, of which 0.5 mL extract liquid was transferred into the test tube. After 10 min of adding 1.5 mL distilled water, 0.5 mL anthrone-ethyl acetate solution (2%, v/v) reagent and 5 mL concentrated sulfuric acid (98%, v/v), the absorbance at 630 nm was read in a Beckman DU 800 UV–visible spectrophotometer (Beckman Coulter, USA) and compared to glucose standards.

      The residue after centrifugation was transferred into a test tube with 10 mL distilled water and placed in a boiling water bath for 15 min. After adding 2 mL of 9.2 mol·L1 perchloric acid for 2 min and then cooling to room temperature, the residue was filtered and the extracting liquid was transferred to the volumetric flask (25 mL) and the volume was fixed by distilled water. A total of 2 mL extracted liquid was collected to measure starch content at 620 nm using glucose as standards.

    • The content of endogenous phytohormones in the buds were measured by high-performance liquid chromatography-mass spectrometry (HPLC-MS). A total of 500 mg samples were extracted overnight at 4 °C with 10 times the volume of acetonitrile solution and 2 μL internal standard master mix. The supernatant was collected by centrifugate at 12,000 rpm for 5 min at 4 °C. The obtained precipitate was added to 5 times the volume of acetonitrile solution and then extracted twice to combine the obtained supernatant. By adding 35 mg of C18 filler and vigorously shaking for 30 s, the supernatant was taken by centrifugate at 10,000 rpm for 5 min at 4 °C. Finally, it was dried with nitrogen, reconstituted with 200 μL methanol, passed through a 0.22 μm organic filter membrane, and placed in a −20 °C refrigerator for on-machine detection.

      The HPLC-MS/MS analysis was conducted on a Poroshell 120 SB-C18 reversed-phase column (2.1 mm × 150 mm, 2.7 μm) at a flow rate of 0.3 mL·min−1 and a column temperature of 30 °C. Methanol / 0.1% formic acid (A) and water / 0.1% formic acid (B) were used as the mobile phase in gradient elution mode. The separation was performed using the following gradient: 20% for 1 min, from 20% to 50% in 2 min, from 50% to 80% in 6 min, at 80% for 1.5 min, then declining from 80% to 20% in 6s and 20% for 2.9 min. The injection volume is 2 μL. The ESI source operation parameters were as follows: ion source, ESI+ and ESI; source temperature, 400 °C; ion spray voltage, +4,500 V and −4,000 V; curtain gas, 15 psi; atomization gas pressure, 65 psi; auxiliary gas pressure, 70 psi. Endogenous phytohormones were analyzed using scheduled multiple reaction monitoring (MRM).

    • Total RNA was extracted using the Total RNA Isolation Kit (Vazyme, China) according to the manufacturer's instructions. The quantity and quality of total RNA were assessed using 1% agarose gels and a NanoPhotometer® spectrophotometer (IMPLEN, USA). The integrity and concentration of total RNA were assessed using an Agilent 2100 RNA Nano 6000 Assay Kit (Agilent Technologies, USA) and Qubit®3.0 Fluorometer (Life Technologies, USA).

      The poly(A) mRNA was isolated from total RNA through a NEBNext® Ultra™ RNA Library Prep Kit (New England Biolabs, China). After construction and normalization, three cDNA libraries were sequenced on the Illumina Hiseq 6000 Sequencing platform (Anoroad, China) and 150 bp paired-end reads were generated. The raw data were processed by removing the low-quality sequences (reads with more than 50% Q < 19 bases), the adaptor-pollute sequences, and sequences with ambiguous base reads accounting for more than 5%.

      To understand their functions, the obtained clean reads were aligned to the R. rugosa genome database (http://eplantftp.njau.edu.cn/Rosa_rugosa/) by HISAT2 v2.1.0. The expression levels of genes were calculated as Fragments Per Kilobase of exon model per Million mapped fragments (FPKM), which eliminates the effect of sequencing depth and gene length on gene expression levels and permits direct data comparisons by the DESeq method[17]. The DEGs were identified if their log2|Fold Change| was over 1 with a q-value ≤ 0.05. And then the GO (Gene Ontology, http://geneontology.org/) and KEGG (Kyoto Encyclopedia of Genes and Genomes, www.kegg.jp) enrichment according to the identified DEGs were analyzed. The key DEGs involved in flowering transition were identified and their expression patterns were analyzed.

    • Quantitative real-time PCR (qRT-PCR) was carried out to verify the transcriptome data and analyze the expression patterns of 12 DEGs related to the flowering transition in R. rugosa 'Duoji Huangmei'. All actions were done on a CFX96 Real-time PCR System according to the instructions of the SYBR Green Pro Taq HS premixed qPCR kit (Accurate Biology, China). The amplification program was as follows: 30 s at 95 °C, 40 cycles of 5 s at 95 °C and 30 s at 60 °C. The relative expression level of differential genes was calculated by the 2−ΔΔCᴛ method with RrGADPH as an internal control. All primers used in this study are listed (Supplemental Table S1). All samples were repeated three times.

    • The bud length increased continuously during the flowering transition process of R. rugosa 'Duoji Huangmei' (Fig. 1a). The flowering transition process was divided into three stages, namely vegetative growth stage (S1), flowering transition stage (S2), and sepal primordial differentiation stage (S3). The bud length was less than 0.3 cm and the growth cone was pointed conical at S1 (Fig. 1b). Subsequently, the bud length increased to 0.3 cm ~ 0.5 cm, and the top of the growth cone gradually changed to oval at S2 (Fig. 1c). When the bud length was greater than 0.5 cm, the sepal primordium began to bulge, and the flowering transition process entered S3 (Fig. 1d).
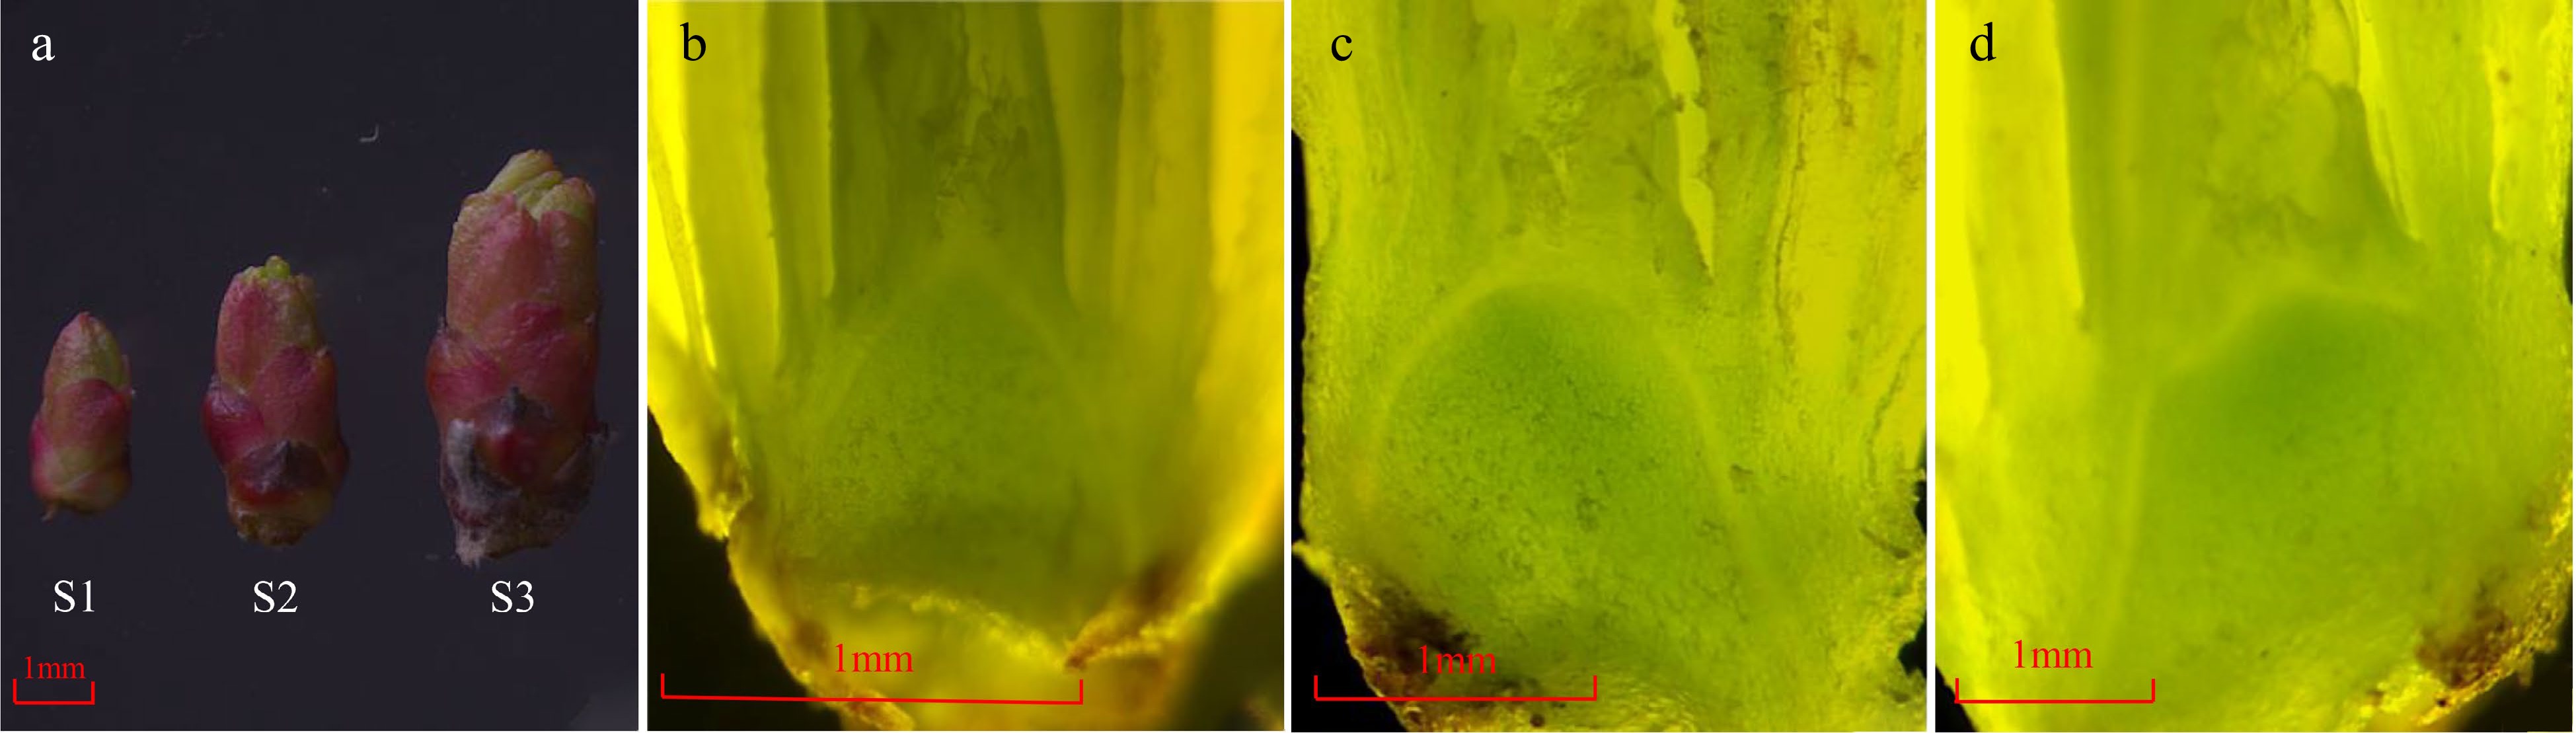
      Figure 1. 

      The morphology changes of buds during the flowering transition process in R. rugosa ‘Duoji Huangmei’. (a) The external morphology of buds at different development stages. (b) The growth cone was pointed conical at S1. (c) The growth cone was oval at S2. (d) The sepal primordium began to bulge at S3.

    • Both sugar and starch content showed up-down patterns, peaking at S2 (Fig. 2a, b). The content of sugar had the highest level at S2 (122.85 mg·g−1), and similar levels at S1 (94.37 mg·g−1) and S3 (91.19 mg·g−1). The content of starch increased from 5.55 mg·g−1 (S1) to 9.65 mg·g−1 (S2), and then decreased to 7.79 mg·g−1 at S3 stage (Fig. 2b). In addition, the content of sugar was about 13 times higher than that of starch at the same stage.
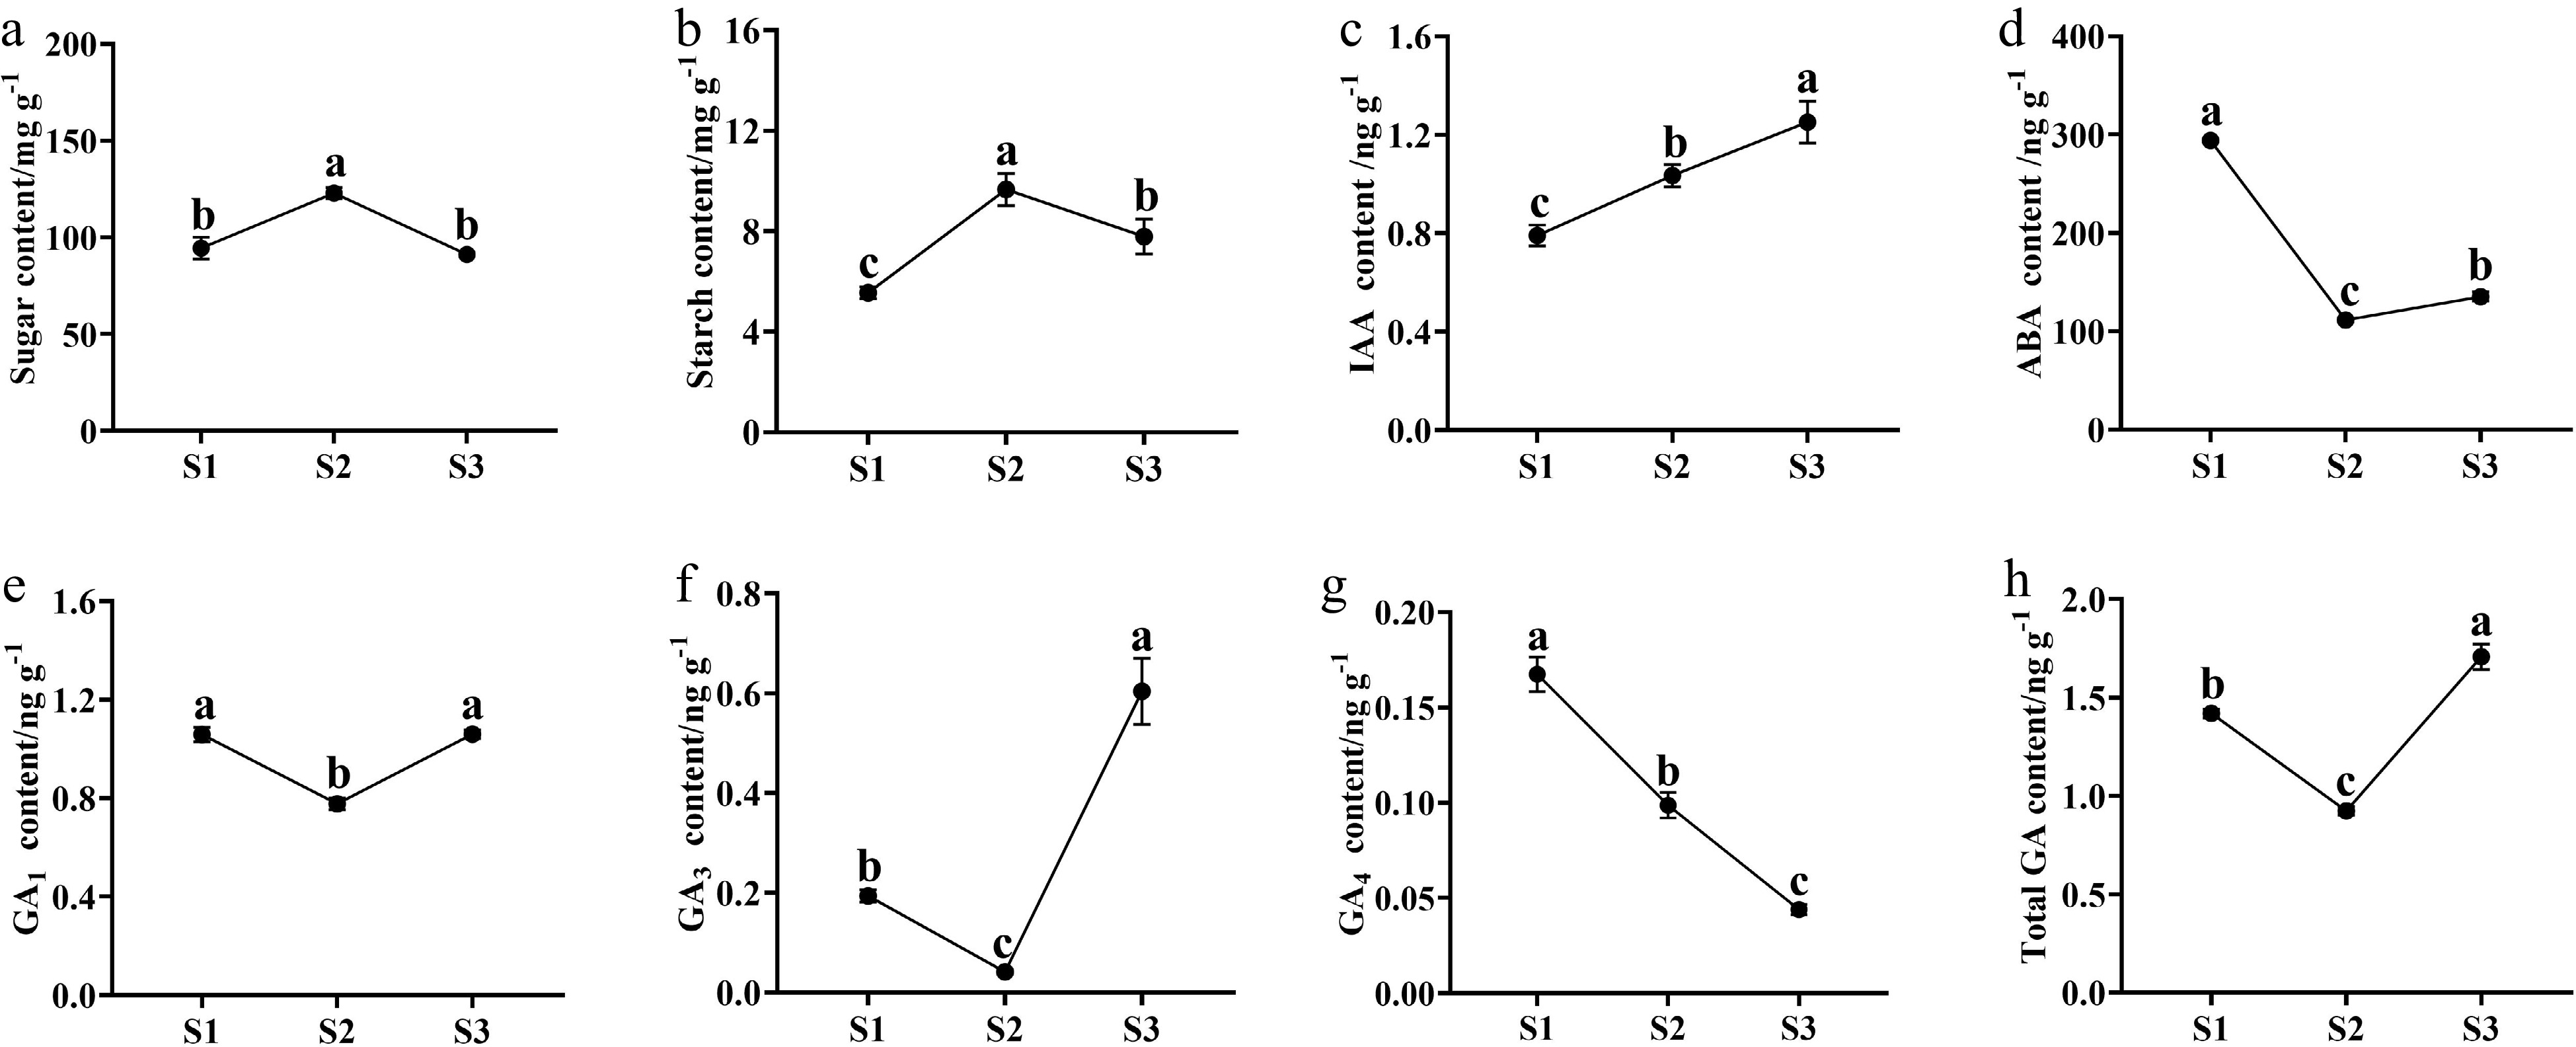
      Figure 2. 

      The content changes of sugars, starch, and endogenous phytohormones in buds during the flowering transition process of R. rugosa 'Duoji Huangmei'. (a) Sugar content. (b) Starch content. (c) IAA content. (d) ABA content. (e) GA1 content. (f) GA3 content. (g) GA4 content. (h) Total GA content. The different small letter for each content indicated significant difference between germplasms at ɑ = 0.05.

    • The content of endogenous phytohormones presented diverse trends during the flowering transition of R. rugosa 'Duoji Huangmei'. The IAA concentration increased continuously with the contents from 0.79 ng·g−1 at S1 to 1.03 ng·g−1 at S2 and 1.25 ng·g−1 at S3 (Fig. 2c). The ABA content decreased 62.08% from S1 (293.92 ng·g−1) to S2 (111.47 ng·g−1) and then kept a gentle trend to S3 (135.22 ng·g−1; Fig. 2d). The content of GA1 and GA3 had similar trends with valley values at S2. The GA1 content maintained higher levels at S1 (1.05 ng·g−1) and S3 (1.06 ng·g−1) than that at S2 (0.77 ng·g−1; Fig. 2e). However, the GA3 content was much higher at S3 than the content at S1 and S2 (Fig. 2f). GA4 content decreased continuously from 0.17 ng·g−1 at S1 to 0.10 ng·g−1 at S2, and 0.04 ng·g−1 at S3 (Fig. 2g). Taken together, total GA content showed higher levels at S1 (1.42 ng·g−1) and S3 (0.92 ng·g−1), and the lowest level at S2 (1.71 ng·g−1; Fig. 2h).

    • Nine cDNA libraries were constructed to explore the key genes associated with the flowering transition in R. rugosa 'Duoji Huangmei'. And the raw data were deposited at the NCBI Sequence Read Archive (SRA) under accession numbers SRR21783417−SRR21783425. A total of 412,576,223 clean reads were obtained after removing the adaptor and low-quality reads (Supplemental Table S2). The Q20 and Q30 base rates were more than 96.45% and 91.17%, respectively. The average GC content was about 47.19%. The mapping rate of each library ranged from 76.28% to 77.51%. These results indicated that the sequencing quality was sufficient for further analyses.

    • There were 3676 DEGs identified from the compare combine of S2 vs S1, which included 2174 up-regulated genes and 1502 down-regulated genes (Fig. 3a). Taking S2 as control, a total of 1227 genes expressed differentially in S3, with more down-regulated genes (972) than up-regulated genes (255). Three thousand six hundred and six DEGs had different expression patterns between S3 and S1, including 2031 up-regulated genes and 1575 down-regulated genes. Five thousand three hundred and thirty two DEGs were found in three compare combinations, of which 417 DEGs were present in all combinations (Fig. 3b).
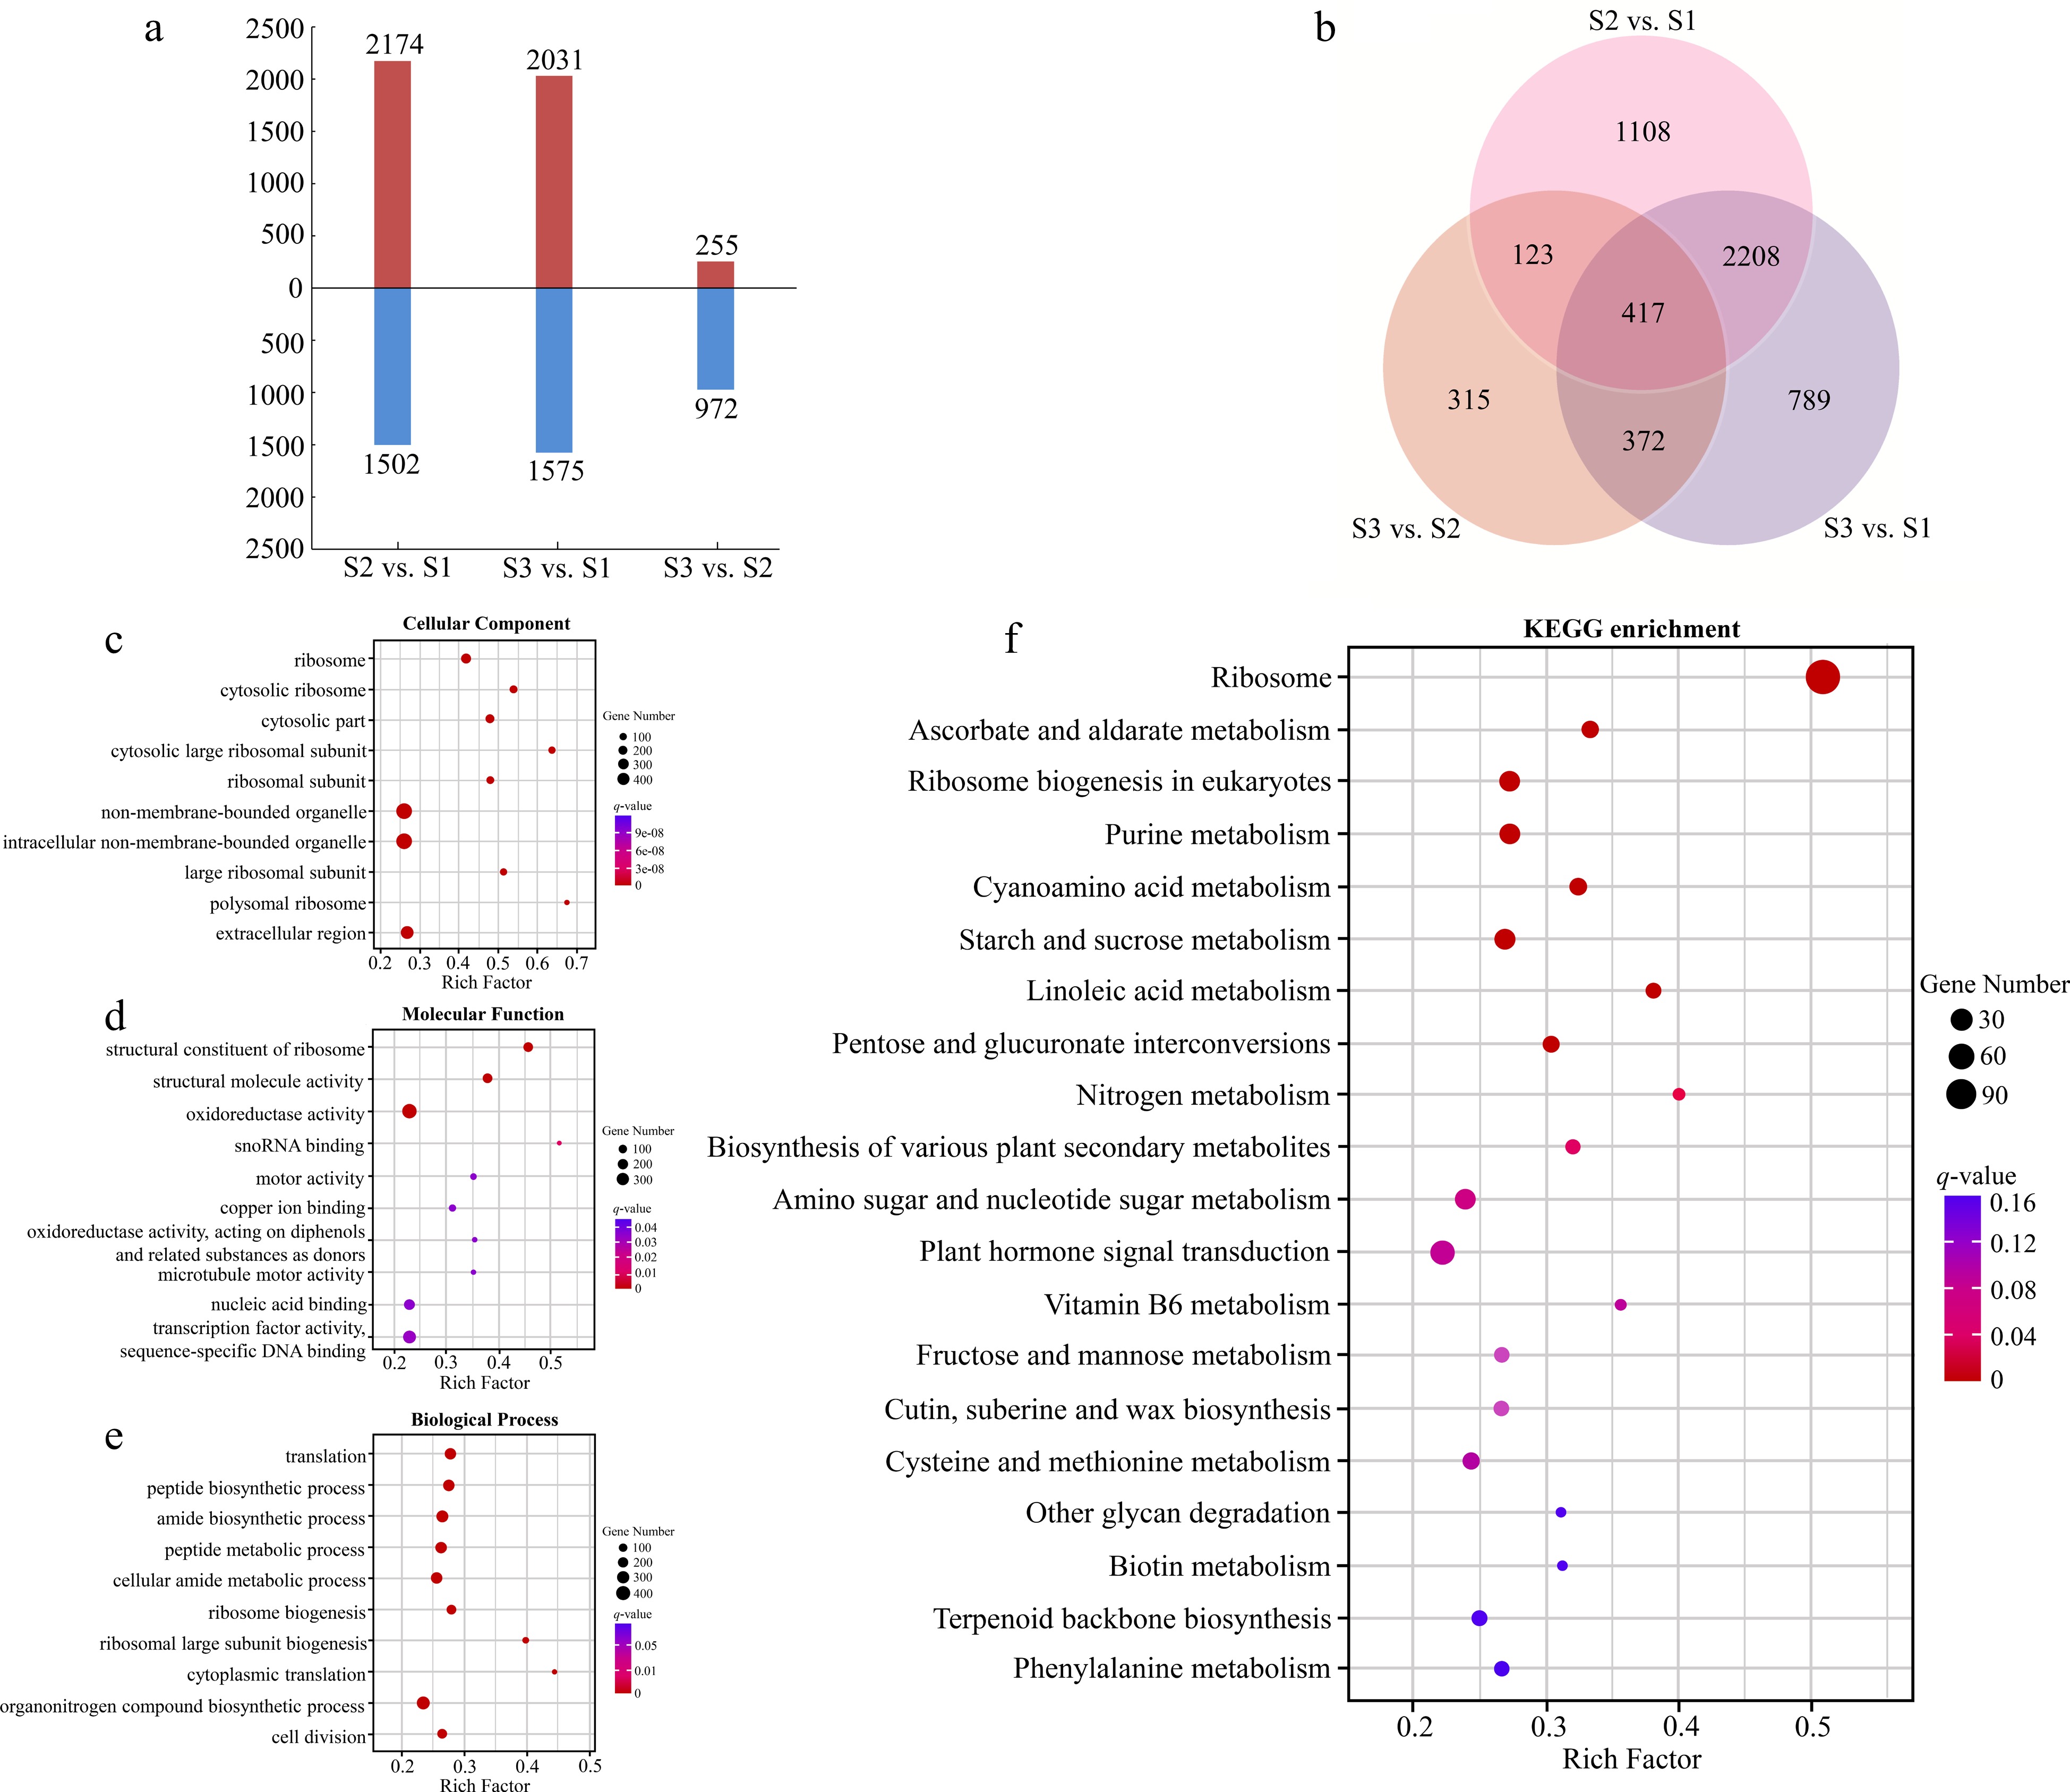
      Figure 3. 

      Analyses of DEGs at three stages of flowering transition in R. rugosa. (a) Numbers of DEGs in each comparison. (b) Venn diagram analyses of differential and stage-specific expression genes in each comparison. (c) The GO terms of DEGs in the cellular components. (d) The GO terms of DEGs in the molecular functions. (e) The GO terms of DEGs in the biological process. (f) KEGG analysis of DEGs.

      For the GO annotation, 3109, 3053, and 2930 DEGs were enriched in cellular component (CC), molecular functions (MF), and biological processes (BP), respectively. The majority of DEGs of CC category were assigned into 'Ribosome' (GO:0005840, 164 DEGs), 'Cytosolic ribosome' (GO:0022626, 92 DEGs), and 'Cytosolic part' (GO:0044445, 103 DEGs; Fig. 3c). For the MF category, the three most abundant structural constituents were 'Structural constituent of ribosome' (GO:0003735, 145 DEGs), 'Structural molecule activity' (GO:0005198, 168 DEGs), and 'Oxidoreductase activity' (GO:0016491, 394 DEGs; Fig. 3d). The three most abundant sub-categories divided from the BP category were 'Translation' (GO:0006412, 183 DEGs), 'Peptide biosynthetic process' (GO:0043043, 195 DEGs), and 'amide biosynthetic process' (GO:0043604, 192 DEGs; Fig. 3e).

      By KEGG analysis, 794 DEGs were enriched in 132 metabolic pathways (Fig. 3f). Among them, the three most significant pathways for enrichment are 'Ribosome' (ko03010, 119 DEGs), 'Ascorbate and aldarate metabolism' (ko00053, 16 DEGs), and 'Ribosome biogenesis in eukaryote' (ko03008, 28 DEGs). In addition, we also found two pathways related to the flowering transition, namely 'Starch and sucrose metabolism' (ko00500, 25 DEGs) and 'Plant hormone signal transduction' (ko04075, 41 DEGs).

    • A total of 17 DEGs involved in starch and sucrose metabolism and transport were identified during the flowering transition process of R. rugosa 'Duoji Huangmei', which including five DEGs related to sugar transport and 12 DEGs related to sugar and starch metabolism, respectively (Fig. 4). There was one down-regulated DEG (RrTPS: evm.TU.chr6.439) and 11 up-regulated DEGs in the combination of S2 vs S1. In the combination of S3 vs S2, the expression of all nine DEGs exhibited downward trends. In addition, there were four DEGs identified from both S2 vs S1 and S3 vs S2, i.e., RrSUT14 (evm.TU.chr2.691), RrTPS (evm.TU.chr6.439), RrTPP (evm.TU.chr3.4724), and RrBAM3 (evm.TU.chr5.2267). Among them, except the expression level of RrTPS decreasing continuously, the other three DEGs showed up-down expression patterns.
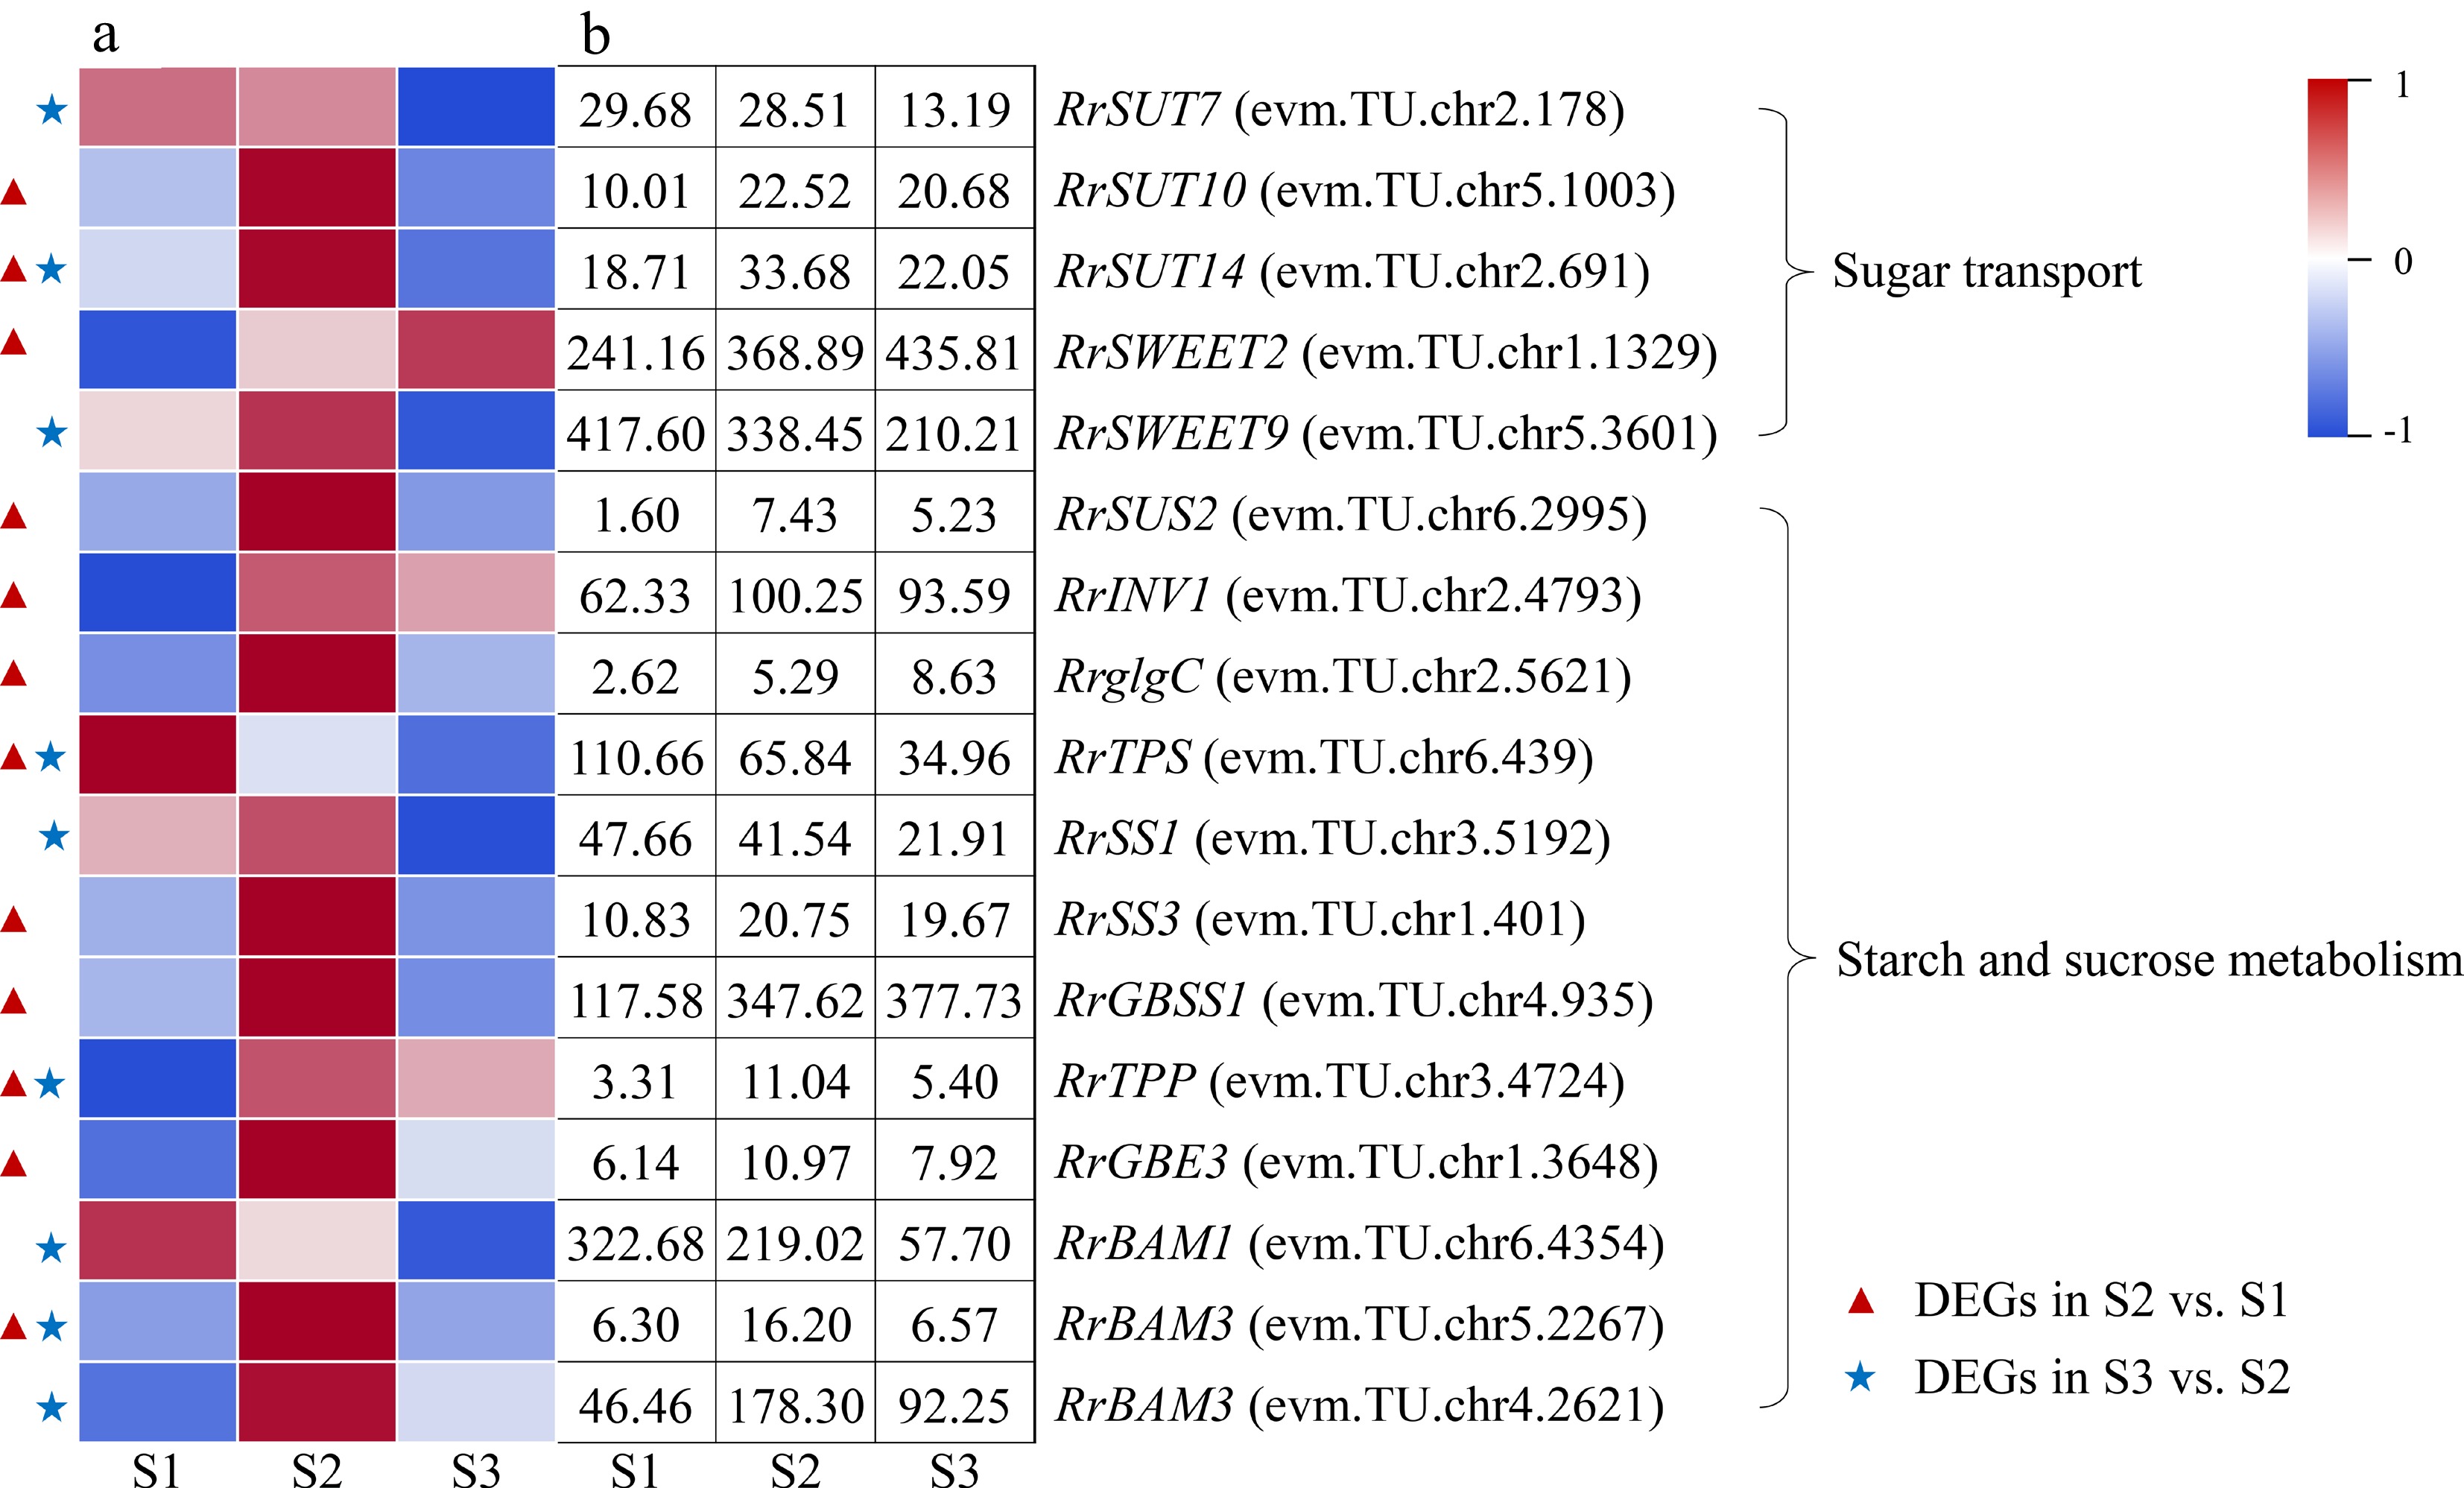
      Figure 4. 

      Expression of starch- and sucrose-related DEGs. (a)The expression heat map of DEGs. (b) The FPKM values of DEGs. BAM: Beta-amylase; GBE3: 1,4-alpha-glucan-branching enzyme 3; GBSS1: Granule-bound starch synthase 1; glgC: Glucose-1-phosphate adenylyltransferase; INV1: insoluble isoenzyme CWINV1-like; SS1: Starch synthase 1; SUS2: Sucrose-phosphate synthase 2; SUT: Sugar transport protein; SWEET: Sugars will eventually be exported transporter; TPP: Trehalose-phosphate phosphatase; TPS: Trehalose-phosphate synthase

    • One DEG involved in IAA metabolism (RrYUCCA2: evm.TU.chr5.4871) and two DEGs related to IAA transport (RrAUX1: evm.TU.chr5.185; RrPIN1: evm.TU.chr4.173) were discovered and presented up-regulated expression during the flowering transition process of R. rugosa 'Duoji Huangmei' (Fig. 5). A total of 11 DEGs involved in IAA signal transduction were distinguished. However, the expression trends of DEGs related to IAA signal transduction were complex, which was different from the highly consistent expression trends of DEGs associated to IAA metabolism and transport. In the combine of S2 vs S1, five DEGs related to IAA signal transduction showed up-regulated trends, i.e., RrTIR1 (evm.TU.chr4.4951), RrIAA13 (evm.TU.chr6.4429), RrSAUR76 (evm.TU.chr2.1179), RrSAUR78 (evm.TU.chr2.5004), and RrGH3.6 (evm.TU.chr1.3329), and three DEGs related to IAA signal transduction showed down-regulated trends, namely RrIAA16 (evm.TU.chr7.3988), RrIAA17 (evm.TU.chr4.5430) and RrSAUR32 (evm.TU.chr3.3449). In the combination of S3 vs S2, only one DEGs related to IAA signal transduction (RrGH3.1: evm.TU.chr2.2246) presented up-regulated expression trend and two DEGs related to IAA signal transduction (RrIAA17: evm.TU.chr2.4338; RrARF: evm.TU.chr4.5433) showed down-regulated expression trends.
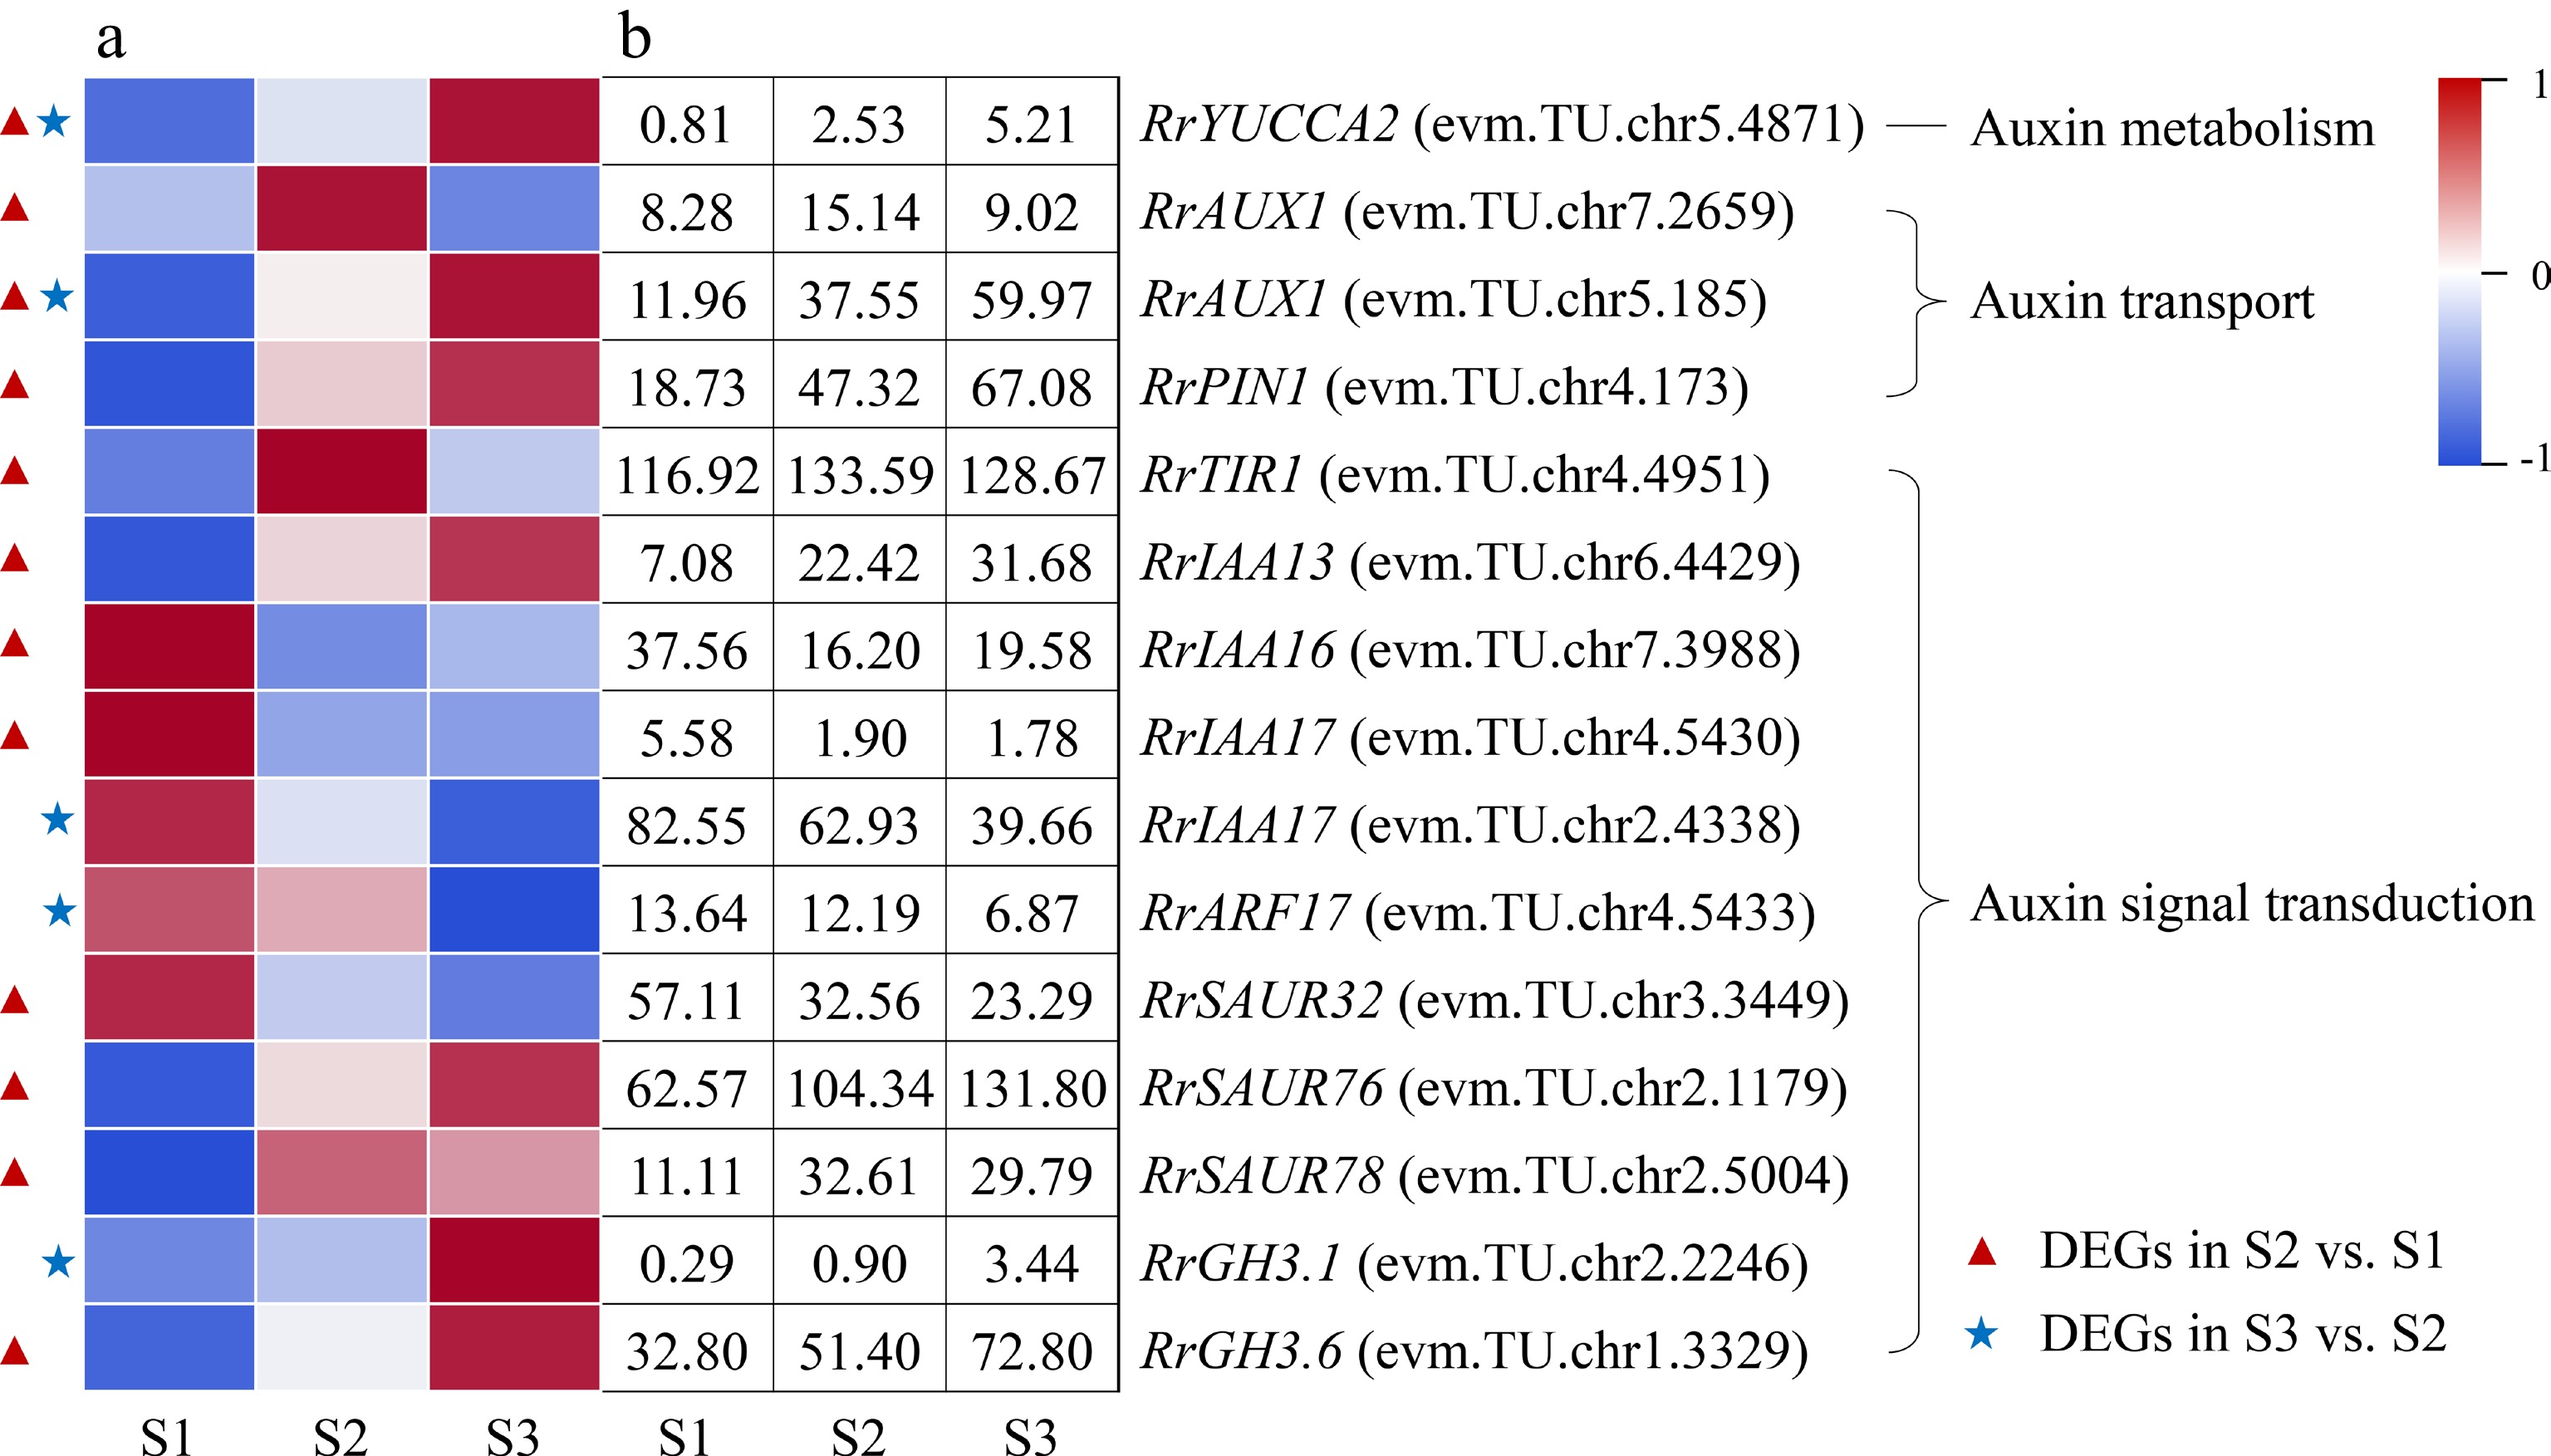
      Figure 5. 

      Expression of IAA-related DEGs. (a) The expression heat map of DEGs. (b) The FPKM values of DEGs. ARF: Auxin response factor; AUX1: Auxin 1; GH3: Gretchen hagen 3; PIN1: PIN-formed acicular protein 1; SAUR: Small auxin-up RNA protein; TIR1: Transport inhibitor response protein 1;YUCCA2: YUCCA flavin-containing monooxygenase 2

    • Two DEGs involved in ABA metabolism (RrNCED3: evm.TU.chr1.2533; RrAO2: evm.TU.chr4.1894) were identified during the flowering transition process of R. rugosa 'Duoji Huangmei', which both decreased sharply in the combination of S2 vs S1 (Fig. 6). There were nine DEGs related to ABA signal transduction in the combination of S2 vs S1, of which eight DEGs showed sharply down-regulated expression trends except RrPYL4 (evm.TU.chr7.2783). Furthermore, eight DEGs associated to ABA signal transduction were selected from the combination of S3 vs S2, which showed slight downward expression patterns from S2 to S3. In addition, four DEGs, namely RrPYR1 (evm.TU.chr4.2796), RrPP2C8 (evm.TU.chr3.5236), RrPP2C16 (evm.TU.chr2.987), and RrABF (evm.TU.chr5.5115), were present in both S2 vs S1 and S3 vs S2.
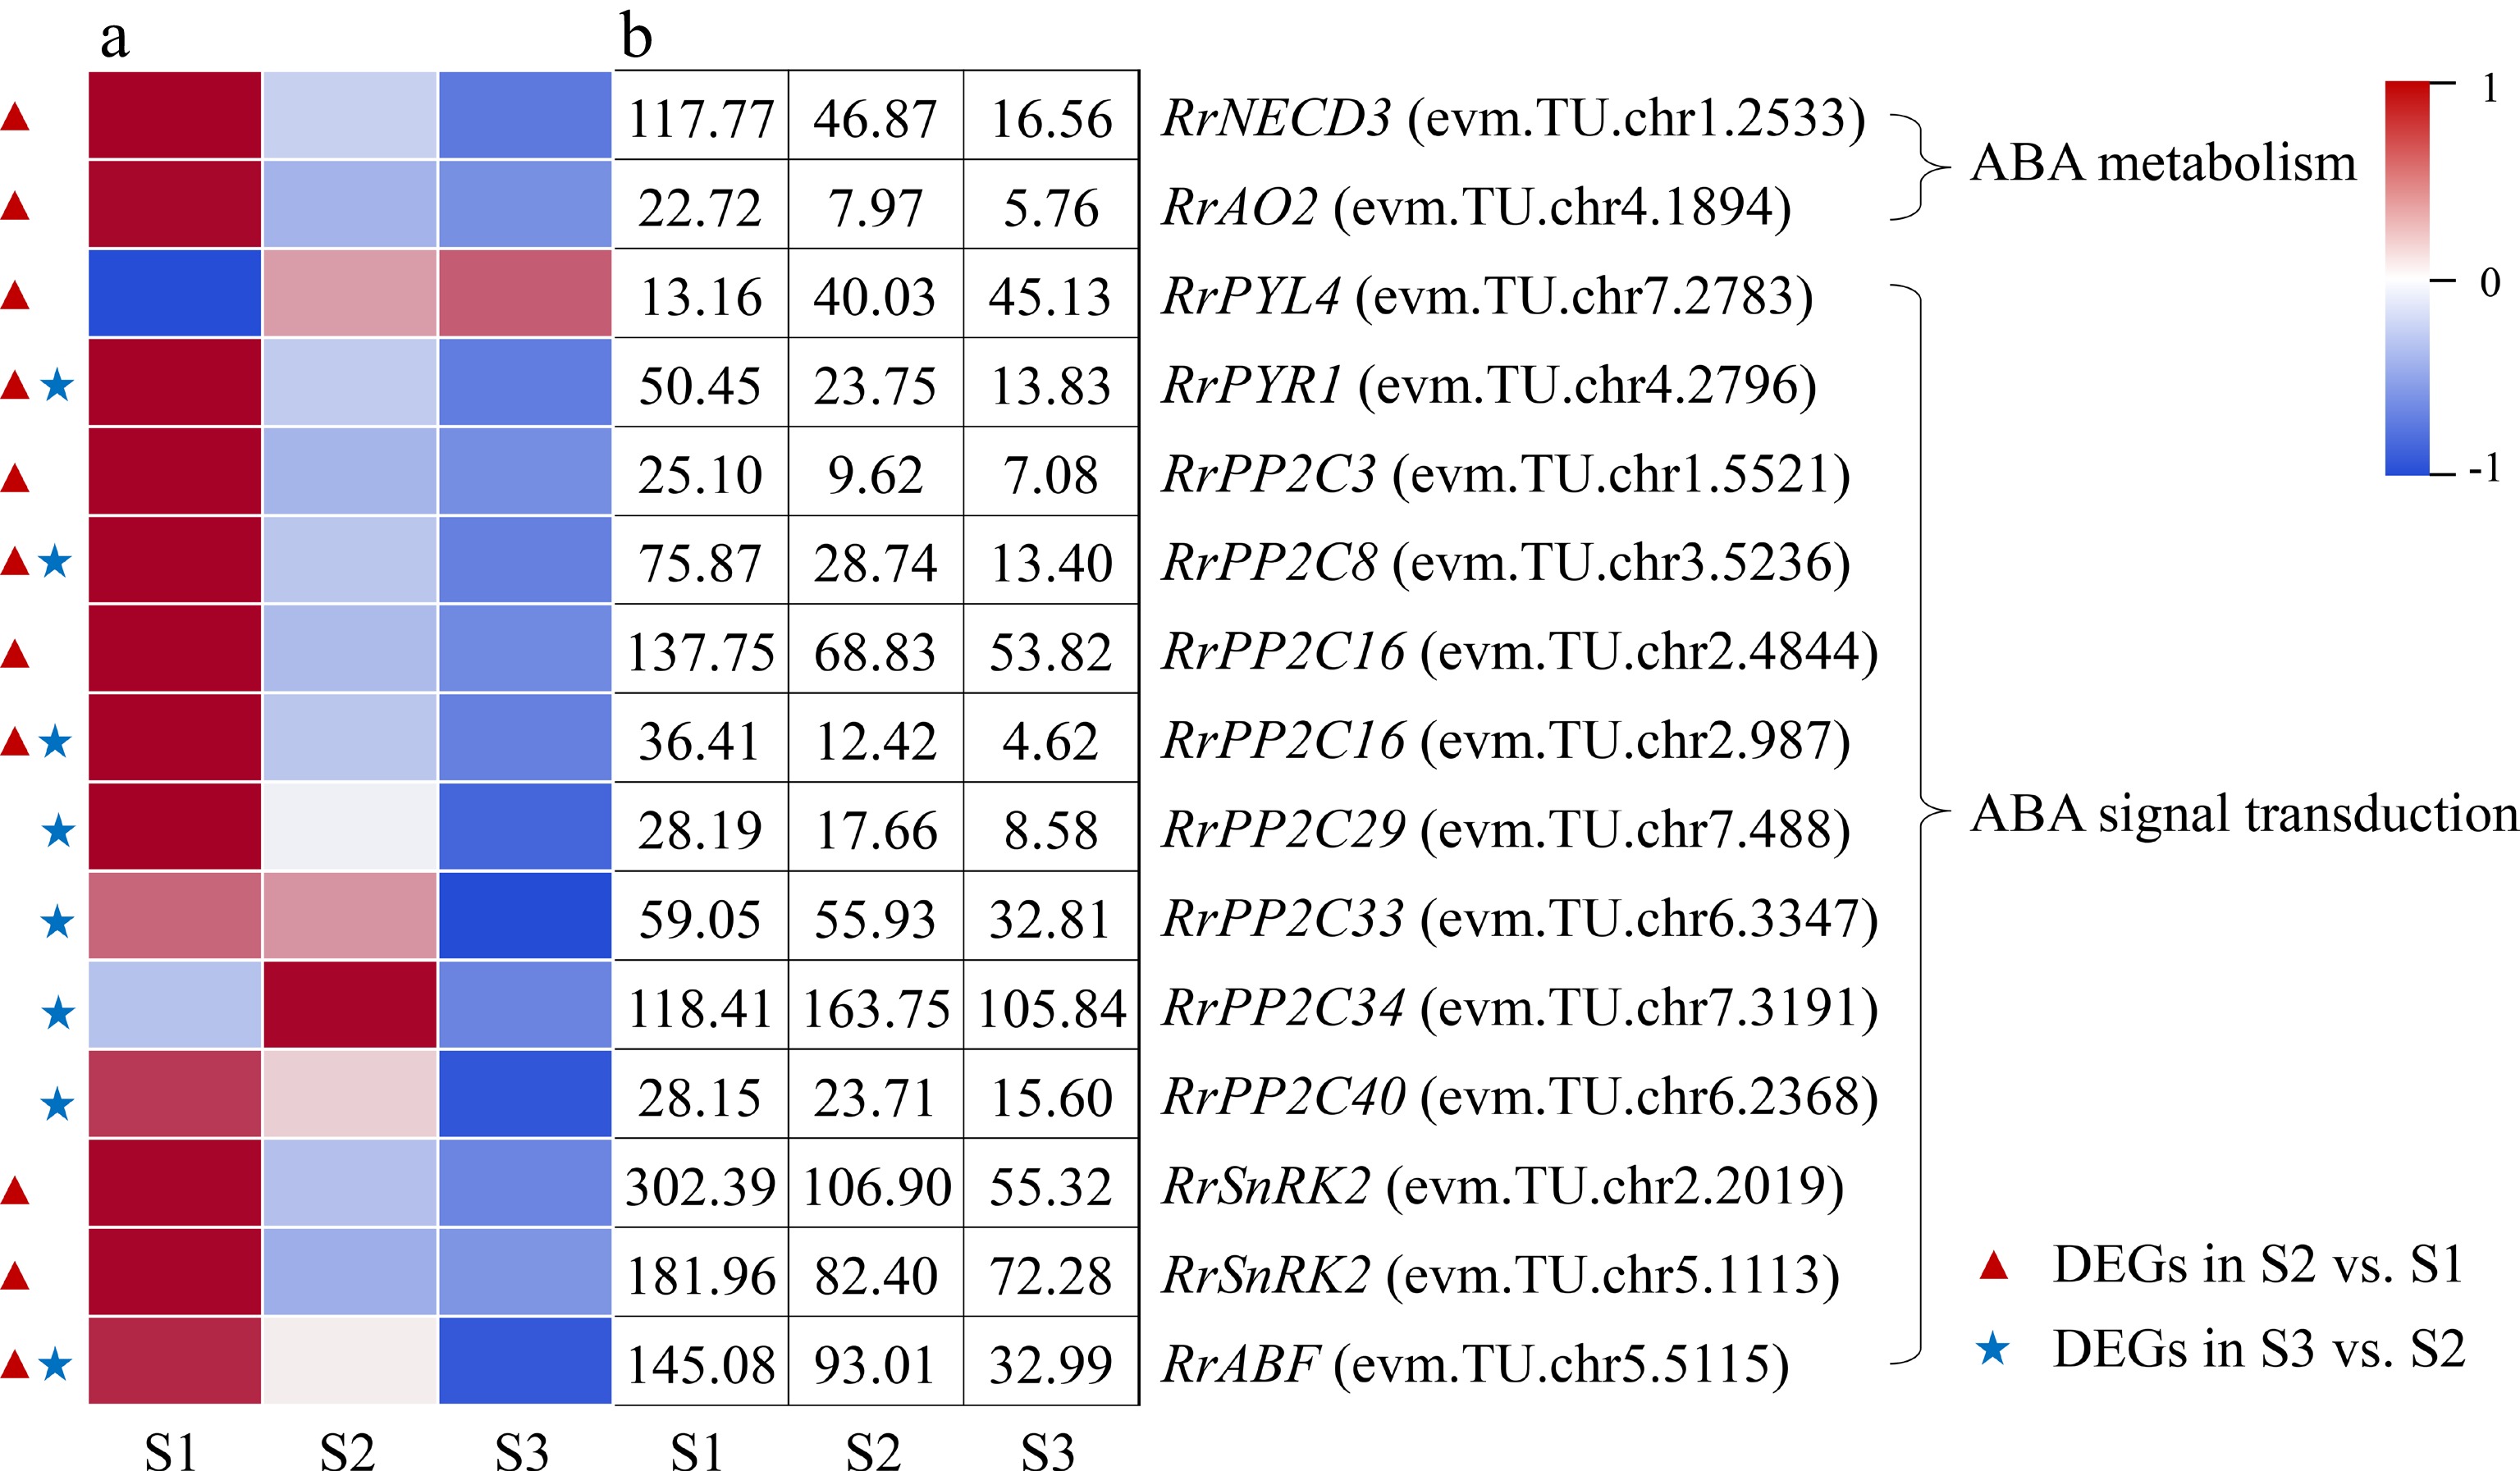
      Figure 6. 

      Expression of ABA-related DEGs. (a) The expression heat map of DEGs. (b) The FPKM values of DEGs. ABF: ABA responsive element binding factor; AO2: Aldehyde oxidase 2; NECD3: 9-cis-epoxycarotenoid dioxygenase 3; PP2C: Protein phosphatase 2C; PYL4: Pyrabactin resistance-like 4 protein; PYR1: Pyrabactin resistance 1 protein; SnRK2: Sucrose nonfermenting 1-related protein kinase 2

    • Two DEGs associated with GA metabolism, RrGA2ox1 (evm.TU.chr1.2534) and RrGA3ox1 (evm.TU.chr2.4322), were distinguished and both exhibited down-regulated expression trends during the flowering transition process of R. rugosa 'Duoji Huangmei' (Fig. 7). And the former one was identified as DEG in combinations of both S2 vs S1 and S3 vs S2, which expression continued to decline. A total of 14 DEGs related to GA signal transduction were identified during the flowering transition process. Interestingly, 12 of 14 DEGs were present in the combination of S2 vs S1, of which nine DEGs showed up-regulated expression trends and three DEGs (RrGID1A: evm.TU.chr7.3415; RrSnakin-2: evm.TU.chr5.4611; RrSCL1: evm.TU.chr5.2181) showed downward patterns. Unlike the combination of S2 vs S1, there were only six DEGs identified in the combine of S3 vs S2, and all of them showed down-regulated expression trends.
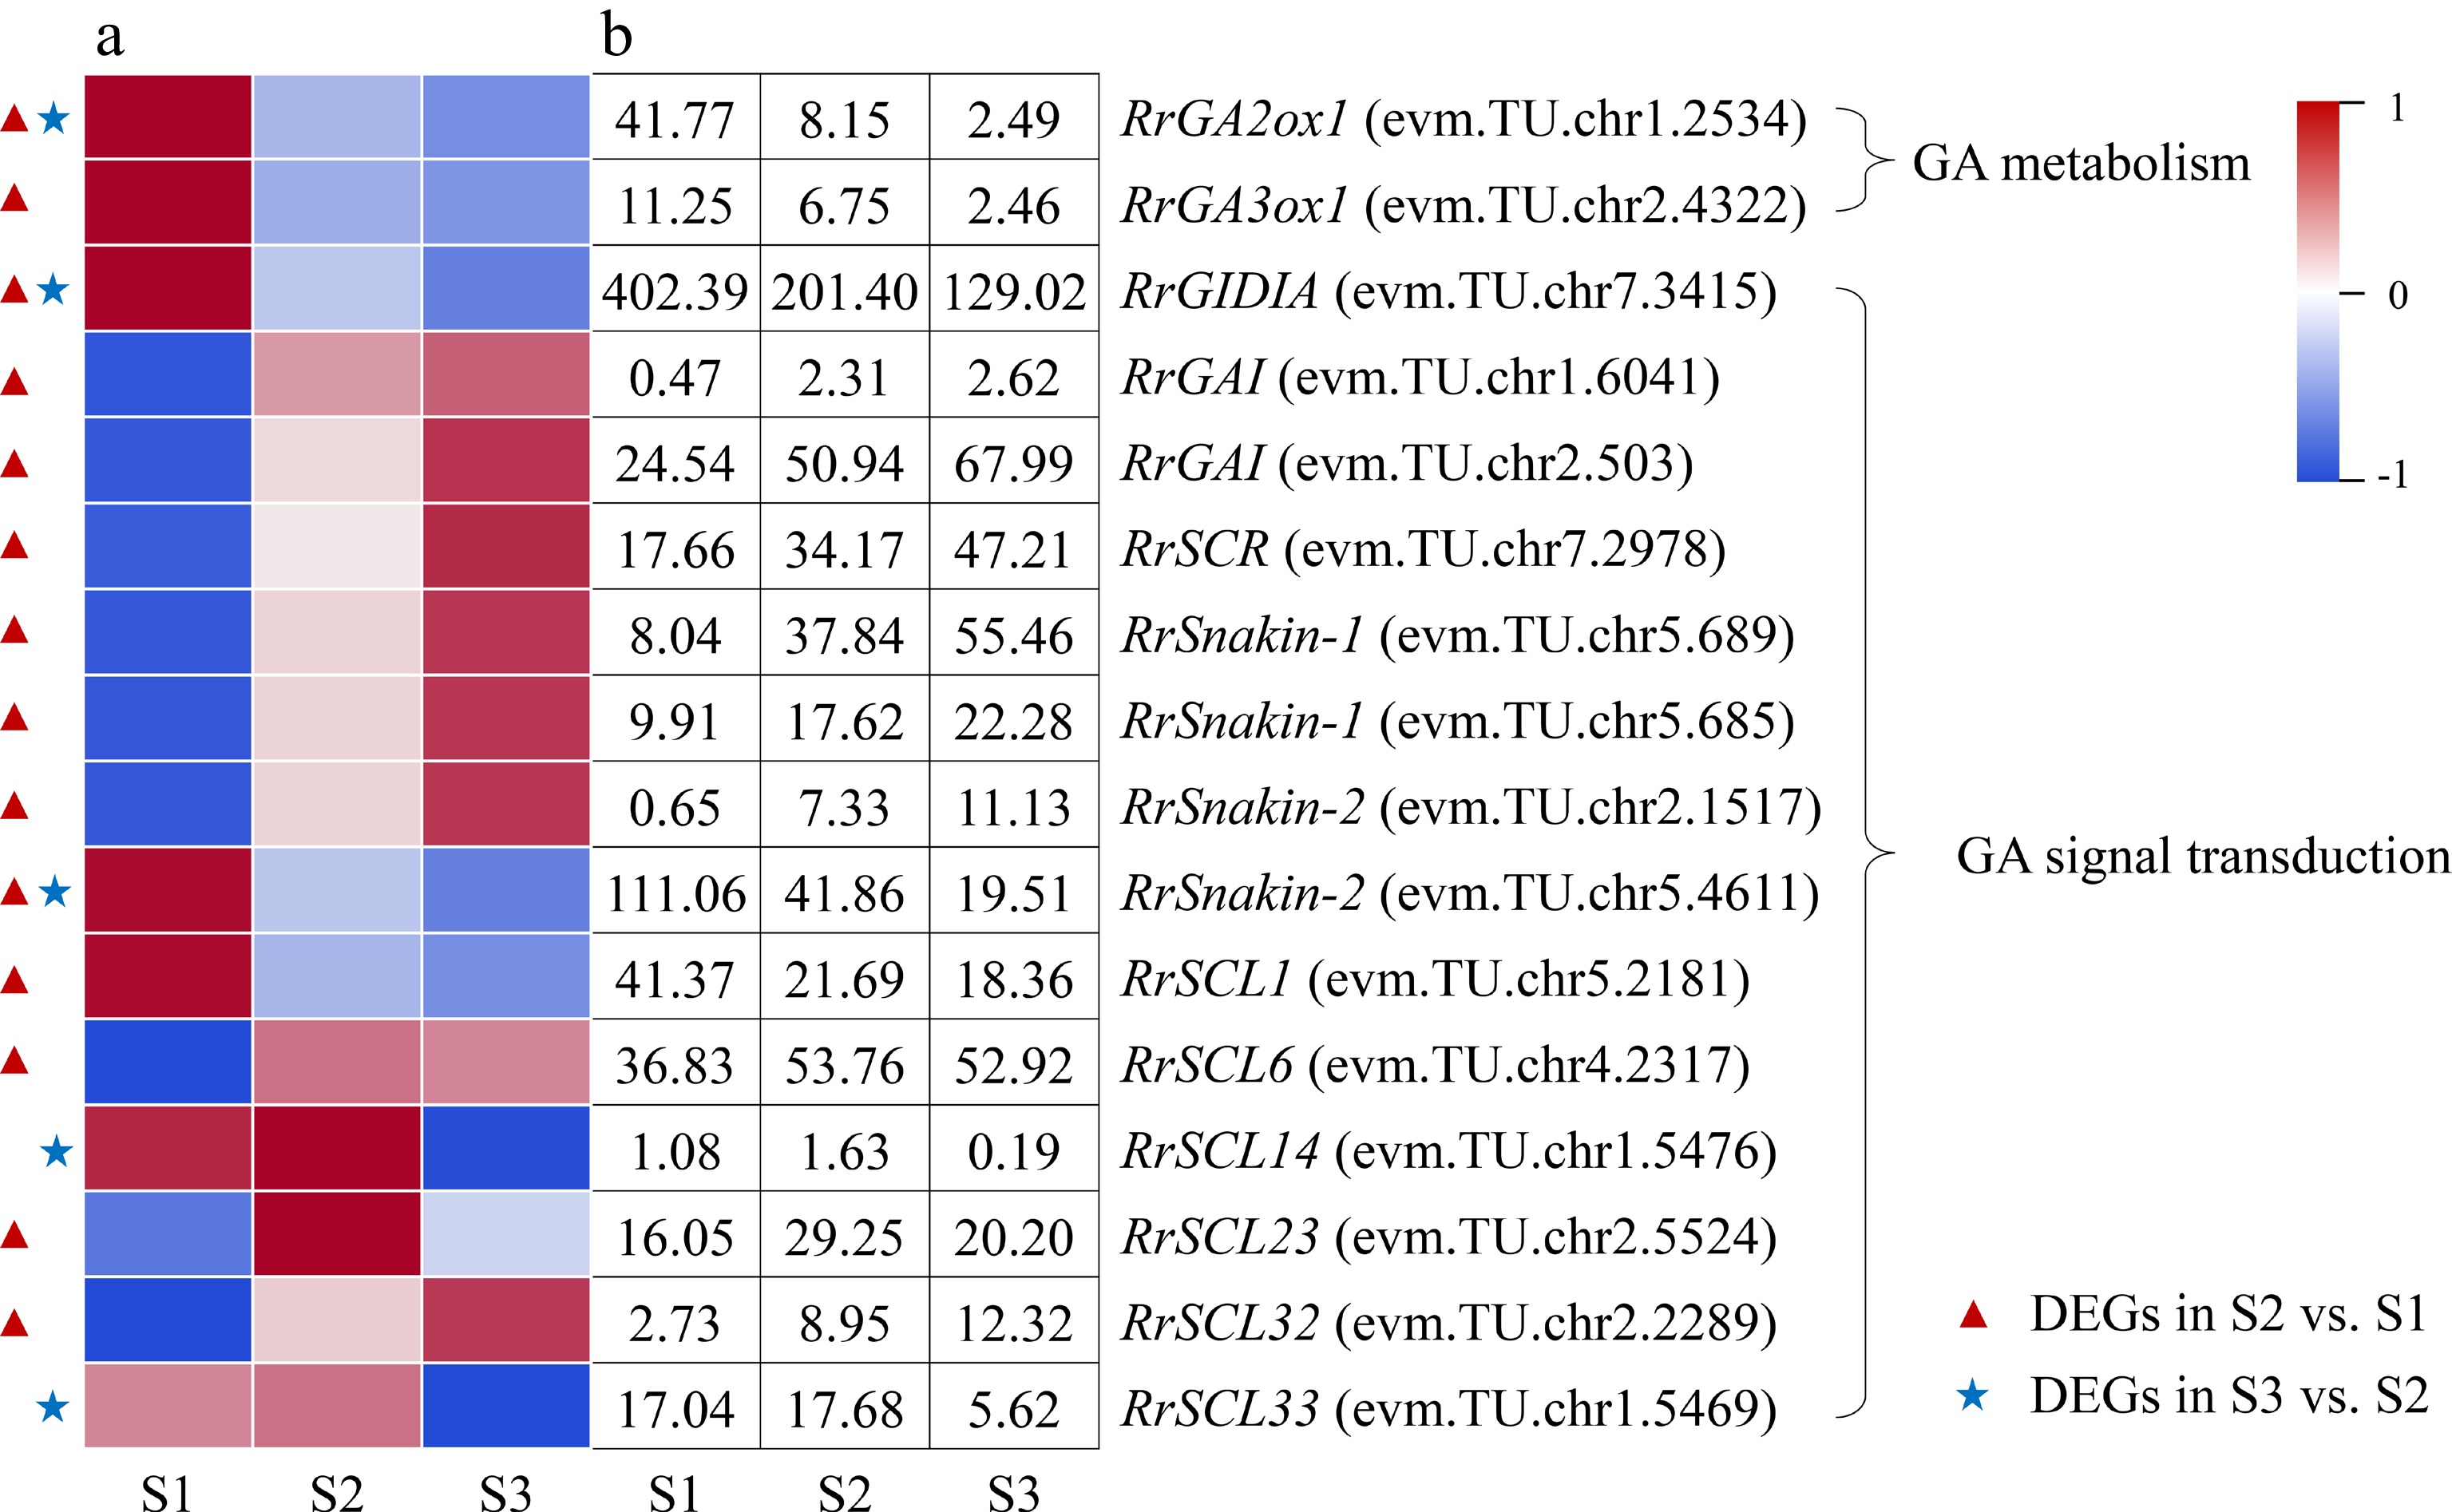
      Figure 7. 

      Expression of GA-related DEGs. (a) The expression heat map of DEGs. (b) The FPKM values of DEGs. GA2ox1: Gibberellin 2-beta-dioxygenase 1; GA3ox1: Gibberellin 3-oxidase 1; GAI: GA insensitive protein; GID1A: GA insensitive dwarf 1 protein; SCL: Scarecrow-like protein; SCR: Scarecrow protein

    • A total of seven DEGs associated with photoperiod were annotated during the flowering transition process of R. rugosa 'Duoji Huangmei', of which five and three DEGs were found in the combination of S2 vs S1 and S3 vs S2, respectively (Fig. 8). Four of the five DEGs in the combination of S2 vs S1, i.e., RrBBX21 (evm.TU.chr2.4992), RrCOL2 (evm.TU.chr3.5220), RrCOL4 (evm.TU.chr1.3253), and RrCOL16 (evm.TU.chr6.1098) showed down-regulated expression trends, and one DEG (RrCOP1: evm.TU.chr2.4992) had an up-regulated expression pattern. One of the three DEGs in the combination of S3 vs S2, RrCOP1 (evm.TU.chr1.6863), had an up-regulated expression trend, while the other three DEGs showed down-regulated expression sharply. In addition, two DEGs involved in vernalization (RrVRN1: evm.TU.chr3.5381; RrVIN3: evm.TU.chr4.4724) were identified, which only presented in the combination of S2 vs S1 and showed up-regulated expression. It must be mentioned that the florigen gene FT is a critical regulator in the flowering transition of plants. One RrFT gene was annotated in this study, i.e., evm.TU.chr6.761, whose expression level presented an up-down trend during the flowering transition process.
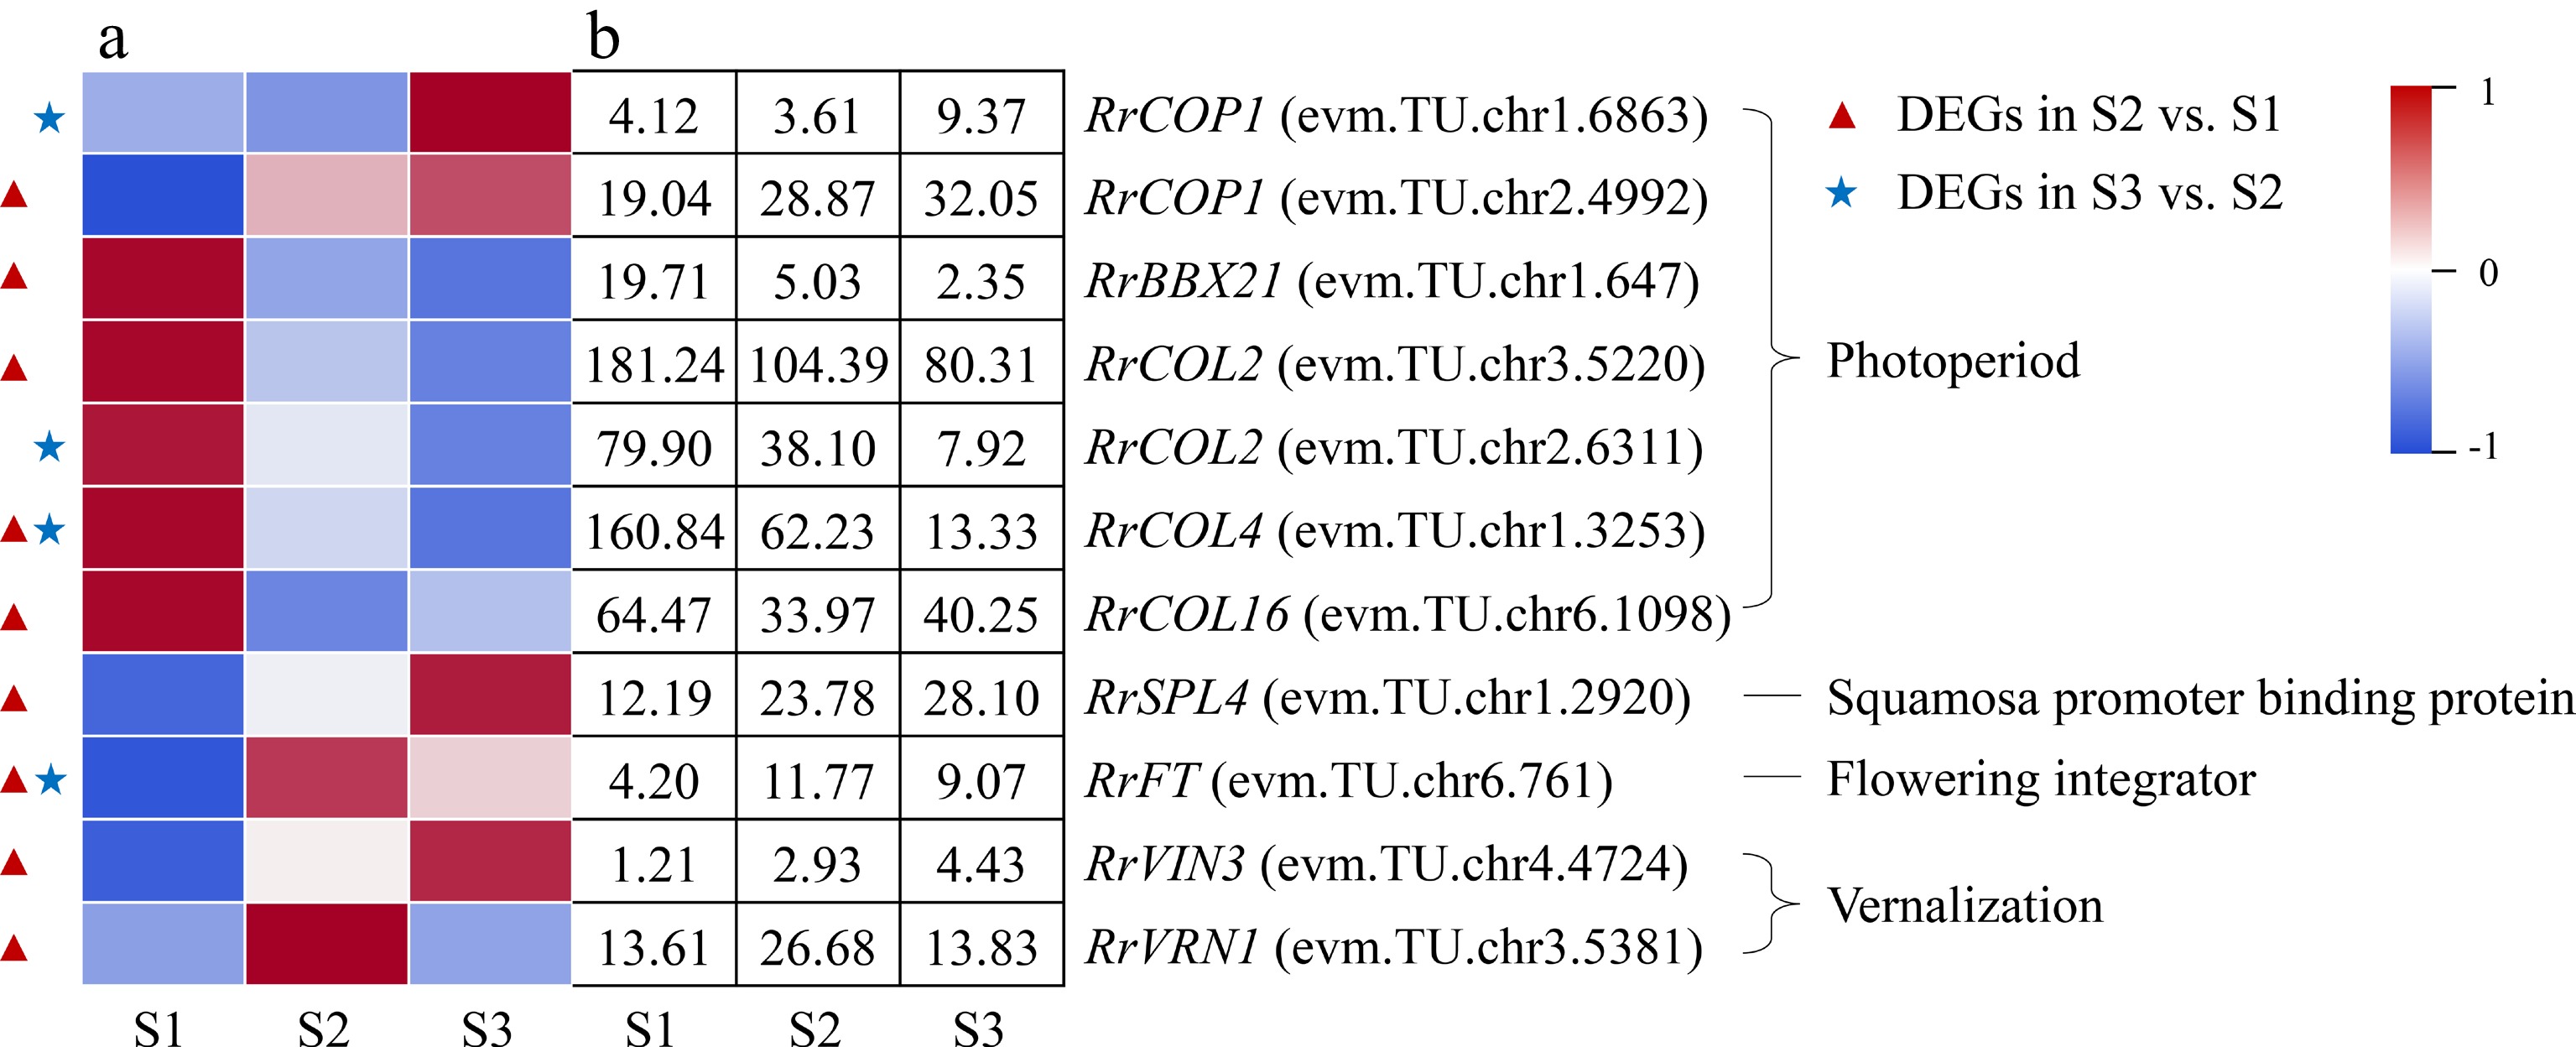
      Figure 8. 

      Expression of photoperiod- and vernalization-related DEGs. (a) The expression heat map of DEGs. (b) The FPKM values of DEGs. BBX21: B-box 21; CO: CONSTANS; COL: CONSTANS-like; COP1: Constitutive Photomorphogenesis 1; FLC: Flowering Locus C; FT: Flowering locus T protein; SPL4: Squamosa promoter-binding-like protein 4;VIN3: Vernalization insensitive protein 3; VRN1: Vernalization protein 1

    • In this experiment, a total of 12 genes related to the starch and sucrose metabolism (RrSUT14, RrTPP, RrTPS), IAA metabolism and signal transduction (RrYUCCA2, RrAUX1), GA metabolism and signal transduction (RrGA2ox1, RrGID1A), ABA metabolism and signal transduction (RrPYR1, RrPP2C16, RrABF), photoperiod (RrCOL4), and the florigen gene RrFT were selected for qRT-PCR verification. As shown in Fig. 9, the expression trends of these genes were similar to those of transcriptome sequencing, and the correlation coefficients were all greater than 0.87. The results showed that the RNA-seq data were accurate and reliable.
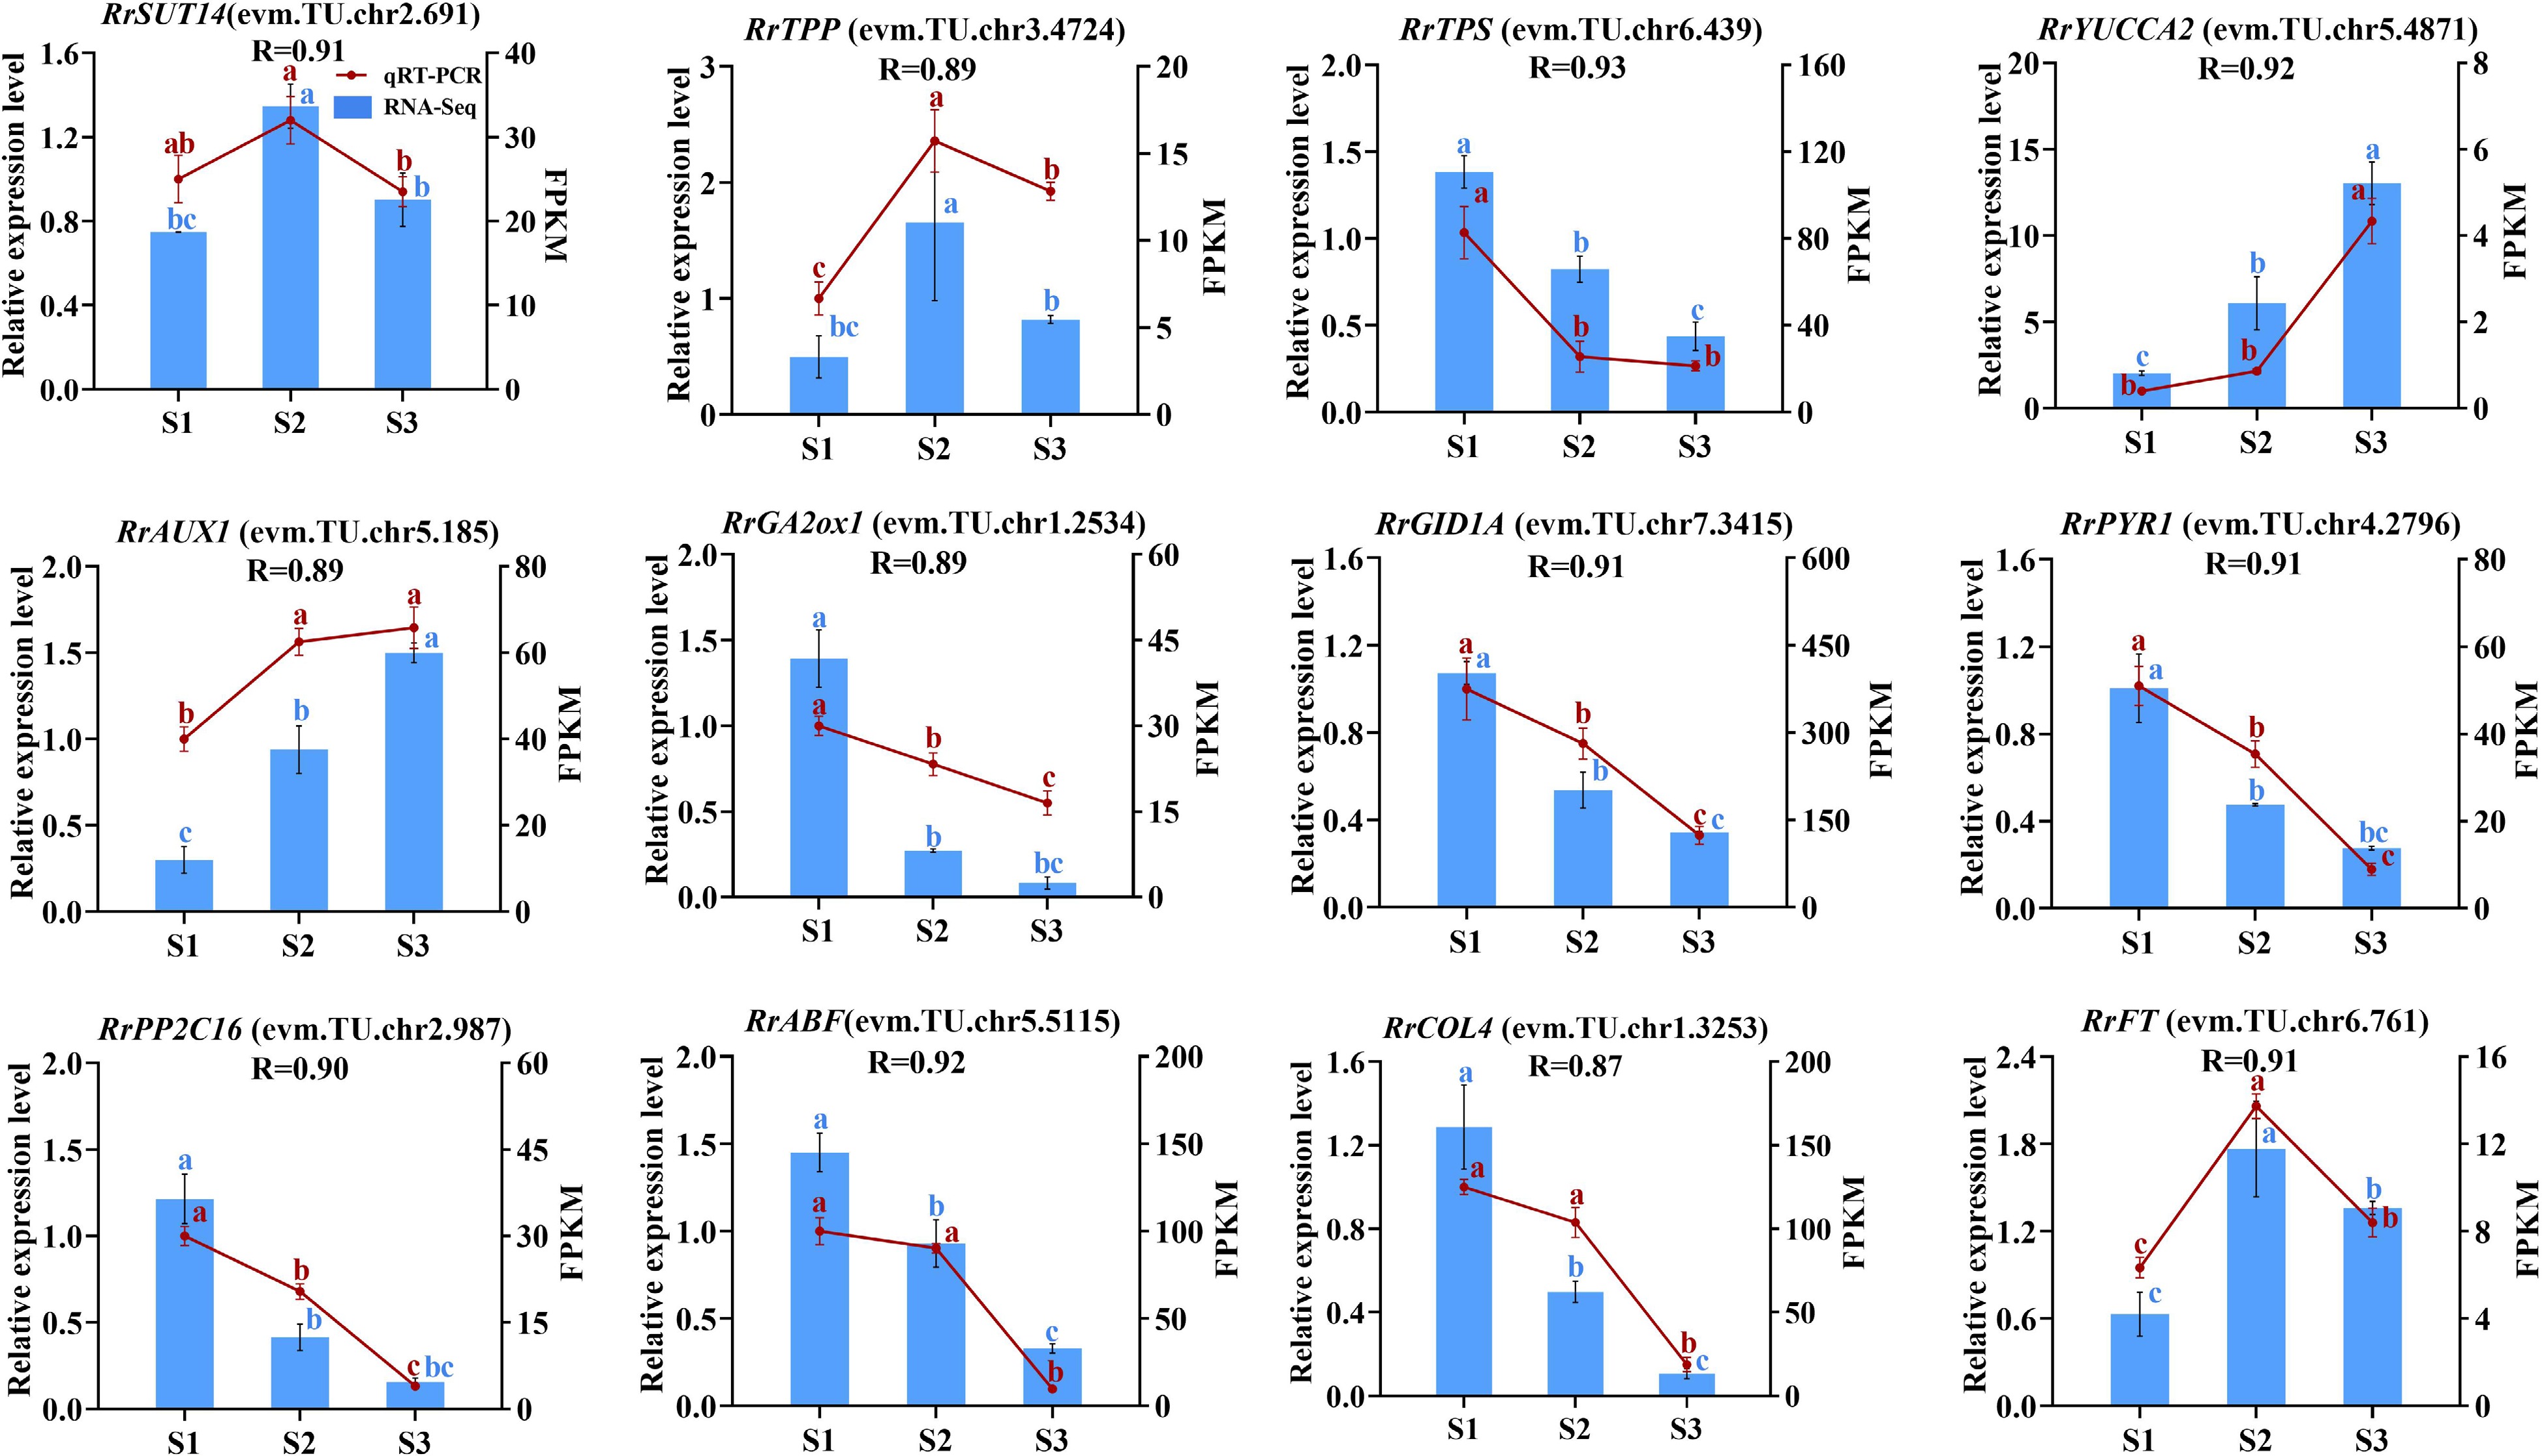
      Figure 9. 

      The correlation of 12 genes between RNA-seq and qRT-PCR data. Letters on the error line indicate significant differences. The different lower case letters for each expression level indicated significant difference between germplasms at ɑ = 0.05.

    • In higher plants, sugar and starch play roles as both energy substances and flowering signals to regulate the floral transition process[18]. The content of sugar and starch both presented up-down or continuous increased trends during flowering transition process[19, 20], which predicted that the accumulation of sugar and starch probably can promote early phase of flowering transition in plants. In this study, we found that the content of sugar and starch both showed up-down patterns (Fig. 2a, b), consisted with the expression patterns of most related DEGs showng up-regulated in the combination of S2 vs S1 (Fig. 4). In addition, three DEGs (RrSWEET2: evm.TU.chr1.1329; RrSUT10: evm.TU.chr5.1003; RrSUT14: evm.TU.chr2.691) involved in sugar transport presented up-regulated expression in the combination of S2 vs S1. Previous studies showed that over expression of MdSUT2 and SWEET10 in A. thaliana resulted in early flowering, and the flowering transition of pSuT mutants was delayed significantly[2123]. Accordingly, we speculated that the flowering transition process from S1 to S2 in R. rugosa was promoted by the co-expression of three DEGs involved in sugar transport and ten DEGs related to sugar and starch metabolism, such as RrSUS2 (evm.TU.chr6.2995), RrglgC (evm.TU.chr2.5621), RrTPS (evm.TU.chr6.439), etc. In addition, the expression of all nine DEGs were downward trends in the combination of S3 vs S2, including three sugar transport-related genes (RrSWEET9: evm.TU.chr5.3601; RrSUT7: evm.TU.chr2.178; RrSUT14: evm.TU.chr2.691) and six sugar and starch metabolism-related genes (RrTPS: evm.TU.chr6.439; RrTPP: evm.TU.chr3.4724; RrSS1: evm.TU.chr3.5192; RrBAM1: evm.TU.chr6.4354; RrBAM3: evm.TU.chr4.2621; RrBAM3: evm.TU.chr5.2267). This indicated that the flowering transition process from S2 to S3 may not require large amounts of sugar and starch. Previous studies showed that the expression of genes related to sugar and starch metabolism also gradually increases during the flowering transition process in Malus domestica and Fragaria × ananassa. This indicated that Rosaceae plants may regulate the flowering transition process by accumulating sufficient sugars and starch[24, 25].

    • For most plants, the content of IAA presented continuous increased or up-down trends during flowering transition process and exogenous IAA treatment can promote or restrain plant flowering transition[12, 26]. In this study, the content of IAA increased continually during the floral transition process (Fig. 2c). Relevant studies also indicated that IAA content also continued to increase during the flowering transition in R. odorata var. gigantea and Crocus sativus[27, 28]. And only one DEG involved in IAA biosynthesis, RrYUCCA2 (evm.TU.chr5.4871), was identified and its expression level presented continually increased trend during the whole flowering transition process, which was consistent with the change in the content of IAA (Fig. 5). IAA was synthesized in the cytoplasm, but its content in cells was determined by multiple IAA transporters, such as PINs, AUX1/LAXs, and ABCBs, etc[29]. In this study, the expression levels of one output transport DEG (RrPIN1: evm.TU.chr4.173) and two input transport DEGs (RrAUX1: evm.TU.chr5.185; RrAUX1: evm.TU.chr7.2659) increased in the combination of S2 vs S1. Accordingly, we speculated that the increased expression levels of RrPIN1 and RrAUX1 may induce the spatiotemporal variation of IAA content in cells and then affect the expression of IAA responsive genes in IAA signal transduction pathway. IAA signal transduction pathway was consisted of IAA receptor (TIR1/AFB), transcriptional repressor (AUX/IAA), IAA response factor (ARF) and downstream target genes[30]. In this study, the expression of IAA receptor gene RrTIR1 (evm.TU.chr4.4951) was up-regulated in the combination of S2 vs S1, which was probably promoted by the change of IAA content. Subsequently, three transcriptional repressor DEGs with differential expressions (RrIAA13: evm.TU.chr6.4429; RrIAA16: evm.TU.chr7.3988; RrIAA17: evm.TU.chr4.5430) transduced IAA signals to RrSAUR32 (evm.TU.chr3.3449), RrSAUR76 (evm.TU.chr2.1179), RrSAUR78 (evm.TU.chr2.5004), and RrGH3.6 (evm.TU.chr1.3329) via non-differential expressed IAA response gene RrARF during the early stage of flowering transition.

      Taken together, the changes of IAA content during flowering transition of many plants have a strong regularity, which indicates that IAA may be closely related to flowering transition. Many genes involved in IAA metabolism, transport and signal transduction pathways have also been identified, but have not been proved to directly affect the flowering transition process. Therefore, the effect of IAA-related genes on flowering transition is worthy of further study.

    • Relevant studies have shown that the content of ABA presented down-up trends during the floral transition process and exogenous ABA treatment can restrain plant flowering transition in most plants[31]. In this study, we found that the ABA content decreased 62.08% from S1 to S2 and then kept a gentle up trend to S3 (Fig. 2d), which was consistent with many Rosaceae plants, such as R. odorata var. gigantea and Prunus avium[27, 32]. Furthermore, the expression levels of two ABA synthesis-related genes (RrNECD3: evm.TU.chr1.2533; RrAO2: evm.TU.chr4.1894) decreased significantly and exhibited no significant difference in the combination of S2 vs S1 and S3 vs S2, respectively, which was consistent with the change of ABA content (Fig. 6). Subsequently, ABA signals were transducted via PYR/PYL/RCAR-PP2C-SnRK2 pathway to activate downstream targets such as transcription factors and ion channels, triggering an ABA response[33]. In this study, we found that the expression trends of most DEGs involved in the PYR/PYL/RCAR-PP2C-SnRK2 signal transduction pathway were consistent with ABA content. Up to now, no other genes involved to PYR/PYL/RCAR-PP2C-SnRK2 signal transduction pathway have been proved to directly affect the flowering transition process, except of BrABF3 in Brassica rapa var. chinensis which promotes flowering through the direct activation of CO transcription[34]. Related studies indicated a potential regulatory role for ABA signalling in the flowering time of Eriobotya japonica[35]. Therefore, direct evidence is needed to prove that ABA content and genes related to ABA metabolism and signal transduction have direct impact on flowering transition of R. rugosa.

    • The total GA content presented down-up or up-down trends during flowering transition process in different plants and exogenous GA treatment can regulate plant flowering transition[28, 36]. In this study, total GA content showed the lowest level at S2 (Fig. 2h), which was consistent with the results in Phalaenopsis aphrodite and Nelumbo nucifera[37,38]. However, GA content showed a decreasing trend during the flowering transition in some Rosaceae plants[3940]. It was noteworthy that GA3 content presented a similar trend to total GA content (Fig. 2f), and we found that exogenous GA3 treatment of different concentrations demonstrated significant effect on flowering transition of R. rugosa (in process), which indicated that GA3 played an important role in GA effect on the flowering transition of R. rugosa.

      Moreover, GA3ox catalyzes the production of active GA, while GA2ox catalyzes the conversion of active GA into inactive GA[41]. In this study, the down-regulated expression of RrGA3ox1 (evm.TU.chr2.4322) may induce the decrease of GA content from S1 to S2, and the down-regulated expression of RrGA2ox1 (evm.TU.chr1.2534) perhaps increased the GA content in the combine of S3 vs S2 (Fig. 7). Previous studies showed that GA content can affect the content of DELLA protein, which in turn led to changes in the expression of related genes inhibited or promoted by DELLA, showing GA signal response and regulating plant flowering transition finally[42]. In this study, there were 11 and four DEGs related to GA signal transduction in the combination of S2 vs S1 and S3 vs S2, respectively, which indicated that GA signal transduction were more complicated in the early stage of flowering transformation of R. rugosa. We speculated that the reduction in total GA content and the down-regulated expression of one GA receptor protein gene (RrGID1A: evm.TU.chr7.3415) increased the content of DELLA protein by promoting the expression of three DELLA family genes (RrGAI: evm.TU.chr1.6041; RrGAI: evm.TU.chr2.503; RrSCR: evm.TU.chr7.2978). After that, DELLA protein promoted the expression of four SCL family genes (RrSCL1: evm.TU.chr5.2181; RrSCL6: evm.TU.chr4.2317; RrSCL23: evm.TU.chr2.5524; RrSCL32: evm.TU.chr2.2289) and inhibited the expression of one GASA family gene (RrSnakin-2: evm.TU.chr5.4611) from S1 to S2.

    • Photoperiod induces floral transition in plants by the changes in circadian rhythms. CO is an important element of the plant photoperiod regulatory pathway, which integrates light and circadian clock signals and delivers them to the flowering integron FT to regulate plant flowering transition[43]. However, CO family genes play diversified roles, namely promoting, inhibiting, or no effect on flowering transition[44, 45]. COP1 promotes CO degradation at the post-transcriptional level[46]. In this study, the up-regulated expression of two COP1 genes (evm.TU.chr2.4992; evm.TU.chr1.6863) and the down-regulated expression of four COL genes (evm.TU.chr3.5220; evm.TU.chr1.3253; evm.TU.chr6.1098; evm.TU.chr2.6311) may cause a continuous decrease in CO protein content during flowering transition process, which suggested that CO protein acted as an inhibitor to the flowering transition in R. rugosa.

      Temperature is an important factor affecting plant flowering, and most plants require a certain period of low-temperature induction before flowering, namely vernalization. The VRN gene play an important role during the vernalization process, which can inhibit the expression of FLC, an essential gene in the vernalization pathway, thereby promote flowering[47]. In this study, there was no DEG related to vernalization in the combination of S3 vs S2, which suggested that vernalization only acts at the early stage of flowering transition of R. rugosa. In the combination of S2 vs S1, the expression of both RrVRN1 (evm.TU.chr3.5381) and RrVIN3 (evm.TU.chr4.4724) showed up-regulated trends, but the expression of RrFLC genes were not detected. It was indicated that RrVRN1 (evm.TU.chr3.5381) perhaps affected the flowering transition of R. rugosa by promoting directly the expression of RrFT (evm.TU.chr6.761), which was consistent with Triticum aestivum[48].

    • The regulatory network of flowering transition in higher plants is complex and comprehensive with the effect of many factors. The sugar and starch can both provide energy and act as a flowering signal to regulate the flowering transition pathway. IAA, ABA and GA can regulate the flowering transition both independently and in interaction with each other. Relevant studies indicated that the expression of TPS is induced by ABA[49]. In combination with the dynamic changes of ABA, the continuous decrease of RrTPS expression level may be influenced by ABA content. Trehalose-6-phosphate(T6P) can act as a flowering signal to indirectly activate the expression of SPL, and then SPL indirectly activates the expression of FT[50]. The expression of RrSPL and RrFT were up-regulated from S1 to S2, which indicated that there may be a positive regulatory relationship among T6P, RrSPL, and RrFT. The IAA-inducible protein SAUR inhibits the activity of PP2C-type protein phosphatase to regulate the plant growth and development process, which makes IAA to interact with ABA to regulate flowering transition in plants[51]. Up-regulated expression of RrSAUR and down-regulated expression of RrPP2C from S1 to S2 indicated that RrPP2C perhaps was negatively regulated by RrSAUR. The interaction between IAA and ABA is also reflected in the regulatory role of ARF on ABF. ARF can regulate downstream IAA-responsive genes and can regulate the expression of ABF in the ABA signaling transduction pathway, which in turn affects ABA signaling[52]. The expression trends of RrARF and RrABF were consistent during the flowering transition in R. rugosa, suggesting that down-regulation of RrARF expression drives down-regulation of RrABF expression. DELLA can bind directly to CO through its CCT structural domain and prevent CO from binding to the FT promoter[42]. BBX21 can interact with COP1 to regulate plant photomorphogenesis[53]. From S1 to S2, RrDELLA and RrCOP1 were up-regulated in expression, and RrCO was down-regulated in expression, which indicated that RrCO may be repressed by RrCOP1 and RrDELLA. In A. thaliana, VRN1 and VIN3 are involved in suppressing the negative regulation of FT by FLC. However, RrFLC with any expression levels in this study was not detected, which may be induced by suppression of RrVRN1 and RrVRN3 to RrFLC. Related studies indicated that VRN1 can act directly with FT[48]. The expression trends of RrVRN1 and RrFT were consistent from S1 to S2, indicating that the up-regulated expression of RrFT is due to the direct effect of RrVRN1. In addition, RrFT can integrate signals from multiple pathways, such as starch and sugar metabolism, vernalization and photoperiodic, to regulate the flowering transition of R. rugosa as a central gene.

      Based on the above results and previous research results, we constructed a hypothetical gene regulatory network map of flowering transition in R. rugosa 'Duoji Huangmei' (Fig. 10). In the network map, we proposed that 74 DEGs related to starch and sucrose (RrSUT7/10/14, RrSWEET2/9, RrSUS2, RrglgC, RrSS1/3, RrGBSS1, RrGBE3, RrBAM1,RrBAM3, RrINV1, RrTPS, RrTPP), IAA (RrYUCCA2, RrPIN1, RrAUX1, RrTIR1, RrIAA13/16/17, RrSAUR32/76/78, GH3.1/3.6), ABA (RrNECD3, RrAO2, RrPYR1, RrPYL4, RrPP2C3/8/16/29/33/34/40, RrSnRK2, RrABF), GA (RrGA2ox1, RrGA3ox1, RrGID1A, RrGAI, RrSCR, Rrsnakin-1/2, RrSCL1/6/23/32/33), photoperiod (RrBBX21, RrCOL2/4/16, RrCOP1), and vernalization (RrVRV1, RrVIN3) did not act independently but interact with each other to regulate flowering transition of R. rugosa. Moreover, we found that more DEGs presented in the combination of S2 vs S1 compared with the combination of S3 vs S2. Accordingly, we speculated that the gene regulatory network from S1 to S2 was more complicated during flowering transition of R. rugosa.
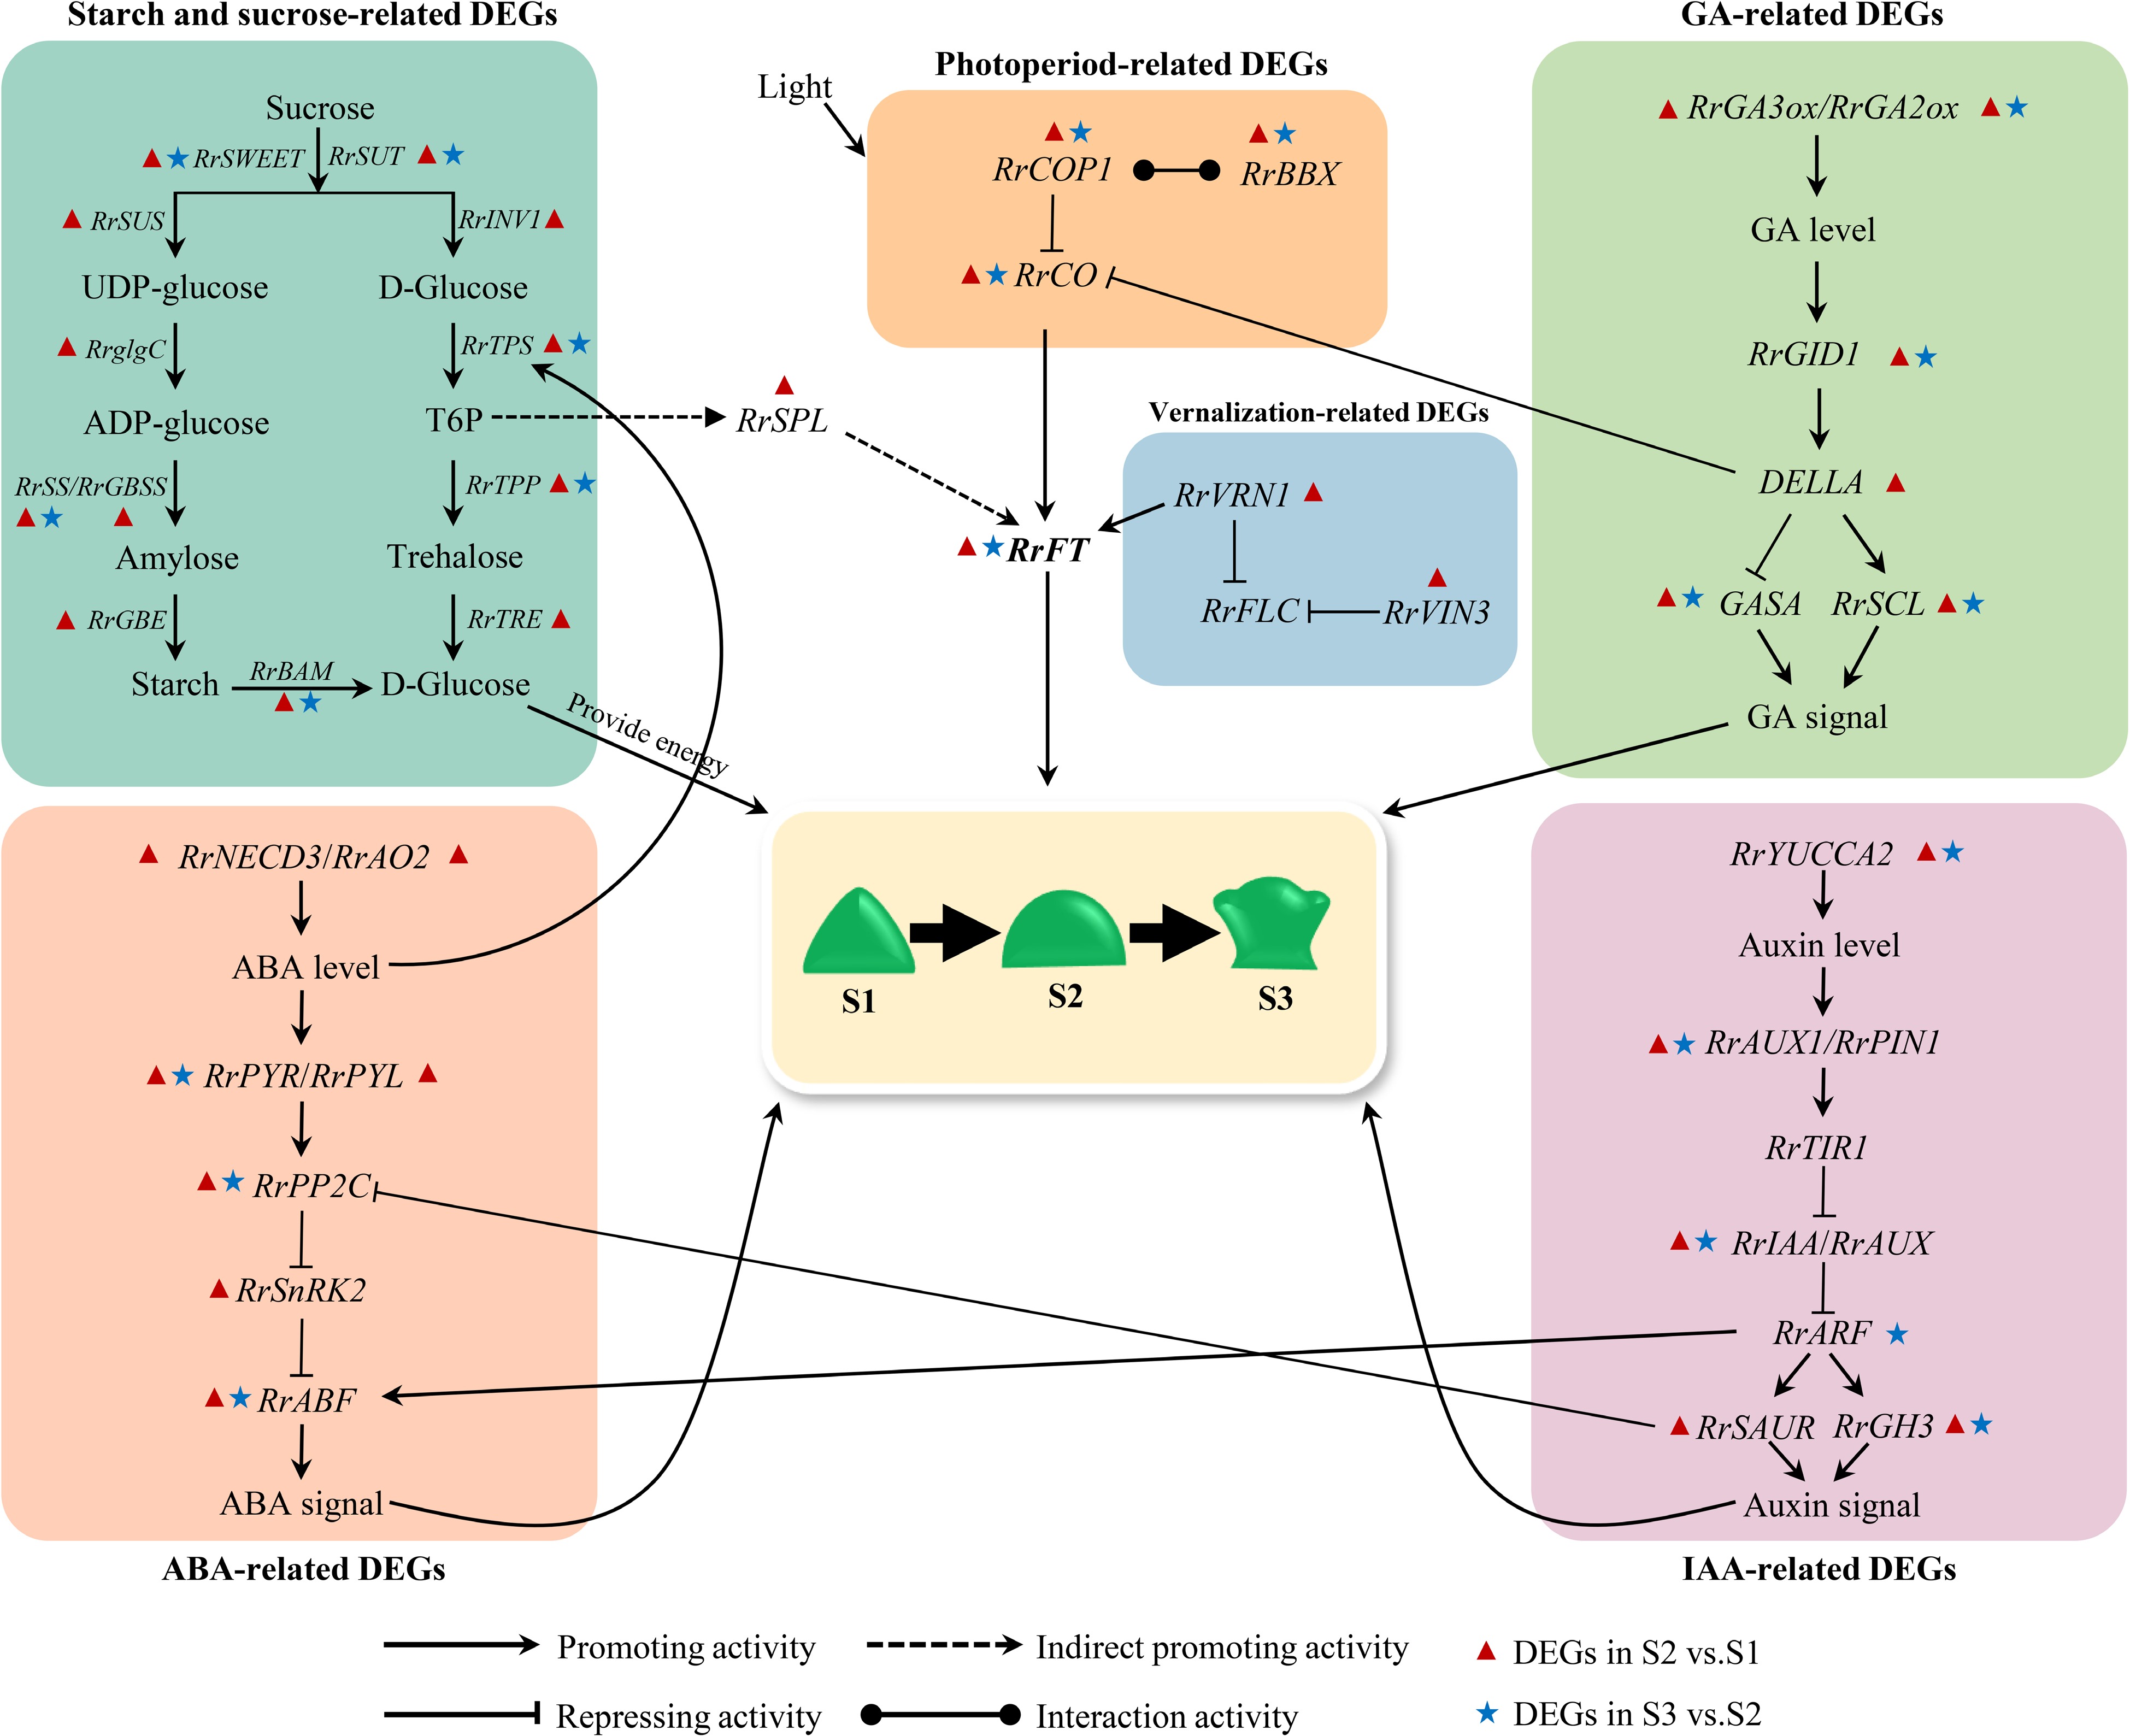
      Figure 10. 

      Hypothetical model for the gene regulatory network of flowering transition in R. rugosa.

      • This project was funded by the Shandong Agricultural Seeds Engineering Project (2020LZGC011) and the National Science Foundation of China (NSFC) (31870688).

      • The authors declare that they have no conflict of interest.

      • # These authors contributed equally: Xiaobin Wang, Fei Zhao

      • Copyright: © 2023 by the author(s). Published by Maximum Academic Press, Fayetteville, GA. This article is an open access article distributed under Creative Commons Attribution License (CC BY 4.0), visit https://creativecommons.org/licenses/by/4.0/.
    Figure (10)  References (53)
  • About this article
    Cite this article
    Wang X, Zhao F, Wu Q, Xing S, Yu Y, et al. 2023. Physiological and transcriptome analyses to infer regulatory networks in flowering transition of Rosa rugosa. Ornamental Plant Research 3:4 doi: 10.48130/OPR-2023-0004
    Wang X, Zhao F, Wu Q, Xing S, Yu Y, et al. 2023. Physiological and transcriptome analyses to infer regulatory networks in flowering transition of Rosa rugosa. Ornamental Plant Research 3:4 doi: 10.48130/OPR-2023-0004

Catalog

  • About this article

/

DownLoad:  Full-Size Img  PowerPoint
Return
Return