ARTICLE   Open Access    

Effect of reduced nitrogen fertilizer application combined with biochar on nitrogen utilization of flue-cured tobacco and its association with functional gene expressions of the nitrogen cycle in rhizosphere soil

More Information
  • Studies have shed light on the impact of the co-application of inorganic fertilizer and biochar on soil fertility, health, and crop growth performance and yield. However, insufficient literature exists regarding the appropriate nitrogen reduction ratio for enhancing soil quality and maximizing crop nitrogen utilization following the application of biochar in a continuous tobacco-rice rotation field. Here, we explored nitrogen absorption and utilization patterns of tobacco crops, as well as the response characteristics of functional genes related to soil nitrogen cycling subjected to the interaction of reduced nitrogen utilization ratios following biochar application in a long-term tobacco-rice rotation field. The results showed that the treatments with 10% (T2) and 20% (T3) nitrogen reduction combined with biochar (30 t∙ha−1) promoted nitrogen utilization efficiency and nitrogen harvest index of tobacco plants. In the second year of the experiment, T2 and T3 significantly increased the nitrogen harvest index by 3.85% and 5.78% compared with the conventional nitrogen application treatment (T1), respectively. We believe that the increase in abundance of nitrification, nitrogen fixation, and ammonification genes, including nxrA, nifH, and UreC in the rhizosphere soil, precipitate the high nitrogen absorption and utilization efficiency in the biochar combined with nitrogen reduction treatments, respectively. This suggests that biochar application at a rate of 30 t·ha−1, nitrogen fertilizer usage can be reduced by 10% and 20% to achieve optimal and sustainable tobacco production.
  • In a recent report on Latin America's next petroleum boom, The Economist refers to the current and future situation in oil producing countries in the region. In the case of Argentina, the increase in oil and gas output 'have led to an increase in production in Vaca Muerta, a mammoth field in Argentina's far west. It holds the world's second-largest shale gas deposits and its fourth-largest shale oil reserves… Rystad Energy expects shell-oil production in Argentina will more than double by the end of the decade, to over a million barrels per day'[1].

    Oil production in Argentina is currently dominated by three Patagonian areas: Neuquén, San Jorge, and Austral. Based on 2021 information, 49% of oil reserves of Argentina are located in Neuquén, whereas San Jorge has 46%. Neuquén is also the largest source of oil (57%) and gas (37%) in the country. According to 2018 data, conventional oil produced in Argentina amounts to 87%, whereas non-conventional, shale production represents 13%; however, non-conventional oil is increasing due to Vaca Muerta shale oil exploitation.

    This increase of production in the Patagonian fields requires the use of a large fluid storage capacity by means of vertical oil storage tanks having different sizes and configurations. Tanks are required to store not just oil but also water. The exploitation of nonconventional reservoirs, such as Vaca Muerta, involves massive water storage to carry out hydraulic stimulation in low-permeability fields, and for managing the return fluid and production water at different stages of the process (storage, treatment, and final disposal).

    Storage tanks in the oil industry are large steel structures; they may have different sizes, and also different shell configurations, such as vertical cylinders with a fixed roof or with a floating roof and opened at the top[2]. It is now clear that such oil infrastructure is vulnerable to accidents caused by extreme weather events[35].

    Data from emergencies occurring in oil fields shows that accidents due to regional winds, with wind speed between 150 and 240 km/h, may cause severe tank damage. Seismic activity in the region, on the other hand, is of less concern to tank designers in Patagonia.

    Damage and failure mechanisms of these tanks largely depend on tank size and configuration, and their structural response should be considered from the perspective of shell mechanics and their consequences. In a report on damage observed in tanks following hurricanes Katrina and Rita in 2005[6,7], several types of damage were identified. The most common damage initiation process is due to shell buckling[811], which may progress into plasticity at higher wind speeds. In open-top tanks, a floating roof does not properly slide on a buckled cylindrical shell, and this situation may lead to different failure mechanisms. Further, damage and loss of integrity have the potential to induce oil spills, with direct consequences of soil contamination and also of fire initiation.

    Concern about an emergency caused by such wind-induced hazards involves several stakeholders, because the consequences may affect the operation of oil plants, the local and regional economies, the safety of the population living in the area of a refinery or storage farm, and the environment[6]. In view of the importance of preserving the shell integrity and avoiding tank damage, there is a need to evaluate risk of existing tanks at a regional level, such as in the Neuquén and San Jorge areas. This information may help decision makers in adopting strategies (such as structural reinforcement of tanks to withstand expected wind loads) or post-event actions (like damaged infrastructure repair or replacement).

    The studies leading to the evaluation of risk in the oil infrastructure are known as vulnerability studies, and the most common techniques currently used are fragility curves[12]. These curves evaluate the probability of reaching or exceeding a given damage level as a function of a load parameter (such as wind speed in this case).

    Early studies in the field of fragility of tanks were published[13] from post-event earthquake damage observations. Studies based on computational simulation of tank behavior under seismic loads were reported[14]. The Federal Emergency Management Administration in the US developed fragility curves for tanks under seismic loads for regions in the United States, and more recently, this has been extended to hurricane and flood events in coastal areas[15]. Seismic fragility in Europe has been reviewed by Pitilakis et al.[16], in which general concepts of fragility are discussed. Bernier & Padgett[17] evaluated the failure of tanks due to hurricane Harvey using data from aerial images and government databases. Fragility curves were developed based on finite element analyses and damage of the tank population was identified in the Houston Ship Channel. Flood and wind due to hurricane Harvey were also considered[18] to develop fragility curves.

    Because fragility curves for tanks under wind depend on the wind source (either hurricane or regional winds), and the type and size of tanks identified in a region, fragility curves developed for one area are not possible to be directly used in other areas under very different inventory and wind conditions.

    This paper addresses problems of shell buckling and loss of integrity of open top tanks, with wind-girders and floating roof and it focuses on the development of fragility curves as a way to estimate damage states under a given wind pressure. The region of interest in this work covers the oil producing areas in Patagonia, Argentina. Damage of tanks under several wind pressures are evaluated by finite element analyses together with methodologies to evaluate the structural stability.

    The construction of fragility curves requires information from the following areas: First, an inventory of tanks to be included in the analysis; second, data about the loads in the region considered; third, data about structural damage, either observed or computed via modeling; and fourth, a statistical model that links damage and load/structure data. This section describes the main features of the tank population considered in the study.

    The construction of an inventory at a regional level is a very complex task, which is largely due to a lack of cooperation from oil companies to share information about their infrastructure. Thus, to understand the type of tanks in an oil producing region, one is left collecting a limited number of structural drawings and aerial photography. A detailed inventory of the Houston Ship Channel was carried out by Bernier et al.[19], who identified 390 floating roof tanks. An inventory for Puerto Rico[20] identified 82 floating roof tanks. Although both inventories used different methodologies and addressed very different tank populations, some common features were found in both cases.

    An alternative strategy to carry out fragility studies is to develop a database using a small number of tanks, for which a detailed structural behavior is investigated using finite element analysis. This is a time-consuming task, but it allows identification of buckling pressures, buckling modes, and shell plasticity. This information serves to build approximate fragility curves, and it can also be used to develop what are known as meta-models, which predict structural damage based on tank/load characteristics. Such meta-models take the form of equations that include the tank geometry and wind speed to estimate damage. Meta-models were used, for example, in the work of Kameshwar & Padgett[18].

    This work employs a simplified strategy, and addresses the first part of the procedure described above. The use of a limited number of tanks in a database, for which a finite element structural analysis is carried out. This leads to fragility curves based on a simplified tank population (reported in this work) and the development of a meta-model together with enhanced fragility results will be reported and compared in a future work.

    Partial information of tanks in the Patagonian region was obtained from government sources, and this was supplemented by aerial photography showing details of tank farms in the region. As a result of that, it was possible to establish ranges of tank dimensions from which an artificial database was constructed.

    The present study is restricted to open-top tanks with a wind girder at the top. They are assumed to have floating roofs, which are designed and fabricated to allow the normal operation of the roof without the need of human intervention. The main characteristics of tanks investigated in this paper, are illustrated in Fig. 1.

    Figure 1.  Geometric characteristics of open-topped oil storage considered in this paper.

    The range of interest in terms of tank diameter D was established between 35 m < D < 60 m. Based on observation of tanks in the region, the ratios D/H were found to be in the range 0.20 < D/H < 0.60, leading to cylinder height H in the range 12 m < H < 20 m. These tanks were next designed using API 650[21] regulations to compute their shell thickness and wind girder dimensions. A variable thickness was adopted in elevation, assuming 3 m height shell courses. The geometries considered are listed in Table 1, with a total of 30 tanks having combinations of five values of H and six values of D. The volume of these tanks range between 55,640 and 272,520 m3.

    Table 1.  Geometry and course thickness of 30 tanks considered in this work.
    H
    (m)
    CoursesThickness t (m)
    D = 35 mD = 40 mD = 45 mD = 50 mD = 55 mD = 60 m
    12V10.0140.0160.0180.0180.0200.022
    V20.0120.0120.0140.0160.0160.018
    V30.0080.0100.0100.0100.0120.012
    V40.0060.0080.0080.0080.0080.008
    14V10.0160.0180.0200.0220.0250.025
    V20.0140.0140.0160.0180.0200.020
    V30.0100.0120.0120.0140.0140.016
    V40.0080.0080.0080.0100.0100.010
    V50.0060.0080.0080.0080.0080.008
    16V10.0180.0200.0220.0250.0280.028
    V20.0160.0180.0180.0200.0220.025
    V30.0120.0140.0160.0160.0180.020
    V40.0100.0100.0120.0120.0140.014
    V50.0060.0080.0080.0080.0080.010
    V60.0060.0080.0080.0080.0080.010
    18V10.0200.0220.0250.0280.0300.032
    V20.0180.0200.0220.0250.0250.028
    V30.0140.0160.0180.0200.0200.022
    V40.0120.0120.0140.0160.0160.018
    V50.0080.0100.0100.0100.0120.012
    V60.0080.0100.0100.0100.0120.012
    20V10.0220.0250.0280.0300.0320.035
    V20.0200.0220.0250.0280.0280.032
    V30.0160.0180.0200.0220.0250.028
    V40.0140.0140.0160.0180.0200.020
    V50.0100.0120.0120.0140.0140.016
    V60.0100.0120.0120.0140.0140.016
    V70.0100.0120.0120.0140.0140.016
     | Show Table
    DownLoad: CSV

    The material assumed in the computations was A36 steel, with modulus of elasticity E = 201 GPa and Poisson's ratio ν = 0.3.

    For each tank, a ring stiffener was designed as established by API 650[21], in order to prevent buckling modes at the top of the tank. The minimum modulus Z to avoid ovalization at the top of the tank is given by

    Z=D2H17(V190)2 (1)

    where V is the wind speed, in this case taken as V = 172.8 km/h for the Patagonian region. Intermediate ring stiffeners were not observed in oil tanks in Patagonia, so they were not included in the present inventory.

    Because a large number of tanks need to be investigated in fragility studies, it is customary to accept some simplifications in modeling the structure to reduce the computational effort. The geometry of a typical ring stiffener at the top is shown in Fig. 2a, as designed by API 650. A simplified version was included in this research in the finite element model, in which the ring stiffener is replaced by an equivalent thickness at the top, as suggested in API Standard 650[21]. This approach has been followed by most researchers in the field. The equivalent model is shown in Fig. 2b.

    Figure 2.  Ring stiffener, (a) design according to API 650, (b) equivalent section[22].

    The pressure distribution due to wind around a short cylindrical shell has been investigated in the past using wind tunnels and computational fluid dynamics, and a summary of results has been included in design regulations.

    There is a vast number of investigations on the pressures in storage tanks due to wind, even if one is limited to isolated tanks, as in the present paper. For a summary of results, see, for example, Godoy[11], and only a couple of studies are mentioned here to illustrate the type of research carried out in various countries. Wind tunnel tests were performed in Australia[23], which have been the basis of most subsequent studies. Recent tests in Japan on small scale open top tanks were reported[24,25]. In China, Lin & Zhao[26] reported tests on fixed roof tanks. CFD models, on the other hand, were computed[27] for open top tanks with an internal floating roof under wind flow. Although there are differences between pressures obtained in different wind tunnels, the results show an overall agreement.

    The largest positive pressures occur in the windward meridian covering an angle between 30° and 45° from windward. Negative pressures (suction), on the other hand, reach a maximum at meridians located between 80° and 90° from windward. An evaluation of US and European design recommendations has been reported[28,29], who also considered the influence of fuel stored in the tank.

    The circumferential variation of pressures is usually written in terms of a cosine Fourier series. The present authors adopted the series coefficients proposed by ASCE regulations[30], following the analytical expression:

    q=λinCicos(iφ) (2)

    in which λ is the amplification factor; the angle φ is measured from the windward meridian; and coefficients Ci represent the contribution of each term in the series. The following coefficients were adopted in this work (ASCE): C0 = −0.2765, C1 = 0.3419, C2 = 0.5418, C3 = 0.3872, C4 = 0.0525, C5 = 0.0771, C6 = −0.0039 and C7 = 0.0341. For short tanks, such as those considered in this paper, previous research reported[31] that for D/H = 0.5 the variation of the pressure coefficients in elevation is small and may be neglected to simplify computations. Thus, the present work assumes a uniform pressure distribution in elevation at each shell meridian.

    In fragility studies, wind speed, rather than wind pressures, are considered, so that the following relation from ASCE is adopted in this work:

    qz=0.613KztKdV2IV=qz0.613KztKdI (3)

    in which I is the importance factor; Kd is the directionality factor; and Kzt is the topographic factor. Values of I = 1.15, Kd = 0.95 and Kzt = 1, were adopted for the computations reported in this paper.

    Because shell buckling was primarily investigated in this work using a bifurcation analysis, the scalar λ was increased in the analysis until the finite element analysis detected a singularity.

    Fragility curves are functions that describe the probability of failure of a structural system (oil tanks in the present case) for a range of loads (wind pressures) to which the system could be exposed. In cases with low uncertainty in the structural capacity and acting loads, fragility curves take the form of a step-function showing a sudden jump (see Fig. 3a). Zero probability occurs before the jump and probability equals to one is assumed after the jump. But in most cases, in which there is uncertainty about the structural capacity to withstand the load, fragility curves form an 'S' shape, as shown in Fig. 3a and b probabilistic study is required to evaluate fragility.

    Figure 3.  Examples of fragility curves, (a) step-function, (b) 'S' shape function.

    The construction of fragility curves is often achieved by use of a log-normal distribution. In this case, the probability of reaching a certain damage level is obtained by use of an exponential function applied to a variable having a normal distribution with mean value μ and standard deviation σ. If a variable x follows a log-normal distribution, then the variable log(x) has a normal distribution, with the following properties:

    • For x < 0, a probability equal to 0 is assigned. Thus, the probability of failure for this range is zero.

    • It can be used for variables that are computed by means of a number of random variables.

    • The expected value in a log-normal distribution is higher than its mean value, thus assigning more importance to large values of failure rates than would be obtained in a normal distribution.

    The probability density function for a log-normal distribution may be written in the form[32]:

    f(xi)=12πσ21xexp[(lnxµ)2/(2σ2)] (4)

    in which f(xi) depends on the load level considered, and is evaluated for a range of interest of variable x; and μ* is the mean value of the logarithm of variable x associated with each damage level. Damage levels xi are given by Eqn (5).

    µ(xi)=1NNn=1ln(xin) (5)

    where the mean value is computed for a damage level xi, corresponding to I = DSi; summation in n extends to the number of tanks considered in the computation of the mean value. Damage levels in this work are evaluated using computational modeling and are defined in the next section. Variance is the discrete variable xi 2), computed from:

    σ2(xi,µ)=1NNn=1(ln(xin)µ)2=1NNn=1ln(xin)2µ2 (6)

    The probability of reaching or exceeding a damage level DSi is computed by the integral of the density function using Eqn (7), for a load level considered (the wind speed in this case):

    P[DS/x]=x=V0x=0f(x)dx (7)

    where V0 is the wind speed at which computations are carried out, and x is represented by wind speed V.

    Various forms of structural damage may occur as a consequence of wind loads, including elastic or plastic deflections, causing deviations from the initial perfect geometry; crack initiation or crack extension; localized or extended plastic material behavior; and structural collapse under extreme conditions. For the tanks considered in this work, there are also operational consequences of structural damage, such as blocking of a floating roof due to buckling under wind loads that are much lower than the collapse load. For this reason, a damage study is interested in several structural consequences but also in questions of normal operation of the infrastructure. Several authors pointed out that there is no direct relation between structural damage and economic losses caused by an interruption of normal operation of the infrastructure.

    Types of damage are usually identified through reconnaissance post-event missions, for example following Hurricanes Katrina and Rita[6,7]. Damage states reported in Godoy[7] include shell buckling, roof buckling, loss of thermal insulation, tank displacement as a rigid body, and failure of tank/pipe connections. These are qualitative studies, in which damage states previously reported in other events are identified and new damage mechanisms are of great interest in order to understand damage and failure modes not taken into account by current design codes.

    In this work, in which interest is restricted to open top tanks having a wind girder at the top, four damage states were explored, as shown in Table 2. Regarding the loss of functionality of a tank, several conditions may occur: (1) No consequences for the normal operation of a tank; (2) Partial loss of operation capacity; (3) Complete loss of operation.

    Table 2.  Damage states under wind for open-top tanks with a wind girder.
    Damage states (DS)Description
    DS0No damage
    DS1Large deflections on the cylindrical shell
    DS2Buckling of the cylindrical shell
    DS3Large deflections on the stiffening ring
     | Show Table
    DownLoad: CSV

    DS1 involves displacements in some area of the cylindrical body of the tank, and this may block the free vertical displacement of the floating roof. Notice that this part of the tank operation is vital to prevent the accumulation of inflammable gases on top of the fluid stored. Blocking of the floating roof may cause a separation between the fuel and the floating roof, which in turn may be the initial cause of fire or explosion.

    DS2 is associated with large shell deflections, which may cause failure of pipe/tank connections. High local stresses may also arise in the support of helicoidal ladders or inspection doors, with the possibility of having oil spills.

    DS3 is identified for a loss of circularity of the wind girder. The consequences include new deflections being transferred to the cylindrical shell in the form of geometrical imperfections.

    In summary, DS1 and DS3 may affect the normal operation of a floating roof due to large shell or wind-girder deflections caused by buckling.

    Tank modeling was carried out in this work using a finite element discretization within the ABAQUS environment[33] using rectangular elements with quadratic interpolation functions and reduced integration (S8R5 in the ABAQUS nomenclature). Two types of shell analysis were performed: Linear Bifurcation Analysis (LBA), and Geometrically Nonlinear Analysis with Imperfections (GNIA). The tank perimeter was divided into equal 0.35 m segments, leading to between 315 and 550 elements around the circumference, depending on tank size. Convergence studies were performed and errors in LBA eigenvalues were found to be lower than 0.1%.

    The aim of an LBA study is to identify a first critical buckling state and buckling mode by means of an eigenvalue problem. The following expression is employed:

    (K0+λCKG)ΦC=0 (8)

    where K0 is the linear stiffness matrix of the system; KG is the load-geometry matrix, which includes the non-linear terms of the kinematic relations; λC is the eigenvalue (buckling load); and ΦC is the critical mode (eigenvector). For a reference wind state, λ is a scalar parameter. One of the consequences of shell buckling is that geometric deviations from a perfect geometry are introduced in the shell, so that, due to imperfection sensitivity, there is a reduced shell capacity for any future events.

    The aim of the GNIA study is to follow a static (non-linear) equilibrium path for increasing load levels. The GNIA study is implemented in this work using the Riks method[34,35], which can follow paths in which the load or the displacement decrease. The geometric imperfection was assumed with the shape of the first eigenvector at the critical state in the LBA study, and the amplitude of the imperfection was defined by means of a scalar ξ [10]. To illustrate this amplitude, for a tank with D = 45 m and H = 12 m, the amplitude of imperfection is equal to half the minimum shell thickness (ξ = 4 mm in this case).

    It was assumed that a damage level DS1 is reached when the displacement amplitudes do not allow the free vertical displacement of the floating roof. Based on information from tanks in the Patagonian region, the limit displacement was taken as 10 mm. This state was detected by GNIA, and the associated load level is identified as λ = λDS1.

    The load at which damage state DS2 occurs was obtained by LBA, leading to a critical load factor λC and a buckling mode. An example of damage levels is shown in Fig. 4.

    Figure 4.  Damage computed for a tank with D = 45 m and H = 12 m. (a) Deflected shape for damage DS1; (b) Equilibrium path for node A (DS1); (c) Deflected shape for damage DS2 (critical mode).

    An LBA study does not account for geometric imperfections. It is well known that the elastic buckling of shells is sensitive to imperfections, so that a reduction in the order of 20% should be expected for cylindrical shells under lateral pressure. This consideration allows to estimate DS0 (a state without damage) as a lower bound of the LBA study. An approach to establish lower bounds for steel storage tanks is the Reduced Stiffness Method (RSM)[3640]. Results for tanks using the RSM to estimate safe loads show that λDS0 = 0.5λDS2 provides a conservative estimate for present purposes.

    DS3 was computed using a linear elastic analysis to evaluate the wind pressure at which a 10 mm displacement of the wind girder is obtained.

    In a similar study for tanks with a fixed conical roof, Muñoz et al.[41] estimated a collapse load based on plastic behavior. However, in the present case the top ring has a significant stiffness, and this leads to extremely high wind speeds before reaching collapse (higher than 500 km/h). For this reason, the most severe damage level considered here was that of excessive out-of-plane displacements of the wind girder, and not shell collapse.

    The methodology to construct fragility curves has been presented by several authors[42,43]. The following procedure was adapted here[44]: (1) Establish qualitative damage categories (Table 2). (2) Compute a data base for different tanks, using LBA and GNIA. In each case, the damage category based on step (1) was identified (Table 3). (3) Approximate data obtained from step (2) using a log-normal distribution. (4) Plot the probabilities computed in step (3) with respect to wind speed x.

    Table 3.  Wind speed for each tank considered reaching a damage level.
    HDIDDS0DS1DS2DS3
    H12D351137.76162.06194.82336.02
    D402160.62181.31227.16360.73
    D453153.32174.19216.82374.04
    D504145.23165.27205.39373.76
    D555152.76180.83216.03374.75
    D606145.11170.75205.22370.98
    H14D357145.57162.05205.87295.03
    D408148.55166.20210.08311.24
    D459136.42153.72192.92334.54
    D5010155.36177.51219.71339.86
    D5511145.24165.34205.39343,17
    D6012141.89167.26200.67338.77
    H16D3513131.32161.94185.71262.20
    D4014146.95163.99207.82277.08
    D4515150.58170.90212.95293.37
    D5016138.97161.05196.54303.62
    D5517138.51174.17195.88313.97
    D6018156.34182.78221.10326.83
    H18D3519146.80160.79207.60223.18
    D4020159.01177.71224.87243.63
    D4521157.10179.51222.17265.32
    D5022152.54172.17215.72293.32
    D5523164.93188.10233.25305.94
    D6024163.69180.32231.49315.63
    H20D3525163.64199.59231.42195.03
    D4026171.24195.14242.18216.47
    D4527171.58203.68242.64293.32
    D5028182.46209.43258.03259.41
    D5529178.95208.23253.07272.48
    D6030174.47196.11246.74290.86
     | Show Table
    DownLoad: CSV

    Wind speeds for each tank, obtained via Eqn (3), are shown in Table 3 for the pressure level associated with each damage level DSi. A scalar ID was included in the table to identify each tank of the population in the random selection process. Wind speed was also taken as a random variable, so that wind speed in the range between 130 and 350 km/h have been considered at 5 km/h increase, with intervals of −2.5 and +2.5 km/h.

    Out of the 30-tank population considered, a sample of 15 tanks were chosen at random and were subjected to random wind forces. The random algorithm allowed for the same tank geometry to be chosen more than once as part of the sample.

    The type of damage obtained in each case for wind speed lower or equal to the upper bound of the interval were identified. Table 4 shows a random selection of tanks, together with the wind speed required to reach each damage level. For example, for a wind speed of 165 km/h, the wind interval is [162.5 km/h, 167.5 km/h]. This allows computation of a damage matrix (shown in Table 5). A value 1 indicates that a damage level was reached, whereas a value 0 shows that a damage level was not reached. In this example, 13 tanks reached DS0; six tanks reached DS1; and there were no tanks reaching DS2 or DS3. The ratio between the number of tanks with a given damage DSi and the total number of tanks selected is h, the relative accumulated frequency. The process was repeated for each wind speed and tank selection considered.

    Table 4.  Random tank selection for V = 165 km/h, assuming wind interval [162.5 km/h, 167.5 km/h].
    IDDS0DS1DS2DS3
    11145.2165.3205.4343.2
    6145.1170.7205.2371.0
    3153.3174.2216.8374.0
    9136.4153.7192.9334.5
    28182.5209.4258.0259.4
    22152.5172.2215.7293.3
    13131.3161.9185.7262.2
    19146.8160.8207.6223.2
    3153.3174.2216.8374.0
    12141.9167.3200.7338.8
    30174.5196.1246.7290.9
    23164.9188.1233.2305.9
    2160.6181.3227.2360.7
    17138.5174.2195.9314.0
    11145.2165.3205.4343.2
     | Show Table
    DownLoad: CSV
    Table 5.  Damage matrix for random tank selection (V = 165 km/h), assuming wind interval [162.5 km/h, 167.5 km/h].
    DS0DS1DS2DS3
    1100
    1000
    1000
    1100
    0000
    1000
    1100
    1100
    1000
    1100
    0000
    1000
    1000
    1000
    1100
    Total13600
    hi0.870.400
     | Show Table
    DownLoad: CSV

    Table 6 shows the evaluation of the fragility curve for damage level DS0. This requires obtaining the number of tanks for each wind speed (fi), the cumulative number as wind speed is increased (Fi), and the frequency with respect to the total number of the sample of 15 tanks is written on the right-hand side of Table 6, for relative frequency (hi) and accumulated frequency (Hi).

    Table 6.  Damage DS0: Wind speed intervals [km/h] shown on the left; logarithm of wind speed; and relative and absolute frequencies (shown on the right).
    V inf
    (km/h)
    V m
    (km/h)
    V sup
    (km/h)
    Ln
    (Vm)
    fiFihiHi
    127.5130132.54.87000.0000
    132.5135137.54.91220.1330.133
    137.5140142.54.94130.0670.200
    142.5145147.54.98360.2000.400
    147.5150152.55.01170.0670.467
    152.5155157.55.044110.2670.733
    157.5160162.55.080110.0000.733
    162.5165167.55.112130.1330.867
    167.5170172.55.140130.0000.867
    172.5175177.55.160130.0000.867
    177.5180182.55.192150.1331.000
     | Show Table
    DownLoad: CSV

    With the values of mean and deviation computed with Eqns (5) & (6), it is possible to establish the log normal distribution of variable V for damage level DS0, usually denoted as P[DS0/V]. Values obtained in discrete form and the log-normal distribution are shown in Fig. 5a for DS0. For the selection shown in Table 6, the media is μ* = 5.03 and the deviation is σ = 0.09.

    Figure 5.  Probability of reaching a damage level P[DSi/V], (a) DS0, (b) DS0, DS1, DS2 and DS3.

    The process is repeated for each damage level to obtain fragility curves for DS1, DS2, and DS3 (Fig. 5b). Notice that the wind speeds required to reach DS3 are much higher than those obtained for the other damage levels. Such values should be compared with the regional wind speeds in Patagonia, and this is done in the next section.

    The oil producing regions in Argentina having the largest oil reserves are the Neuquén and the San Jorge regions, both located in Patagonia. This needs to be placed side by side with wind loads to understand the risk associated with such oil production.

    Figure 6 shows the geographical location of these regions. The Neuquén region includes large areas of four provinces in Argentina (Neuquén, south of Mendoza, west of La Pampa, and Río Negro). The San Jorge region is in the central Patagonia area, including two provinces (south of Chubut, north of Santa Cruz). Another area is the Austral region covering part of a Patagonian province (Santa Cruz).

    Figure 6.  Oil producing regions in Argentina. (Adapted from IAPG[47]).

    A map of basic wind speed for Argentina is available in the Argentinian code CIRSOC 102[45], which is shown in Fig. 7. Notice that the highest wind speeds are found in Patagonia, and affect the oil-producing regions mentioned in this work. For the Neuquén region, wind speeds range from 42 to 48 m/s (151.2 to 172.8 km/h), whereas for San Jorge Gulf region they range between 52 and 66 m/s (187.2 and 237.6 km/h).

    Figure 7.  Wind speed map of Argentina. (Adapted from CIRSOC 102[45]).

    The wind values provided by CIRSOC 102[45] were next used to estimate potential shell damage due to wind. Considering the fragility curves presented in Fig. 4, for damage levels DS0, DS1, DS2 and DS3 based on a log-normal distribution, it may be seen that it would be possible to have some form of damage in tanks located in almost any region of Argentina because CIRSOC specifies wind speeds higher than 36 m/s (129.6 km/h). The fragility curve DS0 represents the onset of damage for wind speeds higher than 130 km/h, so that only winds lower than that would not cause tank damage.

    Based on the fragility curves shown in Fig. 8, it is possible to estimate probable damage levels for the wind speed defined by CIRSOC. Because design winds in Patagonia are higher than 165.6 km/h (46 m/s), it is possible to conclude that there is 81% probability to reach DS0 and 25% to reach DS1.

    Figure 8.  Probability P[DSi/V] to reach damage levels DS1, DS2 and DS3 in tanks located in the Patagonia region of Argentina.

    For the geographical area of the Neuquén region in Fig. 6, together with the wind map of Fig. 7, the expected winds range from 150 to 172.8 km/h (42 to 48 m/s). Such wind range is associated with a DS0 probability between 41% and 92%, whereas the DS1 probability is in the order of 48%.

    A similar analysis was carried out for the San Jorge region, in which winds between 187.2 and 237 km/h (52 and 66 m/s). The probability of reaching DS1 is 87%, and the probability of DS2 is 88%. Wind girder damage DS3 could only occur in this region, with a lower probability of 18%.

    This work focuses on open top tanks having a floating roof, and explores the probability of reaching damage levels for wind loads, using the methodology of fragility curves. A population of 30 tanks was defined with H/D ratios between 0.2 and 0.6; such aspect ratios were found to be the most common in the oil producing regions of Patagonia. The data employed assumed diameters D between 35 and 60 m, together with height between 12 and 20 m. The tanks were designed using current API 650 regulations which are used in the region, in order to define the shell thickness and wind girder. All tanks were assumed to be empty, which is the worst condition for shell stability because a fluid stored in a tank has a stabilizing effect and causes the buckling load to be higher.

    Both structural damage (shell buckling) and operational damage (blocking of the floating roof due to deflections of the cylindrical shell) were considered in the analysis. The qualitative definition of damage levels in this work was as follows: The condition of no damage was obtained from a lower bound of buckling loads. This accounts for geometric imperfections and mode coupling of the shell. Shell buckling was evaluated using linear bifurcation analysis to identify damage level DS2. A geometrically non-linear analysis with imperfections was used to identify deflection levels that would block a floating roof, a damage level identified as DS1. Finally, deflections in the wind girder were investigated using a linear elastic analysis to define damage DS3.

    The present results were compared with the wind conditions of Patagonia, to show that several damage levels may occur as a consequence of wind speeds higher than 130 km/h, which is the expected base value identified for the region. The most frequent expected damage is due to the loss of vertical displacements of the floating roof due to large displacements in the cylindrical shell of the tank, and this may occur for wind speed up to 200 km/h. Damage caused by shell buckling may occur for wind speeds higher than 190 km/h, and for that wind speed, further damage due to displacements in the wind girder may also occur, but with a lower probability. This latter damage form requires much higher wind speed to reach a probability of 20%, and would be more representative of regions subjected to hurricanes.

    The number of tanks considered in the present analysis was relatively low, mainly because the aim of this work was to collect data to build a meta-model, i.e. a simple model that may estimate damage based on shell and load characteristics[46]. In future work, the authors expect to develop and apply such meta-models to a larger number of tank/wind configurations, in order to obtain more reliable fragility curves.

    Fragility studies for an oil producing region, like those reported in this work, may be important to several stakeholders in this problem. The fragility information links wind speed levels to expected infrastructure damage, and may be of great use to government agencies, engineering companies, and society at large, regarding the risk associated with regional oil facilities. At a government level, this helps decision makers in allocating funding to address potential oil-related emergencies cause by wind. This can also serve as a guide to develop further modifications of design codes relevant to the oil infrastructure. The engineering consequences may emphasize the need to strengthen the present regional infrastructure to reduce risk of structural damage and its consequences. The impact of damage in the oil infrastructure on society was illustrated in the case of Hurricane Katrina in 2005, in which a large number of residents had to be relocated due to the conditions created by the consequences of infrastructure failure.

    The authors confirm contribution to the paper as follows: study conception and design: Jaca RC, Godoy LA; data collection: Grill J, Pareti N; analysis and interpretation of results: Jaca RC, Bramardi S, Godoy LA; draft manuscript preparation: Jaca RC, Godoy LA. All authors reviewed the results and approved the final version of the manuscript.

    All data generated or analyzed during this study are included in this published article.

    The authors are thankful for the support of a grant received from the National Agency for the Promotion of Research, Technological Development and Innovation of Argentina and the YPF Foundation. Luis A. Godoy thanks Prof. Ali Saffar (University of Puerto Rico at Mayaguez) for introducing him to the field of fragility studies.

  • The authors declare that they have no conflict of interest.

  • Supplemental Table S1 qRT-PCR primers for key functional genes of nitrogen cycle in rhizosphere soil.(2022).
    Supplemental Table.S2 Significance analysis of the difference in abundance of functional genes of nitrogen cycle between different treatments and control (%) (2022).
  • [1]

    Su H, Cheng C, Gong C, Yang C, Tong J. 2010. Effect of continuous cropping on chemical composition and neutral aroma components of flue-cured tobacco. Acta Agriculturae Jiangxi 22(5):5−8

    doi: 10.19386/j.cnki.jxnyxb.2010.05.002

    CrossRef   Google Scholar

    [2]

    Jin Y, Yang Y, Duan Y, Kong G. 2004. Effect of rotational cropping and continuous cropping on yield and quality of flue-cured tobacco. Southwest China Journal of Agricultural Sciences 17:267−71

    doi: 10.16213/j.cnki.scjas.2004.s1.063

    CrossRef   Google Scholar

    [3]

    You C, Zeng W, Chen D, Huang J, Tang L. 2015. Effect of different soil management methods on functional diversity of microbial flora in rhizospheric soil for continuous tobacco cropping. Acta Tabacaria Sinica 21(02):68−74

    doi: 10.16472/j.chinatobacco.2014.341

    CrossRef   Google Scholar

    [4]

    Bai Y, Wang G, Cheng Y, Shi P, Yang C, et al. 2019. Soil acidification in continuously cropped tobacco alters bacterial community structure and diversity via the accumulation of phenolic acids. Scientific Reports 9(1):12499

    doi: 10.1038/s41598-019-48611-5

    CrossRef   Google Scholar

    [5]

    Liu Z, Zhou W, Li S, He P, Liang G, et al. 2015. Assessing soil quality of gleyed paddy soils with different productivities in subtropical China. CATENA 133:293−302

    doi: 10.1016/j.catena.2015.05.029

    CrossRef   Google Scholar

    [6]

    Chen S, Qi G, Luo T, Zhang H, Jiang Q, et al. 2018. Continuous-cropping tobacco caused variance of chemical properties and structure of bacterial network in soils. Land Degradation & Development 29(11):4106−20

    doi: 10.1002/ldr.3167

    CrossRef   Google Scholar

    [7]

    Yuan P, Wang J, Li C, Cao C. 2022. Long-term rice-crayfish farming aggravates soil gleying and induced changes of soil iron morphology. Soil Use and Management 38(1):757−70

    doi: 10.1111/sum.12688

    CrossRef   Google Scholar

    [8]

    Zou C, Pearce RC, Grove JH, Coyne MS. 2015. Conservation practices in tobacco production increase large aggregates and associated carbon and nitrogen. Soil Science Society of America Journal 79(6):1760−70

    doi: 10.2136/sssaj2015.06.0235

    CrossRef   Google Scholar

    [9]

    Poss R, Smith CJ, Dunin FX, Angus JF. 1995. Rate of soil acidification under wheat in a semi-arid environment. Plant and Soil 177:85−100

    doi: 10.1007/BF00010340

    CrossRef   Google Scholar

    [10]

    Hamidzadeh Z, Ghorbannezhad P, Ketabchi MR, Yeganeh B. 2023. Biomass-derived biochar and its application in agriculture. Fuel 341:127701

    doi: 10.1016/j.fuel.2023.127701

    CrossRef   Google Scholar

    [11]

    Lehmann J. 2007. A handful of carbon. Nature 447:143−44

    doi: 10.1038/447143a

    CrossRef   Google Scholar

    [12]

    Wu D, Senbayram M, Zang H, Ugurlar F, Aydemir S, et al. 2018. Effect of biochar origin and soil pH on greenhouse gas emissions from sandy and clay soils. Applied Soil Ecology 129:121−27

    doi: 10.1016/j.apsoil.2018.05.009

    CrossRef   Google Scholar

    [13]

    Wang C, Guo X, Zeng W, Huang Y, Tang L. 2019. Effects of different biochar application amounts on growth and quality of flue-cured tobacco. Journal of Southern Agriculture 50(10):2160−68

    doi: 10.3969/j.issn.2095-1191.2019.10.04

    CrossRef   Google Scholar

    [14]

    He D, Zhao Y, Gao J, Sui Y, Xin W, et al. 2021. Effects of biochar application combined with nitrogen fertilizer on yield formation of japonica rice and the immediate and residual effects of nitrogen. Journal of Plant Nutrition and Fertilizers 27(12):2114−24

    doi: 10.11674/zwyf.2021244

    CrossRef   Google Scholar

    [15]

    Robertson GP, Vitousek PM. 2009. Nitrogen in agriculture: balancing the cost of an essential resource. Annual Review of Environment and Resources 34:97−125

    doi: 10.1146/annurev.environ.032108.105046

    CrossRef   Google Scholar

    [16]

    Zhang B, Wang C, Yang M, Pan R, Pan M, et al. 2022. Effects of biochar on nitrogen cycling microbes and their functional genes in tobacco-growing soils. Journal of Southern Agriculture 53(9):2444−56

    doi: 10.3969/j.issn.2095-1191.2022.09.007

    CrossRef   Google Scholar

    [17]

    Ding P, Noor H, Shah AA, Yan Z, Sun P, et al. 2023. Nutrient cycling and nitrogen management impact of sowing method and soil water consumption on yield nitrogen utilization in dryland wheat (Triticum aestivum L.). Agronomy 13(6):1528

    doi: 10.3390/agronomy13061528

    CrossRef   Google Scholar

    [18]

    Huang Y, Ye Y, Yang S. 2009. Feasibility of NO3-N determination by dual wavelength spectrophotometric method. Chinese Agricultural Science Bulletin 25(2):43−45

    Google Scholar

    [19]

    Zhang Y, Xu A, Shan H, Ma A. 2010. Ammonium contents in potassium chloride impurities and its impact on soil NH+4-N determination. Chinese Journal of Soil Science 41(05):1134−37

    doi: 10.19336/j.cnki.trtb.2010.05.023

    CrossRef   Google Scholar

    [20]

    Mulvaney RL, Khan SA. 2001. Diffusion methods to determine different forms of nitrogen in soil hydrolysates. Soil Science Society of America Journal 65(4):1284−92

    doi: 10.2136/sssaj2001.6541284x

    CrossRef   Google Scholar

    [21]

    Su Y, Lv JL, Yu M, Ma ZH, Xi H, et al. 2020. Long-term of decomposed straw return positively affects the soil microbial community. Journal of Applied Microbiology 128(1):138−50

    doi: 10.1111/jam.14435

    CrossRef   Google Scholar

    [22]

    Ciavatta C, Govi M, Antisari L, Sequi P. 1991. Determination of organic carbon in aqueous extracts of soils and fertilizers. Communications in Soil Science and Plant Analysis 22(9-10):795−807

    doi: 10.1080/00103629109368455

    CrossRef   Google Scholar

    [23]

    Qi L, Zhou P, Yang L, Gao M. 2020. Effects of land reclamation on the physical, chemical, and microbial quantity and enzyme activity properties of degraded agricultural soils. Journal of Soils and Sediments 20:973−81

    doi: 10.1007/s11368-019-02432-1

    CrossRef   Google Scholar

    [24]

    Tian X, Li Z, Wang Y, Li B, Wang L. 2021. Evaluation on soil fertility quality under biochar combined with nitrogen reduction. Scientific Reports 11(1):13792

    doi: 10.1038/s41598-021-93200-0

    CrossRef   Google Scholar

    [25]

    Ge S, Ding S, Yang Y, Li J, Yan H, et al. 2018. Effects of mined application of biochar and nitrogen fertilizer on effective nitrogen in soil and nitrogen accumulation in flue-cured tobacco. Acta Tabacaria Sinica 24(2):84−92

    doi: 10.16472/j.chinatobacco.2017.282

    CrossRef   Google Scholar

    [26]

    Li C, Zhao C, Zhao X, Wang Y, Lv X, et al. 2023. Beneficial effects of Biochar application with nitrogen fertilizer on soil nitrogen retention, absorption and utilization in maize production. Agronomy 13(1):113

    doi: 10.3390/agronomy13010113

    CrossRef   Google Scholar

    [27]

    Xia H, Riaz M, Zhang M, Liu B, Li Y, et al. 2022. Biochar-N fertilizer interaction increases N utilization efficiency by modifying soil C/N component under N fertilizer deep placement modes. Chemosphere 286:131594

    doi: 10.1016/j.chemosphere.2021.131594

    CrossRef   Google Scholar

    [28]

    Ullah S, Zhao Q, Wu K, Ali I, Liang H, et al. 2021. Biochar application to rice with 15N-labelled fertilizers, enhanced leaf nitrogen concentration and assimilation by improving morpho-physiological traits and soil quality. Saudi Journal of Biological Sciences 28(6):3399−413

    doi: 10.1016/j.sjbs.2021.03.003

    CrossRef   Google Scholar

    [29]

    Ning C, Liu R, Kuang X, Chen H, Tian J, et al. 2022. Nitrogen fertilizer reduction combined with biochar application maintain the yield and nitrogen supply of rice but improve the nitrogen use efficiency. Agronomy 12(12):3039

    doi: 10.3390/agronomy12123039

    CrossRef   Google Scholar

    [30]

    Cheng X, Meng J, Huang Y, Liang H, E Y, et al. 2016. Effect of biochar on root growth, absorption of nitrogen and maize yield. Journal of Shenyang Agricultural University 47(2):218−23

    Google Scholar

    [31]

    Wang Y, Liu Y, Lv H, Yang S. 2015. Effect of washing biochar and chemical fertilizers on rice yield and nutrient uptake. Journal of Plant Nutrition and Fertilizer 21(4):1049−55

    doi: 10.11674/zwyf.2015.0425

    CrossRef   Google Scholar

    [32]

    Wu J. 2018. Effects of biochar addition combined with nitrogen fertilizer on nitrogen utilization of flue-cured tobacco and soil characteristics. Thesis. Henan Agricultural University, China.

    [33]

    Gai X, Wang H, Liu J, Zhai L, Liu S, et al. 2014. Effects of feedstock and pyrolysis temperature on biochar adsorption of ammonium and nitrate. PloS One 9(12):e113888

    doi: 10.1371/journal.pone.0113888

    CrossRef   Google Scholar

    [34]

    Han F, Ren L, Zhang XC. 2016. Effect of biochar on the soil nutrients about different grasslands in the Loess Plateau. CATENA 137:554−62

    doi: 10.1016/j.catena.2015.11.002

    CrossRef   Google Scholar

    [35]

    Sarfraz R, Shakoor A, Abdullah M, Arooj A, Hussain A, et al. 2017. Impact of integrated application of biochar and nitrogen fertilizers on maize growth and nitrogen recovery in alkaline calcareous soil. Soil Science and Plant Nutrition 65(5):488−98

    doi: /10.1080/00380768.2017.1376225

    CrossRef   Google Scholar

    [36]

    Xu W, Wang G, Deng F, Zou X, Ruan H, et al. 2018. Responses of soil microbial biomass, diversity and metabolic activity to biochar applications in managed poplar plantations on reclaimed coastal saline soil. Soil Use and Management 34(4):597−605

    doi: 10.1111/sum.12460

    CrossRef   Google Scholar

    [37]

    Dal Molin SJ, Ernani PR, Gerber JM. 2020. Soil acidification and nitrogen release following application of nitrogen fertilizers. Communications in Soil Science and Plant Analysis 51:2551−58

    doi: 10.1080/00103624.2020.1845347

    CrossRef   Google Scholar

    [38]

    He M, Fan T, Yang C, Chen Y, Li D, et al. 2017. Physiological characterization of NO3 and NH+4 uptake kinetics of tobacco 'K326' and 'Honghuadajinyuan' using a short-time 15N-substrate labeling approach. Plant Physiology Journal 53(4):572−80

    doi: 10.13592/j.cnki.ppj.2016.0519

    CrossRef   Google Scholar

    [39]

    Huang Y, Wang C, Lin C, Zhang Y, Chen X, et al. 2019. Methane and nitrous oxide flux after biochar application in subtropical acidic paddy soils under tobacco-rice rotation. Scientific reports 9:17277

    doi: 10.1038/s41598-019-53044-1

    CrossRef   Google Scholar

    [40]

    Chen H, Yin C, Fan X, Ye M, Peng H, et al. 2019. Reduction of N2O emission by biochar and/or 3,4-dimethylpyrazole phosphate (DMPP) is closely linked to soil ammonia oxidizing bacteria and nosZI-N2O reducer populations. Science of The Total Environment 694:133658

    doi: 10.1016/j.scitotenv.2019.133658

    CrossRef   Google Scholar

    [41]

    Prommer J, Wanek W, Hofhansl F, Trojan D, Offre P, et al. 2014. Biochar decelerates soil organic nitrogen cycling but stimulates soil nitrification in a temperate arable field trial. PloS One 9:e86388

    doi: 10.1371/journal.pone.0086388

    CrossRef   Google Scholar

    [42]

    Ouyang Y, Evans SE, Friesen ML, Tiemann LK. 2018. Effect of nitrogen fertilization on the abundance of nitrogen cycling genes in agricultural soils: a meta-analysis of field studies. Soil Biology and Biochemistry 127:71−78

    doi: 10.1016/j.soilbio.2018.08.024

    CrossRef   Google Scholar

    [43]

    Wang H, Wu Y, Liu J, Xue J. 2022. A review of research advances in the effects of biochar on soil nitrogen cycling and its functional microorganisms. Journal of Ecology and Rural Environment 38(6):689−701

    doi: 10.19741/j.issn.1673-4831.2021.0313

    CrossRef   Google Scholar

    [44]

    Stein L, Klotz M. 2016. The nitrogen cycle. Current Biology 26(3):R94−R98

    doi: 10.1016/j.cub.2015.12.021

    CrossRef   Google Scholar

    [45]

    Liu C, Zhou Z, Wang H, Xue J. 2023. Effects of microplastics on soil physicochemical properties and functional microorganisms related to nitrogen cycling. Acta Scientiae Circumstantiae 43:396−406

    doi: 10.13671/j.hjkxxb.2023.0029

    CrossRef   Google Scholar

    [46]

    Chu C, Wu Z, Huang Q, Han C, Zhong W. 2020. Effect of organic matter promotion on nitrogen-cycling genes and functional microorganisms in acidic red soils. Environmental Science 41(5):2468−75

    doi: 10.13227/j.hjkx.201911013

    CrossRef   Google Scholar

    [47]

    Gao S, Song Y, Song C, Ma X, Jiang L. 2020. Effects of warming and exogenous carbon input on the abundance of key microbial functional genes of carbon-nitrogen cycle in peatland soil. Acta Ecologica Sinica 40(13):4617−27

    Google Scholar

    [48]

    Niu S, Song L, Wang J, Luo Y, Yu G. 2023. Dynamic carbon-nitrogen coupling under global change. Science China Life Sciences 66(4):771−82

    doi: 10.1007/s11427-022-2245-y

    CrossRef   Google Scholar

  • Cite this article

    Zhang B, Tang L, Wang Y, Yang M, Pan R, et al. 2023. Effect of reduced nitrogen fertilizer application combined with biochar on nitrogen utilization of flue-cured tobacco and its association with functional gene expressions of the nitrogen cycle in rhizosphere soil. Technology in Agronomy 3:12 doi: 10.48130/TIA-2023-0012
    Zhang B, Tang L, Wang Y, Yang M, Pan R, et al. 2023. Effect of reduced nitrogen fertilizer application combined with biochar on nitrogen utilization of flue-cured tobacco and its association with functional gene expressions of the nitrogen cycle in rhizosphere soil. Technology in Agronomy 3:12 doi: 10.48130/TIA-2023-0012

Figures(5)  /  Tables(3)

Article Metrics

Article views(3784) PDF downloads(454)

ARTICLE   Open Access    

Effect of reduced nitrogen fertilizer application combined with biochar on nitrogen utilization of flue-cured tobacco and its association with functional gene expressions of the nitrogen cycle in rhizosphere soil

Technology in Agronomy  3 Article number: 12  (2023)  |  Cite this article

Abstract: Studies have shed light on the impact of the co-application of inorganic fertilizer and biochar on soil fertility, health, and crop growth performance and yield. However, insufficient literature exists regarding the appropriate nitrogen reduction ratio for enhancing soil quality and maximizing crop nitrogen utilization following the application of biochar in a continuous tobacco-rice rotation field. Here, we explored nitrogen absorption and utilization patterns of tobacco crops, as well as the response characteristics of functional genes related to soil nitrogen cycling subjected to the interaction of reduced nitrogen utilization ratios following biochar application in a long-term tobacco-rice rotation field. The results showed that the treatments with 10% (T2) and 20% (T3) nitrogen reduction combined with biochar (30 t∙ha−1) promoted nitrogen utilization efficiency and nitrogen harvest index of tobacco plants. In the second year of the experiment, T2 and T3 significantly increased the nitrogen harvest index by 3.85% and 5.78% compared with the conventional nitrogen application treatment (T1), respectively. We believe that the increase in abundance of nitrification, nitrogen fixation, and ammonification genes, including nxrA, nifH, and UreC in the rhizosphere soil, precipitate the high nitrogen absorption and utilization efficiency in the biochar combined with nitrogen reduction treatments, respectively. This suggests that biochar application at a rate of 30 t·ha−1, nitrogen fertilizer usage can be reduced by 10% and 20% to achieve optimal and sustainable tobacco production.

    • Tobacco is a crop that is adversely affected by continuous cropping, leading to increased disease incidence, decreased yield, and reduced quality[1, 2]. Due to limitations in arable land area, tobacco-growing regions in Fujian Province (China) mainly employ a tobacco-rice rotation system. However, as the duration of rotation increases, the problems associated with continuous cropping become more severe, posing a significant challenge to the sustainable development of tobacco production[3]. Previous studies showed that long-term tobacco-rice rotation increased the secretion of autotoxins in tobacco roots, leading to the deterioration of soil's physical and chemical properties[4]. Additionally, the flooding required for rice cultivation decreases soil aeration, resulting in soil anaerobiosis[5]. These factors contribute to a decline in soil available nutrients[6, 7], ultimately decreasing crop yield and quality. Farmers often resort to increasing nitrogen fertilizer application when faced with declining yields. However, traditional nitrogen application rates for tobacco have far exceeded the nitrogen absorption capacity of the plants. Excess nitrogen residue in the soil leads to soil degradation, acidification, and decreased organic matter content, among other negative effects[8]. In the context of a rice-fallow rotation system, the relatively long periods of aerobic conditions in the soil and soil degradation reduce soil's ability to retain mineralized nitrogen. As a result, ammonium nitrogen is more readily nitrified, and nitrate nitrogen is more prone to leaching, accelerating soil acidification and nitrogen loss[9]. This further exacerbates the over-application of nitrogen fertilizer in tobacco-rice rotation systems, creating a vicious cycle. Therefore, finding a way to reduce nitrogen fertilizer usage, minimize nitrogen loss, and improve soil conditions while maintaining crop yield is a crucial issue that needs to be addressed for the sustainable development of agriculture.

      Biochar, as a soil amendment rich in stable carbon, has significant theoretical and practical implications for understanding its impact on soil nitrogen cycling. In recent years, biochar has played an important role in soil improvement and increasing crop yield. It is a stable product obtained from the thermochemical conversion of biomass or organic waste under high-temperature anaerobic or oxygen-limited conditions[10]. The characteristics of biochar, such as high carbon content and recalcitrance, make it highly potential in soil carbon sequestration and reduction of greenhouse gas emissions[11, 12]. Previous research revealed that biochar utilization potentially influenced the growth and development of tobacco plants, including their chemical composition, sensory quality, and yield[13]. Moreover, biochar application has shown great potential in increasing soil organic carbon content, improving soil microbial environment, enhancing soil fertility, and increasing fertilizer use efficiency. He et al.[14] found that under nitrogen reduction conditions (180 kg∙ha−1), biochar application at a rate of 15 t∙ha−1 improved soil fertility and significantly increased crop yield. As research deepens, the microbial-mediated mechanisms underlying biochar's promotion of nutrient utilization in crops have gained traction among researchers and farmers. Microorganisms are essential and active components of soil ecosystems, and the absorption and utilization of soil nitrogen by crops rely on the dominant soil nitrogen cycling processes they mediate[15]. Zhang et al.[16] demonstrated that biochar remediation of tobacco soils in a tobacco-rice rotation system improved soil physical and chemical properties, thereby facilitating the transition of soil nitrogen cycling microorganisms to more efficient nitrogen utilization pathways. However, insufficient literature exists regarding the appropriate nitrogen reduction ratio for enhancing soil quality and maximizing crop nitrogen utilization following the application of biochar in a continuous tobacco-rice rotation field. This study sought to explore nitrogen absorption and utilization patterns of tobacco crops and the response characteristics of functional genes related to soil nitrogen cycling subjected to the interaction of reduced nitrogen utilization ratios following biochar application in a long-term tobacco-rice rotation field. Our findings will provide a scientific basis for the developing nitrogen reduction strategies that enhance the quality and efficiency of tobacco production.

    • The field trial was conducted at the Tobacco Agricultural Research Base in HuanxiTown, Jin'an District, Fuzhou City, Fujian Province, China (119°36′86″ E, 26°17′33″ N). The trial soil was a red paddy soil that had been continuously cropped with tobacco-rice rotation for 20 years. The trial was conducted for a consecutive period of 2 years, from January 2021 to August 2022. During the tobacco growing season in 2021, the accumulated temperature was 2,445.59 °C, and the effective accumulated temperature was 1,159.83 °C. The total rainfall was 459.11 mm. In 2022, the accumulated temperature during the tobacco growing season was 2,009.04 °C, with an effective accumulated temperature of 869.92 °C. The total rainfall was 610.43 mm. At the start of the trial, the initial soil pH was 4.95. Organic matter content was 28.69 g∙kg−1, total nitrogen content was 2.18 g∙kg−1, total phosphorus content was 0.60 g∙kg−1, total potassium content was 20.43 g∙kg−1, alkali-hydrolyzable nitrogen content was 94.00 mg∙kg−1, available phosphorus content was 40.96 mg∙kg−1, and available potassium content was 209.21 mg∙kg−1.

    • The experimental material used was the 'Yunyan 87' flue-cured tobacco commonly grown in Fujian (China). The biochar used in the experiment was obtained by high-temperature pyrolysis (around 450 °C) of tobacco stalks under anaerobic conditions provided by Sanli New Energy Co., Ltd. in Shangqiu, Henan Province (China). The physicochemical properties of the biochar were as follows: pH 9.66, fixed carbon content 475.90 g∙kg−1, total nitrogen content 15.00 g∙kg−1, total phosphorus content 1.40 g∙kg−1, and total potassium content 20.10 g∙kg−1. The experiment consisted of five treatments. The nitrogen application rates followed the local recommended doses, with the same biochar application rate (30 t∙ha−1). The treatments were as follows: T1: Conventional nitrogen application rate of 127.50 kg∙ha−1, T2: Nitrogen application rate reduced by 10% (114.75 kg∙ha−1), T3: Nitrogen application rate reduced by 20% (102.00 kg∙ha−1), T4: Nitrogen application rate reduced by 30% (89.25 kg∙ha−1), T0: Control treatment with no biochar and the conventional nitrogen application rate of 127.50 kg∙ha−1. The experiment was set up in a randomized block design with three replicates per treatment. Each plot covered an area of 144 m2 (24 m long, 6 m wide), resulting in a total of 15 plots. A plot with no biochar or nitrogen fertilizer (N0) was included to calculate nitrogen uptake efficiency. The phosphorus and potassium fertilizers were applied uniformly for all treatments, with P2O5 at a rate of 99 kg∙ha−1 and K2O at 402 kg∙ha−1. In December 2020, the biochar was evenly spread on the soil surface and incorporated into the soil by rotary tillage, with a ridge height of 35 cm and row spacing of 1.2 m × 0.5 m before planting the tobacco. Later, we applied the reduced nitrogen fertilizer in January 2021 and 2022 at different rates. Apart from the variations in treatments, the rest of the field management followed the production standards for high-quality tobacco leaves in Fujian (China). In 2022, the experiment continued with the reduced nitrogen application treatments, and qRT-PCR analysis of key nitrogen cycling functional genes in the tobacco rhizosphere soil was conducted.

    • During the harvest period of flue-cured tobacco, three representative plants with uniform growth from each experimental treatment were selected. Various organs of these plants, including roots, stems, and leaves were sampled. The complete root system of the tobacco plants was excavated, and any debris around the root zone was quickly removed. The soil adhering to the roots was wrapped in aluminum foil, mixed, and frozen in liquid nitrogen before being transferred and stored at −80 °C in a freezer for further use. Each organ was then dried at 105 °C for half an hour to kill the tissues and further dried at 80 °C until a constant weight was reached. The dry matter weight of each sample was determined.

    • After grinding the samples using a 0.25 mm mesh, the total nitrogen content of the plant samples was measured using the concentrated sulfuric acid-hydrogen peroxide digestion method. The measurements were conducted using a fully automated chemical analyzer (Smartchem 2000) from Germany. Nitrogen accumulation and nitrogen use efficiency were calculated using the following formulas[17]:

      Nitrogen accumulation per unit area of plant (kg·ha−1) = Nitrogen accumulation per plant × planting density

      Nitrogen uptake efficiency (%) = [(Nitrogen uptake by plants in nitrogen treatment area − Nitrogen uptake by plants in the area without nitrogen treatment) / Nitrogen application rate] × 100%

      Nitrogen harvest index = Nitrogen accumulation in plant leaves / Whole plant nitrogen accumulation

    • During the root extending, vigorous growing, and harvest periods of flue-cured tobacco, a five-point sampling method was used to collect five soil cores from each plot. Before mixing the soil samples from the same layer, a single sample was provided from each replicate plot. Three replicates were taken from each treatment. A total of 45 soil samples were collected from the 0−30 cm soil layer (3 × 5 × 3). The samples were air-dried indoors and ground using a 1 mm mesh. The total nitrogen content was determined using the concentrated sulfuric acid digestion method with a fully automated chemical analyzer (Smartchem 2000)[17]. Nitrate nitrogen was measured using the dual-wavelength spectrophotometric colorimetric method[18], ammonium nitrogen was determined using the indophenol blue colorimetric method[19], and soil alkali-hydrolyzable nitrogen was measured using the alkaline hydrolysis diffusion method[20].

    • During the harvest period of flue-cured tobacco, the sampling method was the same as described above. The pH was determined using the potentiometric method with an acidity meter[21]. The soil organic matter content was determined using the potassium dichromate titration method[22]. Additionally, three soil ring samples were taken from each replicate point. Soil was extracted from the primary root of the tobacco plant at a depth ranging from 30 to 40 cm below the root's base. The cut ring samples were immediately covered to prevent moisture evaporation and then weighed and recorded to determine the soil bulk density, porosity, and field moisture capacity[23].

    • During the vigorous growing period of tobacco, three representative tobacco plants with uniform growth were selected for each experimental treatment. The complete root system of the tobacco plants was excavated, and the surrounding debris was quickly removed from the rhizosphere. The soil adhering to the roots was wrapped with aluminum foil, and the soil samples were mixed and placed into liquid nitrogen for freezing. They were then transferred and stored in a −80 °C freezer for later use. A fresh soil sample weighing 0.25 g was taken, and soil genomic DNA was extracted using a soil genomic DNA extraction kit (DcP336, TianGen Biotech Co., Ltd., Beijing, China). After DNA concentration detection, qRT-PCR validation was performed on key functional genes associated with soil nitrogen cycling. The specific primer sequences can be found in Supplemental Table S1. Amplification was carried out using a fluorescence quantitative PCR instrument (ABI7500, Applied Biosystems, USA). The qPCR reaction system consisted of 20 μL, including 10 μL 2× Taq MasterMix, 7 μL sterile water, 0.5 μL of each upstream and downstream primer, and 2 μL of template DNA. The standard curve was constructed using the Ct value as the abscissa and the log value of the copy number of the standard sample as the ordinate (log10). The PCR reaction was conducted with the following program: 95 °C for 30 s, followed by 40 PCR cycles of 95 °C for 10 s, 60 °C for 30 s, and 72 °C for 40 s. To establish the melting curve of the PCR product, after the amplification reaction, the program consisted of 95 °C for 10 s, 60 °C for 60 s, and then gradually heated to 99 °C from 60 °C (with a ramp rate of 0.05 °C/second).

    • Tables and figures were plotted with Microsoft Excel 2019, Origin 2022b, R4.2.2 software, and significant difference among the different treatments were tested using SPSS 22.0 statistical software (Duncan's multiple range tests, α = 0.05). Linear regression analysis, stepwise regression analysis, and random forest model prediction analysis with Mantel detection using R4.2.2.

    • According to Table 1, the plant nitrogen accumulation showed significant differences among treatments and years, as well as significant interaction effects between treatments and years. Nitrogen accumulation in the tobacco leaves showed significant differences among treatments, but no significant differences were observed between years and the interaction of years and treatments. In 2021, the leaf and plant nitrogen accumulation in the biochar treatments (T1−T4) was significantly higher than that in the T0 treatment, ranging from 21.45% to 64.95% and 13.91% to 48.88%, respectively. Regarding plant nitrogen accumulation, the rankings among the treatments for both years were T1 > T2 > T3 > T4, with T0 being the lowest. However, in terms of leaf nitrogen accumulation, there was no significant difference between T1 and T2 in a two-year comparison, while T1 and T3 in 2021 revealed the opposite, but no significant difference was observed in 2022.

      Table 1.  Effect of reduced nitrogen fertilizer application combined with biochar on nitrogen accumulation and utilization in flue-cured tobacco.

      YearTreatmentLeaf (kg·ha−1)Stem (kg·ha−1)Root (kg·ha−1)Whole plant (kg·ha−1)Nitrogen uptake efficiency (%)Nitrogen harvest index
      2021N020.98d9.76d9.12c39.86f
      T034.56c18.46c21.04b74.07e26.83c0.47c
      T155.80a25.60a29.76a111.16a55.93a0.50b
      T256.17a24.76a23.18ab104.06b55.95a0.54a
      T349.03b24.31a22.39b95.73c54.78a0.51ab
      T442.80b21.48b20.78b85.06d50.64b0.50b
      2022N019.21d5.99c6.04e31.23e
      T032.68c19.15ab17.43c69.26d29.83d0.47c
      T148.32a23.20a22.09a93.61a49.71a0.52b
      T246.79a20.35b19.20b86.33b48.02a0.54a
      T344.87a18.66ab17.56bc81.10c48.89a0.55a
      T436.29b18.10b15.11d69.49d42.87c0.52b
      Year(Y)************
      Treatment (T)************
      Y × TNS**NS****NS
      Note: Nitrogen uptake efficiency for the T0, T1, T2, T3, and T4 treatments was calculated using N0 as the control. Different lowercase letters in the same column of the table indicate the difference between treatments at 0.05 level in the same year (p < 0.05), the same was applied in Table 2 . '*' indicates a significant difference at 0.05 level; '**' indicates a highly significant difference at 0.01 level; NS indicates no significant differences at 0.05 level. Nitrogen accumulation in leaves includes nitrogen in the topped leaves.

      The nitrogen uptake efficiency of tobacco plants in the biochar treatments was significantly higher than that of the T0 treatment during the two-year period, with an increase of 23.81% to 29.12% in 2021, reaching as high as 55.95%. In 2022, the increase in nitrogen uptake efficiency decreased to a range of 13.04% to 19.88%, with the most significant decrease observed in the T4 treatment. There was no significant difference in nitrogen uptake efficiency between the T2 and T3 treatments among the nitrogen reduction treatments during the two-year period. Further analysis of the nitrogen harvest index of tobacco plants showed that the biochar treatments had significantly higher values than the T0 treatment during the two-year period, with increases ranging from 7.79% to 15.83% and 10.64% to 17.02%, respectively. There was no significant difference between the T2 and T3 treatments in terms of nitrogen harvest index. In 2022, the T2 and T3 treatments were significantly higher than the T1 treatment, accounting for 3.85% and 5.78%, respectively.

    • As shown in Fig. 1, the highest values of alkali-hydrolyzable nitrogen, nitrate nitrogen, and ammonium nitrogen in the soil occur during the vigorous growing period. Over the course of two years, the biochar treatments significantly increased the nitrate nitrogen content in the soil during the vigorous growing period while significantly reducing the ammonium nitrogen content. The different forms of nitrogen in the soil exhibited a significant decrease with reduced nitrogen application rates. Furthermore, the biochar treatments significantly reduced the ammonium nitrogen content in the soil during the harvest period, and the alkali-hydrolyzable nitrogen content in the soil decreased significantly with reduced nitrogen application rates.
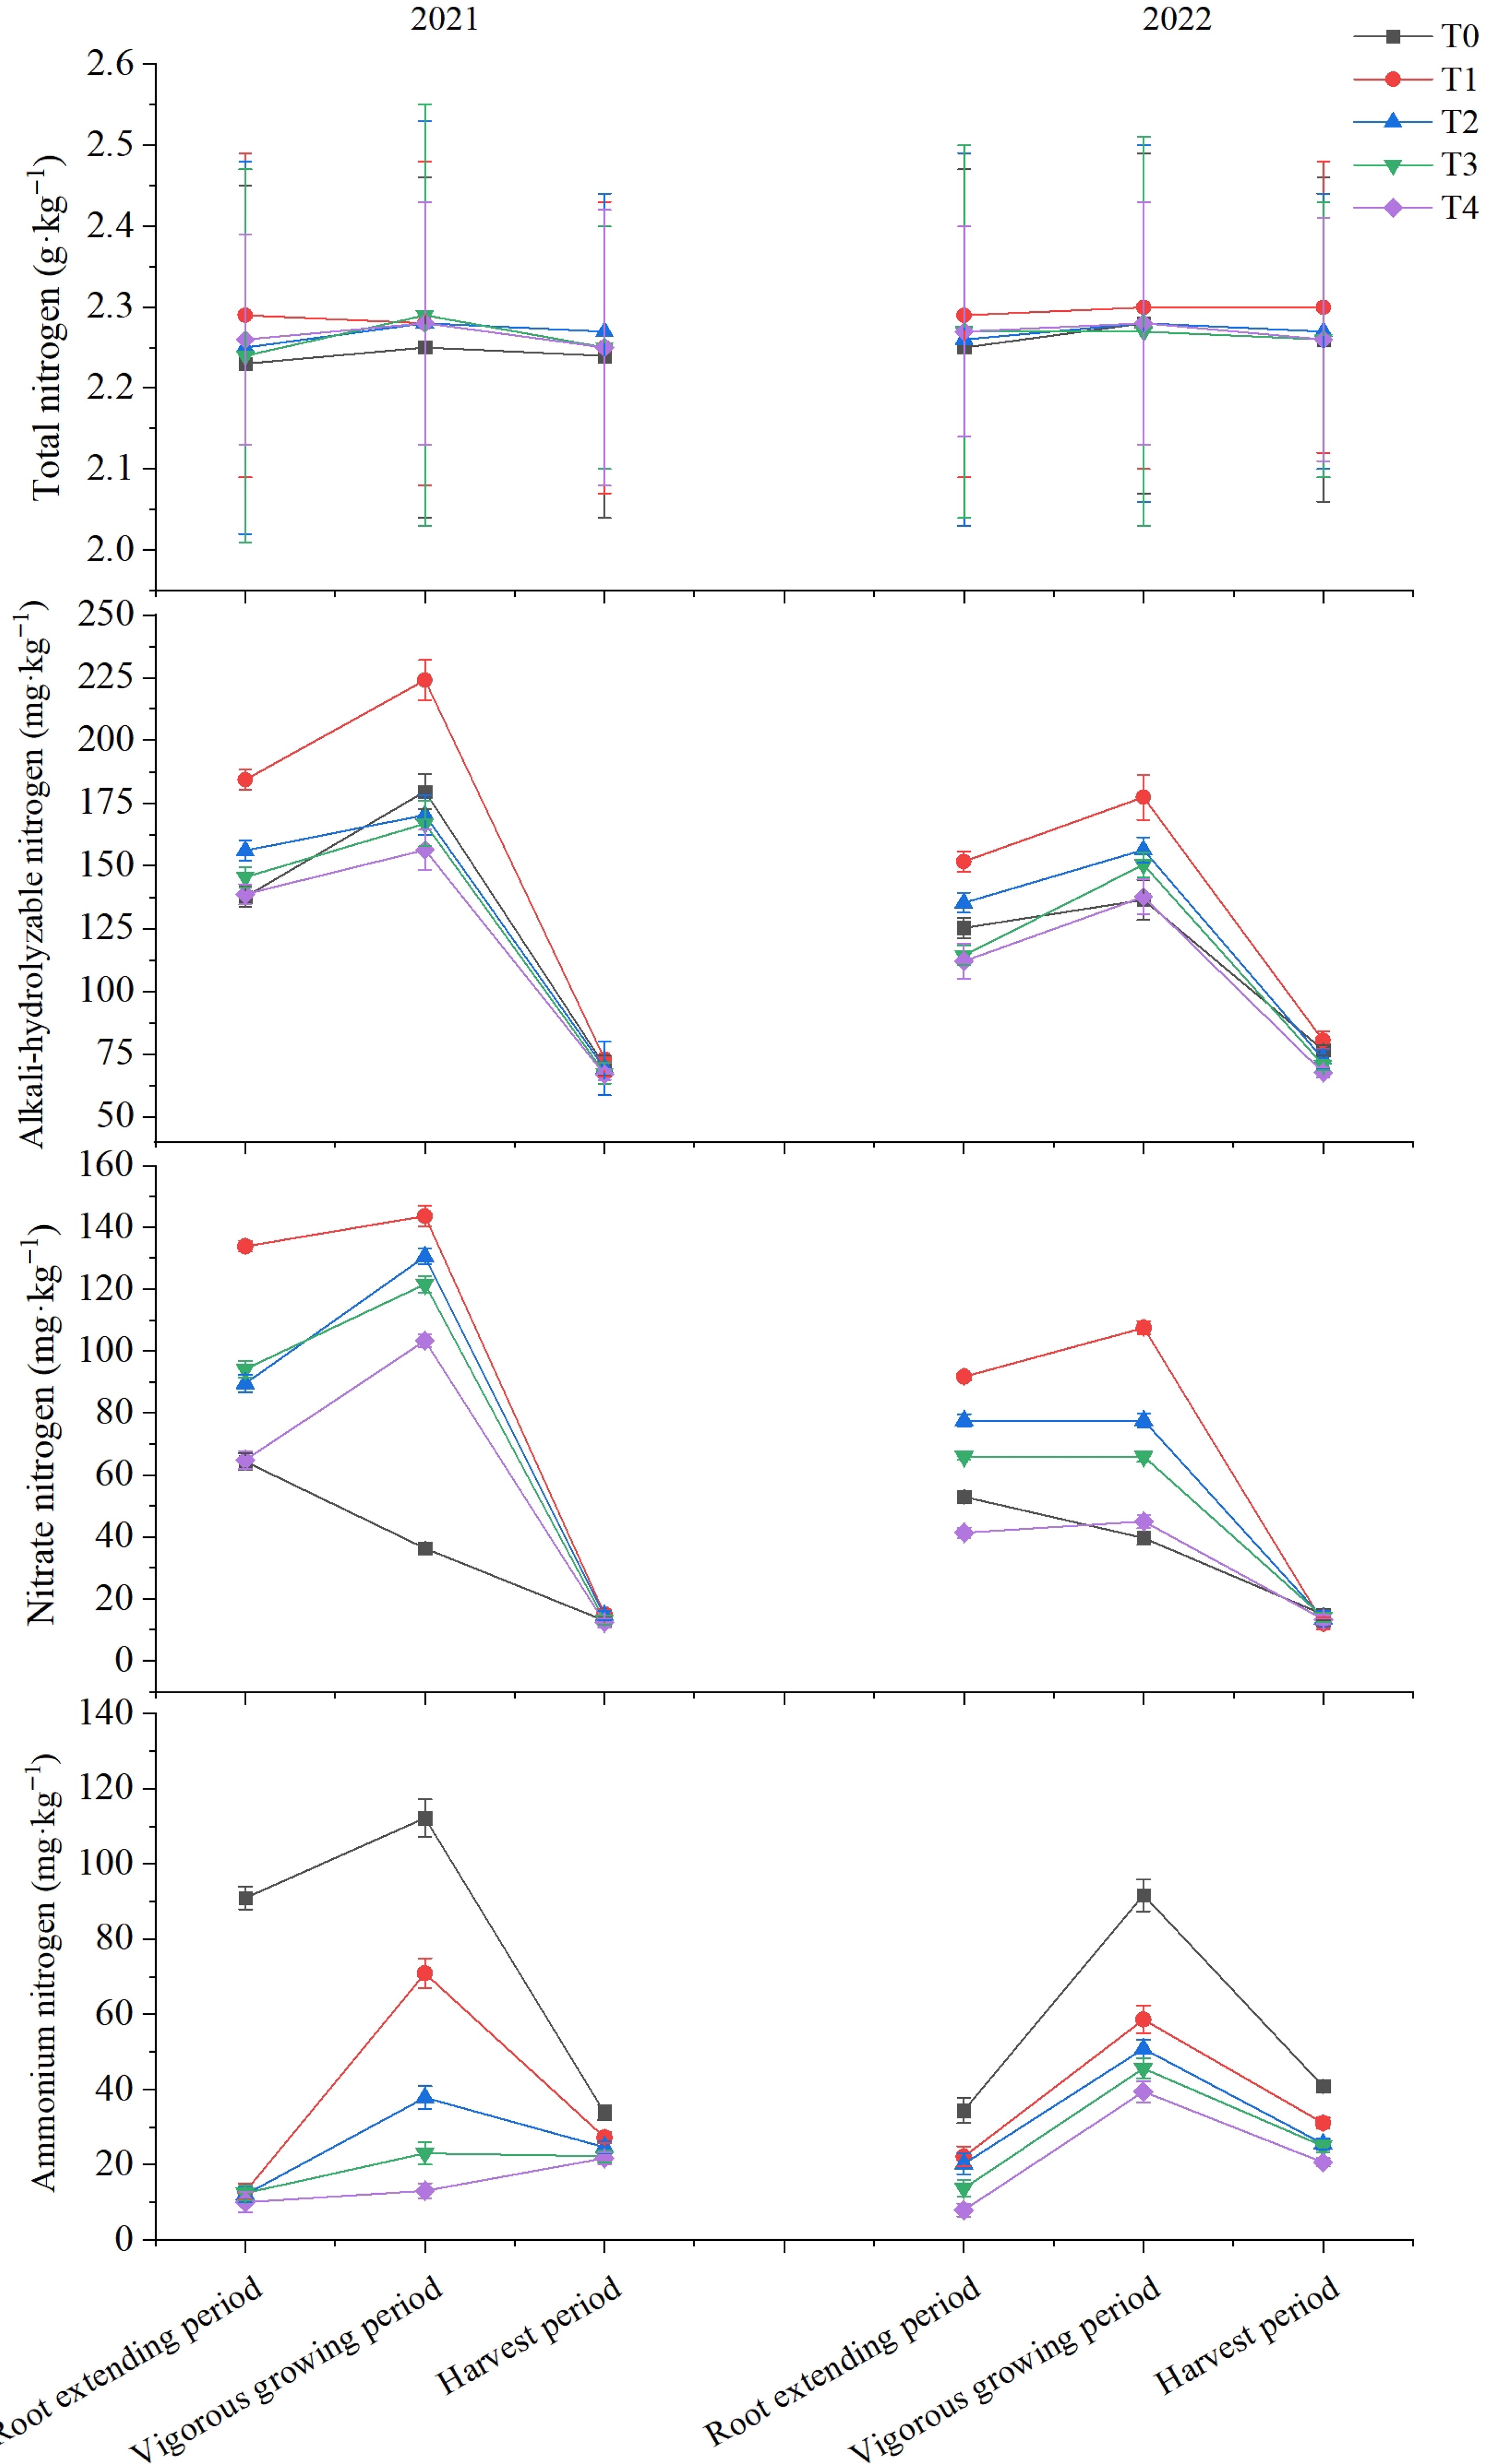
      Figure 1. 

      Effect of reduced nitrogen fertilizer application combined with biochar on nitrogen content of different forms in flue-cured tobacco cultivated soils.

      Table 2 revealed that during the two-year period, the biochar treatments significantly increased soil pH, organic matter content, porosity, and field water-holding capacity compared to the T0 treatment. Besides, these treatments significantly reduced soil bulk density, implying that biochar amendment is crucial in regulating soil pH values, organic matter content, soil porosity, and moisture capacity in acidic soil.

      Table 2.  Effect of reduced nitrogen fertilizer application combined with biochar on physicochemical properties in flue-cured tobacco cultivated soils.

      YearTreatmentpHSoil organic matter
      (g·kg−1)
      Bulk density
      (g·cm−3)
      Porosity
      (%)
      Field moisture capacity
      (%)
      2021T04.96c29.07b1.34a49.44b33.70b
      T15.16a31.98a1.14b57.19a49.00a
      T25.18a31.32a1.12b57.99a47.33a
      T35.16a31.48a1.13b57.34a46.89a
      T45.15a31.40a1.12b57.74a44.23a
      2022T04.98c28.89b1.37a48.43b34.57b
      T15.15a31.76a1.18b55.45a47.00a
      T25.14a31.93a1.17b55.98a47.66a
      T35.17a31.41a1.14b56.79a46.56a
      T45.17a31.15a1.13b57.22a43.90a
    • The treatment with biochar significantly increased the abundance of the ammonia oxidation gene AOA-amoA and denitrification gene narG compared to the T0 treatment, with an improvement range of 14.72% to 19.63% and 26.37% to 41.76%, respectively. The abundance of the denitrification gene norB was significantly lower than the T0 treatment, with a decreased range of 33.14% to 80.63%. As the nitrogen application decreased, the abundance of nitrogen cycling functional genes showed varying degrees of decrease between the denitrification treatments. However, the T2 and T3 treatments still significantly increased the abundance of the nitrification, nitrogen fixation, ammoniation, organic nitrogen synthesis genes, including nxrA, nifH, UreC, and gdh, with improvement ranges of 96.31% to 166.81%, 17.60% to 131.71%, 16.88% to 118.18%, and 24.04% to 74.22%, respectively (Fig. 2 & Supplemental Table S2).
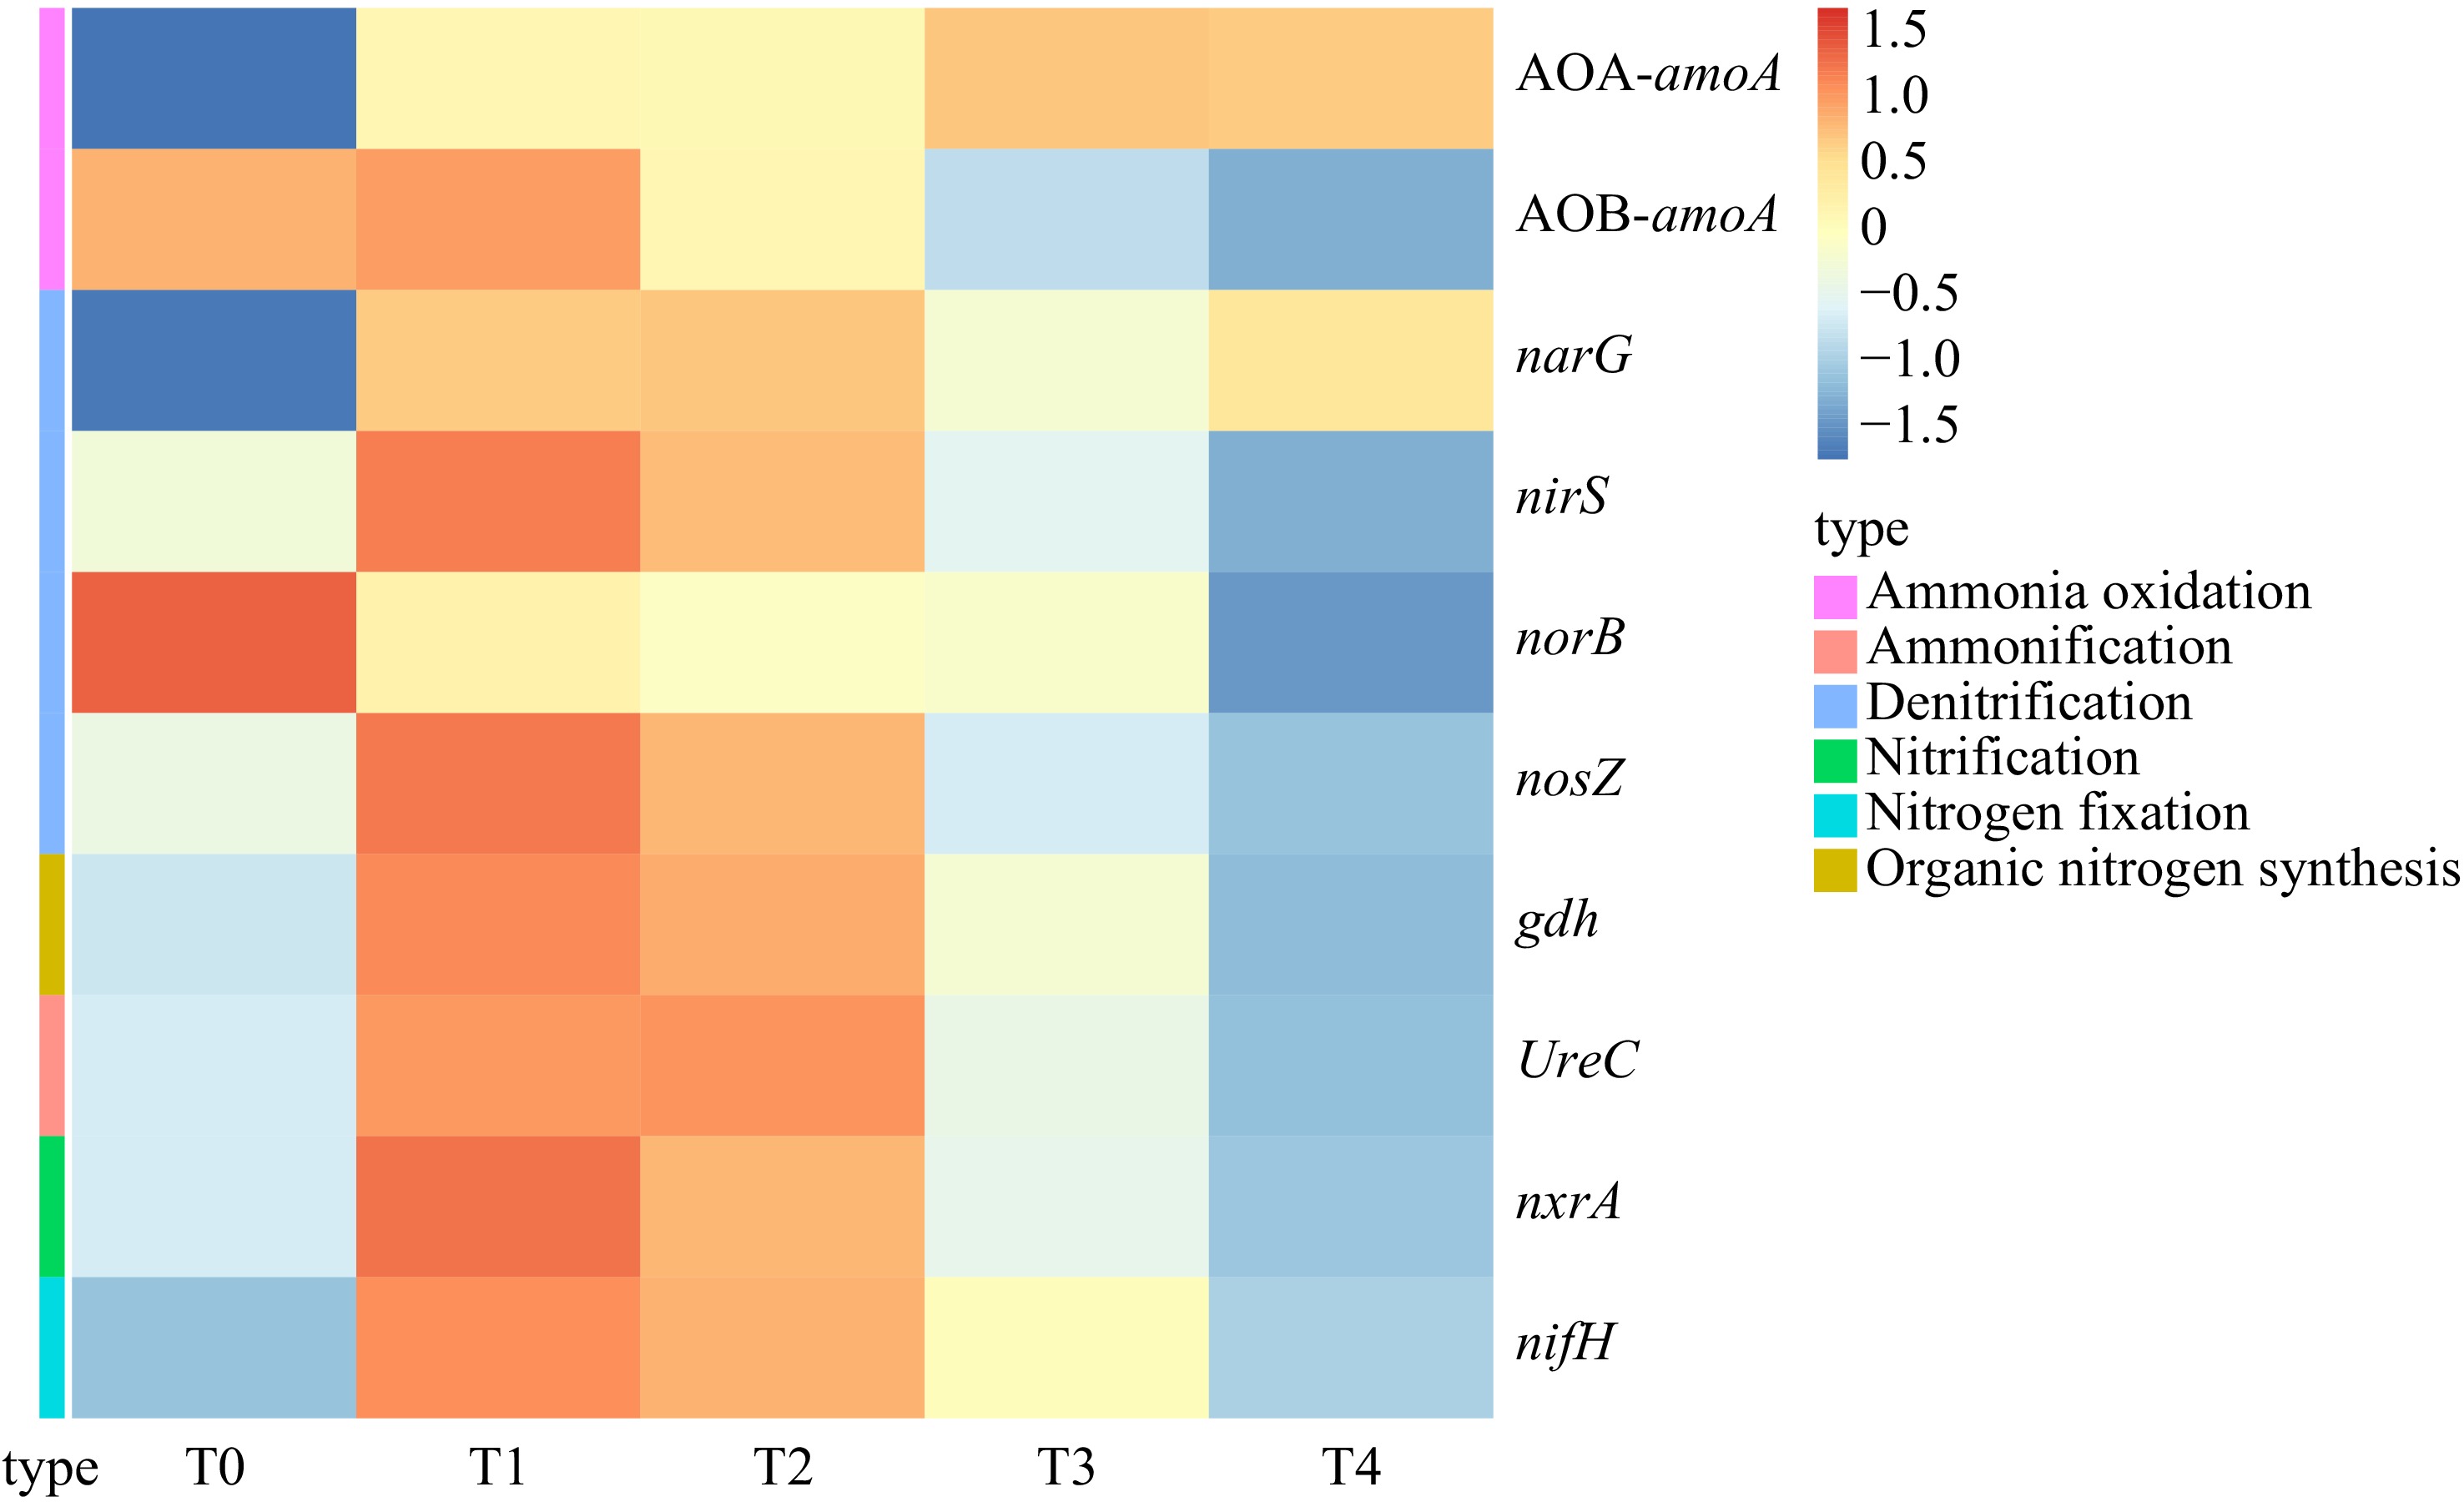
      Figure 2. 

      Difference of nitrogen cycle function gene abundance among different treatments and control.

    • Random forest model analysis results (Fig. 3) showed that nitrogen cycling functional genes have a significant impact on the nitrogen uptake efficiency of tobacco, with a total explanatory rate of 90.08% (p < 0.001). Among them, nitrogen fixation, organic nitrogen synthesis, ammonification, and denitrification genes, including nifH, gdh, UreC, and nirS were significantly correlated (p < 0.01) with nitrogen uptake efficiency, respectively. The nitrification and denitrification genes, including nxrA and nosZ were significantly correlated (p < 0.05) with nitrogen uptake efficiency, respectively.
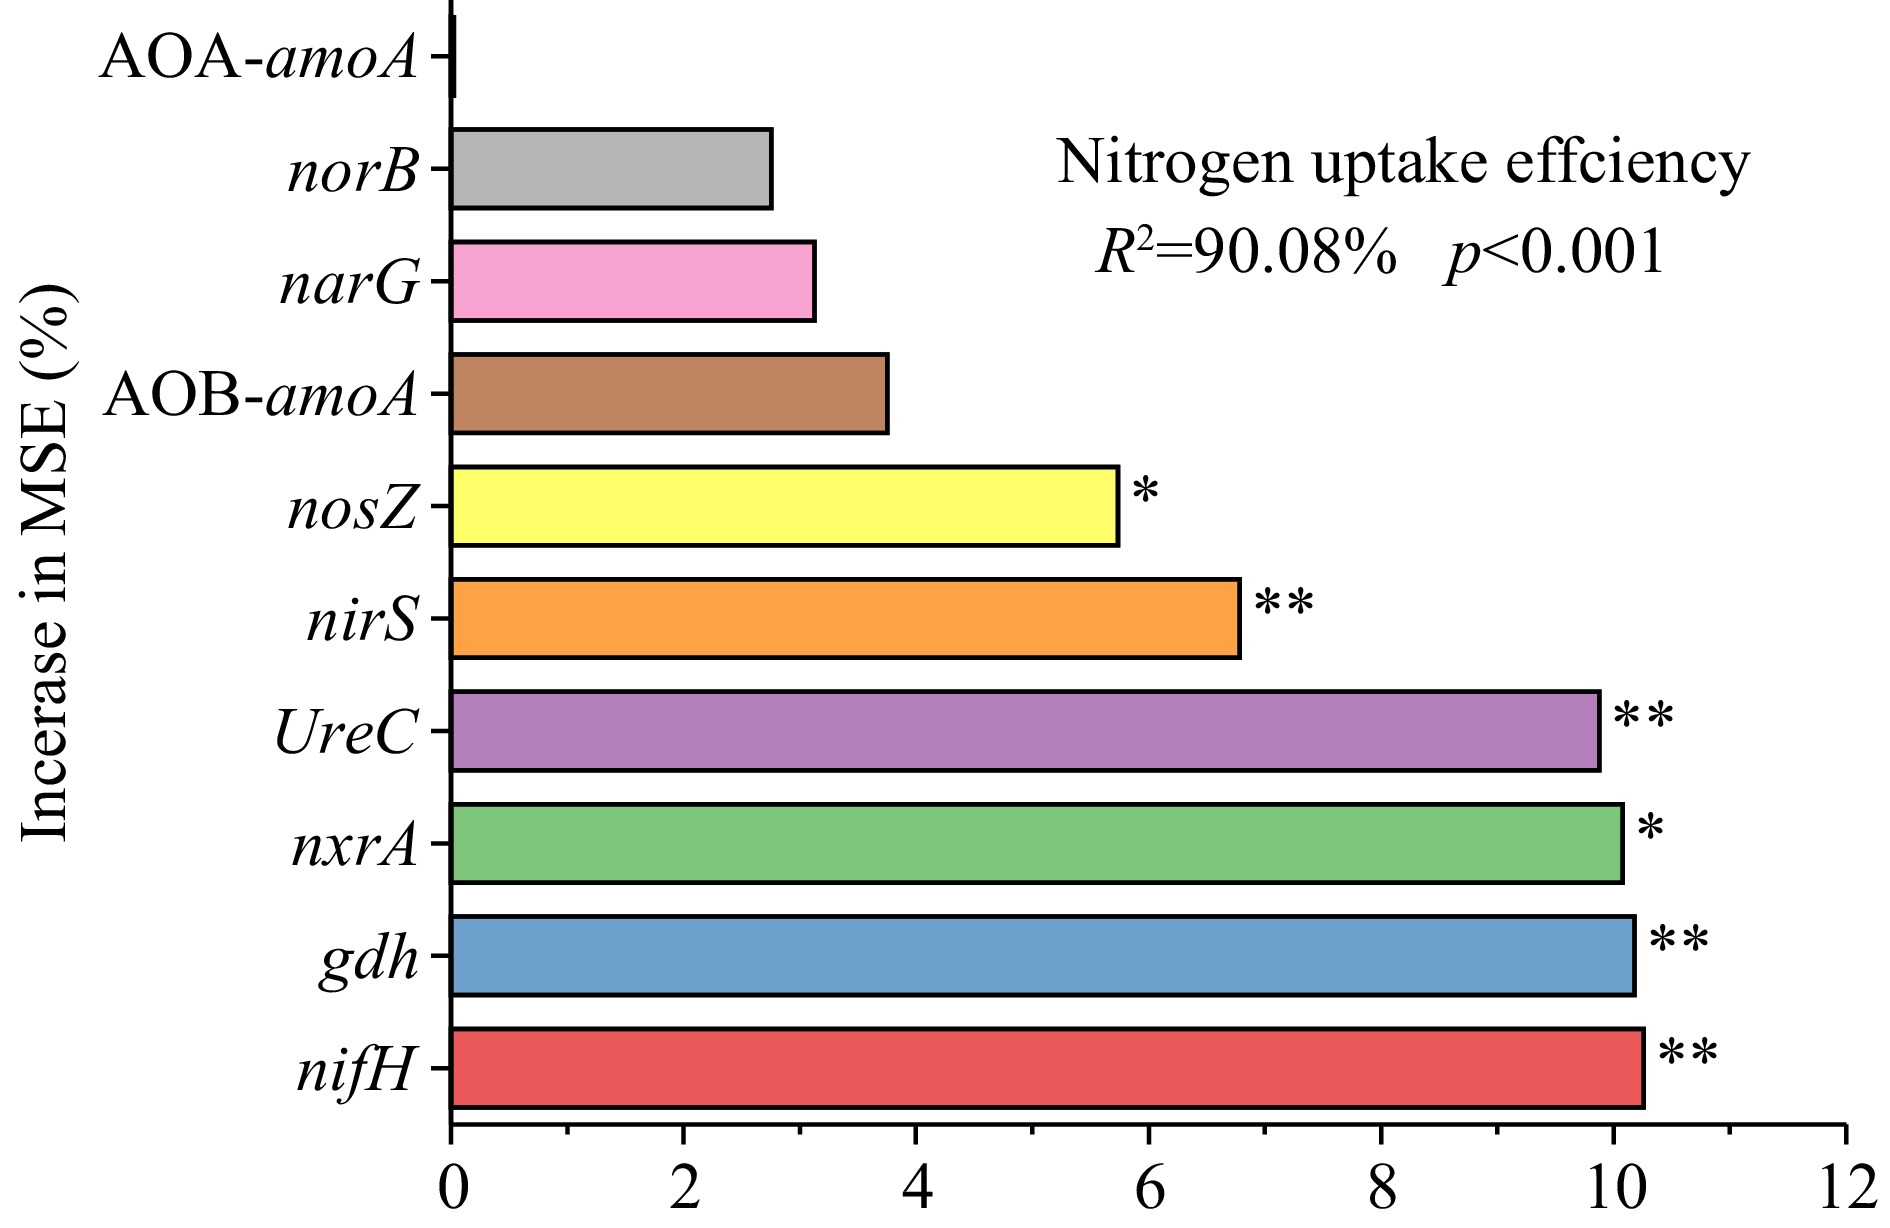
      Figure 3. 

      Random forest model predicts the relevance of nitrogen cycle functional genes on nitrogen uptake efficiency in flue-cured tobacco. Note: The precision importance measures were calculated for each tree in a random forest and averaged over the entire forest. The percentage increase in the mean squared error (MSE) of the variables was used to estimate the importance of these predictors.

      Regression analysis was conducted on tobacco plants' nitrogen accumulation and nitrogen uptake efficiency in 2021 and 2022 with different forms of nitrogen content during the vigorous growing period, as shown in Fig. 4. The nitrogen accumulation and nitrogen uptake efficiency of the whole plant showed a linear growth relationship with the nitrate nitrogen content, revealing slopes of 0.346 and 0.229, respectively (p < 0.001). The plant nitrogen accumulation also showed a stable, increasing trend with the alkali-hydrolyzable nitrogen content, exhibiting a slope of 0.43 (p < 0.01). Whereas the ammonium nitrogen content showed a negative growth trend with the nitrogen uptake efficiency (p < 0.01).
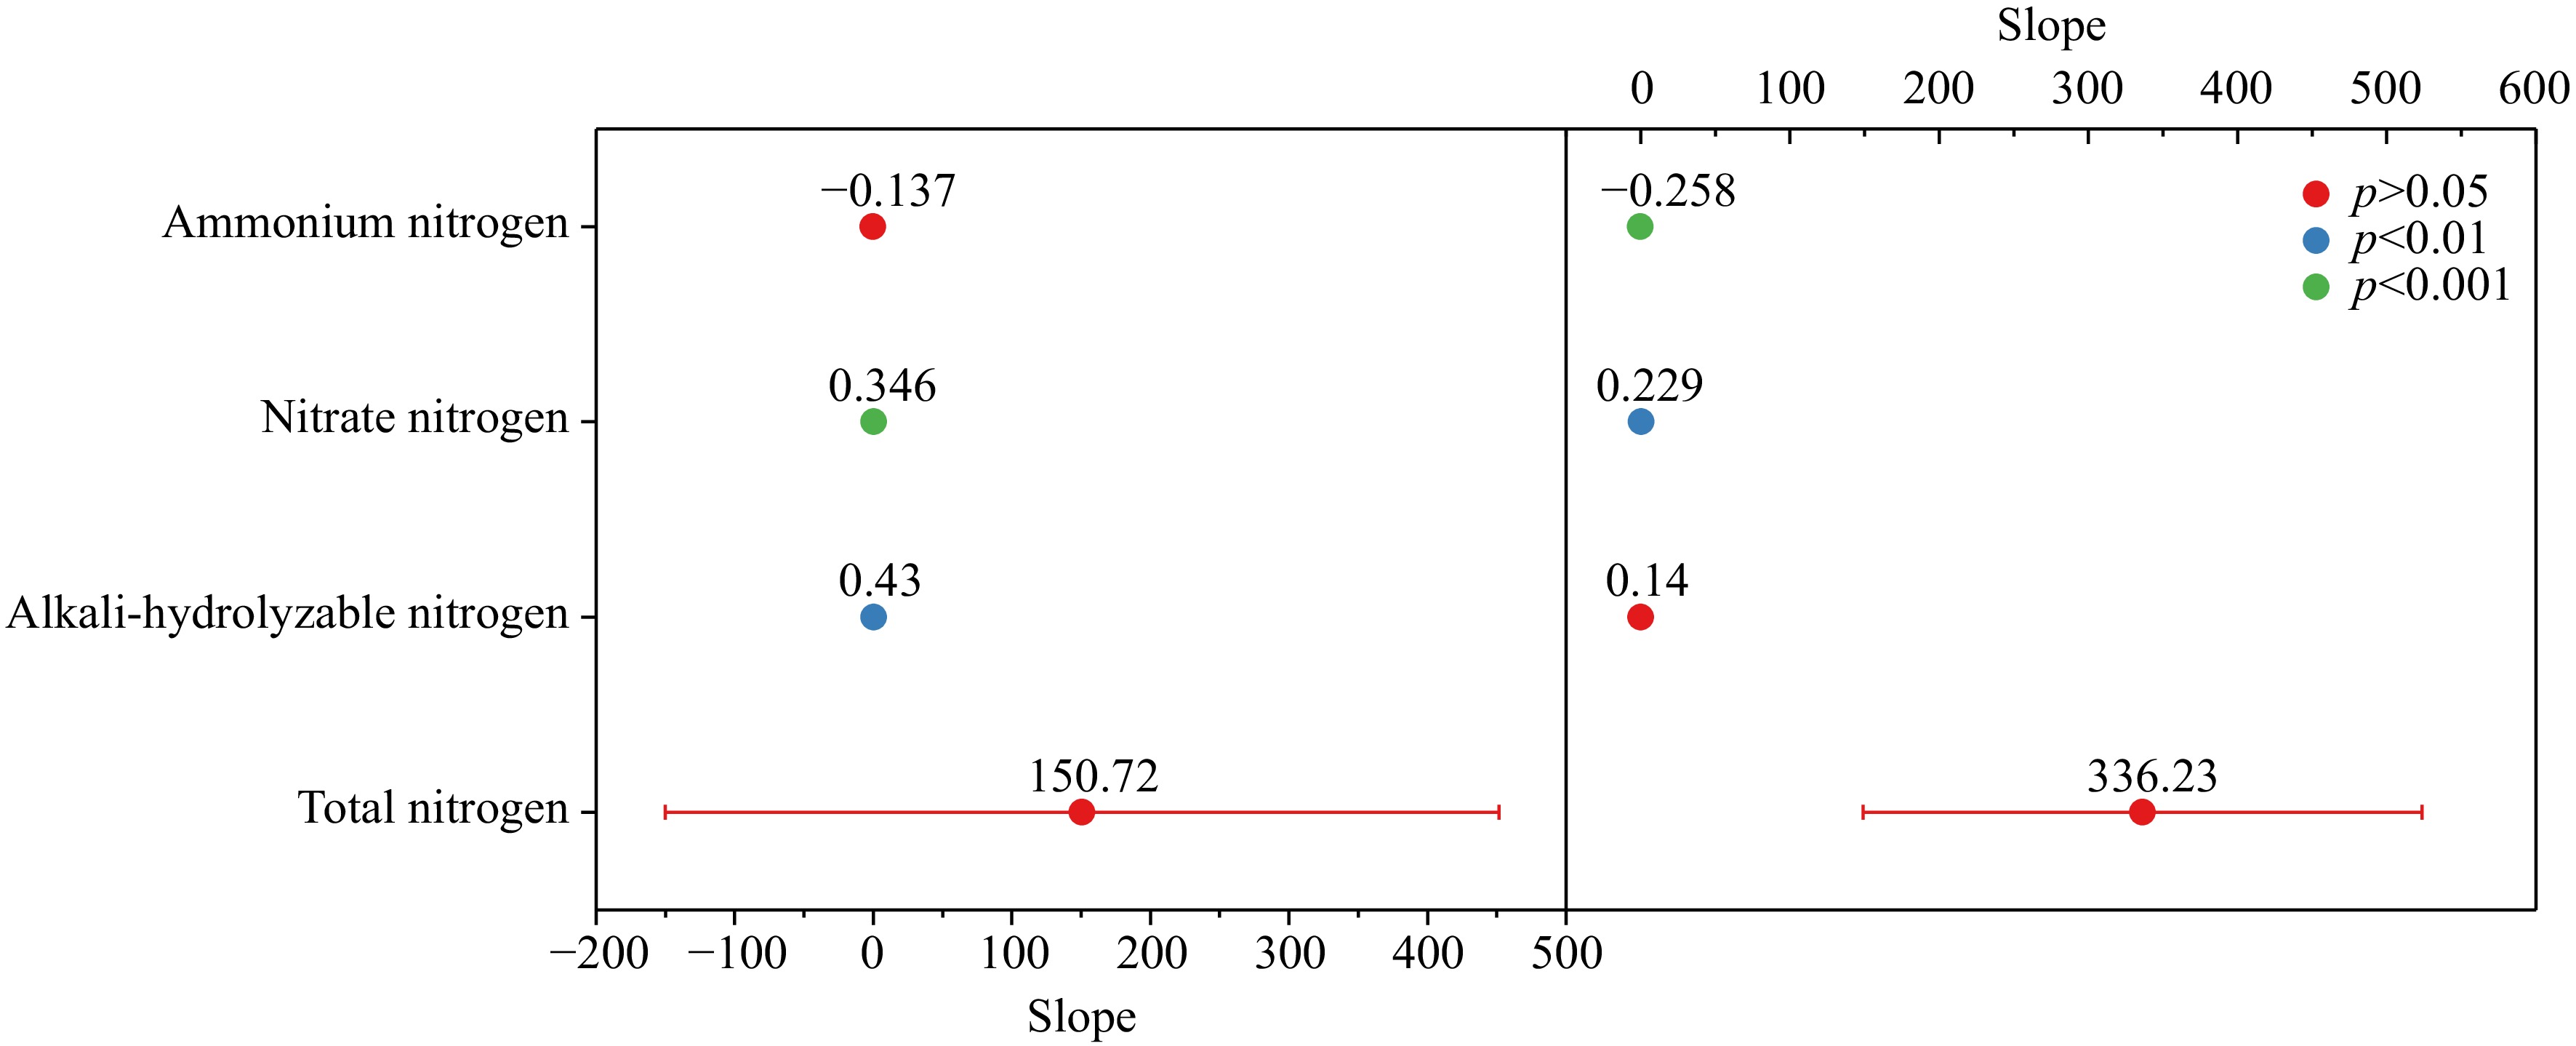
      Figure 4. 

      Regression analysis on different forms of nitrogen content and nitrogen accumulation, absorption and utilization efficiency in soil.

      The Mantel test results showed a highly significant positive correlation (p < 0.001) between the alkali-hydrolyzable nitrogen and nitrate nitrogen content and the abundance of UreC, nxrA, and nifH. Additionally, there was a significant negative correlation between the nitrate nitrogen content and the abundance of the norB gene (p < 0.05). A highly significant positive correlation was also observed (p < 0.001) between the ammonium nitrogen content and the abundance of the norB and AOB-amoA, while there was a significant negative correlation (p < 0.001) between the ammonium nitrogen content and the abundance of the AOA-amoA (Fig. 5).
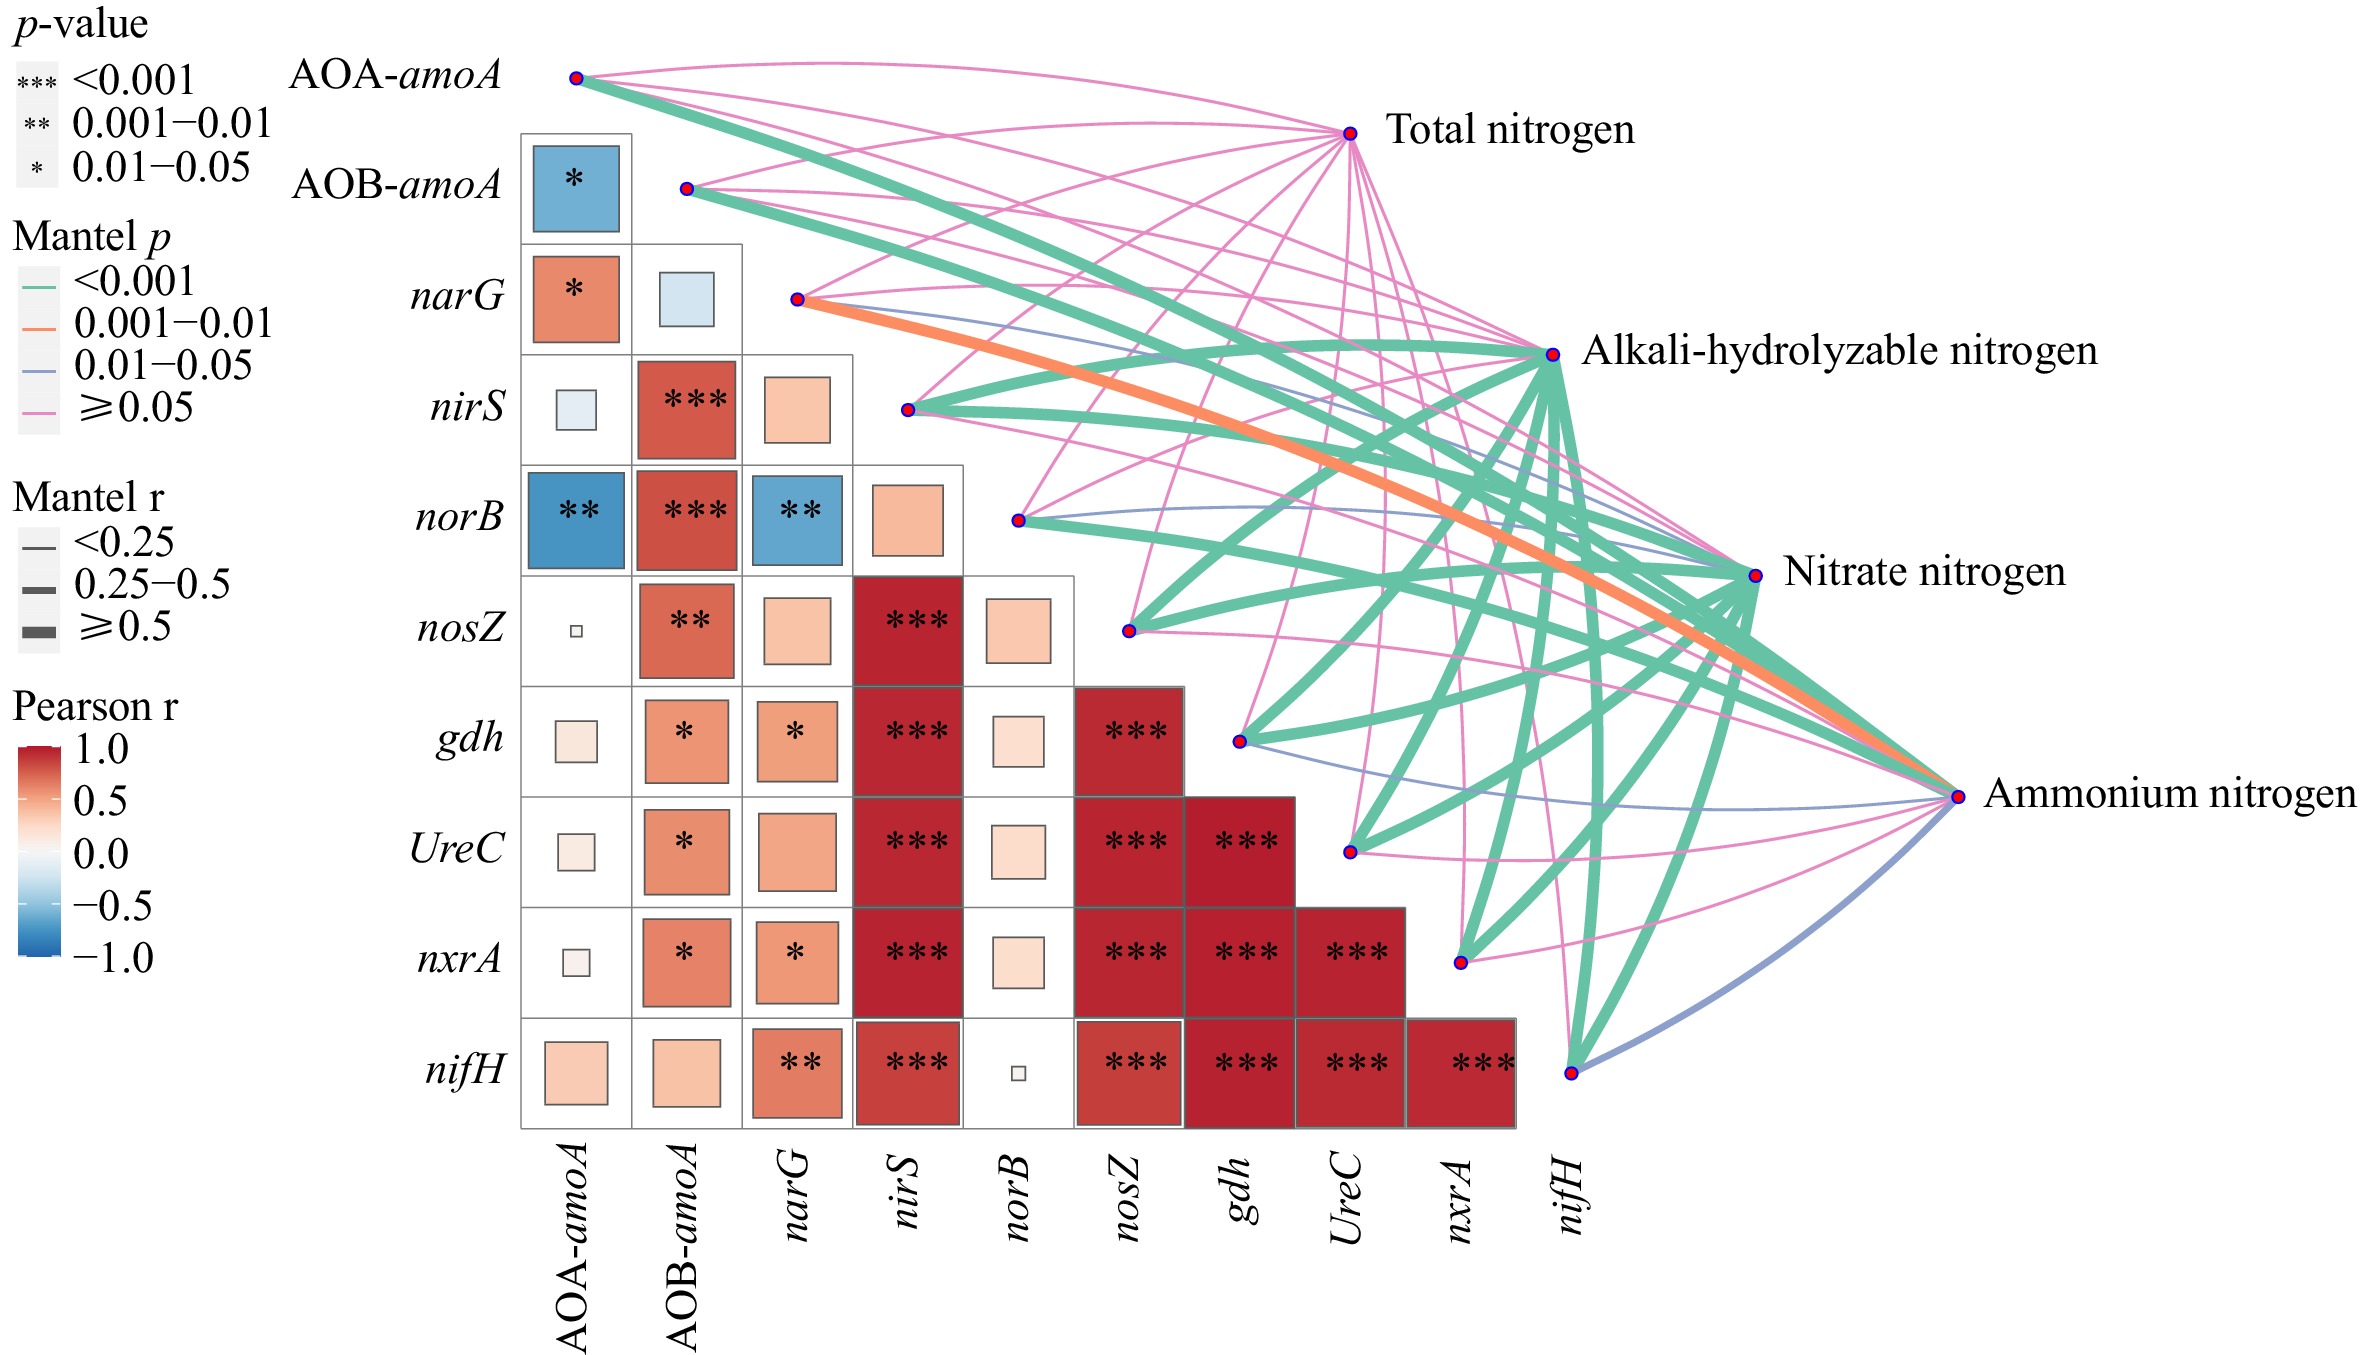
      Figure 5. 

      Mantel test of different forms of nitrogen content and nitrogen cycle function gene abundance.

      Further stepwise multiple regression analysis indicates that organic matter was the main factor influencing the abundance of most nitrogen cycling functional genes (AOB-amoA, gdh, nxrA, and nifH) in the rhizosphere soil (Table 3). Additionally, pH was an important soil physicochemical property influencing the ammonia oxidation gene AOA-amoA and denitrification gene norB. Whereas soil bulk density and porosity were the main factors influencing the nitrification gene nxrA.

      Table 3.  Soil physicochemical factors significantly related to the abundance of nitrogen cycle functional genes (screened by stepwise multiple regression).

      Dependent variableExplanatory variableR2P-value
      AOA-amoABulk density, pH0.78<0.01
      AOB-amoAOrganic matter0.75<0.01
      narGpH, field moisture capacity0.85<0.01
      nirSNA
      norBpH0.68<0.01
      nosZNA
      gdhOrganic matter0.41<0.05
      UreCNA
      nxrAOrganic matter, bulk density, porosity0.56<0.01
      nifHOrganic matter0.47<0.01
      Only explanatory variables with p < 0.05 are shown in the table. NA represents no best fit model, and R2 represents the proportion of variance explained by the model.
    • Biochar is widely used in various fields such as soil improvement and nitrogen reduction to enhance efficiency due to its excellent properties[24]. Ge et al.[25] showed that the application of biochar increased nitrogen uptake efficiency in tobacco plants even with a 15% reduction in nitrogen fertilizer. Furthermore, continuous biochar application has shown significant effects on nitrogen retention and improves the utilization efficiency of tobacco plants. We found that treating soil with a history of continuous tobacco-rice rotation (20 years) with reduced nitrogen and biochar application significantly increased the nitrogen accumulation and uptake efficiency of tobacco plants in the first year compared to the control treatment. This behavior aligns with the work conducted by Li et al.[26], wherein they revealed that maize nitrogen uptake and nitrogen content were largely driven by the addition of nitrogen fertilizer and biochar, triggering higher dry matter accumulation, leaf photosynthetic efficiency, and grain yields. Our finding also agrees with a previous study, demonstrating that the combined use of nitrogen and biochar fertilizer enhanced the effectiveness of biochar in improving nitrogen use efficiency in plants[27]. This suggests that combining nitrogen fertilizer with biochar promotes plants' assimilation and adsorption of nitrogen. It could serve as a nitrogen source, providing essential plant development and growth substrates[28]. This also indicates that appropriate reduction of nitrogen coupled with biochar application enhanced nitrogen absorption capacity in tobacco plants, with a certain degree of persistence[29]. Therefore, short-term moderate nitrogen reduction may not decrease the nitrogen accumulation in crops. Cheng et al.[30] found that applying biochar significantly increased the nitrogen allocation rate in crop harvest organs. We observed that the increase in nitrogen accumulation in tobacco is primarily due to an increase in nitrogen accumulation in the leaves. As nitrogen application decreases, the overall nitrogen accumulation in the tobacco plant decreases to varying degrees. However, in terms of nitrogen accumulation in the leaves, there is no significant difference between the T2, T3, and the T1 treatment. Additionally, these treatments significantly increased the nitrogen harvest index. Previous studies have highlighted the issue of 'source-sink imbalance' after biochar application, which affects the transport of nitrogen nutrients to crop harvest organs[31]. It can be observed that under low nitrogen fertilizer treatment, nitrogen in tobacco plants was supplied to the leaves of the plant and will not lead to excessive nitrogen retention in the root and stem organs, thus reducing nitrogen loss caused by agricultural waste.

      Previous studies have shown that during the vigorous growing period, tobacco plants rapidly increase their nitrogen uptake[32]. Applying biochar can significantly reduce the leaching of nitrate nitrogen in tobacco soil through its adsorption capacity[33]. We noticed that the inorganic nitrogen content reached its highest value during the vigorous growing period, and the biochar treatments significantly increased the nitrate nitrogen content and reduced the ammonium nitrogen content in the soil during this period. This behavior aligns with the work conducted by Han et al.[34], wherein they revealed that the nitrate nitrogen increased with biochar application and biochar application has little influence on the soil ammonium nitrogen. We believed this finding was associated with the enhancement of soil nitrification triggered by the application of biochar. However, with the decrease in nitrogen application rate, the difference in mineral nitrogen content between the treatment with 10% to 20% nitrogen reduction and biochar application and the control treatment was not significant. This suggests that moderate nitrogen reduction combined with biochar application is beneficial for improving soil fertility, which is similar to the findings reported by Sarfraz et al.[35]. This is mainly due to the fact that biochar itself provides nutrients and retains them, and also alters the dynamics of soil microorganisms, thus promoting biological carbon fixation to enhance soil fertility[36].This study also found that the biochar treatments reduced the ammonium nitrogen content in the soil at the harvest period, and the alkali-hydrolyzable nitrogen content of the soil at the harvest period decreased significantly with the decrease in nitrogen application rate. This may be attributed to more nitrogen being absorbed and utilized by the plants, which is of significance in reducing nitrogen loss and alleviating soil compaction and acidification[37]. Further regression analysis of soil nitrogen content and tobacco nitrogen metabolism indicators revealed a linear increase between the whole plant nitrogen accumulation and nitrogen uptake efficiency and the nitrate nitrogen content, while the ammonium nitrogen content showed a negative growth trend with nitrogen uptake efficiency. This is consistent with previous research, suggesting that tobacco prefers nitrate nitrogen in nitrogen source absorption[38]. This indicates that applying biochar can significantly increase the nitrate nitrogen content in the soil, thereby ensuring the accumulation of nitrogen in tobacco plants[16].

      Previous research by our team has revealed that biochar amendment in the tobacco-rice rotation system can significantly reduce soil N2O emissions in two seasons[39]. Chen et al.[40] found that the application of biochar significantly increased soil AOA abundance. Prommer et al.[41] found that the application of biochar significantly enhanced soil nitrification. Here, biochar treatments significantly increased the abundance of the ammonia oxidation gene AOA-amoA compared to the control treatment while reducing the abundance of the denitrification gene norB. norB is responsible for the intensity of N2O conversion in nitrogen cycling. Therefore, this study further validates the research results of our team. Due to the potential correlation between the abundance of nitrogen cycling functional genes and nitrogen balance, high input of nitrogen fertilizer may lead to an increase in the abundance of nitrification and denitrification-related functional genes, resulting in potential risks such as nitrogen loss and decreased nitrogen fertilizer uptake efficiency[42]. In this experiment, as the nitrogen application rate decreased, the abundance of nitrogen cycling functional genes in the nitrogen reduction treatments showed varying degrees of decline, which is beneficial in reducing the risk of nitrogen loss in the soil. However, the nitrogen reduction treatments of 10%~20% still showed a significant increase in the abundance of nitrification gene nxrA, nitrogen fixation gene nifH, ammoniation gene UreC, and organic nitrogen synthesis gene gdh compared to the control treatment (T0). This may be attributed to the application of biochar, which provides a favorable habitat for microorganisms, enabling the nitrogen cycling functional genes to maintain a higher abundance even under a reduced nitrogen supply[43]. The specific mechanisms behind this phenomenon require further investigation incorporating microbiological studies. Random forest model analysis revealed that nitrogen cycling functional genes accounted for a total of 90.08% of the variability in tobacco nitrogen uptake efficiency, indicating that these genes can effectively predict the level of nitrogen absorption and utilization in tobacco. Among them, nitrogen fixation gene nifH, organic nitrogen synthesis gene gdh, and ammoniation gene UreC showed a highly significant correlation with nitrogen uptake efficiency, while nitrification gene nxrA showed a significant correlation. The transformation of different forms of nitrogen in the soil relies on the mediation of nitrogen cycling functional genes[44]. Liu et al.[45] demonstrated through redundancy analysis that soil nitrate nitrogen and ammonium nitrogen content were most closely associated with the abundance of nitrogen cycling functional genes in the soil. Mantel test results showed the atalkali-hydrolyzable nitrogen and nitrate nitrogen content exhibited a highly significant positive correlation with the abundance of ammoniation gene UreC, nitrification gene nxrA, and nitrogen fixation gene nifH. This may explain why the nitrogen uptake efficiency maintained a higher level even under the nitrogen reduction treatments.

      Changes in soil carbon content can have a significant impact on nitrogen cycling[46]. Previous studies have shown that exogenous carbon input can enhance plant growth and ecosystem carbon sequestration. It can also improve nitrogen availability by increasing biological nitrogen fixation and mineralization, while reducing nitrogen leaching. In addition, exogenous carbon input can increase soil microbial abundance, significantly increasing the abundance of bacteria, methanogens, methane-oxidizing bacteria, and ammonia-oxidizing bacteria in the 10−20 cm soil layer[47, 48]. When biochar is applied to the soil as an exogenous material, the organic carbon it carries can serve as a carbon source for nitrogen cycling microorganisms, promoting their growth and reproduction. Our findings showed that the application of biochar can significantly increase soil pH and organic matter content. Further regression analysis reveals that organic matter content significantly influences the abundance of gdh, nxrA, and nifH genes, making it one of the most important physicochemical properties affecting the abundance of nitrogen cycling functional genes. Additionally, pH also significantly influences the abundance of ammonia oxidation genes AOA-amoA and denitrification gene norB. In this experiment, the improvement of soil bulk density and porosity significantly increased the abundance of nitrification gene nxrA, possibly due to the provision of ample colonization space and oxygen to nitrifying microorganisms by biochar[41]. These results indicate that the application of biochar can enhance the abundance of nitrification genes, reduce the abundance of denitrification genes, and consequently increase the content of alkaline nitrogen and nitrate nitrogen in the soil, ultimately improving the nitrogen absorption and utilization efficiency of tobacco plants. Although moderate nitrogen reduction reduces the abundance of nitrogen cycling functional genes to some extent, compared to the control treatment, the abundance of nitrification gene nxrA, nitrogen fixation gene nifH, and ammonification gene UreC still showed significant improvement.

    • The findings of the two-year experiment showed that reduced nitrogen fertilizer application combined with biochar had a significant impact on nitrogen accumulation in tobacco plants. The trend of nitrogen accumulation was observed as T1 > T2 > T3 > T4, with T0 being the lowest. The use of biochar in combination with a 10%−20% nitrogen reduction (T2 and T3) does not show a significant difference in nitrogen uptake efficiency compared to the conventional nitrogen application treatment (T1). In the second year of the experiment, the nitrogen harvest index in T2 and T3 increased by 3.85% and 5.78%, respectively, compared to T1. The possible reason for maintaining a higher nitrogen uptake efficiency under nitrogen reduction conditions is the application of biochar, which improves soil pH, organic matter content, and soil porosity, thereby enhancing the abundance of nitrogen cycling genes in the rhizosphere soil and increasing the content of alkaline nitrogen and nitrate nitrogen in the soil. This experiment suggests that under the condition of full-surface application of biochar (30 t·ha−1), a reduction of 10%−20% in nitrogen fertilizer can be achieved compared to conventional nitrogen application, thus sustainably promoting the production of tobacco.

    • The authors confirm contribution to the paper as follows: Conceptualization, Methodology, Investigation, Writing − original draft, Writing − review & editing: Zhang B; investigation, formal analysis, visualization: Tang L, Wang Y, Yang M, Pan R, Pan M, Chen X, You L; Investigation, Data curation: Huang J, Lin W. All authors reviewed the results and approved the final version of the manuscript.

    • The data in this paper are free from any conflict of interest. The data that support the findings of this study are available from the corresponding author upon reasonable request.

      • This research was supported by the Fujian Branch of China National Tobacco Corporation, China (2019350000240143).

      • The authors declare that they have no conflict of interest. Wenxiong Lin is the Editorial Board member of Technology in Agronomy who was blinded from reviewing or making decisions on the manuscript. The article was subject to the journal's standard procedures, with peer-review handled independently of this Editorial Board member and the research groups.

      • Supplemental Table S1 qRT-PCR primers for key functional genes of nitrogen cycle in rhizosphere soil.(2022).
      • Supplemental Table.S2 Significance analysis of the difference in abundance of functional genes of nitrogen cycle between different treatments and control (%) (2022).
      • Copyright: © 2023 by the author(s). Published by Maximum Academic Press, Fayetteville, GA. This article is an open access article distributed under Creative Commons Attribution License (CC BY 4.0), visit https://creativecommons.org/licenses/by/4.0/.
    Figure (5)  Table (3) References (48)
  • About this article
    Cite this article
    Zhang B, Tang L, Wang Y, Yang M, Pan R, et al. 2023. Effect of reduced nitrogen fertilizer application combined with biochar on nitrogen utilization of flue-cured tobacco and its association with functional gene expressions of the nitrogen cycle in rhizosphere soil. Technology in Agronomy 3:12 doi: 10.48130/TIA-2023-0012
    Zhang B, Tang L, Wang Y, Yang M, Pan R, et al. 2023. Effect of reduced nitrogen fertilizer application combined with biochar on nitrogen utilization of flue-cured tobacco and its association with functional gene expressions of the nitrogen cycle in rhizosphere soil. Technology in Agronomy 3:12 doi: 10.48130/TIA-2023-0012

Catalog

  • About this article

/

DownLoad:  Full-Size Img  PowerPoint
Return
Return