-
Demand for organic produce and products continues to increase worldwide. The organic market was valued at more than $42 billion in the United States and more than $97 billion globally in 2017[1]. Sales of organic crops in the U.S. have increased by 38% since 2016, and organic leafy greens, including lettuce and spinach, account for nearly $600 million in annual sales[2]. Organic agriculture is based on principles of sustainability and conservation of the natural environment. Although modern farming technologies can be utilized, the use of synthetic substances are prohibited, such as inorganic fertilizers or chemical pesticides. Because of this, organic farming must rely on natural substances for managing pests, and organic based fertilizers such as manure or compost. However, this can result in lower productivity (i.e. yield) compared to conventional farming. Many studies have been published on the yield gap between organic and conventional agriculture, and meta-analysis of the data indicates a yield gap of 19%[3]. However, this gap is highly contextual. Depending on the management practice and type of crops, organic yields can be comparable to conventional yields[4]. Therefore, there is need for data driven information and application of organic materials and practices for effective and productive organic agriculture.
In the 2017 fall meeting, the National Organic Standard Board (NOSB) passed a motion to allow hydroponically grown crops be eligible for certification[5]. Although organic hydroponic production has been debated due to its soilless nature[6], this decision will inevitably raise interest and allow U.S. growers to produce certified organic produce using organic culture in hydroponic systems. However, there has been very little research-based information on organic culture for hydroponics. This is partly because organic certification of hydroponically grown crops are prohibited in most European countries[7]. Nevertheless, there is a need for scientific research and quantitative data on organic culture in hydroponic systems to guide and support this burgeoning industry.
Greenhouse hydroponic production of leafy greens is expanding globally and is an important component of the world's food supply[8]. Hydroponics is an excellent method to produce leafy greens due to its soilless nature and ability to recirculate water and nutrients. For example, lettuce production in hydroponics can increase yield tenfold while using 90% less water compared to traditional field agriculture[9]. Because of this, hydroponics is commonly used in controlled environment agriculture (CEA) which includes greenhouses, high tunnels, and indoor plant factories[10]. CEA is expected to play a critical role in reinforcing food security in urban areas[11]. Despite these positive aspects, hydroponic production relies largely on water-soluble inorganic fertilizers and conventional substrates. However, there is potential to combine the productiveness of hydroponics with organic fertilizers and practices.
Although organic hydroponic production is possible, there is limited research available on the topic. Williams and Nelson[12] grew organic lettuce in a nutrient film technique (NFT) hydroponic system but noted challenges in organic fertilizer management compared to conventional. Shinohara et al.[13] reported the successful use of microorganisms to mineralize the organic fertilizer into available forms of nutrients essential for plant growth. Therefore, the addition of microorganisms to mineralize the organic fertilizer might be critical for effective organic hydroponic production. However, there is limited information on the process of mineralization and even less quantitative data on its effectiveness in organic hydroponics. For example, Saijai et al.[14] stated that pH was one of most important factors that influenced the rate of mineralization, but other factors can contribute as well, such as the makeup of the organic fertilizer.
There are many commercially available products for organic hydroponic production, including liquid organic fertilizers that are made from a variety of materials derived from plant and animal sources, including fish and seaweed emulsions, fish hydrolysates, and oilseed extract. There are also many challenges in using liquid formulations of organic fertilizers, namely, clogged tubing in the delivery system, biofilm formation, low nitrogen availability, and possibly high content of unwanted minerals such as sodium[12,15]. Another challenge is that some organic fertilizers contain beneficial microbes while others do not. To make matters more complicated, many products do not have accurate or detailed listing of the compositions and/or concentrations of the nutrients due to proprietary reasons.
Microbial inoculants are beneficiary microorganisms applied to either soil or plant to improve productivity and crop health through enhanced mineralization of organic fertilizers and nutrient availability. Low nutrient availability is one of the primary causes of low yield in organic culture. Therefore, the purpose of this study was to evaluate the performance of lettuce in a hydroponic system using a commercially available certified organic liquid fertilizer compared to a conventional inorganic fertilizer. Additionally, a commercially available microbial inoculant was used to evaluate the mineralization process and quantify its effectiveness on the growth and quality of lettuce in a hydroponic system.
-
Lettuce seed (Lactuca sativa L. 'Red Mist', Osborne Seed Company, Mount Vernon, WA), was sown in 25-mm coconut coir plugs (Riococo, Irving, TX). Both seed and substrate were certified USDA Organic. Plugs were soaked in reverse osmosis (RO) water until fully expanded and then placed in 128-cell trays. A single seed was sown per plug and trays were placed in an indoor propagation rack. Plastic domes were used to cover the trays to maintain high relative humidity during germination. A heating mat was placed underneath the tray to warm the substrate to 24 °C. After germination, domes were removed and two broad band full spectrum LED light bars (Illumitex, Austin, TX) with a photosynthetic photon flux density (PPFD) of 150 µmol m−2 s−1 were turned on for a 16-h photoperiod. Two fans measuring 10 cm in diameter were used to provide air circulation in the propagation shelf while the lights were on. Seedlings were sub-irrigated daily with half-strength nutrient solution at an electrical conductivity (EC) of 1.0 mS cm−1 and a pH of 5.6. When seedlings reached sufficient growth with two expanded true leaves, they were moved to a greenhouse to harden-off before transplanting. At approximately 14 days after sowing (DAS), uniform seedlings were transplanted to six nutrient film technique (NFT) hydroponic systems (Cropking, Lodi, OH).
NFT hydroponic systems
-
There was a total of six independent NFT hydroponic systems, each with four channels measuring 2.4 m with 12 holes (2.5 cm diameter) for a total of 48 plants per system. Each system had a 94.6-L reservoir tank with a submersible pump (1,512 L h−1) that pumped the nutrient solution to the channels via polytube plumbing and drip lines. There was a single drip line per channel with a flow rate of 39 L h−1. The channels were positioned on an aluminum frame with a decline of 3% from the inlet to the outlet of the nutrient solution to provide constant flow of a thin film of solution inside the channel. The solution drained out the outlet end of the channel into a manifold that recirculated the solution to the reservoir tank.
Greenhouse environment
-
Two replicated greenhouse experiments were conducted at the Texas A&M AgriLife Research Center in Dallas, TX (32°59'13.2"N, 96°45'59.8"W; elevation 131 m) from 29 May to 12 June 2020 (Experiment 1) and 24 June to 09 July 2020 (Experiment 2). The greenhouse temperature was controlled by a heating, ventilation, and air conditioning (HVAC) system equipped in the adjacent office building. Throughout each experiment, greenhouse air temperature and photosynthetic active radiation (PAR) were recorded by a datalogger (Campbell Scientific Inc., Logan, UT). The actual daily average air temperature and daily light integral (DLI) for each experiment are presented in Fig. 1. The greenhouse was divided into two blocks to account for environmental differences between the east and west sides. Due to low DLI recorded prior to the start of the first experiment, supplemental light was provided by LED light fixtures (LumiGrow, Emeryville, CA) with a spectrum of blue, green, and red light (23%, 4%, and 73%, respectively) and a photosynthetic photon flux density (PPFD) of 143 µmol m−2 s−1 measured at plant height, to achieve a 16-h photoperiod throughout the treatment duration in Experiment 1. However, no supplemental lighting was provided in Experiment 2.
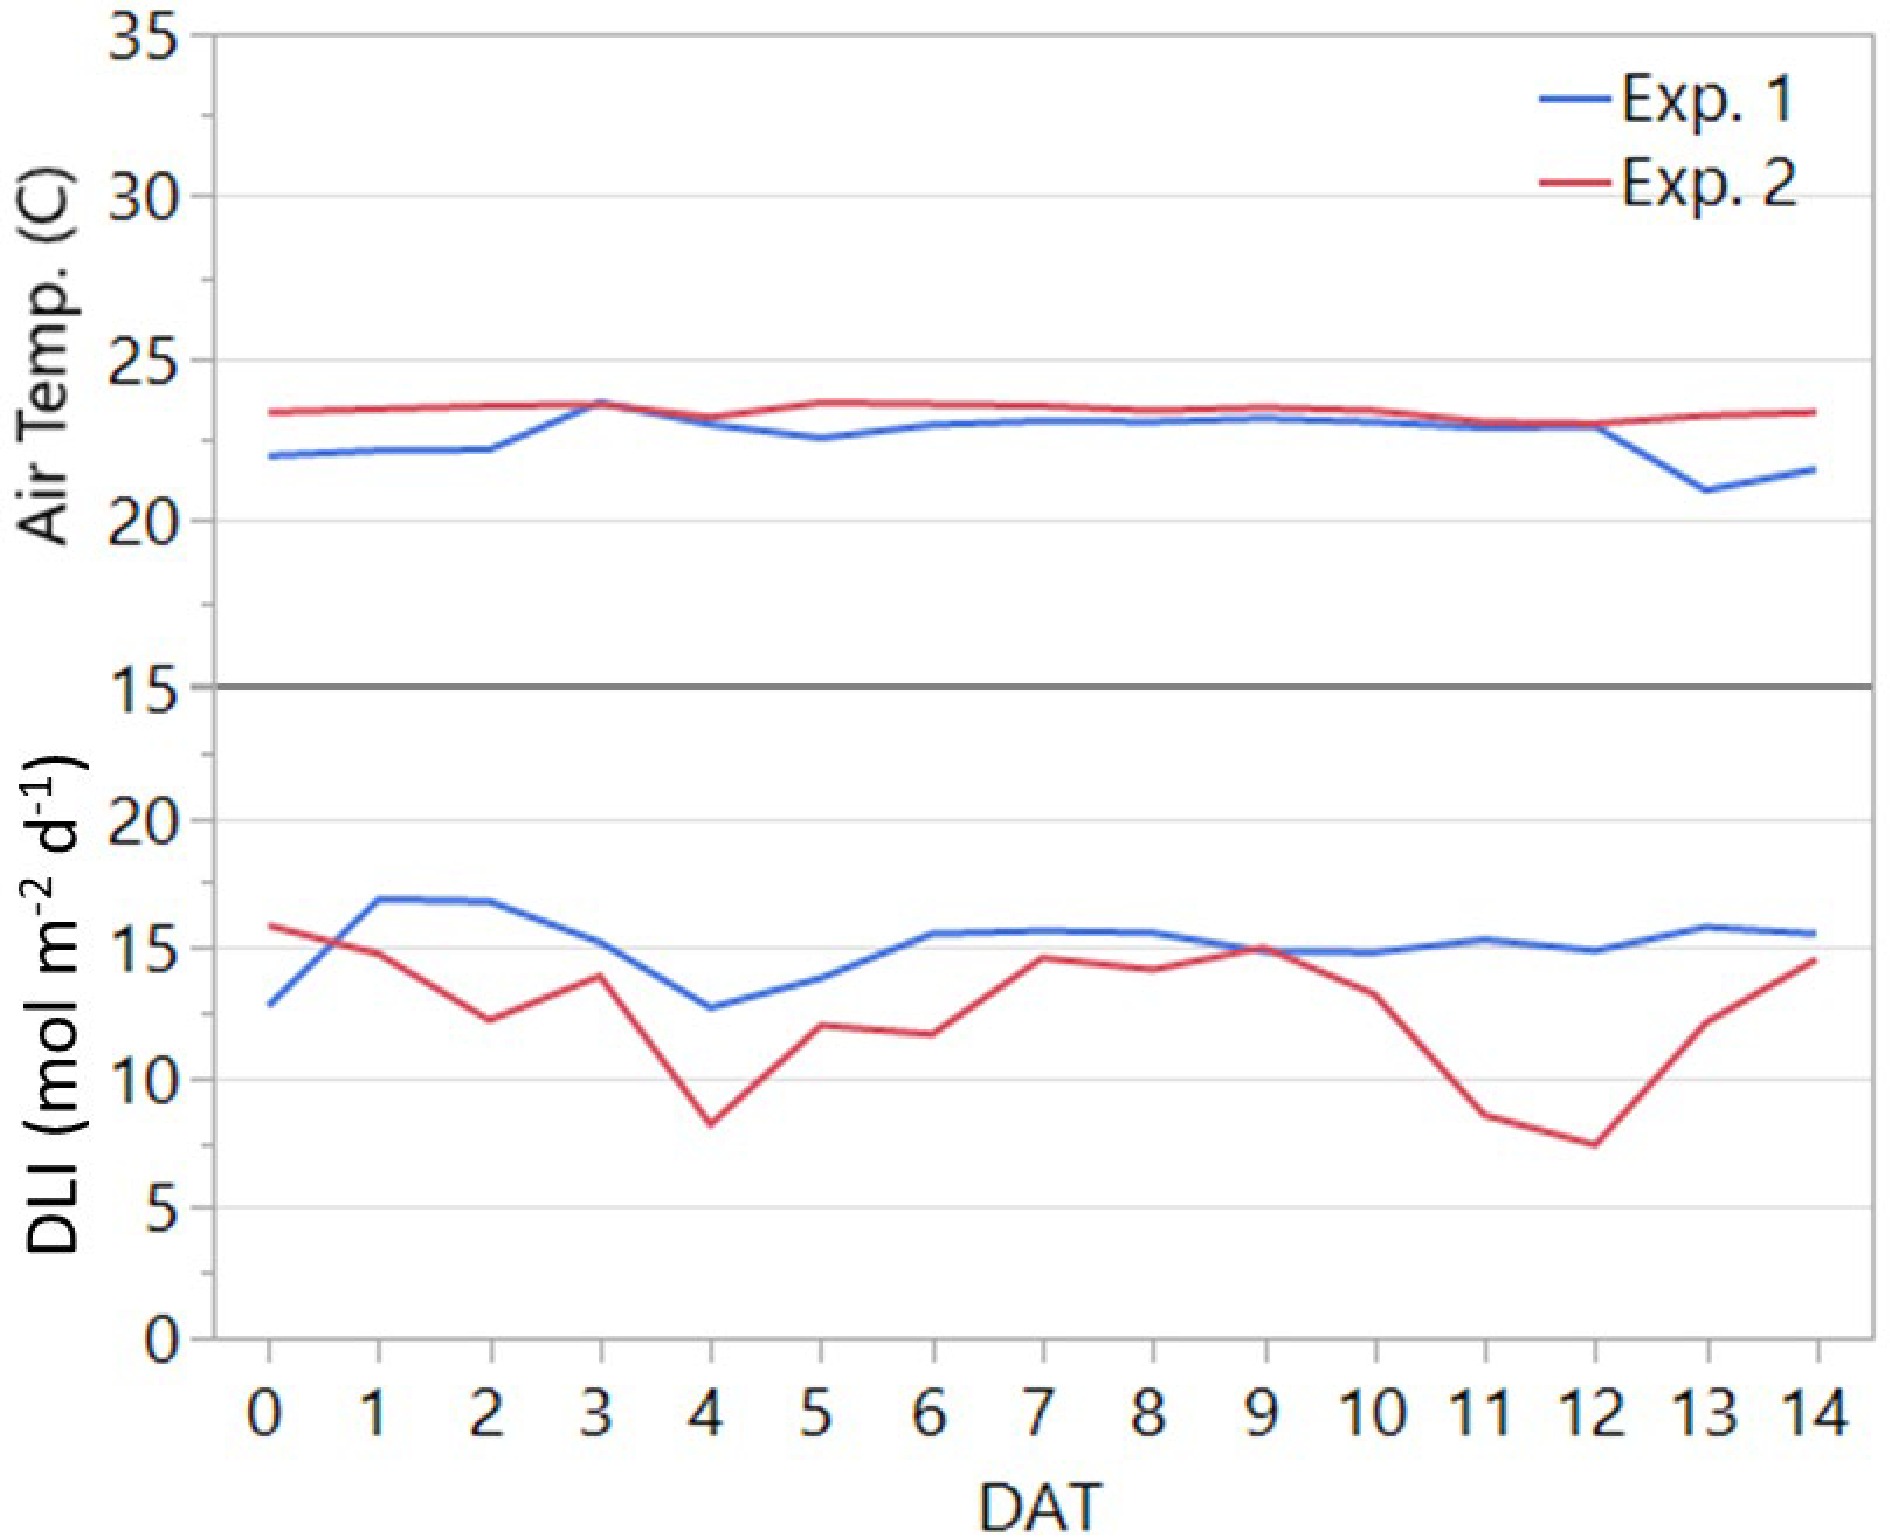
Figure 1.
Average daily air temperature and daily light integral (DLI) in the greenhouse throughout the two experiments. The duration of both experiments was 14 days after transplanting (DAT). Experiments 1 and 2 were conducted from 29 May to 12 June and from 24 June to 09 July 2020, respectively.
Treatments
-
A total of three treatments were used, including a control and two organic treatments (organic fertilizer alone, organic fertilizer with microbial inoculant). The control consisted of a custom conventional nutrient solution blend (modified Hoagland formula) and was prepared using tap water and fertilizer salts at a mM rate of 10.7 N, 1.13 P, 5.38 K, 3.25 Ca, 1.44 Mg, and 1.44 S, and a μM rate of 53.7 Fe, 27.8 B, 6.0 Mn, 1.83 Zn, 1.10 Cu, and 0.63 Mo. The following fertilizer salts were used to prepare the nutrient solution: potassium nitrate, potassium phosphate, calcium nitrate, magnesium sulfate, iron chelate, boric acid, manganese sulfate, zinc sulfate, copper sulfate, and molybdic acid. The control solution had an EC of 1.8 mS cm−1. In the second experiment, the control was prepared at a slightly lower rate with an EC of 1.6 mS cm−1 to better match the EC of the organic treatments. The organic fertilizer treatment was prepared using tap water and a liquid organic fertilizer (Pre-Empt, Coastal Fertilizer & Supply Inc., Labelle, FL) at the recommended label rate of 10 mL L−1. According to the product label, Pre-Empt is a fermented colloid molasses with a unique microbial complex; however, no quantitative information for nitrogen, phosphorus, and potassium is indicated. The following nutrient elements were included in the package with guaranteed analysis (mM): calcium (5.00), magnesium (8.33), iron (1.79), manganese (1.82), zinc (1.54), and boron (1.85). The other organic treatment (organic with inoculant) was prepared by adding a microbial inoculant (TerraBella, Aquabella Organic Solutions, Sebastopol, CA) at a rate of 50 mg L−1 to the above organic treatment. While no specific species of microorganisms is given, the TerraBella product label indicated the following information: 80 million colony forming units (CFUs, units/mL) of aerobic bacteria; 170 CFUs of anaerobic bacteria. The inoculant, containing a proprietary blend of beneficial plant growth-promoting rhizobacteria, was activated according to the label at a rate of 10 mL L−1 in reverse osmosis (RO) water 48 h prior to its addition to the fertilizer. Previous trials (unpublished) showed low magnesium rates of 10 mg L−1; therefore, an organic magnesium supplement was added in the first experiment at the rate of 1 mL L−1 which provided approximately 1.25 mM of additional Mg. The solutions of the organic fertilizer were reused in the second experiment to evaluate the effectiveness of the microbial inoculant across both experiments. For the second experiment, the organic treatments were topped off with tap water and replenished with organic fertilizer to an EC of 1.6 mS cm−1. For the organic fertilizer with inoculant treatment, the solution was re-inoculated at the same rate as the first experiment. Both Pre-Empt organic fertilizer and TerraBella microbial inoculant are certified organic products.
The pH of the control solution was adjusted to 5.6 at the start of both experiments. For the organic treatments, pH was adjusted to approximately 6.0 at the start of both experiments using phosphoric acid for decreasing pH and a mixture of potassium hydroxide and potassium carbonate for increasing pH. Treatments were initiated after seedlings were transplanted to the hydroponic systems on the 29th of May for the first experiment and 24th of June for the second experiment. For both experiments, treatments lasted two weeks.
Experimental design and statistical analysis
-
Both experiments were arranged as a randomized complete block design (RCBD) with two blocks. Only two blocks were used due to limitations in space and equipment (NFT systems). The three treatments were randomized per block with a total of 288 plants or 48 plants per block. All response variables were analyzed using ANOVA with JMP 14.2 (SAS, Cary, NC). Mean separations were analyzed using Tukey's Honest Significant Difference (HSD) test and pair-wise differences were analyzed using Student's t-Test at an alpha of 0.05. Experimental differences were tested in the plant growth response variables and were determined to be significant (P ≤ 0.007), therefore the experimental data and results were analyzed and presented separately.
Data collection
-
Throughout both experiments, the treatment solutions in the reservoirs were monitored daily for EC, pH, and solution volume. The EC and pH were measured using a combo meter (Bluelab, Tauranga, New Zealand). Volume was estimated using a custom ruler with 9.5-L increments. On a weekly basis, expanded true leaves were counted and the natural plant height (h) and two perpendicular widths (w) were measured by hand using a ruler on nine plants per treatment. A growth index (GI) was calculated as follows[16]:
$ \frac{(h+\overline{w})}{2} $ where h is the natural plant height, and
$ \overline{w} $ Experiments were terminated when the adjacent plants were touching each other and leaves started overlapping; thus, plants were not fully mature compared to field lettuce standard but they were larger than baby lettuce. At termination of the experiments, relative chlorophyll content, shoot and root fresh weight (FW), and dry weight (DW) of nine plants were collected. The relative chlorophyll content was taken from the average of three mature leaves per plant, nine plants per treatment (the same plants for GI measurement) using a portable SPAD-502Plus meter (Konica Minolta, Chiyoda, Japan). The tissue DW was measured following complete dryness in a Heratherm OGS750 drying oven (Thermo Fisher Scientific, Waltham, MA) at 70 °C. Shoot tissue samples were ground in a Wiley mill (Thomas Scientific) and sent for elemental analysis at the Soil and Water Testing Laboratory (College Station, TX). In the second experiment, leaf tissue samples were collected for phytonutrient analysis from representative mature leaves of three plants. In brief, fresh tissue samples (1 g) were collected and immediately frozen in liquid nitrogen and stored in a freezer at −80 °C. Subsequently, these samples were ground in a mortar and pestle using liquid nitrogen and extracted in methanol. The extracted samples were then analyzed for anthocyanins and total phenolic compounds (TPC) using the methods described by Silva et al.[17] and Ainsworth and Gillespie[18], respectively. Anthocyanins were measured using a Genesys UV-VIS spectrophotometer (Thermo Fisher Scientific, Waltham, MA, USA) and calculated according to the following formula:
$ \frac{V\times n\times M\times A\times 100}{\varepsilon \times m} $ where, V: The volume of extraction liquid (ml), n: Dilution factor, M: Molecular weight of cyanidine-3-glucoside (449.2 g), A: Absorbance @ 530 nm, ε: molar extinction coefficient (29,600), and m: weight of sample. TPC was determined using the Folin & Ciocalteu's reagent, measured using a microplate spectrophotometer (BioTek, Winooski, VT, USA) at 765 nm, and reported as mg of Gallic Acid Equivalents (GAE) divided by g of FW.
-
Results from Experiment 1 indicated that plant growth index (GI) was lower in the organic nutrient solution compared to the control (Fig. 2). However, the addition of the inoculant in the organic solution increased GI by 9% and was comparable to the inorganic control. In Experiment 2, a similar trend was observed whereby plant GI increased by 9% with the addition of the inoculant to the organic nutrient solution. However, the control resulted in the greatest plant GI, which was approximately 11% and 21% greater than the organic solutions with or without the inoculant, respectively.
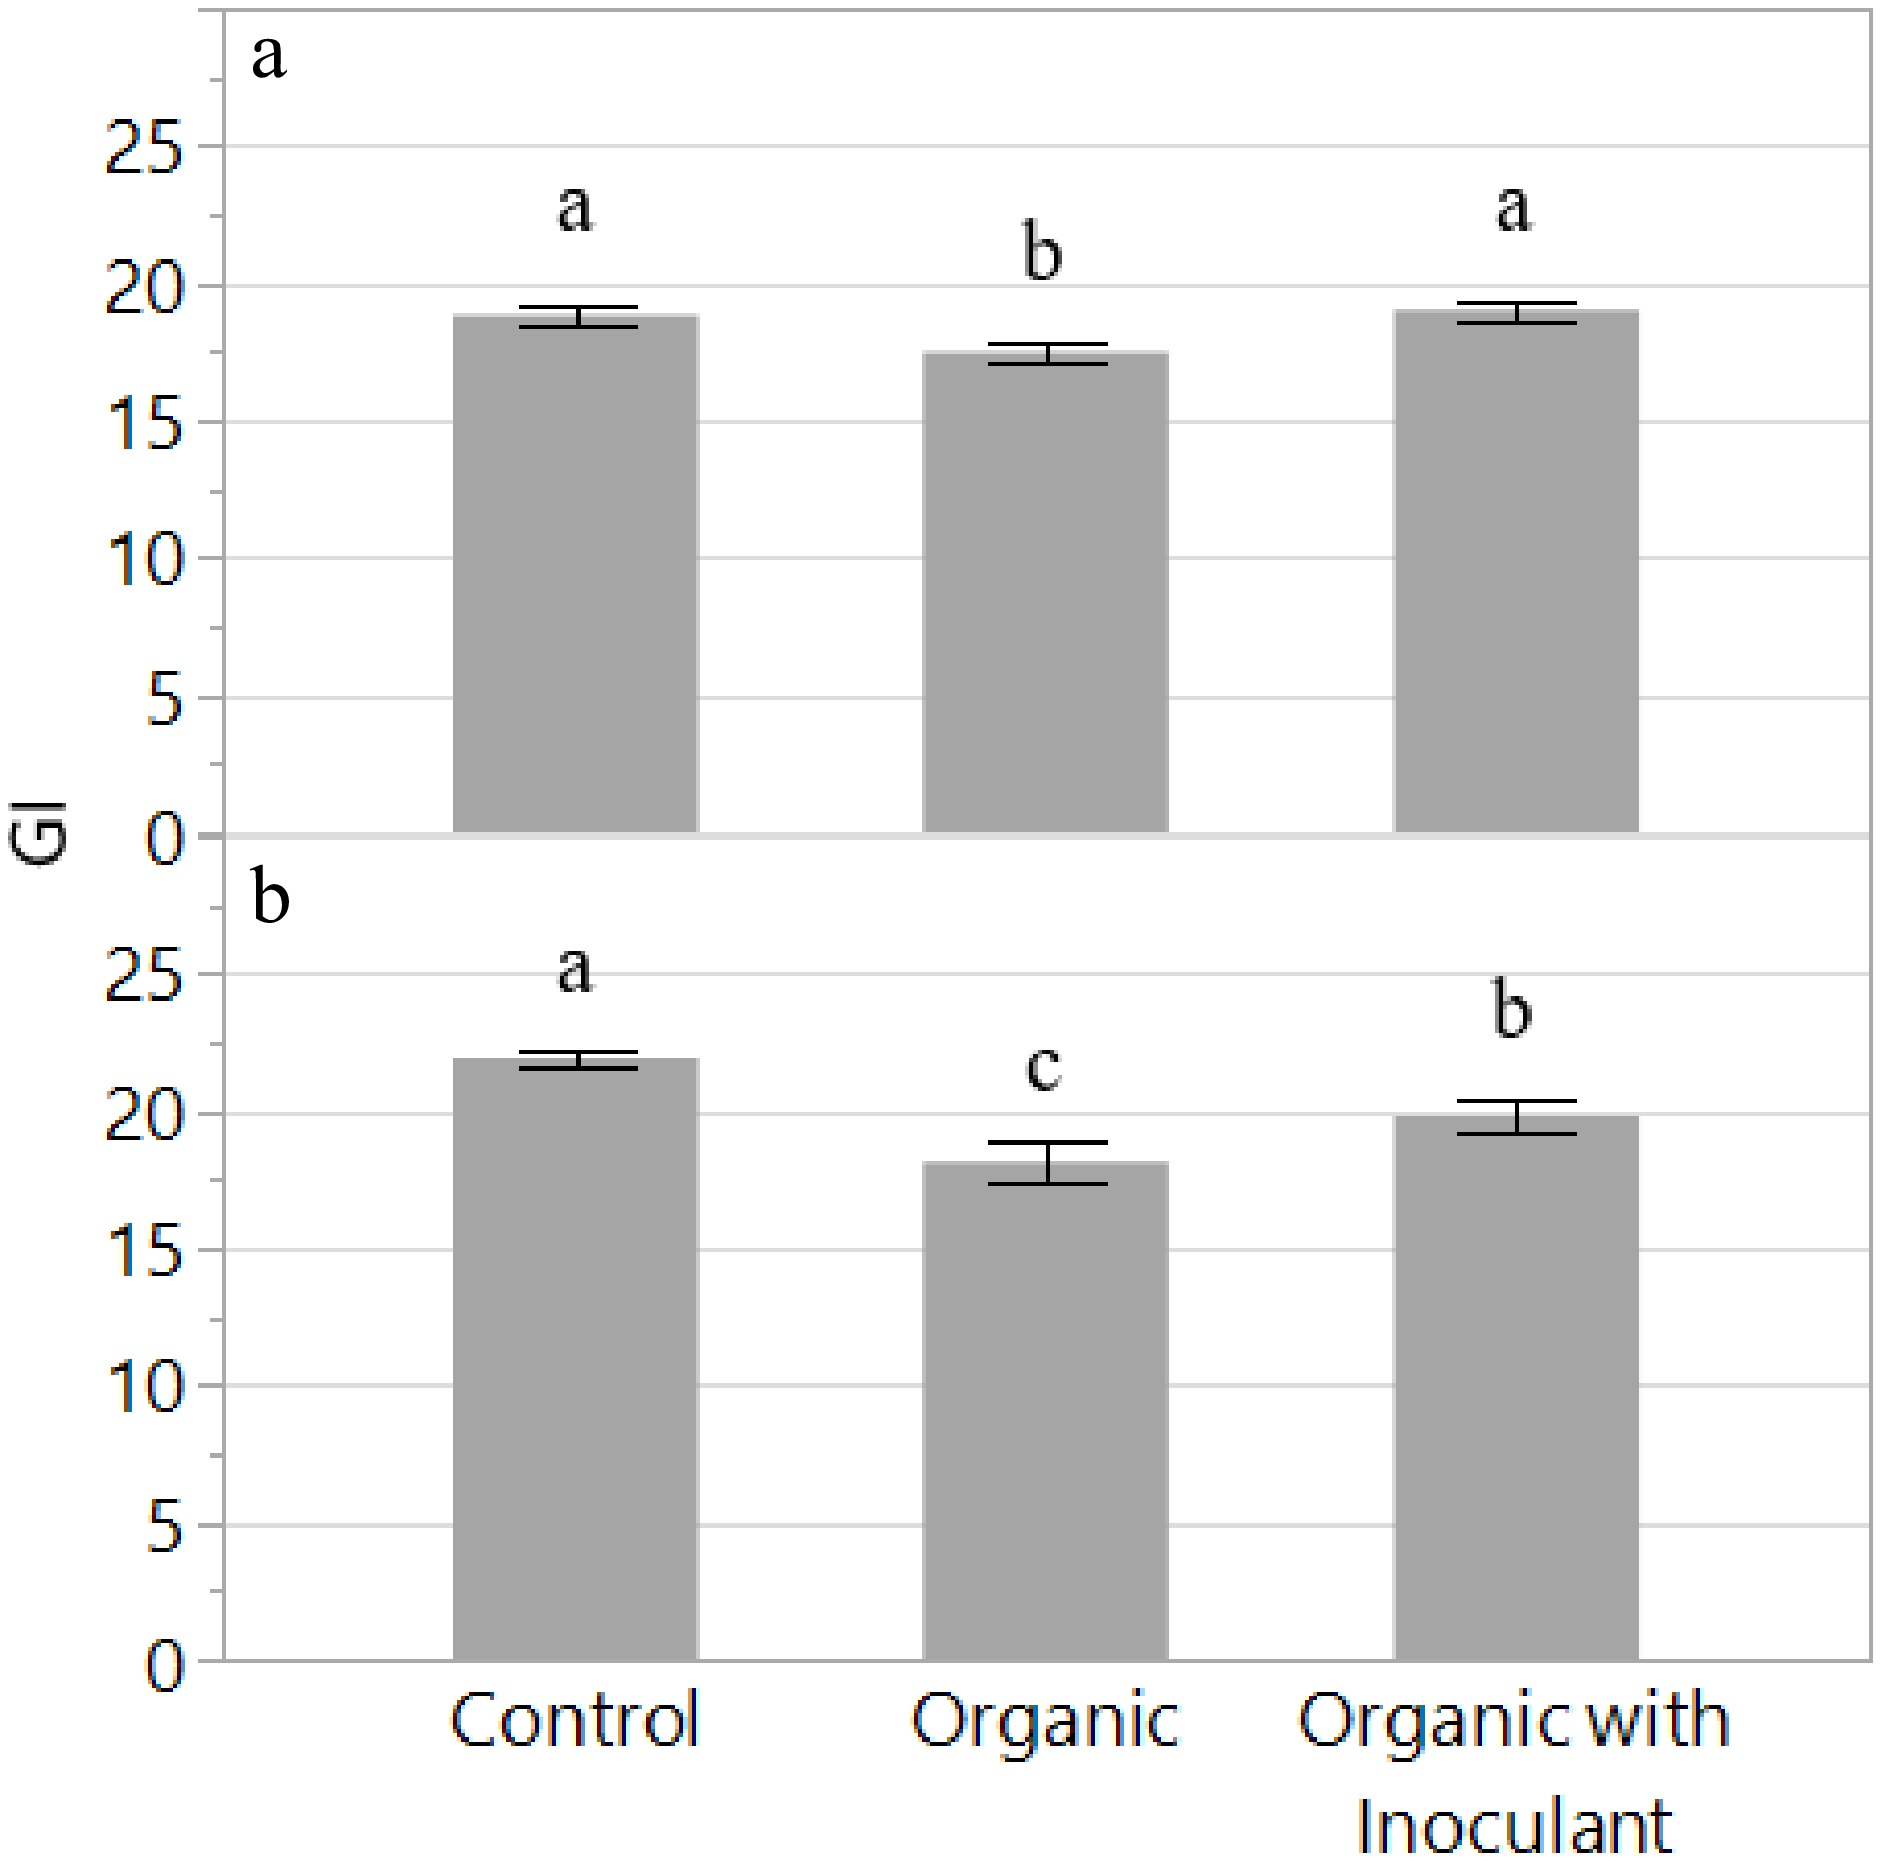
Figure 2.
Growth Index (GI) of the lettuce variety 'Red Mist' grown for two weeks in an NFT hydroponic system fertilized with a conventional (Control) or an organic fertilizer with or without a microbial inoculant. The experiment was replicated and presented separately: Experiment 1 (a) and Experiment 2 (b). Bars represent standard error. Means followed by different letters indicate significant differences among treatments according to Tukey's HSD test (P < 0.05).
In Experiment 1, shoot fresh weight (FW) showed a similar trend as plant GI; however, no significant differences were observed among the treatments (Fig. 3a). The addition of the inoculant increased shoot dry weight (DW) by 17% and was comparable to the control. These results were supported by the plant GI data, which was strongly correlated (r2 = 0.62). There were no significant differences among treatments in shoot water content (WC) and no apparent trends observed in the data.
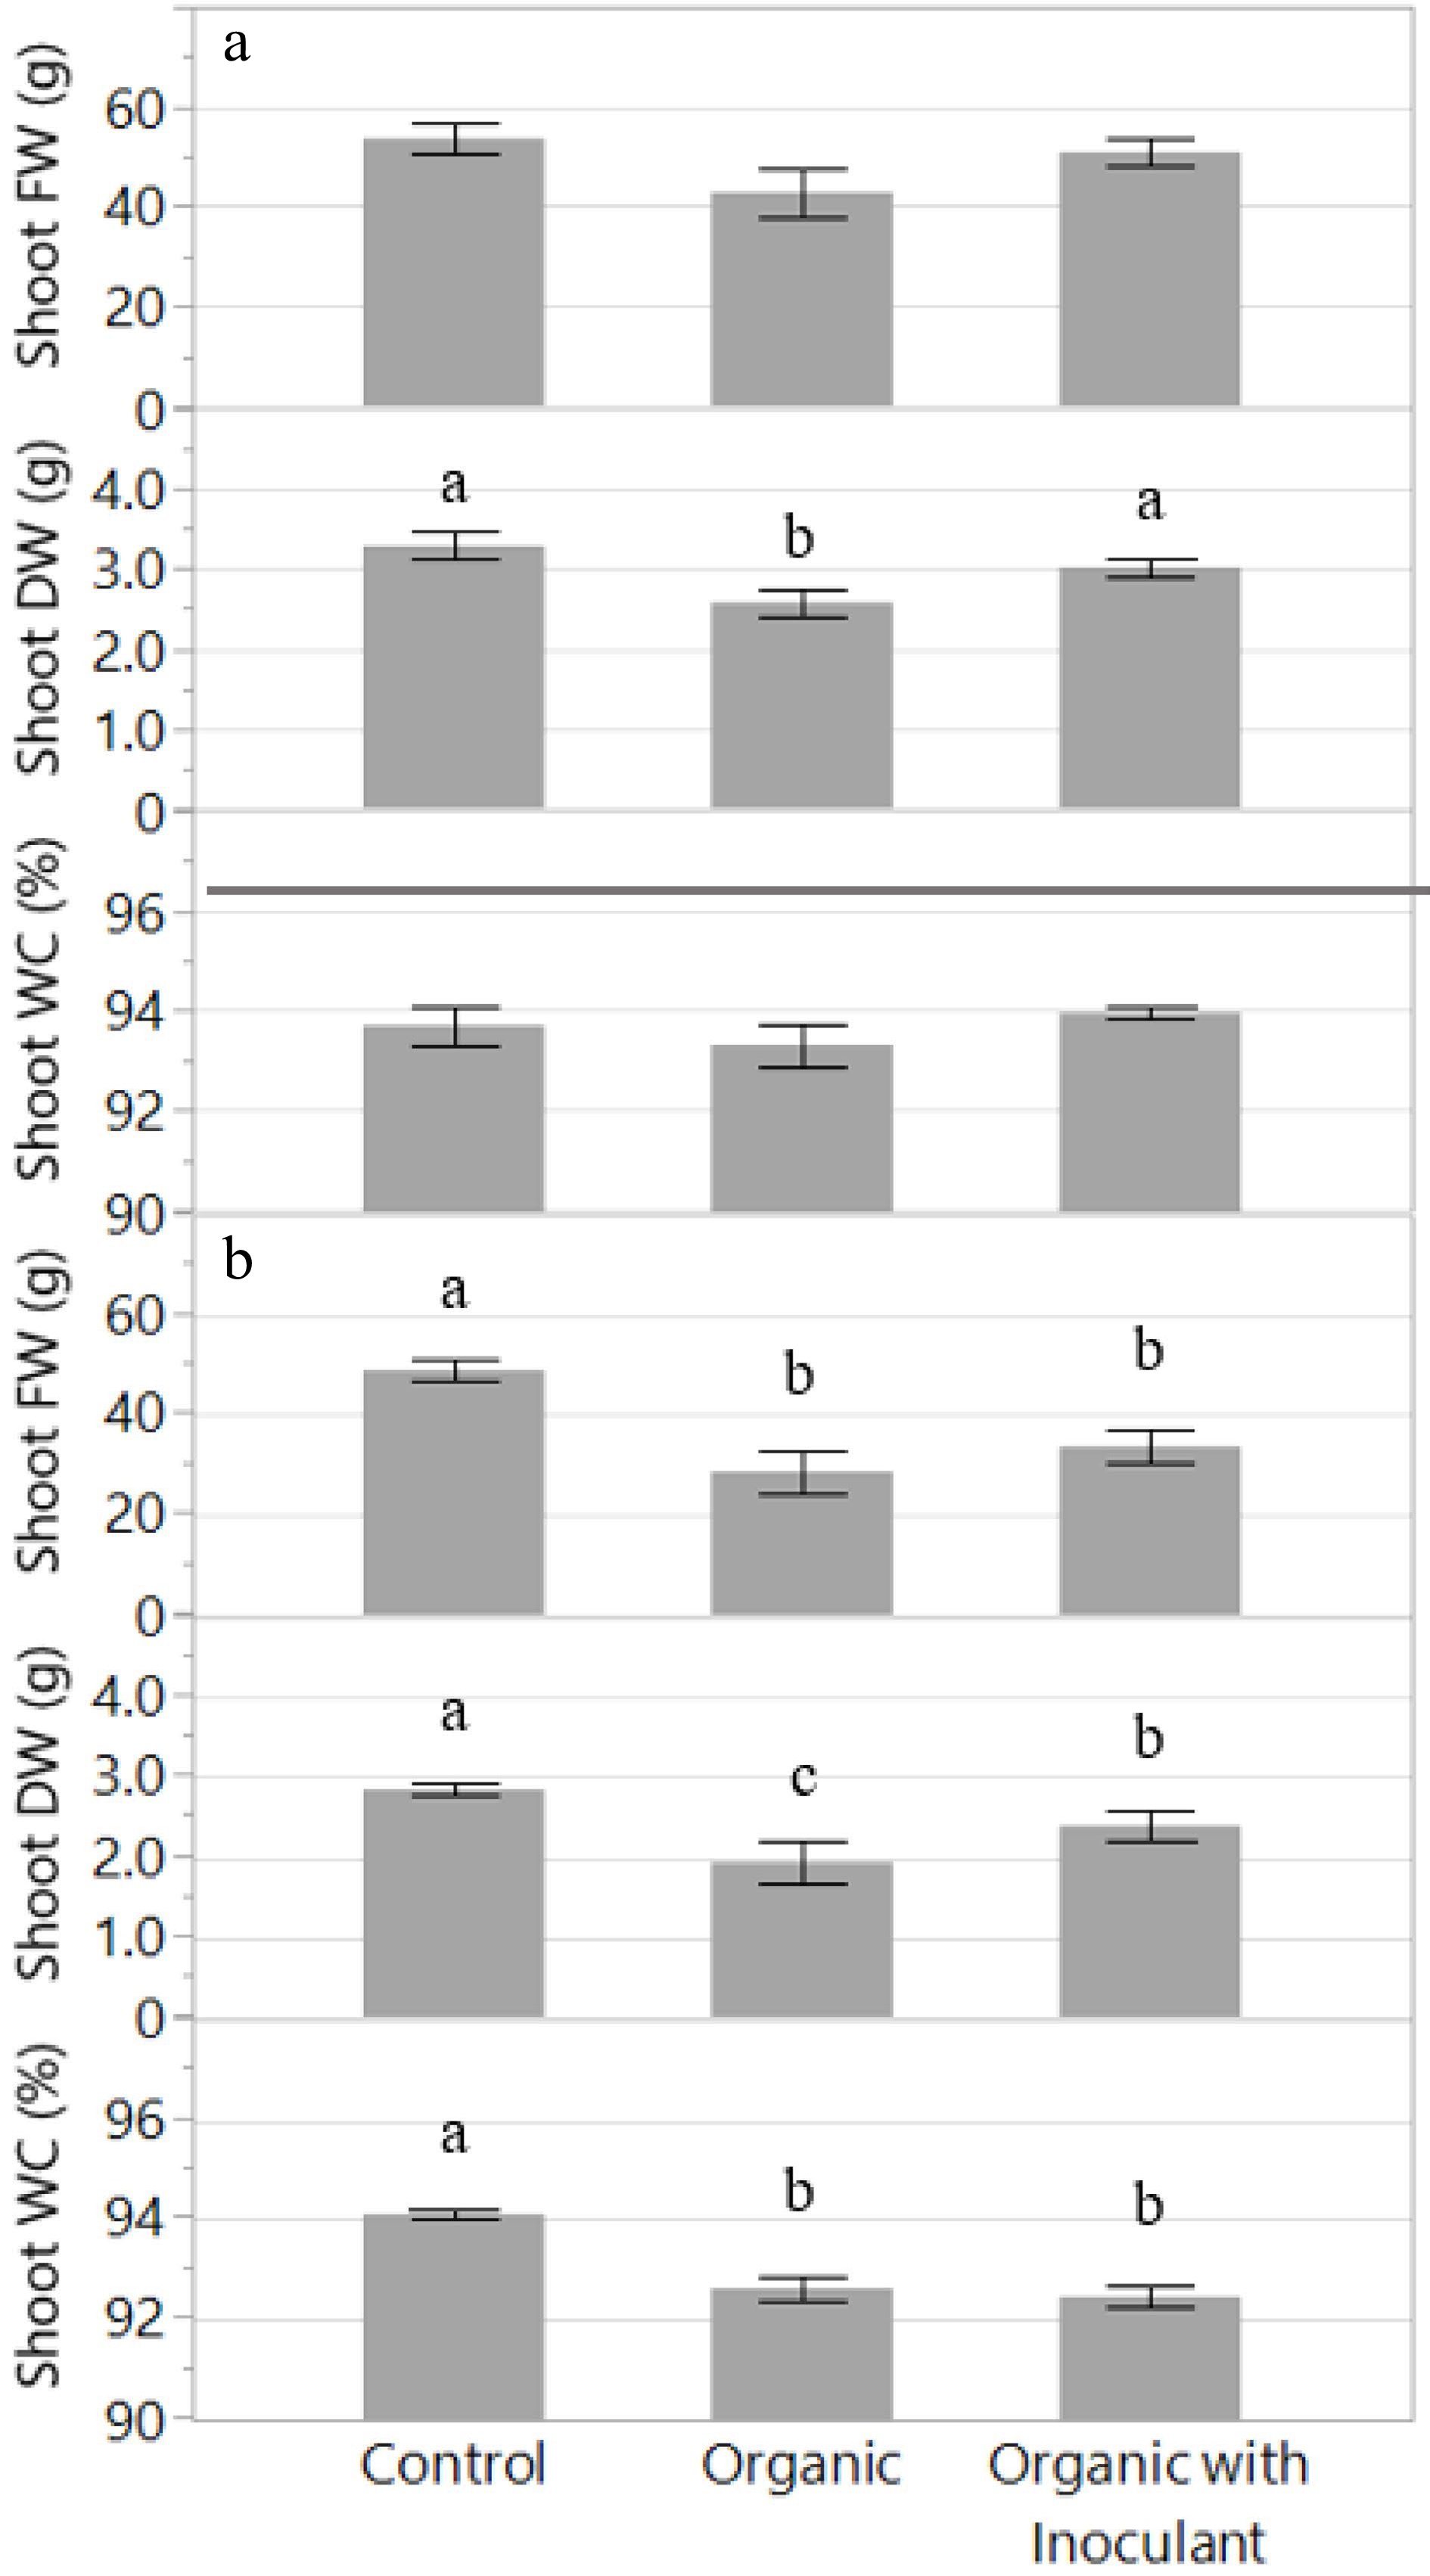
Figure 3.
Shoot fresh weight (FW), dry weight (DW), and water content (WC) of the lettuce variety 'Red Mist' (per plant) grown for two weeks in an NFT hydroponic system fertilized with a conventional (Control) or an organic fertilizer with or without a microbial inoculant. The experiment was replicated and presented separately: Experiment 1 (a) and Experiment 2 (b). Bars represent standard error. Means followed by different letters indicate significant differences among treatments according to Tukey's HSD test (P < 0.05).
In Experiment 2, shoot FW was reduced by 31% and 41% in the organic treatments with or without inoculant, respectively, compared to the control (Fig. 3b). These were large reductions in FW that were not observed in Experiment 1. Additionally, the inoculant did not appear to affect FW. However, there were differences in DW, similar to Experiment 1. Specifically, there was an increase in DW by 24% in the organic nutrient solution with inoculant compared to without. However, even with the inoculant, the DW in the organic treatment was not comparable to the control, which was 19% greater. Again, these results were supported by the plant GI data, which was strongly correlated (r2 = 0.93). In contrast to Experiment 1, shoot WC indicated a greater proportion of dry biomass in the organic treatments compared to the control. Specifically, the shoot WC was 1.5% and 1.7% less in the organic solution with or without inoculant, respectively.
Leaf SPAD and phytonutrients
-
The relative chlorophyll content (SPAD) increased in the organic treatments compared to the control in both experiments (Fig. 4). In Experiment 1, SPAD increased by 18% and 26% in the organic treatments with or without inoculant, respectively. In Experiment 2, SPAD increased by 19% and 13%, respectively. Although there were significant differences between the two organic treatments in both experiments, it remained unclear whether the inoculant had an overall positive effect on SPAD.
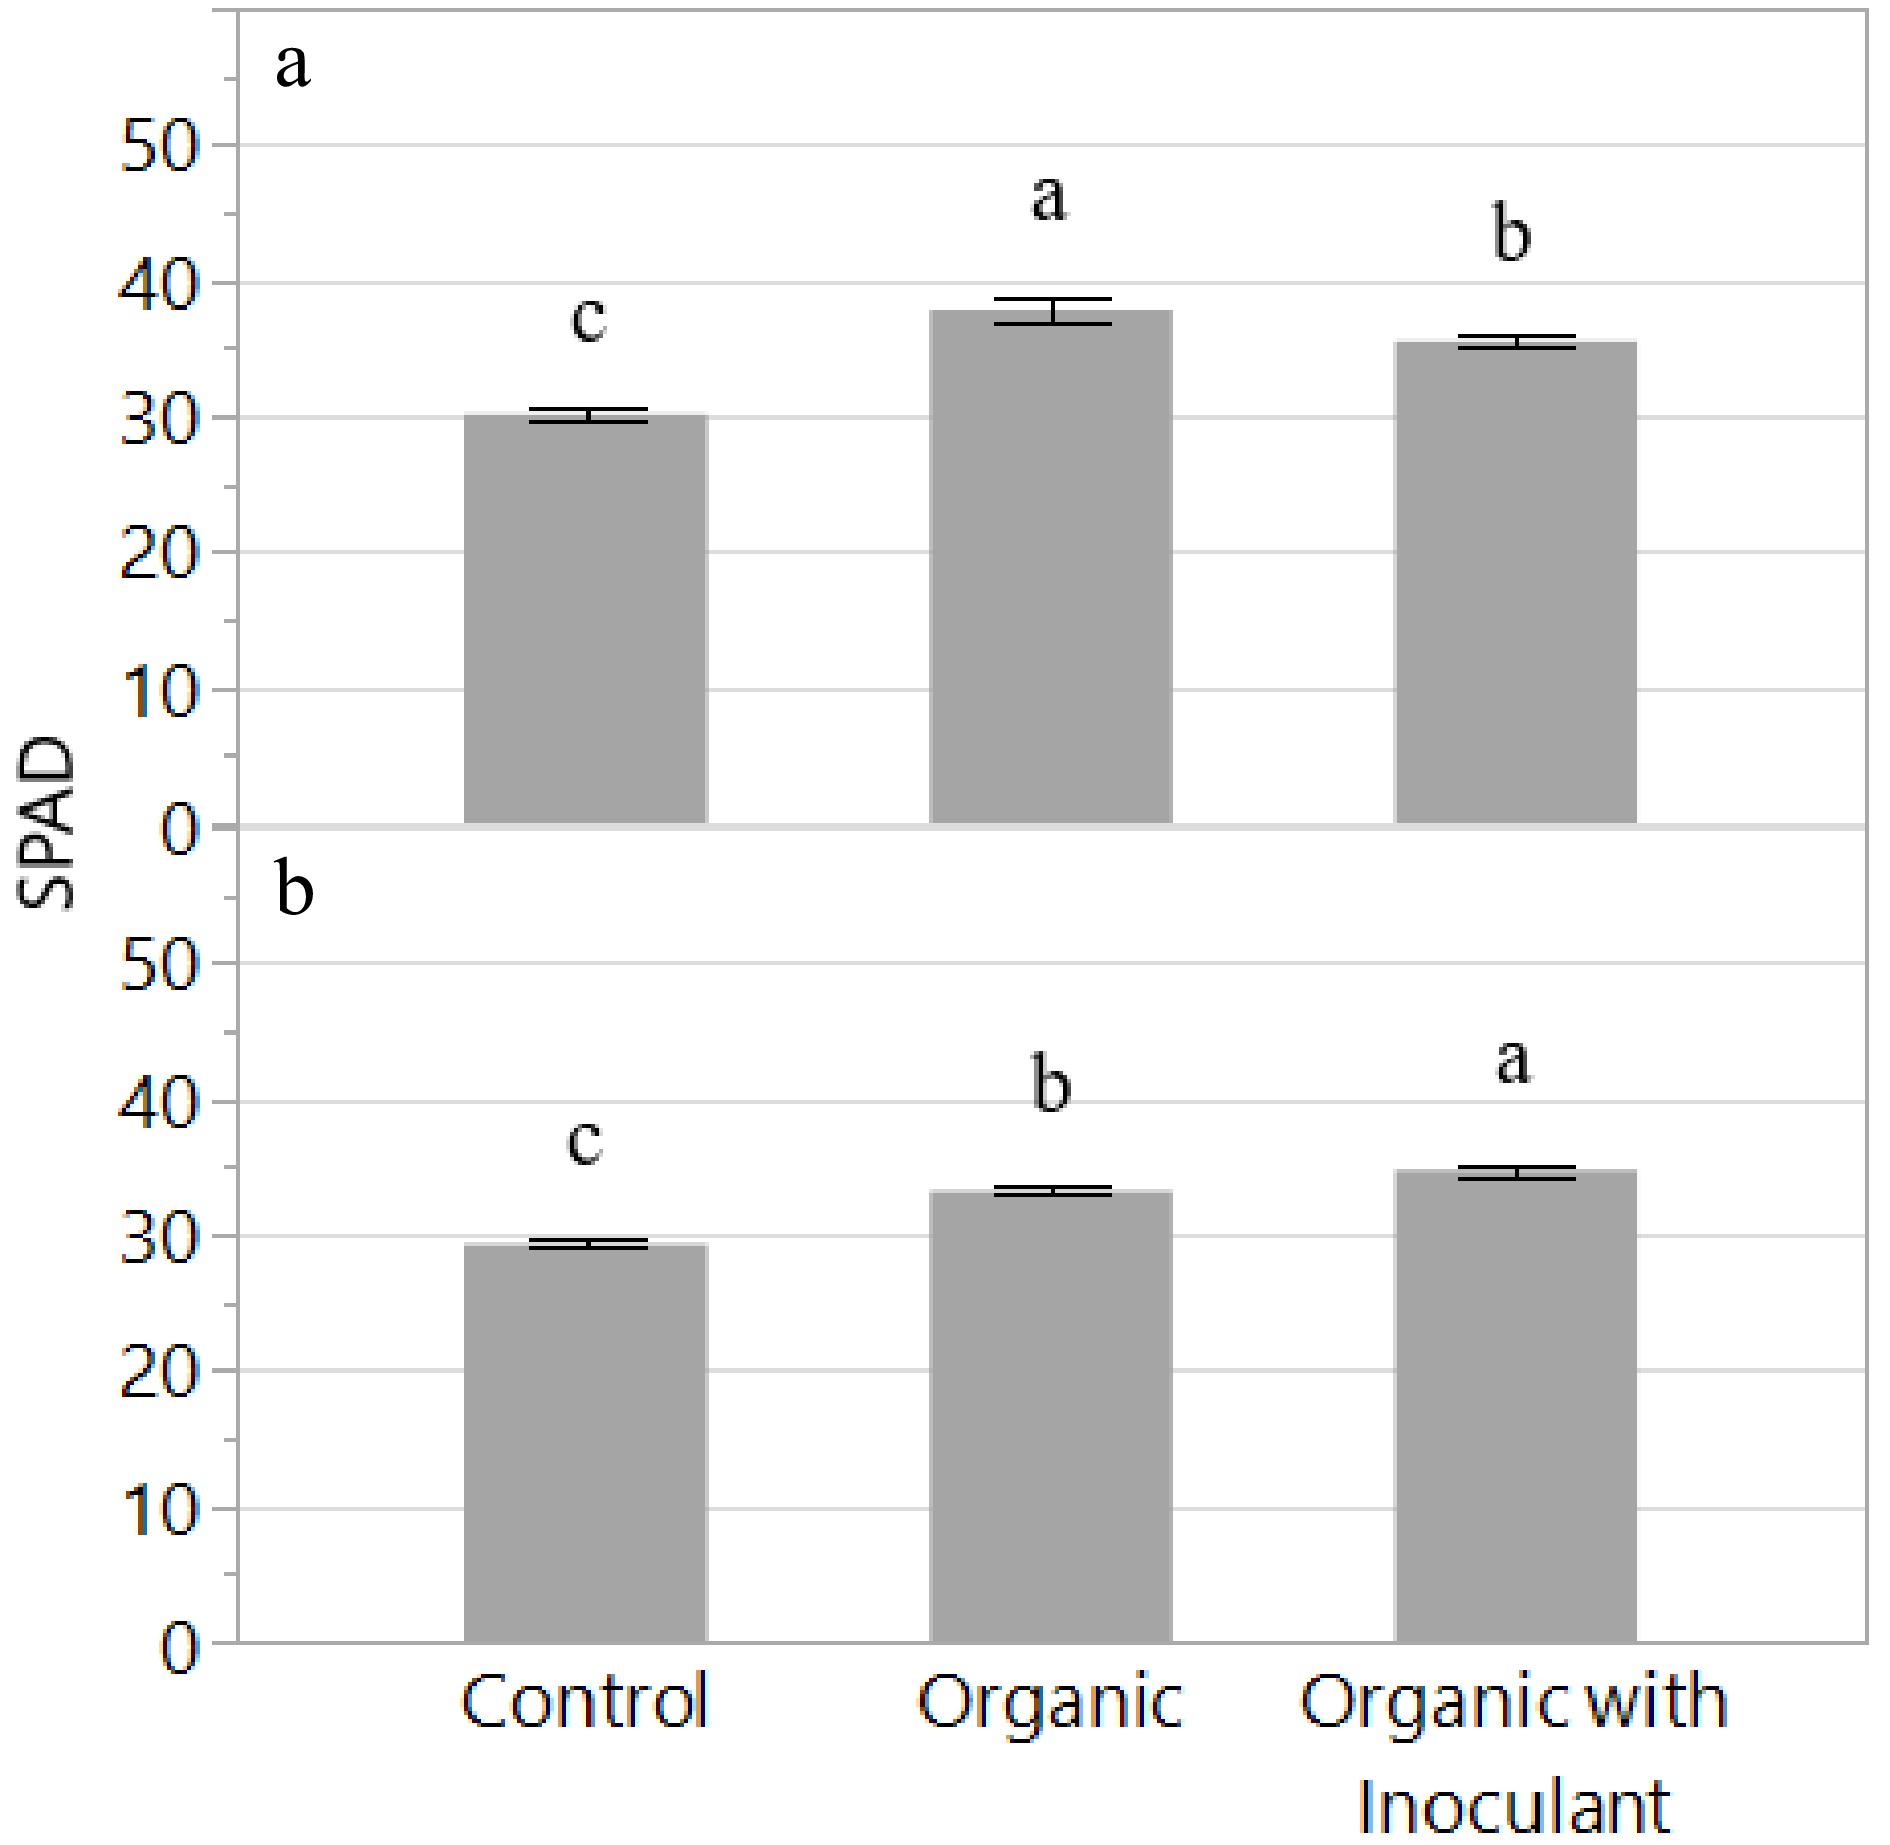
Figure 4.
Relative Chlorophyll Content (SPAD) of the lettuce variety 'Red Mist' grown for two weeks in an NFT hydroponic system fertilized with a conventional (Control) or an organic fertilizer with or without a microbial inoculant. The experiment was replicated and presented separately: Experiment 1 (a) and Experiment 2 (b). Bars represent standard error. Means followed by different letters indicate significant differences among treatments according to Tukey's HSD test (P < 0.05).
Results of the fresh tissue extraction and analysis showed that plant anthocyanin content tended to increase in plants treated with organic nutrient solution with inoculant compared to plants treated with conventional solution (Fig. 5). Specifically, anthocyanin in the shoot tissue increased by 9% in the organic solution with inoculant compared to the inorganic control. Regarding total phenolic content (TPC), there were no significant differences among treatments and no clear trend in the data.
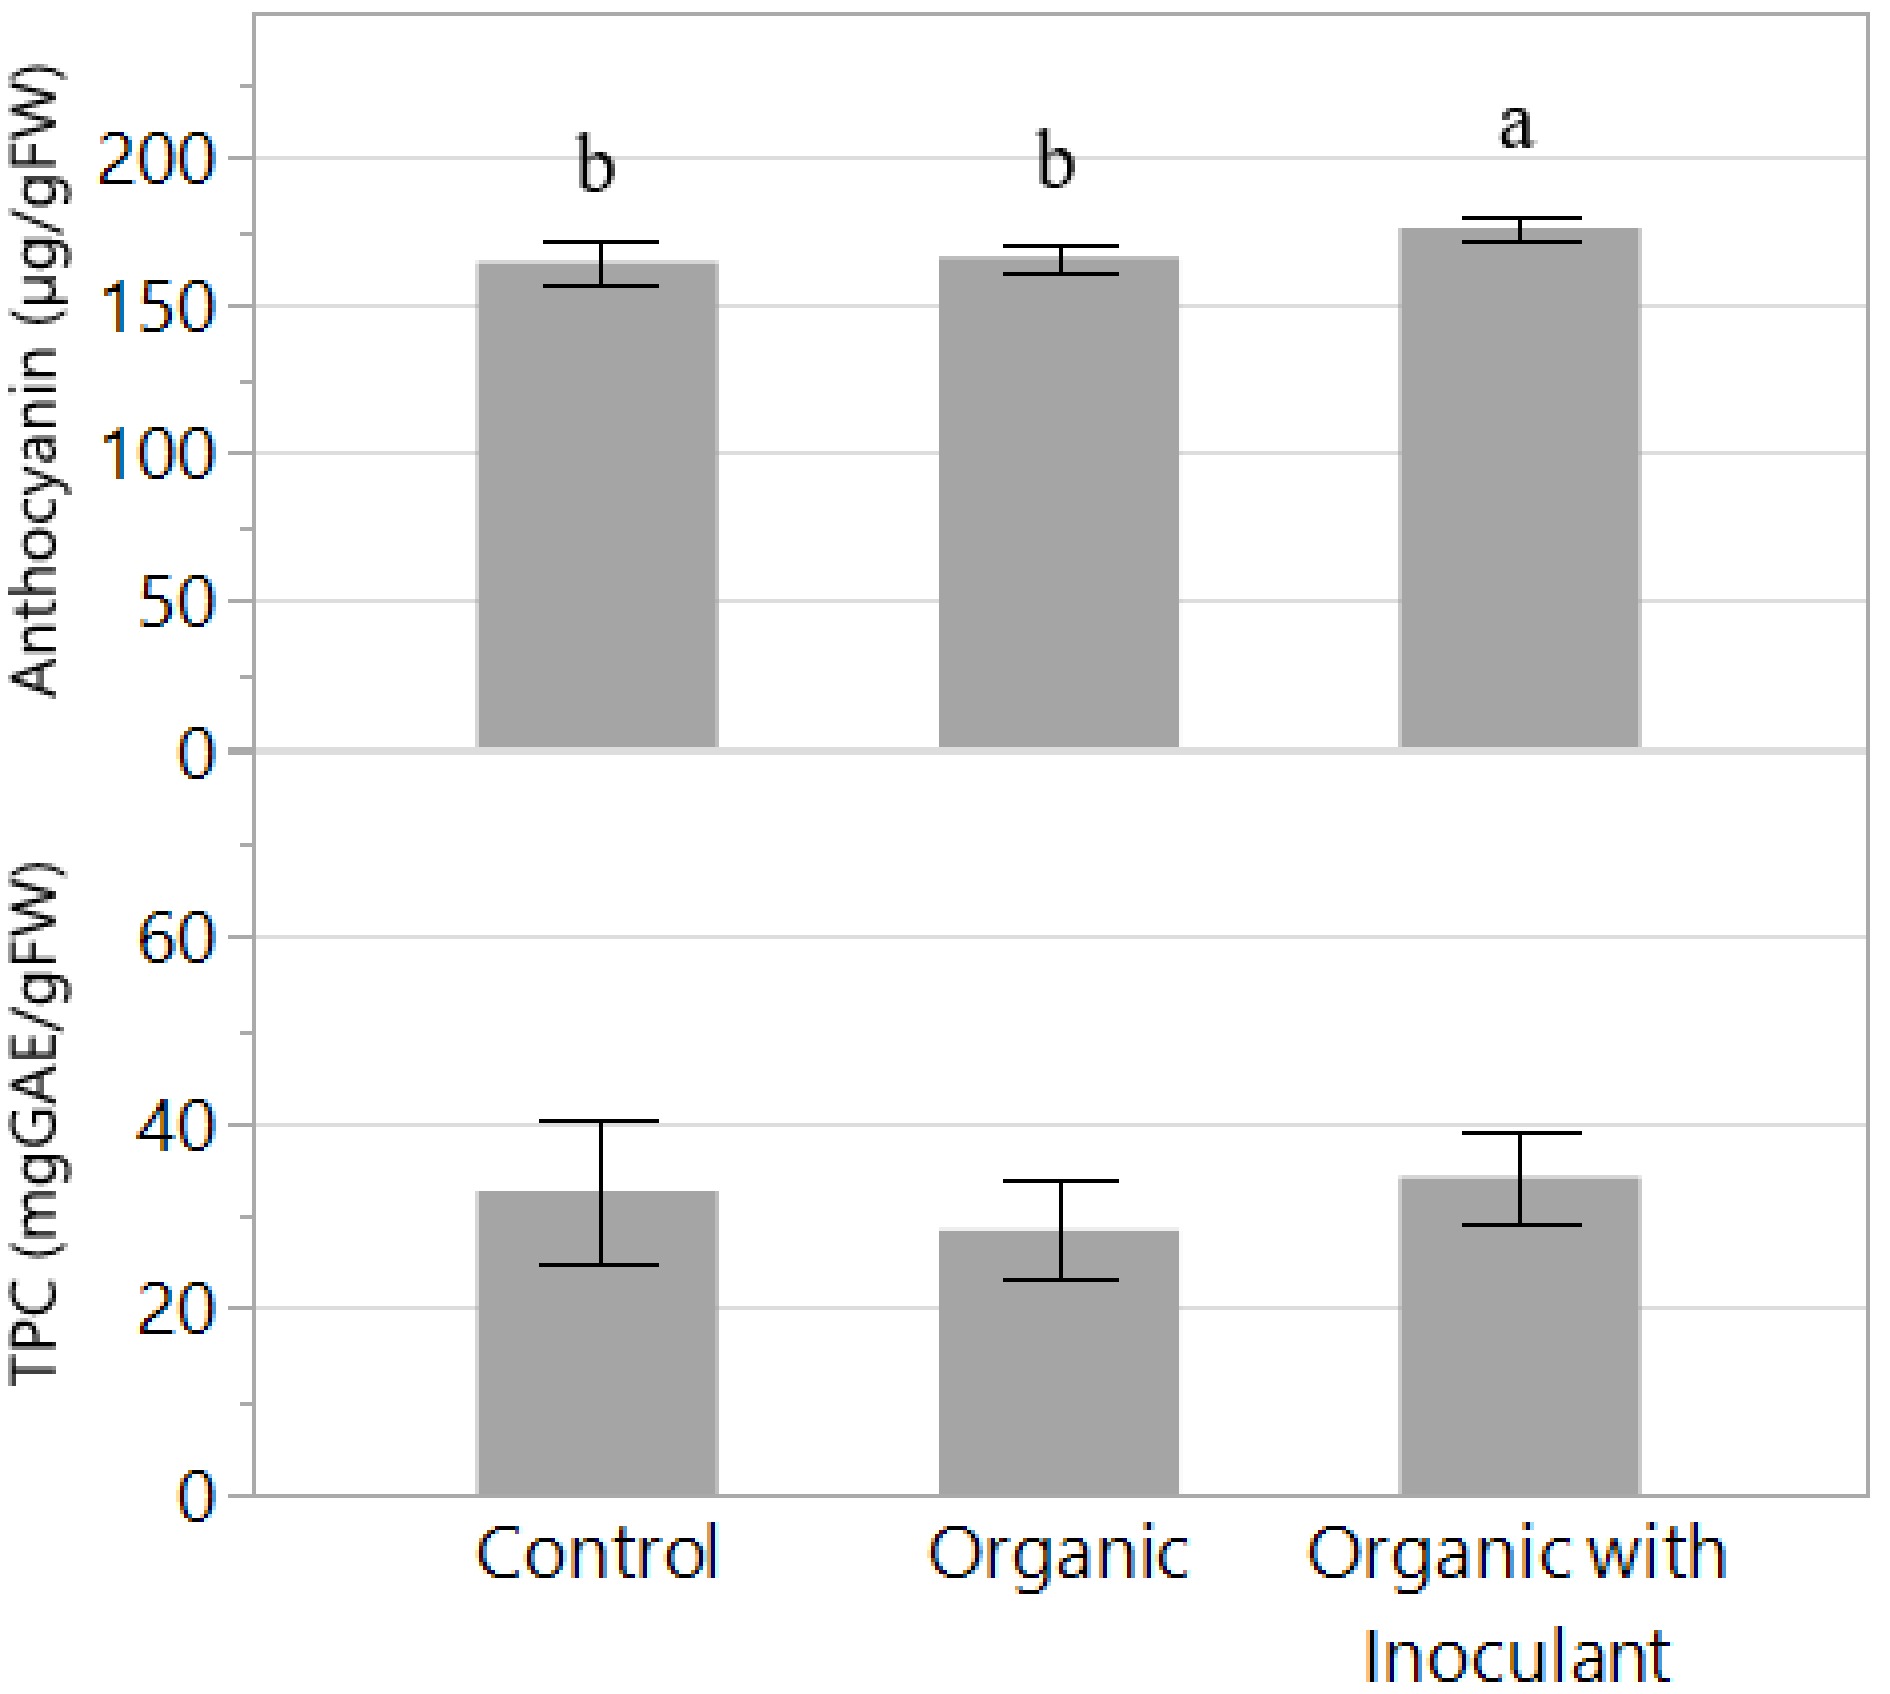
Figure 5.
Anthocyanin and total phenolic content (TPC) of the lettuce variety 'Red Mist' grown for two weeks in an NFT hydroponic system fertilized with a conventional (Control) or an organic fertilizer with or without a microbial inoculant. The experiment was replicated but only data from the second experiment is presented. Bars represent standard error. Means followed by different letters indicate significant differences among treatments according to Tukey's HSD test (P < 0.05).
Leaf tissue mineral content
-
In Experiment 1, the leaf tissue content of macronutrients was generally greatest in plants treated with the organic nutrient solution with inoculant (Table 1). The concentration of N was 10% and 24% greater than the control and organic treatment without inoculant, respectively; P was 12% and 29% greater; Mg was 11% and 13% greater; S was 19% and 41% greater; and Fe was 14% and 17% greater. The leaf tissue mineral content of Mn and Zn were greater in plants treated with the organic solution with inoculant compared to the organic solution without inoculant, but not the control. In this case, Mn and Zn were 113% and 25% greater, respectively. There were no significant differences among the treatments for the leaf tissue mineral content of K, Ca, B, and Cu.
Table 1. Leaf tissue mineral concentration of the lettuce variety 'Red Mist' grown for two weeks in an NFT hydroponic system fertilized with a conventional (Control) or an organic fertilizer with or without a microbial inoculant.
Element Control Organic Organic with
inoculantExperiment 1 (mg/gDW) N 59.85 b 52.99 c 65.94 a P 9.04 b 7.83 c 10.09 a K 80.79 67.97 53.09 Ca 7.93 8.58 5.64 Mg 3.42 b 3.36 b 3.80 a S 4.04 b 3.41 b 4.80 a Fe 0.102 b 0.099 b 0.116 a B 0.047 0.038 0.063 Cu 0.016 0.015 0.025 Mn 0.131 ab 0.102 b 0.217 a Zn 0.064 ab 0.056 b 0.070 a Experiment 2 N 49.45 53.34 47.46 P 7.40 7.45 7.32 K 68.36 a 46.08 b 43.92 b Ca 9.65 a 6.40 b 4.87 c Mg 3.36 2.89 3.12 S 2.95 b 3.68 a 4.07 a Fe 0.079 b 0.099 a 0.086 b B 0.019 b 0.043 a 0.046 a Cu 0.008 b 0.017 a 0.020 a Mn 0.066 b 0.232 a 0.247 a Zn 0.047 ab 0.054 a 0.039 b The experiment was replicated, and data is presented from both experi-ments. Means followed by different letters indicate significant differences among treatments according to Tukey's HSD test (P <0.05). In Experiment 2, the leaf tissue content of micronutrients was generally greatest in plants treated with the organic nutrient solution, regardless of inoculant, compared to the conventional (Table 1). The concentration of B and Cu were more than double that of the control, while Mn was more than threefold in the organic treatments. Additionally, the macronutrient S was 38% and 25% greater in the organic treatment with or without inoculant, respectively. However, the macronutrients K and Ca were greater in the control compared to the organic treatments. Specifically, K was 56% and 48% greater than the organic solution with or without inoculant, respectively, and Ca was 98% and 51% greater, respectively. There was a similar trend in the first experiment, although there were no significant differences. Finally, there were no significant differences among the treatments for the minerals N, P, and Mg.
Nutrient solution EC, pH, and volume
-
In Experiment 1, the EC of the control solution remained stable, but steadily increased in the organic treatments throughout the duration of the study (Fig. 6). By the end of Experiment 1, the EC of the organic treatments was 2.5 mS cm−1 which was an increase of 32% compared to the control. Overall, the average EC of the control, organic, and organic with inoculant was 1.9 ± 0.0, 2.1 ± 0.2, and 2.1 ± 0.2 mS cm−1, respectively. Concurrently, the volume of the solutions decreased throughout the experiment by 46%, 36%, and 41%, respectively (data not presented).
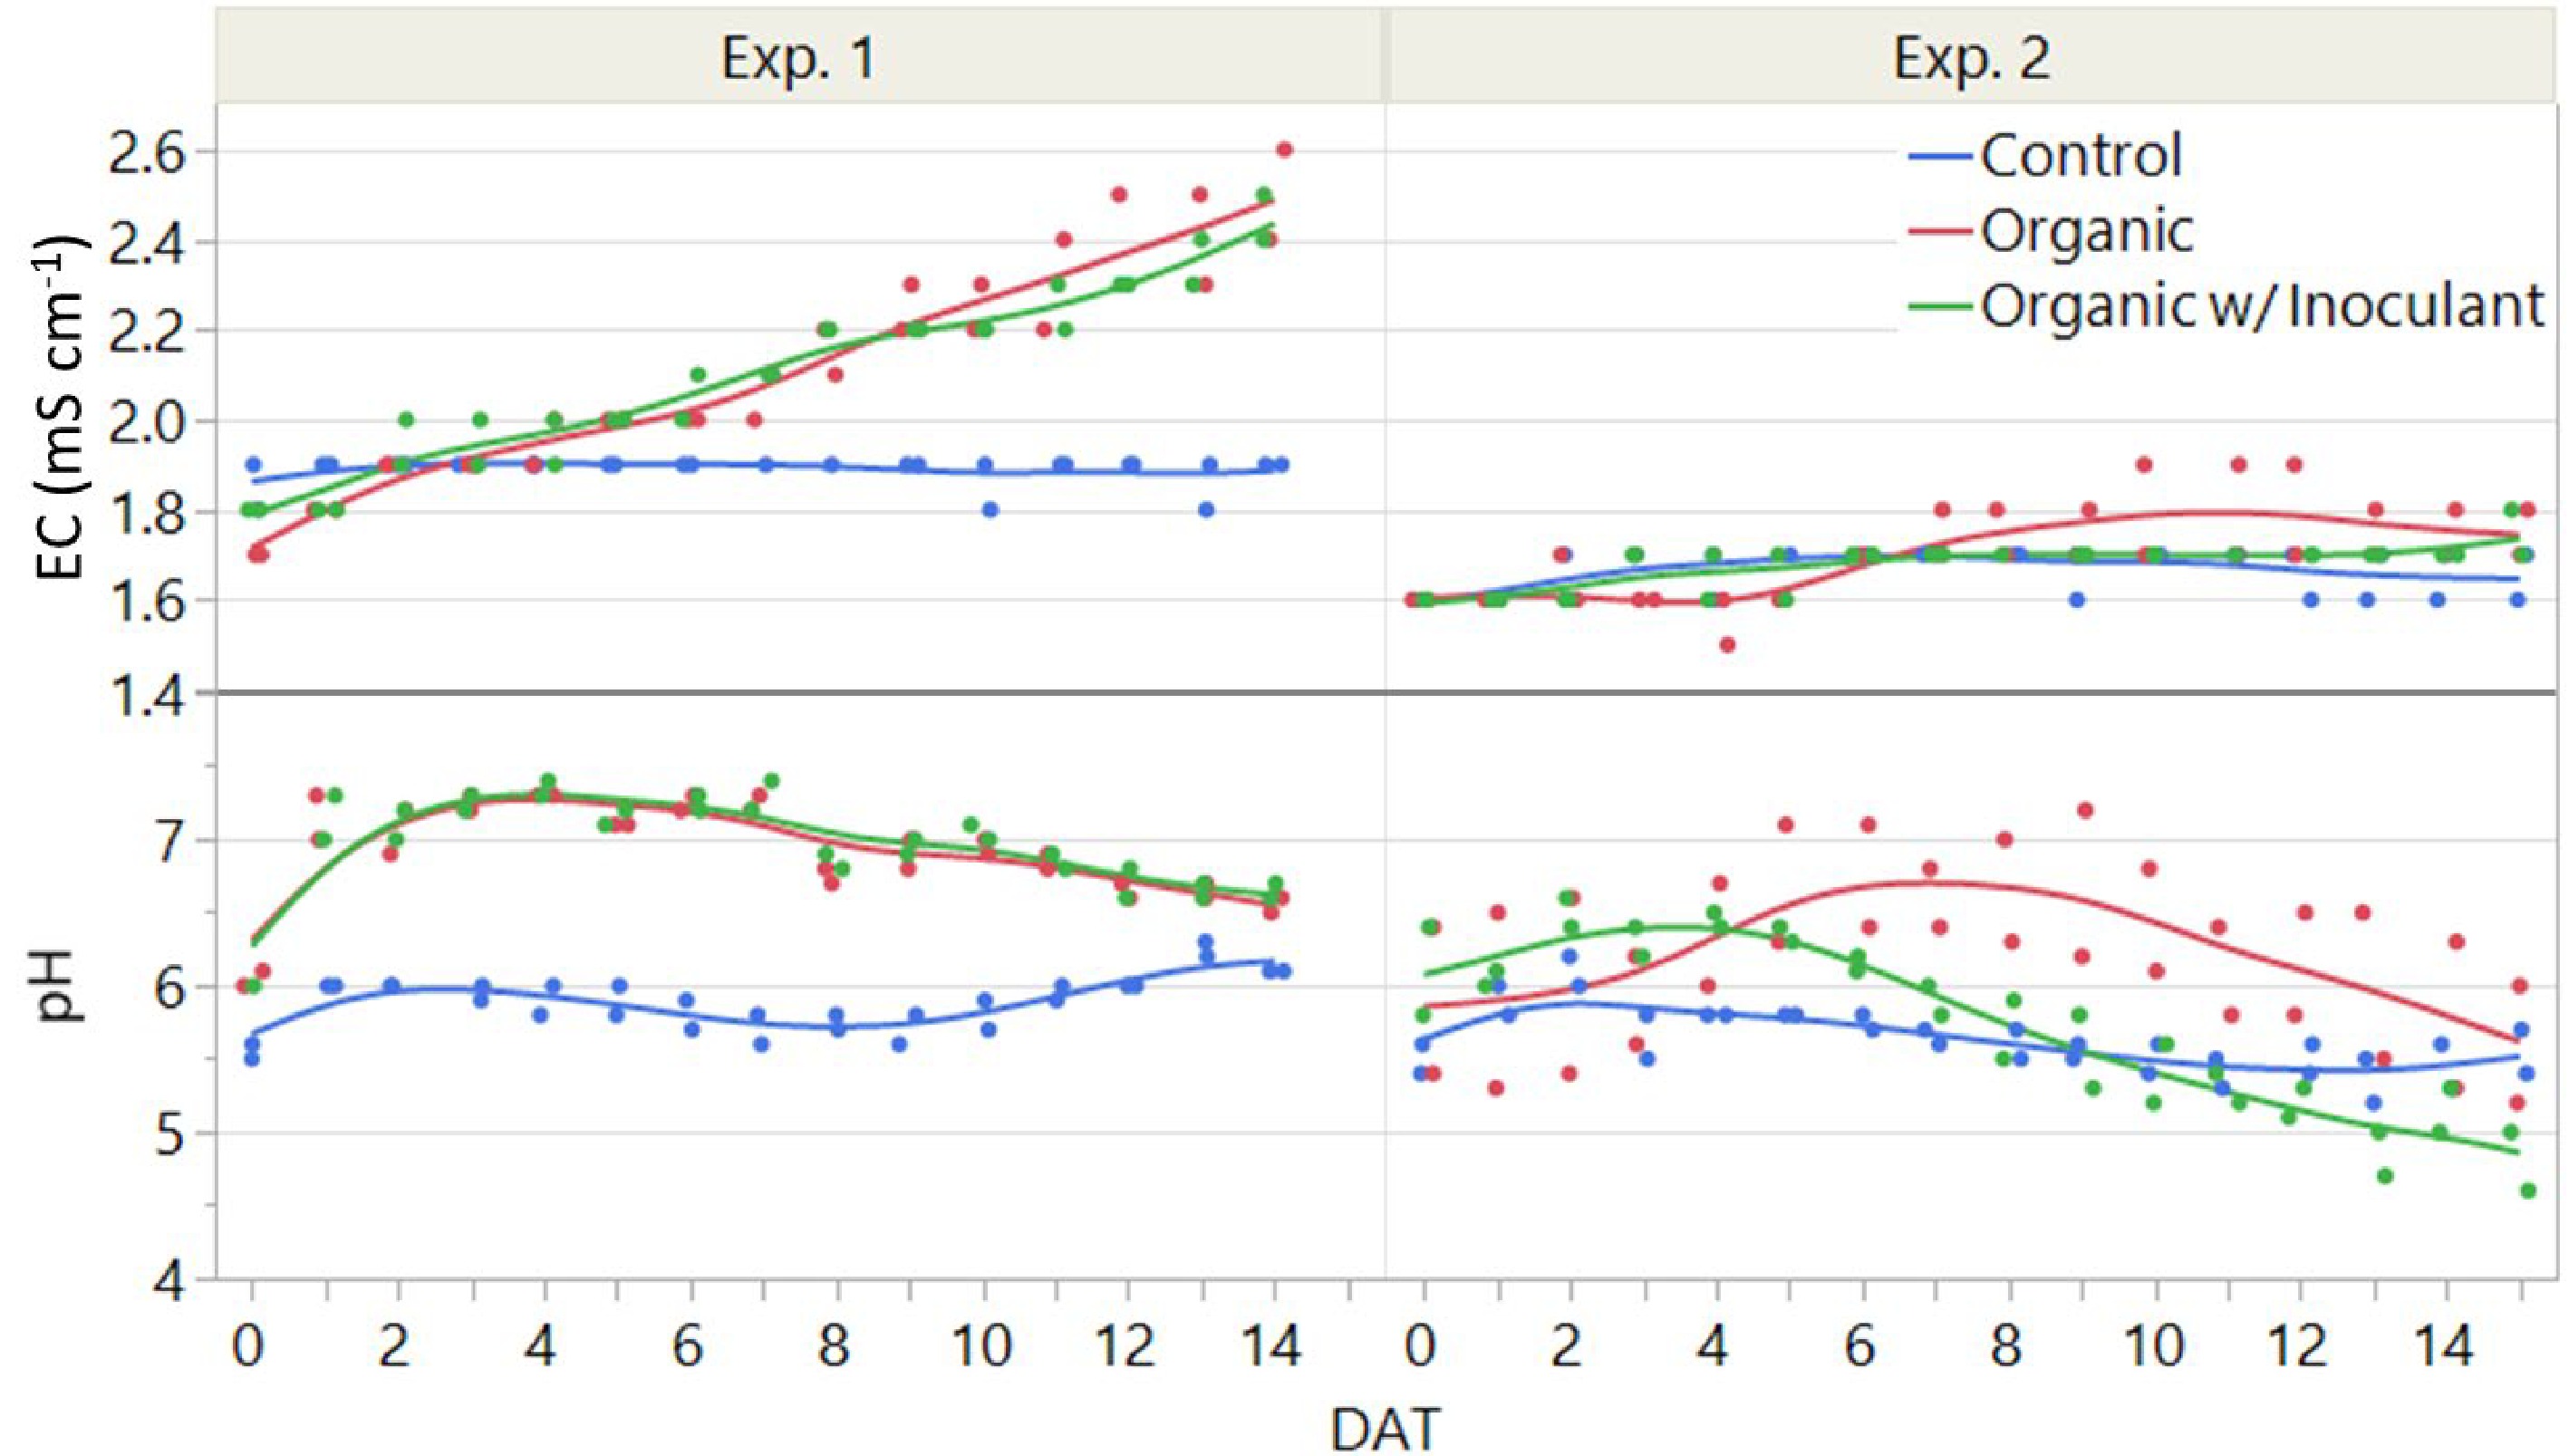
Figure 6.
Electrical conductivity (EC) and pH of the three nutrient solutions, including a conventional (Control) and an organic fertilizer with or without inoculant, used to grow lettuce in an NFT hydroponic system in a greenhouse for two weeks, or 14 days after transplant (DAT). The experiment was replicated twice. The control solution was prepared fresh for both experiments while the organic solutions were replenished and re-used in Experiment 2 to evaluate the effectiveness of the microbial inoculant.
The pH of the control solution remained relatively stable while the organic solutions increased notably during the first week, but then tapered off toward the end of the experiment (Fig. 6). The pH of the organic solutions with or without inoculant reached a maximum of 7.4 and 7.3, which represented an increase of 20% and 23%, respectively, compared to the start of the experiment. Overall, the average pH in the control, organic, and organic with inoculant nutrient solutions was 5.9 ± 0.2, 6.9 ± 0.3, and 7.0 ± 0.4, respectively.
In Experiment 2, the EC of all the nutrient solutions tended to remain stable throughout (Fig. 6), which was dissimilar compared to the Experiment 1 for the organic treatments. Overall, the average EC of the control, organic, and organic with inoculant was 1.7 ± 0.0, 1.7 ± 0.1, and 1.7 ± 0.0 mS cm−1, respectively. Concurrently, the volume of the solutions decreased throughout the experiment by 29%, 20%, and 22% respectively (data not presented).
In Experiment 2, the pH of the control solution was relatively stable compared to the organic solutions, which was similar to Experiment 1 (Fig. 6). However, the organic treatments behaved dissimilarly to the first experiment. Specifically, the pH of the organic solution increased slowly during the first week to 6.8, and then decreased slowly during the second week to 5.6. In contrast, the organic solution with inoculant barely increased to a pH of 6.5, followed by a more rapid decrease to a minimum of 4.8 at the end of the experiment. Overall, the average pH in the control, organic, and organic with inoculant nutrient solutions was 5.6 ± 0.2, 6.2 ± 0.6, and 5.7 ± 0.6, respectively.
-
Our results showed that plant growth with organic fertilizer and inoculant was equal to the conventional fertilizer in the first experiment, based on growth index, and fresh and dry weight. These results indicate that hydroponic production of lettuce using organic fertilizer with a microbial inoculant is viable and has the potential to achieve similar yields to conventional fertilizer. For the organic fertilizer treatments, we did not observe blockage of tubes, but we noticed that the continuous nutrient supply caused a problem in the root zone of the propagation plugs, where roots did not develop well due to low dissolved oxygen as observed in our previous trials, due to the formation of biofilm inside the propagation plugs. After we changed the nutrient supply to 15 min per hour, giving the roots a 'dry' period, crop performance improved.
Shinohara et al.[13] reported an increase in fresh and dry weight of butterhead lettuce using an organic fertilizer with a microbial inoculant in a custom hydroponic system, compared to conventional fertilizer. However, the results from our second experiment showed that plant growth decreased when treated with organic fertilizer compared to the conventional control, but the addition of inoculant increased growth in the organic treatment. A possible reason for the reduced growth is insufficient nutrient availability in the organic treatments as evidenced in the lower tissue K and Ca content, which may be due to slower rate of mineralization in the organic treatments that did not meet the plant growth rate. Saijai et al.[14] reported that the rate of mineralization was highest in a nutrient solution with a pH of 7.5. Our results appear to agree, since the pH of the organic fertilizer solutions with or without inoculant reached a maximum of 7.3 in the first experiment but decreased to a minimum of 4.8 and 5.6, respectively, in the second experiment. This is most likely attributed to poor mineralization (and subsequently nutrient availability) in the second experiment.
Both experiments showed that the addition of a microbial inoculant improved plant growth compared to the organic fertilizer applied alone. The inoculant provides the necessary microorganisms to mineralize larger organic compounds into smaller inorganic nutrients essential for plant growth. Therefore, it is presumed that there was less nutrient availability in the organic fertilizer solution without inoculant, which was evidenced by the reduced mineral content in the shoot tissue of the plants. Moreover, possible phytotoxic effects could have inhibited plant growth. Garland et al.[19] reported phytotoxic effects from soluble organic compounds in a recirculating hydroponic system, but then remediated the effects through microbial activity. Lee et al.[20] identified several organic acids that accumulated when hydroponic nutrient solution was recycled. Asao et al.[21] mitigated the toxicity of an organic acid with a microbial strain and improved the yield of cucumber in a hydroponic system. Our results align with these studies in that the addition of a microbial inoculant benefited plant growth in a hydroponic system.
The higher SPAD readings in the organic treatments indicate greater relative chlorophyll and nitrogen content in the leaves[22]. A higher SPAD reading can also indicate thicker leaves with higher contents of phytonutrients[23]. However, this was not supported by the plant growth (both FW and DW) and the leaf N concentration in our study. These results may indicate that SPAD readings may have a poor correlation with leaf N concentration in organically grown plants. While not quantified, leaf color in organic treatment appeared darker compared to that in the control. Plant quality increased with the organic fertilizer and inoculant compared to the conventional fertilizer, based on anthocyanin results. Anthocyanins are blue/purple pigments in plants and have been shown to have antioxidant and anti-inflammatory properties[24,25]. Overall, these results indicate that there is potential for organic hydroponic production to produce lettuce with improved quality to conventional methods.
In the first experiment, the mineral content of both macro and micronutrients was highest in the shoot tissue of lettuce plants treated with the organic fertilizer and inoculant. This indicates that sufficient mineralization was occurring in the solution, and essential nutrients were available for plant uptake. This is important for hydroponic production of crops, where a continuous supply of nitrogen is critical for optimum plant growth[26]. For organic fertilizer, the mineralization process is necessary to produce ammonium and subsequently nitrate (via ammonification and nitrification, respectively), the latter of which is the preferred source of nitrogen for plants[27]. However, it is important to note that high nitrate content in edible leafy greens is undesirable due to human health concerns[28]. In the second experiment, the nitrogen levels in the shoot tissue were less than those observed in the first experiment and there were no differences among treatments, indicating similar nitrate levels.
Additionally, calcium and potassium concentrations in the shoot tissue were lower than those of the control, indicating these macronutrients might be limited in organic liquid fertilizer for hydroponic production. It may be possible to increase Ca and K by supplementing with specific Ca and K organic fertilizers, similar to what was done with Mg in this study. That is, multiple organic fertilizers may be necessary to provide a 'full spectrum' of essential macronutrients.
Regarding the EC and pH of the nutrient solutions, our results indicated that organic fertilizer is more dynamic than conventional fertilizer throughout the growing cycle of lettuce. The steady increase in the solution EC of the organic treatments in the first experiment could be explained by the mineralization process, which can increase availability of ions in the solution. This would also explain why the EC in the control solution did not increase throughout the experiment, since the conventional fertilizer is already in an inorganic form, therefore no mineralization could occur. However, the depletion of the reservoir solution through evapotranspiration would outpace the differential uptake of ions by the plants, as shown by Niu et al.[29], which can lead to a more concentrated nutrient solution over time. In our case, less than half of the reservoir solution was depleted by the end of the experiment, therefore this impact was less noticeable.
In the second experiment, the EC was more stable for all the treatment solutions. This was attributed to the slightly lower average EC of all the treatments at the start of the second experiment compared to the start of the first (1.6 and 1.8 dS m−1, respectively). Additionally, since the organic solutions were re-used, lower rates of mineralization were attributed to the static nature of the EC in the second experiment. At the start of the second experiment, approximately 25% of the original amount of liquid organic fertilizer was used to replenish the solutions to the desired EC level. Williams and Nelson[12] reported challenges in using EC to indicate nutrient levels in an organic fertilizer to grow lettuce (Lactuca sativa L. var. 'Rex') in an NFT hydroponic system.
Managing pH in a hydroponic system is important to prevent certain nutrients from forming precipitates and becoming unavailable for plant uptake. A pH range of 5.8−6.4 is recommended for most plants in a hydroponic system[30]. For organic fertilizer, this may not be possible due to large fluctuations, as our results indicated. Over the course of both experiments, the pH of the organic solutions fluctuated from a high of 7.3 to a low of 4.8. Williams and Nelson[12] also reported large pH fluctuations and difficulty in managing the pH of an organic nutrient solution. These large changes in pH might be attributed to the mineralization of the organic fertilizer in conjunction with the uptake of available nutrients by the plants. For example, Imas et al.[31] showed that pH increases in solution when nitrate (
${\text {NO}}^-_3 $ ${\text {NH}}^+_4 $ -
Our study showed that hydroponic production with organic fertilizer is feasible and can produce lettuce with yields similar to conventional fertilizer. Additionally, our results emphasize the importance of a microbial inoculant in conjunction with an organic fertilizer for more effective mineralization and enhanced plant growth. There is also potential for organic hydroponic production to produce high quality crops with increased pigmentation and phytonutrient content. However, managing organic fertilizer solution with inoculant over multiple growing cycles can be challenging and supplemental organic fertilizers with different macro nutrients such as Ca, K and Mg may be needed to match the need for optimal plant growth. The EC and pH of the organic fertilizer solution can fluctuate widely, and that a high pH of approximately 7.0 may be more effective for mineralization and plant growth. More research is needed to better understand the mineralization process of organic fertilizer in a nutrient solution for effective organic hydroponic production.
-
The authors declare that they have no conflict of interest.
- Copyright: © 2022 by the author(s). Published by Maximum Academic Press, Fayetteville, GA. This article is an open access article distributed under Creative Commons Attribution License (CC BY 4.0), visit https://creativecommons.org/licenses/by/4.0/.
-
About this article
Cite this article
Hooks T, Masabni J, Sun L, Niu G. 2022. Effects of organic fertilizer with or without a microbial inoculant on the growth and quality of lettuce in an NFT hydroponic system. Technology in Horticulture 2:1 doi: 10.48130/TIH-2022-0001
Effects of organic fertilizer with or without a microbial inoculant on the growth and quality of lettuce in an NFT hydroponic system
- Received: 19 July 2021
- Accepted: 19 January 2022
- Published online: 14 February 2022
Abstract: Organic food continues to increase in popularity worldwide. Similarly, hydroponic production of leafy greens is expanding globally and is an important component of the world's food supply. The purpose of this study was to evaluate the growth and quality of lettuce using six nutrient film technique (NFT) hydroponic systems. There were three treatments: organic fertilizer with or without a microbial inoculant and a conventional inorganic fertilizer as a control. The experiment was repeated over time. Results showed that the plants grown with organic fertilizer with additional microbial inoculant achieved similar shoot fresh and dry weight to those of the control, and dry weight was 17% higher than the organic fertilizer without inoculant. Nitrogen content in the shoot tissue of plants treated with organic fertilizer with inoculant was 10% and 24% greater than the control and the organic fertilizer without inoculant, respectively. However, when the organic fertilizer with inoculant was reused in a second experiment, shoot fresh and dry weight of plants in organic fertilizer with inoculant was lower than those in the control but were still higher compared to the organic fertilizer without inoculant. Additionally, electrical conductivity (EC) and pH of the organic fertilizer solutions fluctuated widely. Interestingly, relative chlorophyll content measured as SPAD and anthocyanin content in the leaf tissue increased in plants treated with organic fertilizer, regardless of inoculant, by 19% and 9%, respectively.
-
Key words:
- Organic hydroponics /
- Leafy greens /
- Phytonutrients /
- Nutritional quality /
- Microbial inoculant /
- Lettuce /
- Organic fertilizer /
- Anthocyanin


