METHOD   Open Access    

Establishment of an efficient transgenic selection system and its utilization in Saccharum officinarum

More Information
  • Transgenic strategy plays an important role in the biological study and breeding of sugarcane. However, the efficiency of sugarcane transgenic systems remains disappointing to breeders. Various cultivated varieties are recalcitrant to genetic transformation, and only a few sugarcane research institutes could successfully obtain positive transgenic lines. In our previous research, three kinds of sugarcane transgenic selection systems, namely, the PMI/Mannose, CP4-EPSPS/glyphosate, and bar/Basta selection systems, were successfully established. Among these systems, the bar/Basta selection system was the most efficient. By applying this selection system, 10 or more transgenic shoots could be obtained from a gram of embryogenic calluses. In addition, the resistant shoots obtained after screening were almost 100% positive for the molecular assay, and all of the transgenic shoots showed high herbicide tolerance in lab tests and field trials. Herein, the key points/steps, advantage and contribution to sugarcane studies and breeding in China of the efficient bar/Basta sugarcane transformation system are presented and discussed.
  • Genetic diversity due to genetic variation is the cornerstone for ecosystem diversity and species diversity. Genetic variation is a change in the genetic material of an organism that can be passed on to future generations, including chromosomal variation, genetic recombination, genetic mutations, and the emergence of orphan genes (OGs)[1]. OGs are a group of genes in a taxonomic group for which no obvious homology can be found at the genomic level, also known as 'lineage-specific genes'[2,3]. The first report of OGs in Saccharomyces cerevisiae was released in 1996[4]. However, in the early stage, researchers knew little about OGs due to the limitation of sequencing ability to obtain the complete genome of many lineages[5]. Over recent decades, following the speedy advancement of sequencing technologies, complete genomic and transcriptomic sequences of a large number of species have been obtained quickly, accurately, and inexpensively[6]. Each freshly sequenced genome consists of a portion of OGs, and therefore, OGs in organisms such as the silkworm[7], sweet orange[8], and tea plant[9] have begun to be studied extensively. As research has continued, based on previous work on complete genomes in such species as Human, Drosophila, and Arabidopsis thaliana, researchers have proposed several mechanisms for the origin of OGs related to gene duplication and subsequent sequence divergence, transposable elements, lateral gene transfer, and de novo origination[1014].

    However, the functions of most OGs are not annotated due to the lack of homologous genes and functional domain information[15]. Although it is challenging to analyze the biological functions using comparative genomics, some preliminary explorations can be made based on their sequence structural features. OGs have a shorter generation time in comparison to non-orphan genes (NOGs), and therefore, there are some identifiable differences in gene and protein length, exon number, GC content, transcript support, and position preference on chromosomes. In sweet orange, the OGs had a lower average number of exons per gene, both shorter genes and protein length, higher GC content, as well as priority distribution on certain chromosomes, in comparison to NOGs[8]. Similar results were found in A. thaliana[15], Drosophila[16], Poaceae[17], zebrafish[18], and tea plant[9].

    A considerable amount of research has now proven that OGs have a crucial impact on growth and development[19,20]. RNA interference of 200 OGs in Drosophila melanogaster induced down-regulation of their expression and was found to result in lethality mainly concentrated in the metaphase[21]. In plants, transgenic transfer of the OG (QQS), which is responsible for influencing the process of carbon and nitrogen segregation of proteins and carbohydrates in A. thaliana, into soybean was found to affect the protein content of soybean seeds similarly[22]. It is noteworthy that tissue-specific expression of OGs exists, with a preference in animals for expression in male reproductive tissues such as the testis[13], exemplified by the species-specific chimeric gene Sdic1 encoding the sperm-specific kinesin intermediate chain in D. melanogaster[23]. A similar phenomenon is present in plants, where tissue-specific expression of OGs tends to be reflected in the male reproductive system, for instance, in pollen. By way of exemplification, the orphan protein encoded by the Ms2 gene caused male sterility in wheat, barley, and phragmites[24]. Besides, OGs have been shown to play an essential part in environmental adaptation. Drought-induced over-expression of the OG (UP12_8740) in cowpea increased its tolerance to osmotic stress and soil drought[25]. Similarly, preferential expression of OGs under abiotic stress was reported in water flea[26], A. thaliana[27] and rice[28].

    The Chinese rose (Rosa chinensis) is an important horticultural crop and one of the most commonly cultivated ornamentals in the world, with considerable economic value in potted and cut flowers. The bright colors of roses are visually attractive, and therefore, R. chinensis is often used as a suitable demonstration plant for the production of new flowering varieties[29]. R. chinensis is also the dominant species used for hybridization and was introduced to Europe in the 18th century as a parent of modern roses[30]. In the present study, the published R. chinensis genome[31]was used to identify OGs and a comprehensive analysis was performed, including sequence structural features, subcellular localization, gene duplication, and chromosome distribution. In addition, a weighted gene co-expression network analysis (WGCNA) was built to project the functions of these identified OGs. The differences in the expression of OGs at different times under salt and drought stress were also analyzed to explore the adaptation of OGs to the environment. In conclusion, the present results provide valuable clues to reveal the evolution, characterization, and environmental adaptation of OGs in R. chinensis.

    Genomes and annotation information for R. chinensis were obtained from the Rosa database (https://lipm-browsers.toulouse.inra.fr/pub/RchiOBHm-V2/). Predicted proteins of Rosa rugosa were downloaded from the eplant (http://eplant.njau.edu.cn). All other Rosaceae predicted proteins were downloaded from the NCBI Datasets (www.ncbi.nlm.nih.gov/datasets). Unique transcripts (PUT) assembled from plant mRNA sequences were downloaded from PlantGDB (https://goblinp.luddy.indiana.edu/prj/ESTCluster), and 122 plant genomes predicted proteins were extracted from Phytozome (https://phytozome-next.jgi.doe.gov), and 77 from eplant (http://eplant.njau.edu.cn) were downloaded. UniProtKB was obtained from Uniprot (www.uniprot.org/uniprotkb) and NR database were downloaded from NCBI (ftp://ftp.ncbi.nlm.nih.gov), individually.

    For the prediction of the potential function of OGs, we collected RNA-seq data from publicly available materials to acquire the gene expression levels. Such data consisted of different tissues or varying stress of R. chinensis. The transcriptome data was downloaded from the National Center for Biotechnology Information database (NCBI; www.ncbi.nlm.nih.gov) with BioProject accession number PRJNA546486 (leaf, stem, root, pistil ovary, prickle, and stamen), PRJNA722055 (leaf imposed to drought stress: 0, 30, 60, and 90 d) and PRJNA587482 (root imposed to salt stress: 0, 2, 24, and 48 h).

    The advancement of comparative genomics has led to a much more improved investigation of the origin and evolution of OGs. A homolog-based search was performed in a pipeline to identify R. chinensis within OGs (Fig. 1). Initially, R. chinensis protein sequences were scoured against the R. rugosa proteome with the BLASTP. Any R. chinensis protein sequence with BLASTP hit with an E-value cutoff of 1e-5 was discarded once available. Homology searches were then conducted with genomes of other Rosaceae plants, Phytozome, eplant, Plant-PUTs database, Uniprot-KB database, and NR database sequentially with an E-value cutoff of 1e-5. Finally, the genes without homologs in any databases were the OGs[15,32], whereas all the alternatives with homologous were non-orphan genes (NOGs).

    Figure 1.  Procedure for identifying the orphan genes in R. chinensis genome. The purple arrows represent a homolog-based search by BLASTP with an E-value cutoff of 1e-5. The blue arrow represents a homolog-based search by TBLASTN with an E-value cutoff of 1e-5. Genes without homologs in any databases were identified as OGs (2,586), while genes with homologs were classified as NOGs (33,791).

    To visualize the structural characteristics of the OGs, a genome-wide profile of R. chinensis was applied. DAMBE7 software was employed to evaluate the isoelectric points of OGs and NOGs[33]. Discrepancies among OGs and NOGs, including gene size, length of the protein, size of the exons and introns, number of the exons, and content of GC were computed with the use of in-house Python scripts. The Wilcox rank-sum test was then used to identify the significant difference across distinct groups for OGs and NOGs. Information on chromosome localization was retrieved from chromosome sequences and plotted using MapGene2Chrom (http://mg2c.iask.in/mg2c_v2.0). A final BUSCA (Bologna Unified Subcellular Component Annotator) was applied to predict the OGs subcellular localizations[34].

    Based on previous studies, there are varied models interpreting the origin of OGs[3,14], of which gene duplication has been considered the dominant mechanism underlying the emergence of OGs[35]. The present work started with a BLASTP search for homologous genes with an E-value cutoff of 1e-8, followed by the identification of different types of gene duplication using MCscanX with was capable of detecting WGD, tandem duplication, proximal duplication, transposon duplication, and dispersed duplication[36].

    To analyze tissue expression, growth and development, and ability to adapt to the environment of R. chinensis, the transcriptome data was downloaded. The raw RNA-seq data was in turn filtered using the Trimmomatic program[37]. With the aim of identifying differentially expressed genes (DEGs) between treatments, we used the default settings of the abundance_estimates_to_matrix.pl, run_DE_analysis.pl (DESeq2) and analyze_diff_expr.pl modules of the Trinity package. Significant differences in gene expression were ascertained using the |log2FC| ≥ 1 with a false discovery rate (FDR) < 0.05 as thresholds, and RSEM implemented in the Trinity package was employed to calculate FPKM (fragments per kilobase of exon per million fragments mapped)[38]. A cluster analysis was conducted using R software targeting particular expressed genes based on RNA-seq data and following functional validation was selected. It was assumed that genes with FPKM value > 0.02 were already expressed[39]. Besides, genes that were exclusively expressed in specific tissue were determined by PaGeFinder software with specificity measure (SPM)[40], and once the SPM value was ≥ 0.9, the gene in that tissue was identified specifically.

    Following the discard of genes with FPKM < 1, WGCNA was constructed and the genes were grouped into modules aided by the WGCNA package in R software[41]. The automatic network builder function block-wise Modules were utilized to construct the network with default parameters. After that, eigengene values were computed for individual modules for every tissue and the module with the highest correlation coefficient, while fulfilling a p-value < 0.05, was picked to serve as the tissue-specific module for further analysis. The candidate with the most significant representative gene in each module was assumed to be the module eigengene. Module membership[10] and gene importance[32] were calculated for every ME in each tissue-specific module, and once MM > 0.95 and GS > 0.85, the gene was deemed to be the central gene of the module. KEGG enrichment analysis was carried out on an online platform, OmicShare (www.omicshare.com).

    The OGs of R. chinensis were characterized according to the methodology employed in recent studies (Fig. 1) with the recently published database resources[15,42,43]. A total of 36,377 annotated protein-coding genes within the R. chinensis genome were used for BLASTP with all R. rugosa protein-coding genes (39,704) presented in this study. During this procedure, there were a total of 33,006 genes with significant similarity (E-value < 1e-5), and 3,371 genes (DBI) were kept for the follow-up analysis. The NOGs indicating homology were eliminated, and a further scan of the remaining genes were carried out alongside the published genomes of the Rosaceae family. Altogether 2872 genes (DBII) were kept for further analysis at this step. The NOGs displaying homology were dropped and the remaining genes were matched with 122 plant genomes in Phytozome for an additional search, yielding 2,812 genes being retained for the following step (DBIII). After comparing these 2,812 genes with the 77 plant genomes in the eplant database, 2,759 genes were not found as homologs (DBIV). Of these 2,759 genes subsequently matched against 251 PlantGDB-assembled Unique Transcripts (PUTs) sequences and no homologs were found for 2,613 genes (DBV). The last step, was to completely erase the impact of false positives from the analysis, leftover genes were examined in the context of UniProt-KB and NR databases, an action that finally left 2,586 genes. These leftover 2,586 genes were labelled as OGs in the R. chinensis genome, representing 7.11% of the entire genome of R. chinensis (Supplementary Table S1), as opposed to these remaining 33,791 genes whose similarity to the databases was defined as NOGs.

    Aiming at clarifying any significant differences between OGs and NOGs, the analysis highlighted and compared the sequence structural features between 2,586 OGs and 33,791 NOGs found in the present study. The results showed a significantly smaller gene size (Wilcox rank sum test, p < 2.2e-16) and protein size (Fig. 2a, Wilcox rank sum test, p < 2.2e-16) for OGs than for NOGs (Table 1), where 1,512.34 bp was the OGs gene size and 72.5 amino acids (aa) was the OGs protein size, 2868.43 bp for NOGs gene size and 378.4 aa for NOGs protein size, which suggested that the NOGs protein was 5.22-fold lengthening than OG protein (Table 1). An in-depth analysis on the structural components of the genes revealed that the shorter protein size was predominantly attributed to the lower number of exons (Fig. 2b, Wilcox rank sum test, p < 2.2e-16). The exon size (Fig. 2c, Wilcox rank sum test, p = 7.789e-15) and intron size (Fig. 2d, Wilcox rank sum test, p < 2.2e-16) of OGs, however, were both remarkably bigger than NOGs. The GC content and the isoelectric point of OGs were further comparatively examined with those of NOGs. It was shown that the GC contents of OGs were lower than that of NOGs (Table 1, Fig. 2e, Wilcox rank sum test, p < 2.2e-16). In contrast, the isoelectric point of OGs (8.53) was higher than that of NOGs (7.42) (Table 1, Fig. 2f, Wilcox rank sum test, p < 2.2e-16). In general, these results suggested that there existed significant differences in genetic features of OGs and NOGs.

    Figure 2.  Analysis and comparison of the structural characteristics of orphan genes (OGs) and non-orphan genes (NOGs). (a) Box-plot comparisons of protein length. (b) Exon number per gene. (c) Exon length. (d) Intron length. (e) GCs content. (f) Isoelectric point. White squares represent the mean value. **** indicate significance levels at p < 0.0001.
    Table 1.  Genic features of orphan genes (OGs) compared with non-orphan genes (NOGs).
    Items OGs NOGs Wilcox rank sum test
    probability
    Mean (SE) Median Mean (SE) Median
    Gene size (bp) 1,512.34 (1,736.26) 880 2,868.43 (2,590.26) 2,239 < 2.2e-16
    Protein size (aa) 72.5 (32.17) 63 378.4 (306.51) 306 < 2.2e-16
    Exons per gene 2.34 (1.99) 2 4.82 (4.74) 3 < 2.2e-16
    Exon size (bp) 347.84 (385.78) 225.5 322.22 (423.62) 164 7.789e-15
    Intron size (bp) 571.3 (998) 270 556.31 (731.19) 356 < 2.2e-16
    Gene GC content (%) 39 (4.85) 38.05 40.31 (4.06) 39.46 < 2.2e-16
    CDS GC content (%) 41.9 (6.47) 41.46 45.08 (4.54) 44.35 < 2.2e-16
    Isoelectric point 8.53 (2.34) 8.64 7.42 (1.94) 7.21 < 2.2e-16
     | Show Table
    DownLoad: CSV

    For the analysis of OGs' genomic distribution, the OGs were plotted over the chromosomes of R. chinensis based on the available information from genome annotation (Supplementary Table S1). A total of 2560 OGs were spread over seven chromosomes. A maximum number of OGs per chromosome was in the order of Chr2 (465), Chr5 (423) and Chr1 (395). The percentages of OGs distributed on the seven chromosomes were 7.97%, 7.01%, 6.84%, 7.37%, 6.91%, 6.41%, and 7.29%, respectively (Fig. 3b), demonstrating that there was no chromosomal preference in the distribution of the OGs in R. chinensis. Besides, the distribution density of OGs was higher near the telomeres, and the distribution was relatively balanced on the chromosomes apart from the aggregation phenomenon in some chromosomal regions (Fig. 3c). Generally, the spread of OGs on these seven chromosomes was reasonably uniform.

    Figure 3.  Orphan genes (OGs) distribution on chromosomes. (a) The numbers of OGs on each chromosome of R. chinensis. (b) Percentage of OGs on each chromosome of R. chinensis. (c) Chromosomal distribution of the identified OGs. Black horizontal lines represent OGs.

    Protein functions typically are, to a certain extent, inferred from their subcellular localization. In this study, among the 2,586 OGs that were identified, 788 were positioned in extracellular space, 652 in the chloroplast, 534 in the nucleus, 261 on the organelle membrane, 232 in the endomembrane system, 86 on the plasma membrane, 27 in the mitochondria, and all but eight in the chloroplast thylakoid lumen (Fig. 4).

    Figure 4.  Orphan gene (OGs) subcellular and gene duplication analysis. (a) OGs assigned to different subcellular locations. (b) The OGs number of different duplication types.

    The origination of OGs is essential in the evolution of the genome. OGs often arise from a combinatorial mix of diverse mechanisms of origin. While gene duplication is believed to be the predominant model for the origin of OGs, the gene duplication theory consists primarily of the generation of the new gene via differentiation following duplication. 2,586 OGs derived from the genome of R. chinensis were detected in this study, including 274 OGs derived from gene duplication, accounting for approximately 10.6% of the whole OGs ((Supplementary Table S2). There were altogether four OGs originating from whole-genome duplication (WGD). Besides, the number of OGs resulting from tandem duplication, transposed duplication, proximal duplication, and dispersed duplication were 10, 4, 12, and 244 (Supplementary Table S2), respectively.

    The gene expression pattern for one gene across different tissues must enlighten the corresponding biological function. Preceding transcriptomic data on six tissues subjected to normal growth conditions were reanalyzed. It was found that the transcriptional data contained 2,088 (80.74%) OGs and 29,572 (87.51%) NOGs with FPKM > 0.02. Typically, the expressed amount of OGs is relatively lower than that of NOGs. Of these, in pistil ovary and stamen, there were the most OGs expressed (Fig. 5a). In addition, 1,139 OGs were identified to be represented across all six tissues (FPKM > 2 in a minimum of one tissue), and 346 OGs were hyper-expressed in all six tissues (FPKM > 2 in all of them). The amount of actively expressed OGs (GeneSpring normalized expression value > 0) followed a generally parallel trend throughout the six tissues and the highest expression level in stamen (Fig. 5b). It was further observed that 214 OGs were specifically expressed in six tissues, out of which 24 were specifically expressed in root, 20 in the stem, 29 in leaf, 21 in prickle, 90 in stamen, and 30 in the pistil ovary (Fig. 5c), such genes may have specific roles within the corresponding tissues. It was obvious that OGs showed more potential expression in stamen (Fig. 5d). A tissue preference for the expression of most OGs was seen according to the expression abundance in each tissue (Fig. 6).

    Figure 5.  Gene expression patterns of R. chinensis orphan genes (OGs). (a) Fraction of OGs having expression in different tissues. (b) GeneSpring normalized expression levels of OGs in different tissues. (c) Fraction of OGs having tissue-specific expression in different tissues of adult stage. (d) Venn diagram showing the number and relationships of expressed OGs in root, stem, leaf, prickle, stamen, and pistil ovary.
    Figure 6.  Expression pattern of orphan genes in different tissues includes root, stem, leaf, prickle, stamen, and pistil ovary of R. chinensis.

    As the function of OGs cannot be inferred from homologous genes, however, OGs were exclusively expressed in diverse tissues (Fig. 5). The potential functions of OGs were further profiled employing WGCNA, a tool for determining synergistic gene modules. Fifteen modules were defined. Considering different tissues as traits, the modules associated with the optimization of characteristic vector genes and phenotypes were filtered and mapped the heat map of module-trait relationships. Five modules were eventually settled on that had an extremely strong positive correlation to the trait (Fig. 7a). Subsequently, 5,218 hub genes were screened and confirmed in five modules, consisting of 217 OGs. In MEblue (leaf), there were 1,454 hub genes, containing 31 OGs. In the MEbrown model (root), 1,436 hub genes were present, covering 49 OGs. In the MEgreen model (pistil ovary), a total of 250 hub genes existed, including 11 OGs. Among the MEred model (stem), with 159 hub genes that included one OG. In the MEturquoise model (stamen), as many as 1,919 hub genes were found, comprising 125 OGs (Supplementary Table S3). These five modules were followed up with an analysis of KEGG enrichment immediately (p-value < 0.05). In MEblue (leaf), it was predominantly enriched in photosynthesis (ko00195), porphyrin, and chlorophyll metabolism (ko00860), carbon fixation in photosynthetic organisms (ko00710), carotenoid biosynthesis (ko00906), and plant hormone signal transduction (ko04075). In the MEbrown model (root), it was primarily affluent in glutathione metabolism (ko00480), phenylpropanoid biosynthesis (ko00940), MAPK signaling pathway (ko04016), and plant hormone signal transduction (ko04075). In the MEgreen model (pistil ovary), linoleic acid metabolism (ko00591), alpha-Linolenic acid metabolism (ko00592), and plant hormone signal transduction (ko04075) were enriched. In the MEred model (stem), it was mainly enriched SNARE interactions in vesicular transport (ko04130) and isoflavonoid biosynthesis (ko00943). In the MEturquoise model (stamen), pentose and glucuronate interconversions (ko00040), phosphatidylinositol signaling system (ko04070), glycerophospholipid metabolism (ko00564), glycolysis/gluconeogenesis (ko00010), galactose metabolism (ko00052) and ether lipid metabolism (ko00565) (Fig. 7b).

    Figure 7.  Co-expression network analyses. (a) Heat map of module-tissue relationship. (b) KEGG enrichment analysis of five tissue-specific modules, include KEGG enrichment analysis result of MEblue module genes (leaf). KEGG enrichment analysis result of MEgreen module genes (pistil ovary). KEGG enrichment analysis result of MEbrown module genes (root). KEGG enrichment analysis result of MEturquoise module genes (stamen). KEGG enrichment analysis result of MEred module genes (stem).

    In addition, with the aim of probing the potential link between OGs and environmental adaptation, the expression of OGs were reanalyzed in roots under salt stress (0, 2, 24, and 48 h under salt stress) and leaves under drought stress (0, 30, 60, and 90 d under drought stress) using published RNA-seq data. At salt treatment, compared with the control group (0 h under salt stress), 21 (up-regulated: 7, down-regulated: 14), 116 (up-regulated: 56, down-regulated: 60) and 56 (up-regulated: 91, down-regulated: 39) identified OGs in 2 h vs 0 h, 24 h vs 0 h, and 48 h vs 0 h were differentially expressed, correspondingly (Supplementary Table S4). A total of 201 OGs overlapped (201/2586, 7.78%) that were salt responsive in roots, of which 112 OGs (112/201, 55.72%) were up-regulated and 89 OGs (89/201, 44.28%) were down-regulated (Fig. 8a). Fuzzy c-means clustering analysis of all salt-associated DEGs (including OGs and NOGs) was further divided into six Clusters of gene co-expression patterns (Fig. 8b). Two Clusters were focused on with increasing (Cluster 2), and decreasing trends (Cluster 4) of gene expression levels with increasing salt treatment time. Genes with Memberships > 0.7 in Cluster 2 and Cluster 4 were screened for subsequent functional enrichment analysis. There was a total of 440 DEGs in Cluster 2, including 15 OGs, and 336 DEGs in Cluster 4, including 7 OGs (Supplementary Table S5). Nineteen OGs were engaged and enriched in GO terms, consisting 'cellular hyperosmotic salinity response', 'cellular response to hydrogen peroxide', and 'response to salt stress' (p-value < 0.01) (Supplementary Table S6). KEGG enrichment results showed that ABC transporters and brassinosteroid biosynthesis pathway were remarkably enriched (p-value < 0.05) (Table 2).

    Figure 8.  Transcriptome analysis of orphan genes (OGs) under salt and drought stress. (a) Number of differentially expressed OGs under salt stress in leaves of R. chinensis. (b) Trends in the expression of differentially expressed genes at different time points under salt stress. (c) Heat map of the expression of OGs under the trend of pattern Cluster 2 and Cluster 4. (d) Number of differentially expressed OGs under drought stress in roots of R. chinensis. (e) Trends in the expression of differentially expressed genes at different time points under drought stress. (f) Heat map of the expression of OGs under the trend of pattern Cluster 1 and Cluster 3.
    Table 2.  Enriched KEGG pathway for R. chinensis orphan genes.
    Type Cluster KEGG pathway p-value
    Salt stress Cluster 2 Alanine, aspartate and glutamate metabolism 0.011861
    Base excision repair 0.013442
    Pentose and glucuronate interconversions 0.016805
    Ubiquinone and other terpenoid-quinone biosynthesis 0.032602
    Cluster 4 Glutathione metabolism 0.006557
    ABC transporters 0.007274
    Brassinosteroid biosynthesis 0.014615
    MAPK signaling pathway 0.016903
    Terpenoid backbone biosynthesis 0.023847
    Glycine, serine and threonine metabolism 0.035604
    Drought stress Cluster 1 Carbon metabolism 4.02E-06
    Ubiquinone and other terpenoid-quinone biosynthesis 5.04E-05
    Carbon fixation in photosynthetic organisms 5.22E-05
    Riboflavin metabolism 0.000115
    Pentose phosphate pathway 0.00284
    Glyoxylate and dicarboxylate metabolism 0.008393
    Steroid biosynthesis 0.03522
    DNA replication 0.036059
    Thiamine metabolism 0.043981
    Cluster 3 Pyrimidine metabolism 0.002402
    Aminoacyl-tRNA biosynthesis 0.019032
    Purine metabolism 0.037451
     | Show Table
    DownLoad: CSV

    Upon drought treatment, in contrast to the control group (0 day under drought stress), 101 (up-regulated: 46, down-regulated: 55), 204 (up-regulated: 76, down-regulated: 128) and 352 (up-regulated: 152, down-regulated: 200) OGs in 30 d vs 0 d, 60 d vs 0 d, and 90 d vs 0 d were differentially expressed, respectively (Supplementary Table S7). Altogether, 480 OGs overlapped (480/2586, 18.56%) in response to drought in roots, with 215 OGs (215/480, 44.79%) being up-regulated and 265 OGs (265/480, 55.21%) being down-regulated (Fig. 8d). An analysis of fuzzy c-means clustering centered on two Clusters (Cluster 1: increasing and Cluster 3: decreasing) of gene expression levels as the duration of drought treatment increased. Individual genes with Memberships > 0.7 in Cluster 1 and Cluster 3 were filtered out for follow-up functional enrichment analysis. 344 DEGs, including nine OGs, were enriched in Cluster 1, and 348 DEGs in Cluster 3 including 19 OGs (Supplementary Table S8). A total of 28 OGs were engaged and enriched in GO terms, namely 'photosynthesis', 'reductive pentose-phosphate cycle' and 'regulation of defense response' (p-value < 0.01) (Supplementary Table S9). The results of KEGG enrichment revealed that carbon metabolism and pentose phosphate pathway were markedly enriched (p -value < 0.05) (Table 2). Strikingly, for 107 OGs a response to both categories of stresses was also discovered (Supplementary Table S10), indicating that these genes likely function significantly in stress tolerance.

    Petal expansion is the principle procedure by which roses open. Interestingly, it was found that 158 OGs were differentially expressed during petal expansion from the results of Han et al. (Supplementary Table S11)[71]. In the results of Han's study, they used WGCNA to identify two modules MEyellow and MEgreenyellow that may be involved in adaxial–abaxial regulation in rose petals. In the MEyellow model, with 383 hub genes, comprising nine OGs. Within the MEgreenyellow model, a total of 52 hub genes were identified, covering two OGs (Supplementary Table S12). Functional analysis of the hub genes of both modules showed that they mainly include transcription factors such as MYBs and WUSCHEL. They also encode various enzymes such as laccase, cellulose synthase, and trehalose-6-phosphate synthase. All in all, 11 OGs were identified that may participate in adaxial–abaxial regulation and have a significant effect on the flowering open procedure.

    The burgeoning field of comparative genomics has accelerated the exploration of the emerging field of OGs, with OGs potentially important for the development, function, and evolution of living organisms being identified in successive species[7,4446]. The accurate identification of OGs is an important prerequisite for their functional prediction and analysis. In the present study, 2,586 OGs from the genome of the rose species R. chinensis were identified, representing approximately 7.11% of the genome, a proportion consistent with the typical percentage of OGs in organisms[47]. Similar to the present results, Lin et al.[15] identified 1,324 OGs in the A. thaliana genome covering approximately 4.9% of the entire genome, Zhao and Ma[9] characterized a total of 1,789 OGs in tea plant accounting for about 3.37% of the genome, and Guo et al.[28] identified 1,926 OGs in the rice genome representing approximately 4.9% of the whole genome. At present, the authentication of OGs relies primarily on comparing the target genome with published genomes of its homologous species. The more reference genomes are available, the richer the annotation information and the smaller the genome gaps of the target genome. Consequently, the number of reference genomes will affect the number and accuracy of OGs identified, where more reference genomes will likely result in fewer OGs and higher accuracy. However, the limitations of currently available identification tools lead to the possibility that the present study may not reflect the fully authentic OGs in the R. chinensis genome. Future improvements in the exclusion of pseudogenes from identification tools and evolutionary analysis of non-conserved genes may further improve the accuracy of identification.

    The shorter origin of OGs relative to NOGs has led to differences in sequence structural features, including gene size, protein size, number and size of exons and introns, GC content, and isoelectric point. The sequence structures between OGs and NOGs were analyzed and compared to reveal whether these general differences exist in the R. chinensis genome. Typically, NOGs have a larger gene size compared with OGs[17,18,42], and the results were consistent with this (Table 1). The short protein length and few exons of OGs (Fig. 2) were similar to the general characteristics of plant families Poaceae[17], Brassicaceae[27], Rutaceae[8], and Camellia[9]. The decrease in the number of exons in OGs may be an important factor contributing to the reduction in their average size (Fig. 2), as the average length of exons is somewhat constant[47]. Consequently, even if the length of exons and introns of OGs was significantly higher than that of NOGs, it had little effect on average size. De novo origination might be another reason accounting for this shorter gene size of OGs, due to their short evolutionary time[48]. In addition, it was speculated that another possible contributor to the difference was the higher proportion of intron-less OGs. Kaessmann suggested that recurrent line-specific expansion may lead to a dramatic enrichment of intron-less genes and the creation of new genes by retrotransposition, a phenomenon that has been demonstrated in zebrafish[13]. On the other hand, in the R. chinensis genome, the GC content of OGs was noticeably less than that of NOGs, in line with Aegiceras corniculatum[49], and the wheat genome[39]. Notably, the GC content of OGs and NOGs tended to be highly variable across species. In contrast to the present results, the GC content of OGs was markedly higher than that of NOGs in sweet orange[8], Bombyx mori[7], zebrafish[18], and tea[9]. The selection and adaptation of organisms to the external environment and genetic recombination are important drivers of changes in GC content[50,51]. The isoelectric point is intimately associated with protein function, and its alteration is thought to be a modifying effect on protein function, important for solubility, subcellular localization, and protein interactions[52]. It was revealed that the isoelectric point of OGs was distinctly above that of NOGs, which may also be driven by selection[53]. For example, in prokaryotes, adaptation to the environment has led to changes in protein isoelectric points[54].

    During evolution, new genetic elements acquired by the genome, such as OGs, are one of the important sources of functional and phenotypic diversity[55]. The expression patterns of OGs on different tissues for the prediction and understanding of their biological functions are accessible using RNA-seq[56]. OGs are inconsistently expressed on different tissues, and in general, OGs are highly expressed in the reproductive system of plants and animals[8,18,57,58]. In the present study, 214 OGs were expressed tissue-specific, of which 90 and 30 OGs were expressed only in reproductive organs, stamen, and pistil ovaries, respectively; in addition, 24, 20, 29, and 21 OGs were expressed in nutritional organs, including roots, stems, leaves, and prickle (Fig. 5). The specific expression of more than 50% of R. chinensis OGs on reproductive organs implied their important role in reproductive development, which was largely in line with the expression profile of other plants' OGs[9,28,49], and more detectable expression was found in stamen (42.06%). Many studies have shown that OGs, or young genes as some researchers call them, were more inclined to be expressed in the male organs. In 2015, Cui refined this doctrine to 'new genes out of the male' and hypothesized that new genes have an important role in reproductive isolation and species differentiation[1]. The present results also support this hypothesis. In a word, the specific expression of OGs in R. chinensis provides important data on their resistance mechanisms, which is resistant to herbivores, pathogens, or mechanical damage, and also prevents water loss, which suggests an important role in the evolution of habitat adaptation in R. chinensis.

    It is not feasible to use homology comparisons to infer the possible expression characteristics and functions of OGs, as they are unique in each species. Under this circumstance, co-expressed gene modules rich in biological information become a dependable vehicle for inferring the biological processes that maybe involved in OGs, as co-expressed genes usually exhibit significant functional similarities[59]. In the present study, WGCNA was used to identify 217 OGs distributed in five modules (Supplementary Table S3). KEGG analysis revealed that these co-expressed gene modules were engaged in a variety of biologically important processes. These mainly included linoleic acid metabolism, pentose and glucuronate interconversions, photosynthesis, and plant hormone signal transduction. In all, the involvement of OGs in important physiological processes such as growth and development, signal transduction, and metabolism in roses demonstrates that OGs can be functional and are likely to be essential.

    OGs involved in pentose and glucuronate interconversions may contribute to male sterility, given the crucial role of anthers in male gametogenesis, while male sterility mutants usually exhibit genetic disruption linked to anther and pollen development[60,61], which can result from abnormal carbohydrates metabolism[62,63]. Carbohydrates, such as pentose and glucuronate, play multiple roles in pollen development, serving as a major source of energy for plant metabolism and as important signaling molecules for regulating growth and development[64,65]. β-glucuronidase, a glycosyl hydrolase, is mainly responsible for the lysosomal degradation of mucopolysaccharides, dermatopoietin, and keratin sulfate[66]. In addition, β-glucuronidase is involved in the metabolism of various endogenous substances, including pentose, glucuronides, porphyrins, starch, and sucrose[67]. The pentose and glucuronide interconversion pathway, enriched with OGs, is highly correlated with male sterility in studies of cabbage (Brassica oleracea L. var. capitata)[68] and cotton (Gossypium hirsutum L.)[69,70] transcriptome analysis, suggesting the involvement of key genes in this pathway.

    Rose flower opening is dependent on petal expansion. The adaxial-abaxial regulation of petals led to a heterogeneous distribution of auxin, and the transport and signaling of the phytohormone auxin were involved in the entire development of flowers[71], and the OGs might be active in determining and maintaining the adaxial-abaxial polarity of petals. On the other hand, floral fragrance is an important feature of ornamental roses, providing sensory pleasure to humans, and monoterpenes are one of the main classes constituting the fragrance of roses[72]. Usually, monoterpenes are mainly produced in plastids and their substrates are derived from the methylerythritol 4-phosphate pathway[73]. However, the lack of photosynthesis in rose petals may lead to a reduced flux of substrates produced through the methylerythritol 4-phosphate pathway. Therefore, photosynthesis not only provides roses with energy for growth and development, but also plays a role in the production and dispersal of floral fragrances. Fatty acid derivatives are prominent compounds in the leaves and sepals of roses[74]. An important class of enzymes involved in the formation of fatty acid-derived volatiles is lipoxygenase (LOX), the enzymatic oxidation of linoleic acid by LOX to produce hexanal. In addition, cleavage of linoleic acid at the 12−13 double bond yields the C12 precursor of jasmonic acid[75]. It has been shown that increased levels of jasmonic acid methylation led to a delayed degradation of carotenoids and affected the carotenoid content of the yellow rose cultivar R. hybrida 'Frisca'[76].

    Rose plants usually grow in subtropical climates where environmental stresses such as drought and salinity are important factors limiting their growth and productivity. It has been shown that OGs were preferentially expressed under abiotic stress, as in yeast[77] and rice[26,28]. Using available RNA-seq data, the expression patterns of OGs were screened under salinity and drought stresses, respectively, and observed 201 and 480 OGs stimulated individually, suggesting the possible important role of these stress-responsive OGs in adaptation to extreme environmental stresses (Fig 8). The increased stimulation of OGs under drought is probable to be highly correlated with their native environment, exemplified by the Middle East Taif region, where Damask rose (Rosa damascena Mill.) originated[78]. The roots serve as the primary site of plant perception of soil water deficit, and subsequently, drought response signals from the roots are transmitted to the leaves[79]. The enrichment of OGs in phytohormone signaling pathways suggested that they may have an essential position in drought sensing and signaling. Surprisingly, a total of 107 OGs responding to both types of stress were found (Supplementary Table S10). RhEXPA4 is a rose expansion protein gene that regulates leaf growth and bestows drought and salt tolerance in Arabidopsis[80] This suggests that these 107 OGs may be critical candidates for further studies of environmental adaptations in roses.

    In conclusion, even without direct functional evidence, the analysis of co-expressed gene modules implies that OG genes maybe involved in important biological processes such as developmental regulation, signal transduction, metabolism, and stress adaptation in roses.

    The authors confirm contribution to the paper as follows: study conception and design: Mao J; data analysis, draft manuscript preparation: Ma D, Ding Q; critical manuscript revision: Mao J, Ma D, Zhao Z, Han X. All authors read and approved the final manuscript.

    The data that support the findings of this study are available in the Rosa database repository: https://lipm-browsers.toulouse.inra.fr/pub/RchiOBHm-V2/.

    We appreciate Laboratoire Reproduction et Developpement des Plantes for providing their valuable databases to the public. This work was financially supported by Fundamental Research Funds for the Central Universities (JUSRP124005).

  • The authors declare that they have no conflict of interest.

  • [1]

    Raza G, Ali K, Mukhtar Z, Mansoor M, Arshad M, et al. 2010. The response of sugarcane (Sac-charum officinarum L.) genotypes to callus induction, regeneration and different concentrations of the selective agent (geneticin-418). African Journal of Biotechnology 9(51):8739−47

    Google Scholar

    [2]

    Hoang NV, Furtado A, Botha FC, Simmons BA, Henry RJ. 2015. Potential for genetic improvement of sugarcane as a source of biomass for biofuels. Frontiers in Bioengineering and Biotechnology 3:182

    doi: 10.3389/fbioe.2015.00182

    CrossRef   Google Scholar

    [3]

    Manickavasagam M, Ganapathi A, Anbazhagan VR, Sudhakar B, Selvaraj N, et al. 2004. Agrobacterium-mediated genetic transformation and development of herbicide-resistant sugarcane (Saccharum species hybrid) uzing axillary buds. Plant Cell Reports 23(3):134−43

    doi: 10.1007/s00299-004-0794-y

    CrossRef   Google Scholar

    [4]

    Suprasanna P, Patade VY, Desai NS, Devarumath RM, Kawar PG, et al. 2011. Biotechnological developments in sugarcane improvement: an overview. Sugar Tech 13(4):322−35

    doi: 10.1007/s12355-011-0103-3

    CrossRef   Google Scholar

    [5]

    Li YR, Yang LT. 2015. Sugarcane agriculture and sugar industry in China. Sugar Tech 17:1−8

    doi: 10.1007/s12355-014-0342-1

    CrossRef   Google Scholar

    [6]

    Parascanu MM, Sanchez N, Sandoval-Salas F, Carreto CM, Soreanu G, et al. 2021. Environmental and economic analysis of bioethanol production from sugarcane molasses and agave juice. Environmental Science and Pollution Research 28(45):64374−93

    doi: 10.1007/s11356-021-15471-4

    CrossRef   Google Scholar

    [7]

    Viswanathan R, Rao GP. 2011. Disease Scenario and Management of Major Sugarcane Diseases in India. Sugar Tech 13(4):336−353

    doi: 10.1007/s12355-011-0102-4

    CrossRef   Google Scholar

    [8]

    Srikanth K, Subramonian N, Premachandran MN. 2011. Advances in Transgenic Research for Insect Resistance in Sugarcane. Tropical Plant Biology 4(1):52−61

    doi: 10.1007/s12042-011-9077-2

    CrossRef   Google Scholar

    [9]

    Priji PJ, Hemaprabha G. 2015. Sugarcane specific drought responsive candidate genes belonging to ABA dependent pathway identified from basic species clones of Saccharum sp. and Erianthus sp. Sugar Tech 17(2):130−37

    doi: 10.1007/s12355-014-0313-6

    CrossRef   Google Scholar

    [10]

    Mahadevaiah C, Appunu C, Aitken K, Suresha GS, Vignesh P, et al. 2021. Genomic selection in sugarcane: Current Status and future prospects. Frontiers in Plant Science 12:708233

    doi: 10.3389/fpls.2021.708233

    CrossRef   Google Scholar

    [11]

    Bhat SR, Gill SS. 1985. The implications of 2n egg gametes in nobilization and breeding of sugarcane. Euphytica 34:377−84

    doi: 10.1007/BF00022932

    CrossRef   Google Scholar

    [12]

    Piperidis G, Piperidis N, D’Hont A. 2010. Molecular cytogenetic investigation of chromosome composition and transmission in sugarcane. Molecular Genetics and Genomics 284:65−73

    doi: 10.1007/s00438-010-0546-3

    CrossRef   Google Scholar

    [13]

    Grivet L, Arruda P. 2002. Sugarcane genomics: Depicting the complex genome of an important tropical crop. Current Opinion in Plant Biology 5:122−27

    doi: 10.1016/S1369-5266(02)00234-0

    CrossRef   Google Scholar

    [14]

    Lekshmi M, Pazhany AS, Sobhakumari VP, Premachandran MN. 2017. Nuclear and cytoplasmic contributions from Erianthus arundinaceus (Retz.) Jeswiet in a sugarcane hybrid clone confirmed through genomic in situ hybridization and cytoplasmic DNA polymorphism. Genetic Resoures and Crop Evolution 64:1553−60

    doi: 10.1007/s10722-016-0453-5

    CrossRef   Google Scholar

    [15]

    Zhang J, Zhang Q, Li L, Tang H, Zhang Q, et al. 2019. Recent polyploidization events in three Saccharum founding species. Plant Biotechnology Journal 17(1):264−74

    doi: 10.1111/pbi.12962

    CrossRef   Google Scholar

    [16]

    Dong H, Clark LV, Jin X, Anzoua K, Bagmet L, et al. 2021. Managing flowering time in Miscanthus and sugarcane to facilitate intra- and intergeneric crosses. PLoS One 16(1):e0240390

    doi: 10.1371/journal.pone.0240390

    CrossRef   Google Scholar

    [17]

    Verma KK, Song XP, Budeguer F, Nikpay A, Enrique R, et al. 2022. Genetic engineering: an efficient approach to mitigating biotic and abiotic stresses in sugarcane cultivation. Plant Signaling & Behavior 17(1):2108253

    doi: 10.1080/15592324.2022.2108253

    CrossRef   Google Scholar

    [18]

    Cheavegatti-Gianotto A, Gentile A, Oldemburgo DA, Merheb GDA, Sereno ML, et al. 2018. Lack of detection of Bt sugarcane Cry1Ab and NptII DNA and proteins in sugarcane processing products including raw sugar. Frontiers in Bioengineering and Biotechnology 6:24

    doi: 10.3389/fbioe.2018.00024

    CrossRef   Google Scholar

    [19]

    Iqbal A, Khan RS, Khan MA, Gul K, Jalil F, et al. 2021. Genetic Engineering Approaches for Enhanced Insect Pest Resistance in Sugarcane. Molecular Biotechnology 63:557−68

    doi: 10.1007/s12033-021-00328-5

    CrossRef   Google Scholar

    [20]

    Wang W, Yang B, Cai W, Feng C, Wang J, et al. 2015. Establishment of Mannose Selection System in Sugarcane Transformation. Biotechnology Bulletin 31(1):92−97

    doi: 10.13560/j.cnki.biotech.bull.1985.2015.01.014

    CrossRef   Google Scholar

    [21]

    Wang WZ, Yang BP, Feng CL, Wang JG, Xiong GR, et al. 2017. Efficient Sugarcane Transformation via bar Gene Selection. Tropical Plant Biology 10(2-3):77−85

    doi: 10.1007/s12042-017-9186-7

    CrossRef   Google Scholar

    [22]

    Belide S, Vanhercke T, Petrie JR, Singh SP. 2017. Robust genetic transformation of sorghum (Sorghum bicolor L.) using differentiating embryogenic callus induced from immature embryos. Plant Methods 13:109

    doi: 10.1186/s13007-017-0260-9

    CrossRef   Google Scholar

    [23]

    Ratjens S, Mortensen S, Kumpf A, bartsch M, Winkelmann T. 2018. Embryogenic callus as target for efficient transformation of Cyclamen persicum enabling gene function studies. Frontiers in Plant Science 9:1035

    doi: 10.3389/fpls.2018.01035

    CrossRef   Google Scholar

    [24]

    Song Y, Bai X, Dong S, Yang Y, Dong H, et al. 2020. Stable and efficient Agrobacterium-mediated genetic transformation of larch using embryogenic callus. Frontiers in Plant Science 11:584492

    doi: 10.3389/fpls.2020.584492

    CrossRef   Google Scholar

    [25]

    Rakshit S, Rashid Z, Sekhar JC, Fatma T, Dass S. 2010. Callus induction and whole plant regeneration in elite Indian maize (Zea mays L.) Inbreds. Plant Cell Tissue and Organ Culture 100:31−37

    doi: 10.1007/s11240-009-9613-z

    CrossRef   Google Scholar

    [26]

    Arvinth S, Arun S, Selvakesavan RK, Srikanth J, Mukunthan N, et al. 2010. Genetic transformation and pyramiding of aprotinin-expressing sugarcane with cry1Ab for shoot borer (Chilo infuscatellus) resistance. Plant Cell Reports 29(4):383−95

    doi: 10.1007/s00299-010-0829-5

    CrossRef   Google Scholar

    [27]

    Basnayake SWV, Moyle R, Birch RG. 2011. Embryogenic callus proliferation and regeneration conditions for genetic transformation of diverse sugarcane cultivars. Plant Cell Reports 30(3):439−48

    doi: 10.1007/s00299-010-0927-4

    CrossRef   Google Scholar

    [28]

    Zhu YJ, McCafferty H, Osterman G, Lim S, Agbayani R, et al. 2011. Genetic transformation with untranslatable coat protein gene of sugarcane yellow leaf virus reduces virus titers in sugarcane. Transgenic Research 20(3):503−12

    doi: 10.1007/s11248-010-9432-3

    CrossRef   Google Scholar

    [29]

    Rani K, Sandhu SK, Gosal SS. 2012. Genetic augmentation of sugarcane through direct gene transformation with Osgly II gene construct. Sugar Tech 14(3):229−36

    doi: 10.1007/s12355-012-0149-x

    CrossRef   Google Scholar

    [30]

    Xiong Y, Jung JH, Zeng QC, Gallo M, Altpeter F. 2013. Comparison of procedures for DNA coating of micro-carriers in the transient and stable biolistic transformation of sugarcane. Plant Cell 112(1):95−99

    doi: 10.1007/s11240-012-0208-8

    CrossRef   Google Scholar

    [31]

    Santosa DA, Hendroko R, Farouk A, Greiner R. 2004. A rapid and highly efficient method for transformation of sugarcane callus. Molecular Biotechnology 28(2):113−19

    doi: 10.1385/MB:28:2:113

    CrossRef   Google Scholar

    [32]

    Dong S, Delucca P, Geijskes RJ, Ke J, Mayo K, et al. 2014. Advances in agrobacterium-mediated sugarcane transformation and stable transgene expression. Sugar Tech 16(4):366−71

    doi: 10.1007/s12355-013-0294-x

    CrossRef   Google Scholar

    [33]

    Wang WZ, Yang BP, Feng XY, Cao ZY, Feng CL, et al. 2017. Development and characterization of transgenic sugarcane with insect resistance and herbicide tolerance. Frontiers in Plant Science 8:1535

    doi: 10.3389/fpls.2017.01535

    CrossRef   Google Scholar

    [34]

    Stachel SE, Messens E, Van Montagu M, Zambryski P. 1985. Identification of the signal molecules produced by wounded plant cells that activate T-DNA transfer in Agrobacterium tumefaciens. Nature 318:624−29

    doi: 10.1038/318624a0

    CrossRef   Google Scholar

    [35]

    Hiei Y, Ohta S, Komari T, Kumashiro Y. 1994. Efficient transformation of rice (Oryza zativa L.) mediated by Agrobacterium and sequence analysis of the boundaries of the T-DNA. The Plant Journal 6(2):271−82

    doi: 10.1046/j.1365-313X.1994.6020271.x

    CrossRef   Google Scholar

    [36]

    Ishida Y, Saito H, Ohta S, Hiei Y, Komari T, et al. 1996. High efficiency transformation of maize (Zea mays L.) mediated by Agrobacterium tumefaciens. Nature Biotechnology 14:745−50

    doi: 10.1038/nbt0696-745

    CrossRef   Google Scholar

    [37]

    Cheng M, Fry JE, Pang S, Zhou H, Hironaka CM, et al. 1997. Genetic transformation of wheat mediated by Agrobacterium tumefaciens. Plant Physiology 115:971−80

    doi: 10.1104/pp.115.3.971

    CrossRef   Google Scholar

    [38]

    Sivanandhan G, Kapil Dev G, Theboral J, Selvaraj N, Ganapathi A. 2015. Sonication, vacuum infiltration and thiol compounds enhance the Agrobacterium-mediated transformation frequency of Withania somnifera (L.) Dunal. PLoS One 10(4):e0124693

    doi: 10.1371/journal.pone.0124693

    CrossRef   Google Scholar

  • Cite this article

    Wang W, Wang J, Feng C, Zhao T, Shen L, et al. 2023. Establishment of an efficient transgenic selection system and its utilization in Saccharum officinarum. Tropical Plants 2:11 doi: 10.48130/TP-2023-0011
    Wang W, Wang J, Feng C, Zhao T, Shen L, et al. 2023. Establishment of an efficient transgenic selection system and its utilization in Saccharum officinarum. Tropical Plants 2:11 doi: 10.48130/TP-2023-0011

Figures(1)  /  Tables(1)

Article Metrics

Article views(4253) PDF downloads(933)

METHOD   Open Access    

Establishment of an efficient transgenic selection system and its utilization in Saccharum officinarum

Tropical Plants  2 Article number: 11  (2023)  |  Cite this article

Abstract: Transgenic strategy plays an important role in the biological study and breeding of sugarcane. However, the efficiency of sugarcane transgenic systems remains disappointing to breeders. Various cultivated varieties are recalcitrant to genetic transformation, and only a few sugarcane research institutes could successfully obtain positive transgenic lines. In our previous research, three kinds of sugarcane transgenic selection systems, namely, the PMI/Mannose, CP4-EPSPS/glyphosate, and bar/Basta selection systems, were successfully established. Among these systems, the bar/Basta selection system was the most efficient. By applying this selection system, 10 or more transgenic shoots could be obtained from a gram of embryogenic calluses. In addition, the resistant shoots obtained after screening were almost 100% positive for the molecular assay, and all of the transgenic shoots showed high herbicide tolerance in lab tests and field trials. Herein, the key points/steps, advantage and contribution to sugarcane studies and breeding in China of the efficient bar/Basta sugarcane transformation system are presented and discussed.

    • Sugarcane (Saccharum officinarum) is one of the most important economic crops in tropical and subtropical countries as it is the main raw material for sugar production. Brazil and India are the top two sugarcane producers among the more than 100 countries that grow sugarcane[1,2]. Sugarcane provides approximately 80% of the world’s sugar and more than 90% of the sugar in China[35]. Moreover, it has now become a raw material of bioethanol[6]. Sugarcane production is threatened by biotic and abiotic stresses[79]. Meanwhile, numerous other characteristics, such as cane yield and other agronomic traits, of commercial and cultivated sugarcane varieties need to be improved by sugarcane scientists to fully meet the needs of sugarcane farmers[10]. The cultivated varieties of sugarcane are the progenies of crosses among Saccharum officinarum, Saccharum spontaneum, Saccharum barberi, and Saccharum sinense[1114]. They are heterozygous aneuploid crops that contain numerous chromosomes (40–200), and the structure of their genomes is very complex[15]. However, sugarcane is photoperiod-sensitive, and numerous parent germplasms are difficult to cross; all of these factors complicate character improvement through traditional breeding strategies[16]. Genetic transformation is a convenient and effective strategy for the character improvement of cultivated varieties[17]. Brazil is the first and only country utilizing transgenic sugarcane varieties in field production[18]. In 2022–2023, Brazil planted almost 70,000 hectares of transgenic sugarcane, accounting for 89% of annual production. No other country apart from Brazil uses transgenic sugarcane varieties in field production primarily because transgenic sugarcane lines are difficult to obtain in the laboratory[19]. The primary technical difficulty is not easy to obtain high-quality embryogenic calluses from different varieties. The embryogenic calluses of sugarcane are the only explants that can be used for genetic transformation through Agrobacterium-mediated and particle bombardment methods. However, embryogenic calluses and the most suitable status for genetic transformation must be precisely identified. Furthermore, plant physiology and anatomy must be organically combined. Different varieties also need different recipes of callus induction media and different subculture protocols during callus induction. In brief, considerable practice and comparison, time, and resources are needed. In our previous research, three kinds of sugarcane genetic transformation selection systems, namely, the PMI/mannose selection system[20], bar/Basta selection system[21], and CP4-EPSPS/Roundup (unpublished) selection system, were successfully established by enhancing the quality of sugarcane embryogenic callus induction by using Agrobacterium-mediated genetic transformation and a precise transformation protocol. The bar/Basta selection system was the most efficient genetic transformation system for sugarcane. Herein, the key points/steps, advantage, and contribution in China of the efficient bar/Basta transgenic selection system are presented and discussed.

    • The embryogenic callus is an ideal material for transgenesis because of its stable proliferation; high regeneration rate; sensitivity to screening antibiotics and herbicides, such as kanamycin, hygromycin, and glufosinate ammonium; and tolerance to Agrobacterium tumefaciens[2224]. The low quality of embryogenic calluses induced from different sugarcane varieties is the first negative factor inducing the low efficiency of transformation. Exogenous auxin and cytokinin are necessary to induce cell differentiation and proliferation in in vitro cell culture, such as the embryogenic callus induction of maize[25]. Thus, media for the embryogenic callus induction of different cultivated sugarcane varieties need different exogenous auxin and cytokinin concentrations. For example, high-quality embryogenic calluses of the cultivated sugarcane varieties ROC22 can be obtained by alternately adding high and low 2,4-D concentrations and miniscule amounts of 6-BA to the in vitro culture medium. Sugarcane plants collected 3 months after planting and 2 months before harvesting are suggested to be the best original material for callus induction. The tops of shoots containing the immature leaf whorl must be used to initiate callus induction within 24 h after cutting from the plants (Fig. 1a). First, an immature leaf whorl is transected into thin sections then cultivated in medium with a high concentration (2 mg/L) of 2,4-D; the resulting explant dedifferentiates quickly within 14 d (Fig. 1b). Second, subcultivation is performed in a medium with a low concentration (1 mg/L) of 2,4-D. Tiny embryogenic calluses then form after another 14 d. Third, subcultivation is performed again in a medium containing a low concentration (1 mg/L) of 2,4-D and a very low concentration (0.1 mg/L) of 6-BA. Large and granular embryogenic calluses suitable for transformation form after the subcultivation period (Fig. 1c). The actual concentration of 2,4-D and 6-BA added to the subculture medium for different varieties of sugarcane is based on the status of the calluses growing on the last medium. If callus growth is slow and difficult, the added amount of 2,4-D is increased. If the callus is water-soaked, the concentration of 2,4-D is decreased. Cultivation for callus induction is preferably done in the dark at 28 °C.
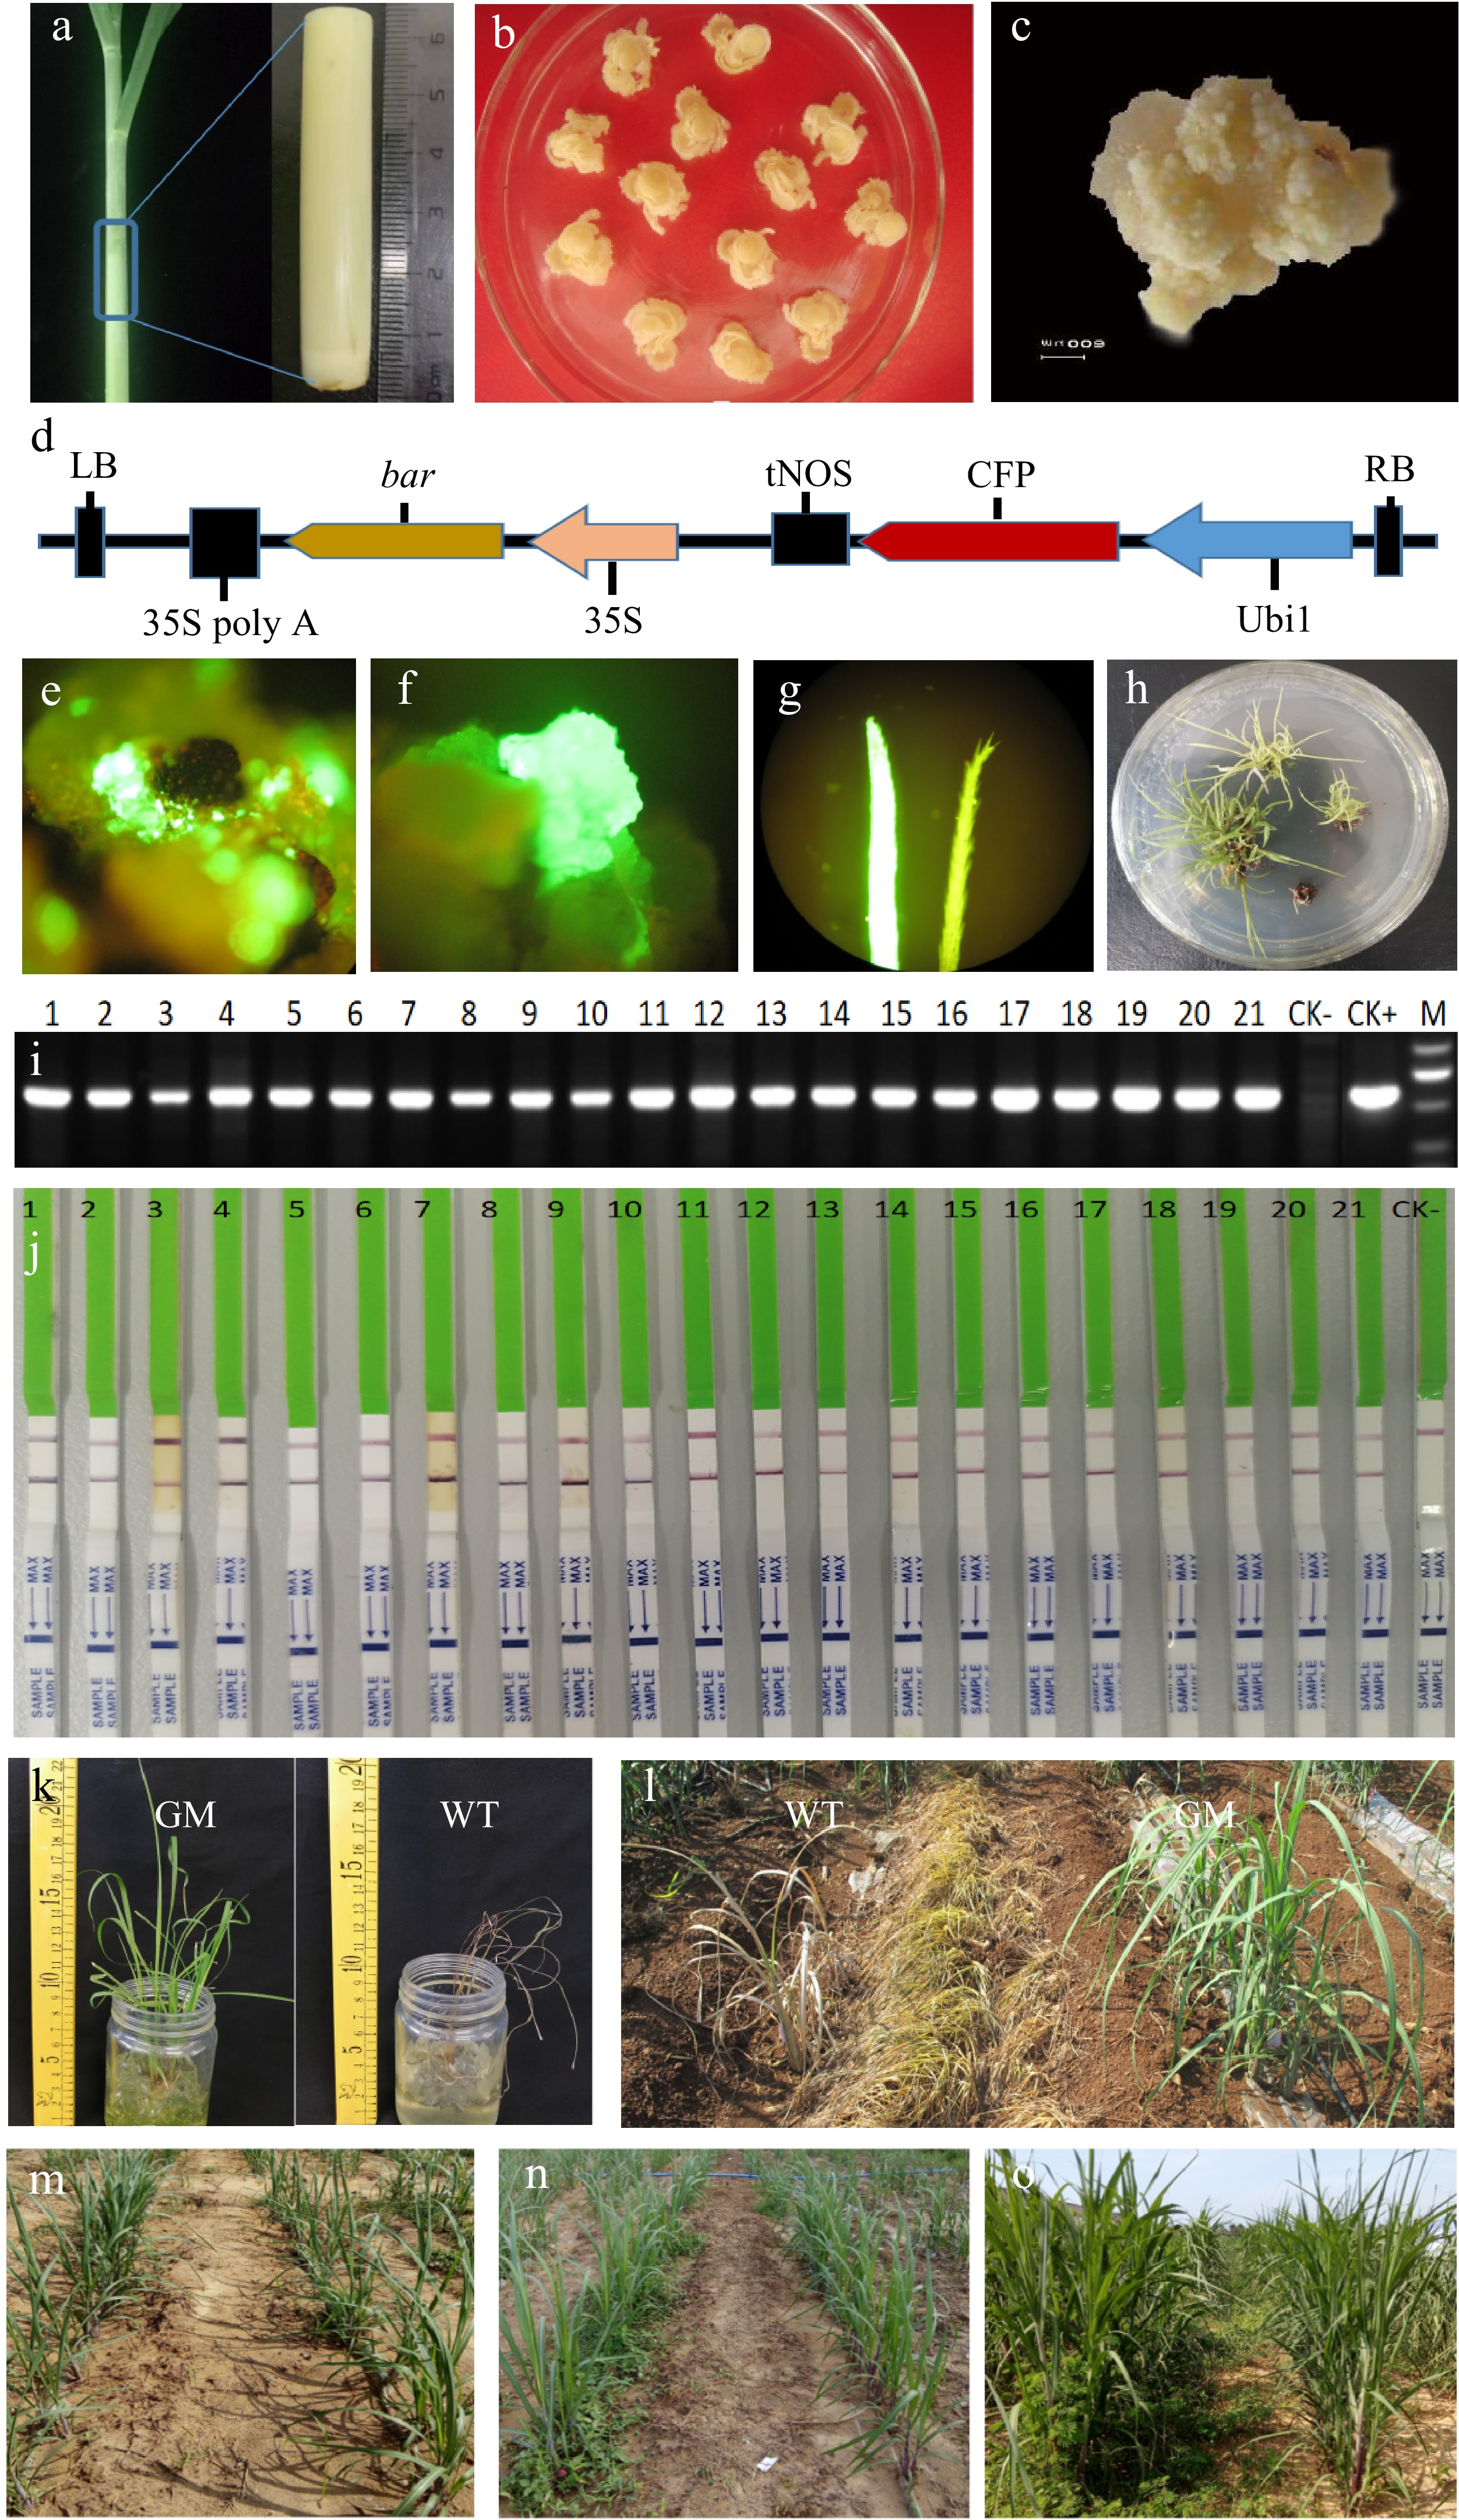
      Figure 1. 

      Efficient sugarcane transgenic system based on herbicide screening. (a) Original explant from sugarcane tillers for callus induction. (b) Two weeks after first induction through the addition of a high concentration (2 mg/L) of 2,4-D to the medium. (c) Two to three weeks after third induction through the addition of a low concentration (1 mg/L) of 2,4-D and a very low concentration (0.1 mg/L) of 6-BA to the medium. (d) Schematic of the pCAMBIA3300-CFP plant expression vector. RB: Right border of pCAMBIA3300; LB: Left border of pCAMBIA3300; Ubi1: maize Ubi 1 promoter; CFP: CFP visible marker gene; tNOS: nopaline synthase terminator; 35S: cauliflower mosaic virus 35S promoter; bar: bar selective marker gene; 35S poly A: cauliflower mosaic virus 35S poly A tail. (e) Fluorescence observation of infected calluses after 7 d of resting cultivation. (f) Fluorescence observation of resistant calluses after 30 d of callus screening. (g) Fluorescence observation of leaves after 14 d of regeneration, Left: leaf of transgenic shoot, Right: leaf of wild-type shoot. (h) Resistant shoots on the rooting medium. (i) Molecular assay for the bar selective marker gene by traditional PCR; CK−: nontransformation shoots; CK+: plant expression vector; and M: DNA marker ladder. (j) PAT/bar protein assay by QuickStix Strips; 1–21: Resistant shoots; CK−: nontransformation shoots. (k) Herbicide tolerance testing of transgenic shoots. GM: transgenic shoots (2.0 mg/mL Basta); WT: Wild-type shoots (0.5 mg/mL Basta). (l) Tenth day after herbicide spraying; GM: transgenic shoots; WT: Wild-type shoots. (m) First day after weed control in the field; Left: Weed control of wild-type shoots by hoeing; Right: Weed control of transgenic shoots by herbicide. (n) Two weeks after weed control in the field; Left: Weed control of wild-type shoots by hoeing; Right: Weed control of transgenic shoots by herbicide. (o) Two months after weed control; Left: Weed control of wild-type shoots by hoeing; Right: Weed control of transgenic shoots by herbicide.

    • Particle bombardment is the main approach used by existing sugarcane transformation studies[2630]. However, it has several disadvantages, including the low frequencies of positive shoots, high copy numbers of target genes, and instability of the gene construct in the receptor material[31]. Agrobacterium-mediated transformation has advantages over other gene-delivery technologies[32,33]. Our previous research showed that the Agrobacterium strains EHA105 and LBA4404 are suitable for sugarcane genetic transformation. The plant expression vector for vector construction must contain an expression cassette to provide the resistant protein of the selection agent for the positive screening of shoots from transformed calluses. The CaMV 35S promoter has been proven to be sufficiently strong to induce numerous selectable agents, such as the bar, CP-EPSPS, PMI, and NPTⅡ genes, in sugarcane transgenic systems. It can follow at least three other target expression cassettes on the vector aside from the selectable expression cassette, that is, the total integrated fragment could exceed 10 KB between left and right borders. The use of different promoters and terminators for each expression cassette is preferred to avoid vector recombination. The target expression cassettes could be overexpression or RNAi cassettes. Meanwhile, the use of a strong promoter, such as Ubi 1/actin/CaMV 35S, to induce the Cas9 gene and 2–3 u6 promoters to activate 2–3 sgRNA, is preferred for sugarcane editing strategies, such as the CRISPR/Cas9 system. In our previous research, the Agrobacterium strain EHA105 harboring the pCAMBIA3300 plant expression vector containing two expression cassettes was used for transformation to establish our efficient sugarcane transgenic system. One of the expression cassettes was a bar selective marker gene promoted by the CaMV 35S promoter and added with a CaMV 35S polyA tail at the 3ʹ site. The other expression cassette was the CFP visible marker gene promoted by the Ubi1 promoter and terminated with the tNOS terminator (Fig. 1d). The simple vector harboring the visible marker gene is helpful for establishing our efficient transgenic system.

    • A precise transformation protocol increases the infectivity of bacteria and causes receptor explants to absorb the infectious bacterial mixture sufficiently. This situation could increase the efficiency of genetic transformation significantly. Acetosyringone (AS) is a phenolic compound and can activate the vir gene in the plant expression vector, thus increasing the infectiousness of bacteria and the rate of transformation in monocots[3437]. Hence, it must be added steadily at a suitable working concentration throughout bacterial cultivation. Sonication and vacuum treatment could induce receptor explants to absorb the infectious bacterial mixture sufficiently and enhance Agrobacterium-mediated transformation efficiency[38]. Herein, the sugarcane genetic transformation protocol could be established by combining influencing factors. The precise transformation protocol of our lab is as follows: The Agrobacterium strain harboring the target plant expression vector was streaked on YEP medium containing the appropriate antibiotics and 100 µM AS and grown at 28 °C for 3 d. Then, a single colony was selected and recultured overnight in liquid YEP medium containing the appropriate antibiotics and 100 µM AS at 28 °C. Subsequently, bacteria were collected after centrifugation, resuspended in a starter culture (1/5 strength MS medium + 30 g/L sucrose + 30 g/L glucose + 100 µM AS) and vortexed at 90–100 rpm for 2 h at 28 °C in the dark. Then, the bacterial mixture was diluted to an optical density of approximately 0.3–0.6 at 600 nm. A high density of the bacterial mixture may enhance transformation efficiency but also may induce the high copy number integration of the target genes. A suitable amount of embryogenic calluses (3–5 g) was collected and air dried on a clean bench. Then, the air-dried embryogenic calluses were transferred to an Erlenmeyer flask, added with approximately 50 mL of the bacterial mixture, and shaken slowly at 90–100 rpm for 10 min at 28 °C in the dark. In addition, the embryogenic calluses and bacterial mixture were sonicated (180 W) for 2 min in an ultrasonic cleaner. Then, the bacterial mixture was pipetted out, and 50 mL of fresh bacterial mixture was added again. Subsequently, the embryogenic calluses and bacterial mixture were vacuumed (−0.08 MPa) for 5 min then shaken slowly at 90–00 rpm for another 10 min at 28 °C in the dark. Afterward, the bacterial mixture was pipetted out, and the embryogenic calluses were blotted dry to remove excess Agrobacterium suspension and air-dried for approximately 30 min on a clean bench by using filter paper. Next, the embryogenic calluses were transferred to a Petri dish, sealed with parafilm, then incubated for 3 d at 21 °C in the dark. All of the infected embryogenic calluses were transferred to a resting medium without selection stress and cultured for 7 d at 28 °C in the dark. Subsequently, all embryogenic calluses were transferred to a selection medium containing 2 mg/L Basta (glufosinate ammonium) and cultured for 30 d at 28 °C in the dark. All selected calluses were transferred to a regeneration medium and cultured for 14 d (30 °C and 14 h of light and 28 °C and 10 h of darkness daily). After regeneration, green buds were transferred to a rooting medium and cultured for 30 d under the same conditions. Meanwhile, CFP expression was observed after resting cultivation (Fig. 1e), selection cultivation (Fig. 1f), regeneration cultivation (Fig. 1g, h), and rooting cultivation to estimate transformation efficiency. After rooting cultivation, resistant shoots were sampled for molecular assays via traditional PCR detection (Fig. 1i) and PAT/bar protein detection by using QuickStix Strips (Fig. 1j). The transformation results presented in Table 1 show that on average, 11 transgenic shoots could be obtained from each gram of embryogenic calluses used for transformation. The results of the PCR and QuickStix Strip assays demonstrated that almost 100% of the resistant shoots were positive.

      Table 1.  Technical service using the efficient transgenic system.

      Name of
      vector/gene
      Calluses
      used (g)
      Transgenic shoots provided (lines)Target of genetic transformationStrategy of genetic modificationInstitutes servicedDate
      Cry2A217Pest-resistant genesOEHuazhong Agricultural University2017.5
      Cry1C220OE2017.5
      Hc-Pro220Functional gene of yje SCSMV virusOEYangzhou University2019.12
      ScD27220Tiller-associated genesOESugarcane Research Institute, Yunnan Academy of Agriculture Science2018.5
      ScD10225RNAi2019.6
      INV215Sucrose invertase geneOEInstitute of Nanfan & Seed Industry, Guangdong Academy of Science2021.10
      FUG215Haploidy induction geneGE2019.12
      SsWRKY1- OE215Drought resistance-associated genesOEYunnan Agricultural University2020.8
      SsWRKY1-RNAi220RNAi2020.8
      DREB212Drought resistance-associated genesOESouth Subtropical Crops Research Institute, Chinese Academy of Tropical Agriculture Science2020.9
      REMO214OE2020.9
      MYB8i215MYB transcription factorsRNAiFujian Agriculture and Forestry University2020.11
      MYB11i212RNAi2020.11
      ERF99213Ethylene-responsive factorsOE2020.11
      Z6345JAZ transcription factorsOE2021.9
      Z10350OE2021.9
      VSR380Vacuolar sorting receptorsOEYulin Normal University2022.6
      R1335Plant activator polypeptide receptorOE2022.10
      RK1330Ratoon stunting disease-responsive factorsRNAiSugarcane Research Institute, Guangxi Academy of Agriculture Science2022.10
      * OE: Target gene overexpression; RNAi: Target gene suppression by RNAi; GE: Gene mutation by genomic editing.
    • Transgenic shoots screened on the basis of the bar selective marker gene or CP4-EPSPS exhibit herbicide resistance. In our lab, the herbicide-resistant gene bar was used as the selectable marker gene in our transformation system. Resistant shoots were screened by adding herbicide (2 mg/L) to the culture media. The herbicide tolerance of the transgenic shoots was tested in the lab by exposing the shoots to different concentrations of Basta (Fig. 1k). The results showed that all transgenic shoots grew normally even when exposed 2.0 mg/mL Basta. By contrast, the wild-type shoots died when exposed to only 0.5 mg/mL Basta. Thus, the integration of the herbicide-resistant bar gene significantly improved the herbicide resistance of the transgenic shoots, and all of the transgenic shoots obtained by using our transformation system were herbicide-resistant.

    • Herbicide tolerance was also tested in the field. The results showed that on the third day after herbicide spraying (2.0 mg/mL Basta), no significant difference was found between genetically modified and wild-type shoots. However, on the sixth day after herbicide spraying, the leaves of the wild-type shoots were yellowing and shriveled. By contrast, the genetically modified shoots grew healthily in the field. On the tenth day after herbicide spraying, the wild-type shoots died entirely, whereas the genetically modified shoots grew normally throughout the testing period (Fig. 1l). Therefore, the result of field testing coincided with that of herbicide tolerance testing in the lab.

    • Sugarcane transgenic shoots planted in the field could be weed-controlled by using herbicide (200 g/L glufosinate ammonium, YONON Biosciences Co., Ltd., Zhejiang, China), whereas wild-type shoots planted in the field need to be weed-controlled by hoeing (Fig. 1m). The results showed that the weed control of wild-type plants by hoeing was unsustainable. Weeds regrew rapidly 2 weeks after being controlled by hoeing (Fig. 1n) and grew tall and surrounded cane plantlets heavily 2 months later (Fig. 1o). Meanwhile, transgenic shoots were weed-controlled sustainably by using herbicide. Therefore, weed control by herbicide saves labor and costs.

    • Most of the sugarcane breeding institutes of China could not produce any positive transgenic sugarcane shoots, and a few institutes could produce some positive transgenic sugarcane shoots albeit at very low frequencies. After we successfully established the efficient sugarcane genetic transformation system in our lab, we produced numerous transgenic shoots and provided them to almost all of the sugarcane breeding institutes in China through technical services (Table 1). Hence, our system provides a great contribution to molecular breeding and molecular biology research in China. Some gene delivery approaches aim at the character improvement of cultivated varieties, and most aim at the functional study of endogenous and exogenous genes.

    • The bar/Basta selection system was established in our laboratory by using the Agrobacterium-mediated genetic transformation method and a precise transformation protocol. It was proven to be an efficient genetic transformation system that enhanced the quality of induced sugarcane embryogenic calluses. Statistical analysis revealed that 10 or more transgenic shoots could be obtained from each gram of transformed embryogenic calluses used for transformation. In addition, resistant shoots 10 cm in height were obtained approximately 4 months from the initiation of the transformation. Screening revealed that the resistant shoots were almost 100% positive in the molecular assay. All transgenic shoots produced by our transformation system were herbicide-resistant and could be weed-controlled in field trials by using Basta (glufosinate ammonium) herbicide. We are working on the PMI/Mannose[20] and CP4-EPSPS/Roundup (unpublished) systems in our lab in addition to the efficient bar/Basta selection system. Transgenic shoots screened by the CP4-EPSPS/Roundup system are tolerant to Roundup (41% glyphosate), which is cheaper than Basta (20% glufosinate). Thus, the CP4-EPSPS/Roundup system has broad application prospects. By contrast, the released GM sugarcane lines from Brazil, namely, CTB141175/01-A, CTC91087-6, and CTC93209-4, were screened by the NPTII/ G418 and bar/Basta selection systems, and those from Indonesia, namely, NXI-1T, NXI-4T, and NXI-6T, were screened by using the NPTII/G418 and hpt/hygromycin-B selection systems. Therefore, our sugarcane transgenic system is the most advanced in the field. The other results (unpublished) of our research group also showed that our efficient sugarcane transgenic system was effective for ROC22, LC05-136, and GT42, which are the top three cultivated varieties in China. Our system also worked for S. spontaneum, which is an original parent of sugarcane. Thus, it may be effective for all sugarcane germplasms if high-quality embryogenic calluses could be induced. Numerous genome-edited sugarcane lines have also been created by combining genome-editing elements in plant expression vectors and delivering them to the genome by using our genetic transformation system. We produced numerous transgenic shoots of different research targets by using our transformation system and provided them to almost all sugarcane breeding institutes in China through technical services. Therefore, the establishment of our efficient sugarcane genetic transformation system has made a great contribution to the biological study and breeding of sugarcane in China.

      • This work was supported by Hainan Yazhou Bay Seed Lab (JBGS+B21HJ0302), National Key Research and Development Program of China (2018YFD1000503) and Chinese Agriculture Research System (CARS-170301).

      • The authors declare that they have no conflict of interest.

      • Received 6 December 2022; Accepted 9 June 2023; Published online 19 July 2023

      • Copyright: © 2023 by the author(s). Published by Maximum Academic Press on behalf of Hainan University. This article is an open access article distributed under Creative Commons Attribution License (CC BY 4.0), visit https://creativecommons.org/licenses/by/4.0/.
    Figure (1)  Table (1) References (38)
  • About this article
    Cite this article
    Wang W, Wang J, Feng C, Zhao T, Shen L, et al. 2023. Establishment of an efficient transgenic selection system and its utilization in Saccharum officinarum. Tropical Plants 2:11 doi: 10.48130/TP-2023-0011
    Wang W, Wang J, Feng C, Zhao T, Shen L, et al. 2023. Establishment of an efficient transgenic selection system and its utilization in Saccharum officinarum. Tropical Plants 2:11 doi: 10.48130/TP-2023-0011

Catalog

  • About this article

/

DownLoad:  Full-Size Img  PowerPoint
Return
Return