-
Trees from family Dipterocarpaceae serve an important ecosystem function in the rainforest community of Asian tropical forests, where 20%−50% of the canopy layer belong to this family[1]. With high-quality timber that has a high economic value, dipterocarp forests also form a major pillar of the global tropical timber trade[2]. Due to long-term over-harvesting and land use change, tropical rainforests have become severely fragmented, and a large number of dipterocarps are today listed as endangered species and are at risk of extinction[3]. As a result, ecosystem services of Asian tropical rainforests in which dipterocarps are the dominant species have been seriously impaired[4]. Therefore, conservation genetics studies focusing on Dipterocarpaceae are urgently needed[1].
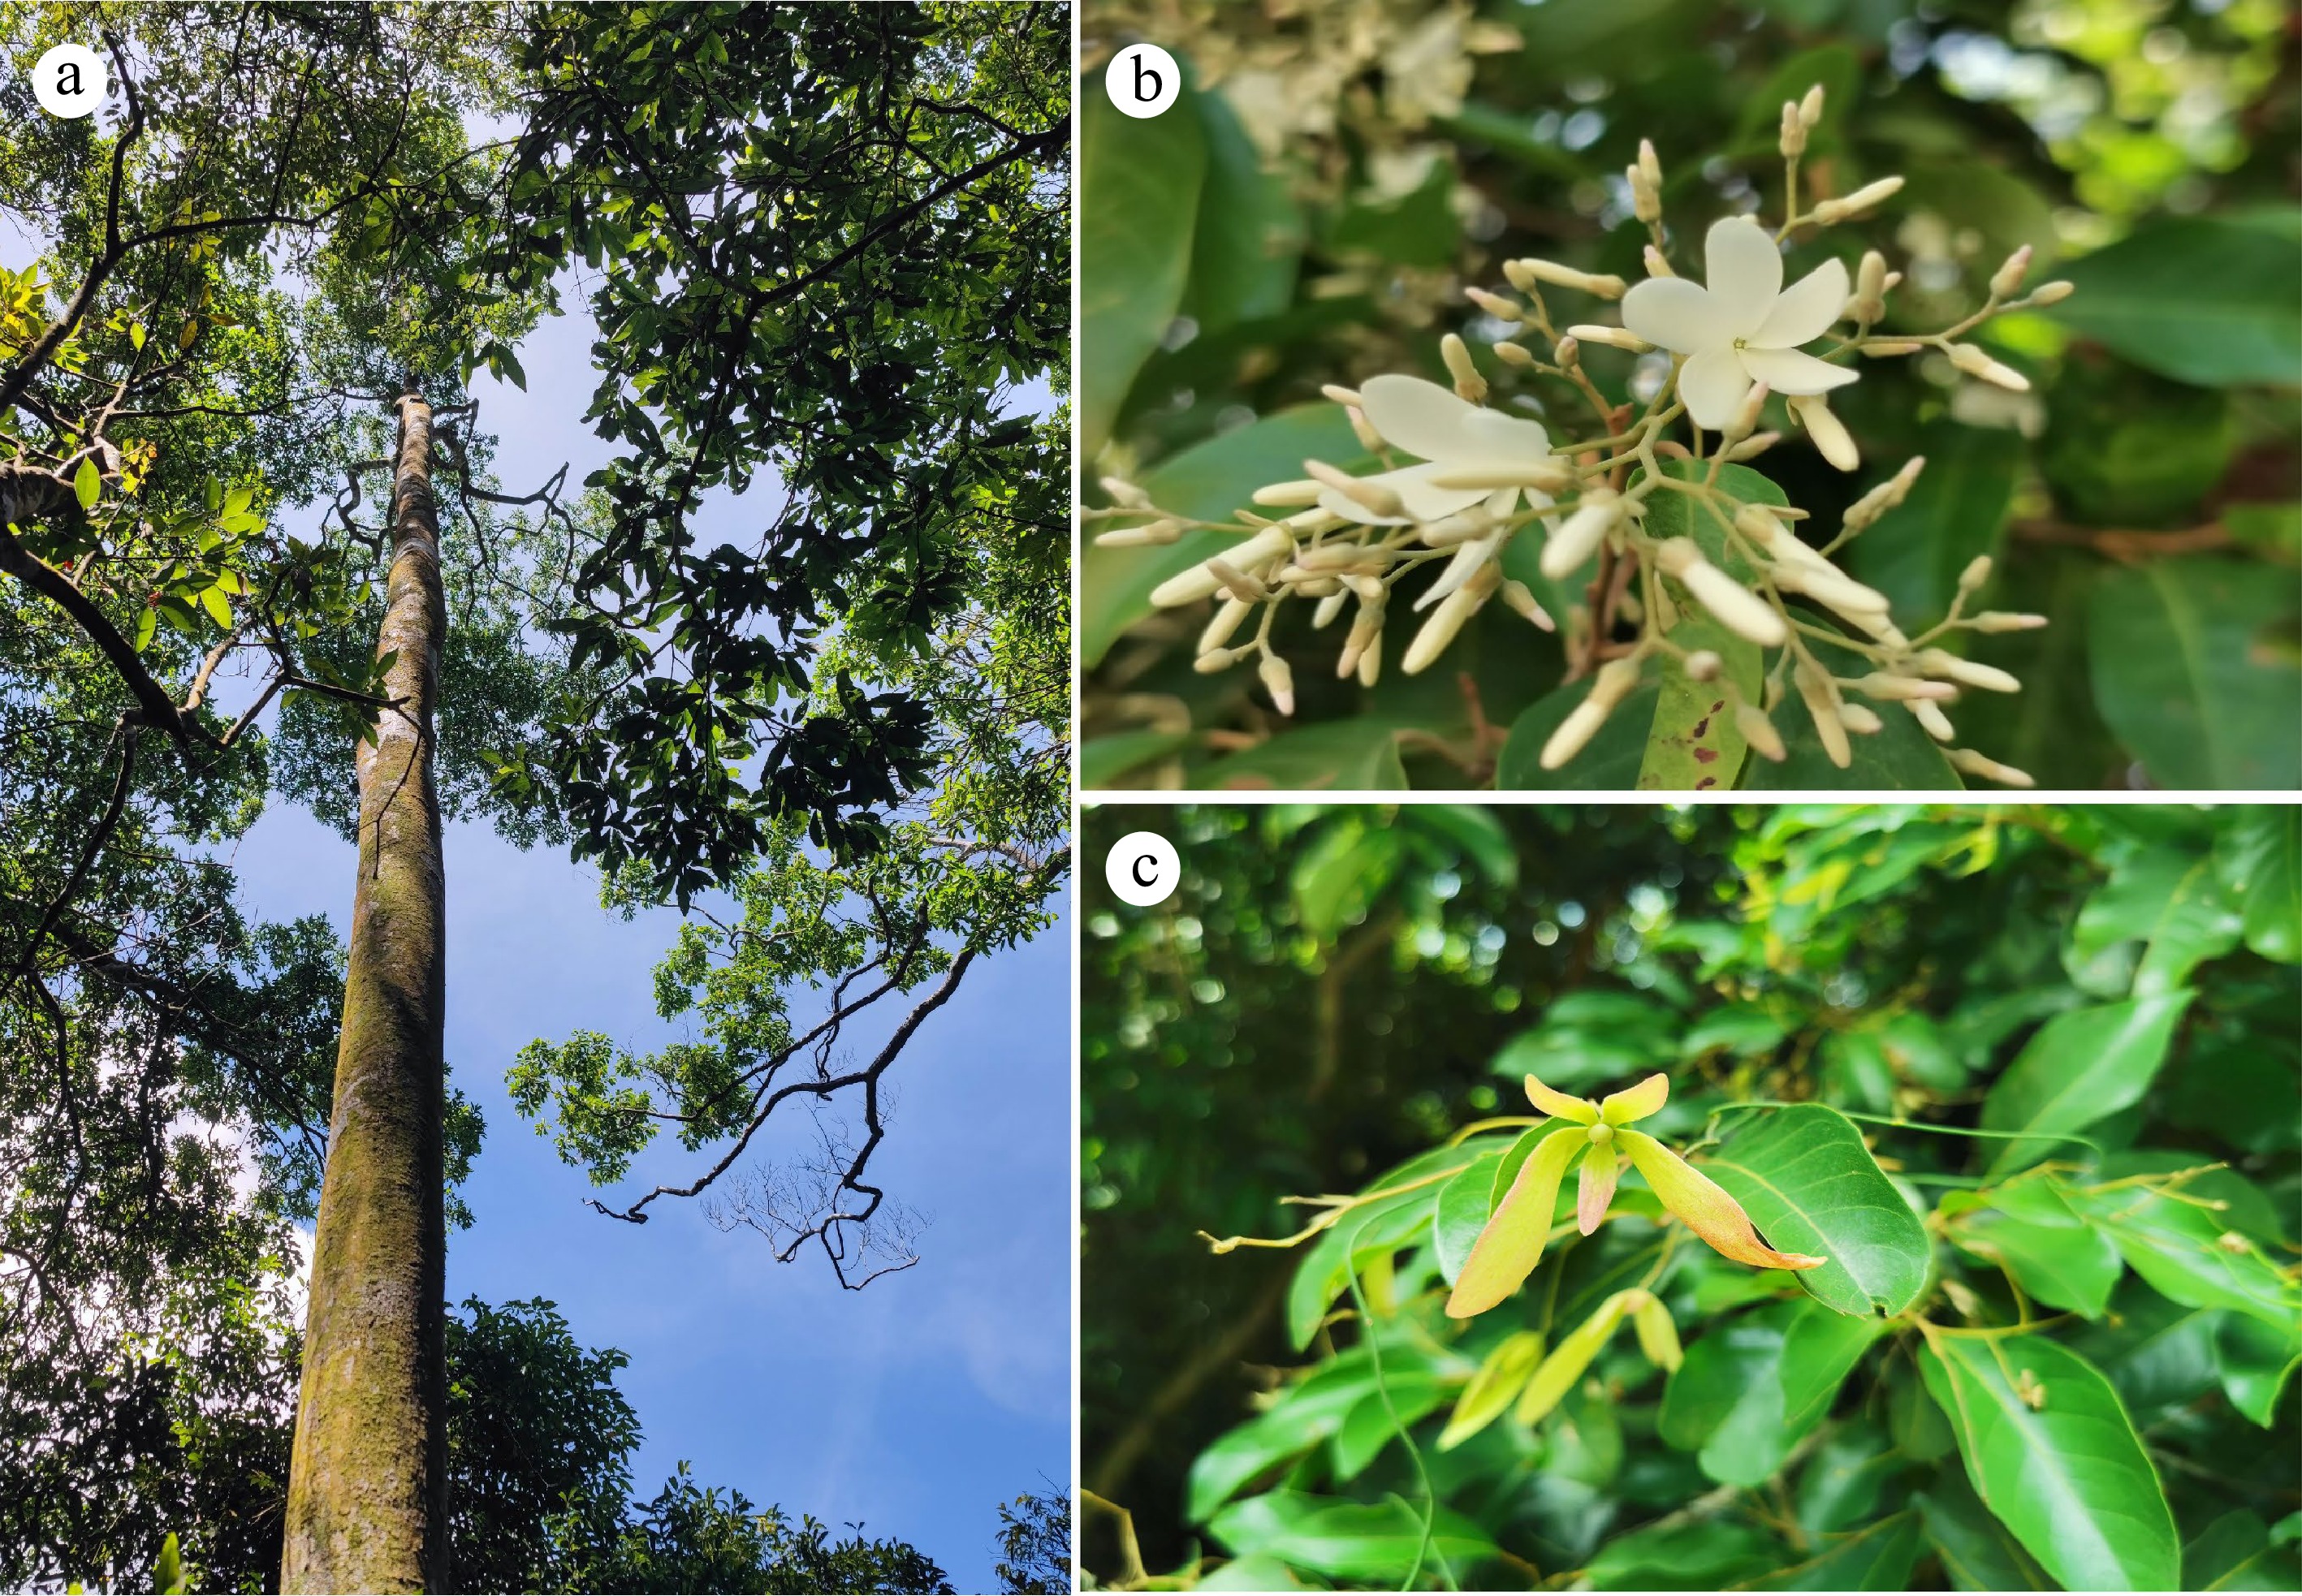
The tropical forests in Hainan Island, China are located at the northern edge of tropical Asia and are distinct from the typical tropical rainforests of Southeast Asia in terms of species composition, community structure and appearance as a consequence of the influence of the Asian monsoon[5]. Only three species of Dipterocarpaceae, Hopea hainanensis Merrill & Chun, H. reticulata Tardieu and Vatica mangachapoi Blanco can be found on this island. Although the species diversity of Dipterocarpaceae in Hainan Island has been greatly reduced as compared to that in Southeast Asia, the three species, especially V. mangachapoi (Fig. 1), play a key role in community assembly and ecosystem functioning of the lowland rainforests of this island[5−7]. It is remarkable that V. mangachapoi has developed into a continuously distributed coastal forest growing on sand substrate with 25 kilometers-long and 400 to 500 meters-wide at Shimei Bay, Wanning City (China), which is estimated to be at least 4000 years old[8, 9]. A study showed that soil moisture and organic matters of the sand substrate are much lower than those of normal tropical soils[10]. The formation of the coastal V. mangachapoi-dominated forest on barren and harsh sandy beach is unique and rare in itself, which could serve as an example to study the underlying physiological and genetical adaptation of V. mangachapoi to arid and poor substrate. In recent years, due to such factors as coastal development and village expansion, the area of the coastal V. mangachapoi-dominated forest in Shimei Bay has been reduced, and the formerly intact population has fragmented into several isolated patches. Coupled with the presence of forest gaps and fungal disease caused by human interference, the survival of the coastal V. mangachapoi is seriously threatened[9, 11, 12]. Conservation management is thus needed to protect this unique coastal forest dominated by V. mangachapoi.
Habitat fragmentation can cause an intact population into small, isolated patches, with reduced gene flow between patches and increased genetic drift and inbreeding within patches[13−16]. If seed dispersal is limited and restricted within patches, genotypes are likely to be spatially clustered, producing a strong fine-scale spatial genetic structure (FSGS)[17, 18]. Vatica magachapoi has winged fruits, which may promote seed dispersal by wind. Studies indeed showed that the dispersal distance of winged fruits are generally further than non-winged fruits in dipterocarps[19, 20]. On the other hand, the strength of FSGS was also affected by pollen dispersal. Dipterocarps that are pollinated by large insects, such as bees, can achieve longer distance of pollen flow than those pollinated by small insects, such as thrips, because large pollinators can move further than small ones[21, 22]. The limited seed and pollen dispersal were confirmed as the main reason for significant FSGS of most dipterocarps in fragmented habitats[23−26]. Is there a significant FSGS in the coastal forest of V. mangachapoi? Is genetic diversity lower in the coastal V. mangachapoi populations than the undisturbed rainforest populations nearby? Does significant genetic differentiation occur between patches of the coastal V. mangachapoi forest? These questions are important for the conservation and management of the unique coastal dipterocarp forest but remain to be resolved.
To answer the above questions, two coastal populations of V. mangachapoi (SM and RY) were sampled, and one population in the lowland rainforest near the coast (TT) were further collected for comparison. Genetic diversity, structure and population differentiation were assessed for the three V. mangachapoi populations using 12 SSR markers. Gene flow was estimated to test whether habitat fragmentation interrupted genetic exchange between them or not. Finally, FSGS were analyzed using the SM population to show whether significant spatial genetic structure has occurred within patches. Answering these questions could shed light on the conservation and continued survival of this unique coastal V. mangachapoi-dominated forest.
-
The study area is located in the Provincial Nature Reserve of V. mangachapoi, Wanning City, Hainan Province (China). Two V. mangachapoi populations (SM and RY) in the coastal forest separated by villages, roads and human facilities, and one population (TT) in the lowland rainforest near the coast were selected (Table 1, Fig. 2). In total, 188 V. mangachapoi trees individually spaced out more than 25 m apart and with DBH > 5 cm were sampled. Mature leaves lacking disease spots were selected, dried by silica gel and then were stored in a −20 °C refrigerator. The voucher specimens of V. mangachapoi were kept in Hainan University (Hainan, China).
Table 1. Genetic diversity indices of the three V. mangachapoi populations based on 12 SSR markers.
Population Location N Na Ne Ho He Fis SM 110.26691° E, 18.66671° N 91 8 3.647 0.547 0.690 0.207 RY 110.17952° E, 18.59768° N 39 7 3.704 0.605 0.700 0.142 TT 110.24941° E, 18.67744° N 58 7.5 3.694 0.566 0.692 0.167 Average 7.5 3.682 0.572 0.694 0.172 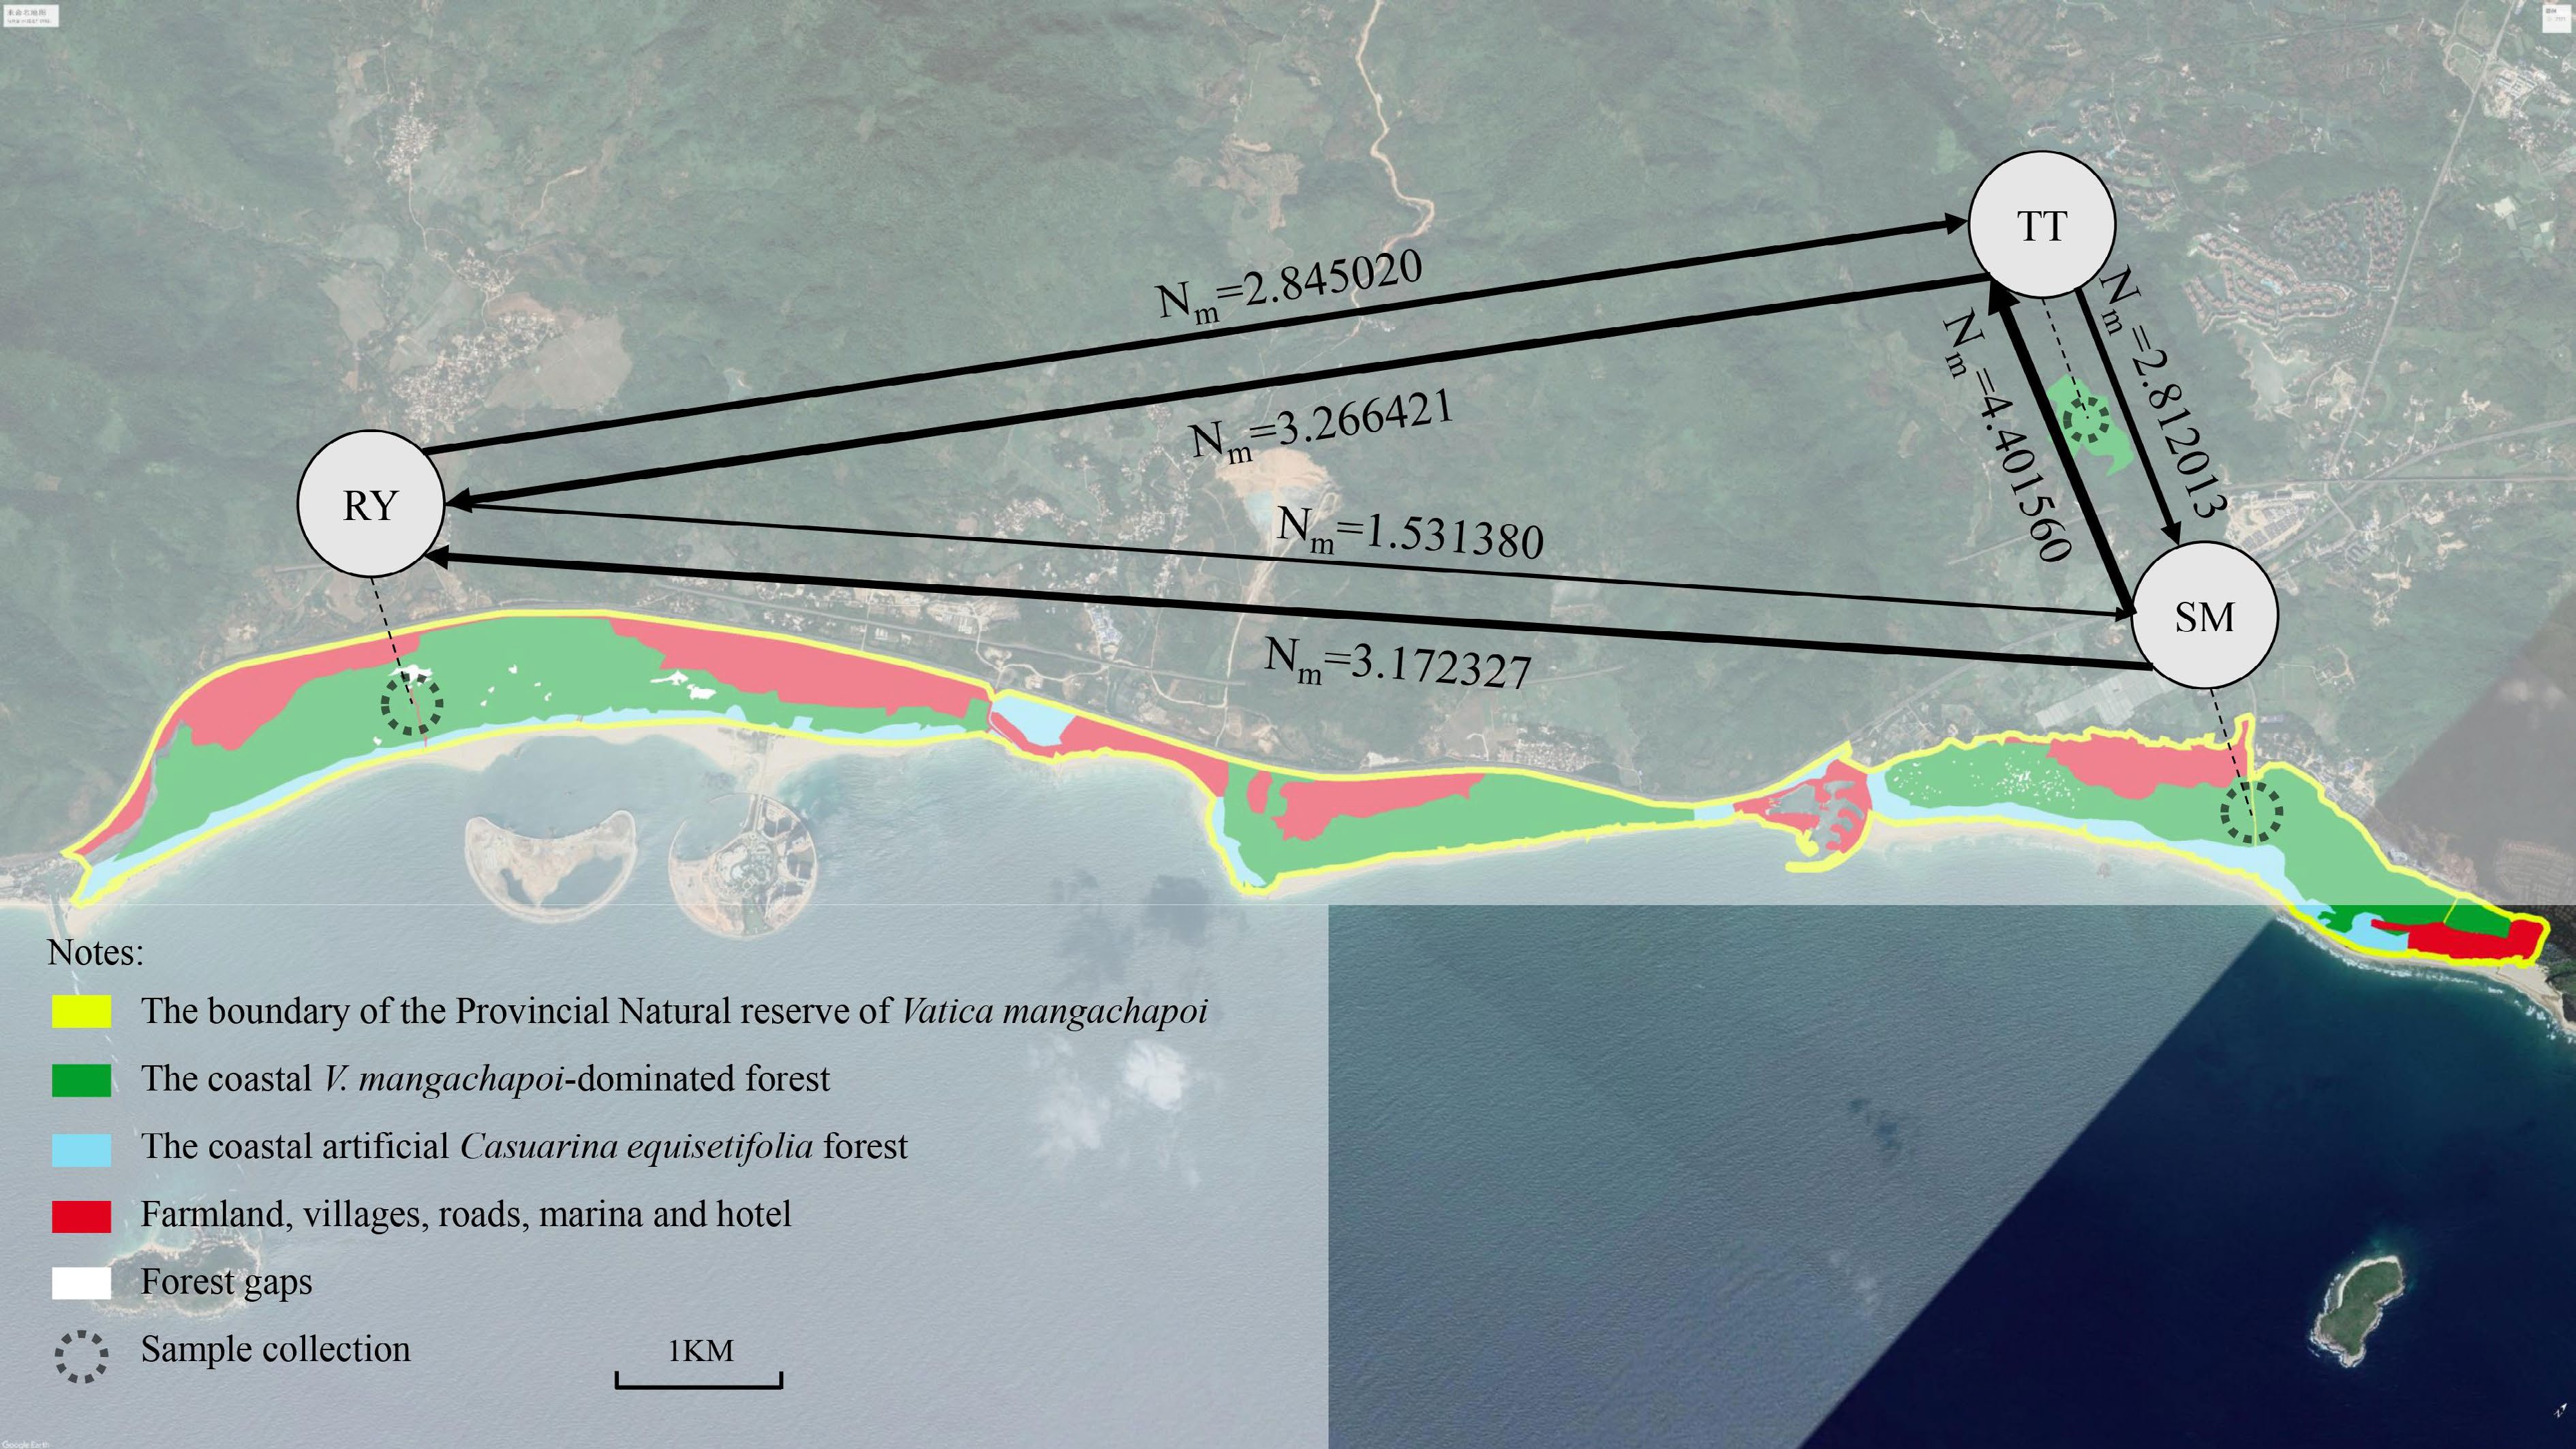
Figure 2.
Geographic distribution of the coastal V. mangachapoi-dominated forest and the locations of the three sampled V. mangachapoi populations. Gene flow among them was estimated, with the width of lines being proportional to the intensity of gene flow.
Genomic DNA extraction, PCR amplification and SSR genotyping
-
A modified CTAB method[27] was used to extract the genomic DNA of V. mangachapoi. Twelve pairs of polymorphic SSR primers developed by Guo et al.[28] were used in this study. PCR amplification were performed in a total volume of 10 μL, containing 1.0 μL of genomic DNA (around 50 ng), 5.0 μL of Taq PCR Master Mix (GeneTech), 0.5 μL of forward and reverse primers, and 3.0 μL of ddH2O. Amplification was carried out as follows: pre-denaturation at 95 °C for 5 min, followed by 35 cycles of denaturation at 95 °C for 20 s, annealing at 52−62 °C for 15 s, extension at 72 °C for 30 s, and finally extension at 72 °C for 7 min. PCR products were separated by capillary electrophoresis using ABI3730xl (Applied Biosystem) and SSR genotypes were analyzed by the GeneMarker software.
Data analysis
-
Population genetic parameters, including number of alleles (Na), effective number of alleles (Ne), observed heterozygosity (Ho), expected heterozygosity (He), inbreeding coefficient (Fis) and genetic differentiation among populations (
$ {F}_{\mathrm{s}\mathrm{t}} $ Bayesian clustering analysis was performed using Structure 2.3.4[34]. The values of K were set from 1 to 10, and for each value of K, 10 independent replicates were run with 100,000 burn-in iterations followed by 200,000 MCMC (Markov chain Monte Carlo) iterations. The best K was determined according to the delta K of STRUCTURE Harvester[35]. The results of the 10 replicates were combined by the Greedy algorithm implemented in Clumpp1.1.2[36], and the result of individual clustering were drawn using Distruct1.1[37]. NJ trees were constructed using MEGA 11.0[38] based on Nei & Chessers[30] genetic distances. Principal co-ordinate analysis (PCoA) was performed with GenAlex 6.51.
The effective population size (θ) of the three V. mangachapoi populations and the migration rate (M) between them were calculated using MIGRATE[39], a software based on the coalescent theory and Bayesian inference to estimate values of parameters of a user-specified population model. MIGRATE analyses were run under a Brownian motion model, and four heat chains with different temperatures of 1.0, 1.5, 3.0 and 1.0 × 10⁵ were simulated. Gene flow was calculated according to the equation Nm = θ*M/x. For SSR markers, x was set to 4. Three independent replications were run to ensure the convergence of the Markov chain Monte Carlo methods implemented in MIGRATE.
The fine-scale spatial genetic structure (FSGS) within-population was assessed using SPAGeDi 1.5[40]. The kinship coefficients (Fij, kinship coefficients) between any two individuals were calculated and regressed against the natural logarithm of the spatial distance to obtain the regression slope bF[41]. We divided the distance between any pair of individuals sampled from the SM population into 10 distance classes (35, 50, 75, 100, 150, 300, 500, 700, 850, 1,100 m), with at least 30 pairs of individuals per distance class[42, 43].
The 95% confidence intervals of Fij were calculated from 9,999 permutations of spatial distance among pairs of adults for 10 distance classes. If the Fij was higher than the upper bound of the 95% confidence interval, there is significant spatial genetic structure in population and a high level of genetic similarity among individuals; if the Fij fell within the 95% confidence interval, there is no spatial genetic structure in population and individuals were considered to be spatially randomly distributed; if the Fij was less than the lower bound of the 95% confidence interval, individuals were considered to be uniformly distributed in space without spatial genetic structure. The value of the Sp statistic reflects the strength of FSGS and is defined as Sp = -bF / (1-F(1) ), where bF is the regression slope, and F(1) is the mean pairwise kinship coefficient of the first distance class.
-
There is no significant difference in the level of genetic diversity between the coastal (SM and RY) and the rainforest (TT) populations (Table 1). The inbreeding coefficient was greater than 0, indicating inbreeding and an excess of homozygotes in the three V. mangachapoi populations. Totally 90 alleles were detected from the 12 SSR loci, and the number of alleles at a single locus ranged from 4.667 to 11.000, with an average of 7.500 alleles per locus. The observed and expected heterozygosity ranged from 0.303 to 0.769 and from 0.415 to 0.808, respectively. The primer sequences, range of allele sizes and genetic diversity indices of the 12 SSR loci are shown in Table 2.
Table 2. Primer sequences, allele size and genetic diversity indices of the 12 SSR markers.
Loci Primer sequences (5’-3’) Repeat
motifAllele size GenAlex PowerMarker Na Ne Ho He PIC VM1 F:GAACCCTTATTGGCCTGCCTAC (AT)11 166−184 7.333 4.231 0.740 0.763 0.7430 R:GGGACCAAATGACTTGAGTAATCT VM2 F:ACCCTAACAATTCTCTTTGTTTCCT (TAA)11 152−195 9.667 4.120 0.513 0.755 0.7364 R:CCCCAATCTCAGTAAGGACTCA VM3 F:CTTGTGTCGAGCATGCATGTAT (AT)11 175−191 8.333 4.857 0.761 0.793 0.7659 R:TGCTGGCCTTTTATGTTAGGGT VM4 F:ATAGCAGGCACTTCGGAAGTAC (TA)8 261−277 8.667 4.613 0.370 0.781 0.7533 R:CCTGAGAAACAAAGCAACGCAT VM5 F:GCACTAGCACTAGCACTAGCTT (CT)11 218−226 4.667 2.908 0.629 0.651 0.6026 R:GGCTTTTCCAATTTCCATGGCT VM6 F:AGTTAAGGGACCAAATTTAGCGT (TA)7 259−269 5.000 2.794 0.593 0.636 0.5902 R:GTGTTTGTCAACTGGGCTTCAA VM7 F:CCCATGTGCTAGGCTAATGCTA (AT)6 229−239 5.000 2.394 0.303 0.582 0.5409 R:AAATCAGCATGAAACTTCTCCATT VM8 F:CACCACCACAGGCTTGAGTATA (TA)7 168−182 5.667 1.722 0.374 0.415 0.4044 R:GAAGGCCAACTAATCAAGCTGC VM9 F:TCATTTCTGTCTCACTCGACCC (TTC)10 148−168 5.667 3.010 0.639 0.666 0.6097 R:TCATCGACGAATCACTGTTCGA VM10 F:ACGGATAAGTTAACGGACTAGACA (TA)10 215−227 9.333 4.713 0.568 0.776 0.7997 R:AGATTTTCCCCCAGTCATCGAC VM11 F:GCTGGCACTTAGGATGCCTTAA (ATT)11 138−150 11.000 3.564 0.610 0.702 0.6657 R:AGCAACCAATTAGCTCAAATCAA VM12 F:GGGCAGCCTCGTAAATCAATTAC (ATT)13 225−249 9.667 5.253 0.769 0.808 0.7958 R:ATTACCTGGCACAACCTTAGCC Genetic differentiation was weak among the three V. mangachapoi populations (Fst = 0.008~0.013). The result of AMOVA showed that 99% of genetic variation was partitioned within population, in line with little divergence among populations (Supplemental Table S1).
The Wilcoxon sign rank test found that the p-values were not significant under either the S.M.M or the T.P.M model for the three V. mangachapoi populations, and their allele frequency distributions were generally L-shaped (Fig. 3), indicating that the three populations have not experienced genetic bottlenecks recently.
Population genetic structure
-
STRUCTURE analysis found that delta K was maximized at K = 2, indicating two genetic clusters of the studied V. mangachapoi populations. The distribution of the two clusters did not differ significantly between the three populations, and this is also true for K = 3 or 5 (Fig. 4). Consistent with the results of STRUCTURE analyses, NJ tree (Supplemental Fig. S1) and PCoA analysis (Fig. 5) also suggest a homogeneous genetic structure of the three V. mangachapoi populations.
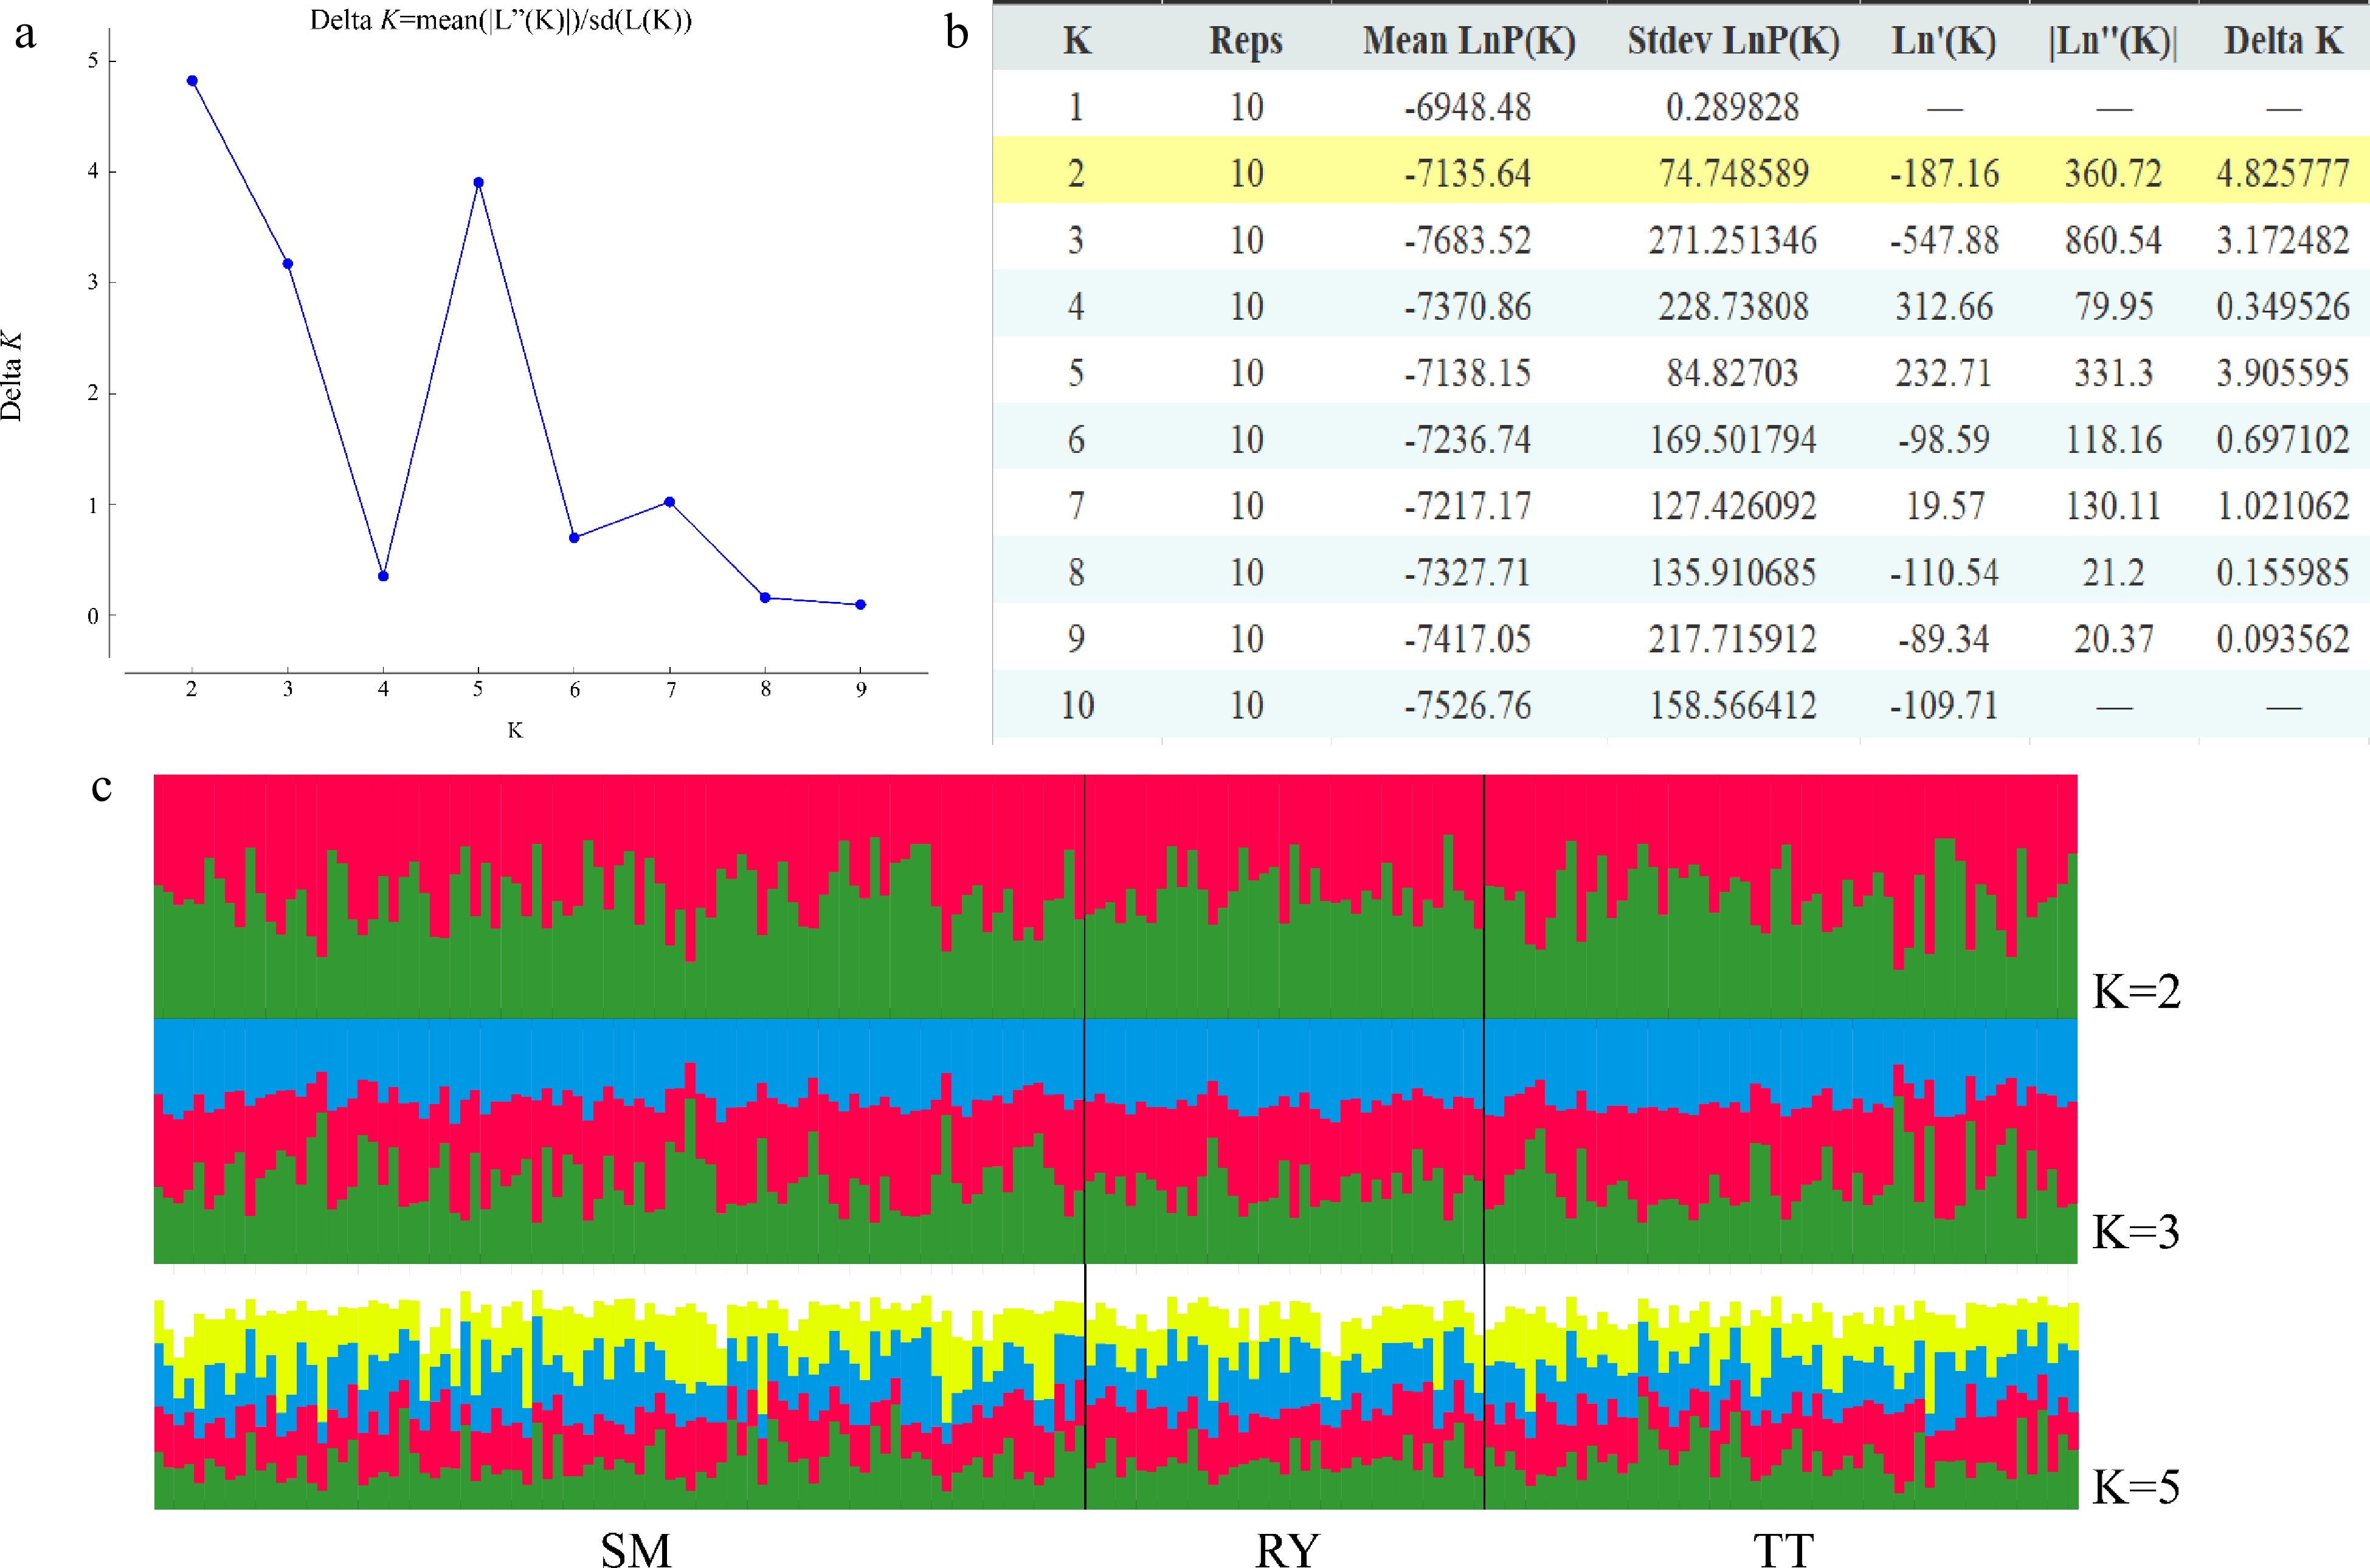
Figure 4.
Results of STRUCTURE analysis. (a) Best K determined using the delta K method. (b) Log probabilities and delta K values for K from two to ten. (c) The results of individual assignment at K = 2, 3 and 5. Each vertical bar represents an individual, and the proportion of the colors corresponds to the posterior probability of genetic clusters assigned to each individual.
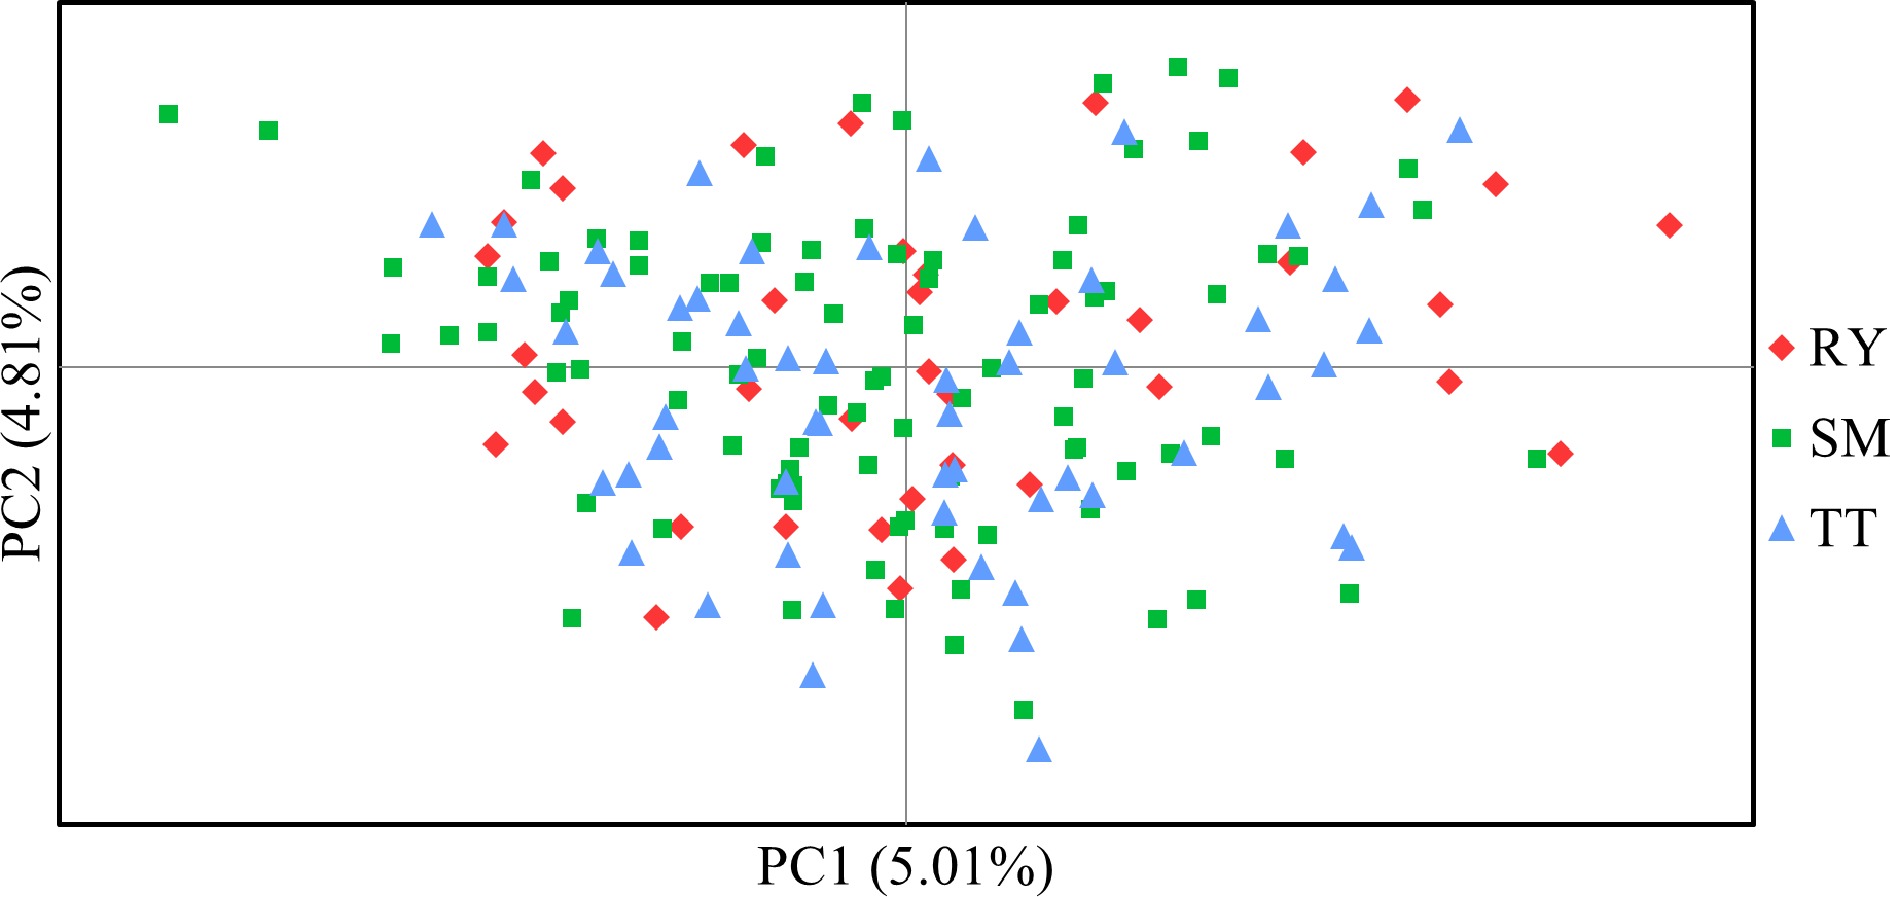
Figure 5.
Principal co-ordinate analysis (PCoA) based on Nei & Chessers[30] genetic distance among individual samples of V. mangachapoi.
Gene flow and effective population size
-
The effective population sizes of the three V. mangachapoi populations estimated by MIGRATE were similar, but the intensity of gene flow varied among them (Fig. 2, Table 3). The gene flows from RY to the other two populations were less than their reverse gene flows, however, the gene flows from SM to the other two populations were greater than their reverse gene flows. These results suggested that gene flows between the V. mangachapoi populations were asymmetric.
Table 3. Mutation-scaled migration rate, effective population size and gene flow estimated by program MIGRATE.
Direction of
gene flowMigration
rate (M)Effective population
size (θ)Gene flow (Nm) SM→RY 129.615 θSM = 0.09790 3.172327 SM→TT 179.839 4.401560 RY→SM 63.241 θRY = 0.09686 1.531380 RY→TT 117.490 2.845020 TT→SM 115.412 θTT = 0.09746 2.812013 TT→RY 134.062 3.266421 Fine-scale spatial genetic structure
-
No spatial genetic structure was detected at any of the 10 distance classes in the SM population (Fig. 6). The values of Fij were less than zero over multiple distance classes, indicating that individual trees of V. mangachapoi were spatially uniformly distributed. Based on the mean affinity (F(1)) for the first distance class (0.0151) and the regression slope bF (−0.004605), the strength of FSGS (Sp) was derived as 0.004675 for the V. mangachapoi population in Shimei Bay.
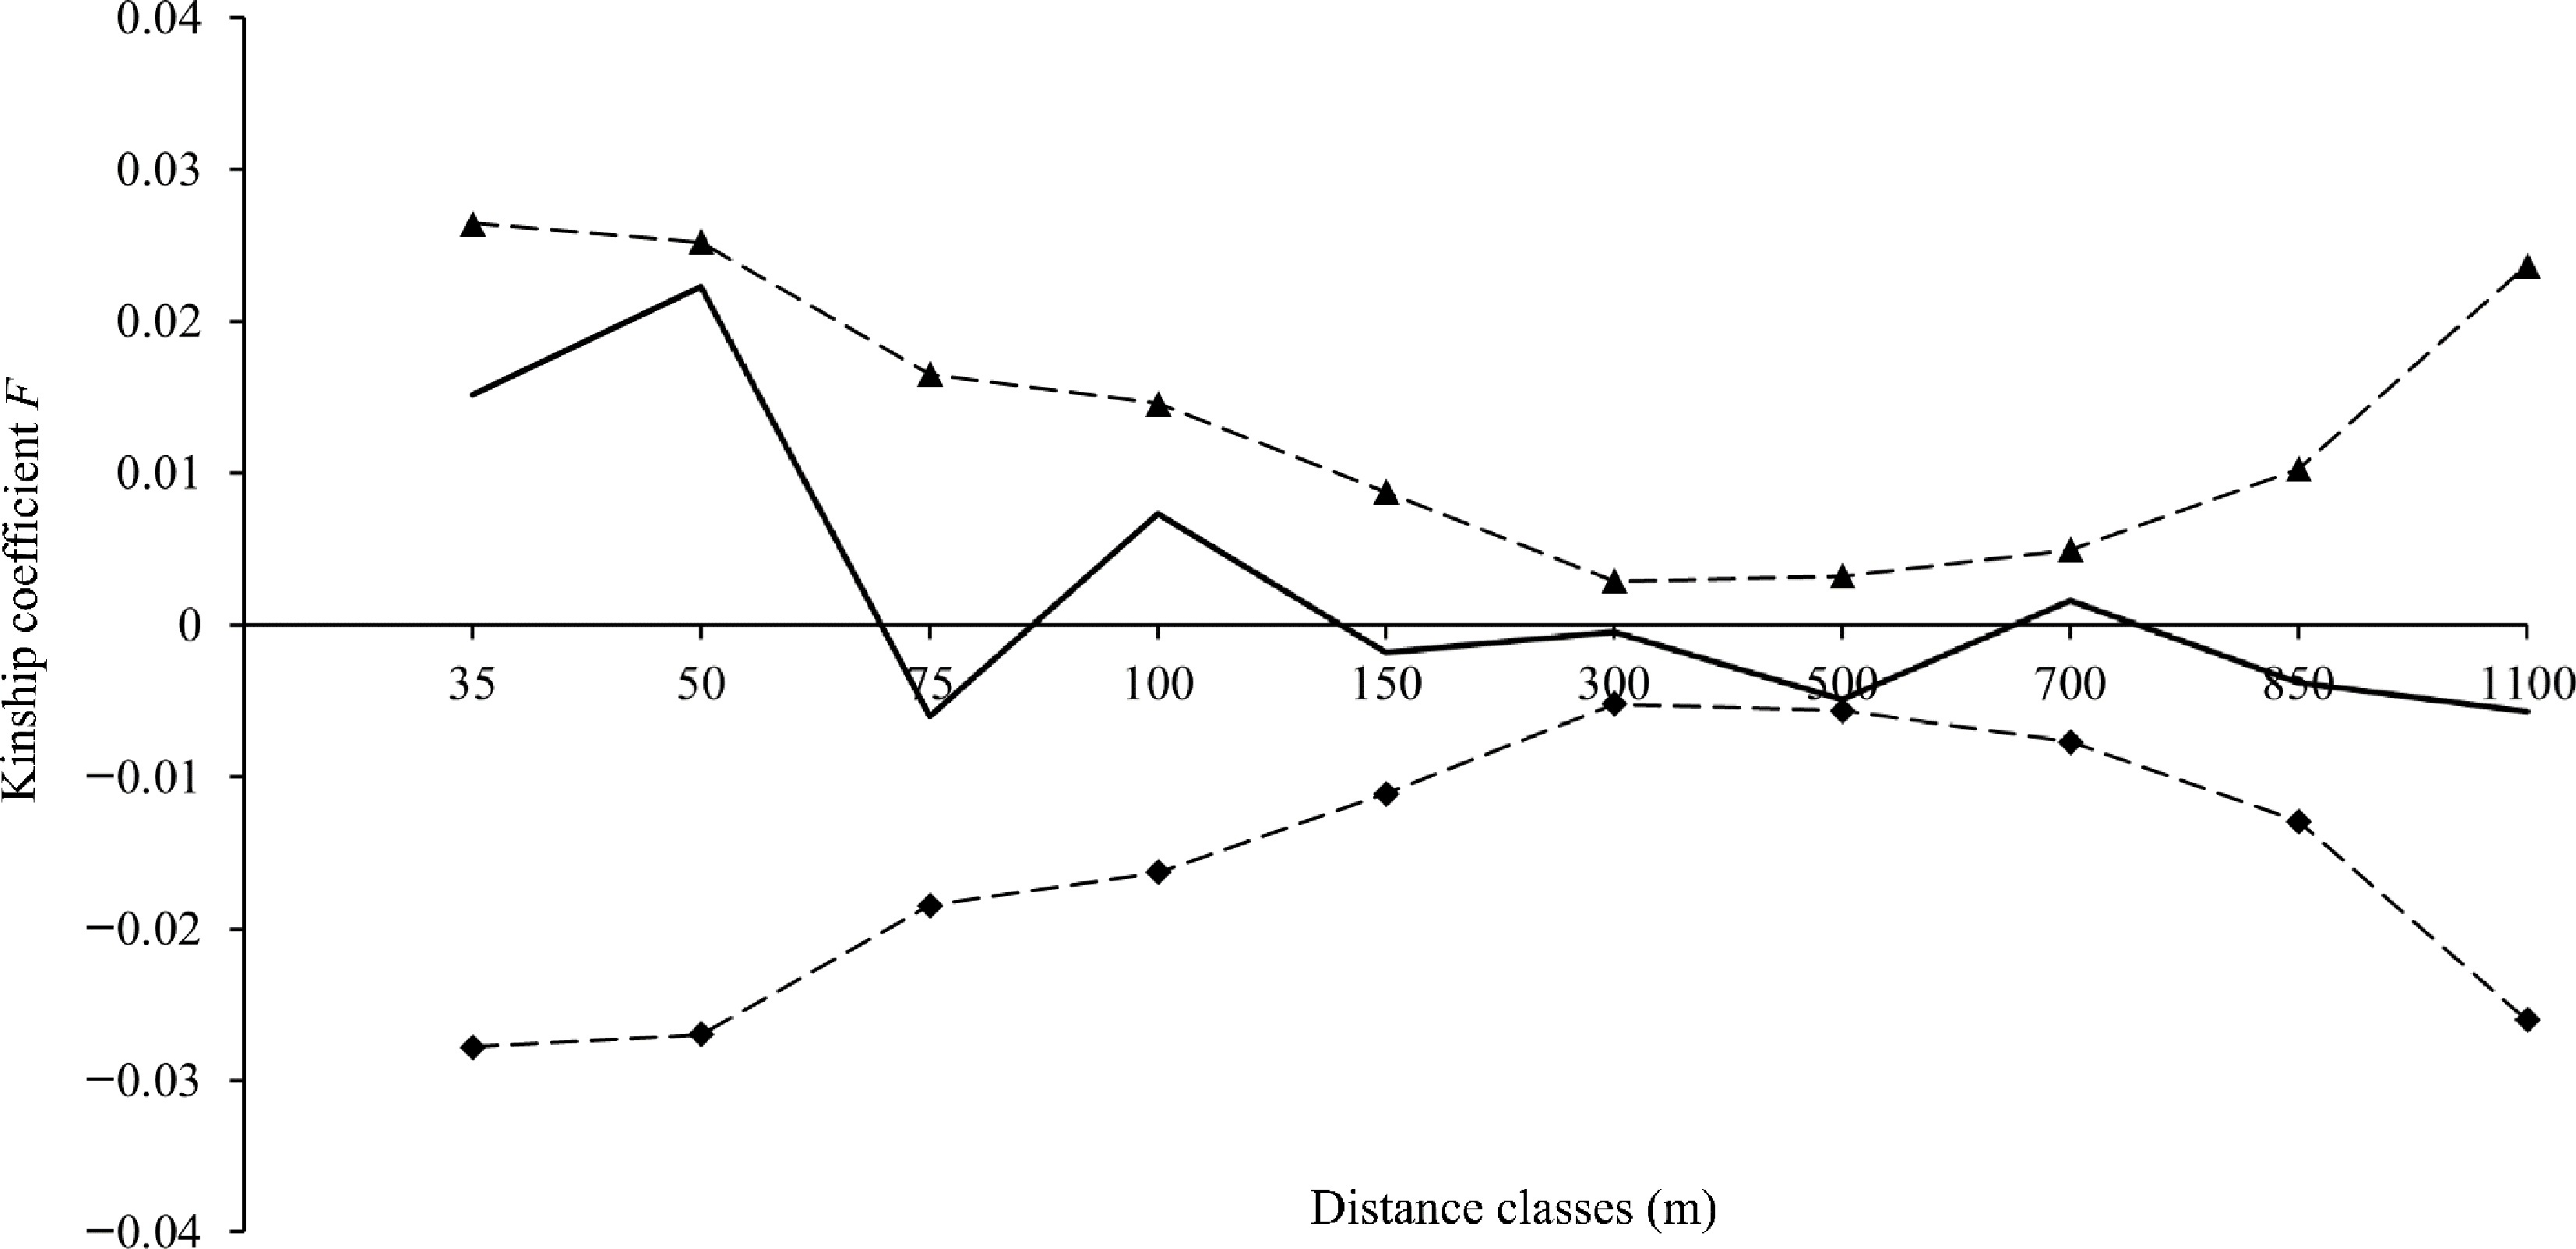
Figure 6.
Fine-scale genetic structure of V. mangachapoi in Shimei Bay. The solid line represents the mean Kinship coefficient F (Loiselle et al.[41]), and the dashed lines represent the 95% confidence intervals of the mean Kinship coefficient F.
-
Due to rapid coastal development and village expansion, the coastal population of V. mangachapoi declined and fragmented into several small and discontinuous patches[12] (Fig. 2). However, there was no significant difference in genetic diversity between the coastal (SM and RY) and the rainforest (TT) populations (Table 1), and the effective sizes of the three populations are quite close (Table 3). Besides, no recent bottleneck could be detected in these populations (Fig. 3). The results indicated that the sizes of the two coastal populations are still large to maintain a comparative level of genetic diversity relative to that of the rainforest population nearby[44]. In addition, the three V. mangachapoi populations were demonstrated to share a homogenous genetic structure and there is little differentiation between them (Figs 4 & 5). In summary, patterns of SSR variation observed in V. mangachapoi suggested either genetic connection through gene flow or not enough time to accumulate divergence after fragmentation of the coastal forest dominated by V. mangachapoi.
Frequent gene flow can prevent rapid loss of genetic variation and differentiation between patches in a fragmented population[45, 46]. Vateriopsis seychellarum is endemic in the Seychelles, after a long period of logging, only a few hundred adult trees remained. Nevertheless, a relatively high level of genetic diversity was found in this species. Long-distance gene flow between isolated patches of Va. seychellarum was considered as the main reason to maintain genetic variation in this species[25]. If pollinators can travel across the gaps created by fragmentation, pollen-mediated gene flow could be maintained between patches, as a result, genetic drift happened within patches would be mitigated in the short term[26, 47, 48]. In this study, frequent gene flow (Nm > 1) was detected between the three V. mangachapoi populations. Besides, the time of fragmentation of the coastal V. mangachapoi forest is relatively short comparing with the generation time of this species. Differentiation between patches is probably impeded by gene flow or there is not enough time to accumulate significant divergence among them, and genetic variation could be largely maintained within the coastal V. mangachapoi forest.
Fine-scale spatial genetic structure
-
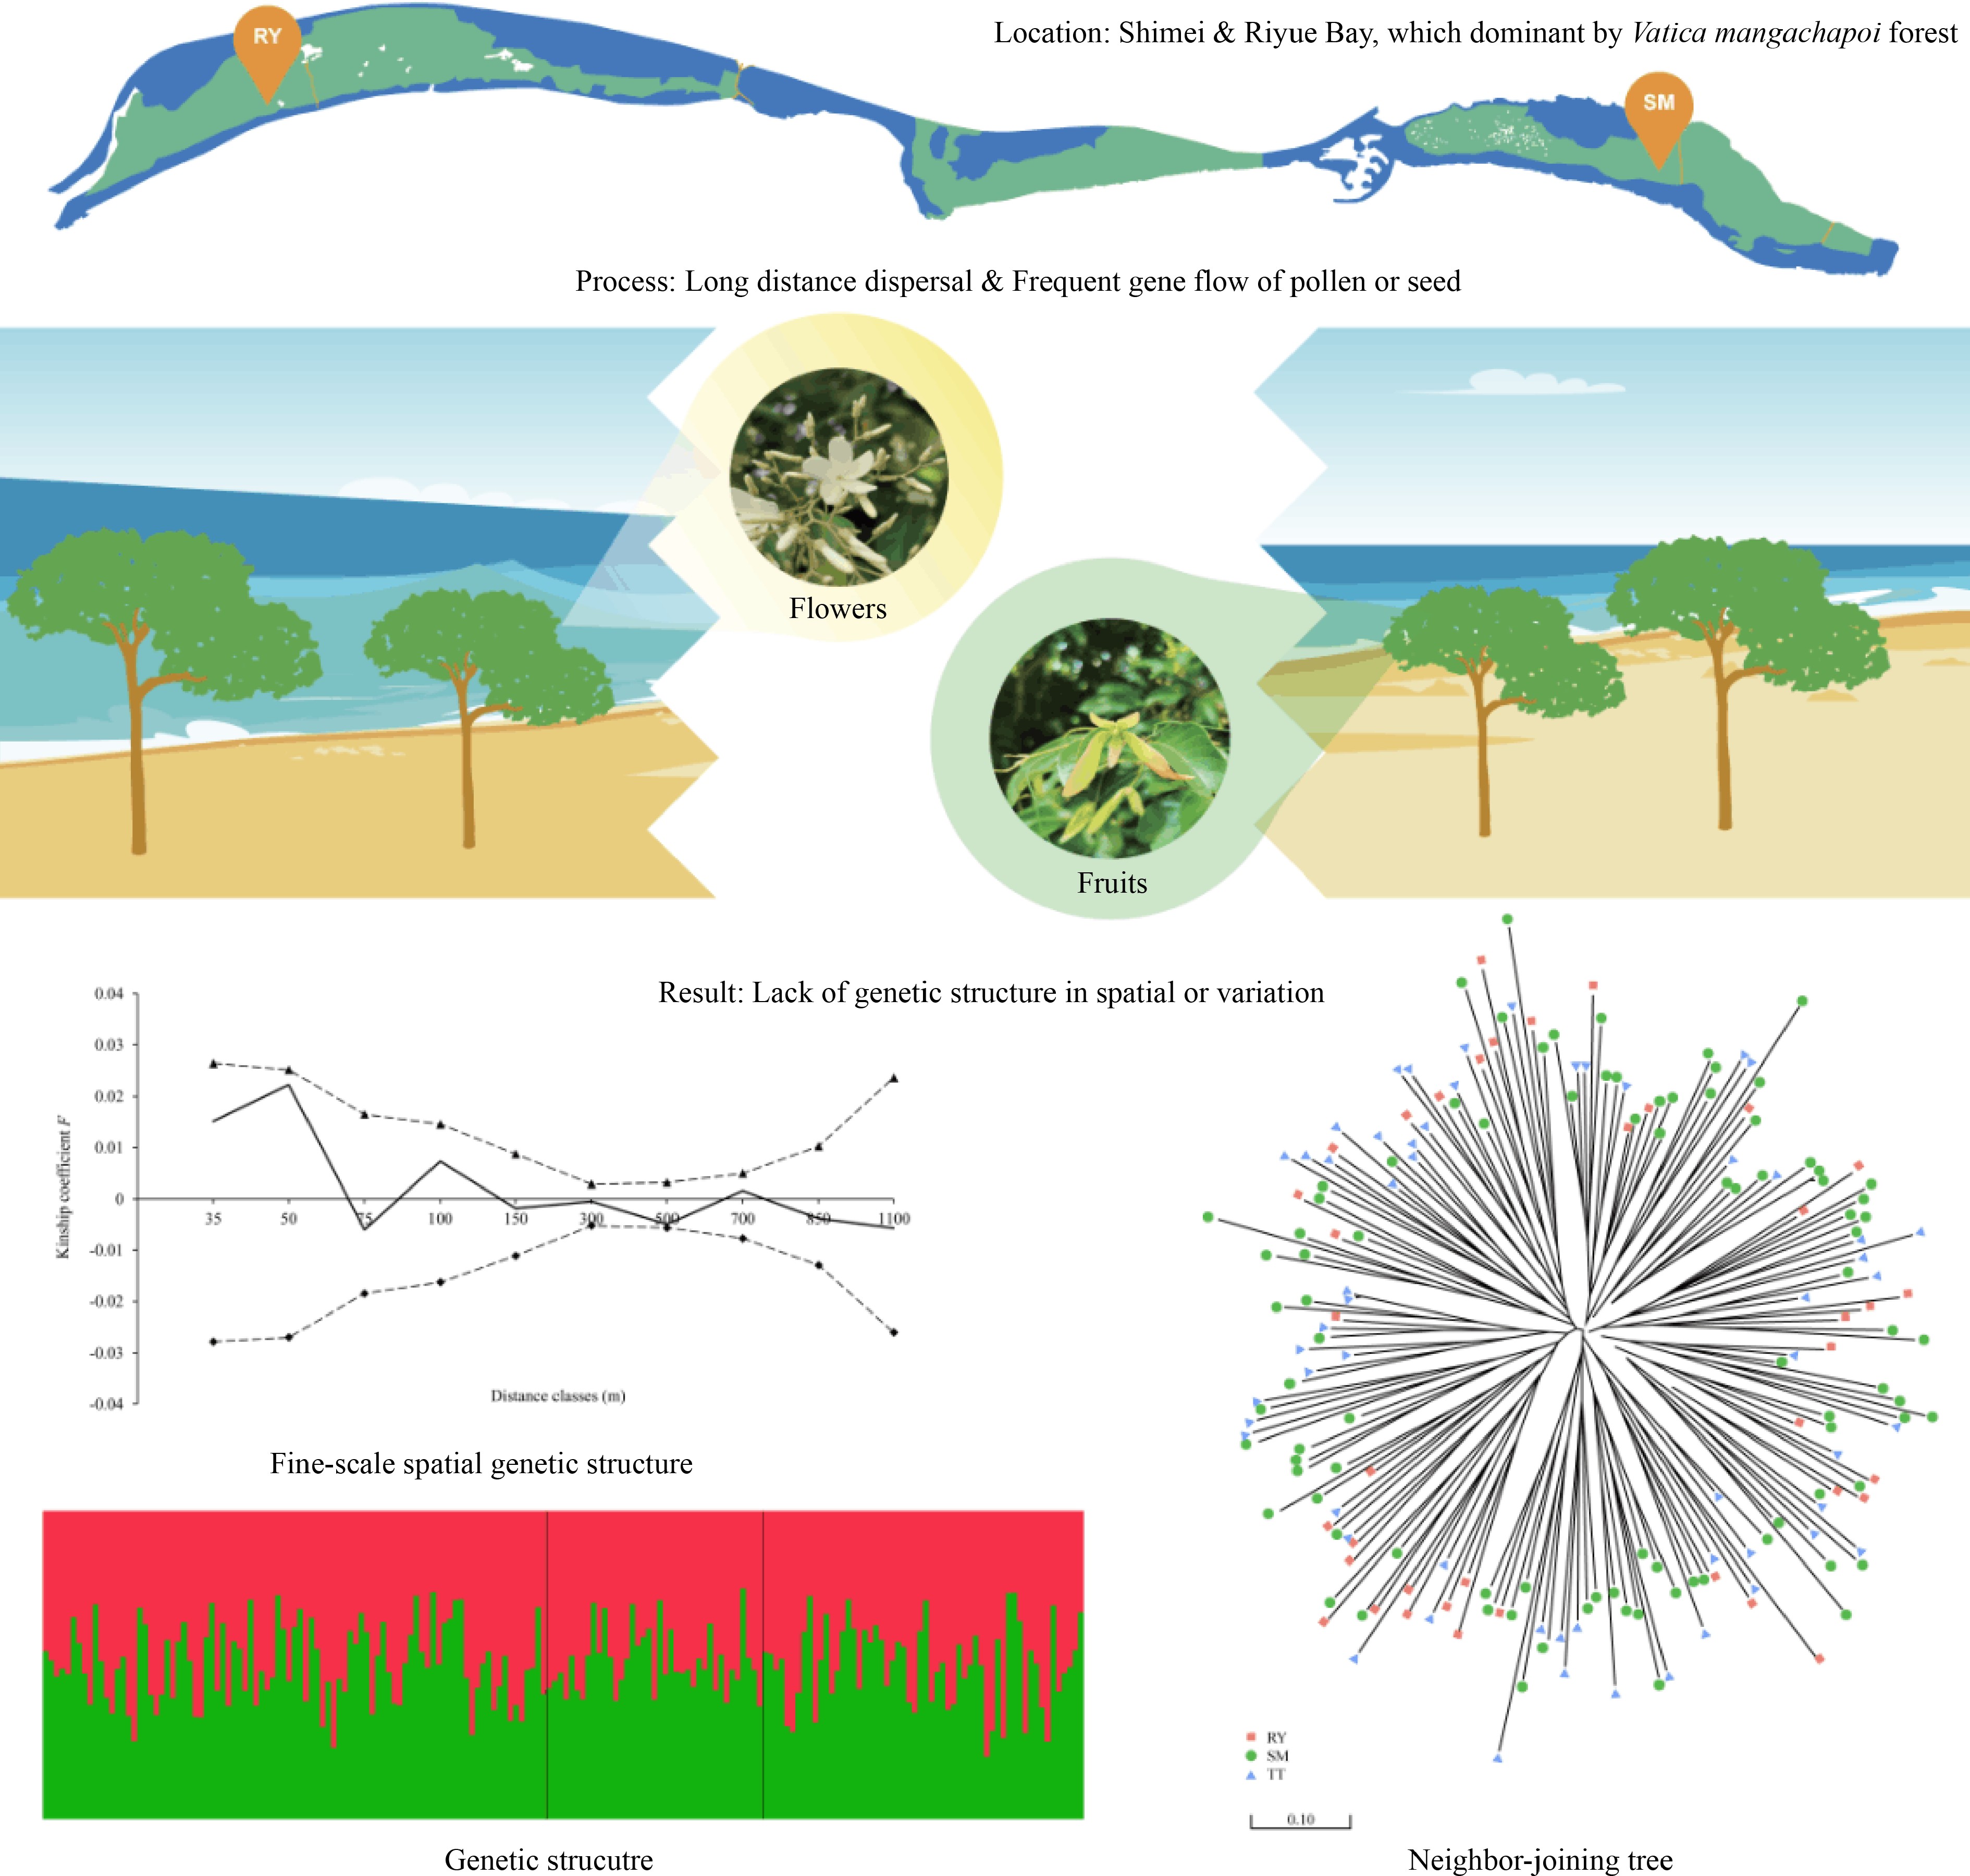
No significant FSGS was detected in the SM population of V. mangachapoi, which may result from long distance dispersal of seeds and/or pollens within population[24, 49]. Two of the five sepals of V. mangachapoi flowers keep growing and develop into functional wings of the fruits that would promote seed dispersal by wind[19, 50]. Hainan Island will experience frequent Pacific typhoon from June to October each year, and the time of fruit ripening of V. mangachapoi (mid to late July-August) coincides well with the activities of the Pacific typhoon[51]. Moreover, Wanning City is one of the locations where typhoons frequently make landfall on Hainan Island. The coastal V. mangachapoi forest at Shimei Bay would be highly likely to encounter a Pacific typhoon during its fruit ripening period. Strong convection currents can carry winged fruits of V. mangachapoi into the upper air and achieve a long-distance horizontal dispersal with hundreds of meters, which may account for the lack of significant FSGS in the SM population[52, 53].
Pollen-mediated gene flow can also influence the strength of FSGS, and restricted gene flow generally results in significant FSGS[22, 24, 54]. Kettle et al. studied the FSGS of three dipterocarp species from the tropical rainforests at Borneo[54]. No clear signal of FSGS was detected in Dipterocarpus grandiflorus, a species pollinated by large pollinators with strong mobility, which may facilitate long-distance pollen flow. On the contrary, S. xanthophylla and Parashorea tomentella had significant FSGS, probably because they were pollinated by small pollinators and consequently short distances of pollen flow. Lee et al. studied the FSGS of S. parvifolia populations in different habitats[22]. They found that populations in montane rainforests, which were mainly pollinated by large pollinators, had no FSGS, whereas populations in lowland rainforests, which were pollinated by small pollinators, had significant FSGS. Lee et al. suggested that it is the restricted pollen flow that leads to strong FSGS in the lowland dipterocarp rainforests[22]. However, as the distance of pollen-mediated gene flow of V. mangachapoi is unclear at present, the relative contribution of seed and pollen dispersal to the random distribution of genotypes in space deserve further studies.
Implications for conservation
-
In this study, we demonstrated that there was no significant difference in genetic diversity among the two coastal V. mangachapoi populations and one rainforest population near the coast. Moreover, little differentiation and frequent gene flow were detected between the three populations. Even though the coastal populations maintain a relatively high level of genetic diversity, the extremely simple community structure and poor species richness of the coastal V. mangachapoi-dominated forests indicate that this unique community is much more fragile than other dipterocarp communities[55, 56]. In addition, the coastal V. mangachapoi-dominated forest is likely to degrade into a sandy scrub community or bare sandy beach in the near future if intense anthropogenic disturbance persists. Therefore, further logging and invasion of the coastal forest must be strictly prohibited, and saplings of V. mangachapoi should be planted in forest gaps to promote the restoration of the coastal V. mangachapoi-dominated forest landscape.
-
The fragmented coastal V. mangachapoi-dominated forest in Shimei Bay have not yet exhibited significant genetic differentiation and diversity loss. The winged fruits of V. mangachapoi may promote seed dispersal and maintain gene flow between populations, which could mitigate genetic drift and lead to random distribution of genotypes within population. In addition, comparing with the generation time of V. mangachapoi, the time of fragmentation of the coastal V. mangachapoi forest is relatively short, so there is not enough time to accumulate differentiation for populations from the fragmented forest. Based on the above findings, we suggest to strengthen the protection of the coastal V. mangachapoi forest to prevent further deforestation. Besides, saplings of V. mangachapoi should be planted to connect isolated populations and facilitate the restoration of the unique coastal V. mangachapoi forest.
We thank W-Q Xiang, S-Q Zhu and Y Cai of Hainan University for their help on data analysis and collection of samples. We also thank the Provincial Nature Reserve of Vatica mangachapoi at Wanning City for their help on field research. This study was supported by the National Natural Science Foundation of China (Grant No. 32060236) and the Key R&D Projects of Hainan Province (Grant No. ZDYF2022XDNY260).
-
The authors declare that they have no conflict of interest.
-
accompanies this paper at (https://www.maxapress.com/article/doi/10.48130/TP-2023-0008)
-
Received 6 May 2023; Accepted 14 June 2023; Published online 5 July 2023
-
There is no significant difference in genetic diversity between the coastal and lowland V. mangachapoi populations.
No fine-scale spatial genetic structure was detected in the coastal SM population.
Strong gene flow between populations accounts for the homogenous genetic structure of the coastal and lowland populations.
There is not enough time to accumulate differentiation between fragmented populations in the coastal forest.
- Supplemental Fig. S1 Neighbor-joining tree based on Nei's (1983) genetic distance for V. mangachapoi.
- Supplemental Table S1 Analysis of molecular variance (AMOVA) for the three V. mangachapoi populations.
- Copyright: © 2023 by the author(s). Published by Maximum Academic Press on behalf of Hainan University. This article is an open access article distributed under Creative Commons Attribution License (CC BY 4.0), visit https://creativecommons.org/licenses/by/4.0/.
-
About this article
Cite this article
Duan J, Wang H, Tang L. 2023. Effects of habitat fragmentation on the coastal Vatica mangachapoi forest (Dipterocarpaceae) in Shimei Bay, Hainan Island, China. Tropical Plants 2:8 doi: 10.48130/TP-2023-0008
Effects of habitat fragmentation on the coastal Vatica mangachapoi forest (Dipterocarpaceae) in Shimei Bay, Hainan Island, China
- Received: 06 May 2023
- Accepted: 14 June 2023
- Published online: 05 July 2023
Abstract: Habitat fragmentation can cause isolation and decline of a formerly continuously distributed population, which leads to loss of genetic variation and increased risk of extinction. Vatica mangachapoi Blanco is a dominant tree species growing in the lowland rainforests of Hainan Island, China. Remarkably, this species dominates a coastal forest in Shimei Bay, Wanning City of Hainan Province (China). Due to logging, expansion of farmland and villages, and construction of tourism facilities, the coastal V. mangachapoi-dominated forest has become fragmented, threatening its future. To evaluate the effects of habitat fragmentation on this unique coastal forest, two V. mangachapoi populations (SM and RY) along the coast and one population in the lowland rainforest near the coast were selected, and their genetic diversity was assessed based on 12 SSR markers. In addition, the genetic structure of the three populations and gene flow among them, and the fine-scale spatial genetic structure (FSGS) of the SM population were also studied. The results show that the three V. mangachapoi populations had comparable levels of genetic variation, and differentiation among them is negligible ($ {F}_{\mathrm{s}\mathrm{t}} $ = 0.008 ~ 0.013). Model-based clustering, Principal co-ordinate analysis and the Neighbor-joining (NJ) methods consistently support a homogeneous genetic structure of the three populations, and strong gene flow was detected among them by MIGRATE analyses. Moreover, there is no significant FSGS in the SM population. A relatively short time since habitat fragmentation and gene flow mediated by seed dispersal might be the likely reasons for the high levels of genetic variation and an absence of genetic structure of the coastal V. mangachapoi populations. In conclusion, even though there are no significant effects of fragmentation on the coastal V. mangachapoi forest, strict protection is required to prevent further deforestation and fragmentation. Besides, saplings of V. mangachapoi should be planted in forest gaps to reconnect fragments of the coastal forest, which would be of benefit for the long-term survival of the tropical coastal V. mangachapoi-dominated forest.


