


-
Chinese cabbage (Brassica rapa L. ssp. pekinensis) is a nutritious leafy vegetable that comes in a variety of colors, including light green, dark green, yellow, and purple[1,2]. Leaf color is considered an important agronomic and commercial trait[3], which is affected by both genetic and environmental factors[4]. Improving leaf color is a central goal of Chinese cabbage germplasm mining, which will require robust and accurate high-throughput genetic information. The recent sequencing and assembly of the whole Chinese cabbage genome has provided an opportunity for molecular-assisted breeding aimed at improving leaf color[5,6].
Manual visual identification, chlorophyll and SPAD content for leaf color assessments are often imprecise and inadequate for distinguishing between subtle differences. Furthermore, traditional assessments often failed to provide adequate information to describe the relationships between leaf phenotypes and environmental variables in a sufficiently quantitative nor systematic manner[7]. It is therefore difficult to match phenotypes to specific genes or loci using traditional methods. However, recent advances in spectral analysis, artificial intelligence (AI), and machine vision technology have enabled the development of new powerful tools for leaf color analysis. For instance, visible light, multispectral, hyperspectral, and fluorescence imaging techniques are increasingly being employed in modern agricultural breeding research[8−10]. Developing a novel method for leaf color analysis using visible light and multispectral imaging technology would be of benefit to biologists, botanists, and plant breeders.
The rapid development of spectral imaging technology has made the application of these techniques to physiological and biochemical systems a research hotspot. Furthermore, combining spectral imaging and computer processing technology enables the development of non-destructive diagnostic tools, making smart agriculture possible[11,12]. Thus, multispectral imaging provides efficient, accurate, and nondestructive monitoring of crop plants, and is likely to replace traditional field monitoring methods[13−15]. In addition, when coupled with bespoke algorithms, spectral imaging allows real-time monitoring of crop plants[16,17]. Recently, spectral imaging has been successfully applied to the study of plant color phenotypes[18,19]. Even with this progress, existing spectral imaging techniques cannot accurately distinguish the subtle differences in leaf color of different Chinese cabbage cultivars. Therefore, a fast and nondestructive method that can accurately distinguish the subtle differences in Chinese cabbage leaf colors is urgently needed in the field of vegetable breeding.
Here, we comprehensively compared several Chinese cabbage leaf color identification methods. A PLS-DA machine learning algorithm was used to construct and optimize a supervised identification model, and to standardize the results. The fusion of different spectral data was constructed to improve the identification accuracy of the model. The reliability of our method was verified with the identified quantitative trait locus (QTL) of F2 segregation population. Overall, our method enables the accurate and precise identification of Chinese cabbage leaf color phenotypes, and would greatly benefit studies of leaf color, functional genomics, and molecular-assisted breeding of Chinese cabbage.
-
This study used a total of nine leaf color-diverse high-generation inbred lines of Chinese cabbage, their F1 generation and two F2 segregation populations. The experimental plant materials were obtained from the State Key Laboratory of North China Crop Improvement and Regulation and Key Laboratory of Vegetable Germplasm Innovation and Utilization of Hebei, College of Horticulture, Hebei Agricultural University, and planted in Baoding, China. For leaf color analysis, the upper portions of the fifth leaves (as determined from the inside to the outside) were sampled and stored in a low temperature environment until analysis.
Traditional assessments of leaf color are conducted based on visual inspection. Visual inspection was carried out according to the distinctness, uniformity, and stability (DUS) paradigm. We distinguished the color according to The Royal Horticultural Society's Color Chart (RHSCC), and recorded scores by visual inspection. Field investigations were conducted 25−30 d after planting. In order to minimize subjectivity and improve accuracy, three separate investigators independently scored the blade samples from shallow to deep. Each investigator had normal color vision and was confirmed to not be colorblind or have weak color vision or other visual defects. Grading was increased as the color depth of leaves increased, with a minimum score of '1' and a maximum score of '5'. The visual assessment of Chinese cabbage leaf color was based on the combined results from each experimenter.
Spectral imaging assessment of Chinese cabbage leaf color
-
The VideometerLab 4 system (Videometer, Herlev, Denmark) was used to capture multispectral images of Chinese cabbage leaves. This system uses 19 LEDs (365, 405, 430, 450, 470, 490, 515, 540, 570, 590, 630, 645, 660, 690, 780, 850, 880, 940 and 970 nm) to capture multispectral images, including visible light imaging, ultraviolet (UV) imaging, and near-infrared (NIR) imaging. The region of interest within each image was segmented using the threshold method. The average reflectivity of each wavelength was determined by analyzing the reflectivity of each of the 19 bands within the target region.
Image processing and visible light color parameter extraction
-
The background difference method[20] was used to process the original images captured by VideometerLab 4, with background separation achieved based on the background difference. Preprocessed images were analyzed using ENVI image processing software (NV5 Geospatial, Florida, USA). The region of interest is constructed from non-leaf vein regions of the leaves. The average values for the red, green, and blue (RGB) channels were extracted as color parameters for each pixel. However, the color difference distinguished by RGB color space is non-linear and unintuitive. Therefore, hue, saturation, and lightness (HSL) color space were utilized during the analysis process. RGB values were converted to HSL values according to Eqns (1), (2), (3), and (4) as follows:
$ H=\left\{\begin{array}{lll}\dfrac{\pi }{3}\times \dfrac{G-B}{Max-Min},& \text{}\text{if}\text{}& Max=R\\ \dfrac{\pi }{3}\times \dfrac{B-R}{Max-Min}+\dfrac{2\pi }{3},& \text{}\text{if}\text{}& Max=G\\ \dfrac{\pi }{3}\times \dfrac{R-G}{Max-Min}+\dfrac{4\pi }{3},& \text{}\text{if}\text{}& Max=B\end{array}\right. $ (1) $ H=H+2\pi ,\quad H \lt 0 $ (2) $ L=\dfrac{1}{2}\left(Max+Min\right) $ (3) $ S=\left\{\begin{array}{l}\dfrac{\text{}\text{Max-}Min}{Max+Min},\quad 0 \lt L\le \dfrac{1}{2}\\ \dfrac{Max-Min}{2-\left(Max+Min\right)},\quad L \gt \dfrac{1}{2}\end{array}\right. $ (4) PLS-DA model construction
-
Partial least squares discriminant analysis (PLS-DA) is an improved supervised classification algorithm for discriminant analysis. PLS-DA is commonly used in spectral and metabolic analyses, as well as other multidimensional analyses[21−23]. The basic principle is shown in Eqn (5),
$ Y={\sum }_{i=1}^{n} {\beta }_{i}{\lambda }_{i}+B $ (5) where
$ Y $ $ i $ $ {\beta }_{i} $ $ i $ $ {\lambda }_{i} $ $ i $ $ n $ The model was constructed as follows. First, RGB values were converted to HSL values. HSL color parameters, multispectral data, and multi-source fusion data obtained from the training set were used as input variables. The PLS-DA models were established using spectral data (X) and visually-determined leaf color classifications (Y). The number of main factors was determined and adjusted according to the change of model fitting index, and the independent variable fitting index (R2X, cum), dependent variable fitting index (R2Y, cum), and model prediction index (Q2, cum) were obtained. When R2 and Q2 are > 0.5, the model fitting is considered acceptable.
Finally, the permutation test was used to verify the model. After replacing the samples, the statistical distribution and P-value were calculated. The order of Y is repeated 200 times at random, and the separated model is fitted to all displaced Y while extracting as many components as the original matrix Y. To verify the predictive capability of the model, the cumulative cross effectiveness (Q2) was calculated. To verify the explanatory power of the model, the cumulative variance (R2) was calculated. Negative Q2 intercept values indicate that the model is not overfitted. The independent variable fitting index (R2X), dependent variable fitting index (R2Y), model prediction index (Q2), and comprehensive identification rate were used as the model evaluation criteria. We explained the working flow of this study in Fig. 1, showing the overall processing process from data acquisition to modeling.
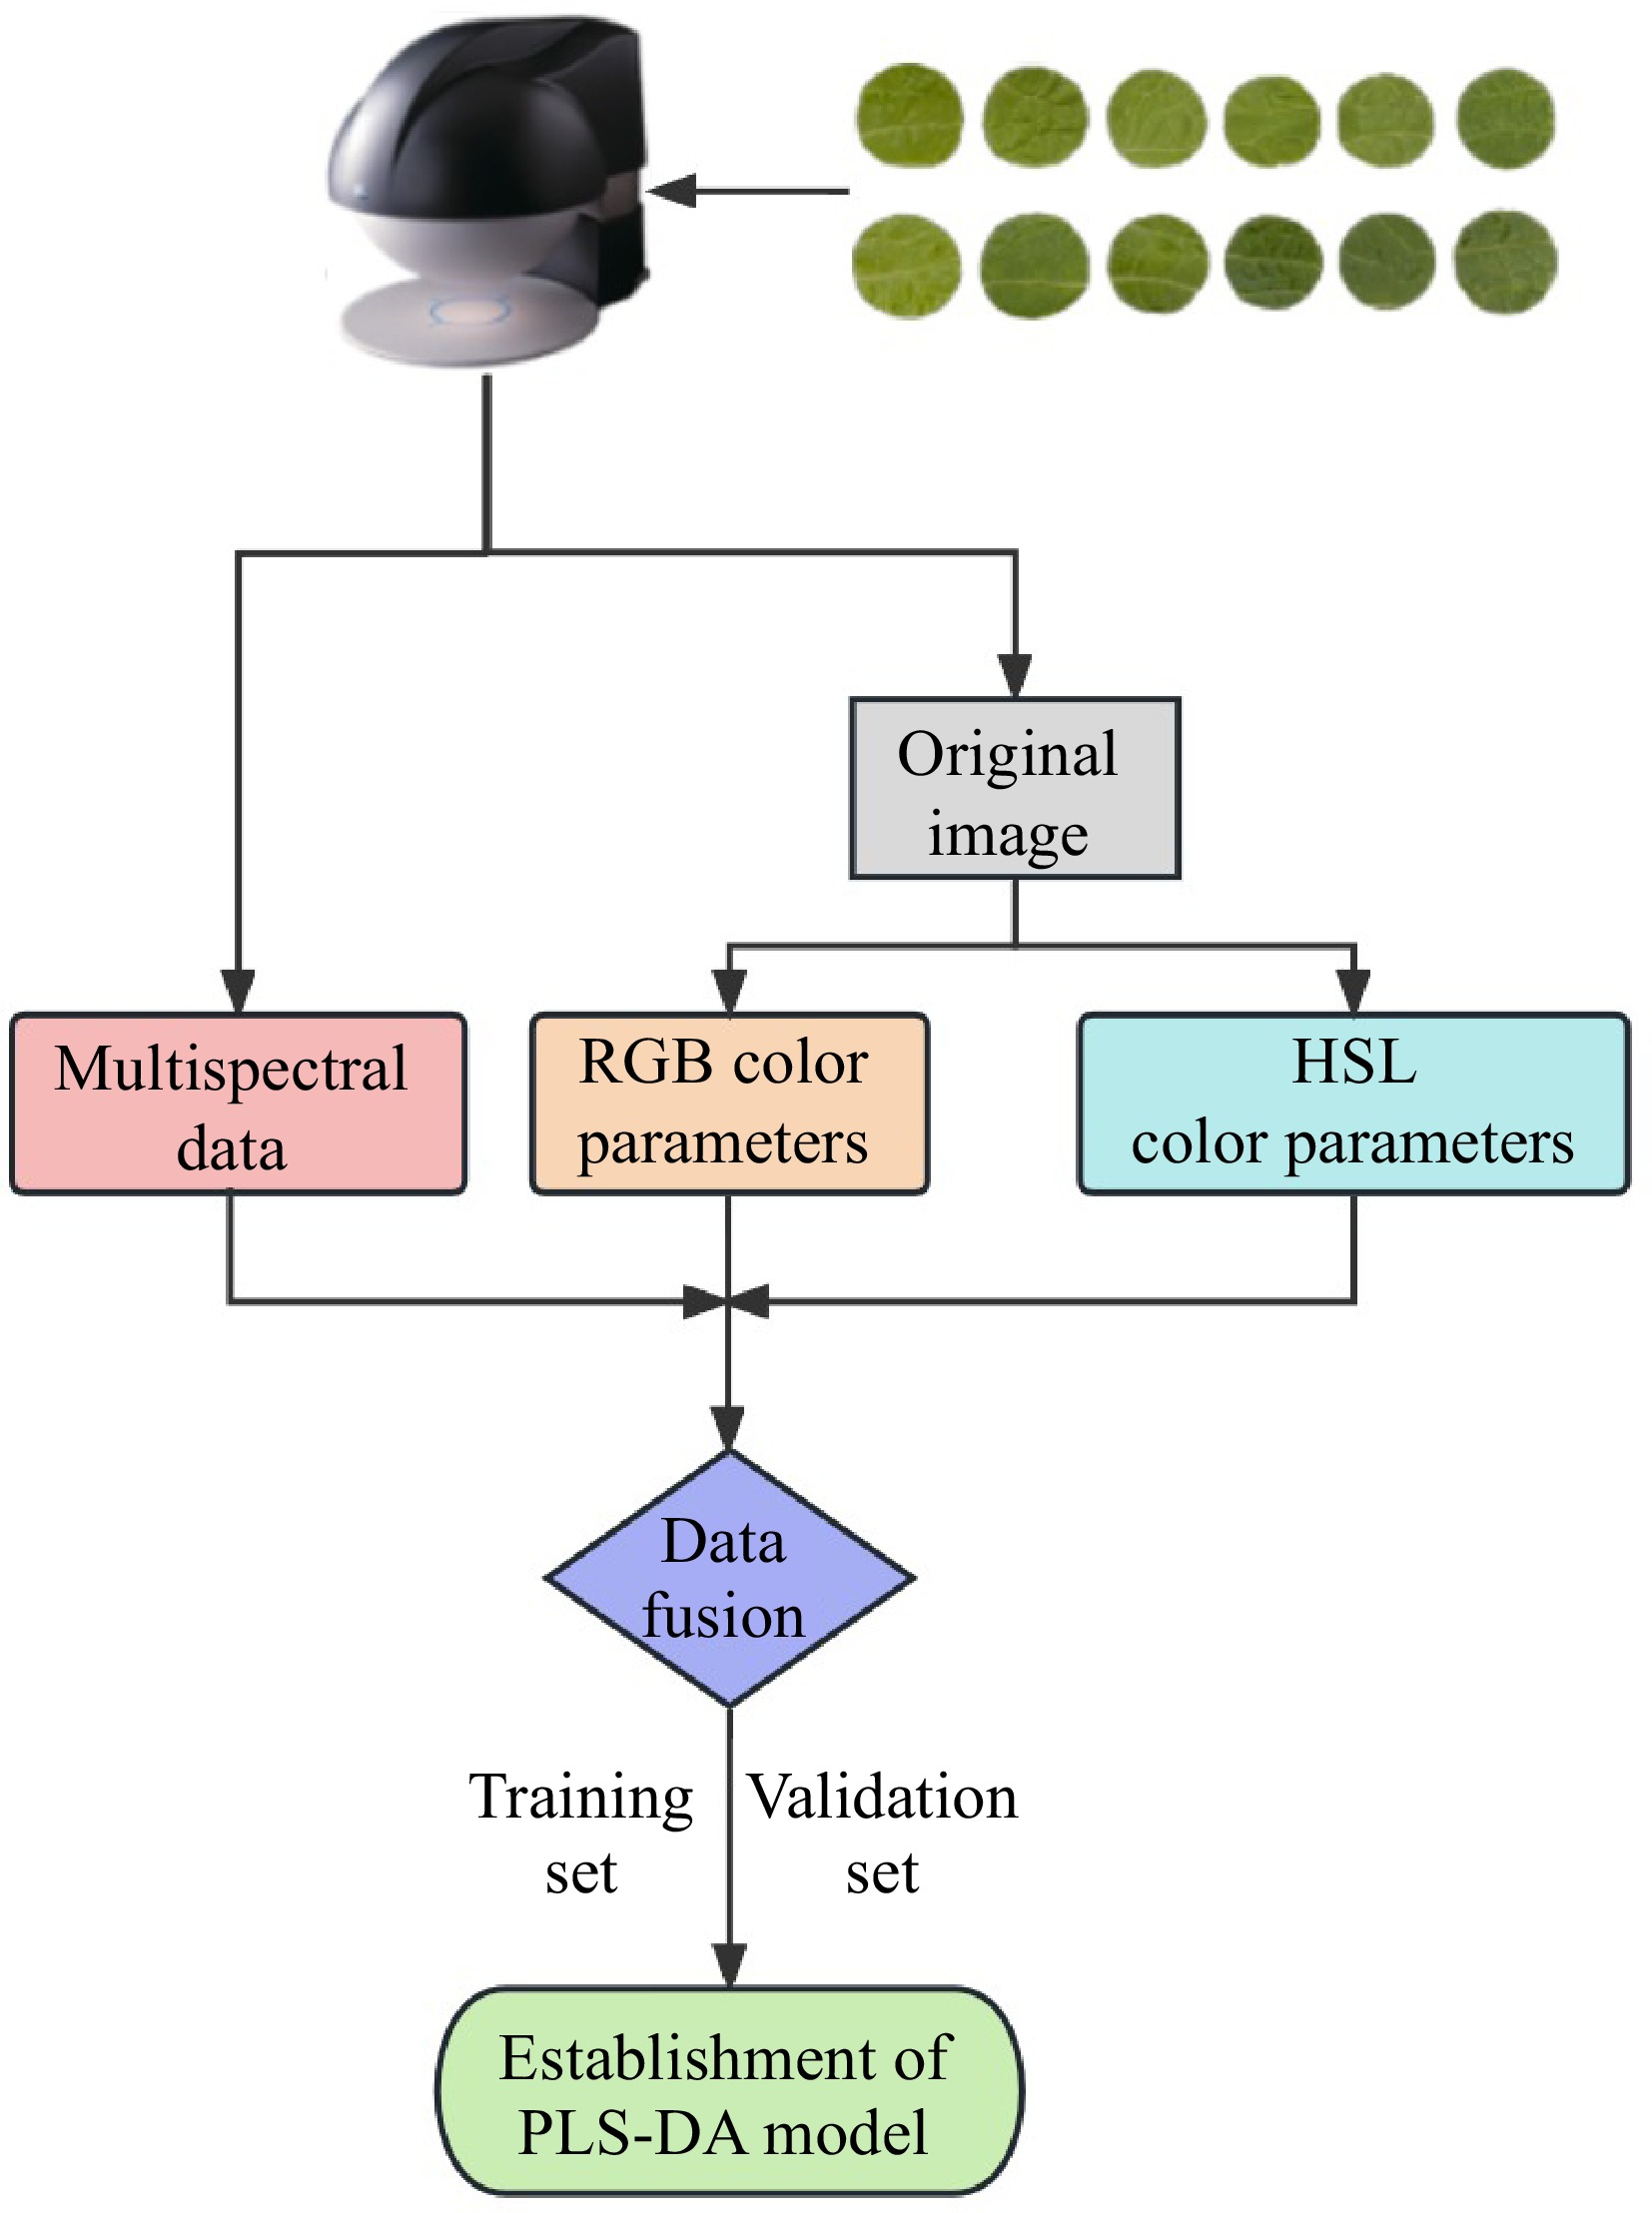
Figure 1.
Establishment of PLS-DA model for accurate identification of Chinese cabbage leaf color based on multispectral imaging.
Whole genome resequencing
-
All samples with the uniform phenotype except leaf color and no insect damage and other malformations were taken for whole genome re-sequencing. After screening for extremely light phenotypes (A) and extremely dark phenotypes (E) by visual inspection and PLS-DA supervised leaf color phenotype identification model based on data fusion separately, 22 light green phenotypes and 22 dark green phenotypes were selected for further analyses. The genomic DNA of each individual plant was extracted separately using a modified CTAB method. DNA quality and concentration were assessed by agarose gel electrophoresis. The extracted DNA was mixed in equal amounts and sent to Shanghai Meiji Biomedical Technology Co., Ltd (Shanghai, China) for library construction and sequencing on the Illumina NovaSeq platform (PE150). The base quality and content distribution of raw data were evaluated, and clean reads were compared with the reference genome (
www.bioinformaticslab.cn/EMSmutation/download/ ) using BWA software. To evaluate comparison efficiency and depth distribution, the MEM2 comparison method was used. The GATK Haplotyper method was used to detect single nucleotide polymorphisms (SNPs) and indels with default parameters. In combination with genomic annotation, the SnpEff program was used to perform location annotation and mutation efficacy prediction for mutation sites. Genetic markers were screened for homozygous differences (except for F1 populations) to select SNP and indel markers. Finally, an analysis was conducted on the mixed offspring pools. After comparing to the reference genome and detecting mutation sites, the obtained loci were filtered and subjected to noise reduction to identify candidate genomic regions related to dark green leaf color in Chinese cabbage. -
Chinese cabbage variety 'A03', a homozygous line with light green leaf color, was crossed with eight other homozygous high-generation inbred lines with diverse green leaf colors. The leaf color phenotypes of the F1 generation are shown in Fig. 2a. RHSCC is used to exhibit the color of leaves. Of these, 'F1-442' and 'F1-449' were self-crossed to obtain the F2 generation 'F2-442' and 'F2-449' segregation populations, which exhibited subtle differences in leaf color. A total of 348 plants from the 'F2-442' population and 450 plants from the 'F2-449' population were obtained. 'F2-442' was composed of F2 segregations with light green, oily green, and intermediate leaf colors. 'F2-449' was composed of F2 segregations with light green, blackish green, and intermediate leaf colors (representative plants are shown in Fig. 2b & c).
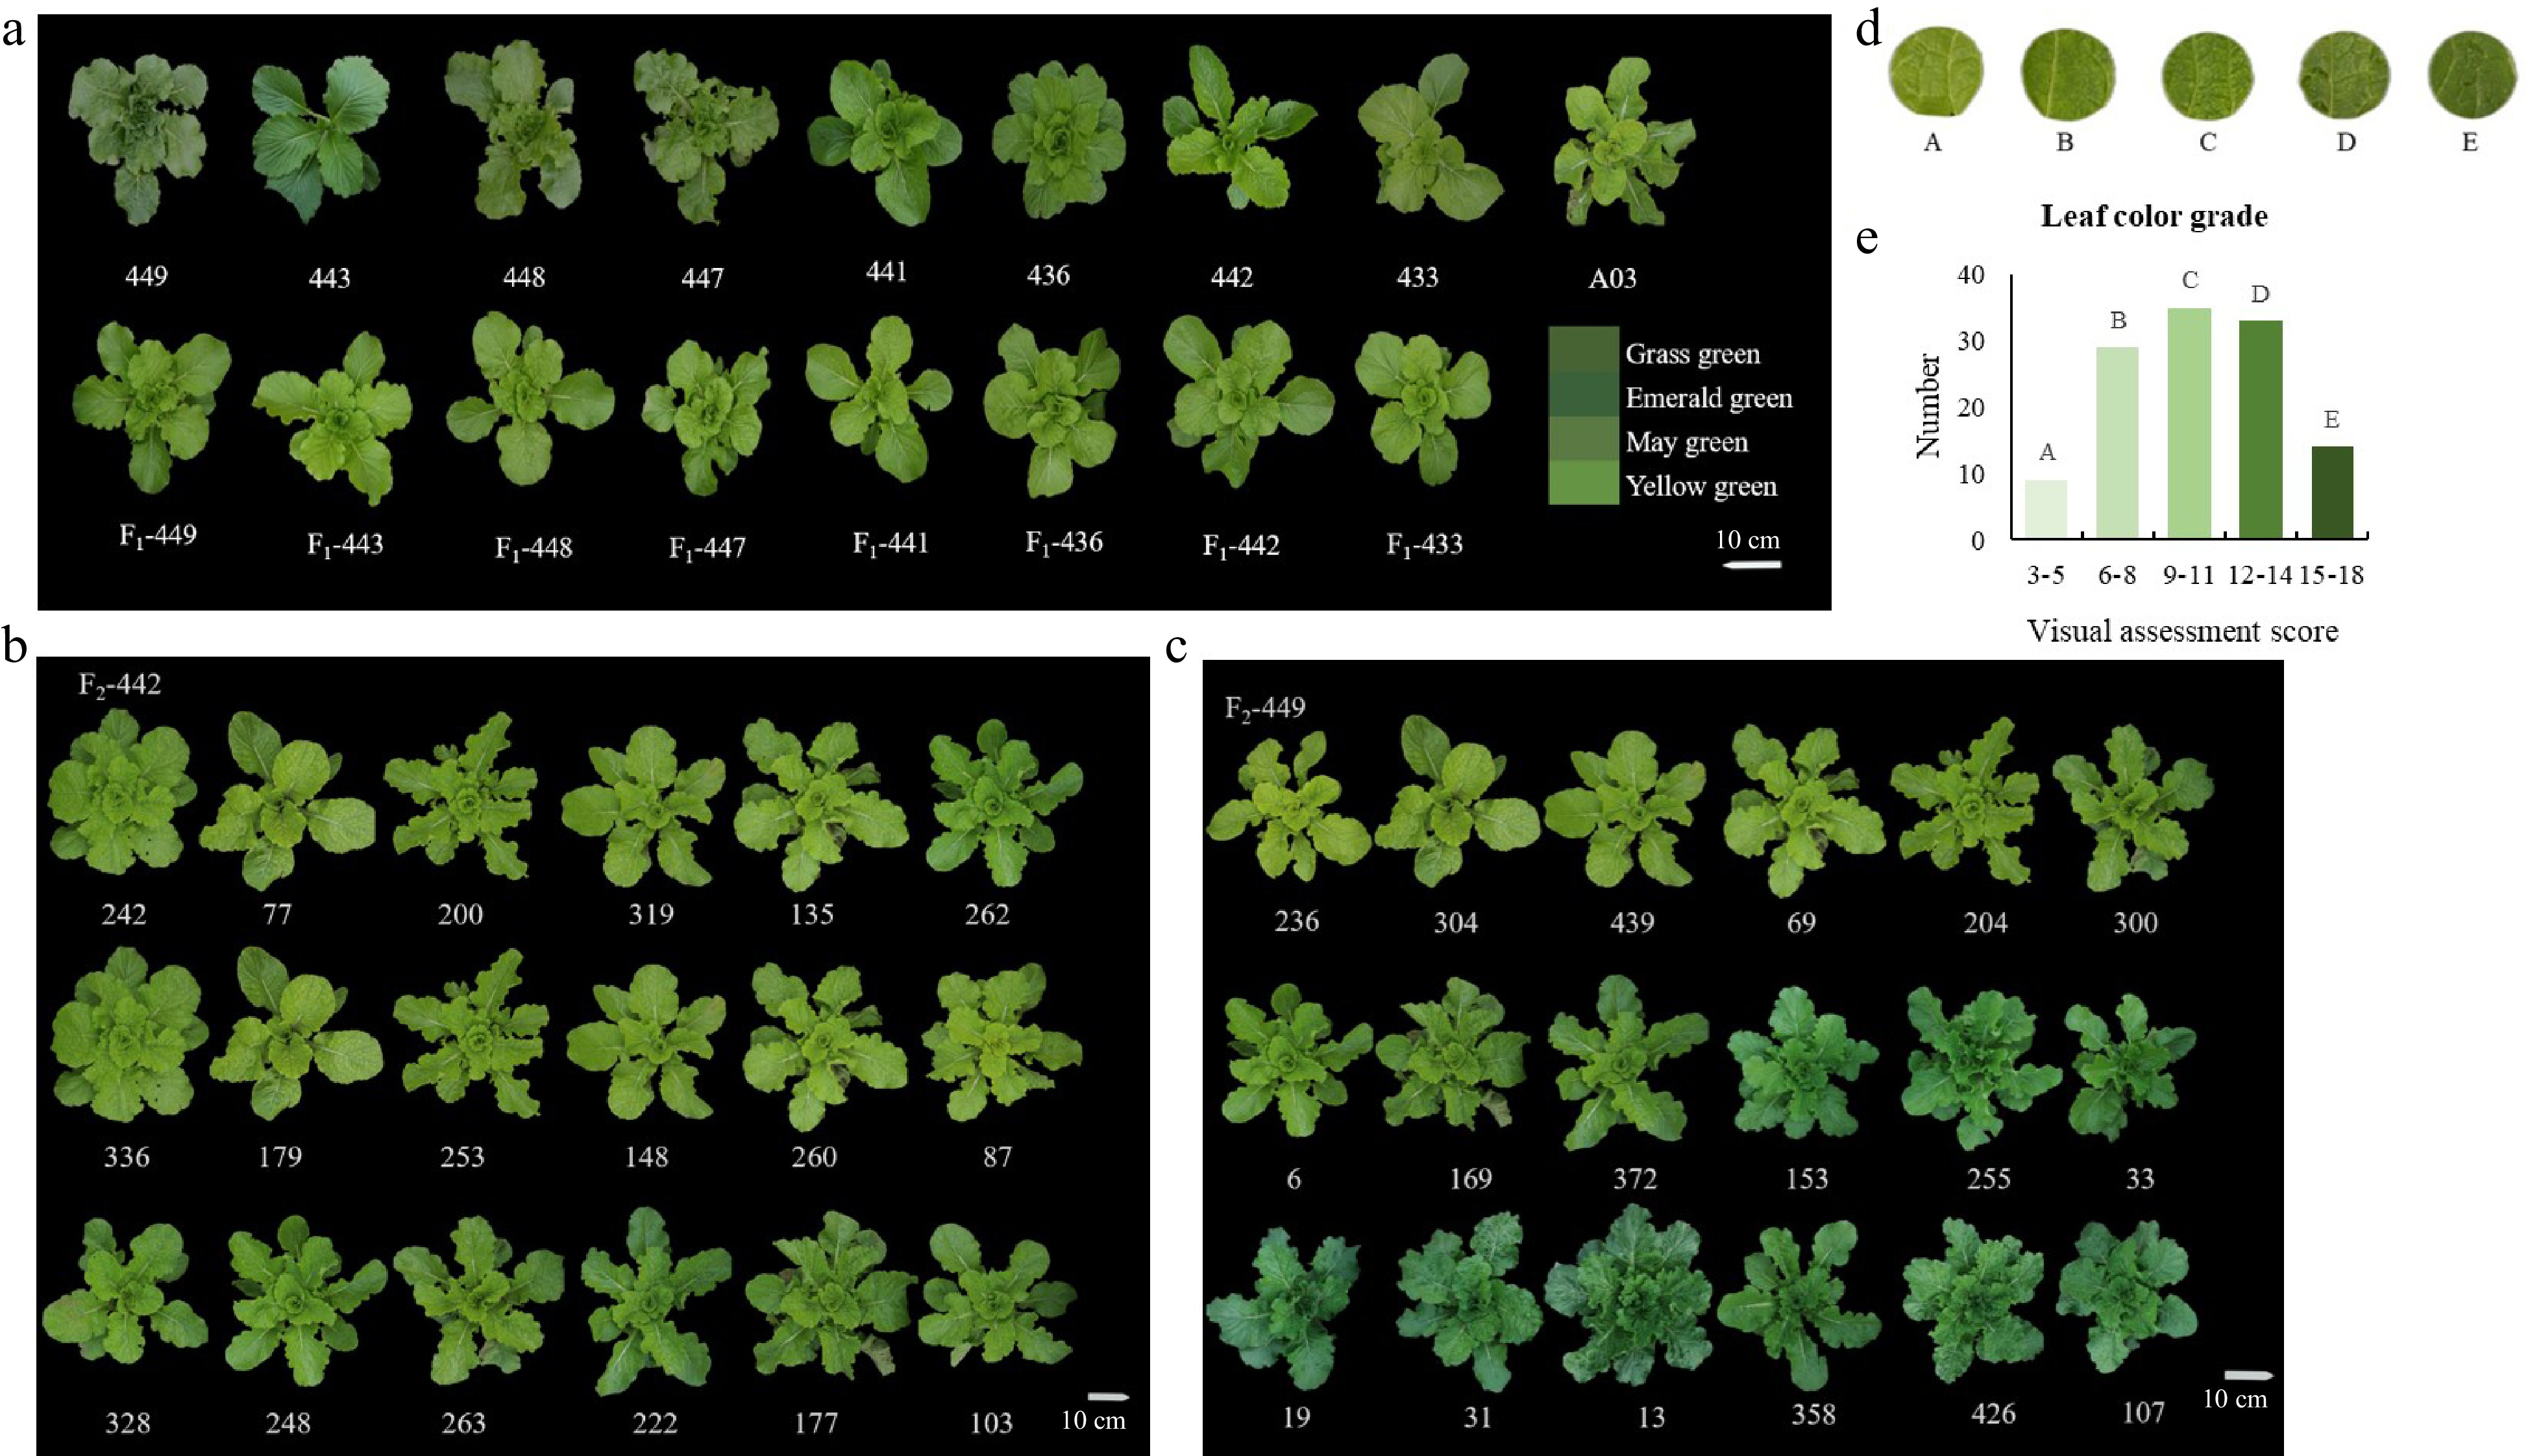
Figure 2.
Visual assessment of leaf color phenotype. (a) The leaf color phenotypes of nine homozygous high-generation inbred lines and their F1 generation. The figure references the Grass green, Emerald green, May green, and Yellow green in 'The Royal Horticultural Society's Color Chart' as color comparisons. Representative materials of (b) 'F2-442' and (c) 'F2-449' in F2 population of Chinese cabbage. (d) Visual inspection on the difference of leaf color of population. (e) Color difference classification of samples. Scale bars = 10 cm.
The phenotypic data of nine high-generation inbred lines of Chinese cabbage as well as their 'F2-442' segregation populations were obtained by visual inspection carried out by experimental personnel. According to the visual inspection grade, 120 samples representing different leaf colors were selected for examination. The samples exhibited a maximum score of 15 points and a minimum score of 3 points, with an average score being 9.25 points. Leaf color was concentrated around 7−11 points, exhibiting a normal distribution (p < 0.05). According to the scoring results, the samples were divided into five color categories (Fig. 2d & e). These categories were used as the comparison and evaluation standard, and the identification rate was calculated by comparing the results of different identification methods.
Comparison of leaf color identification accuracy based on K-means
-
The spatial distribution of RGB and HSL parameters was plotted according to the visual inspection level, as shown in Fig. 3a & b. Using the RGB and HSL parameters, Chinese cabbage leaf color grades were identified by K-means clustering and the results were statistically matched with the recognition rate of the actual grade based on visual inspection (Supplemental Table S1). The comprehensive identification rate of the RGB and HSL parameters was 80% and 87%, respectively. HSL parameters were more effective in distinguishing the C, D, and E types, which were difficult to differentiate using RGB color models. Thus, HSL-based identification was more accurate than RGB-based identification.
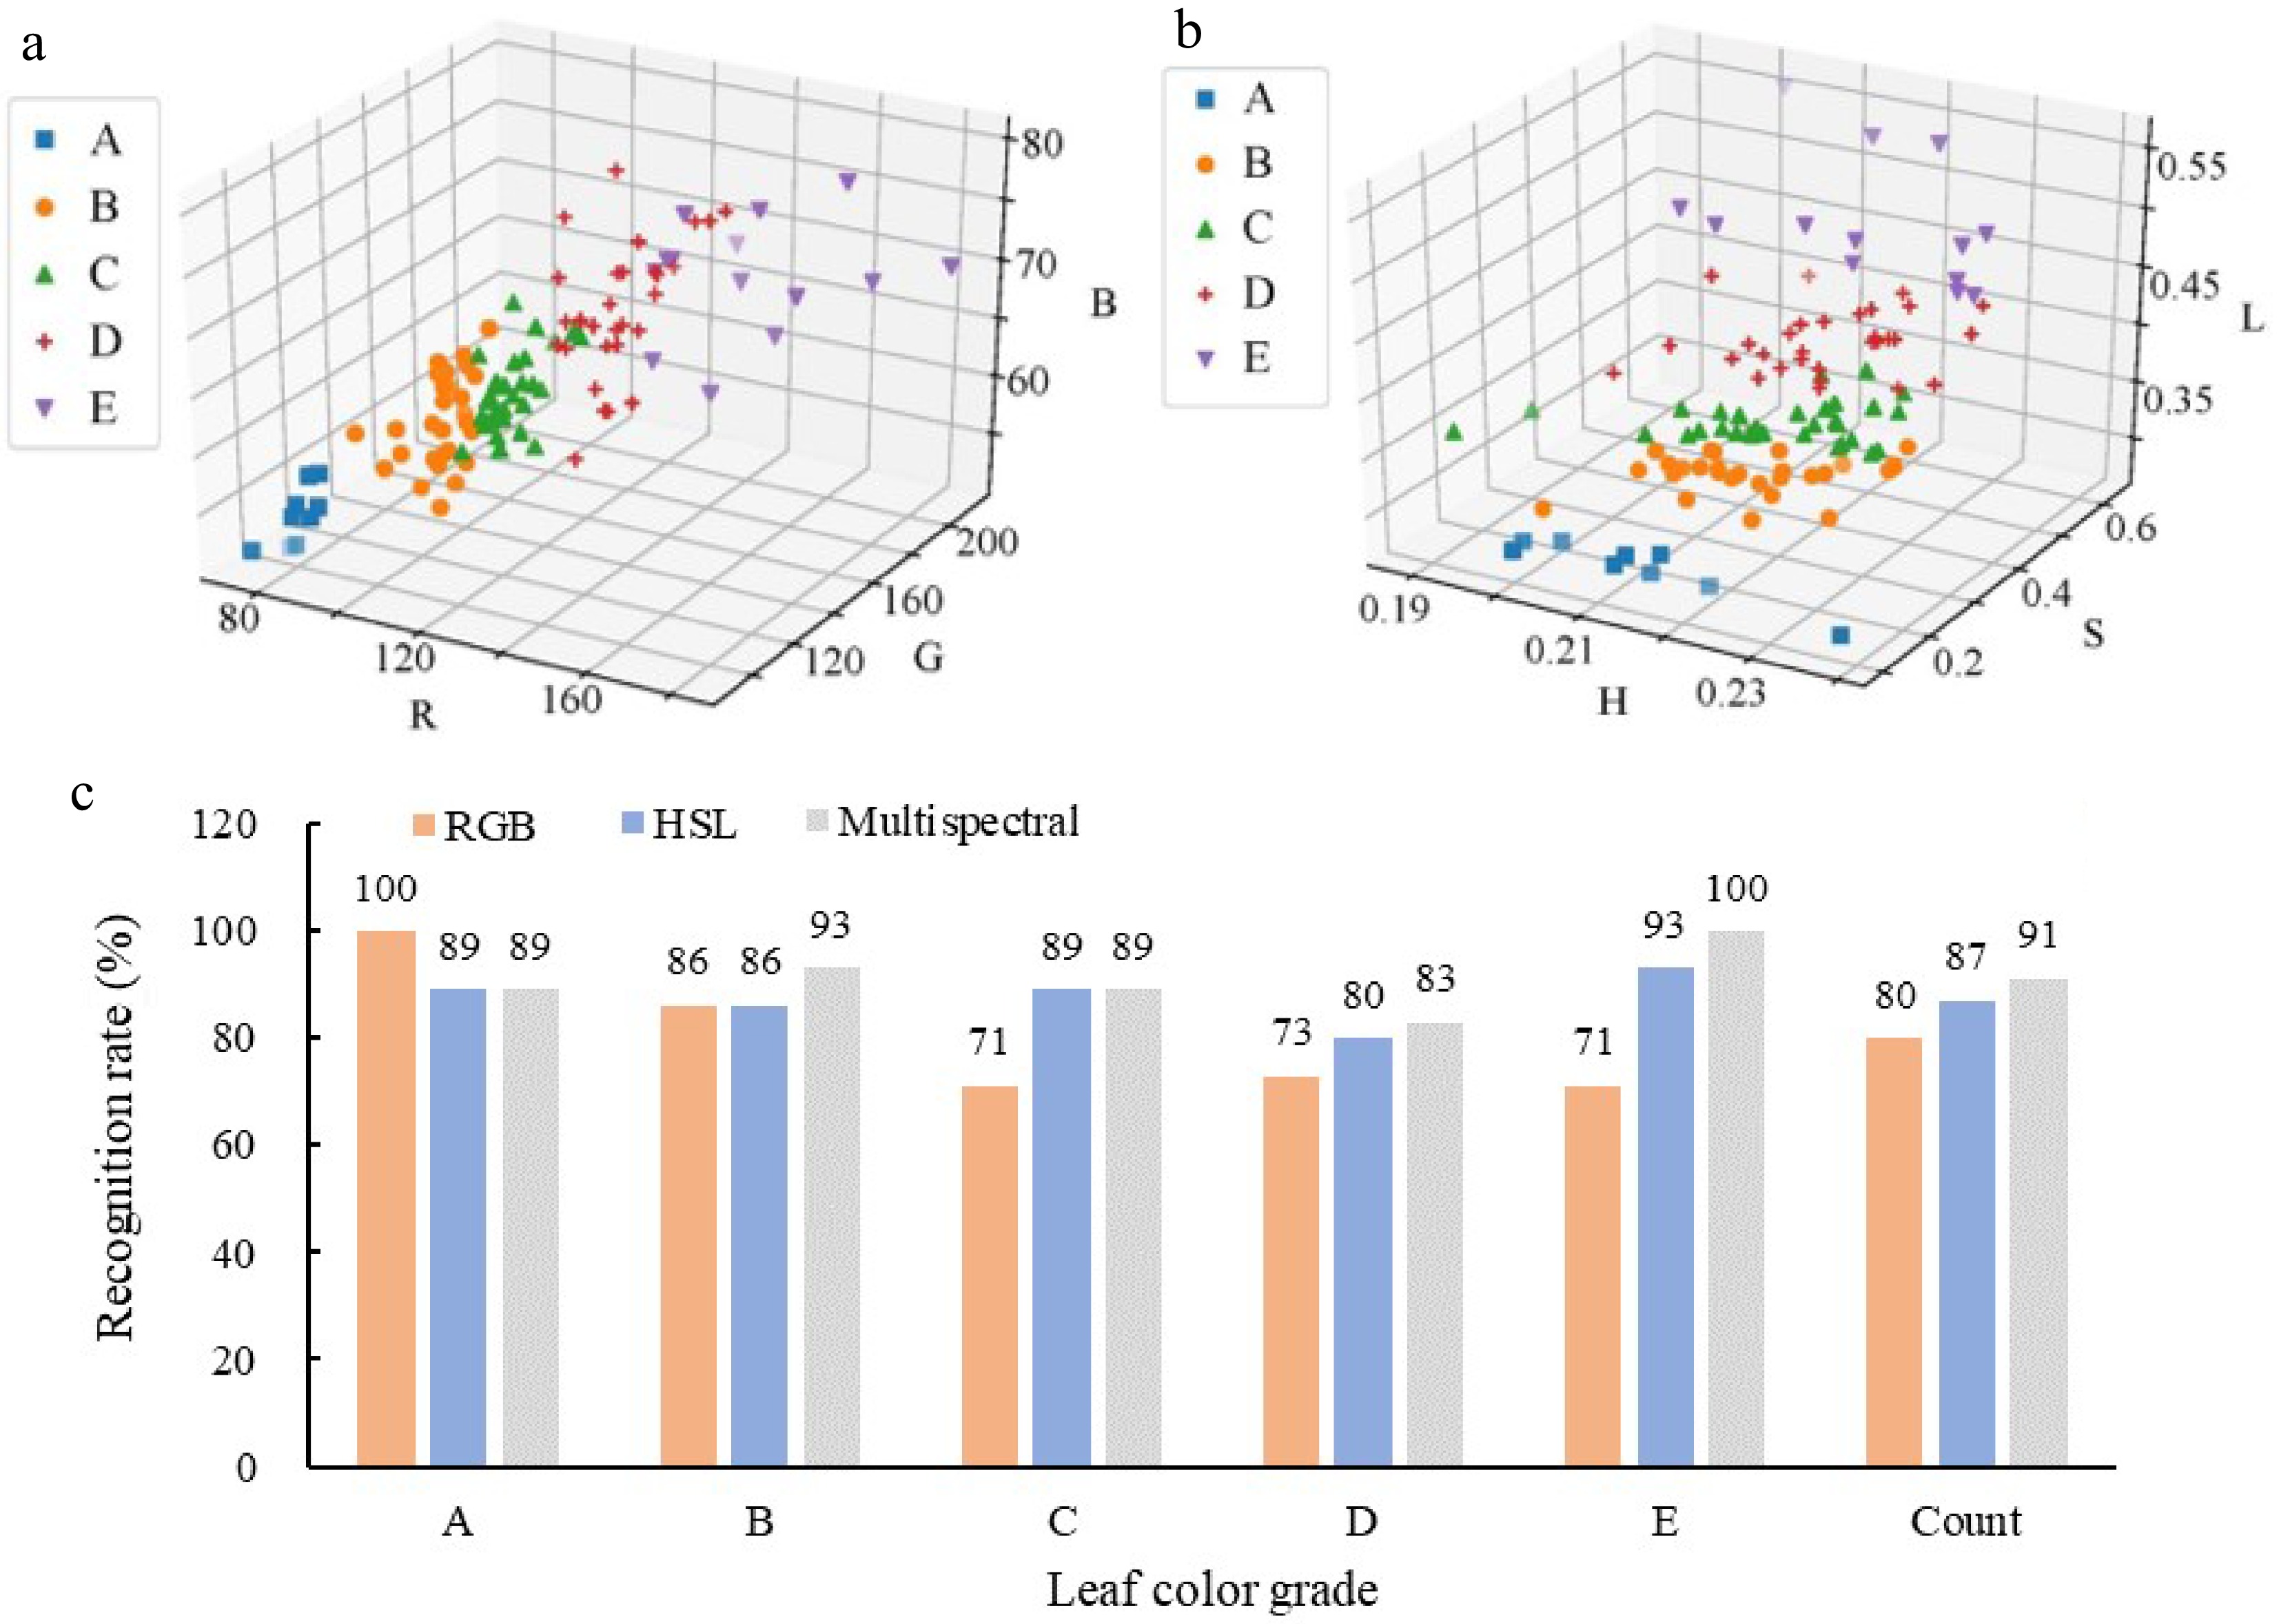
Figure 3.
Comparison of leaf color identification accuracy of Chinese cabbage based on K-means. Spatial distribution of (a) RGB parameters and (b) HSL parameter identification results. (c) K-means clustering recognition rate of RGB parameters, HSL parameters and multispectral data.
K-means clustering analysis was carried out for the average reflectivity of the 19 channels, with K set to '5' to obtain five cluster centroids (C1−C5). Each cluster centroid had 19 dimensions, and the final spectral cluster center was obtained through iterative algorithmic calculation (Supplemental Fig. S1a). This algorithm classified each sample into the nearest Ci class according to the distance between the sample and the cluster center. Comparing the classification results of the multispectral data with the manual visual data, the recognition rates of the five manually surveyed levels were 89%, 93%, 89%, 83%, and 100%, respectively, with a total recognition rate of 91% (Fig. 3c & Supplemental Table S1). These results suggest that multispectral identification offered improved accuracy compared to RGB and HSL parameters and can be used to more accurately identify and classify Chinese cabbage leaf color.
A comprehensive analysis of Chinese cabbage leaf color data indicated that both HSL parameters and multispectral data based on digital images could effectively identify and classify leaf colors. However, a simple unsupervised classification method based on K-means cannot guarantee classification accuracy, lacks a unified scale, and cannot compare identification results across different groups. To improve the accuracy and systematicity of the model, we used a PLS-DA machine learning algorithm to establish a supervised leaf color identification model based on sample spectral data, randomly selected samples were used as the verification set.
Establishment of PLS-DA-based Chinese cabbage leaf color identification models
-
According to the manual visual inspection, the values of the five grades of leaf color (from shallow to deep, A−E) were reassigned as 1−5. The actual category of leaf color determined by visual inspection was taken as the dependent variable, and the RGB parameters obtained from digital images were taken as independent variables for PLS-DA analysis. The projection of each sample on the plane composed of the first and second principal components (PCs) is shown in Supplemental Fig. S2a. The sample distribution was relatively concentrated, with B/D and C/E exhibiting partial cross-mixing. The fitting recognition rate for each grade was 100%, 84%, 57%, 92%, and 69%, respectively, with a comprehensive fitting recognition rate being 80%. The best fit was observed for classes A and D. The worst fit was observed for classes C and E, which did not meet the recognition requirements. The dependent variable fitting index (R2Y) and the model prediction index (Q2) for each type of sample are listed in Table 1. After 200 permutation tests, the intersection points between the Q2 regression line and the vertical axis was less than zero (Supplemental Fig. S2b), suggesting that the model was stable without over-fitting. The number of main factors was 3, the independent variable fitting index (R2X) was 1, the dependent variable fitting index (R2Y) was 0.34, and the model prediction index (Q2) was 0.3. For our model, Q2 < 0.5, resulting in a relatively poor fit and discrimination accuracy.
Table 1. Accuracy of PLS-DA model based on image RGB color parameters, HSL color parameters, multispectral data, and data fusion.
Principal
divisorRGB HSL Multispectral RGB + HSL+ Multispectral 1 2 3 Count 1 2 Count 1 2 3 4 Count 1 2 3 4 5 6 7 Count R2X 0.897 0.094 0.008 1 0.751 0.242 0.993 0.659 0.234 0.08 0.009 0.982 0.691 0.191 0.065 0.035 0.005 0.004 0.004 0.995 R2Y 0.236 0.028 0.074 0.339 0.236 0.108 0.344 0.236 0.196 0.024 0.027 0.483 0.238 0.198 0.042 0.025 0.537 0.079 0.047 0.663 Q2 0.231 0.005 0.083 0.299 0.233 0.133 0.335 0.231 0.248 0.009 0.003 0.429 0.233 0.252 0.042 0.023 0.05 0.062 0.087 0.546 Root-mean-
square error
(RMSE)A 0.216 0.212 0.21 0.213 0.241 0.191 0.216 0.233 0.203 0.199 0.202 0.209 0.228 0.199 0.199 0.2 0.216 0.215 0.2 0.208 B 0.376 0.379 0.353 0.369 0.391 0.335 0.363 0.386 0.307 0.312 0.31 0.329 0.385 0.305 0.307 0.304 0.31 0.318 0.323 0.322 C 0.408 0.414 0.41 0.411 0.405 0.398 0.402 0.403 0.352 0.359 0.361 0.369 0.405 0.354 0.36 0.361 0.376 0.384 0.381 0.374 D 0.333 0.329 0.276 0.313 0.298 0.272 0.285 0.32 0.286 0.27 0.26 0.284 0.195 0.224 0.245 0.236 0.245 0.277 0.32 0.249 E 0.39 0.381 0.385 0.385 0.389 0.39 0.39 0.387 0.351 0.248 0.347 0.333 0.388 0.355 0.343 0.334 0.348 0.333 0.307 0.344 Using the actual category of leaf color, which was measured manually, as the dependent variable and the HSL parameters obtained from digital images as the independent variable, we constructed a PLS-DA model (Table 1). The projection of each sample on the plane composed of the first and second PCs is shown in Supplemental Fig. S2c, with no cross-mixing observed among the samples. The fitting recognition rate for each grade was 100%, 85%, 70%, 92%, and 79%, respectively, with an overall fitting recognition rate being 85%. The best fit was observed for class A, while the fit for categories B, C, and E was relatively poor. After 200 permutation tests, the intersection points between the Q2 regression line and the vertical axis was less than zero (Supplemental Fig. S2d), again suggesting that the model was stable without over-fitting. The number of main factors was 2, the independent variable fitting index (R2X) was 0.99, the dependent variable fitting index (R2Y) was 0.34, and the model prediction index (Q2) was 0.34. Again, Q2 < 0.5, resulting in a relatively poor fit. However, this model was more effective than the RGB-based model.
Multispectral data from multiple identification methods, including NIR and fluorescence data, can better reflect complex leaf color phenotypes and improve the accuracy of K-means-based identification. However, our original spectral data was noisy due to instrumental and environmental factors. To minimize the impact of adverse factors such as non-uniform samples, baseline drift, high-frequency noise, and stray light, we normalized the data by using Savitzky-Golay smoothing (SG)[24] five times, with 15 points (Supplemental Fig. S1b). Then, the PLS-DA discriminant model of Chinese cabbage leaf color was established using a set of training data and tested using the validation data. Specifically, when constructing the model, the actual category of leaf color determined by visual inspection was taken as the dependent variable, and the 19-dimensional multispectral data were taken as the independent variables (Table 1). The projection of each sample on the plane composed of the first and second PCs is shown in Supplemental Fig. S2e. The sample distribution was relatively concentrated, with no cross-mixing observed. The fitting recognition rate for each grade was 100%, 87%, 78%, 100%, and 82%, respectively, with an overall fitting recognition rate of 89%. The best fit was observed for classes A and D, while the fit for classes C and E was relatively poor. After 200 permutation tests, the intersection points between the Q2 regression line and the vertical axis was less than zero (Supplemental Fig. S2f), again suggesting that the model was stable without over-fitting. Thus, our model was more accurate than either the RGB-based or HSL-based models, and the root-mean-square error (RMSE) was lower. The number of main factors was 4, the independent variable fitting index (R2X) was 0.98, the dependent variable fitting index (R2Y) was 0.48, and the model prediction index (Q2) was 0.43. In this case, Q2 is close to 0.5, indicating this model is better than the above-mentioned ones.
Based on the disparate components of different spectra, our data was highly heterogeneous. Such heterogeneity can improve the accuracy of model-based identification. Here, we combined visible light color parameters and multispectral data to construct a comprehensive Chinese cabbage leaf color identification model. The actual category of leaf color determined by visual inspection was taken as the dependent variable, and the 25-dimensional RGB, HSL, and multispectral data were taken as the independent variables to establish the PLS-DA model (Table 1). The projection of each sample on the plane composed of the first and second PCs is shown in Supplemental Fig. S2g. The sample distribution was relatively concentrated, with no cross-mixing observed. The fitting recognition rate for each grade was 92%, 92%, 93%, 100%, and 100%, respectively, with an overall fitting recognition rate being 95%. The best fit was observed for classes A and D, while the fit for classes B and C was relatively poor. After 200 permutation tests, the intersection points between the Q2 regression line and the vertical axis was less than zero (Supplemental Fig. S2h), again suggesting that the model was stable without over-fitting. The data fusion model exhibited higher accuracy than any of the single spectral data models, and the RMSE was significantly reduced. The number of main factors was 7, the independent variable fitting index (R2X) was 1, the dependent variable fitting index (R2Y) was 0.66, and the model prediction index (Q2) was 0.55. Thus, this model produced the best fit.
A comprehensive evaluation of the model was conducted using parameters including R2X, R2Y and Q2, and the statistical results are shown in Fig. 4a. Overall, the data fusion-based leaf color identification model was superior to traditional methods, with all models ranked as follows: data fusion model > multispectral data model > HSL color parameter model > RGB color parameter model. Subsequent research was carried out to substitute the spectral data of the validation samples into the PLS-DA model, calculate the leaf color type of the samples, and expand the samples for model identification and validation. By using different spectral parameters as input data, the supervised leaf sample PLS-DA model achieved satisfactory identification of the validation set of leaf samples. Statistical comparisons between manual visual inspection and model-based identification methods are shown in Fig. 4b and Supplemental Table S2. The data fusion model produced the highest overall identification rate (96%), followed by the multispectral model at 95%. Both models were effective in identifying leaf colors and assigning them to correct leaf color categories. In comparison, the RGB-based model produced the lowest overall identification rate (83%), and could not accurately discern between samples with light leaf color (D and E).
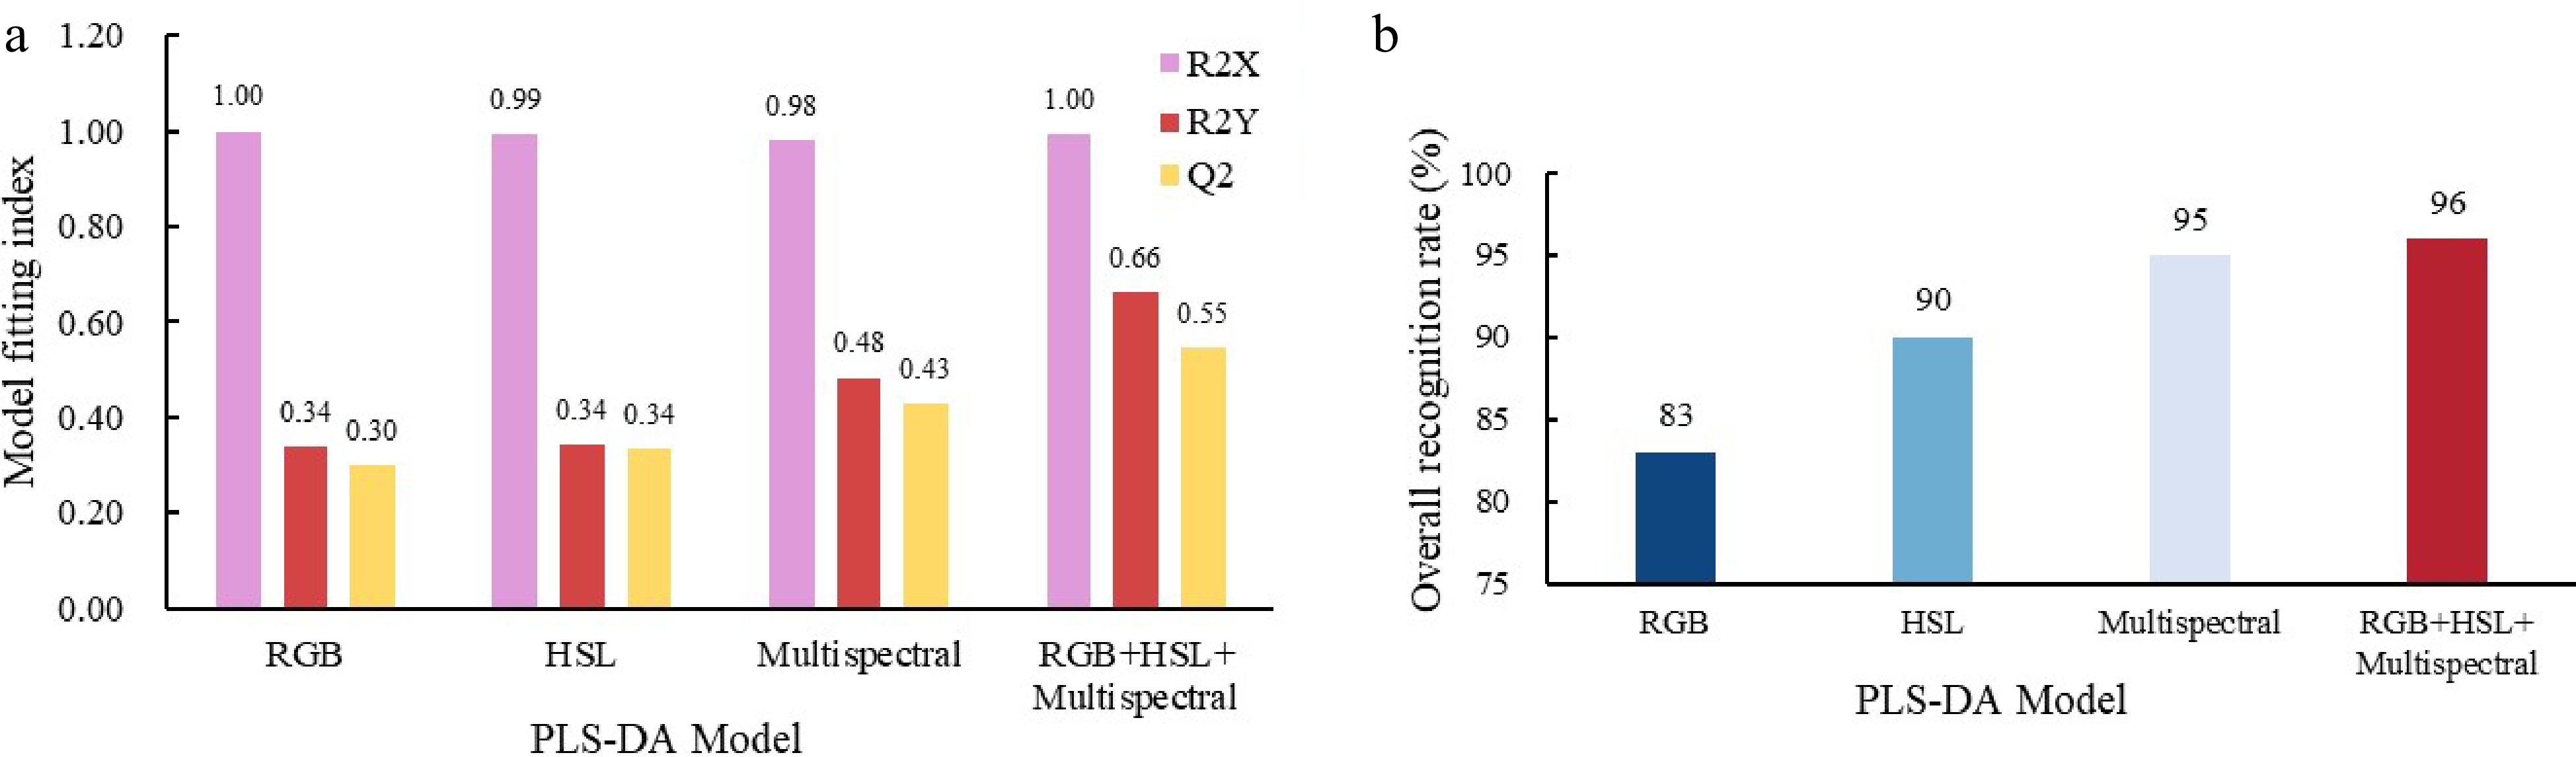
Figure 4.
PLS-DA model parameters. (a) Model fitting index for each sample type on image RGB, HSL color parameters, multispectral data and data fusion. (b) Overall recognition rate of RGB parameters, HSL parameters, multispectral data and data fusion.
In summary, we established a multispectral PLS-DA-based model, which is a supervised classification model based on a training set, with unified identification indicators and strong systematicity. This model can accurately detect and distinguish between Chinese cabbage leaf colors. For instance, the model can accurately determine the leaf color of a single plant, and can also compare the leaf colors of different populations. Thus, our model lays a foundation for the accurate identification of leaf color traits in Chinese cabbage, auxiliary functional gene mining, and biotechnology-based breeding.
Application of data fusion-based PLS-DA model to accurately identify the leaf color of Chinese cabbage
-
In the previous experiment, we used manual visual inspection to classify the leaf colors of the 'F2-449' population. Through bulked-segregant analysis sequencing (BSA-seq) of two extreme phenotype pools, we obtained a candidate genetic locus for dark green leaf color (49,732,120−60,494,964 bp) on chromosome 9 (chr9), which contains a total of 3450 SNP mutations (Table 2 & Fig. 5a). The data fusion-based PLS-DA supervised leaf color identification model was applied to re-identify the 'F2-449' population resulting from the cross of dark green Chinese cabbage '449' and light green Chinese cabbage 'A03'. Because of diverse and subtle variations in leaf color across the F2 isolated populations, the quantification and identification of leaf color phenotypes were very complex.
Table 2. Candidate region statistics.
Leaf color recognition method Chromosome Position SNV number Manual visual inspection Chr 9 49732120-60494964 3450 Data fusion-based PLS-DA leaf color identification Chr 9 53002792-53999899 1539 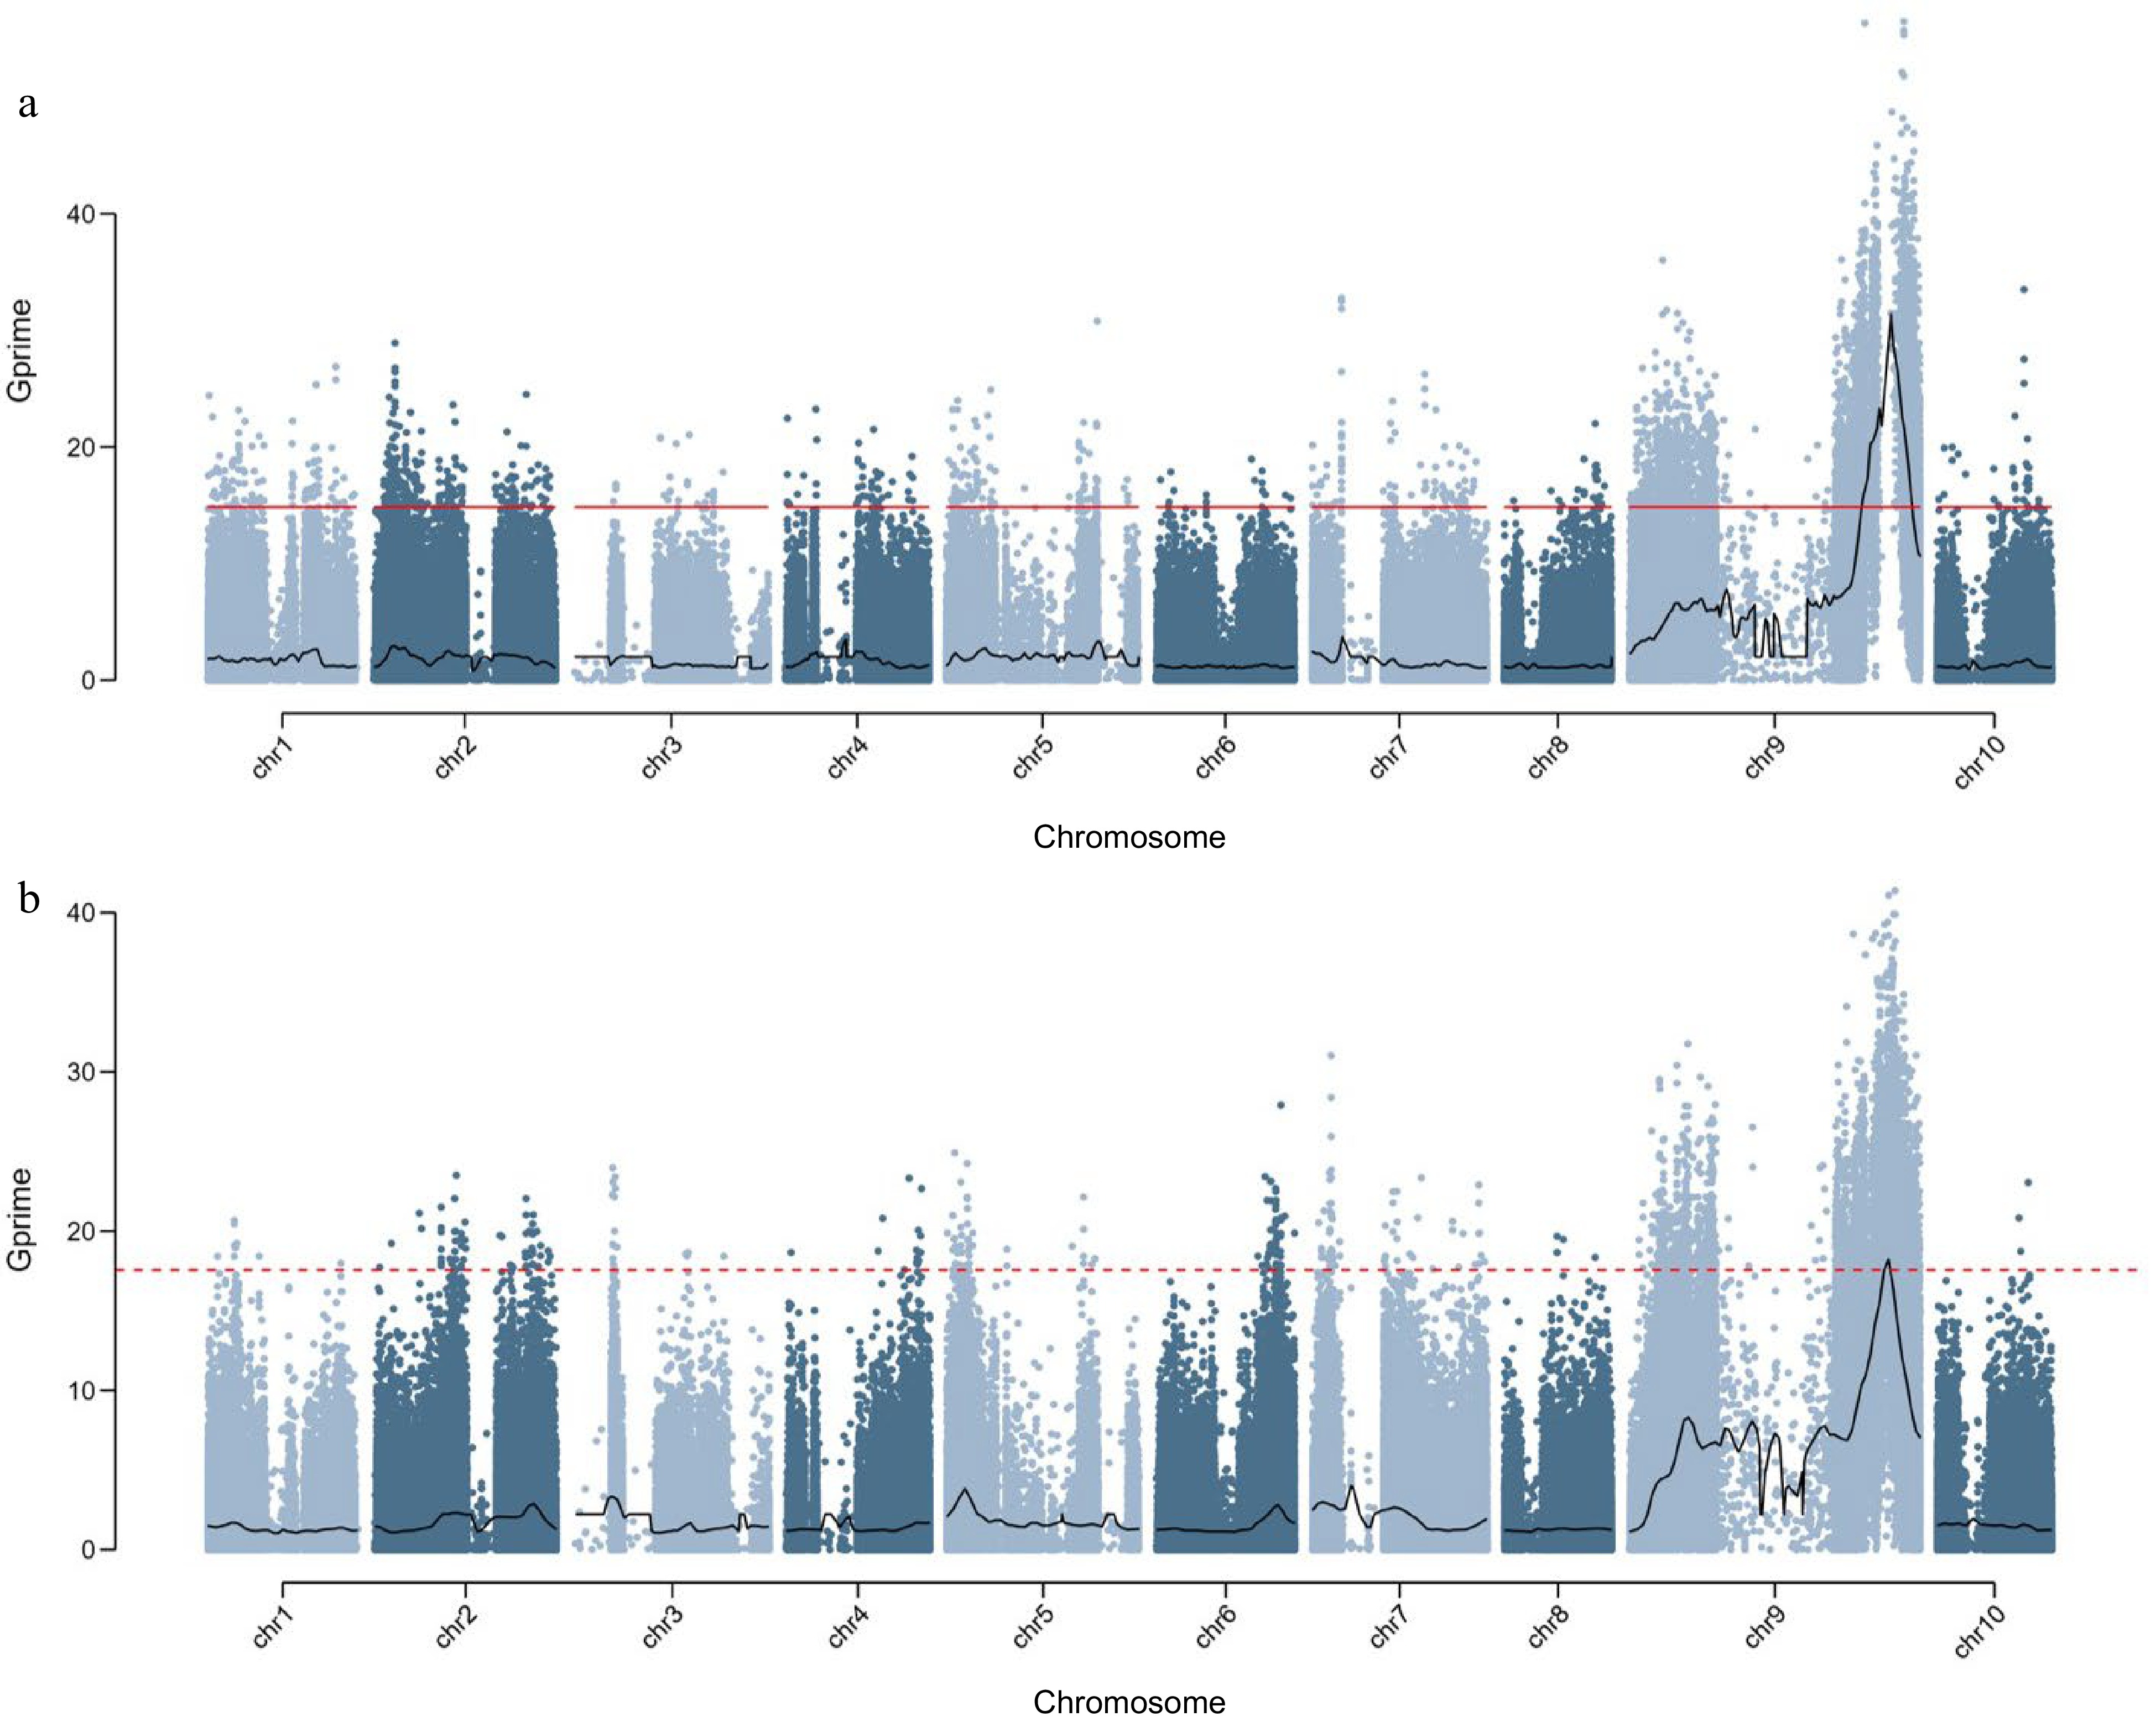
Figure 5.
Display the distribution map of SNP index on chromosomes using Gprime's computational model. The Gprime analysis results of BSA sequencing for identifying 'F2-449' population leaf color classification results based on (a) visual inspection and (b) PLS-DA fusion model (b).
Samples of 'F2-449' population leaves were collected and imaged using VideometerLab 4, and the color parameters and multispectral data were extracted (Supplemental Table S3). The coefficient of variation for HSL saturation (S) was 28%, the coefficient of variation for the multispectral data at 590 nm and 630 nm was 15%, and the coefficient of variation for the green (G) RGB channel was 13%. Overall, the population was differentiated of leaf color, indicating that the spectral data were available.
The data fusion-based PLS-DA leaf color identification model was used to evaluate and identify the leaf color of the 'F2-449' population (Supplemental Fig. S3). The leaf color of the 450 'F2-449' plants was classified from shallow to deep (A−E). Leaf color tended to be concentrated between classes B−D, of which C accounted for 29%, B accounted for 25%, and D accounted for 24%. The extreme dark green phenotype (E) accounted for 14% and the extreme light green phenotype class (A) accounted for 8%.
Based on the identification results of the F2 isolated population, BSA mixed-pool sequencing was carried out by combining reference genome splicing data and parental re-sequencing data. The interval with the largest ratio was defined as the candidate genomic interval related to the dark green leaf phenotype, located between 53,002,792 and 53,999,899 on chr9, with 1539 detected SNPs (Table 2). The Gprime analysis results is shown in Fig. 5b. Notably, the candidate region identified using the data fusion-based PLS-DA model was much smaller than that identified using manual observation data. Taken together, these results suggest that the data fusion-based PLS-DA model is more accurate in identifying subtle differences in leaf colors and has significant potential for the precision breeding of Chinese cabbage.
-
The accurate determination and comparison of phenotypes is essential for plant molecular breeding and functional genomics study[25]. Traditional visual inspection methods can discern between Chinese cabbage leaf colors to some extent. However, they are cumbersome, lack unified classification standards, and are unable to distinguish between subtle phenotypes. As a result, traditional leaf color survey methods are insufficient for the biotechnology-assisted precision breeding of Chinese cabbage.
Recent advances in spectral analysis, AI, and machine vision technology have enabled the development of new powerful tools for leaf color analysis. In fact, most plant phenotypic information can be obtained and analyzed through spectral imaging processing[26]. In this study, we explored the feasibility of classifying Chinese cabbage leaf color utilizing two aspects of color depth: visible light digital camera imaging and multispectral imaging. Based on visible light imaging, the RGB and HSL color parameters of random samples were obtained. A K-means algorithm was used to classify random samples based on RGB and HSL color parameters. The matching rate between the visible light imaging classification results and manual visual leaf color classification results was 80% and 87%, respectively, consistent with the accuracy reported in a study by Kendal et al.[27] that quantified human perception of plant color and color difference using digital images. Our analyses showed that the random leaf color samples were distributed discretely in the RGB and HSL color spaces. Dark-colored samples exhibited obvious separation while light-colored samples did not exhibit a significant separation, with some degree of overlap, in the RGB space. In contrast, different leaf color samples were clearly separated in HSL space, with the S and L axes being obviously separated. However, no separation was observed for the H axis, which may be due to the consistency of H between subtly different samples. Taken together, these results illustrate that the visible light color parameters of leaves can be used to classify leaf color, and that the leaf color of individual samples can be determined based on these color parameters.
RGB images only record information related to the R, G, and B bands, resulting in the loss of a considerable amount of spectral reflection information[28,29]. In order to improve the accuracy of leaf color identification, we conducted a multispectral feature analysis of Chinese cabbage leaves. The spectral curve of Chinese cabbage leaves exhibited obvious and highly different absorption peaks in the 500−700 nm and NIR bands, which may have resulted from different chlorophyll absorption of different leaves. A K-means clustering analysis was conducted on the average reflectivity of 19 spectral channels. The matching rate between the multispectral classification results and the manual visual leaf color classification results was 91%, suggesting that multispectral data can more accurately classify and discern Chinese cabbage leaf color than visible light imaging data, especially considering that the spectral characteristics of differently-colored Chinese cabbage leaves are significantly different.
Optimization of PLS-DA model for subtle leaf color identification based on spectral phenotype
-
Traditional phenotypic identification methods have the disadvantages, such as a tedious identification process, destructive sampling, and large errors. However, our study demonstrates that both visible light-based color parameters and multispectral data can be effectively utilized to identify and classify Chinese cabbage leaf color phenotypes. Similar to the challenges faced by Zhang[30] in studying the multispectral characteristics and quantitative models of Chinese cabbage leaves, our simple unsupervised model based on K-means had limitations in ensuring the category accuracy, lacked a unified scale, and could not compare identification results across different populations. To improve the accuracy and systematicity of the model, we employed a PLS machine learning algorithm. Specifically, we used training samples to construct a supervised model and applied it to identify the leaf color of leaves in the validation set samples. In this way, we developed a stable and systematic leaf color identification model for Chinese cabbage.
Taking the RGB, HSL, and multispectral data of the training images as model input variables, different spectral phenotype-based quantitative identification models of Chinese cabbage leaf color were established, all of which could identify dark green Chinese cabbage leaves to some extent. However, in terms of accuracy, the models were ranked as follows: multispectral model (R2Y = 0.48, Q2 = 0.43) > HSL color parameter model (R2Y = 0.34, Q2 = 0.34) > RGB color parameter model (R2Y = 0.34, Q2 = 0.3). The high accuracy of the multispectral model may be attributed to the multispectral imaging system's ability to capture more channel information, which reflects the internal physiological parameters of leaves, such as water content, chlorophyll content, and anthocyanin content. Additionally, multispectral imaging showed a wider range of application scenarios and increased accuracy[27]. In our study, we also applied SG smoothing to the multispectral data, which helps eliminate the influence of noise, leading to improved stability and prediction rates.
Compared to single-sensor leaf color classification models, which are limited by sensor data type, multi-sensor data fusion offers greater potential in leaf color classification[31]. By combining visible light color parameters with multispectral data, we established a PLS-DA model of the classification variable Y of leaf color. The fitting parameters of the model were R2X = 1, R2Y = 0.66, and Q2 = 0.55. Compared to the single parameter model, the data fusion model exhibited stable discrimination performance and higher discrimination accuracy, with an overall recognition rate reaching 96%. The performance of our several quantitative identification models for Chinese cabbage leaf color based on spectral phenotype was also comprehensively evaluated using the model fitting parameters R2X, R2Y, and Q2, as well as each model's comprehensive recognition rate. The results indicate that the data fusion-based Chinese cabbage leaf color identification model was superior to all these quantitative models.
The combination of spectral model and high throughput genome resequencing data
-
In this experiment, the original image and multi-spectral data of Chinese cabbage leaves were obtained by using VideometerLab 4 system. RGB parameters and HSL parameter are extracted from the original image. RGB data, HSL data and multi-spectral data are combined to form 25-dimensional fusion data. PLS-DA models were established with training samples. Comparative analysis shows that the 25 dimensions data fusion model is superior to any other single data model. Through the comprehensive comparison of verification sets, we finally get PLS-DA model for accurate identification of Chinese cabbage leaf color based on multispectral imaging. Based on this model, we accurately identified the leaf color traits of the F2-449 population and applied the results to BSA sequencing.
The efficacy of BSA largely depends on the feasibility of dividing individuals into groups with extreme phenotypes, namely accuracy of phenotypic identification[32,33]. The precise phenotype also depends on the use of new field technologies (such as remote sensing techniques for precise evaluation of secondary traits) and the correct selection, calibration, and application of phenotype instruments (such as neutron probes, radiation sensors, chlorophyll, and photosynthesis meters). This experiment upgraded the recognition ability of dark green leaf color through machine learning, improving the accuracy of evaluating extreme phenotypes. The candidate area for dark green leaf color was reduced from 10.76 Mb manually observed to 1.00 Mb, providing great convenience for subsequent analysis.
-
In this study, we comprehensively compared several Chinese cabbage leaf color identification methods. Identification methods based on RGB, HSL, and multispectral imaging all exhibited good recognition accuracy, with the comprehensive recognition rate of the multispectral imaging method reaching 91%. However, the simple unsupervised classification model based on a K-means algorithm lacks a unified scale and could not compare identification results across different populations. To address this issue, a PLS-DA machine learning algorithm was used to construct and optimize a supervised identification model, and to standardize the results. The fusion of different spectral data was found to improve the identification accuracy of the model. The data fusion-based PLS-DA supervised leaf color phenotype identification model exhibited a Q2 of 0.55, with a comprehensive recognition rate reaching 96%. This recognition rate was 1%−13% higher than that of the single spectral models. The accurate Chinese cabbage leaf color identification model was applied to the 'F2-449' population. The sequencing results of the BSA mixing pool preliminarily identified the candidate genetic locus related to dark green leaf color, located between 53,002,792 and 53,999,899 bp on chromosome 9. Notably, the candidate locus identified using the data fusion-based PLS-DA model was much smaller than that identified using manual observation data.
This work was financially supported by grants from the National Natural Science Foundation of China (32222076, 32272712), the Natural Science Foundation of Hebei (Grant No. C2020204111, C2022204063), the Introduced Oversea Rturness Project of Hebei (Grant No. C20220364).
-
The authors declare no conflict of interest. Jianjun Zhao is the Editorial Board member of Journal Vegetable Research. He was blinded from reviewing or making decisions on the manuscript. The article was subject to the journal's standard procedures, with peer-review handled independently of the Editorial Board member and his research groups.
-
# These authors contributed equally: Ziwei Xie, Jinghui Yan, Hao Liang
- Supplemental Fig. S1 (a) Multispectral K-means clustering center spectrogram of leaf color samples. (b) Comparison between the original spectrum after SNV processing and the spectrum after SG smoothing.
- Supplemental Fig. S2 PLS-DA model based on image RGB (a, b) and HSL (c, d) color, multispectral data (e, f) and data fusion (g, h).
- Supplemental Fig. S3 The proportion of leaf color types in ‘F2-449’ population.
- Supplemental Table S1 K-means clustering results of Chinese Cabbage leaves.
- Supplemental Table S2 The results of leaf color grade identification of Chinese cabbage leaves in the validation set based on PLS-DA model.
- Supplemental Table S3 Leaf color spectral data of ‘F2-449’ population.
- Copyright: © 2023 by the author(s). Published by Maximum Academic Press, Fayetteville, GA. This article is an open access article distributed under Creative Commons Attribution License (CC BY 4.0), visit https://creativecommons.org/licenses/by/4.0/.
-
About this article
Cite this article
Xie Z, Yan J, Liang H, Yue X, Su X, et al. 2023. PLS-DA model for accurate identification of Chinese cabbage leaf color based on multispectral imaging. Vegetable Research 3:25 doi: 10.48130/VR-2023-0025 

PLS-DA model for accurate identification of Chinese cabbage leaf color based on multispectral imaging
- Received: 24 April 2023
- Accepted: 28 July 2023
- Published online: 05 September 2023
Abstract: Chinese cabbage (Brassica rapa L. ssp. pekinensis), a leafy vegetable, exhibits a range of leaf colors, with the dark green varieties being favored by consumers. Manual visual identification of Chinese cabbage leaf color phenotypes is subjective and it is difficult to distinguish between subtle differences in leaf color, posing challenges for precision breeding. In this study, we constructed a partial least squares discriminant analysis (PLS-DA) leaf color identification model and compared four classification methods for leaf color, namely red, green, and blue (RGB) channels, hue, saturation, and lightness (HSL) color space, multi-spectrum and data-fusion. The PLS-DA supervised leaf color phenotype identification model based on data fusion can improve the recognition rate by 1%−13% compared to a single spectral model. To further validate the model, we conducted a bulked segregant analysis (BSA) of a mixed pool of a Chinese cabbage F2 population (F2-449) using whole-genome sequencing. The candidate locus related to dark green leaf color was reduced by 9.76 Mb compared to the manual visual inspection which provides convenience for the localization of candidate genes. Therefore, the development of a precise phenotypic identification system for Chinese cabbage that can distinguish subtle leaf color differences using high-throughput phenotype analysis technology is of great significance and agricultural practical value for the mining of high-throughput genomic data.
-
Key words:
- Chinese cabbage /
- Leaf color /
- Multi-spectrum /
- PLS-DA