


-
Maternal transgenerational effects significantly influence the phenotypic traits of the offspring, encompassing factors such as nutrition, hormones, gut microbiota, and epigenetic regulation[1−4]. As oviparous animals, chickens rely solely on the nutrition provided by the egg post-separation from the mother, rendering maternal effects critical from the embryonic to early developmental stages in chicks. However, the patterns of these changes remain largely unexplored[5]. Our previous research identified the chicken liver as a target organ influenced by maternal effects at both the transcriptional and epigenetic levels[6,7]. The liver, being the most crucial metabolic organ in chickens, facilitates fat and protein metabolism, as well as the storage of vitamins and minerals, playing a pivotal role in hematopoiesis and glucose and lipid metabolism during embryonic development[8]. Yet, systematic analyses of the transcriptional diversity in the liver across generations, from breeders to embryos to offspring, are scarce.
During the reprogramming process of avian embryonic development, epigenetic modifications of specific genes can undergo aberrations. Mutations in genes encoding epigenetic regulatory proteins may also occur. These changes represent critical phases where maternal effects are exerted[9]. Epigenetics plays a significant role in regulating complex cellular networks. They are involved in key physiological processes such as chromatin assembly and mRNA splicing. The distribution of epigenetic regulators within both the cytoplasm and nucleus is closely associated with their mechanisms of action[10,11]. Notably, genes are intimately linked to embryogenesis and development, with maternally inherited LncRNAs being abundantly present in early embryos[9]; in chicken embryos, there is a marked increase in the expression of mRNA during developmental stages, suggesting that maternal effect contributes to maintaining pluripotency in stem cells and plays a role in embryonic development[6]. Furthermore, studies indicate that the duration of maternal effects in birds is relatively short[12], which may be closely related to the efficiency of early chick development. However, the changes in marker genes involved in this process and the underlying mechanisms remain largely unclear.
In the production cycle of broiler breeders, individuals entering the late laying phase exhibit significant declines in egg production and increased body fat deposition, impacting liver lipid metabolism and other metabolic pathways[13]. By contrast, during rapid cell division and differentiation, the liver of hatching chicken embryos showcases an efficient energy metabolism system and biosynthesis activities, laying the foundation for subsequent life stages[14]. Furthermore, at 21 d post-hatch, during a period of rapid growth, the liver's functions in energy and protein/amino acid metabolism, lipid metabolism adjustment, vitamin and mineral storage, and immune regulation are crucial to support this growth rate[15].
To delve into the temporal and spatial variations in the liver transcriptomes of broiler chickens at different developmental stages and identify key transcription factors associated with economic traits, particularly metabolic efficiency, this study analyzed 23 high-throughput RNA-Seq libraries from liver tissue samples of AA strain broiler breeders, offspring at the E19 embryonic stage, and 21-day-old post-hatch offspring. Through this approach, we aim to gain a deeper understanding of the functional changes in the liver across developmental stages and their potential impacts on overall health and productivity, thereby uncovering key gene expression patterns that influence liver health and metabolic characteristics.
-
The experiment utilized late-laying 57-week-old broiler breeders and their male broiler offspring, ROSS 308, raised under standardized conditions at the Meat Chicken Science and Technology Backyard (Zhuozhou, China). At the end of 65 weeks, liver samples were collected from eight selected broiler breeders. Fertilized eggs were collected, and incubated, and only male offspring chicks were used in this study. Samples were taken on the 19th day of embryonic development for collection and sex determination (seven were selected), and chicks were raised until the age of 21 d, at which point liver samples from eight selected individuals were collected. The samples were immediately frozen in liquid nitrogen and stored at −80°C for further analysis. The experimental workflow is illustrated in Fig. 1.
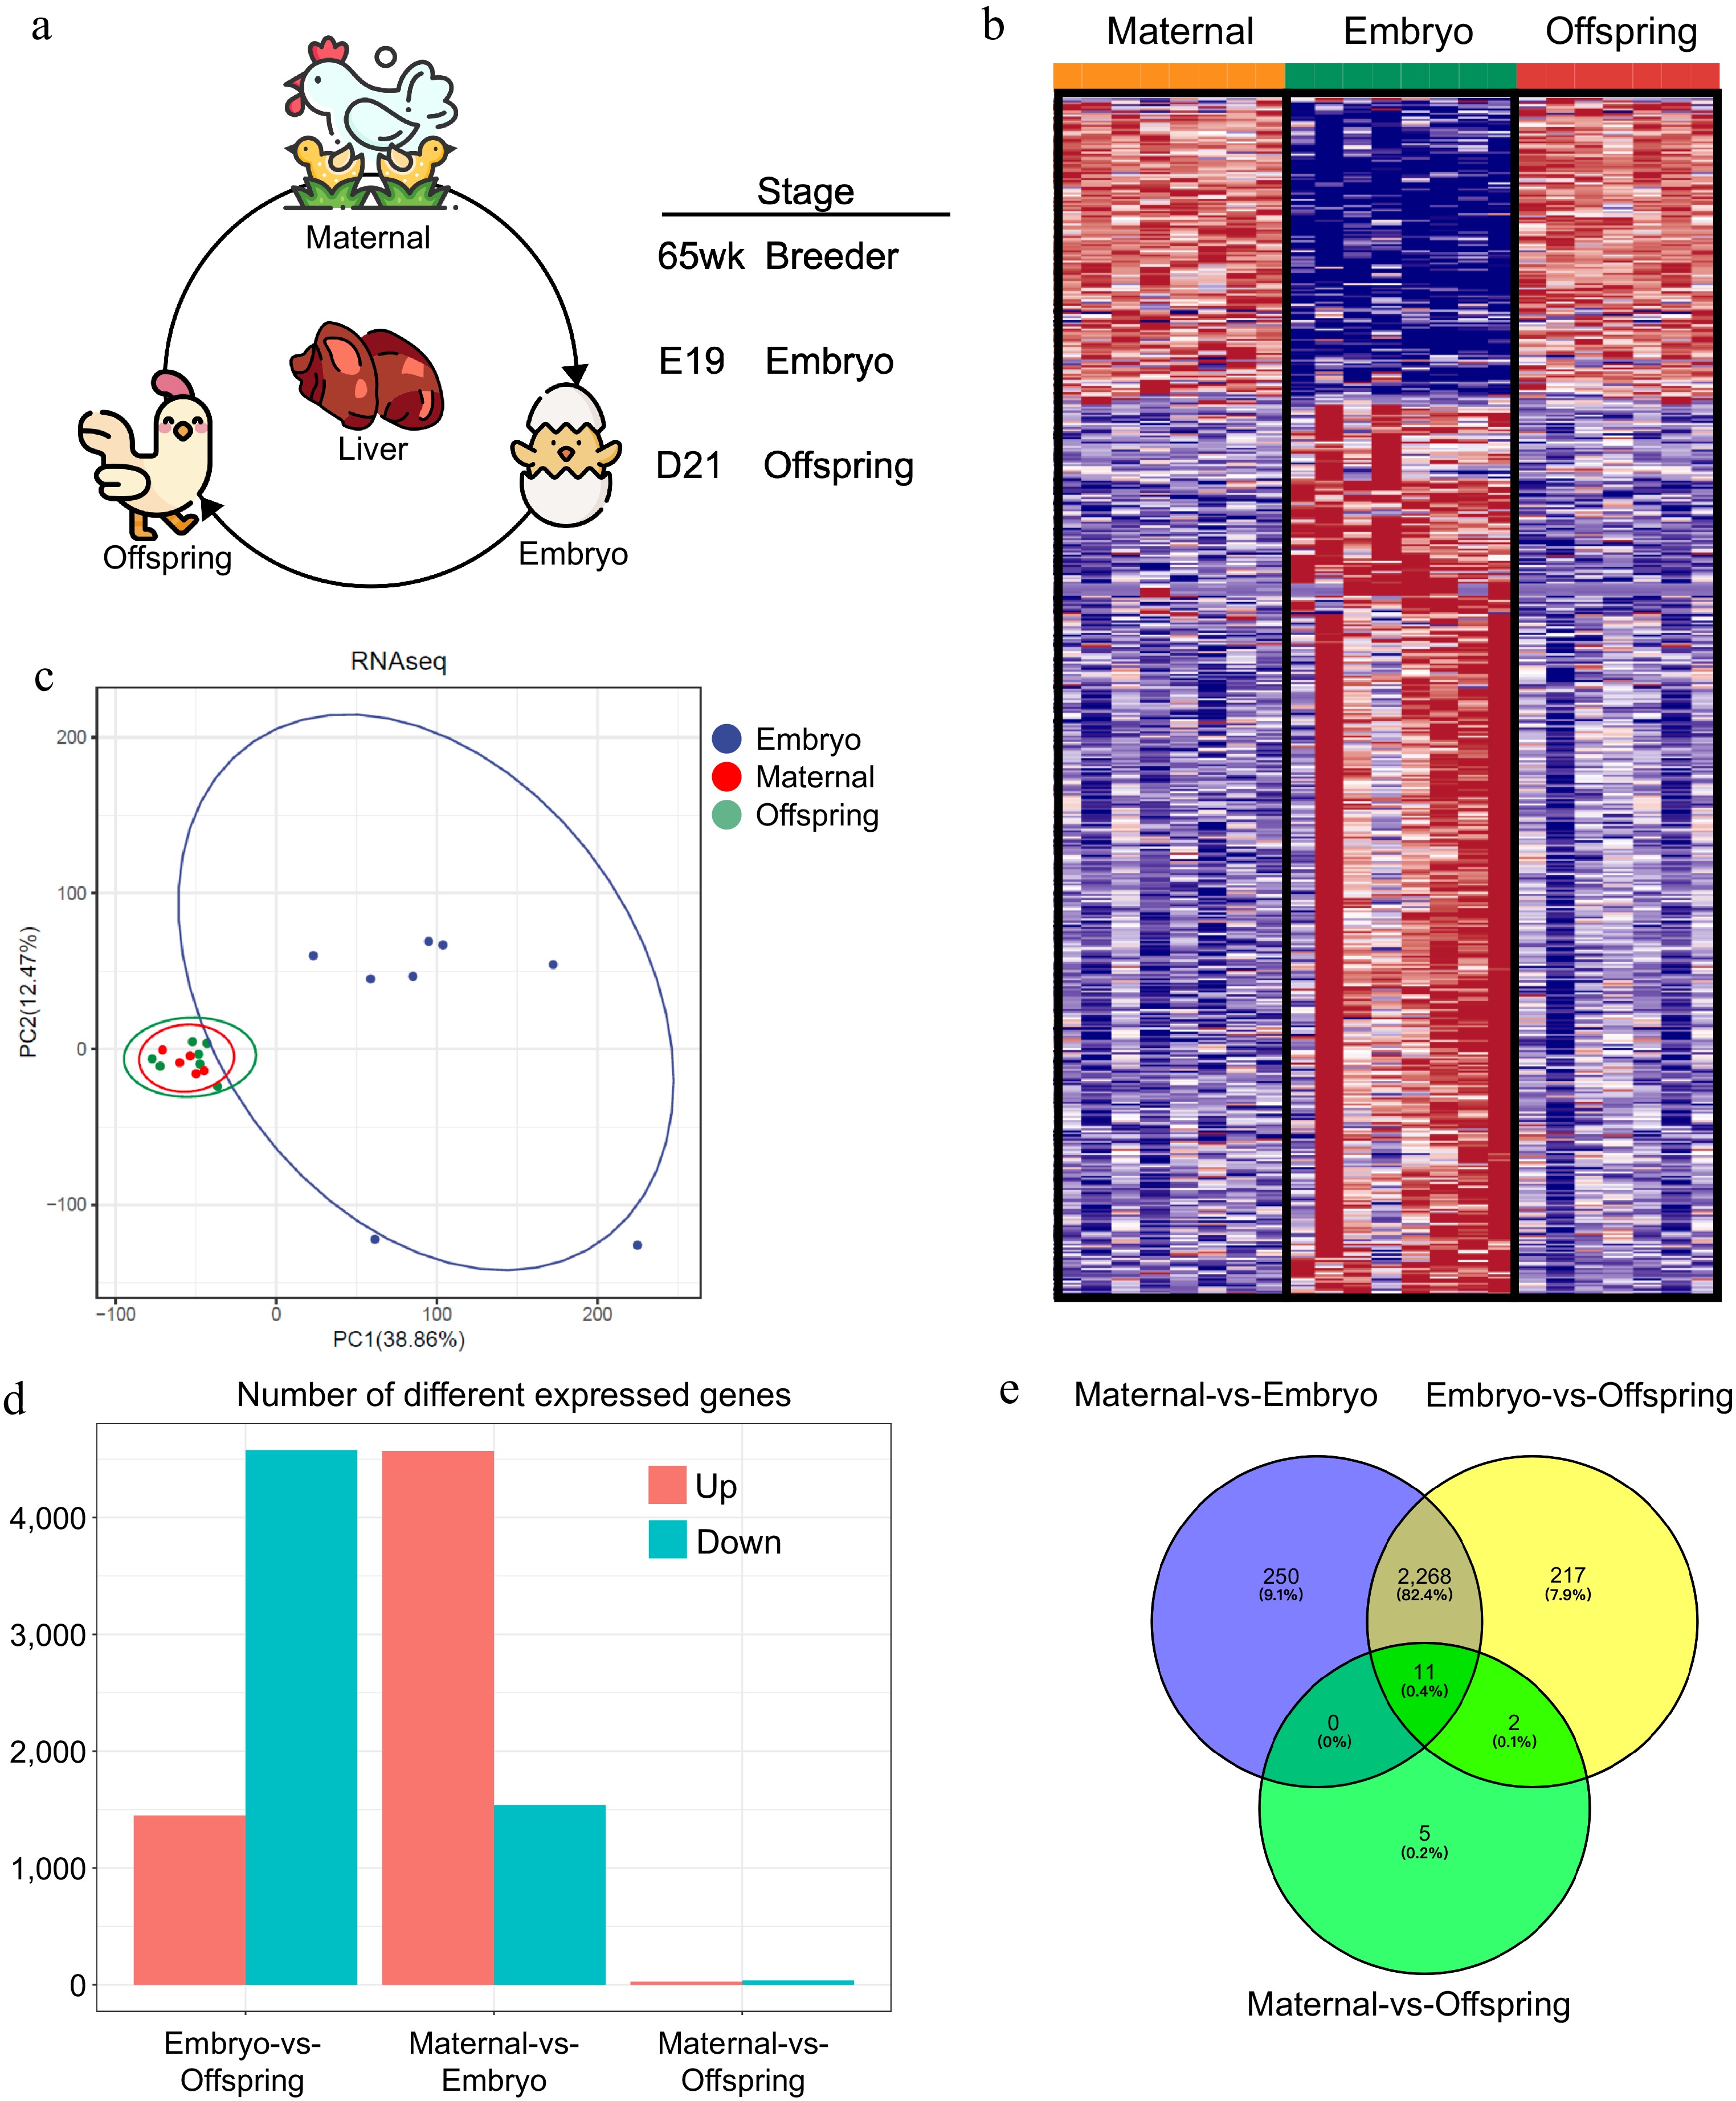
Figure 1.
Liver transcriptome profiles of maternal, embryo, and offspring stages. (a) Workflow diagram, (b) differential gene expression profiles across the three stages, (c) PCoA plot of sample distribution, (d) number of differentially expressed genes between stages, (e) Venn diagram of differentially expressed genes.
Total RNA isolation
-
The liver samples were collected and immediately placed in RNase-free centrifuge tubes, followed by rapid freezing in liquid nitrogen. Total RNA isolation was performed using 100 mg tissue samples and 1 mL Trizol reagent (Vazyme #R701), adhering to the protocols provided by the supplier. To evaluate the RNA integrity and purity, a NanoDrop microvolume spectrophotometer (Thermo Fisher, Wilmington, USA) was utilized, following the procedure outlined by Gao et al.[16]. This procedure guaranteed the structural integrity and dependability of the RNA specimens before further examination.
RNA-Seq library construction and sequencing
-
Total RNA that met the criteria, with a RIN value of ≥ 7 as determined by the Agilent 2100 Bioanalyzer, was utilized for mRNA library preparation for sequencing[17]. To precisely quantify the molar concentration of the constructed libraries, qPCR with standards was conducted, employing the KAPA Library Quantification Kit (Cat no. KK4602) as recommended by Illumina, ensuring accurate library loading volumes for sequencing. The libraries were then hybridized to a Flowcell using the TruSeq Rapid PE Cluster Kit on a cBot, followed by clustering on the HiSeq2500 system. This step involves immobilizing the library molecules on Flowcell primers and undergoing bridge PCR amplification before sequencing. Illumina's data collection software managed the sequencing operation.
Gene expression analysis
-
Gene expression differentiation analysis employed DESeq2[18], adhering to the approach outlined by Fan et al.[6]. Differentially expressed genes were identified by setting the criteria to an absolute log2 |fold change| ≥1 and a Q-value ≤ 0.05. To assess the expression correlation among samples, the Pearson correlation coefficient for all gene expression data was calculated. For intra-group comparisons, only Pearson correlation coefficients exceeding 0.80 were considered, denoting superior reproducibility. Prediction pipeline for lncRNA transcripts:(1) Cufflinks were used to assemble the transcripts for each sample. (2) Cuffmerge was used to merge the transcripts predicted from all individuals. (3) The merged transcripts were compared with the known protein-coding transcripts downloaded from Ensembl using Cuffcompare, filtering out lncRNA loci that encode proteins. (4) Transcripts shorter than 200 bp and with fewer than two exons were removed. (5) CNCI was used to predict the coding potential of transcripts, and transcripts with coding potential were removed. (6) BLAST was used to further filter out transcripts with coding potential by comparing them with the NCBI protein database. Based on the FPKM values of lncRNA expression, differential expression analysis between samples was performed using the DEGseq package. The differential lncRNAs were screened using the statistical methods of fold-change (expression difference multiple) and Fisher's exact test.
Functional enrichment analysis
-
Enrichment analysis was executed with the entire genome serving as the background set, focusing on the biological process (BP) category of Gene Ontology (GO) for the functional assessment. GO terms were deemed significant if they achieved a P value < 0.01 and were associated with ≥ 2 genes.
Time analysis
-
Short Time-series Expression Miner (STEM), Using STEM, time-series gene expression data was normalized and analyzed by clustering genes into predefined temporal expression profiles. Parameters such as the number of profiles and FDR correction were set, and the analysis identified significant profiles based on gene expression trends across time points. The results were then visualized, and significant profiles were subjected to Gene Ontology (GO) enrichment analysis to identify related biological processes. Key findings included the identification of gene clusters with distinct temporal expression patterns and their associated GO terms.
-
To delineate the RNA expression profiles involved in liver function during maternal effects in broiler breeders (Fig. 1a,b), high-throughput RNA sequencing generated 185.88 GB of clean data from 23 liver samples, encompassing both maternal and offspring stages, specifically embryos at day 19 of gestation and chicks 21 d post-hatch. Each sample contributed 7.9 GB of clean data, with a Q30 base percentage consistently exceeding 91.71% (Table 1). A total of 19,031 genes were identified across the liver samples. Clean reads were aligned to the reference chicken genome using HISAT, resulting in a mapping success rate between 90.83% and 93.35% (Table 1). The identification of differentially expressed genes (DEGs) was grounded on comparative analyses and their expression levels across the various samples. A comprehensive array of DEGs was identified in the liver tissue (Table 2, Supplementary Fig. S1a). Principal component analysis (PCA) was employed to model the distribution and segregation trends among the maternal, embryonic, and offspring comparison groups, illustrating distinct clustering patterns (Fig. 1c). A Venn diagram further emphasized the shared and unique gene expression alterations occurring across the maternal, embryonic, and offspring stages. When considering these stages as distinct entities, pairwise differential expression analyses revealed that the maternal versus embryonic stages exhibited the highest number of differentially expressed genes, followed by the embryonic versus offspring stages, with the least differential expression observed between the maternal and offspring stages (Fig. 1d, e).
Table 1. RNA-seq read statistics.
Sample name Clean_reads Raw_bases Q20 Q30 GC_content HISAT mapped HISAT Uniquely mapped Breeder1 38362812 11040224580 96.53% 93.16% 51.99% 88.5% 75.78% Breeder2 37847708 10940622840 96.28% 92.59% 56.15% 72.49% 52.58% Breeder3 34672132 9846336276 96.52% 93.10% 51.41% 89.35% 77.37% Breeder4 40482362 11592999936 96.48% 93.04% 51.51% 89.92% 76.84% Breeder5 37196291 10296891108 96.86% 93.68% 49.86% 92.12% 82.17% Breeder6 40958805 12072458664 96.59% 93.12% 59.16% 59.57% 32.85% Breeder7 35709829 10510141572 96.47% 92.96% 56.03% 75.07% 55.02% Breeder8 33669242 9914908752 96.79% 93.69% 51.39% 90.98% 78.82% Embryo1 40485557 11654523972 95.90% 91.83% 52.50% 89.67% 74.26% Embryo2 37432078 11069231292 96.48% 93.04% 51.34% 88.79% 74.68% Embryo3 39065142 11126909556 96.26% 92.59% 51.62% 88.44% 75.25% Embryo4 35508865 10322469360 96.30% 92.65% 51.73% 90.69% 77.44% Embryo5 37076246 10837283688 96.46% 92.94% 52.48% 89.48% 74.28% Embryo6 39932521 11473593264 96.23% 92.53% 51.41% 89.88% 77.24% Embryo7 43619518 12556149732 96.36% 92.82% 51.46% 90.88% 76.31% Embryo8 36859302 10562648292 96.14% 92.44% 53.36% 76.34% 58.07% Offspring1 35823274 10444364028 96.48% 93.12% 50.66% 91.04% 78.7% Offspring2 38678468 11108159496 96.39% 92.82% 53.96% 81.18% 63.04% Offspring3 38105455 11117678544 96.33% 92.70% 55.17% 79.53% 62.3% Offspring4 38509142 11038901832 95.75% 91.71% 51.52% 88.96% 74.73% Offspring5 38362812 11040224580 96.53% 93.16% 51.99% 88.5% 75.78% Offspring6 37847708 10940622840 96.28% 92.59% 56.15% 72.49% 52.58% Offspring7 34672132 9846336276 96.52% 93.10% 51.41% 89.35% 77.37% Table 2. Pairwise comparison of up and downregulated DEGs between maternal, embryo and offspring chickens in liver.
Compare group Down Up Total Liver Maternal-vs-Embryo 1540 4569 6109 Embryo-vs-Offspring 1449 4578 6027 Maternal-vs-Offspring 26 38 64 Differential GO analysis of DEGs in the maternal effect process
-
To further elucidate the characteristic DEGs involved in the liver's role during maternal effects, the top 10 DEGs in the maternal-embryo and embryo-offspring comparisons were identified, including IGFBP1, ABI3BP, DIO3, PDK4, IGFALS, IGF1, among others (Tables 3 & 4). In addition, 2,090 differentially expressed long non-coding RNAs (LncRNAs) were detected, each longer than 1,000 nucleotides (Supplementary Table S1). The distribution of DEGs in the liver are visually depicted in the volcano plots (Fig. 2a).
Table 3. Maternal-vs-embryo Top 10 DEGs.
Gene Log2FC p−value Regulation IGFBP1 −3.4921 < 0.0001 down ABI3BP −4.4975 < 0.0001 down MT3 −4.7465 < 0.0001 down DIO3 −4.8438 < 0.0001 down CHRNA7 −5.4058 < 0.0001 down TTLL2 −5.4702 < 0.0001 down NEGR1 −6.8204 < 0.0001 down SREBF2 −2.9490 6.11E-303 down PDK4 −2.8915 3.08E-300 down IRF1 −3.0829 4.15E-299 down IGFBP1, Insulin-like Growth Factor Binding Protein 1; ABI3BP, ABI Family Member 3 Binding Protein; MT3, Metallothionein 3; DIO3, Deiodinase Iodothyronine Type III; CHRNA7, Cholinergic Receptor Nicotinic Alpha 7 Subunit; TTLL2, Tubulin Tyrosine Ligase Like 2; NEGR1, Neuronal Growth Regulator 1; SREBF2, Sterol Regulatory Element Binding Transcription Factor 2; PDK4, Pyruvate Dehydrogenase Kinase 4; IRF1, Interferon Regulatory Factor 1. Table 4. Embryo-vs-Offspring Top 10 DEGs.
Gene Log2FC p−value Regulation MT3 5.1899 < 0.0001 up ABI3BP 4.5664 < 0.0001 up IGFBP1 4.1745 < 0.0001 up HMGCR −3.1252 < 0.0001 down IGFALS −3.7697 < 0.0001 down IGFBP4 −3.8229 < 0.0001 down FASN −5.1979 < 0.0001 down IGF1 −6.3826 < 0.0001 down CDKN2B −6.4335 < 0.0001 down ELOVL2 −6.2947 < 0.0001 down MT3, Metallothionein 3; ABI3BP, ABI Family Member 3 Binding Protein; IGFBP1, Insulin-like growth factor-binding protein 1; HMGCR, 3-Hydroxy-3-Methylglutaryl-CoA Reductase; IGFALS, Insulin-like growth factor-binding protein; acid labile subunit; IGFBP4, Insulin-like growth factor-binding protein 4; FASN, Fatty Acid Synthase; IGF1, Insulin-like growth factor 1; CDKN2B, Cyclin Dependent Kinase Inhibitor 2B; ELOVL2,ELOVL Fatty Acid Elongase 2. 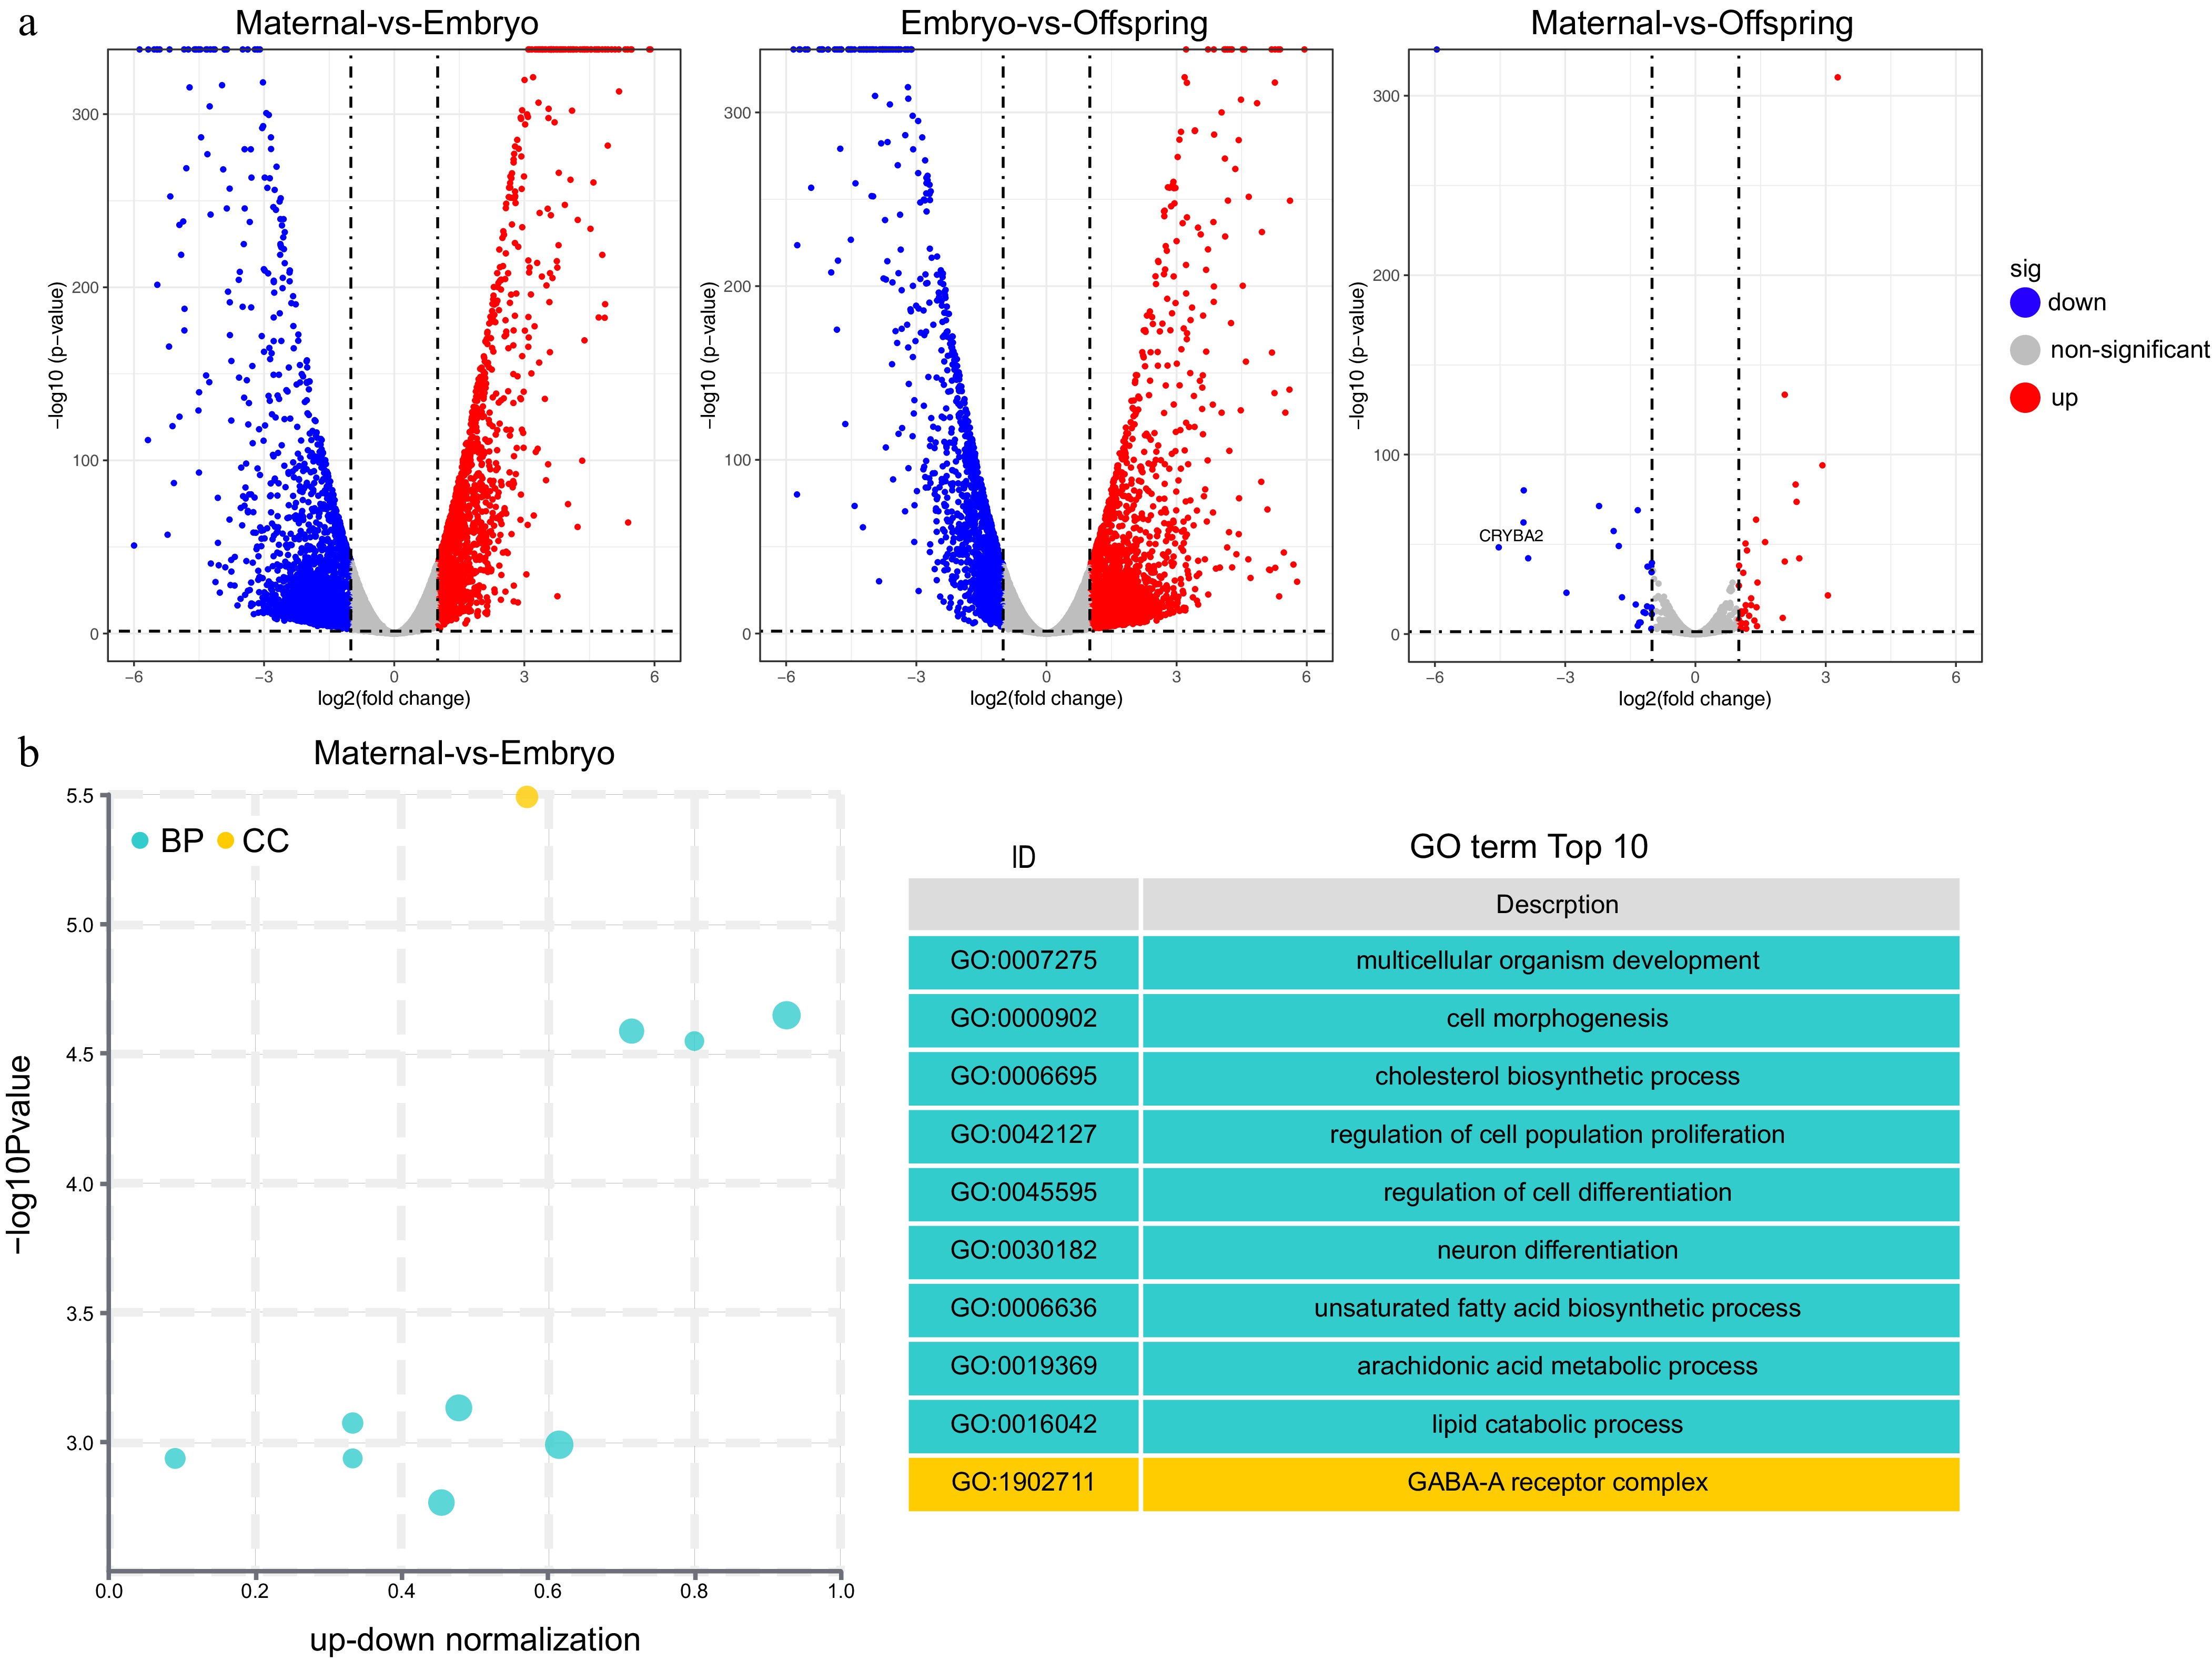
Figure 2.
GO enrichment analysis of differentially expressed genes (DEGs). (a) Volcano plot, (b) top 10 GO pathways enriched in DEGs between maternal and embryo stages. The cyan color represents GO's Biological Process (BP) pathways, while the yellow color represents GO's Cellular Component (CC) pathways.
Enrichment analysis was also performed to pinpoint key genes and pathways implicated in the maternal effect. The liver undergoes a functional transition from cell development and differentiation during the embryonic stage to glucose and lipid metabolism and immune function by the 21-d post-hatch stage. Gene Ontology (GO) enrichment analysis revealed significant biological pathways, including those related to multicellular organism development, synaptic transmission (GABAergic), adherens junction organization, cholesterol biosynthetic process, unsaturated fatty acid biosynthetic process, immune response, and the B cell receptor signaling pathway (Fig. 2b, Fig. 3a & b).
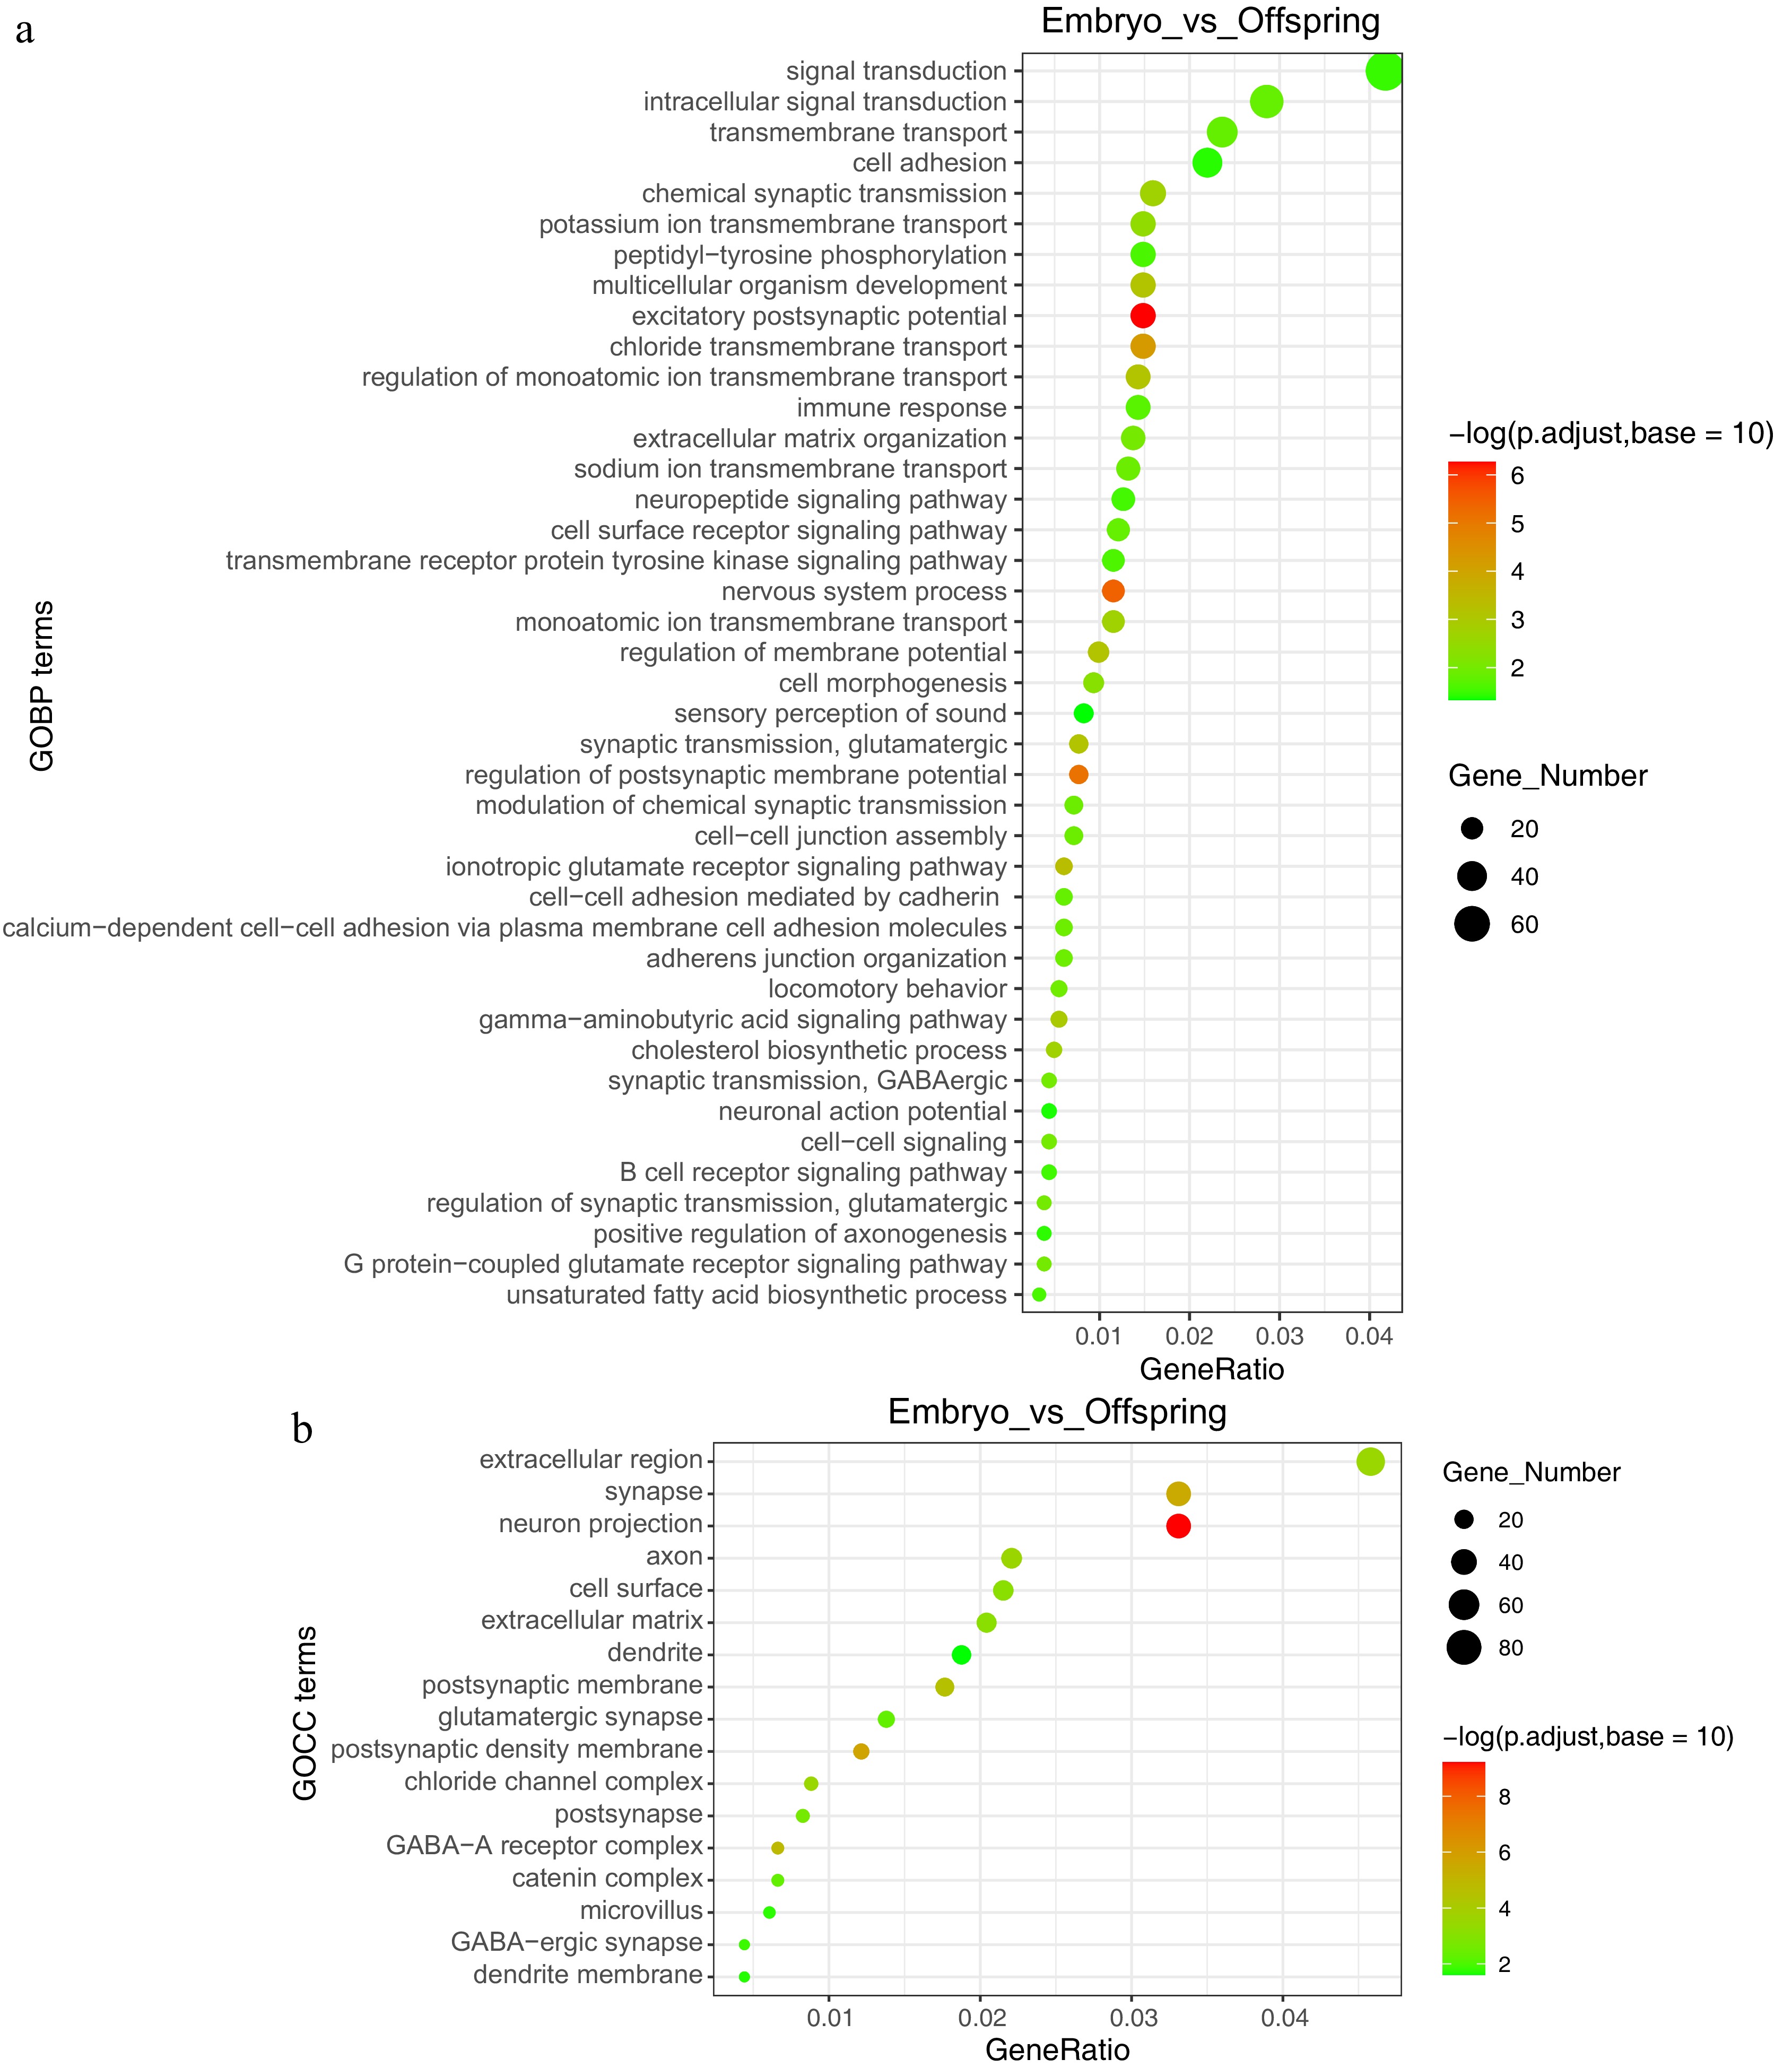
Figure 3.
GO functional annotation analysis of embryo vs offspring stages. (a) Enriched functions at the GOBP (Gene Ontology Biological Process) level, (b) enriched functions at the GOCC (Gene Ontology Cellular Component) level.
Expression patterns of developmentally related genes across three stages
-
Based on the analysis of RNA expression profiles across the three stages, 20 characteristic genes involved in the regulation of cell proliferation and organ development were successfully identified (Fig. 4). Key genes such as IGF1, IGFBP1, IGFBP2, IGFBP4, IGFALS, and HMGCR were significantly upregulated in the liver tissues of both embryos and offspring, with expression levels being particularly higher in the embryonic stage. Additionally, critical genes regulating lipid metabolism, including FASN, ELOVL2, ELOVL5, ELOVL6, SREBF2, ACACA, and CYP7A1 were also found to be significantly upregulated in the liver of both embryos and offspring. A correlation analysis of characteristic target genes (including LncRNAs) across the three stages was conducted to gain deeper insights into the regulatory patterns of maternal effects (Fig. 5, Supplementary Table S2).
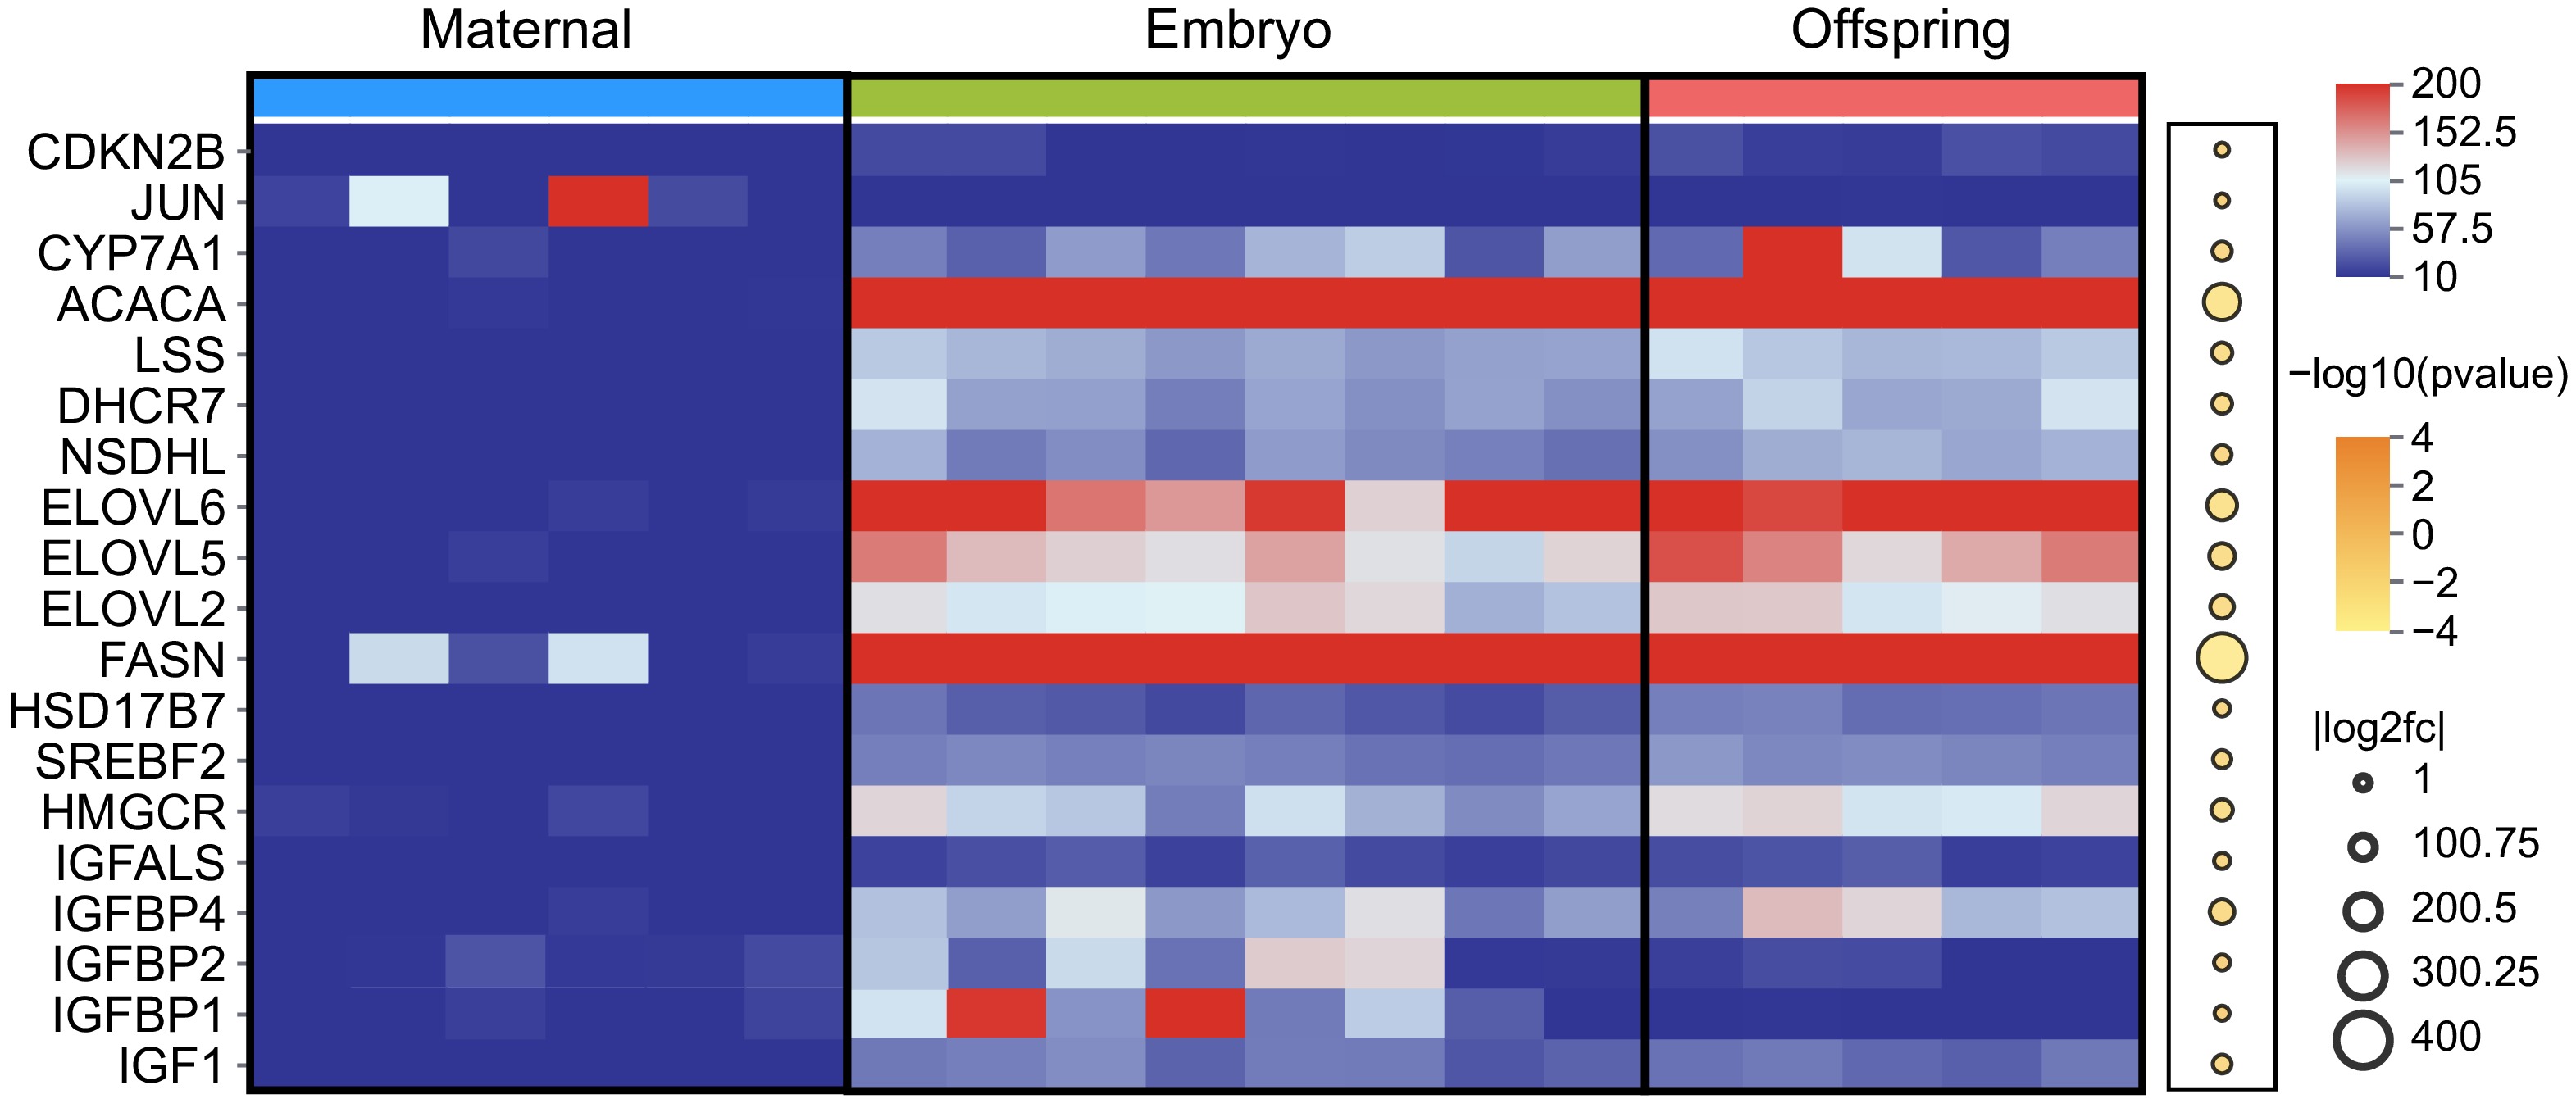
Figure 4.
Expression of DEGs in maternal, embryo, and offspring liver tissues. The red and blue squares represent FPKM values, with darker red indicating higher expression levels. Upregulated DEGs are marked in dark yellow, while downregulated DEGs are shown in white.
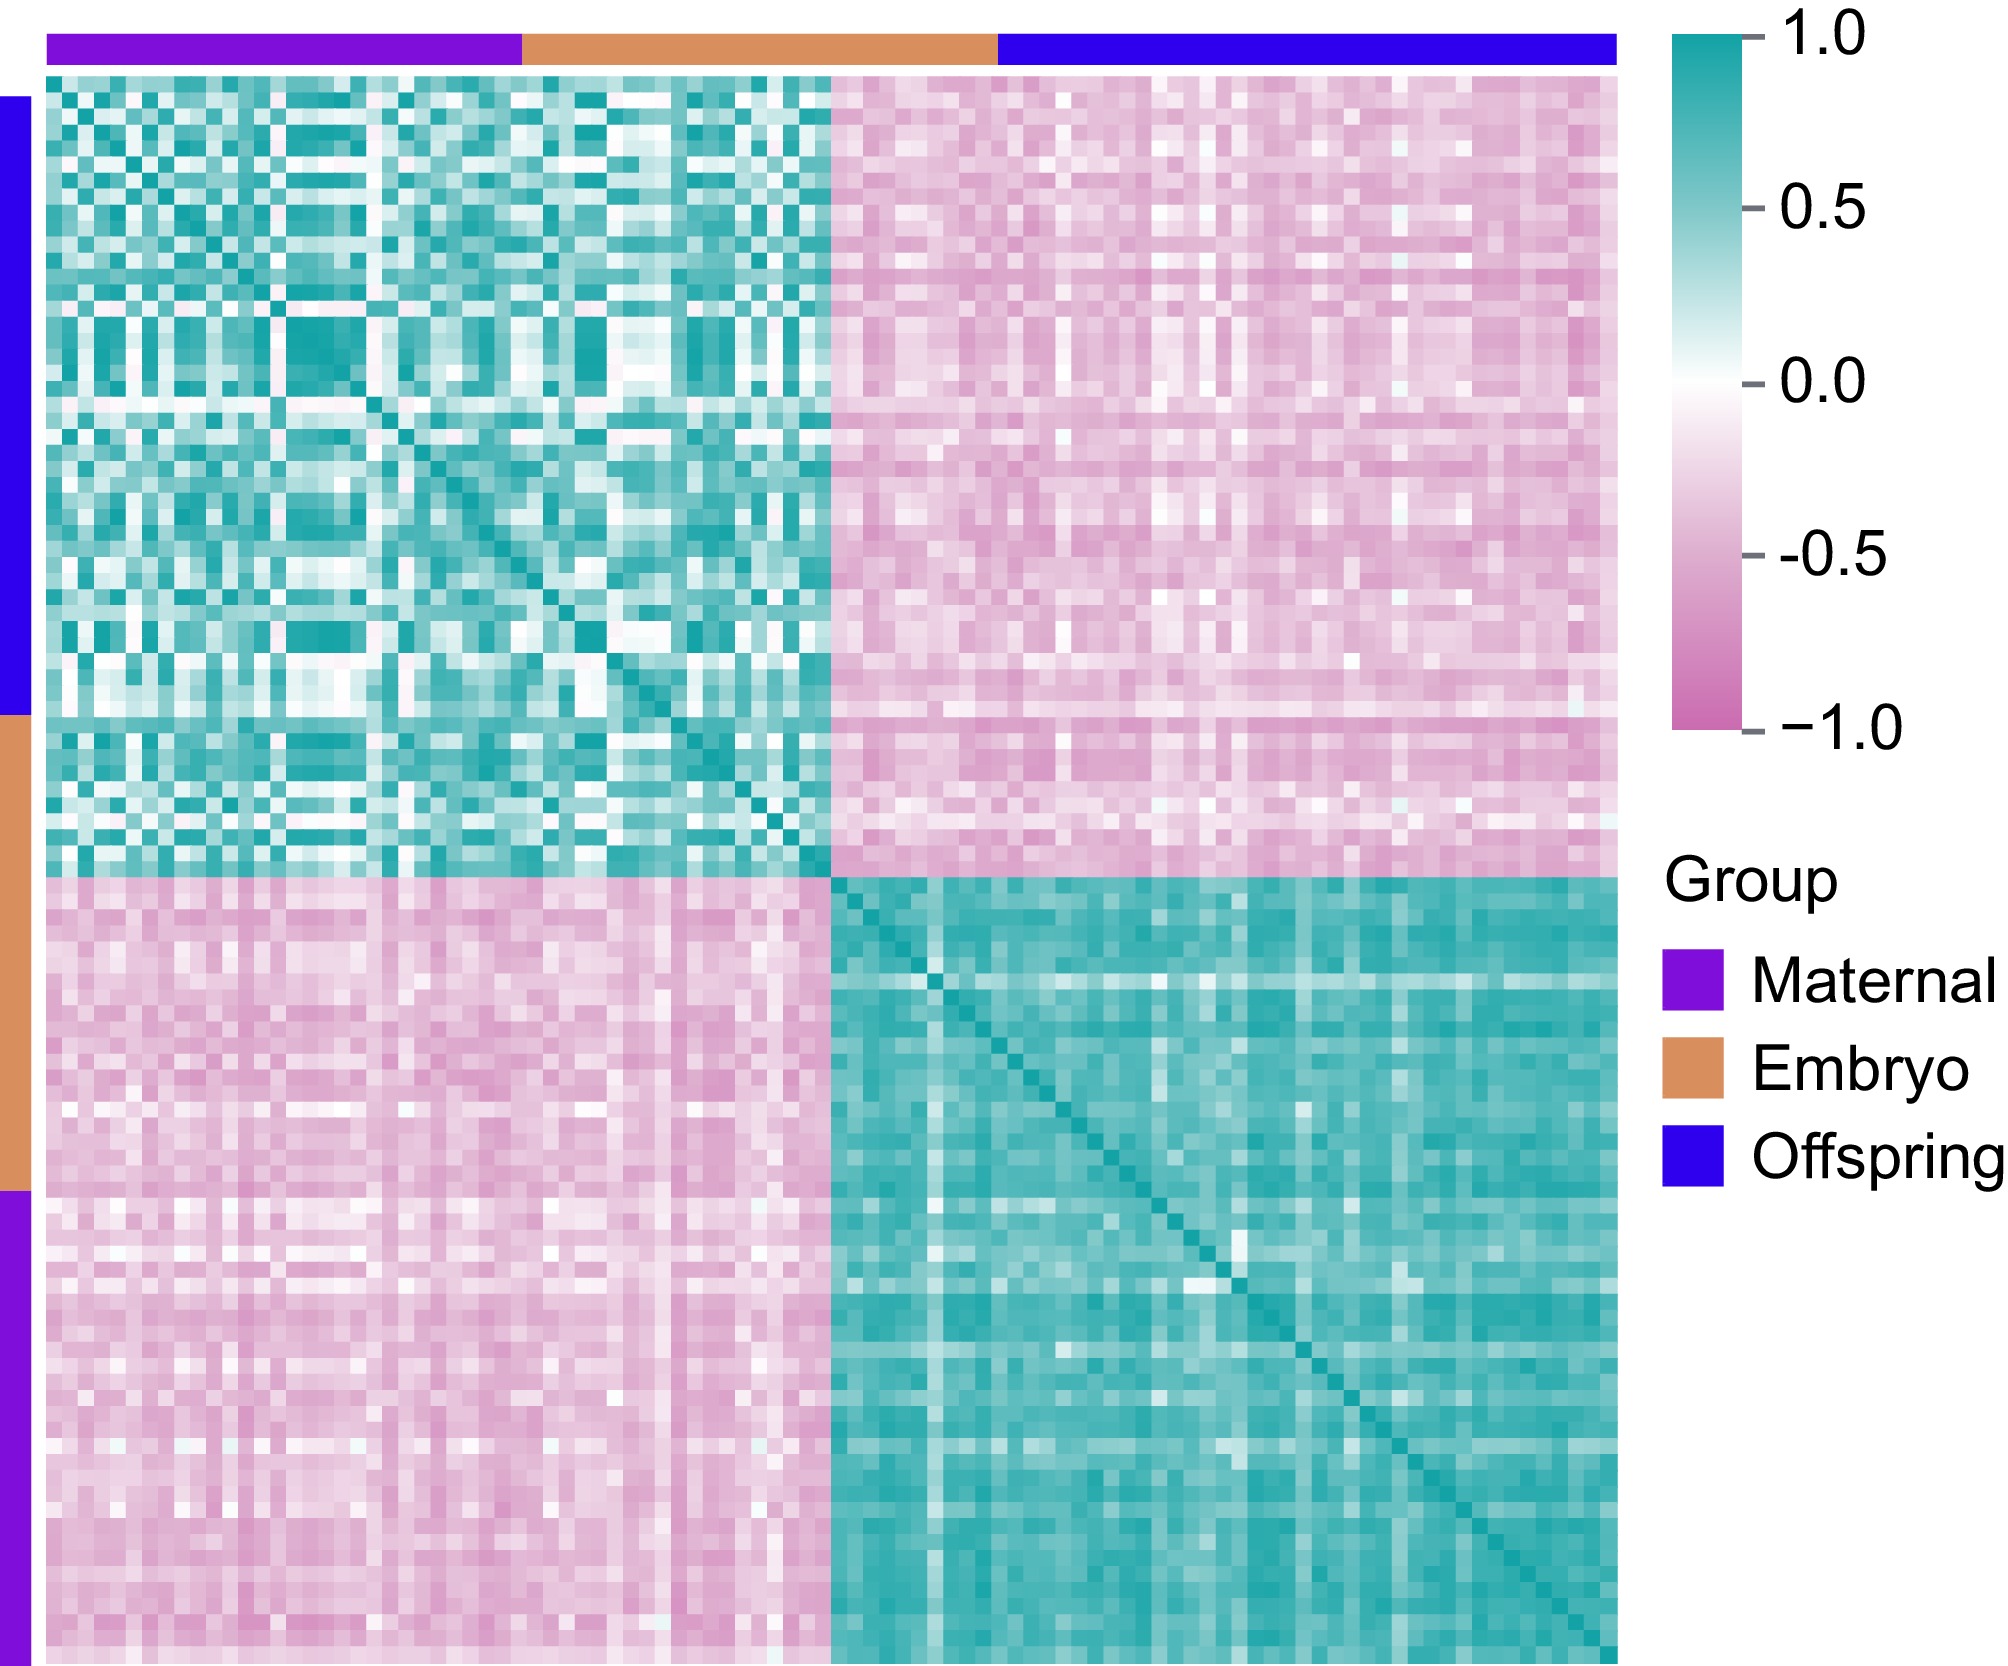
Figure 5.
Correlation analysis of DEGs in maternal, embryo, and offspring stages. Pink represents negative correlations, while cyan indicates positive correlations.
Time analysis of liver function across three developmental stages
-
Time-series analysis was utilized to explore the DEGs across the maternal-embryo-offspring stages, aiming to delineate the dynamic changes in liver mRNA expression profiles influenced by maternal effects (Fig. 6a). By comparing DEGs with a Q value ≤ 0.05 and an absolute log2|fold change| ≥ 1 across the various stages, the DEGs were organized into six distinct clusters, with expression patterns predominantly following 'high-low-high' and 'low-high-low' trends (Fig. 6b).
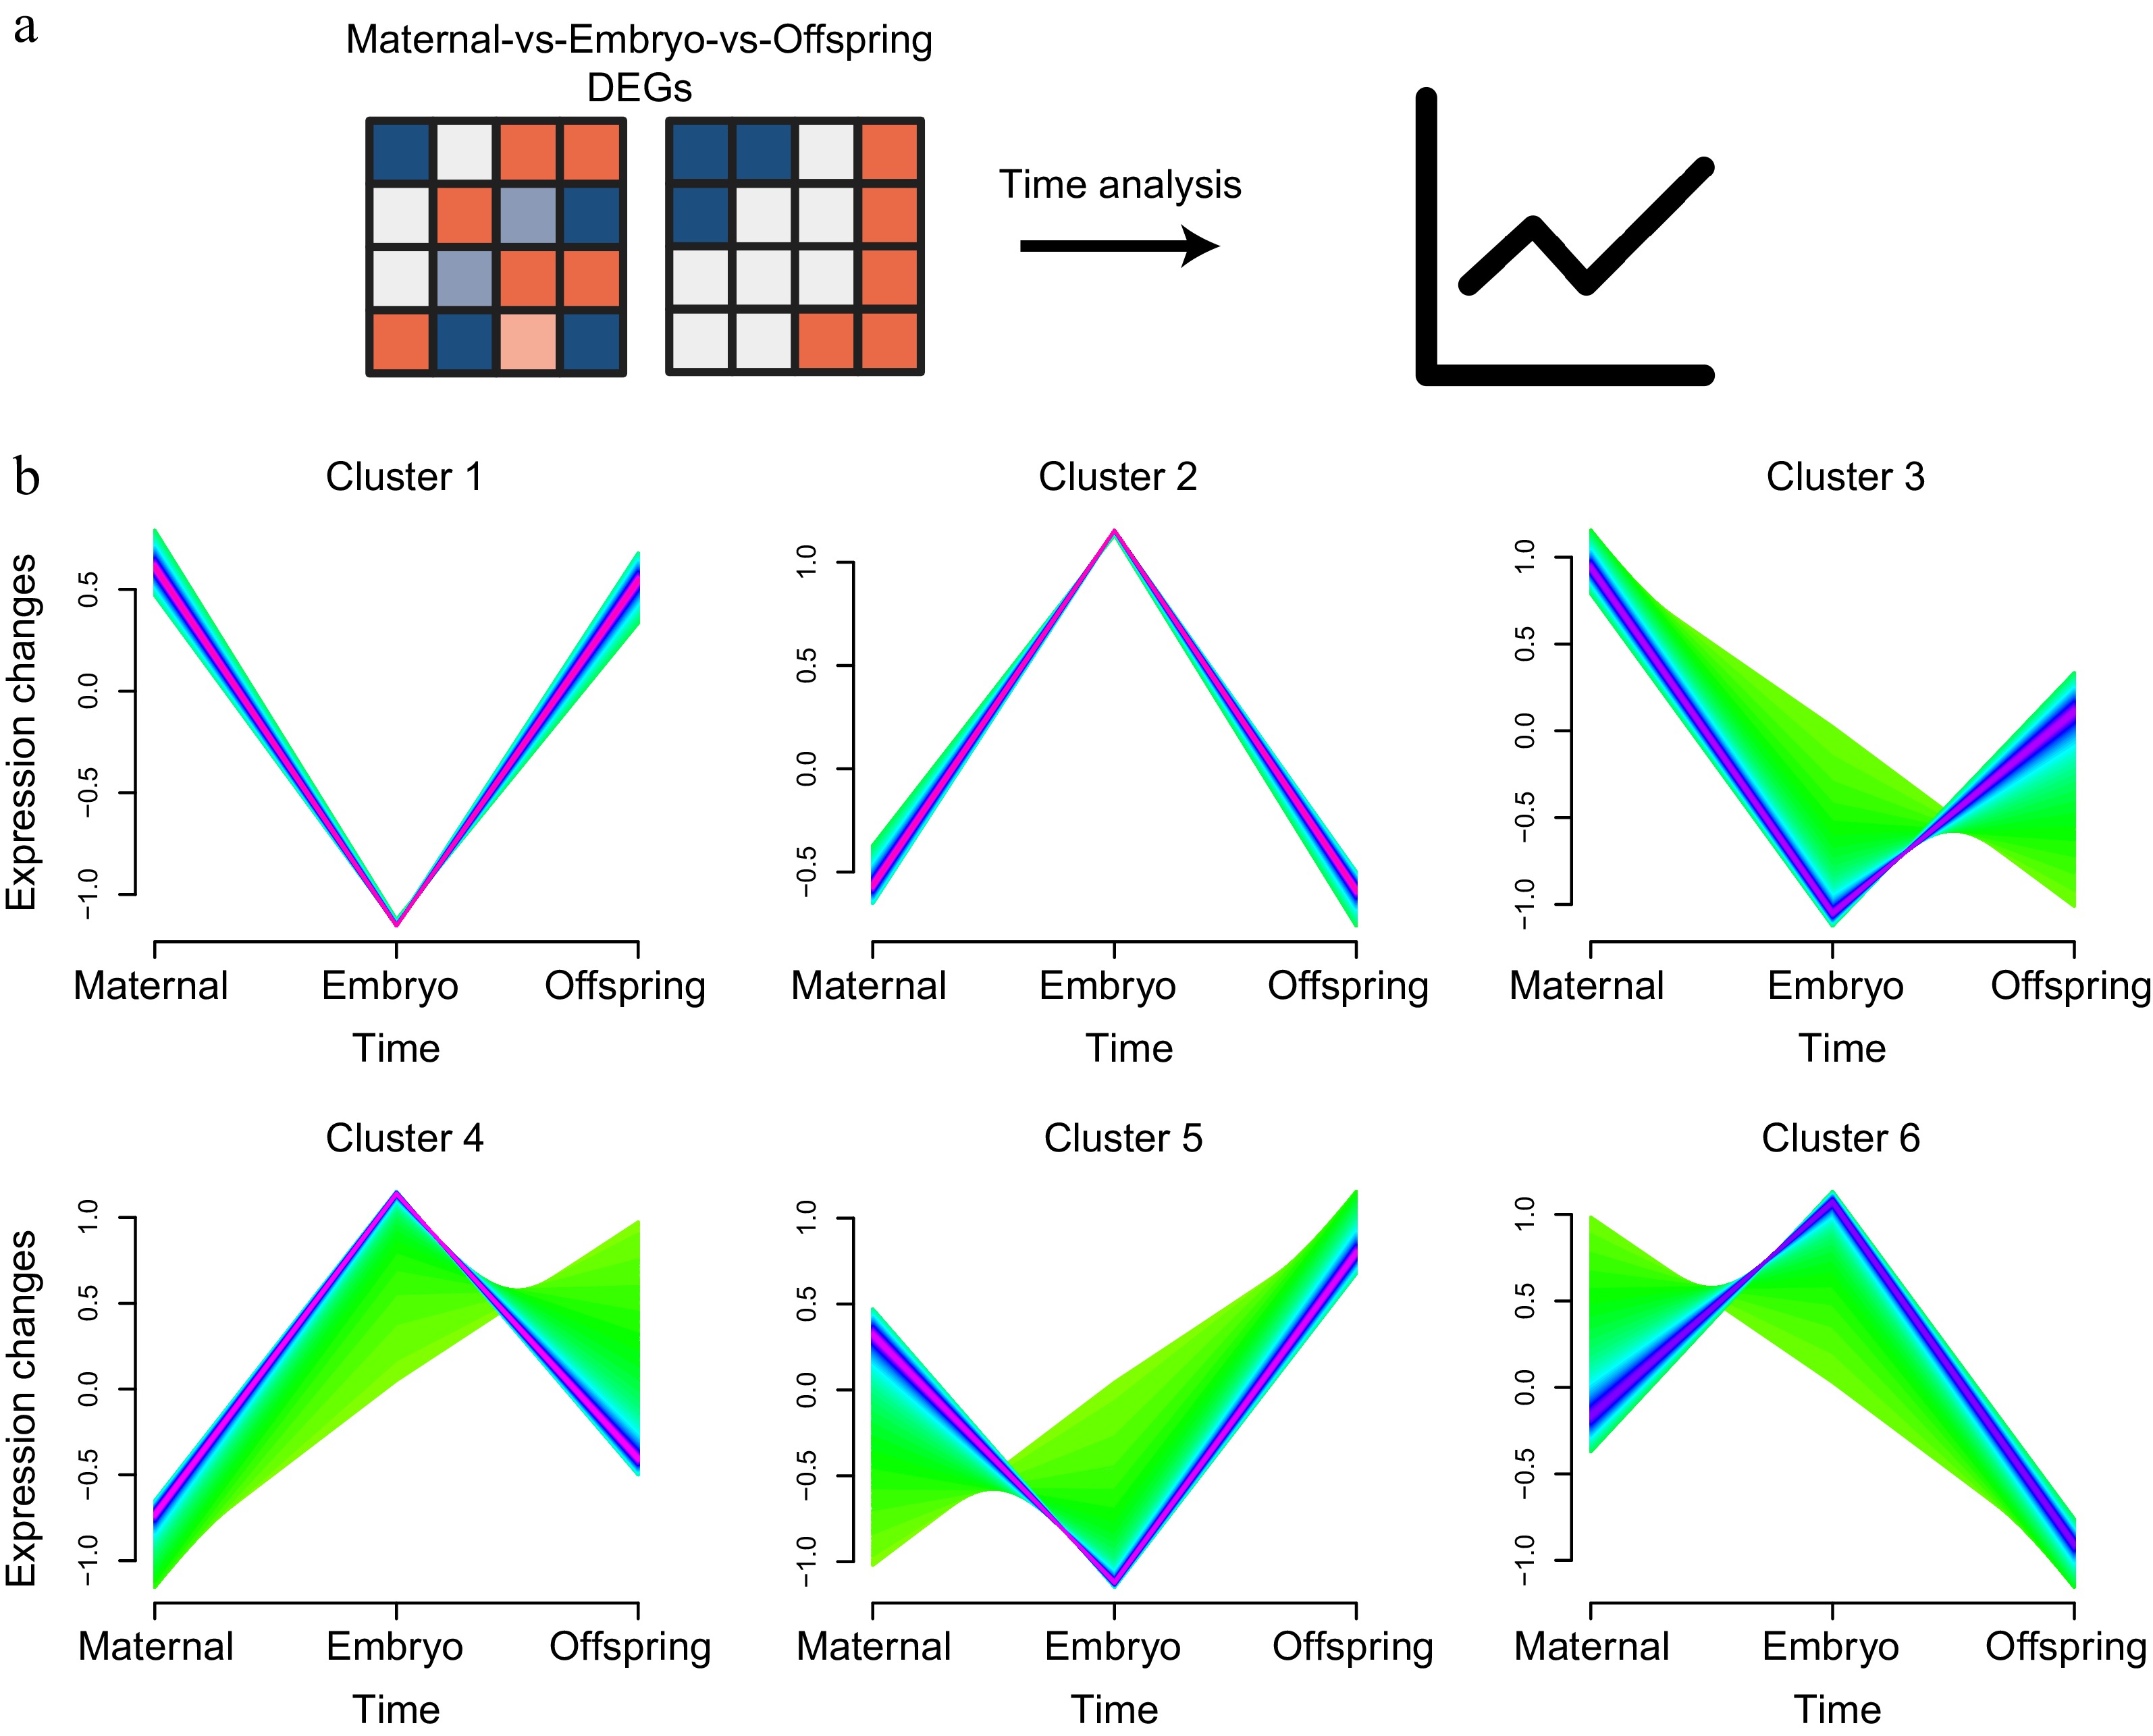
Figure 6.
Time analysis of liver expression profiles across maternal, embryo, and offspring stages. (a) Workflow diagram of the time analysis. (b) Cluster analysis of DEGs across the three stages, showing six distinct clusters.
In Cluster 1, KEGG pathway enrichment analysis revealed a significant association with the 'Toll-like receptor signaling pathway', where key characteristic genes included TLR2, TLR4, TLR5, MyD88, and NF-κB. The 'Lysosome' pathway was also enriched, with CTSD (Cathepsin D) and LAMP1 (Lysosomal Associated Membrane Protein 1) identified as pivotal genes, alongside the 'C-type lectin receptor signaling pathway'. Furthermore, the Gene Ontology (GO) categories in this cluster were significantly enriched for activities such as GTPase activator activity, actin filament binding, small GTPase binding, and protein tyrosine kinase activity (Fig. 7a−c).
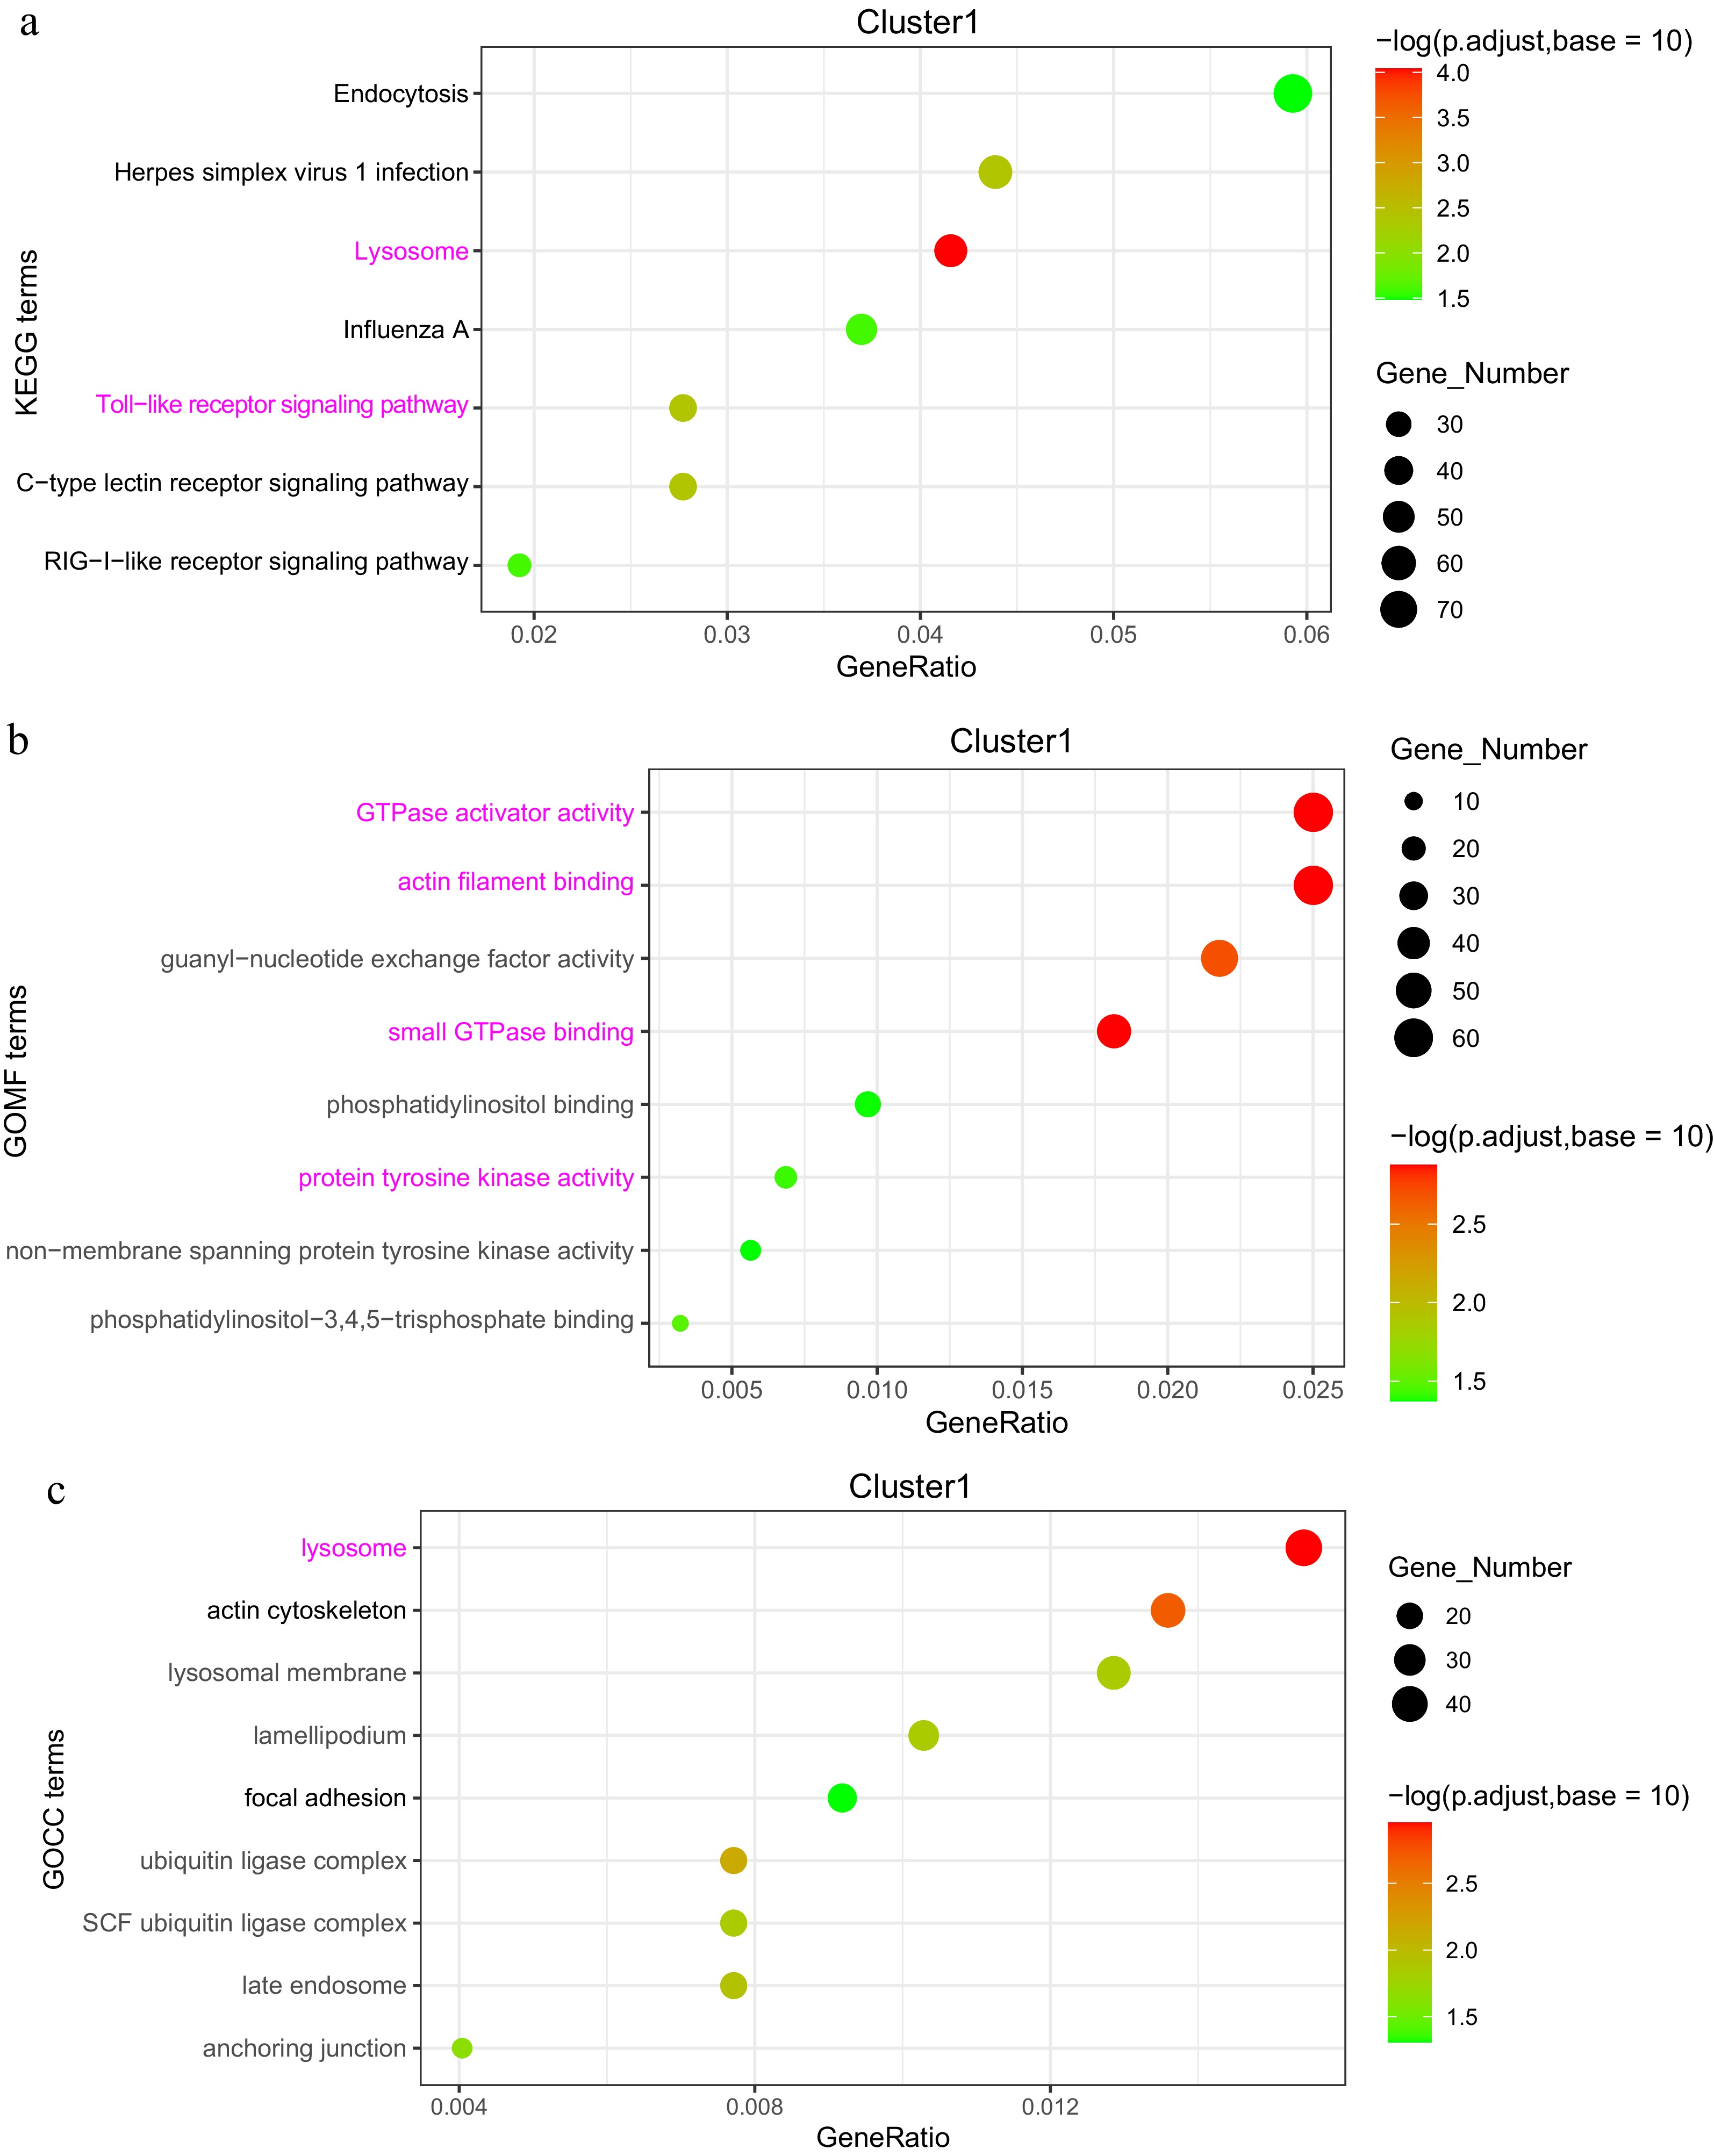
Figure 7.
Analysis of DEGs in the 'high-low-high' expression pattern (Cluster 1). (a) KEGG enrichment analysis of DEGs. (b) GOMF (Gene Ontology Molecular Function) enrichment analysis of DEGs. (c) GOCC (Gene Ontology Cellular Component) enrichment analysis of DEGs.
In Cluster 2, KEGG analysis highlighted enrichment in the 'Neuroactive ligand-receptor interaction' pathway, with GABRA identified as a characteristic gene, as well as in the 'Calcium signaling pathway' and 'ECM-receptor interaction'. GO categories in this cluster were enriched in functions such as 'Calcium ion binding', 'nucleotide binding', 'synapse', 'neuron projection', 'glutamatergic synapse', and 'microtubule cytoskeleton', with TUBB, MAPs, and KIFs identified as key genes (Supplementary Table S3). The remaining four clusters also displayed enrichment in GO categories related to metabolism, development, and immune function, reflecting dynamic processes that occur throughout the maternal-embryo-offspring transition (Fig. 8a−c, Supplementary Fig. S1b).
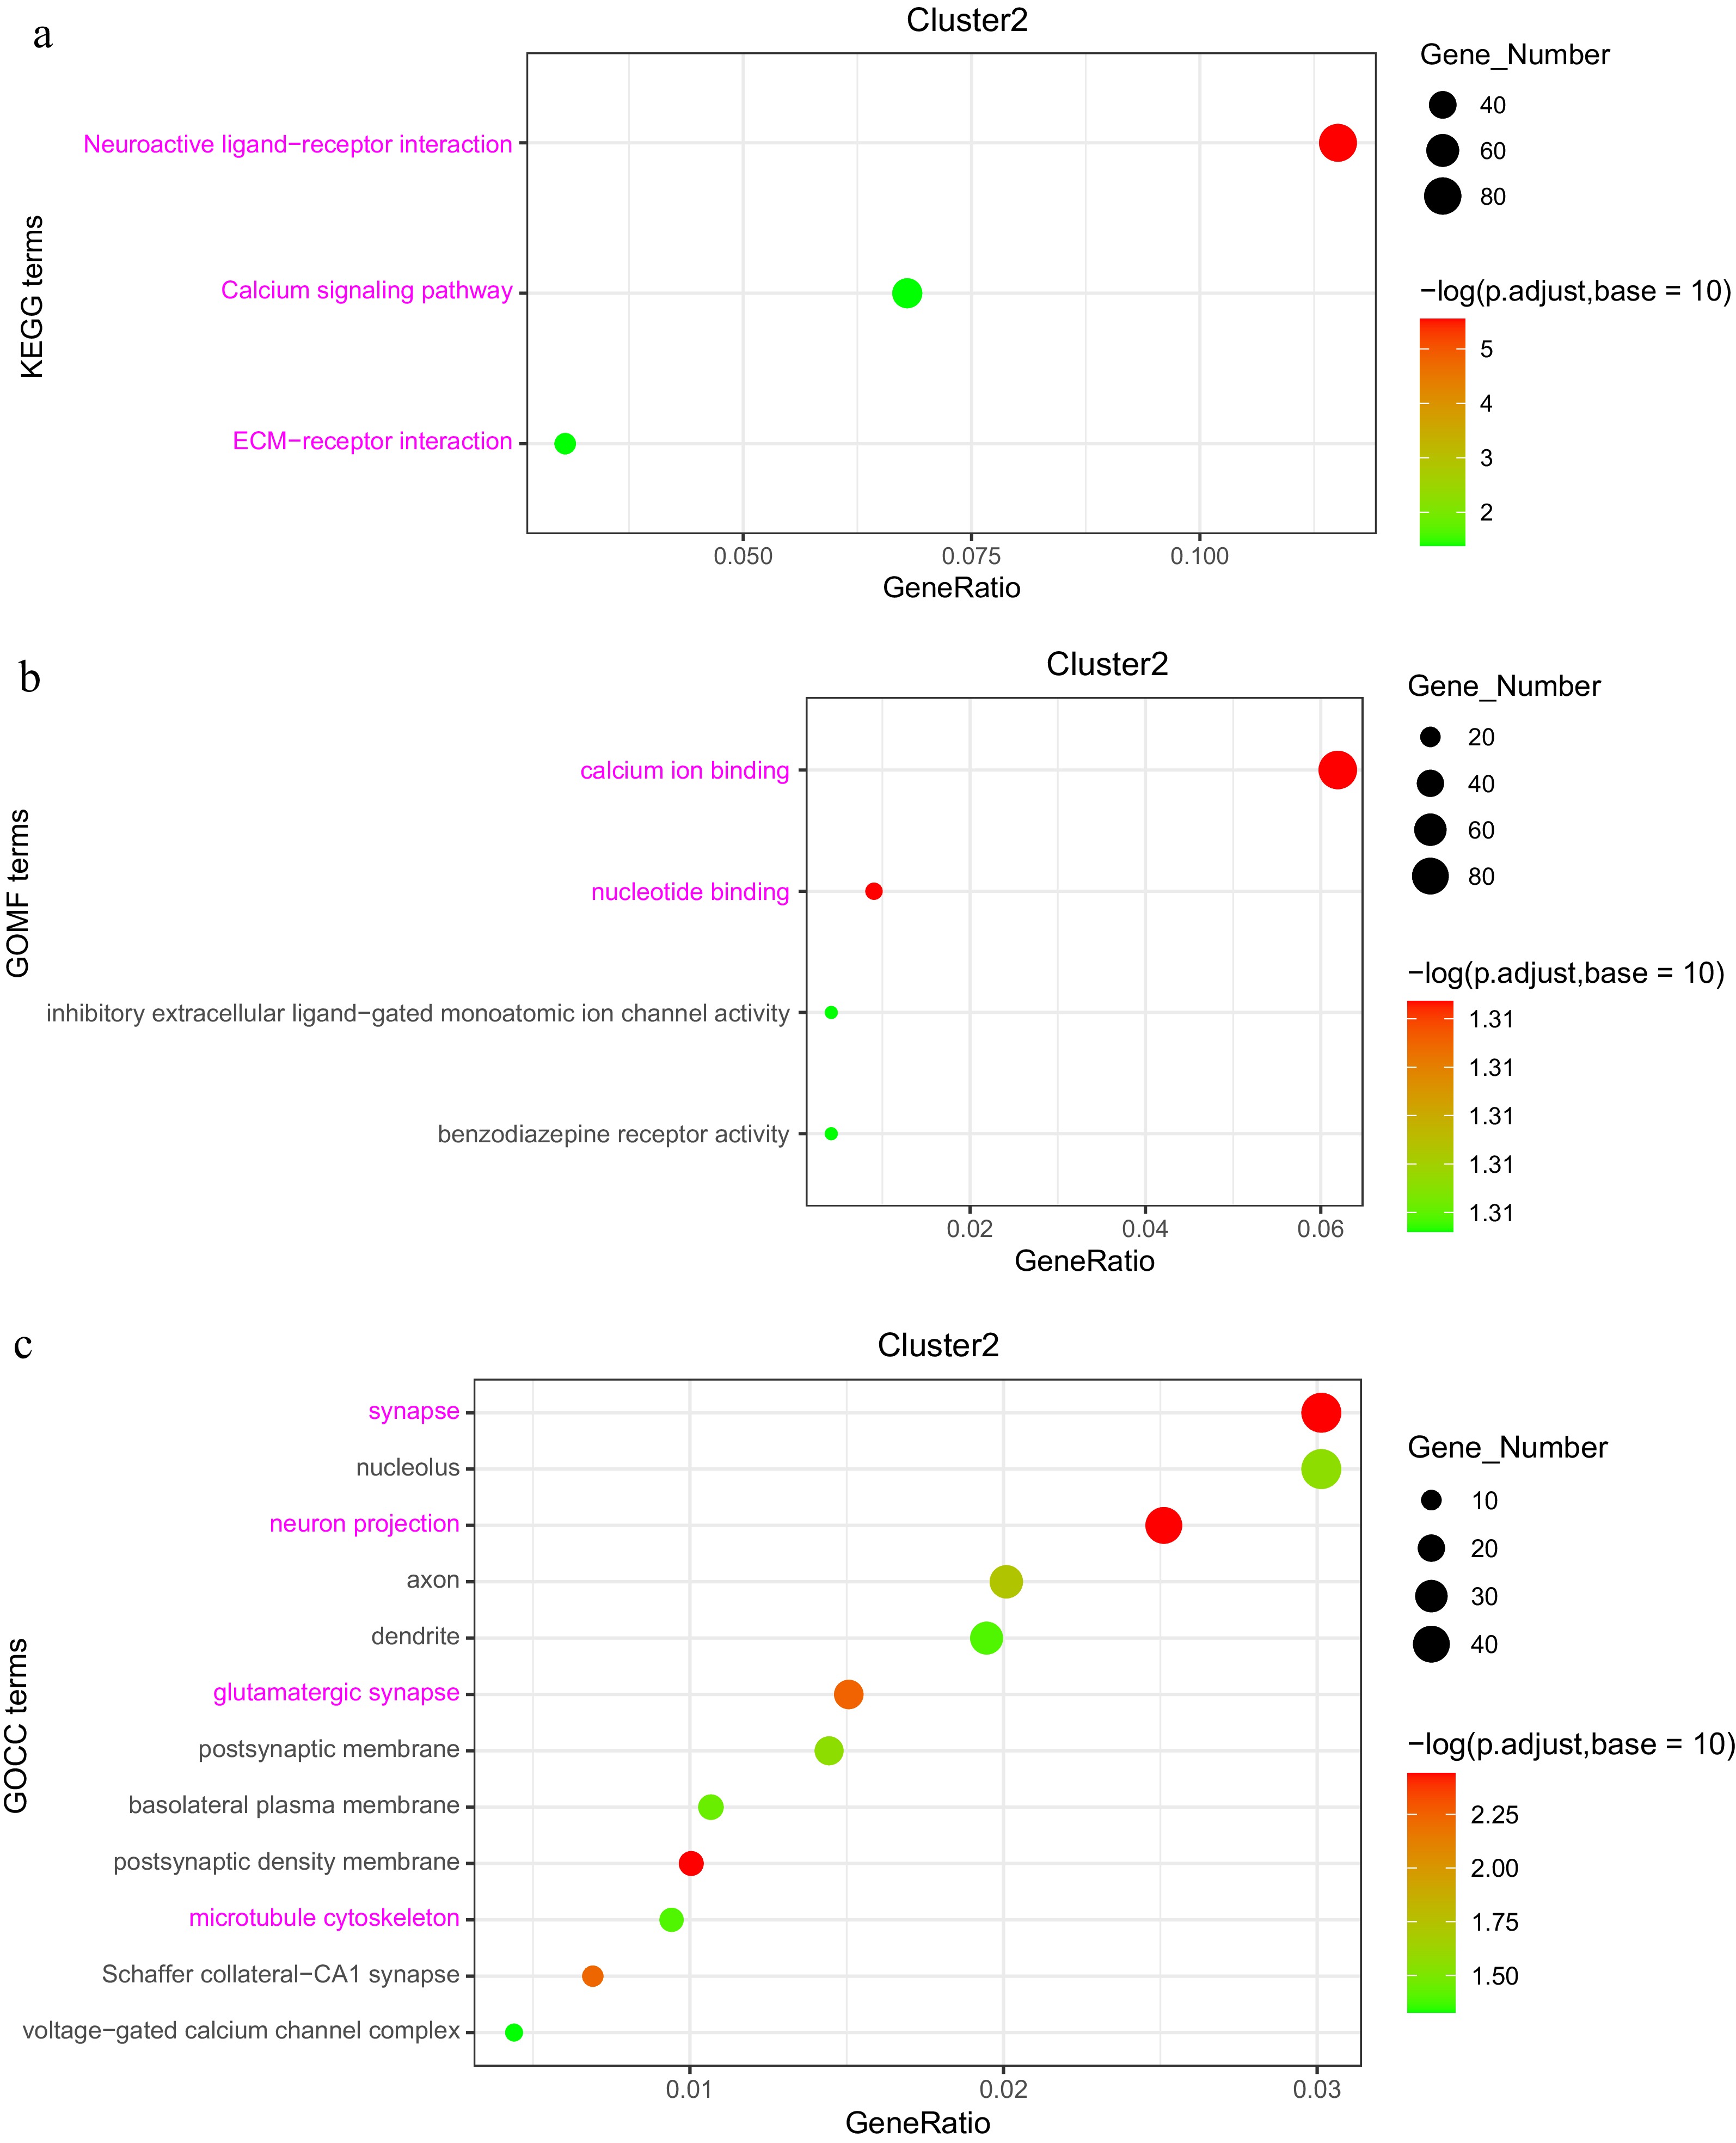
Figure 8.
Analysis of DEGs in the 'low-high-low' expression pattern (Cluster 2). (a) KEGG enrichment analysis of DEGs. (b) GOMF (Gene Ontology Molecular Function) enrichment analysis of DEGs. (c) GOCC (Gene Ontology Cellular Component) enrichment analysis of DEGs.
-
Chicken embryos require 21 d to develop and hatch, constituting one-third of the overall grow-out period. Consequently, early developmental stages are crucial in determining the final body weight at market. The maternal effects exerted by breeder hens play a decisive role during embryonic development[19]. The development of the liver during the embryonic stage is critical for broiler growth and is regulated by factors such as maternal nutrition and maternal epigenetic modifications[7]. Throughout embryonic development, the liver's metabolic functions transition from an early reliance on anaerobic glycolysis to a dependence on aerobic respiration. As development progresses, the liver's capacity for glucose metabolism strengthens, with gluconeogenesis and glycogen metabolism becoming increasingly refined[20]. Simultaneously, lipid metabolism becomes more active, with enhanced fatty acid oxidation capabilities[21]. However, the core regulatory genes involved in liver development, as well as the mechanisms underlying their changes during maternal effects, remain inadequately understood. To address this gap, a comprehensive transcriptome analysis was performed to elucidate the gene expression changes and related functional pathways that characterize liver development from breeder chickens, through embryos, to offspring broilers. This analysis offers critical insights into the molecular underpinnings of liver development, laying a solid foundation for future research into the maternal effects influencing growth and development in broiler chickens.
Based on the comparative analysis of liver expression profiles between breeder hens and E19 chicken embryos, the top 10 significantly differentially expressed genes were identified, including IGFBP1, ABI3BP, MT3, DIO3, CHRNA7, TTLL2, NEGR1, SREBF2, PDK4, and IRF1. Previous studies have demonstrated that IGFBP1 plays a crucial role in regulating cell growth, differentiation, and metabolism by modulating the activity of insulin-like growth factors (IGFs)[22]. Additionally, DIO3 is involved in the regulation of thyroid hormones and promotes embryonic development by inactivating T3 and T4[23]. Through a comparative analysis of liver expression profiles between E19 chicken embryos and D21 broiler chickens, MT3, ABI3BP, and IGFBP1 were identified as characteristic genes highly expressed in E19 embryos. ABI3BP is involved in cytoskeletal reorganization and extracellular matrix signaling, playing a crucial role in influencing cell migration and tissue morphology during embryonic development[24]. Furthermore, a significant upregulation of key genes regulating lipid metabolism, FASN, and ELOVL2, was observed in D21 broilers. FASN acts as a pivotal enzyme in fatty acid synthesis, is closely associated with adipogenesis, and is highly expressed in metabolically active liver tissues[25]. ELOVL2 is essential for the elongation of fatty acids and is integral to the synthesis of polyunsaturated fatty acids[26]. The elevated expression of these genes is intricately linked to the nutritional demands of different developmental stages; E19 chicken embryos primarily rely on glycogen metabolism for energy, whereas D21 broilers, during their rapid growth phase, necessitate extensive lipid metabolism to satisfy their energy requirements[27]. Maternal nutrition plays an important role in shaping the offspring's metabolic system. For instance, lipid and carbohydrate metabolism are closely related to the mother's fat and carbohydrate intake. Nutritional imbalances could lead to metabolic disorders or abnormal fat deposition in the offspring.
In the GO analysis of DEGs between maternal and embryo samples, significant enrichment in terms related to multicellular organism development, cell morphogenesis, and regulation of cell differentiation were observed. These biological processes are critical for ensuring the correct spatial arrangement of cells within tissues and organs during embryonic development, allowing cells to acquire the necessary functional characteristics[28]. Epigenetic regulation plays a crucial role in influencing both embryonic and offspring development[29]. In this study, 2,090 differential LncRNAs were identified and an association analysis performed with differential mRNAs, uncovering relationships of synergistic regulation and mutual inhibition. Previous studies have suggested that the maternal effects in breeder hens can influence the transcriptional levels of key genes such as MyoD in chicken embryos through LncRNA-mediated cis-regulation, thereby impacting embryonic metabolic development and immune processes[30]. Moreover, the present study analyzed DEGs across maternal, embryo, and offspring stages, and constructed an inter-regulatory GO network based on the distinct metabolic characteristics of each stage. This network provides a theoretical basis for further research into the mechanisms by which maternal effects regulate offspring development. The distinct metabolic characteristics observed across maternal, embryo, and offspring stages suggest that maternal effects play a crucial role in shaping the developmental trajectory and functional maturation of offspring.
To further investigate the maternal effects on liver expression profiles, the top 20 DEGs were identified by selecting those with low expression levels in breeder hens and high expression levels in embryos and offspring broilers. Among these, the IGF family members, including IGF1, IGFBP1, IGFBP2, IGFBP4, and IGFALS, were found to exhibit consistently high expression from the E19 embryo stage to D21 broilers. The expression of IGF1 is subject to regulation by DNA methylation and non-coding RNAs, where maternal malnutrition can lead to decreased levels of fetal IGF1 through epigenetic modifications, subsequently inhibiting fetal growth and development[31]. IGFBP1, IGFBP2, and IGFBP4 modulate the activity of growth factors by binding to IGF1 and IGF2[32,33]. Additionally, maternal metabolic conditions, such as obesity or diabetes, can suppress the activity of these IGFBPs through mechanisms involving miRNA and DNA methylation, thereby reducing the secretion of growth factors and potentially affecting the growth and development of the offspring[34,35]. Additionally, lipid metabolism-related genes, such as FASN, ELOVL2, ELOVL5, ELOVL6, and ACACA, were found to be consistently highly expressed from the E19 embryo stage to D21 broilers. Research has shown that FASN is subject to indirect regulation by LncRNA H19, which promotes the process of fatty acid synthesis[36]. Although there are few reports on the epigenetic regulation of the ELOVL gene family, these genes play a crucial role in the elongation of fatty acids. Their activity is modulated under varying lipid nutritional conditions, thereby enhancing the elongation process to support lipid metabolism[37]. These findings further highlight the critical role of maternal effects in regulating the development of the offspring's liver.
To elucidate the gene regulatory mechanisms and temporal characteristics during maternal effects, a time-series analysis of DEGs was constructed across the maternal, embryo, and offspring stages. The enriched DEGs predominantly followed 'high-low-high' and 'low-high-low' expression patterns. In the 'high-low-high' pattern, the enriched genes were primarily associated with immune function. The 'Lysosome pathway' was particularly significant in both the maternal and D21 offspring broiler stages, where cellular renewal, tissue repair, and immune responses depend heavily on lysosomal activity[38]. During the chicken embryo development stage, the primary cellular functions are rapid proliferation and differentiation, which leads to a relatively lower demand for lysosomal degradation. In this context, key genes such as Lysosomal Associated Membrane Protein 1 (LAMP1) and Cathepsin D (CTSD) were identified as crucial players. LAMP1 is essential for lysosomal transport, facilitating the movement of enzymes and proteins within lysosomes. CTSD, on the other hand, plays a significant role in lysosomal protein degradation, breaking down cellular waste and damaged proteins. These genes are vital for maintaining lysosomal function, which is critical for cellular homeostasis and metabolic regulation[39,40]. These findings provide deeper insights into the gene regulatory dynamics influenced by maternal effects throughout different developmental stages. The 'Toll-like receptor signaling pathway' plays a crucial role in recognizing pathogen-associated molecular patterns (PAMPs) and initiating immune responses[41]. During the maternal and offspring stages, exposure to external environments increases the likelihood of encountering bacteria and viruses, which in turn activates the expression of relevant characteristic genes involved in this pathway[42]. However, during the chicken embryo developmental stage, the immune system remains immature, and the relatively enclosed embryonic environment limits exposure to pathogens, resulting in fewer opportunities for activation of this pathway. The present study revealed that MyD88, TLR family genes, and NF-kB were significantly downregulated in chicken embryos, indicating that the immune response in chicken embryos relies more heavily on maternally provided antibodies and other protective mechanisms, resulting in a lower requirement for TLR pathway activation.
In the 'low-high-low' expression pattern, the enriched genes were predominantly linked to cell proliferation and organogenesis. The 'Neuroactive ligand-receptor interaction pathway', which reflects the functional demands of the nervous system at various developmental stages showed that during the chicken embryo stage, neurotransmitter activity is primarily concentrated on early neural network formation and initial signal transduction[43]. The differentially upregulated gene Gamma-Aminobutyric Acid Receptor Subunit Alpha (GABRA), a major receptor for GABA plays a critical role in the synthesis of neurons in chicken embryos[44]. The 'Calcium signaling pathway' plays a crucial role during chicken embryo development, particularly in regulating rapid cell division, differentiation, and the formation of the muscle system[45]. As breeder hens and offspring broilers reach maturity, the rate of cell division and differentiation significantly decreases, leading to reduced dependence on calcium signaling[46]. Concurrently, metabolic processes undergo reprogramming, especially in offspring broilers, where the focus shifts toward energy metabolism, muscle hypertrophy, and enhanced production performance[27].
Significant enrichment of the 'Microtubule cytoskeleton' was also observed during the chicken embryo stage, where it plays a pivotal role in maintaining cell structure and supporting cell proliferation[47]. During this developmental phase, cells require frequent structural reorganization and dynamic changes, and the high expression of microtubule cytoskeleton components ensures these processes occur efficiently, thereby facilitating organ formation and functional development[48]. Among the enriched genes, TUBB (Beta-tubulin) stands out as a core gene involved in maintaining cell morphology, driving cell division, mediating endocytosis, and supporting intracellular transport[49]. Additionally, MAPs (Microtubule-associated proteins) are crucial for regulating microtubule growth by binding to microtubules, ensuring the proper functioning of the cytoskeleton and thereby maintaining cellular integrity and facilitating development[50]. In summary, the distinct gene regulatory networks observed in this study reflect the dynamic changes in gene expression and function across different developmental stages. Immune-related pathways become increasingly active as broilers grow, supporting the complex functions of a mature physiological system. In contrast, the pathways enriched in chicken embryos are primarily focused on fundamental developmental functions, such as cell division, migration, and nervous system development. These differences in gene expression underscore the varying metabolic and physiological processes occurring at each stage of development. Moreover, these findings provide a foundational basis for further investigation into the epigenetic regulation of maternal effects in breeder hens, offering insights into how these effects influence the development and function of offspring.
-
This study, by comparing liver gene expression profiles among breeder hens, chicken embryos, and offspring broilers, has highlighted the pivotal role of maternal effects in embryonic development. Significantly differentially expressed genes such as IGFBP1, ABI3BP, and DIO3, were identified which are crucial for glucose metabolism, lipid metabolism, and cytoskeletal reorganization. Time analysis revealed two primary gene expression patterns: 'high-low-high' and 'low-high-low'. The former pattern, associated with immune function, includes genes like LAMP1 and CTSD that are highly expressed in breeder hens and offspring broilers, indicating enhanced immune activity. The latter pattern includes genes such as GABRA and TUBB, which are highly expressed in chicken embryos, supporting neural network formation and cytoskeletal reorganization. In summary, maternal effects influence the expression of key genes in embryonic development through epigenetic regulation. Understanding this mechanism is crucial for improving broiler production performance. Future research should focus on exploring the relationship between maternal nutrition and epigenetics to optimize feeding strategies for breeder hens.
This study was funded by the National Key R&D Program of China (2021YFD1300404), the China Agriculture Research System program (CARS-40 and CARS-41), the Beijing Natural Science Foundation (No. 6222036), National Natural Science Foundation of China (32202724).
-
All procedures were reviewed and preapproved by the China Agricultural University Animal Care and Use Committee (Beijing, China), identification number: A070805202-1-1, approval date: 07/08/2023. The research followed the 'Replacement, Reduction, and Refinement' principles to minimize harm to animals. This article provides details on the housing conditions, care, and pain management for the animals, ensuring that the impact on the animals was minimized during the experiment.
-
The authors confirm contribution to the paper as follows: study conception and design: Lv Z, Guo Y; data collection: Fan H, Wang H, Chen S, Nie W; analysis and interpretation of results: Gao M, Chen Y; draft manuscript preparation: Gao M. All authors reviewed the results and approved the final version of the manuscript.
-
The data that support the findings of this study are available in the Genome Sequence Archive at the National Genomics Data Center, China National Center for Bioinformation (GSA: CRA016504).
-
The authors declare that they have no conflict of interest.
-
# Authors contributed equally: Mingkun Gao, Youying Chen
- Supplementary Table S1 The differential expression levels of lncRNAs between maternal, embryo, and offspring.
- Supplementary Table S2 The correlation index between differentially expressed mRNAs and lncRNAs, as well as the differential mRNA expression levels between maternal, embryo, and offspring.
- Supplementary Table S3 The six differential clusters analyzed by time analysis, along with the associated GO pathways and the enriched differentially expressed mRNAs.
- Supplementary Fig. S1 Quality assessment of whole-transcriptome data and time analysis clusters. (a) Quality assessment of full-length transcriptome. (b) GO pathway analysis enriched in clusters 4, 5, and 6.
- Copyright: © 2024 by the author(s). Published by Maximum Academic Press on behalf of Nanjing Agricultural University. This article is an open access article distributed under Creative Commons Attribution License (CC BY 4.0), visit https://creativecommons.org/licenses/by/4.0/.
-
About this article
Cite this article
Gao M, Chen Y, Fan H, Chen S, Wang H, et al. 2024. Transgenerational effects on the gene transcriptome of chicken liver. Animal Advances 1: e003 doi: 10.48130/animadv-0024-0003 

Transgenerational effects on the gene transcriptome of chicken liver
- Received: 16 August 2024
- Revised: 10 September 2024
- Accepted: 27 September 2024
- Published online: 31 October 2024
Abstract: Chickens are important breeding animals and models for biomedical research, particularly due to their oviparous nature, which makes it an ideal subject for studying maternal effects. This study employs RNA-Seq to conduct a comprehensive analysis of the transcriptomics of the poultry liver, with a focus on maternal transgenerational effects. Samples were examined from broiler breeders, E19 embryos, and 21-day-old offspring, identifying 2,753 DEGs. GO analysis revealed significant enrichment of differentially expressed RNAs in functions such as actin filament binding and lysosomal activity. KEGG analysis identified pathways associated with endocytosis and Toll-like receptor signaling, displaying a high-low-high expression pattern across the broiler breeders, embryos, and offspring, which is closely linked to immune function regulation. Conversely, the Neuroactive ligand-receptor interaction and Calcium signaling exhibited a low-high-low expression pattern, which is intimately associated with organogenesis, and embryonic development. Additionally, based on DEGs, genes such as IGF1, IGFBP, FASN, and ELOVL were identified, which are significantly expressed in embryos and are crucial for development and lipid metabolism regulation. In summary, the present research provides a valuable transcriptional regulatory network for studying maternal effects on liver tissue development in broiler breeders, laying a foundation for further exploration of the molecular mechanisms underlying maternal effects.
-
Key words:
- RNA-seq /
- Maternal effect /
- Liver /
- Embryo development /
- Broiler breeder