


-
Environmental quality and agricultural sustainability are seriously threatened by soil degradation, which refers to a decline in soil productivity due to land use[1]. The challenges facing agriculture in tropical Africa are indeed complex and multifaceted. The combination of population pressure, limited arable land, difficult climates, and resource constraints present significant hurdles for farmers in the region[1]. Increasing agricultural production in Ghana has been primarily based on the continuous expansion and shortening of fallow periods[2]. This has resulted in widespread soil degradation[3] but does not allow production to match the growing population and demand for agricultural products[4].
Soil degradation refers to the long-term loss of soil productivity and ecosystem function. Soil degradation by erosion is often considered the greatest factor that diminishes the crop production potential of agricultural lands[1]. This is because soil loss corresponds to losses in plant nutrients, soil productivity, and crop yield[5]. In addition to being a significant social and economic issue, soil erosion is crucial for determining the health and function of ecosystems[6]. Although soil erosion is one of the problems that affects soils naturally, it can also occur by tillage. In the process of soil erosion, the topsoil, which is rich in organic matter and plant nutrients, is transported away and leaves the residual soil poorer than it was[7,8].
Tillage operations affect the possibility of soil erosion by water dependent on the depth, direction, and timing of tillage, type of tillage machine, and number of tillage traffic. Water erosion can be mitigated by utilizing minimum tillage or no-till approaches[9]. Tillage and other actions performed up and downfield slopes enable surface water drainage, which can speed up the soil erosion process.
Soil erodibility is a major element that directly impacts the quantity of soil loss in a field when other factors such as rainfall erosivity, topography, and vegetation cover are held constant[10,11]. Soil erodibility is an estimate of a soil's ability to resist erosion based on its physical properties. Texture is the most influential factor in erodibility; nevertheless, structure, organic matter, and permeability also play a role[12]. Soils rich in organic matter have higher infiltration rates, better soil structure, and can withstand erosion better. Silt, fine sand, and some clay-textured soils erode more easily than sand, sandy loam, and loam-textured soils. Soil erodibility increases due to tillage and inappropriate agricultural practices that reduce soil organic matter, disturb soil structure, or compact soil. Hence, different tillage and cropping practices have varying effects on soil erodibility, and their management is important to reduce soil and fertility losses[13, 14].
Although in situ measurement of soil erodibility is the most precise, due to the time and cost involved, attempts have been made in many parts of the world to predict erodibility from easily observed soil parameters[12]. Wischmeier et al.[15] erodibility index has been frequently used to measure soil erodibility. The index has been translated into a nomograph based on the association of erodibility (K) with particle size distribution, organic matter, structure, and permeability of soils. Several researchers have successfully employed nomographs to measure soil erodibility[16]. However, in this study, we attempted to predict erodibility values on a Ferric Acrisol using a nomograph and related them to easily measured soil parameters.
Previous studies in Ghana, however, have assessed the susceptibility to erosion of some managed and unmanaged land use types as well as soil series in different agroecological zones[2, 17]. These studies, however, failed to quantify variations in erodibility under integrated soil management systems, such as a combination of different tillage systems with different levels of soil fertility amendment. The objective of this study was therefore to evaluate the impacts of tillage and soil fertility management on the dynamics of soil erodibility and to determine the relationship between the soil erodibility index determined by the K-nomograph and easily measured soil parameters to find an alternative method for estimating soil susceptibility to erosion.
-
Field experiments were executed at the KNUST Research and Teaching farms in Anwomaso, Kumasi, and Ghana. The climate is characterized by double maxima of rainfall and is often referred to as the major or minor season. Average rainfall per annum ranged between 1,067 and 1,158 mm[18]. The peaks of rain occurred in June and October in the main and minor seasons, respectively. The locations are distinguished by year-round high temperatures and uniformly high sunshine; the mean annual temperature is usually above 18 °C. This location is in Ghana's semi-deciduous forest zone. The vegetation zones run parallel to each other from north to south and are connected to the amount of rainfall. The elevation ranged from 302 to 412 masl. The soils were derived from the basement complex rocks and were classed as ferric Acrisol (WRB). The section of the research farm where this study was conducted has been under intensive management for over 10 years and was designed purposely for erosion research in 2011.
Experimental layout and treatment allocation
-
The experiment was a split plot with three replicates arranged out in a Randomized Complete Block design. The main plot was tilled at four levels: control (grassland fallow), no-till (NT), minimum tillage, and conventional tillage. The soil amendments had four levels: control (no fertilizer), poultry manure (PM), ½ rates of NPK + ½ PM, and NPK fertilizer. Two weeks after planting (WAP), the amendments (poultry manure, poultry manure + NPK fertilizer, and NPK fertilizer) were applied to their respective treatment plots. Plots were treated with poultry manure + NPK fertilizer at five WAP, and NPK fertilizers were top-dressed with N in the form of urea. Between 2011 and 2014, the treatments were applied every year for five cropping cycles.
Soil sampling strategy
-
The soil was sampled per experimental plot at the end of the fifth crop cycle. Soil samples were collected randomly to a depth of 15 cm using a standard auger for routine soil analysis. Soil samples for bulk density and saturated hydraulic conductivity determinations were collected using a sample core. Soil samples were obtained from neighboring fields classified as grassland fallow to analyze the effect of fertility management options on soil erodibility. All samples were carefully packaged and labeled in preparation for laboratory analyses. The soils were analyzed following standard protocols.
Laboratory analysis of soil samples
-
The bulk density was calculated using the conventional procedures provided by Blake & Hartge[19]. The saturated hydraulic conductivity was measured with a falling head permeameter, as described by Bonsu & Laryea[20]. Figure 1 depicts the configuration. A manometer connected to a meter, reinforced by a clamp holder is equipped with a hose that links to the water head on the core, which is supported by a gravel platform with a drainage outlet. Capillarity moistened the core samples until the soil was completely saturated. The fine gravel was placed in a ten-litre bucket with a perforated bottom and set over a sink. Water was carefully poured into the soil core brim. The hydraulic head (Ht) on the soil surface was determined against time (t) using a meter-scale water manometer. The stopwatch was started, and the time (t1) as well as the start height (H0) was recorded. Readings were taken after the hydraulic head fell 2 cm to the earth surface. This was done three times. The usual falling head equation was used to compute the saturated hydraulic conductivity (Ks).
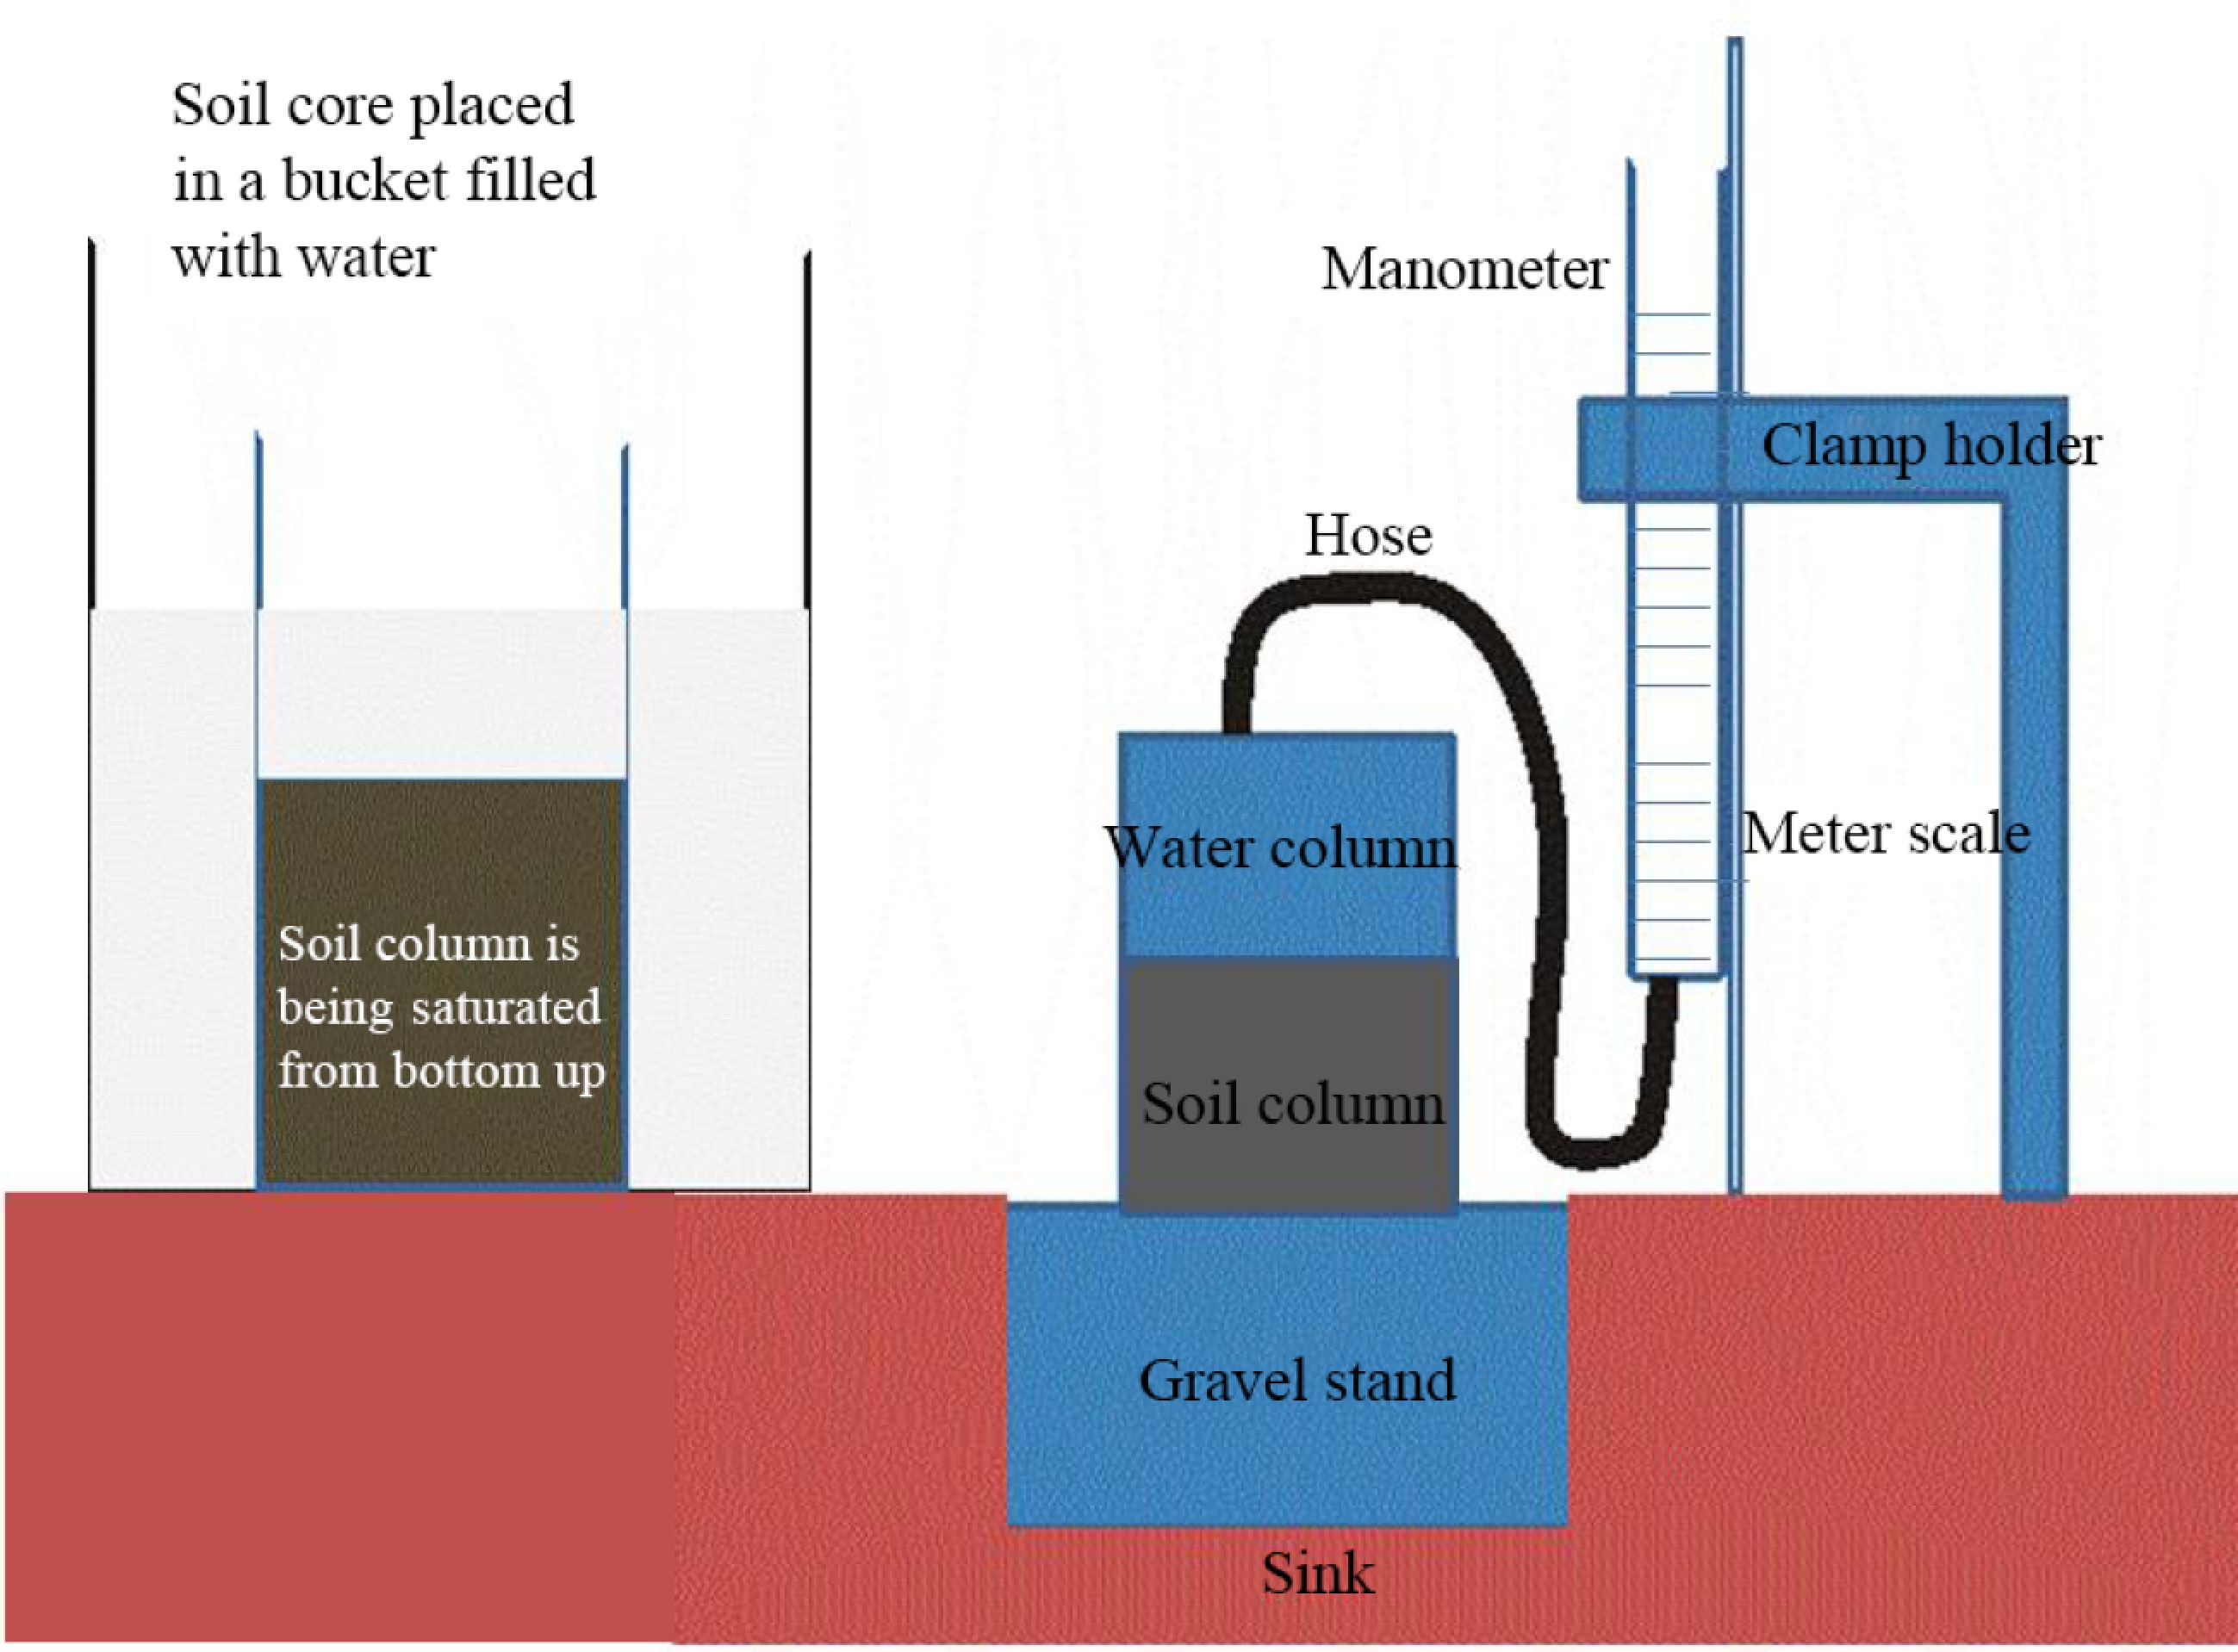
Figure 1.
Laboratory setup of the procedure for saturated hydraulic conductivity.
Sand fractionation and soil particle sizes were determined using the procedure of Dewis & Freitas[21]. Organic carbon was measured using a modified Walkley-Black wet oxidation method[22].
Erodibility determination
-
The dataset required to read numerical soil erodibility values directly from the K nomograph developed by Wischmeier et al.[15] (% silt plus very fine sand,% sand greater than 0.10 mm, organic matter content, soil structure, and permeability) was obtained through routine laboratory analysis and standard profile description. The nomograph was fitted with the values and codes of the five parameters, and the K values were read and divided by the 7.59 factor to get K in Mg·h·MJ−1·mm−1[23].
Statistical analysis
-
ANOVA was performed on the data using the Genstat statistical program 9th edition. The Least Significant Difference (LSD) approach was used to assess significant differences at the 5% probability level. Simple Linear regression was used to identify the associations between the measured parameters for prediction purposes. For comprehensive details of the methodology please see Mesele[18].
-
Soils under minimum tillage were higher in clay content than all the other tillage systems and the control (Table 1). The clay content of the soils decreased in the order of minimum tillage > conventional tillage > Control = No-till. Percent silt was highest in the no-till system though not significantly different from the control. Minimum tillage and conventional tillage reduced the % silt of the soil by 13%; and increased the clay content by 150% and 103%, respectively after three seasons of cultivation. No statistical difference was observed between and within the tillage systems and the control for the sand fractions.
Table 1. Effect of tillage systems on sand fractions, total porosity, root water storage, hydraulic conductivity and soil erodibility.
Tillage system Very fine sand (%) Fine sand (%) Medium sand (%) Coarse sand (%) Very coarse sand (%) Silt
(%)Clay
(%)Total porosity (%) Water storage (mm) Saturated hydraulic conductivity (mm/h) Erodibility
× 10−3 (Mg·h·MJ−1·mm−1)Control 4.0 11.2 27.0 24.0 5.9 22.4 5.3 45 48 634 13 No-till 4.6 11.6 22.8 21.2 5.5 27.7 6.6 46 32.6 585 24 Minimum tillage 3.5 10.9 23.5 22.3 6.5 20.0 13.3 39 44 349 18 Conventional tillage 3.7 10.0 21.8 23.3 10.9 19.8 10.8 42 23.1 127 14 Lsd (0.05) 1.8 2.5 6.2 5.5 6.7 6.9 2.3 5 3 46 7 CV (%) 22.9 11.5 13.0 12.1 46.3 15.3 12.9 6.4 15.2 22 15.4 Total porosity varied from 39 to 46% in the minimum tillage and no-till respectively. The control which was a natural ecosystem has the highest saturated hydraulic conductivity (Ks) values. Among the tillage systems, no-till has the highest Ks value followed by the minimum tillage and the conventional tillage has the lowest Ks value. The average erodibility was 13 × 10−3 to 24 ×10−3 Mg·ha·h/(ha·MJ·mm). Control tillage, conventional tillage, minimum tillage, and no-till were ranked in terms of erodibility. No-till produced significantly more K (p < 0.05) than the control and conventional tillage.
Impact of soil amendment on soil organic carbon and erodibility
-
Application of soil amendment over five cropping cycles showed some variations in soil organic carbon and soil erodibility (Table 2). The control has the least soil organic carbon and the highest occurred in plots with poultry manure application. Differences in soil organic carbon were significant among the treatments. Soil erodibility has its lowest value under the control (no amendment) and the highest value under the NPK treatment.
Table 2. Effect of soil amendments on soil organic carbon and soil erodibility.
Treatment Soil erodibility values
× 10−3 (Mg·h·MJ−1·mm−1)Organic carbon
(%)Control 17 1.65 ½ PM + ½ NPK 19 2.19 Poultry manure 19 2.67 Mineral NPK 21 1.82 LSDP<0.05 2 0.20 % CV 15.4 8.10 Effect of tillage and soil amendment interactions on erodibility
-
Table 3 shows the mean values of the tillage x soil amendments interactions on soil erodibility. The erodibility of the soil ranged from 1 to 2.6 × 10⁻² Mg·h·(MJ−1·mm−1). Conventional tillage was shown to be statistically less erodible than no-till and minimum tillage systems under control (no amendment was applied). No-till erodibility (K) values were comparatively high though not statistically significant from minimum tillage. Soil amendments did not affect erodibility under no-till or conventional tillage systems (p > 0.05).
Table 3. Effect of tillage and soil amendments interactions on soil erosion susceptibility.
Tillage practice Soil erodibility values (Mg·h·MJ−1·mm−1) No-amendment ½ NPK + ½ PM NPK PM No-till 0.021 0.025 0.026 0.024 Minimum tillage 0.019 0.019 0.02 0.015 Conventional tillage 0.01 0.014 0.017 0.016 Lsd (0.05) 0.007 CV (%) 12.1 Correlations of soil erodibility, particle size fractions and hydraulic conductivity
-
Figure 2a depicts the association between K and % sand > 0.10 mm with a coefficient of determination of −0.67 at the 5% probability level. The results showed that as the percentage of sand increased over 0.10 mm, the erodibility values decreased. Figure 2b depicts the association between % silt + extremely fine sand and K values. At a 5% probability level, the connection was statistically significant. With a r2 = 0.61, soil erodibility increases as the percentage of silt + very fine sand increases. Figure 2c indicates that erodibility and clay percentage are inversely related. With a r2 = 0.12, increasing the percentage of clay resulted in a decrease in soil erodibility. At a 5% probability level, the connection was statistically significant.
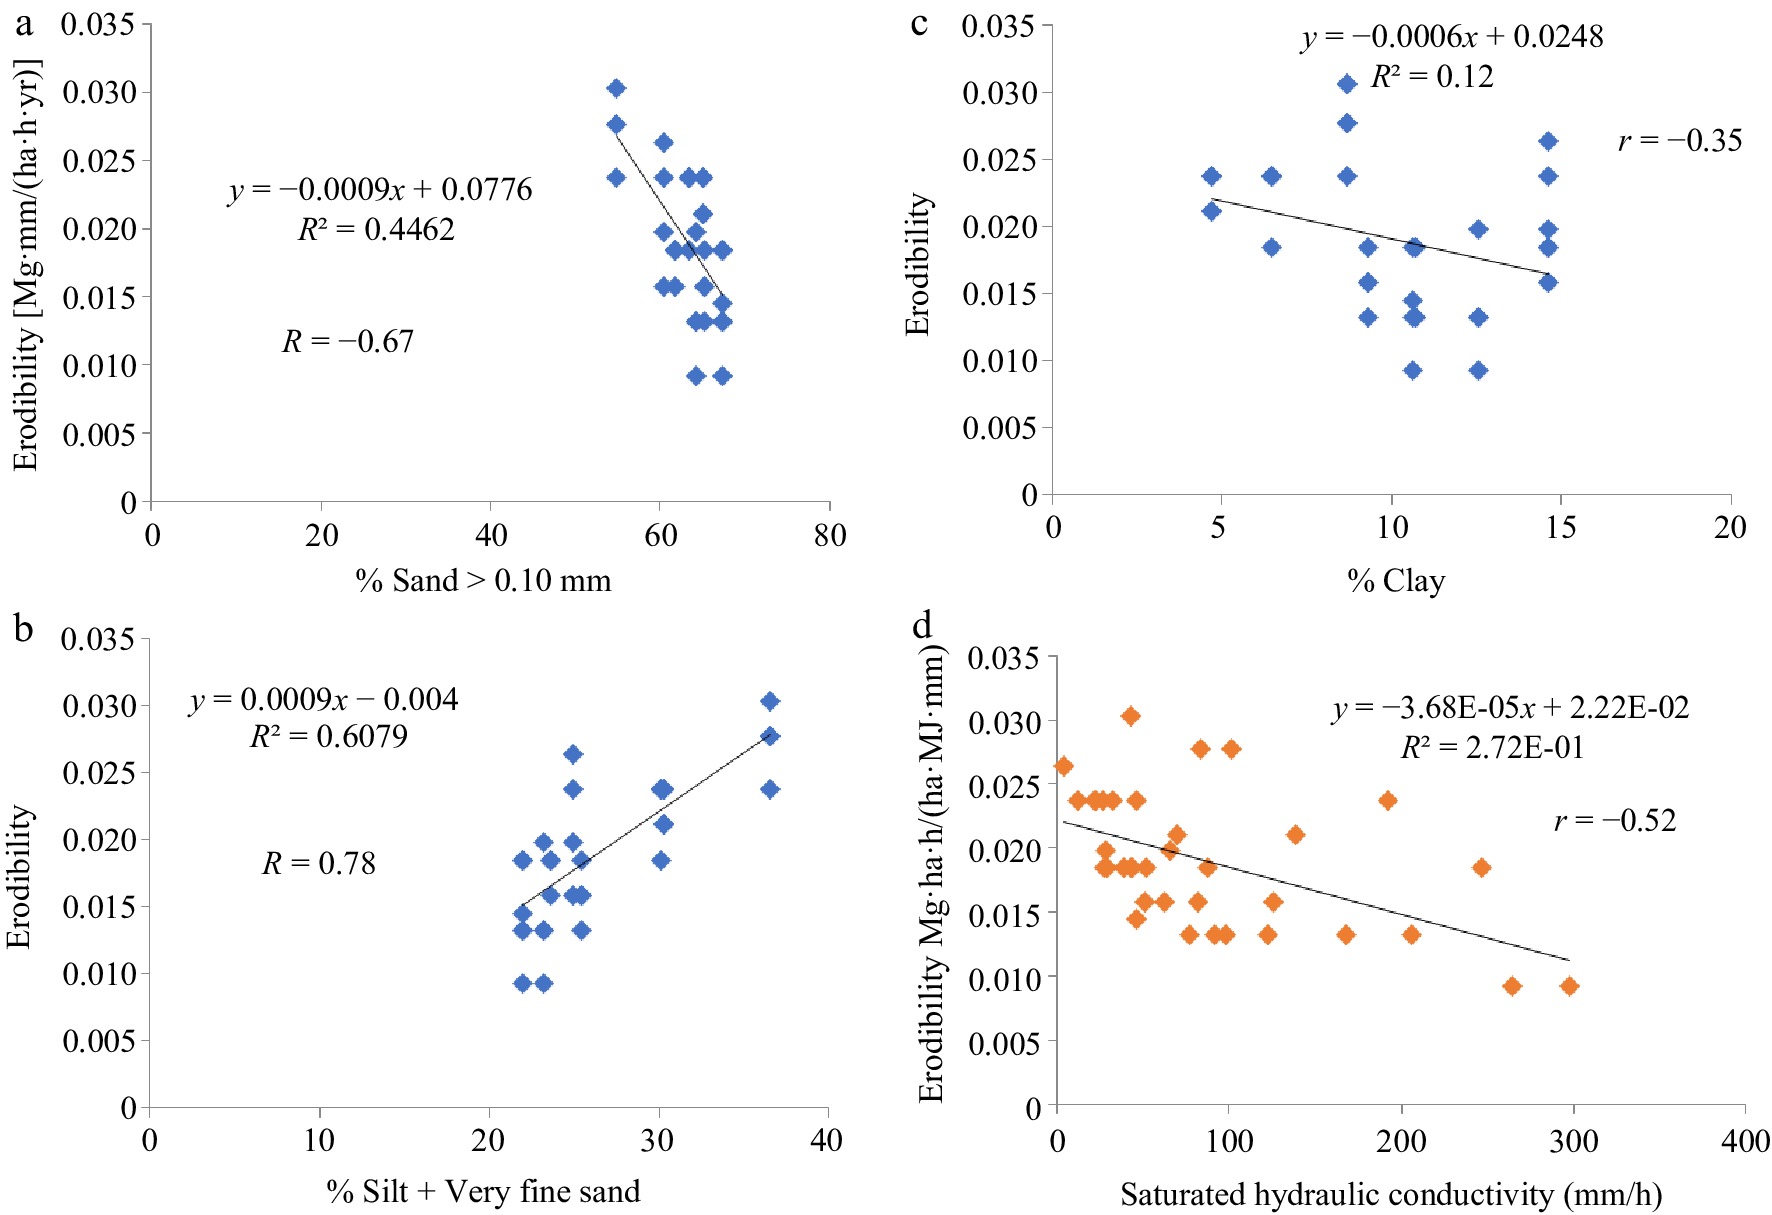
Figure 2.
Relationship between erodibility and soil particle size fractions and saturated hydraulic conductivity.
The association between erodibility and saturated hydraulic conductivity has a r of −0.52 (Fig. 2d). Soil erodibility decreased significantly (p < 0.05) as saturated hydraulic conductivity increased. Figure 3 indicates that erodibility and soil organic carbon content are inversely associated, with r of −0.31, although this association is not significant at 5% probability due to low range of the values for this study. Soil erodibility decreased as the saturated hydraulic conductivity increased.
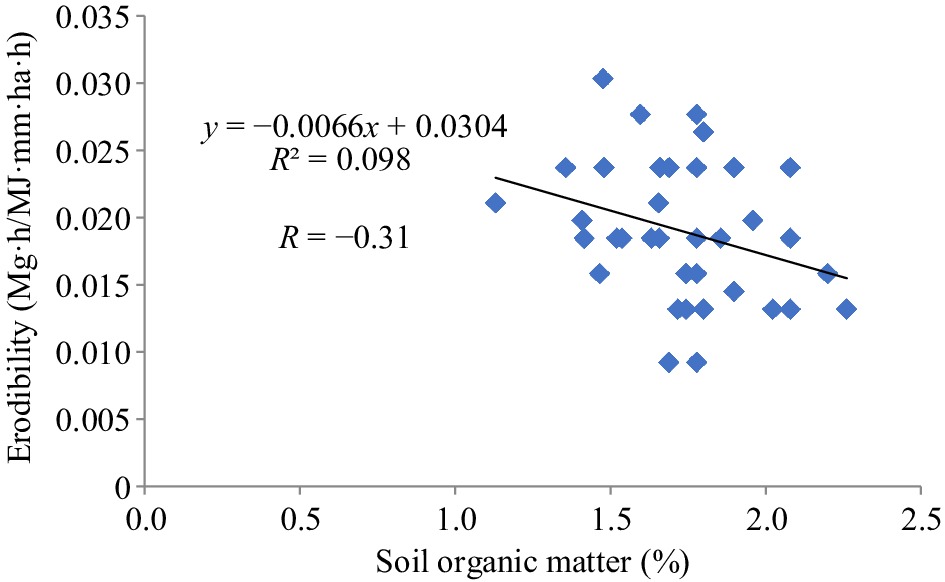
Figure 3.
Relationship between erodibility and soil organic carbon.
-
Tillage and soil fertility enhancements are crucial considerations in soil fertility management strategies for sustainable intensification of agriculture and high crop yield[14]. Soil erodibility, as an inherent sensitivity of soil to erosion, is predicted to be altered by the dynamics of the determining variables. Despite this, static values are frequently employed for soils in the Universal Soil Loss Equation (USLE) without considering that soil management impacts the magnitude of K[24, 25]. Highly erodible soil may yield less erosion under proper and effective soil conservation practices than less erodible soil with poor management[26]. The study's findings clearly illustrate that tillage has a substantial impact on erodibility because it influences the input parameters.
Tillage affects soil susceptibility to erosion in a variety of ways, including effects on soil organic matter, aggregate stability, soil structure, particle size distribution, and hydraulic conductivity. This study found that tillage practices had a considerable impact on soil organic matter. Tillage is one of the primary techniques for reducing organic matter in the soil[27]. Every time the soil is tilled, aeration occurs. Because organic matter decomposition and carbon release are aerobic processes, oxygen boosts or hastens the operation of soil bacteria that consume organic matter. Conventional tillage significantly recorded lower levels of soil organic matter while there was a buildup of soil organic carbon under the no-till system. The minimum tillage has over 30% higher soil organic matter than the conventional plough-harrow-plant system. The low level of soil organic matter in the conventional tillage system is associated with the rapid rate of decomposition and has negative implications on soil nutrients, particularly nitrogen[28]. This gradually results in poor soil aggregation apart from the direct effect of tillage on soil structure and soil aggregate stability. Earlier studies have shown that conventional tillage is deleterious to soil health while conservation tillage systems like no-till and minimum tillage enhanced soil structure and aggregate stability[29, 30].
Conventional tillage, which often involves hoeing or discing (plough-harrow-plant) smooths the soil's top and obliterates the channels and natural soil aggregates that connect the soil's surface to its subsurface, leaving the land vulnerable to erosion. Crevices between natural aggregates, as well as old root channels and earthworm holes, are also removed. Large pores, such as those destroyed by traditional tillage, are essential to transfer water into the soil following rainfall. The production of a plough pan or hoe pan, a layer of compacted soil generated by smearing action at the bottom of the plough or hoe, can impede root penetration and water infiltration. All of these processes have implications for soil susceptibility to erosive agents.
Concerning soil amendments, several studies have indicated increased soil organic matter in different cropping systems as a result of the application of organic amendments such as poultry manure[31, 32]. This study further confirmed that soil organic matter increased under the application of poultry manure after five cropping cycles over the control and other treatments. There were no significant differences in the soil organic matter level between plots amended with NPK and those without any amendments after the 5th cropping cycle. This implies that chemical fertilization has negative effects on soils, as earlier reported by Savci[33] and Pahalvi et al.[34].
The quantity of water a soil can hold under saturated conditions, as well as the amount of water available inside the root zone, both play essential roles in soil erosion susceptibility. Natural grassland has the highest saturated hydraulic conductivity, followed by no-till and then minimum tillage, whereas conventional tillage has the lowest saturated hydraulic conductivity. Apart from natural grassland, the minimum tillage has the most water stored in the root zone, followed by no-till. This observation is supported by the works of Mesele et al.[14] and Zhang et al.[35] who observed higher moisture storage under conservation tillage systems than under no-till systems.
Another major factor that determines soil erodibility is the soil particle size distribution and for this, tillage has shown a strong effect. Although tillage did not significantly change the soil textural class after five periods of treatment, it did cause a significant redistribution of the various particle sizes. The combination of this tillage impact with the preferential removal of tiny particles throughout the erosion process resulted in considerable differences in soil erodibility. The no-till technique, with its greater intrinsic silt and very fine sand, was shown to have much higher erodibility values than the other tillage methods[36]. Conventional tillage, on the other hand, has a lower erodibility rate because of its higher proportion of coarse sand and clay fractions, which are less erodible than silt and fine sand. This is because the size and cohesive forces of the former and latter give resistance to the erosive pressures of raindrops and runoff, respectively. The coarse fractions also improve soil infiltration, reducing the quantity of runoff susceptible to erosion. A similar observation was recorded by Santos et al.[37]. The mixing of the 0−15 cm and 15−30 cm layers by the plough and harrow may account for the higher clay content of the 15−30 cm soil depth. The increasing coarser sand fractions may be attributable to the selective removal of silt and very fine sand through erosion across the three seasons. The coefficient of determination of the erodibility relationships with percent sand and silt plus fine sand accounted for the majority (86%) of the changes in the magnitude of K.
The main effect of soil amendments on erodibility revealed that soils under poultry manure application had lower erodibility values than those under mineral fertilizer application. This suggested that the increased soil organic matter could have contributed to the improvement in soil aggregation and susceptibility to erosive forces[38]. Increased soil organic matter potentially reduces the soil erodibility. The interaction between tillage and soil amendments revealed that poultry manure interacted with both minimum and conventional tillage to considerably reduce erodibility. Because actual field erodibility measurement is costly and time-consuming, correlations between erodibility and easily measured soil parameters were developed. According to the findings of this study, erodibility has a strong relationship with different sand fractions and saturated hydraulic conductivity. This meant that soil erodibility could be determined based on easily observed soil characteristics.
-
The study revealed that erodibility is a dynamic soil property and by influencing soil properties such as soil particle size distribution, soil organic matter, and hydraulic conductivity, the susceptibility of the soil to erosion changes. The increase in soil erodibility was in the order of no-till > minimum tillage > conventional tillage > grassland fallow. The higher erodibility status of no-till and minimum tillage does not directly imply increased soil loss but does indicate the high risk of soil erosion if the conservation tillage systems are not properly managed, particularly in the absence of cover and the presence of erosive rains. Soil amendments such as poultry manure reduced soil erodibility by improving soil organic matter and promoting better soil aggregation while the latter increased with NPK application. The high contributions of sand and silt to the variation in soil erodibility denotes that any other indices of erodibility based on particle size distribution apart from the K-nomograph may satisfactorily predict erodibility values of a Ferric Acrisol.
-
The author confirmed the solo responsibility to study conception and design, performed the fieldwork and lab analysis, draft manuscript preparation and revison to the article.
-
The datasets generated during and/or analyzed during the current study are available from the corresponding author on reasonable request.
-
The author is grateful to his academic supervisor and mentor, Late Prof Charles Quansah of Kwame Nkrumah University of Science and Technology Kumasi, for the tutelage and for supervising this work. May his soul rest in peace.
-
The author declares that there is no conflict of interest.
- Copyright: © 2024 by the author(s). Published by Maximum Academic Press, Fayetteville, GA. This article is an open access article distributed under Creative Commons Attribution License (CC BY 4.0), visit https://creativecommons.org/licenses/by/4.0/.
-
About this article
Cite this article
Mesele SA. 2024. Changes in soil susceptibility to erosion under tillage and soil fertility management practices. Circular Agricultural Systems 4: e004 doi: 10.48130/cas-0024-0004 

Changes in soil susceptibility to erosion under tillage and soil fertility management practices
- Received: 24 October 2023
- Revised: 13 December 2023
- Accepted: 15 January 2024
- Published online: 29 February 2024
Abstract: The degree to which soil is susceptible to erosion is measured as soil erodibility which can be influenced by different land management options. This study evaluated the dynamics of soil erodibility to tillage and soil amendments in a maize field under five consecutive cropping cycles. Tillage treatments were no-till, minimum, conventional, and grassland fallow (control). The soil amendment treatments used were no amendment (control), NPK, poultry manure (PM), and ½ NPK + ½ PM and these treatments were applied to all the tillage treatments including no-till. The study showed that tillage and soil amendment interactions had significant effects on soil erodibility (p < 0.05). The mean erodibility values ranged from 13 × 10−3 to 24 × 10−3 Mg·h·MJ−1·mm−1 in the following order: control < conventional tillage < minimum tillage < no-till. For the soil amendments, erodibility varied from NPK > poultry manure = ½ NPK + ½ PM > control (undisturbed grassland). Regardless of the type of soil amendment, the soil erodibility under conventional tillage was significantly lower than that under no-till and minimum tillage systems. The relationship between erodibility and easily measured soil parameters, such as % sand greater than 100 µm, % silt plus very fine sand, clay, and saturated hydraulic conductivity, were significant at p < 0.05. The higher contribution (86%) of sand and silt to the variation in erodibility indicates that any other indices of erodibility based on particle size distribution, apart from the nomograph, could satisfactorily predict erodibility values.
-
Key words:
- Conservation agriculture /
- Land degradation /
- Soil erosion /
- Tillage