


-
Grape is one of the highest extensively cultivated fruit crops with great economic benefits and nutritional value[1,2]. Due to human wealth and health-promoting values, the consumption of grape berry and grape products is gradually increasing in diet and health[3,4]. Nowadays, China is the leading producer and consumer of table grapes in the world[5]. High-end table grapes are exceedingly demand by increasing consumers since their preference for attractive, delicious, and healthy fruit. Protected cultivations, such as rain shelters, plastic tunnels, and solar greenhouses, are effective practices, that prevent pests and diseases, resist natural disasters, improve the quality of fruits, prolong supply periods, and promote the economic incomes of vineyards[6−8]. Nonetheless, the long-time application of plastic films leads to decreased light intensity and changes in light quality in vineyards, which successively influences the yield and quality of grape berries[8].
Light is a crucial environmental factor and energy source that affects plant morphogenesis and fruit quality formation. It is widely known that light quality, light intensity, and photoperiod significantly regulate the plant growth and metabolic process[9]. For example, light exposure not only increased chlorophyll and carotenoid contents, but also improved leaf photosynthetic capacity in grape[10−12]. Subsequently, anthocyanin and flavonol contents were increased under light exposure conditions in grape[13−20]. Conversely, light exclusion treatment decreased proanthocyanidin (PA), flavonol, and anthocyanin concentrations in the skins of grape berries[13,15,21,22]. Additionally, light exposure significantly induced the accumulation of sugar[23,24] and aroma compounds, including C13-norisoprenoids, and monoterpenes in grape[25−27]. These findings confirm that improving the light environment has a practical effect on the berry qualities of grape production.
Various cultivation management practices have been developed to control the light environment in the planting zone of grape canopies, including vineyard pruning, trellis management[7,28], leaf removal[27,29,30], cluster thinning[31−34], and bagging[35−38]. However, some of these measures are not only very time-consuming and labour-intensive, but also have limited impacts on improving light conditions in vineyards. With the advent of light-emitting diode (LED) in horticulture, nighttime illumination and supplementation of different light qualities have become common practices to modulate the growth and nutritional quality of horticulture plants[39,40]. For instance, supplementary LEDs not only enhanced the photosynthetic capacity and photosynthate production but also increased the yield and quality of tomato in greenhouses[41,42]. Ultraviolet (UV) and blue light treatment pre- and post-harvest improved the total anthocyanin content and fruit quality of strawberry[43−46], blueberries[47,48], and sweet cherries[49,50]. However, previous studies indicated that spectral formulas must be developed independently for different horticultural plants because light quality requirements are known to be species-specific[51−54]. Therefore, it is necessary to determine a suitable light spectrum for table grape, especially under protected cultivation conditions.
The 'Queen Nina' grape (Vitis vinifera L. × Vitis labrusca L.) is a promising red-skinned grape cultivar with great development potential and broad cultivation prospects in northern China due to its excellent quality and unique aroma. The objective of this research was to explore the effects of LED supplementary light on grape clusters in protected conditions, with a focus on enhancing grape growth and improving berry quality. This research provides a theoretical foundation and technical strategy for optimizing grape production.
-
This experiment was conducted from August to October 2022 in a rain shelter greenhouse covered with polyvinyl film located in Beiduoduo farm of Laixi City (120°50' E, 37°00' N). Three-year-old table grape cultivars of 'Queen Nina' (Vitis vinifera L. × V. labrusca L.) were grown in rain shelters under drip irrigation and were trained with a 'T' type trellis system and south-north rows. Each vine included 25 bunches of grapes.
Supplemental light treatments started at 80 days (d) after the beginning of flowering and continued 45 d until the commercial harvest stage. A total of six distinct LED light treatments (MGC-380A-LED; Pulangke, Ningbo, China) were arranged during a 4 h period after sunset, including LED white light (W), LED red light (R), LED blue light (B), the combination of red and blue light at a 1:1 ratio (R1B1), the combination of red and blue light at a 4:1 ratio (R4B1), and the combination of red and blue light at a 1:4 ratio (R1B4). The control treatment was only natural light without supplementary artificial lighting. Each LED light strip was 1.5 m long and each light intensity was maintained at approximately 50 ± 5 μmol/(m2·s). Each treatment contained three independent biological replicates and every replicate included three grapevines. Furthermore, 100 grape berries were randomly sampled (including the top, middle, and bottom parts of the clusters) from three biological replicates at the following times: 0, 15, 30, and 45 d after treatment. The skin and flesh of the berries were separated and immediately frozen in liquid nitrogen and kept at −80 °C.
Determination of basic physical and chemical indicators
-
The single berry weight (g) of grape berries was determined using an electronic analytical balance (0.01 g). The longitudinal and transverse diameters (mm) were measured using an automatic vernier caliper. Total soluble solids (TSS, °Brix) and titratable acidity (TA, %) were measured by using hand-held digital refractometers (ATAGO PAL-BX/ACID F5, Tokyo, Japan) according to the manufacturer's guidelines. Color differences of the grape berries under different treatments were determined using a digital colorimeter model Chroma Meter CR-400 (Konica Minolta, Osaka, Japan) and the color were expressed as CIELab values: Lightness (L*), redness (a*), and yellowness (b*). The Chroma C* (color saturation) was calculated as follows:
$ C = \sqrt{a^2+b^2} $ $ h=arctan\dfrac{b*}{a*} $ Determination of the content of soluble sugar and organic acid
-
The extraction of soluble sugars and organic acids was modified based on a previous method[57]. For the extraction of soluble sugars, 5 g of finely ground powder was moved to 10 mL of pure acetonitrile as extraction solvent. The mixture was subjected to ultrasound at 40% power and 30 °C for 20 min. After centrifugation at 5,000 rpm for 10 min, the supernatant was moved to a new 50 mL centrifuge tube. A second extraction was performed using 10 mL of the extraction solvent, and the combined supernatants were mixed up to a final volume of 25 mL. One milliliter of the extracted buffer was filtered using a 0.45 μm polypropylene syringe filter on HPLC assay. The chromatographic column used is Xtimate NH2 5 μm 4.6 mm × 300 mm, with a mobile phase of pure acetonitrile (A) and water (B). The gradient solution program was as follows: 85%A (0 min), 85%A (13 min), 85%A (13.1 min), 75%A (25 min), 75%A (25.1 min), 65%A (35 min), 65%A (35.1 min), and 85%A (45 min). The flow speed was set at 1 mL/min, and the injection volume 5−10 μL. The column temperature was kept at 40 °C.
For the extraction of organic acids, ultra-pure water was set as the extraction solution, and the extraction procedure was the same as that for soluble sugars. One milliliter of the extracted elution was filtered using a 0.45 μm polypropylene syringe filter on HPLC assay. The chromatographic column used was an Agilent Polaris C18 5 μm 4.6 mm × 250 mm, with a mobile phase of 0.1% phosphoric acid aqueous solution (A). The gradient elution program was as follows: 100%A (0 min), 100%A (15 min), 0%A (15.1 min), 0%A (22 min), 100%A (22.1 min), and 100%A (29 min). The flow speed was set at 1 mL/min, and the injection volume 5−10 μL. The column temperature was kept at 40 °C.
Quantitative analysis of anthocyanins
-
The total anthocyanin content (TAC) was measured with a methanol-HCl technique. Anthocyanin content was measured using the pH differential method[58]. The absorbance value of these extracts was calculated in 510 and 700 nm in solutions in pH 1.0 and pH 4.5, respectively. Data is shown as mg cyanidin-3-glucoside equivalents/100 g fresh weight (FW) through a molar extinction coefficient of 29,600.
The extraction method for the anthocyanin component was modified based on a previous method[17]. Five grams of grape berry peels were randomly selected from each treatment on each sampling date and homogenized after freezing with liquid nitrogen. Three replicates were performed for each treatment. The sample was dissolved into 35 mL of methanol buffer and subjected to ultrasound at 40% power and 30 °C for 10 min, following by shaking at 220 rpm for 1 h in a shaker at 30 °C. After centrifugation at 5000 rpm for 5 min, the supernatant was transferred to a new 50 mL centrifuge tube. The sample was subjected to a second extraction in 10 mL methanol solution, then the combined supernatants were mixed to a final volume of 50 mL. One mL of the extracted buffer was filtered using a 0.45 μm polypropylene syringe filter on HPLC assay. The chromatographic column used is XBridge BEH C18 5 μm 4.6 mm × 250 mm XP, with a mobile phase of 0.1% formic acid aqueous buffer (solution A) and 0.1% formic acid acetonitrile buffer (solution B) as the organic phase. The gradient elution program was as follows: 8%A (0 min), 9%A (1 min), 12%A (30 min), 100%A (40 min), and 6%A (41 min) as the stop time. The flow speed was set in 1 mL/min, and the injection volume was 5−10 μL. The column temperature was maintained at 40 °C.
Quantitative analysis of flavonoids
-
The extraction method for flavonoids was modified based on a previous method[59]. Five grams of freeze-dried sample were homogenized after grinding with liquid nitrogen, and 5 mL of 80% ethanol was added. The samples were subjected to ultrasound at 40% power and 30 °C for 30 min. After centrifugation at 5000 rpm for 5 min, the supernatant was transferred to a new 50 mL centrifuge tube. The sample was subjected to a second extraction using 5 mL of 80% ethanol solution, and the combined supernatants were mixed up to a final volume of 15 mL. This extraction liquid was then dried using a nitrogen evaporator (N-EVAP 112, Organomation, USA) and re-dissolved into 5 mL of methanol. The buffer was filtered using a 0.45 μm polypropylene syringe filter on LC-MS assay.
The chromatographic column worked is XBridge BEH C18 2.5 μm 3.0 mm × 150 mm XP, through a mobile phase of methanol containing 0.01% formic acid (A) and an aqueous buffer containing 0.01% formic acid (B). The gradient solution program was as follows: 10%A (0 min), 30%A (5 min), 30%A (8 min), 50%A (18 min), 50%A (25 min), 70%A (29 min), 100%A (33 min), 10%A (34 min), and 10%A (37 min) as the stop time. The flow speed was set at 0.4 mL/min, and the injection volume was 1−5 μL. The column temperature was kept at 40 °C.
Determination and analysis of volatile organic compounds (VOCs)
-
The grape berry skin from these samples were ground into powder under liquid nitrogen, and 1.0 g of the powder was used for the harvest of VOCs as per a previously described method[60]. After grounding desorption of the VOCs of the fibre coating was conducted in the injection port of the GC apparatus (Model 8890; Agilent) at 250 °C for 5 min under the splitless mode. The identification and quantification of VOCs was conducted with a Agilent Model 8890 GC and a 7000D mass spectrometer (Agilent), equipped with a 30 m × 0.25 mm × 0.25 μm DB-5MS (5% phenyl-polymethylsiloxane) capillary column. The MS was selected ion monitoring (SIM) mode that was used for the identification and quantification of chemical compounds. VOCs were identified by comparing the mass spectra using the data system library (MWGC or NIST) and linear retention index (Metware Biotechnology Co., Ltd., Wuhan, China). For two-group analysis, differential metabolites were determined by VIP (VIP > 1) and absolute Log2FC (|Log2FC| ≥ 1.0). Furthermore, the coefficient of variation (CV) values and principal component analysis (PCA) was derived using a previously described method[61].
Sensory determination of grape berries
-
Sensory determination of grape samples was performed under a standard sensory analysis chamber as per a previously reported method[8]. The panellists consisted of 14 experienced specialists, aged between 21 and 35 (seven women and seven men), who have professional sensory abilities to identify and characterize grape berries. The grape berries from different light treatments were scored through a 5-point scoring system as the following descriptors: A, colour intensity; B, sweetness; C, acidity; D, taste balance; and E, aroma intensity. The process was carried out in triplicate.
Statistical analyses
-
Statistical analyses were conducted using SPSS software to assess significant differences between treatments in the same developmental stage through one-way analysis of variance (ANOVA) and Duncan's multiple range test (p < 0.05). Data are presented as mean ± standard deviation (SD). The normalized raw data of 19 metabolites after taking the Z-score were used for correlation analysis and PCA analyses[8]. PCA was performed through a correlation matrix and between-groups algorithm method. The raw data for volatile metabolites were normalized using Z scores for heatmap analysis. Graphs were constructed using Origin 2023 (OriginLab Corporation, Northampton, MA, USA) and GraphPad Prism 8 (GraphPad Software, 225 Franklin Street. Fl. Boston, MA, USA).
-
The influences from different light treatments on the quality and sensory properties of 'Queen Nina' grapes were explored with natural light as a control. Although the skin color from all grapes experienced a gradual transition from green to red, the color appearances were dramatically affected by the different light treatments (Fig. 1a). At 45 d after treatment, grape skins treated with R1B4 treatment showed a uniform and complete red coloration, while those under white light exhibited a yellowish red hue, and the control group mainly retained a light-yellow color (Fig. 1a). Additionally, our findings revealed that R1B4 treatment also increased single berry weight and transverse diameter (Fig. 1b & d), whereas the longitudinal diameter was not affected by light treatment (Fig. 1c).
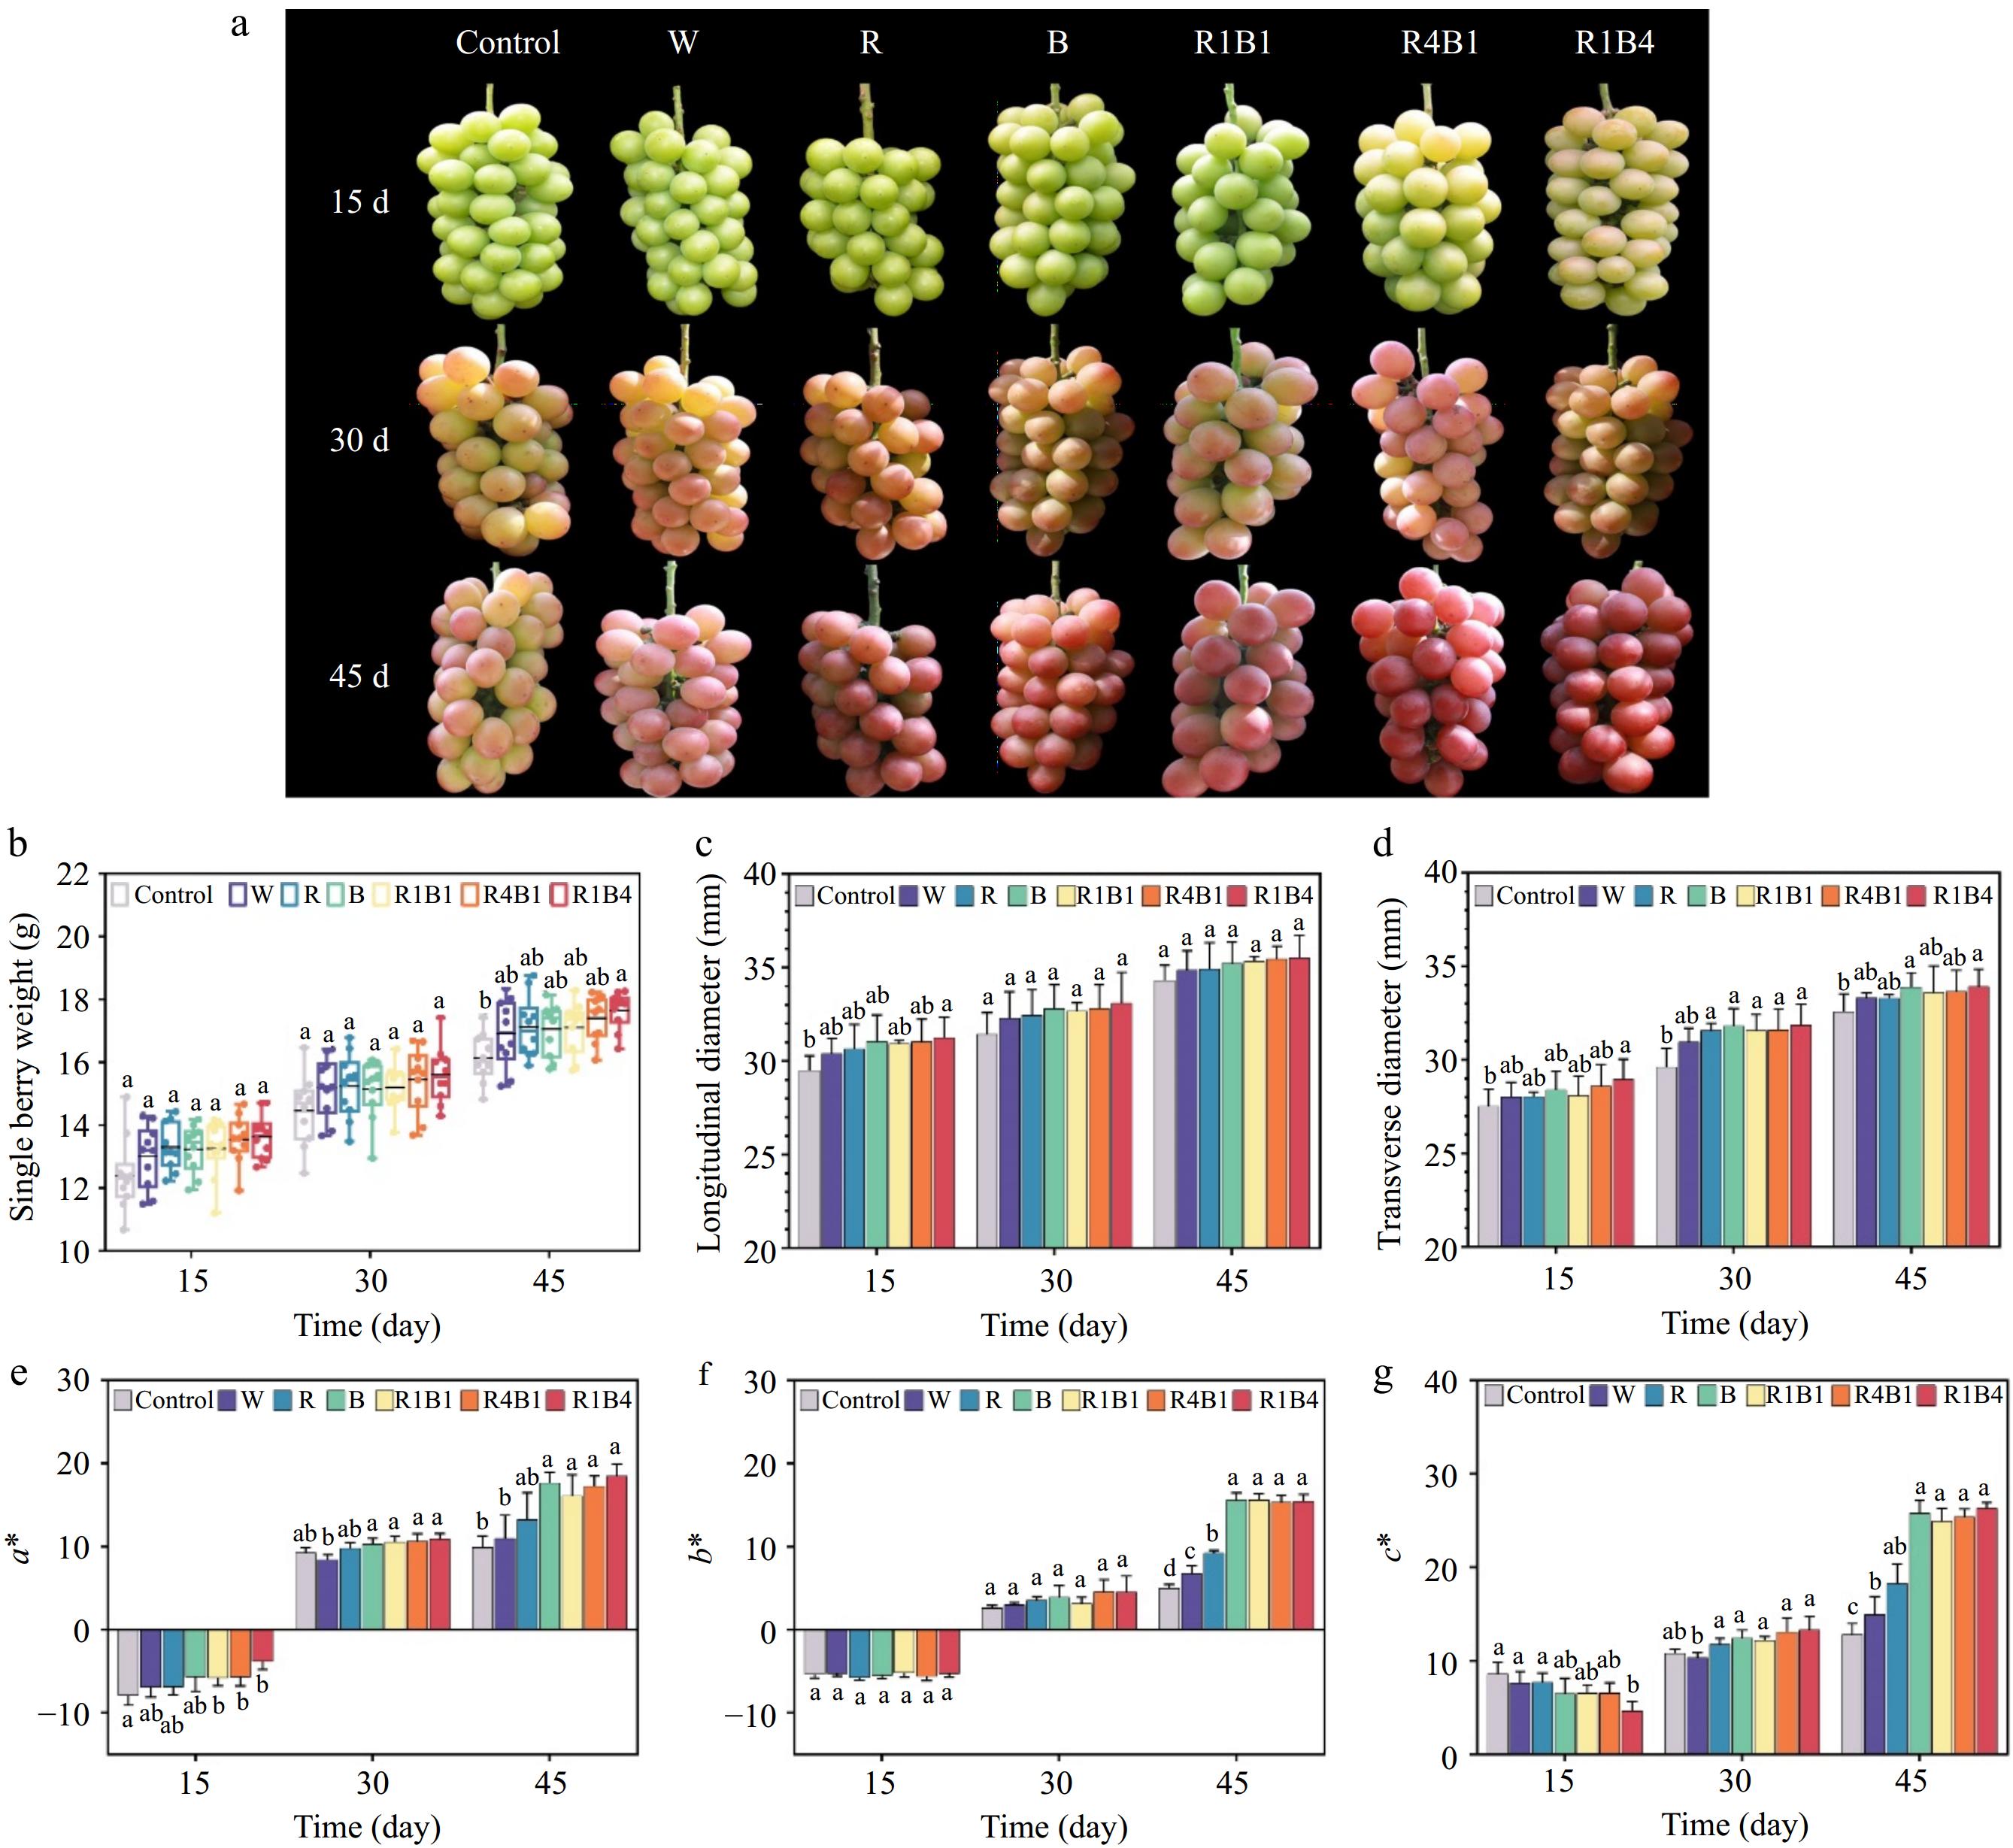
Figure 1.
Phenotypic and physiological characteristics of grapes under different light quality treatments. (a) Color phenotypes of 'Queen Nina' grapes at 15, 30 and 45 d after treatment with different light qualities. Abbreviations: W, white light treatment; R, red light treatment; B, blue light treatment; R1B1, red and blue light at a 1:1 ratio; R4B1, red and blue light at a 4:1 ratio; R1B4, red and blue light at a 1:4 ratio. (b)−(d) Measurement of various physiological parameters including individual berry weight, longitudinal and transverse diameters. (e) Color difference a*; (f) Color difference b*; (g) Color saturation c*. Data are presented as mean ± standard deviation (n = 10). Different letters indicate statistically significant differences based on one-way analysis of variance (P < 0.05).
Different color parameters, including a*, b*, and c*, were employed to evaluate the changes in berry color. The a* positive and negative values denote red and green, and b* positive and negative values signify yellow and blue, respectively. The c* describes color saturation and the higher c* value represents the more saturation in the color[62]. The control samples displayed an increasing trend in a*, b*, and c* values, implying a gradual transition in the skin color from green to red (Fig. 1e−g). Similar tendencies were also investigated among all treatments, including the natural maturation process and the phenotype changes of grape berries. Furthermore, the a*, b*, and c* values of R1B4, R4B1, R1B1, and B treatments were significantly higher than those of other treatments at 45 d after light exposure (Fig. 1e−g). These results confirmed that R1B4, R4B1, R1B1, and B treatments could induce superior redness in 'Queen Nina' grapes when compared to the R treatment, W treatment, and control environments.
Light treatment accelerates sugar accumulation and decreases the content of acid in grape
-
The TSS and TA are closely associated with the fruit taste and consumer acceptability. All light treatments significantly increased the accumulation of TSS and decreased the TA concentration (Fig. 2a & b), resulting in a gradually increasing TSS/TA ratio during the ripening stages (Fig. 2c). After 45 d of different light treatments, R1B4 had the highest TSS/TA ratio, followed by B treatment, whereas the control had the lowest TSS/TA ratio (Fig. 2c).
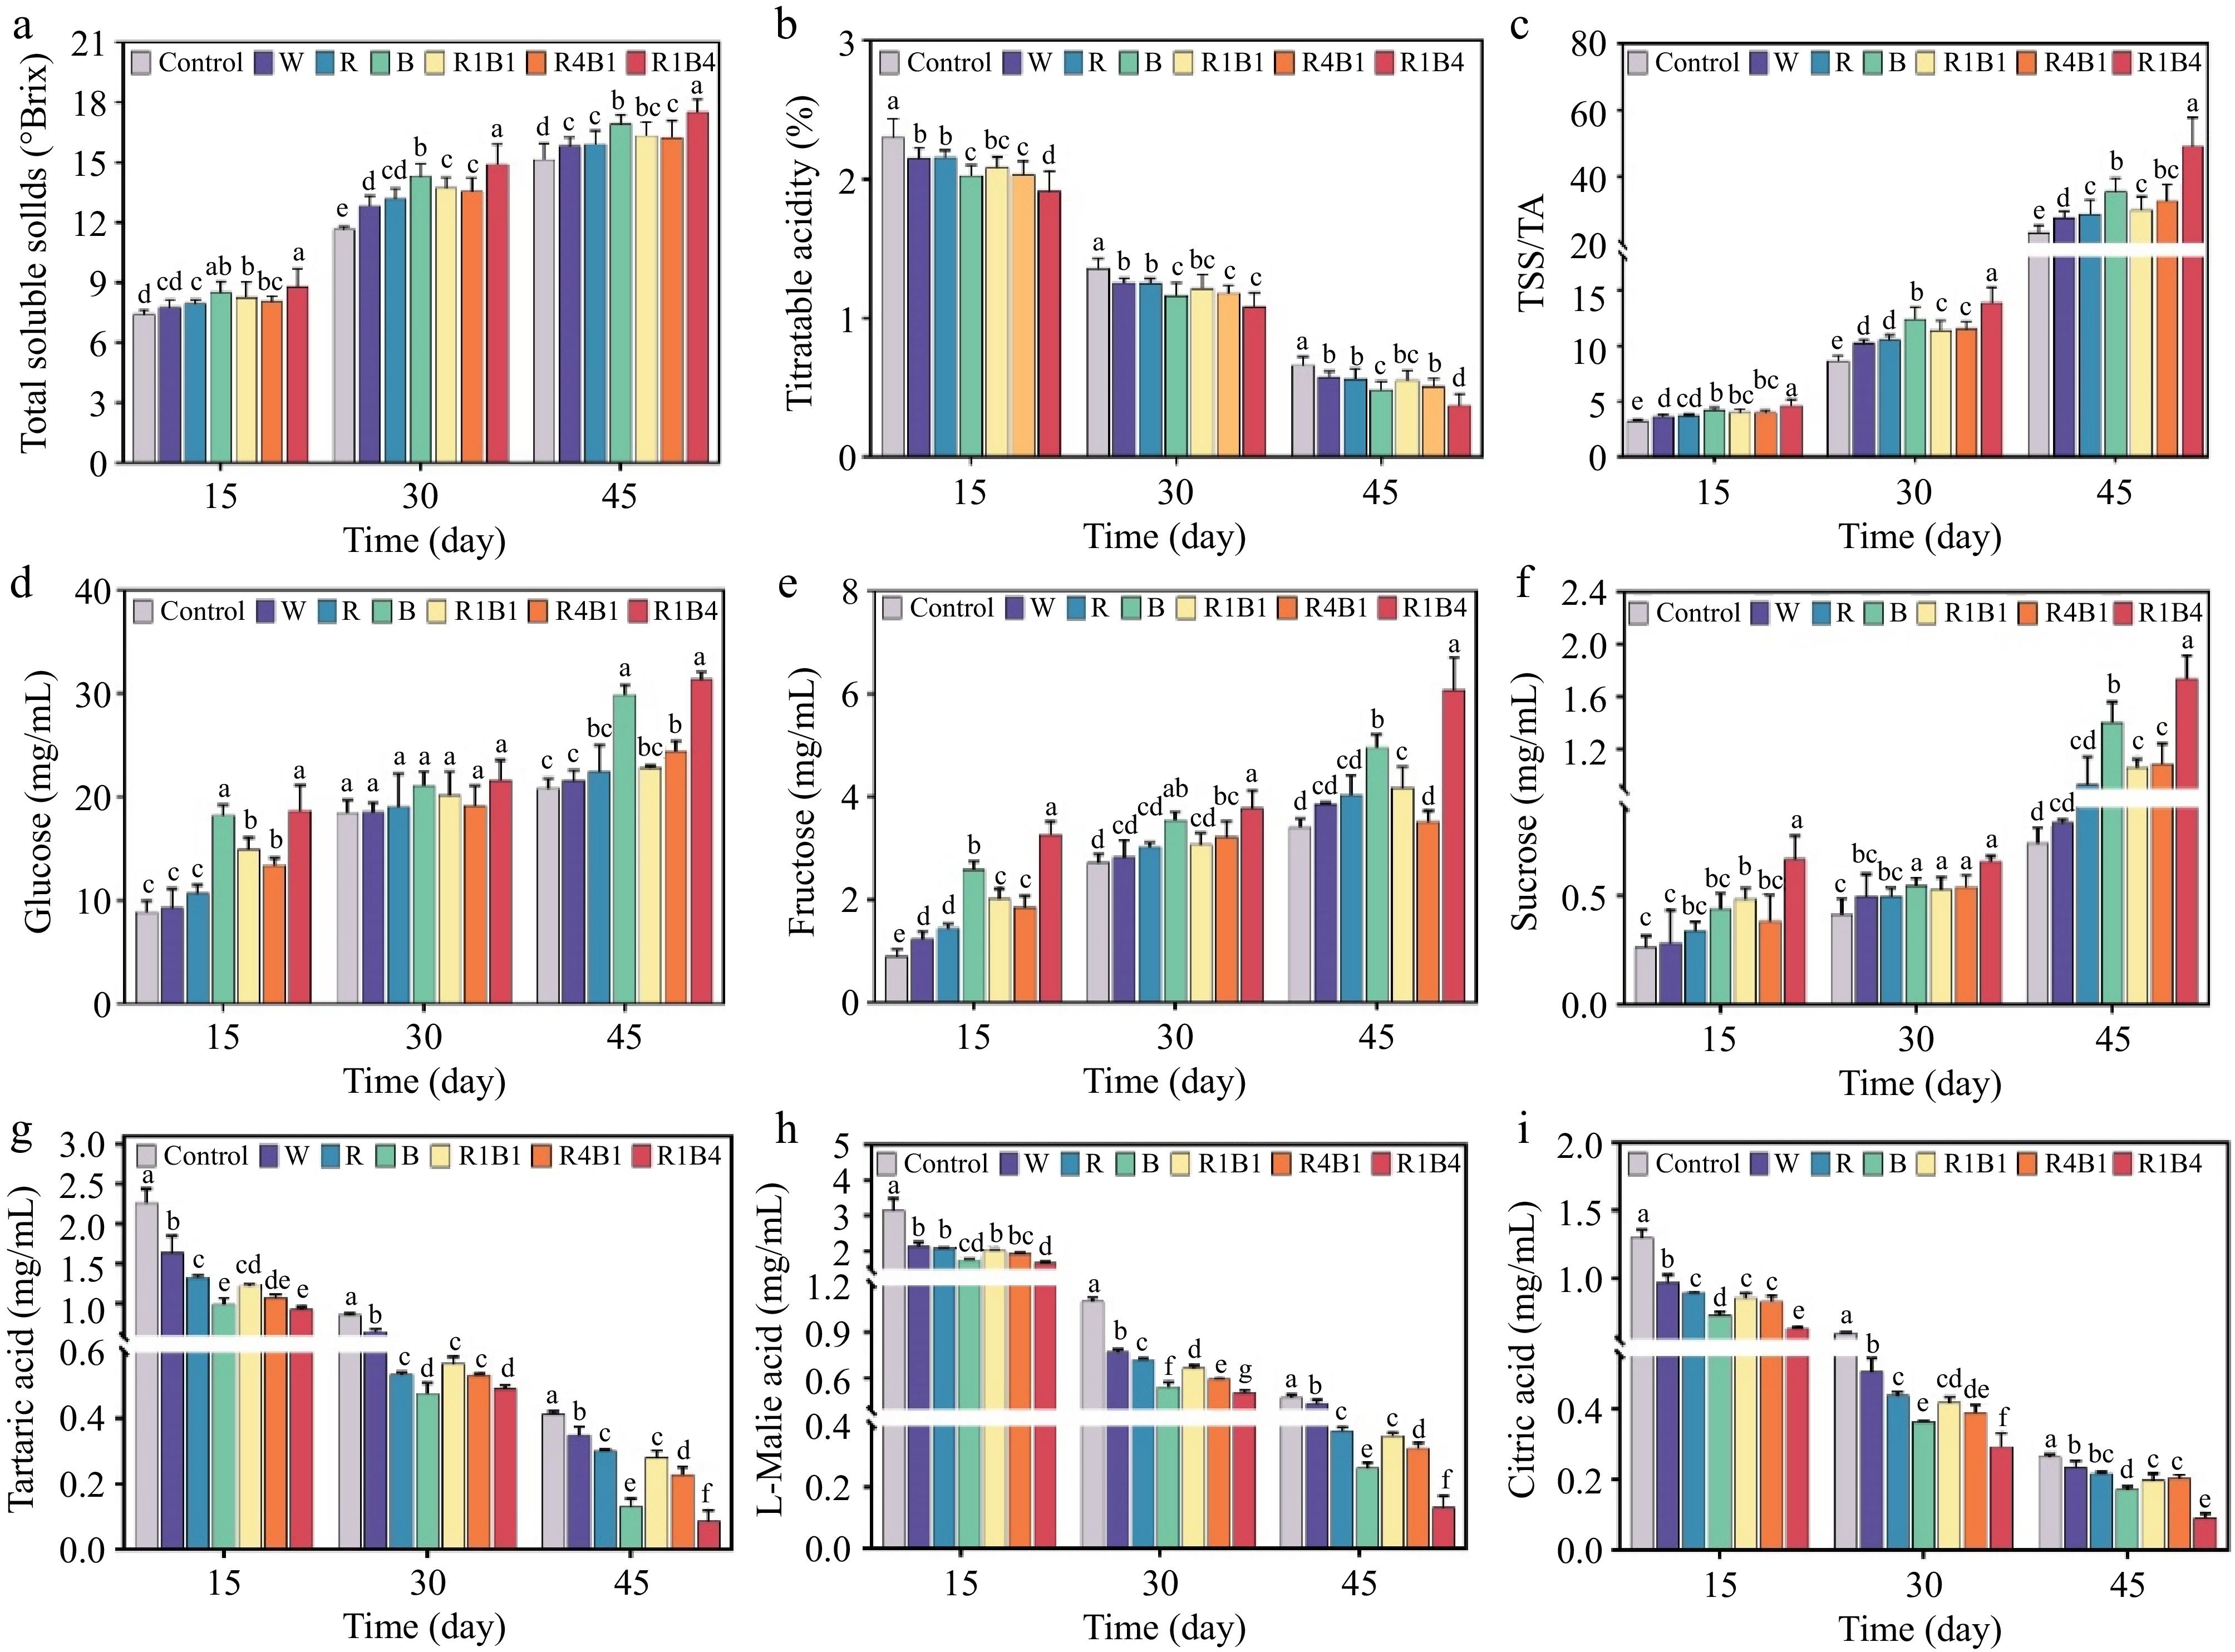
Figure 2.
Changes of sugar and acid in grape berry after different light quality treatments at 15, 30, and 45 d. (a) Total soluble solids content (TSS); (b) Titratable acidity (TA); (c) Sugar acid ratio (TSS/TA); (d) Glucose content; (e) Fructose content; (f) Sucrose content; (g) Tartaric acid content; (h) L-malic acid content; (i) Citric acid content. Data are presented as mean ± standard deviation (n = 3). Different letters indicate statistically significant differences based on one-way analysis of variance (p < 0.05).
The contents of these soluble sugars, including glucose, fructose, and sucrose, were determined. Glucose exhibited the highest concentration, followed by fructose, whereas sucrose had the lowest concentration in both the control and light-treated berries (Fig. 2d−f). Compared to the control berries, R1B4, B, and R4B1 treatments significantly increased glucose content by 50.54%, 43.51%, and 17.20% at 45 d after treatment, respectively (Fig. 2d). Correspondingly, fructose content was induced by R1B4 (78.22%), B (45.41%), and R1B1 (22.36%) and sucrose content was elevated by R1B4 (134.68%), B (89.64%) R1B1 (43.24%), and R4B1 (46.85%) at 45 d after treatment, respectively (Fig. 2e & f). Overall, R1B4 and B treatments increased the soluble sugar content of the berries. In contrast, W and R treatments altered the soluble sugars content in a statistically insignificant manner.
The contents of the three organic acids were measured. The malic, tartaric, and citric acid gradually decreased in all treatments; however, the different light treatments always had lower levels of these acids compared to control berries, especially for the R1B4 and B treatments (Fig. 2g−i). The tartaric, malic, and citric acids were decreased by 79.08%, 72.05%, and 65.27% at 45 d after R1B4 treatment compared to control berries, respectively (Fig. 2g−i). Taken together, different light-quality treatments in grape during ripening increased soluble sugar content and decreased organic acid content by different degrees. R1B4 and B treatments were more effective than R and W light treatments, which might help grape to produce higher sweetness and lower sourness.
Different light treatments promote anthocyanin accumulation and chlorophyll degradation
-
Fruit skin color is mainly determined through anthocyanin accumulation and chlorophyll degradation. To better understand its anthocyanin profiles under different light quality treatments, TAC and five basic individual anthocyanin, including Peonidin-3-O-glucoside content (Pn), Cyanidin-3-O-glucoside (Cy), Petunidin-3-O-glucoside (Pt), Delphinidin-3-O-glucoside (Dp), and Malvidin-3-O-glucoside (Mv), were measured from the skin of grape berries. Compared to control berries, the TAC was significantly increased at all three experimental stages by all light treatments, especially for the R1B4 and B groups (Fig. 3a), suggesting a critical role of light in anthocyanin accumulation.
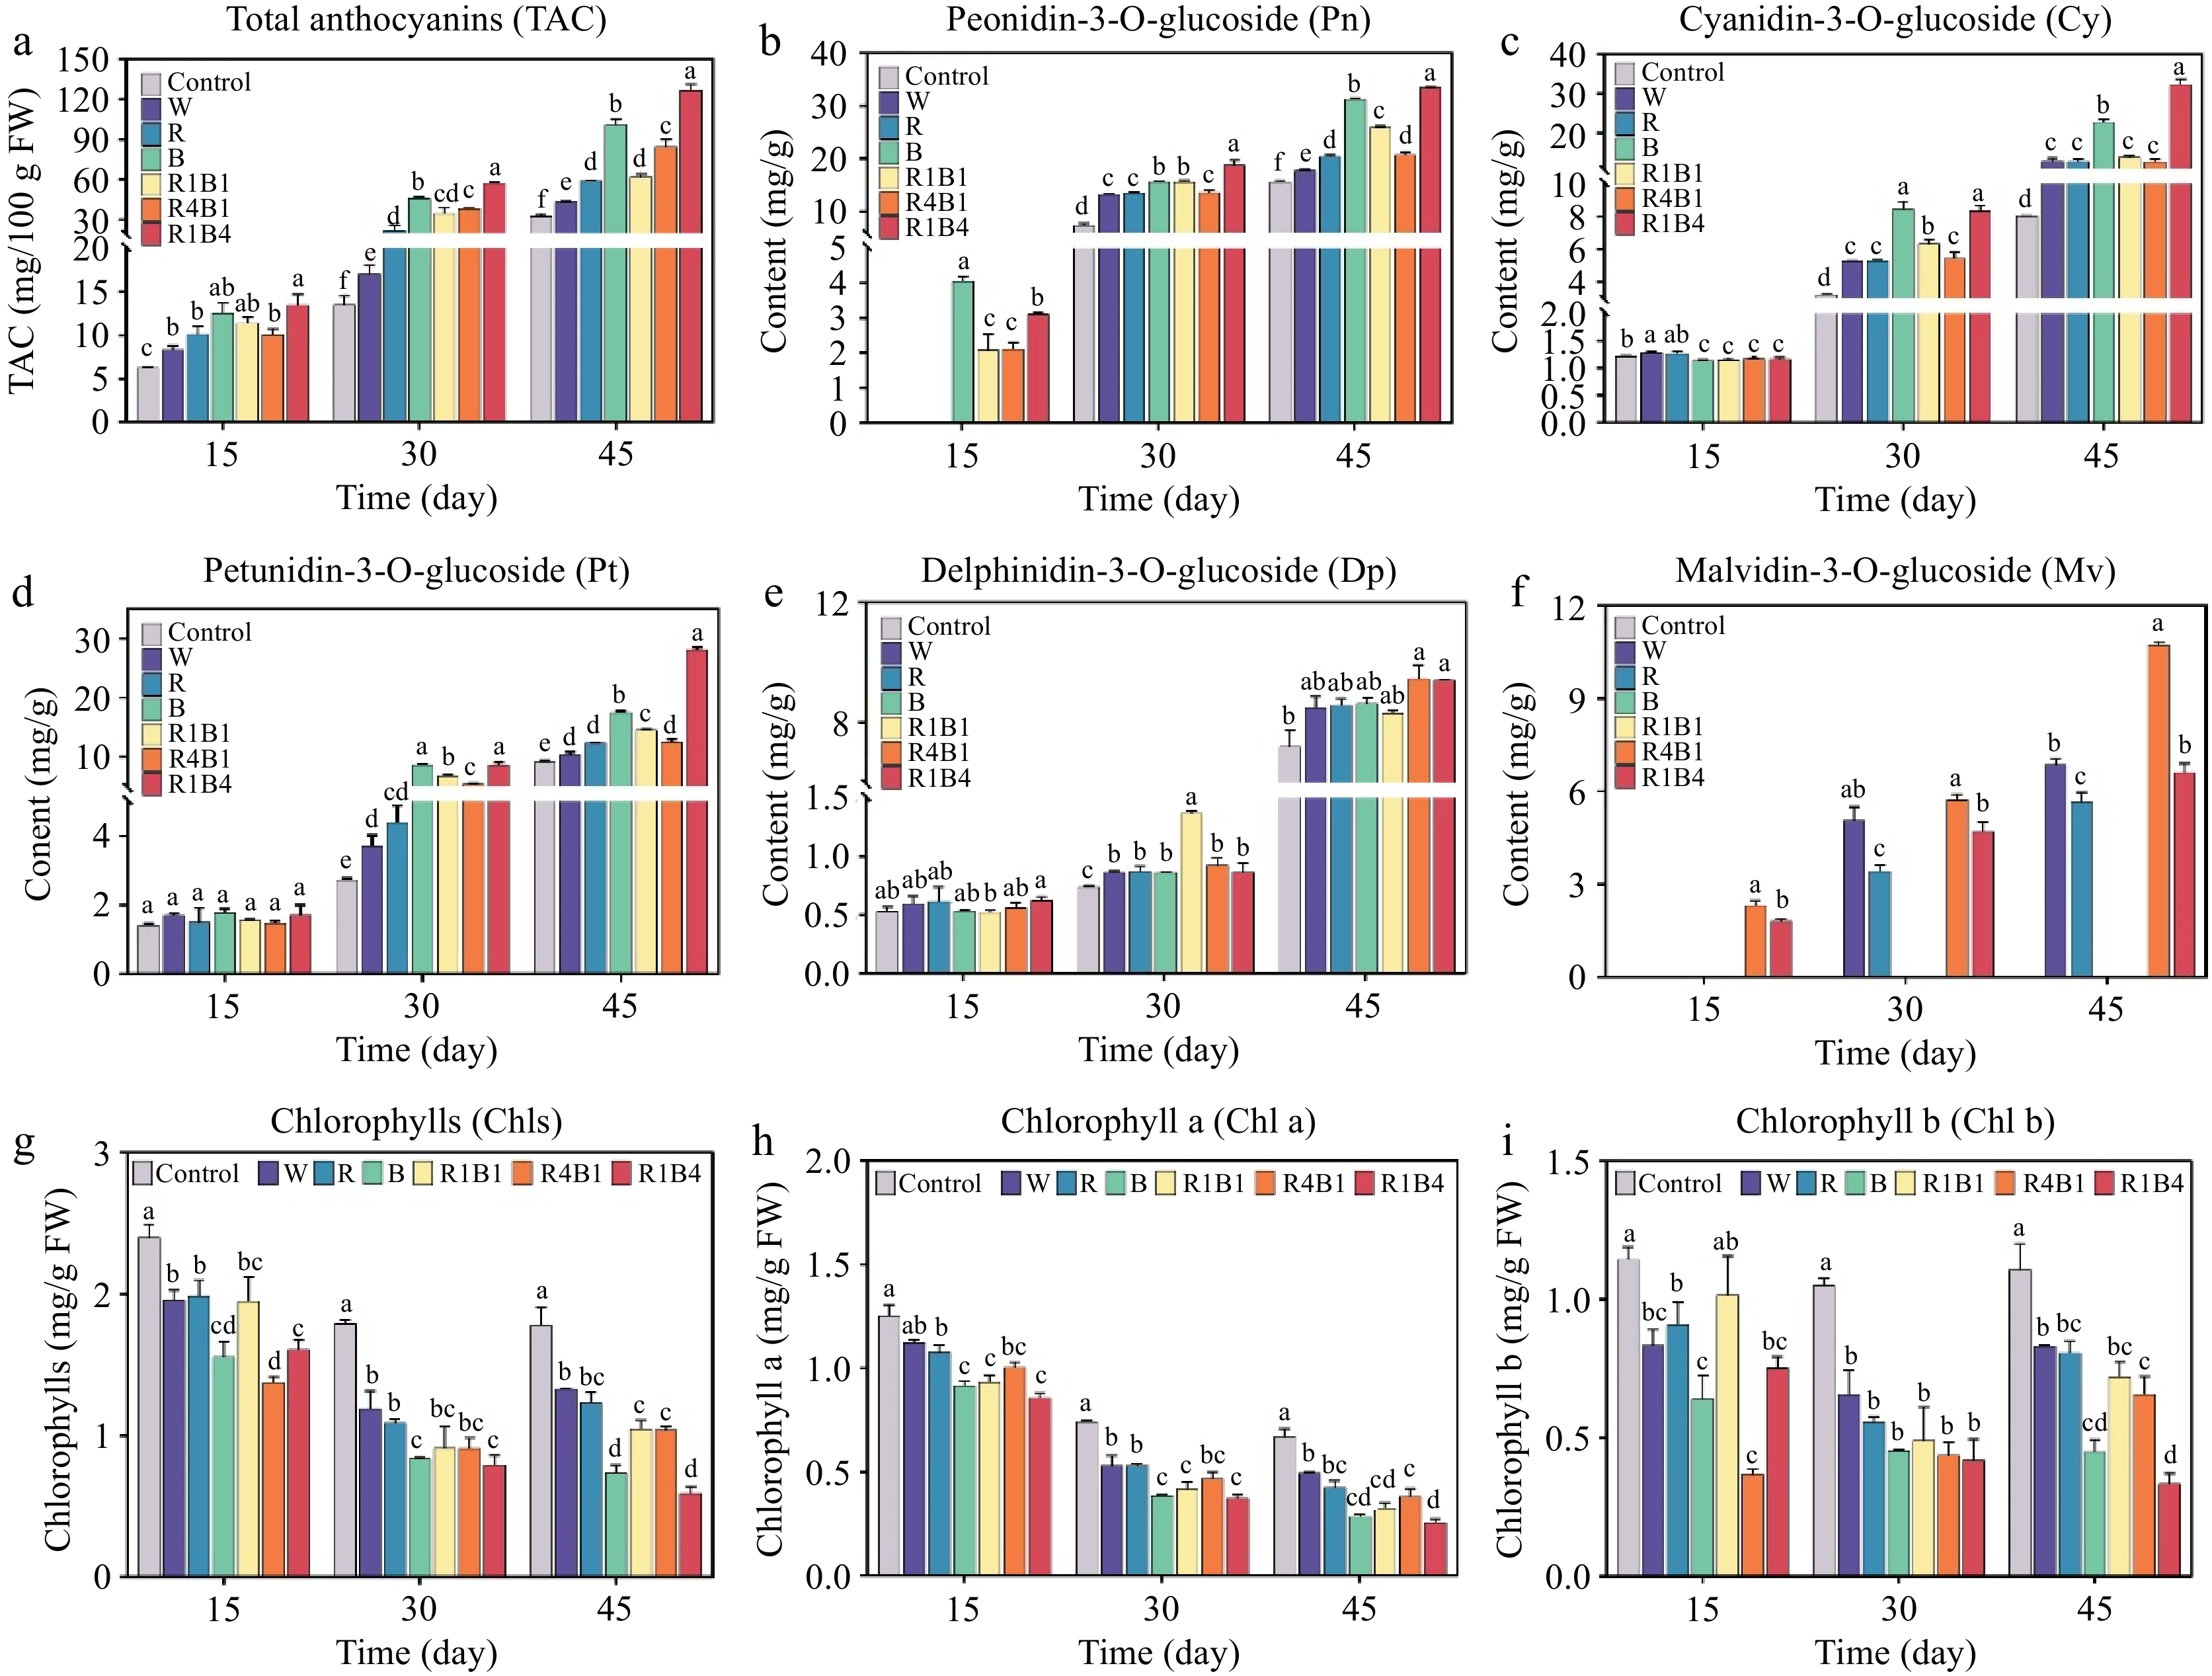
Figure 3.
Changes in grape berry anthocyanin components and color difference after different light quality treatments at 15, 30, and 45 d. (a) Total anthocyanin content (TAC); (b) Peonidin-3-O-glucoside content (Pn); (c) Cyanidin-3-O-glucoside content (Cy); (d) Petunidin-3-O-glucoside content (Pt); (e) Delphinidin-3-O-glucoside content (Dp); (f) Malvidin-3-O-glucoside content (Mv); (g)−(i) total chlorophyll content, chlorophyll a content, chlorophyll b content at each time point. Data are presented as mean ± standard deviation (n = 3). Different letters indicate statistically significant differences based on one-way analysis of variance (P < 0.05).
Five basic single anthocyanins (including Cy, Pn, Dp, Pt, and Mv) increased significantly under the different light qualities in grape berries (Fig. 3b−f). Among all anthocyanin derivatives, the contents of Pn and Cy were more abundant than Dp, Pt, and Mv. For example, the percentage of Pn and Cy altered from 50.6% in the R4B1 group to 67.5% in the B group at 45 d after different light treatments (Supplementary Fig. S1). Additionally, R1B4 and B treatments increased the proportion of Cy, whereas R4B1 treatment elevated the proportion and content of Mv (Fig. 3b−f, Supplementary Fig. S1). Furthermore, the content of most anthocyanin compositions was highest under the R1B4 treatment but lowest under the W treatment (Fig. 3b−f), indicating that the R1B4 light was the most appropriate measure in promoting anthocyanin accumulation in grape.
Furthermore, the dynamic changes in chlorophyll (Chl) concentration of grape skins were estimated to investigate the impact of light treatment in chlorophyll degradation. The Chl concentration of grape skins displayed a gradual reduction trend during berry ripening. After 45 d of treatment, the total Chl concentration was obviously lower in grape berries at R1B4 and B treatments in comparison with other treatments (Fig. 3g). The model still established authentic when chlorophyll a (Chl a) and chlorophyll b (Chl b) was investigated, respectively (Fig. 3h & i). Our results suggested that Chl degradation was susceptible to light treatment. Taken together, exogenous light irradiation, especially to R1B4 treatment, promoted grape color transformation by accelerating the synthesis of anthocyanin and the degradation of chlorophyll.
Different light treatments affect flavonoid concentration and composition
-
A total of 12 flavonoids, belonging to four subclasses of flavonoids, were identified at the ripening stage of 'Queen Nina' grapes. Among these, procyanidin B1 (PB1), procyanidin B2 (PB2), catechin, epicatechin, and epigallocatechin gallate (EGCG) belonged to the flavanols subclass of flavonoids. Quercetin-galctoside (quercetin-gal), quercetin-glucoside (Quercetin-glu), myricetin-galctoside (Myricetin-gal), myricetin-glucoside (Myricetin-glu) and kaempferol-galctoside (Kaempferol-gal) belonged to the flavonols subclass of flavonoids. Daidzein and apigenin-7-O-glucoside (Api-7-O-glu) belonged to the isoflavones and flavones subclass, respectively (Fig. 4).
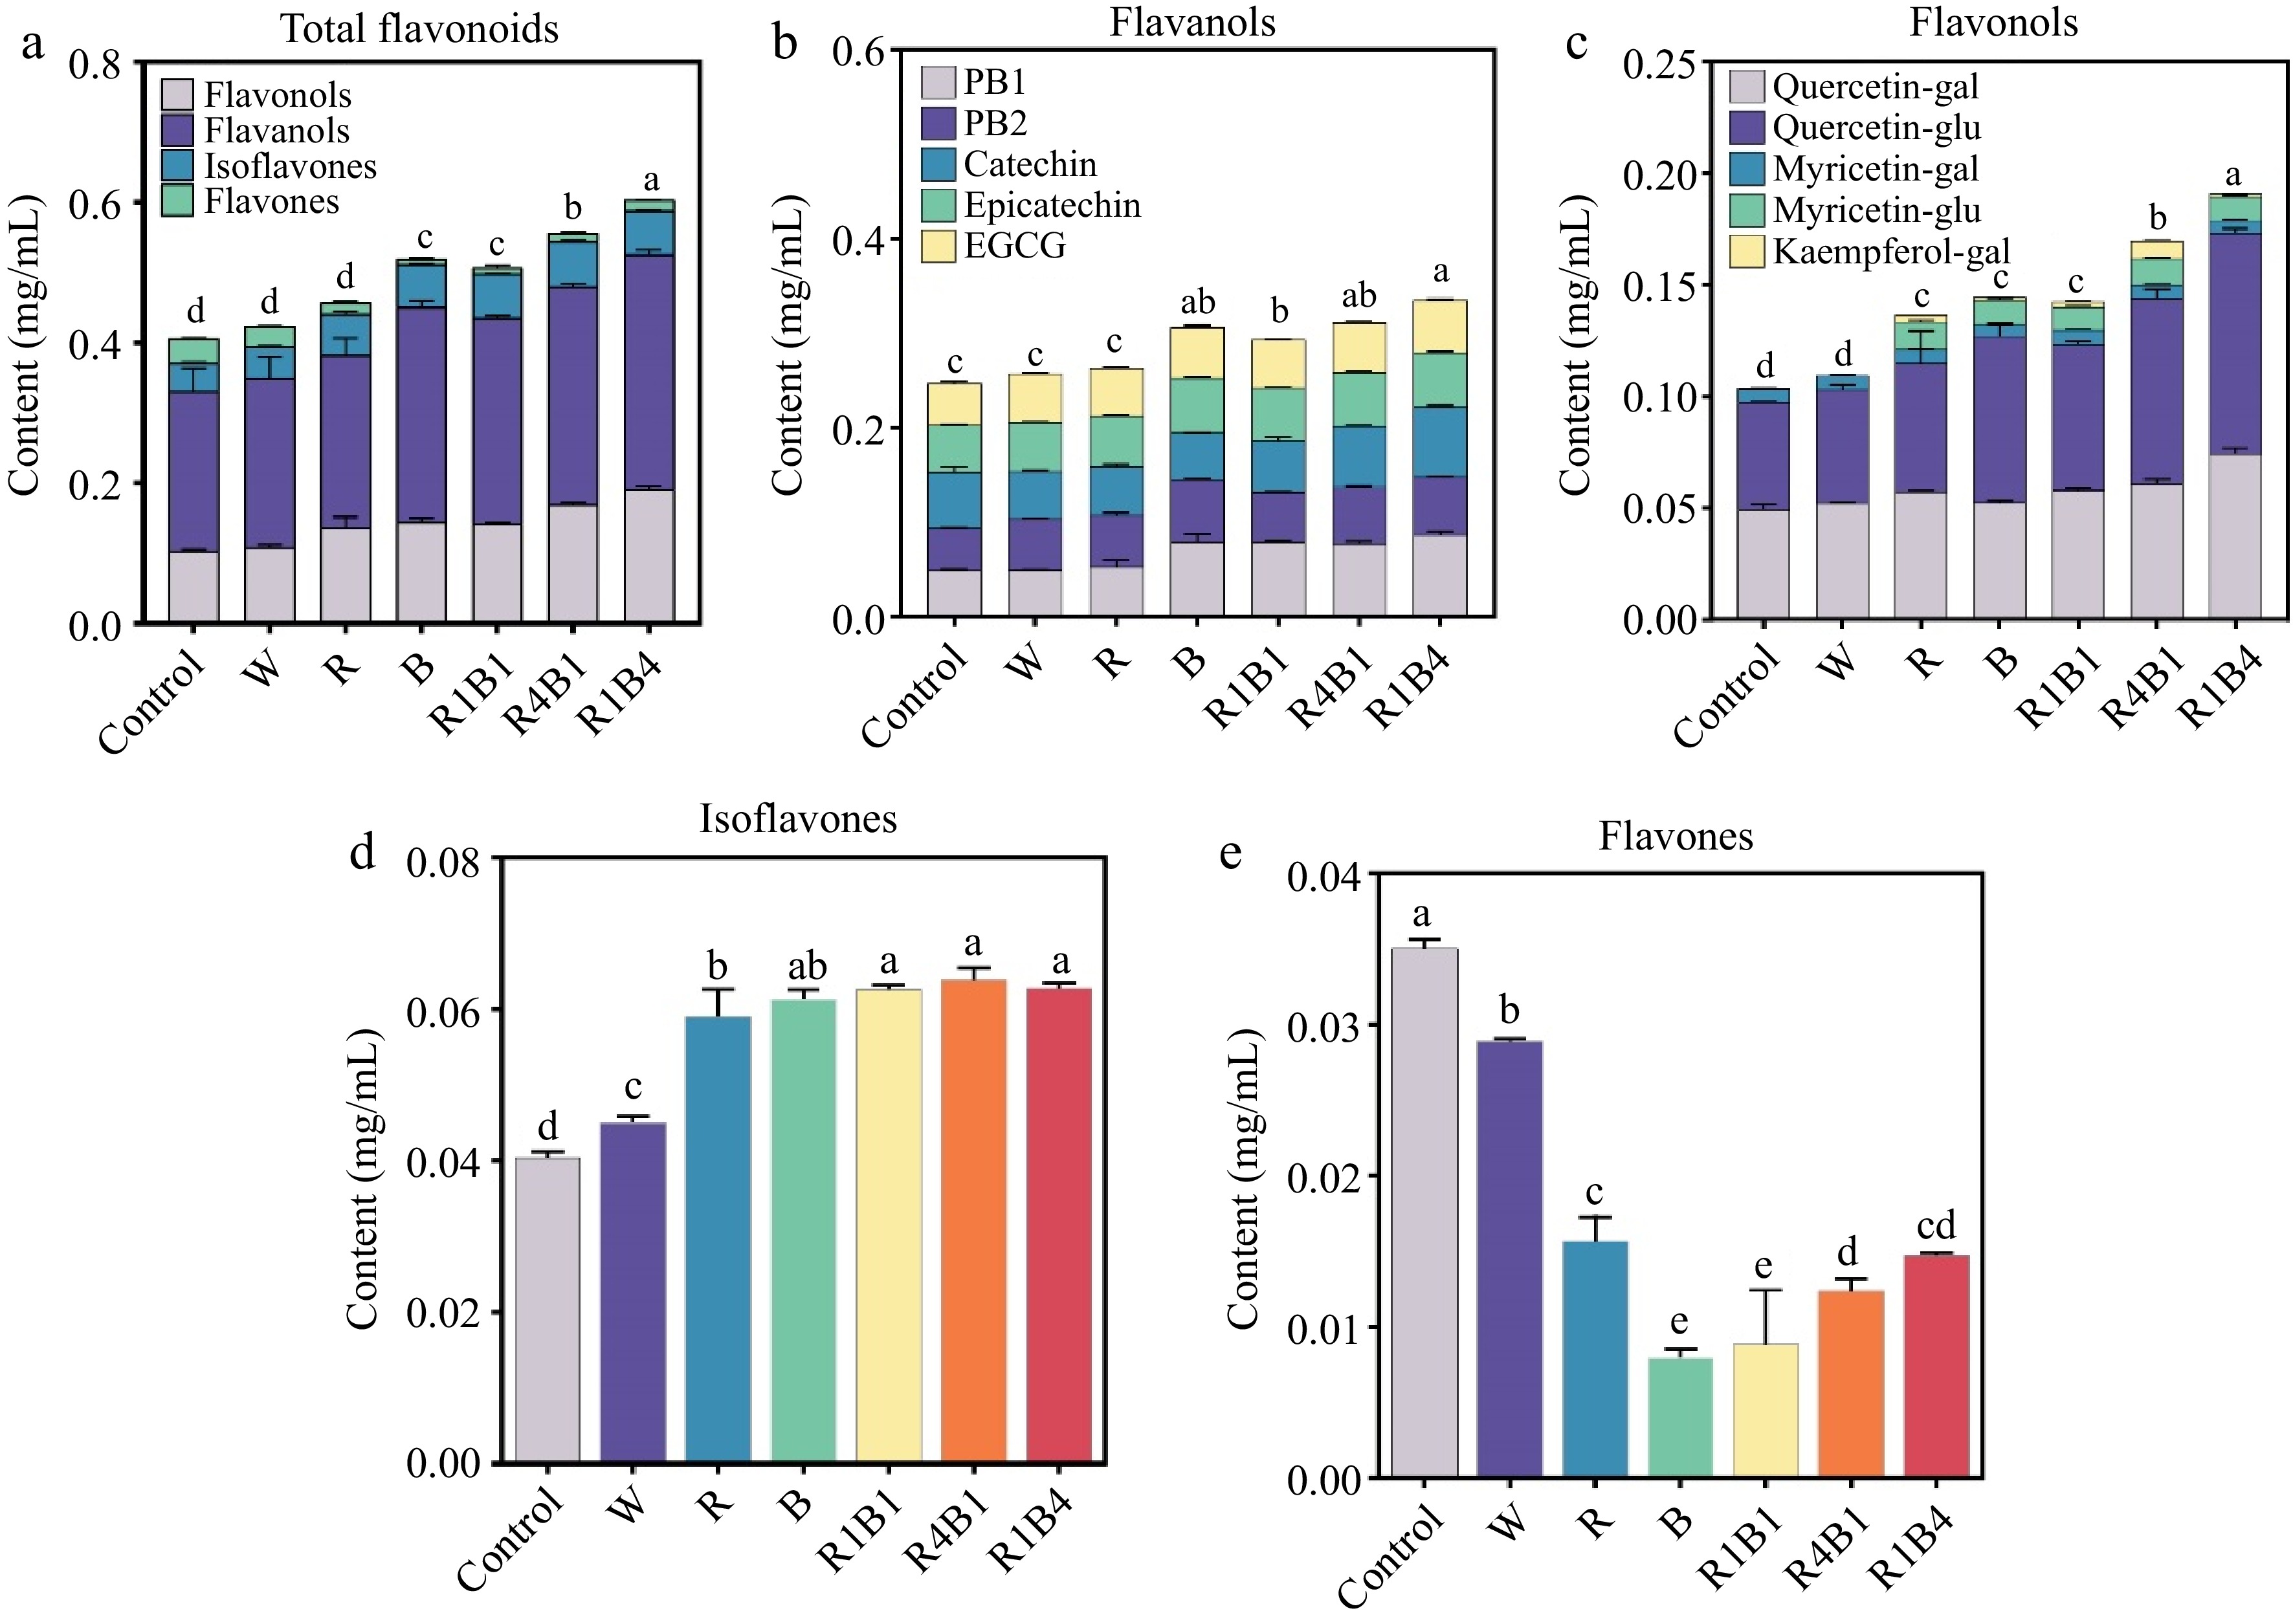
Figure 4.
Changes in grape berry flavonoid components after different light quality treatments at 45 d. (a) Total flavonoid content; (b) Flavanols content; PB1, procyanidin B1; PB2, procyanidin B2; EGCG, epigallocatechin gallate; (c) Flavonols content; Quercetin-gal, Quercetin-galctoside; Quercetin-glu, Quercetin-glucoside; Myricetin-gal, Myricetin-galctoside; Myricetin-glu, Myricetin-glucoside; Kaempferol-gal, Kaempferol-galctoside. (d) Isoflavones content; (e) Flavones content. Data are presented as mean ± standard deviation (n = 3). Different letters indicate statistically significant differences based on a one-way analysis of variance (p < 0.05).
Compared to the control group, the R1B4 treatment exhibited the highest total flavonoid content, followed by the R4B1 treatment, whereas R1B1 and B showed the lowest increase flavonoids content. Additionally, statistical analysis cannot display a significant difference among un-treated and W/R light treatment (Fig. 4a). The similar patterns were also investigated in flavanols and flavonols, respectively (Fig. 4b & c). Interestingly, the content of daidzein, the unique isoflavones, displayed an increasing trend in all light-treated groups (Fig. 4d). Conversely, a significant decrease was observed in the content of Api-7-O-glu, the unique flavones in 'Queen Nina' grapes (Fig. 4e). Furthermore, the flavanols ratio accounted for more than 50% of the total flavonoids among all the treatments, followed by flavonols (more than 25%), whereas flavones ratio was less than 9.0% of the total flavonoids (Supplementary Fig. S2). Therefore, the high content of total flavonoids in the R1B4 treatment was primarily due to the significantly higher levels of flavanols and flavonols.
Volatile organic compounds (VOCs) in response to different light treatments
-
VOCs are responsible for the primary aroma substances in grape berries. To investigate aroma characteristics among different light treatments, GC-MS was employed to identify and characterize VOCs at 45 d after treatment. The coefficient of variation (CV) analyses demonstrated that VOCs with CV values less than 0.3 in quality-control (QC) samples made up more than 85% (Supplementary Fig. S3a), suggesting that the results were believable. PCA indicated that all samples were well clustered mainly based on three biological replicates (Supplementary Fig. S3b). The cumulative percentage of the first five principal components come to 81.70%, with 31.14%, 19.88%, 13.54%, 10.60%, and 6.54% of the percentage of variance, respectively (Supplementary Fig. S3c). Furthermore, both the PC1 values of QC samples based on the ion peaks were within ± 3 standard deviation (Supplementary Fig. S3d). All these data suggested that the analysis showed good repeatability.
A total of 107 VOCs were identified and classified into 11 groups, including 32 esters, 24 terpenoids, 10 aromatics, nine heterocyclic compounds, eight ketones, eight acids, seven aldehydes, four alcohols, two phenols, two hydrocarbons, and one amine (Fig. 5a & b; Supplementary Table S1). Between them, the relative concentrations of esters, heterocyclic compound, terpenoids and acid were the top four in all samples (Fig. 5a; Supplementary Table S2). Esters had the largest variety and highest concentration of VOCs, reaching more than 42% of the total volatile compounds (Fig. 5a; Supplementary Table S2), indicating that esters are the main VOCs in the 'Queen Nina' grape cultivar.
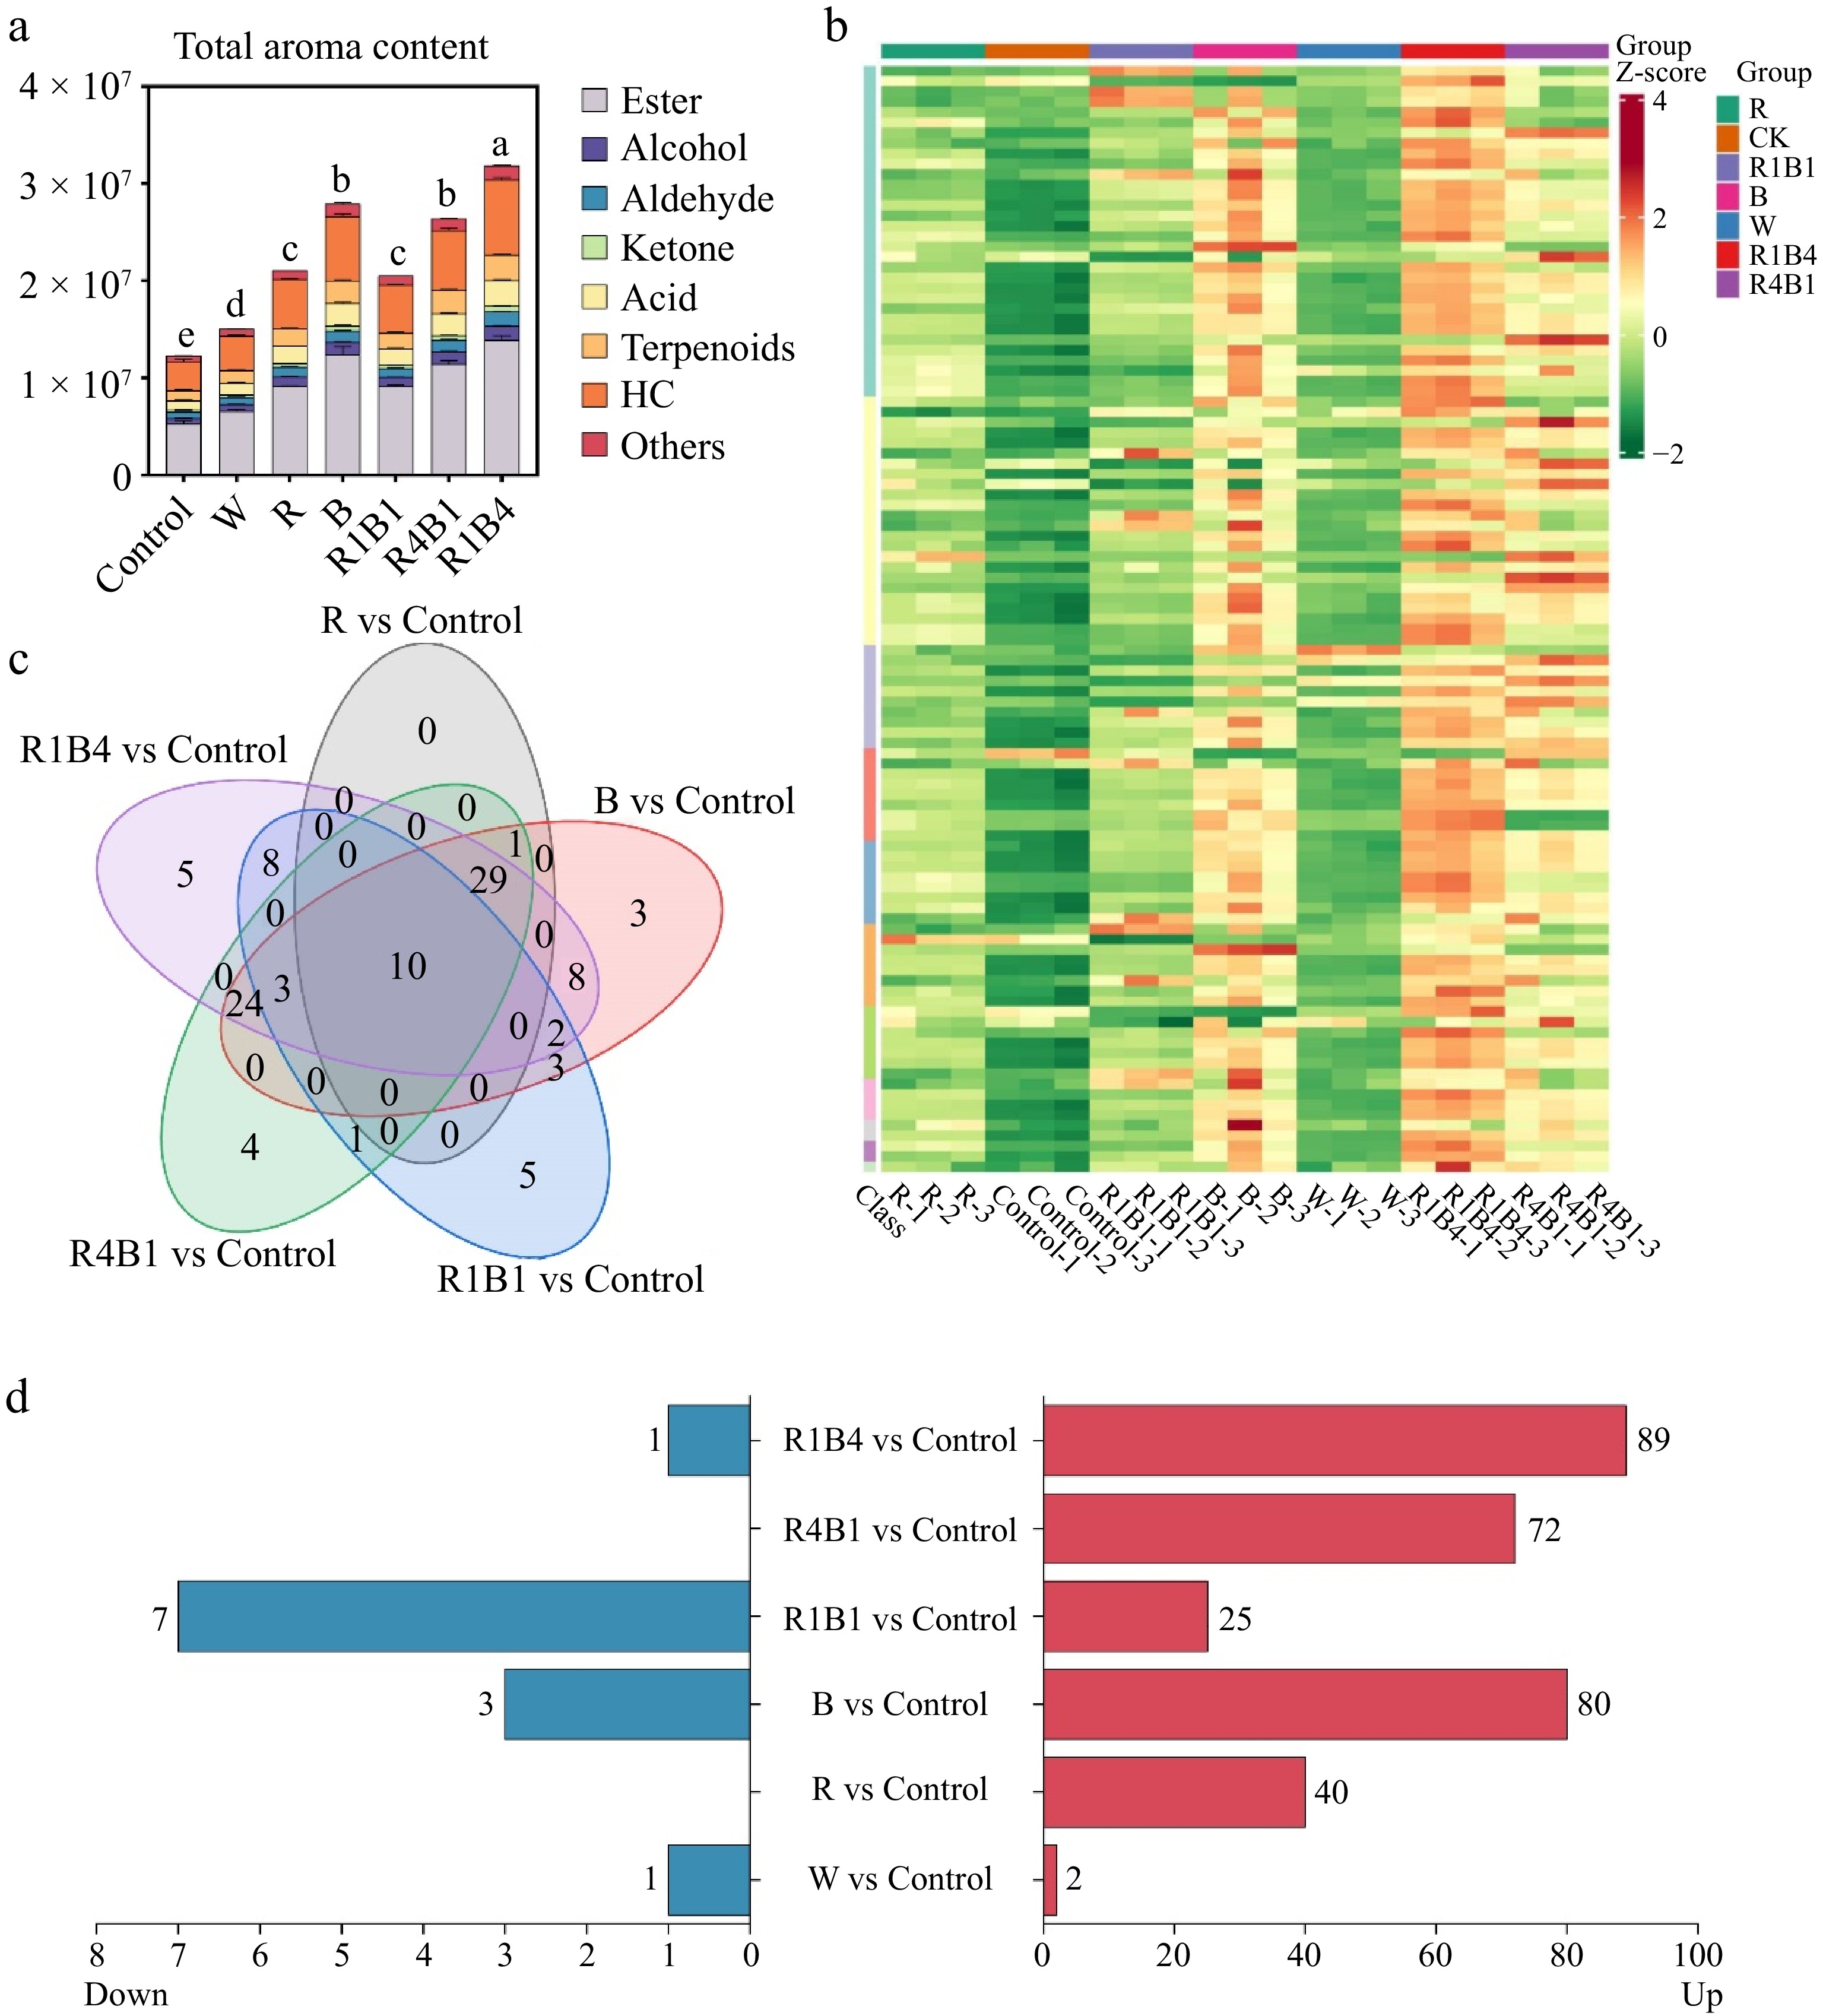
Figure 5.
Changes in grape berry aroma components after different light quality treatments at 45 d. (a) Total aroma content; (b) Venn diagrams presenting unique and common aroma metabolites in six light treatments compared to control; (c) Aroma components up-regulated and down-regulated by six light treatments compared to control; (d) Heat maps of 107 VOCs components in all treatments.
When comparing to control berries, 89, 80, 72, 40, 25, and two differential metabolites were up-regulated in R1B4, B, R4B1, R, R1B1, and W treatments, respectively (Fig. 5d, Supplementary Fig. S4; Supplementary Tables S3−S8). The total amount of emitted VOCs was significantly increased by different light supplementation, especially for the R1B4 groups (Fig. 5a), indicating an involvement of light in VOCs accumulation. Furthermore, 10 differential metabolites, including four esters (geranyl isobutyrate, butanoic acid, hexanoic acid, and decanoic acid), one terpenoid (cis-, beta-Farnesene), one heterocyclic compound [1-Pentanone, 1-(1H-imidazol-4-yl)], one alcohol (n-Tridecan-1-ol), one aldehyde (2,6-Dodecadien-1-al), one ketone [(2-Buten-1-one, 1-(2,6,6-trimethyl-2-cyclohexen-1-yl)-, (E)], and one acid (Benzoic Acid, 2,3-dihydroxy), were in coexistence in different light treatments, except for W treatment (Fig. 5c), indicating that these VOCs might be key odorants of in 'Queen Nina' grape. Furthermore, the proportions of individual differential metabolites in the total VOCs were also calculated, 20 of which had proportions > 1% at almost all light treatments, including six esters, five heterocyclic compounds, two acids, two terpenoids, two alcohols, two aromatics, and one aldehyde (Supplementary Fig. S5; Supplementary Table S9). Among them, the proportions of 2,4-decadienoic acid (ester) accounted for more than 24% of the total VOCs between these treatments, followed by [Pyrolo[3,2-d]pyrimidin-2, 4(1H,3H)-dione] (Heterocyclic compound, more than 14%), and [(2E)-2-(Acetylhydrazono) propanoic acid] (acid, more than 5%), suggesting that these metabolites might contribute to the aromatic sensory properties of 'Queen Nina' grape (Supplementary Table S9). Taken together, the R1B4 group was the most favorable treatment for the accumulation of VOCs in 'Queen Nina'.
Correlation analyses on berry quality attributes
-
The correlation analysis of the 19 quality attributes in 'Queen Nina' grape berries indicated that every attribute reflects the quality of grape berries to varying degrees, whereas also being interrelated to some extent. The correlation among these 19 indicators was determined using the Pearson correlation coefficient, and the results are shown in Fig. 6a. TA, tartaric acid (TTA), L-malate (LMA), and citric acid (CA) showed significant negative correlations with the other indicators. However, there were significant positive correlations among the various organic acids. TSS, glucose, fructose, and sucrose showed significant positive correlations with the indicators of anthocyanins and volatiles. Interestingly, the correlation between Mv and the remaining indicators was very low (Fig. 6a).
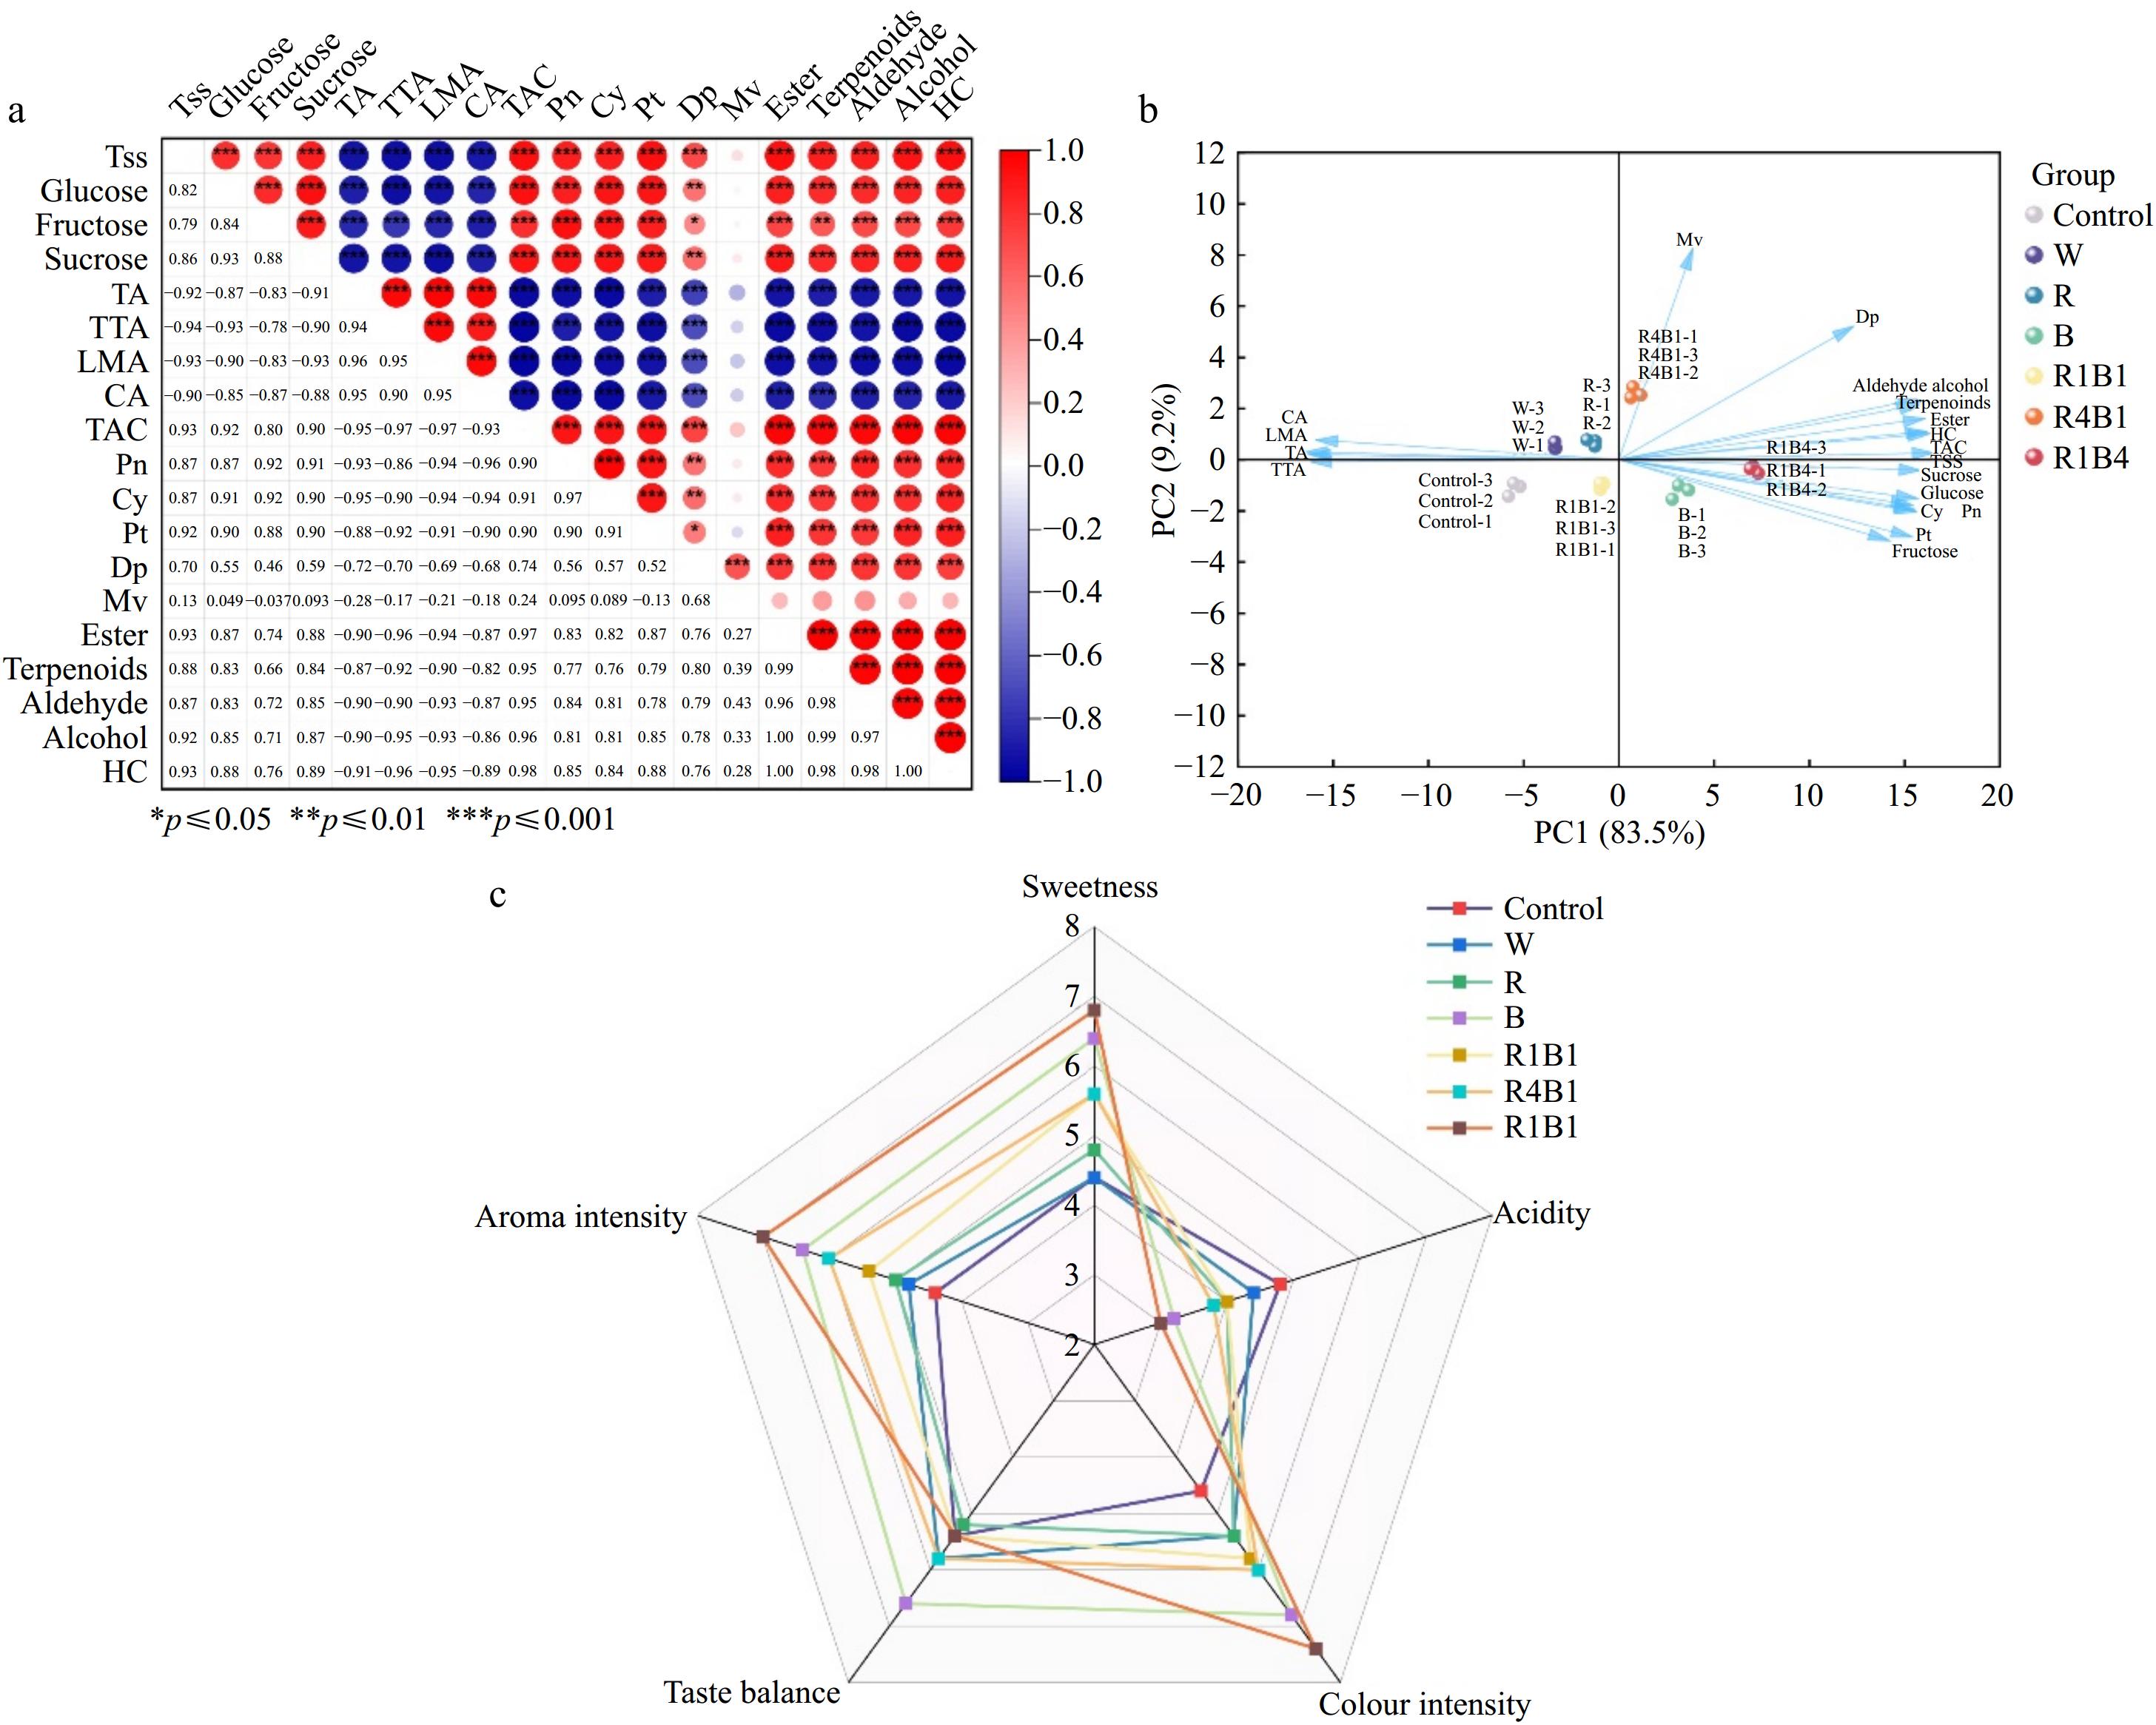
Figure 6.
Correlation analysis of 19 quality indicators in 'Queen Nina'. (a) The color intensity and circle size are proportional to the value of each correlation coefficient. Red represents a positive correlation, and blue represents a negative correlation. TTA, tartaric acid; LMA, L-malic acid; CA, citric acid; Ant, total anthocyanins; HC, Heter compound. (b) PCA scores of physiological parameters of 'Queen Nina' under different treatments at maturity stage. (c) Radar plots of sensory assessment of different treatments at harvest.
The principal component analysis of 19 parameters, such as sugar components, organic acids, anthocyanins, and main volatile compounds, was carried out under different light wavelengths (Fig. 6b). The cumulative variance contribution rate of Queen Nina's first two principal components come to 92.67% (Supplementary Table S10), basically reflecting the results included into this data. In consequence, to simplify the 19 quality indicators for two principal components, and the use of the two principal components for comprehensive quality evaluation. In the two principal components, PC1 dominates with an Eigenvalue of 15.86, and a variance contribution rate of 83.5% (Supplementary Table S10), implying that PC1 acts as a crucial function from these analyses. TAC, Ester, Terpenoids and HC had higher loading values, and all four attributors had positive effects on PC1 (Supplementary Table S11), reflecting the anthocyanin and aroma levels in 'Queen Nina'. Additionally, B, R4B1, and R1B4 align positively along the PC1 axis, suggesting that these light treatments enhance the anthocyanin and aroma levels (Supplementary Table S12). PC2, with an Eigenvector of 1.75 with a variance contribution rate of 9.2% (Supplementary Table S10). DP and MV had higher load values, indicating that PC2 mainly reflects specific anthocyanins (Supplementary Table S11). The samples of W, R, and R4B1 were in the positive path to PC2 axis, indicating that they tended to increase Dp and Mv anthocyanin content more than other treatments (Supplementary Table S12).
To distinguish the taste differences of 'Queen Nina' berries treated with different light irradiation, a blind-tasting experiment was conducted. A trained sensory tasting team organized the tasting of grapes under different light treatments, and the results were represented as radar charts (Fig. 6c). The sweetness, aroma intensity, and color intensity scores of berries under the R1B4 treatment were higher compared to other treatments. The taste balance of 'Queen Nina' grape berries from the B treatment received significantly higher sensory scores than other light treatments. Additionally, the acidity in grape berries under the control treatment was found to be higher than that of the other treatments (Fig. 6c). In general, the sensory evaluations of berries following light treatment surpassed those of the control group. Specifically, the R1B4 treatment yielded the highest sensory score, followed by the B treatment.
-
Supplementing light is a common and effective approach to address low light problems in protected cultivation. Numerous studies have shown that different light qualities strongly influence the fruit quality and ripeness, such as in banana[63], tomato[64], pitaya[65], apple[66], and strawberry[67]. In blueberries[68] and tomatoes[69], supplementing with red and blue light could promote the synthesis of sugars (glucose and fructose), decrease the content of organic acids (malic and citric acids), and enhance the TSS/TA ratio, which improved fruit quality and consumer acceptability. Herein, all light treatments promoted sugar accumulation and inhibited the organic acid synthesis, resulting in a significantly increasing TSS/TA ratio (Fig. 2). Similar results were also observed in 'Kyoho' grape, where red and blue light treatment significantly enhanced the sugar concentration in grape berries[23]. Furthermore, the R1B4 treatment displayed the peak levels of sugar accumulation and TSS/TA ratio (Fig. 2), indicating the combination with red and blue at a 1:4 ratio might be the highest effective light quality for soluble sugar synthesis from 'Queen Nina' grape. Similarly, the combination with red and blue also showed the most obvious effect in the sugar accumulation and organic acid degradation in three table grape varieties[8], suggesting the conserved regulation of red and blue light in grape sugar and acid metabolism.
Anthocyanins and flavonoids are essential phytochemicals for colour characteristics and potential health benefits of grapes, and the anthocyanin accumulation is greatly regulated by light conditions[70,71]. Further studies of light applications performed on other horticultural plant species had long championed the positive impacts from the blue light in enhancing the anthocyanins of flavonoids. For example, blue light treatment accelerated the accumulation of anthocyanins and flavonoids during fruit ripening in bilberry[72]. Correspondingly, postharvest blue light irradiation could enhance anthocyanin and flavonoid levels, and maintain postharvest fruit quality of apple and strawberry[73,74]. In this research, the contents of Pn and Cy were significantly higher than Dp, Pt, and Mv in 'Queen Nina' grape, which was consistent with the fact that Pn and Cy are the main red anthocyanins in grape skin[75,76]. Furthermore, R1B4 treatment significantly increased the accumulation of total anthocyanins and flavonoids compared to other light treatment groups (Figs 3 & 4), which was in general harmony with the previous studies where a red-blue mixed light was more advantageous for anthocyanin and flavonoid accumulation in grape and strawberry[8,77]. Interestingly, blue light treatment was also more effective in promoting anthocyanin accumulation than red light, which was consistent with previous investigations in both table and wine grapes[8,23,50]. However, the R4B1 treatment had higher flavonoid content than the B treatment, indicating that different wavelengths of light had different effects on specific compounds in grape berries. All these excellent results supported the fact that R1B4 treatment was the most appropriate light quality for anthocyanin and flavonoid accumulation in 'Queen Nina' grape.
Aroma is one of the most important sensory attributes related to fruit quality and consumer preference[78,79]. Fruit aroma mainly depends on the VOCs, such as esters, terpenes, alcohols, aldehydes, etc, which were also greatly influenced by light conditions. In grape, blue light irradiation increased volatile compounds[50], whereas shading treatment decreased the level of the volatile compounds[80−83]. Similar results were also found in strawberries[84,85]. In our study, R1B4 treatment not only significantly increased the content of total VOCs, but also promoted the accumulation of esters and terpenoids (Fig. 5), which were the main volatile compounds of the 'Queen Nina' grape. These results were consistent, in part, with the previous observation that blue light was the most optimum light treatment to accumulate the volatile compounds of the grape berries, including esters and terpenoids[8,86]. Furthermore, the 19 quality indicators of grape berries under the R1B4 treatment achieved the highest composite score and sensory score according to the PCA and sensory analysis (Fig. 6), respectively, which were generally consistent with the previous results about the impact of light irradiation onto grape berry quality[8]. In summary, supplemental light with the R1B4 group was the most favorable treatment for the improvement of berry quality in 'Queen Nina' grape.
-
The research investigated the impact of different light wavelengths on the berry quality of greenhouse-cultivated 'Queen Nina' grape, revealing a positive influence of light treatments. Among the six light treatments, R1B4 outperformed others, significantly enhancing the content of sugars, anthocyanins, flavonoids, and the proportion of esters and terpenoids in aroma components, while reducing chlorophylls and organic acid levels. PCA and sensory analysis indicated that the grape berries treated with R1B4 light reached the highest composite score and sensory score. Taken together, supplemental light with the combination of red and blue light at a 1:4 ratio might be the most effective in improving the 'Queen Nina' grape quality under protected cultivation.
This work was supported by the Science and Technology Small and Medium-sized Enterprise Innovation Ability Enhancement Project in Shandong Province (2023TSGC0491), the science-technology benefiting people project of Qingdao (23-2-8-xdny-4-nsh), the National Natural Science Foundation of China (NSFC) (32372646, 32272647 and 32102353), the Natural Science Research Project of Anhui Educational Committee (2024AH051983), the key research and development plan of Shandong Province (2023TZXD015 and 2022TZXD001101), Shandong Provincial Natural Science Foundation (ZR2021QC005 and ZR2022QC018), Inner Mongolia Science Technology Plan (2022YFDZ0029), the Unveiling and Commanding project of the West Coast new area of Qingdao (2022-23), and the Qingdao Agricultural University Enterprise Cooperation Projects (660/2424191). Additionally, we thank the Instrumental Analysis Center of Qingdao Agricultural University for assistance during data collection.
-
The authors confirm contribution to the paper as follows: study conception and design: Ren Y, Leng X, Li B, Fang J; data collection: Ji X, Wu J, Wang M, Liu W; analysis and interpretation of results: Wei G, Sun X, Li L; draft manuscript preparation: Cui Z, Xu X, Li Y, Mu Q. All authors reviewed the results and approved the final version of the manuscript.
-
All relevant data are within the manuscript and its supplemental files.
-
The authors declare that they have no conflict of interest.
- Supplementary Table S1 Statistical table of the number of aroma metabolites of 'Queen Nina' grape at 45 days after treatment.
- Supplementary Table S2 The proportion of 10 class of compounds to VOCs.
- Supplementary Table S3 Compared with control and W group's different metabolites.
- Supplementary Table S4 Compared with control and R group's different metabolites.
- Supplementary Table S5 Compared with control and B group's different metabolites.
- Supplementary Table S6 Compared with control and R1B1 group's different metabolites.
- Supplementary Table S7 Compared with control and R4B1 group's different metabolites.
- Supplementary Table S8 Compared with control and R1B4 group's different metabolites.
- Supplementary Table S9 The 20 components with the highest relative content in volatile metabolites.
- Supplementary Table S10 Eigenvalues, variance contribution rates and cumulative contribution rates of principal components.
- Supplementary Table S11 Loading matrix of principal components.
- Supplementary Table S12 Values of PC1 and PC2 for each treatment.
- Supplementary Fig. S1 Proportions of individual anthocyanin components in control, W, R, B, R1B1, R4B1, R1B4 groups, respectively.
- Supplementary Fig. S2 Proportions of individual flavonoids components in control, W, R, B, R1B1, R4B1, R1B4 groups, respectively.
- Supplementary Fig. S3 (A) Distribution diagram of CV values of aroma compounds measured; (B) PCA scores of aroma content of ‘Queen Nina’ under different treatments at maturity stage; (C) The explanation rate diagram of the first five principal components in PCA; (D) The PC1 values of QC samples based on ion peaks. The horizontal axis represents the order of sample detection, while the vertical axis reflects the PC1 values. Yellow and red lines define the ranges of positive and negative 2, 3 standard deviations, respectively. Green dots represent quality control (QC) samples, and black dots represent experimental samples.
- Supplementary Fig. S4 Six light treatments up-regulated and down-regulated heat maps of aroma compounds compared to control.
- Supplementary Fig. S5 Heatmaps of 20 aroma compounds >1%.
- Copyright: © 2025 by the author(s). Published by Maximum Academic Press on behalf of China Agricultural University, Zhejiang University and Shenyang Agricultural University. This article is an open access article distributed under Creative Commons Attribution License (CC BY 4.0), visit https://creativecommons.org/licenses/by/4.0/.
-
About this article
Cite this article
Ren Y, Ji X, Wu J, Wei G, Sun X, et al. 2025. Effects of light quality on physiological and biochemical attributes of 'Queen Nina' grape berries. Food Innovation and Advances 4(1): 53−64 doi: 10.48130/fia-0025-0006 

Effects of light quality on physiological and biochemical attributes of 'Queen Nina' grape berries
- Received: 29 August 2024
- Revised: 06 December 2024
- Accepted: 06 December 2024
- Published online: 18 February 2025
Abstract: Protected cultivation is an effective measure for high-end grape production. Nevertheless, the long-time application of plastic film negatively influences the light environment, and results in a certain decrease in berry quality. In this study, six different light treatments, including white (W), red (R), blue (B), and three different combinations with different ratios of red and blue light (1:1, 4:1, 1:4, respectively), were applied to monitor the quality and sensory properties of 'Queen Nina' grapes. Compared to the control group (without supplemental light), all light treatments significantly increased the size and weight of berries, as well as improved their sugar, anthocyanins, flavonoids, and volatile organic compounds (VOCs) content, whereas all light treatments decreased the levels of chlorophylls and organic acids. Furthermore, the R1B4 treatment improved the content of cyanidin-3-O-glucoside (Cy) and peonidin-3-O-glucoside (Pn), which are the dominant anthocyanin compounds in red grape berry. Additionally, esters, accounting for more than 42% of the VOCs, are the main volatile compounds in 'Queen Nina' grape, and R1B4 treatment was the most favorable treatment for VOCs accumulation. The combination of red and blue light at the 1:4 ratio (R1B4) obtained the highest composite and sensory scores and had the most positive impact on berry coloration, sugars, anthocyanins, flavonoids, and VOCs accumulation, followed by the blue light treatment. In summary, the present results highlight the effective strategy of R1B4 light treatment to increase the berry quality of 'Queen Nina' grape berries.
-
Key words:
- Grape /
- Protected cultivation /
- Light quality /
- Physiological parameters /
- Biochemical composition