


-
Aronia melanocarpa, a member of the Rosaceae family that originated in North America[1], is notable for its high amount of phenolic compounds such as phenolic acids, flavonols, anthocyanins, flavan-3-ols, and procyanidins[2]. These compounds are bioactive phytochemicals known for their exceptional free radical scavenging capabilities[3], drawing significant interest due to the fruit's nutritional and therapeutic potential[4]. Aronia melanocarpa is particularly recognized for its extraordinarily high anthocyanin levels, documented at up to 686 mg/100 g of fresh weight, considered as the highest record in plants[5]. This high anthocyanin content not only enhances its antioxidant capacity but also promotes health benefits like anti-inflammatory effects and regulations in blood sugar and cholesterol[2,5−7]. Despite its health benefits, the harsh taste of the raw fruit, characterized by intense astringency and high acidity, restricts its culinary applications[8]. As a result, there is considerable necessity in developing novel Aronia melanocarpa products through processing methods to improve sensory acceptance while retaining nutritional value. Among various techniques, fermentation using Lactobacillus strains is favored for enhancing bioactivity and improving the sensory properties and shelf life of the fruit. Previous researchers have documented successful applications of Lactobacillus and mixed-strain fermentations in enhancing the flavors of fruits like apples[9], jackfruit[10], and oranges[11]. Especially, Lactiplantibacillus plantarum and Lacticaseibacillus paracasei strains showed notable efficacy in fruit fermentations, with Lactiplantibacillus plantarum being capable of responding well to a variety of environments and synthesizing antioxidant chemicals[12,13]. Fermented wolfberry pulp using Lactiplantibacillus plantarum significantly enhanced the total phenols and flavonoid content, accompanied by improving levels of total acids and other flavor compounds[14]. Additionally, Lacticaseibacillus paracasei has been effectively employed in the fermentation of Aronia melanocarpa juice, yielding favorable outcomes[15]. Moreover, both Lactiplantibacillus plantarum and Lacticaseibacillus paracasei demonstrate substantial potential to increase the concentration of volatile substances, including ketones, alcohols, acids, and aldehydes[16]. Literature has documented improvements in the quality characteristics of tropical fruits fermented with mixed strains of Lactiplantibacillus plantarum and Lacticaseibacillus paracasei[17].
Based on these findings, this study ferments Aronia melanocarpa juice utilizing a 1:1 mix of Lactiplantibacillus plantarum 1243 and Lacticaseibacillus paracasei 139, to enhance the quality of the juice and establishing a foundation for its commercial application. The experiment measured changes in viable cell counts, total sugar, pH, acidity, and color. Additionally, quality indices such as total phenolic content, total flavonoid content, and DPPH scavenging capacity were assessed alongside sensory evaluations and flavor characteristics. The findings are expected to contribute to a better knowledge of the effect of Lactobacillus fermentation on Aronia melanocarpa juice, potentially influencing the development of a nutritionally rich juice with enhanced palatability.
-
Strains of Lactiplantibacillus plantarum 1243 and Lacticaseibacillus paracasei 139, isolated from kefir, were preserved at the College of Food Science, South China Agricultural University (Guangdong, China). Man-Rosa broth (MRS) was obtained from Huankai Microbial Science & Technology Co., Ltd. (Guangdong, China). The antioxidant 1,1-diphenyl-2-picrylhydrazyl (DPPH) was purchased from Sigma-Aldrich Co., Ltd. (St. Louis, MO, USA). The Rutin standard and Folin-Ciocalteu reagent were respectively sourced from Solarbio Science & Technology Co., Ltd. (Beijing, China) and Shanghai Macklin Biochemical Co., Ltd. (Shanghai, China). All additional chemicals and reagents employed in the experiments were of analytical grade.
Aronia melanocarpa juice preparation
-
Fresh Aronia melanocarpa, sourced from Dalian, Liaoning Province, China, was processed by removing leaves and calyces and thoroughly washing the fruits with distilled water before juicing. Before bottling the combination into 200 g pieces per bottle, 9% of brown sugar was dissolved in the juice and pomace mixture. The juice was pasteurized at 80 °C for 15 min and subsequently cooled to 25 °C for inoculation.
Microorganism preparation and fermentation
-
A 1:1 mixture of Lactiplantibacillus plantarum 1243 and Lacticaseibacillus paracasei 139 was prepared, achieving a viable cell count of 107 CFU/mL. Both the inoculated Aronia melanocarpa juice and a control sample (the 0-h sample, which was not inoculated with the bacteria) were incubated at 37 °C for 96 h. Sampling for analysis was conducted at 0, 24, 48, 72, and 96 h.
Determination of viable cell counts
-
Viable cell counts were performed according to CNIS GB 4789.2-2022 with modifications. Each 100 μL of juice sample was diluted with 900 μL of 0.9% w/v NaCl solution, achieving dilutions ranging from 10−1 to 10−7. Samples were plated on MRS agar containing sodium L-glutamate, in triplicate, and incubated at 37 °C for 24−48 h. Colonies ranging from 30−300 were counted, and results were expressed as lg CFU/mL.
Determination of total sugar
-
The total sugar content (TSC) was determined using the phenol-sulfuric acid method with adaptations[18]. Absorbance was measured at 490 nm using a microplate reader to establish standard curves (y = 0.0088x + 0.0815, R² = 0.9964). Results were expressed in grams of glucose equivalents (GE) per 100 mL of sample (g GE/100 mL).
Determination of pH and total acidity
-
The pH was measured using a digital pH meter (Rex Electric Chemical, PHS-3C) at room temperature (25 °C). Total acidity was quantified by acid-base titration according to the standard GB5009.239-2016-kw, with 100 g of sample reacting with 0.1 M NaOH.
Determination of antioxidant activity
Total phenolic content
-
The total phenolic content (TPC) was determined using a modified Folin-Ciocalteu method[19]. Aronia melanocarpa juice was centrifuged, and the supernatant was diluted twentyfold. 0.5 mL of distilled water and 2.5 mL of 10% (v/v) Folin-Ciocalteu reagent were added to 0.5 mL of the diluted sample. The mixture was incubated for 5 min, followed by the addition of 2 mL of 7.5% v/v Na2CO3, which was then left to stand in the dark for 1 h. Absorbance was measured at 765 nm using a VersaMax spectrophotometer (Molecular Devices, Shanghai, China). The phenolic content was calculated from a standard curve (y = 0.0076x + 0.0684, R² = 0.9953) and expressed as micrograms of gallic acid equivalents (GAE) per milliliter of juice (μg GAE/mL).
Total flavonoid content (TFC)
-
The total flavonoid content was quantified using a modified AlCl3 colorimetric method[20]. A tenfold diluted juice sample was mixed with 5% v/v AlCl3, pH 5.5 acetic acid-sodium acetate buffer, and 60% v/v ethanol. The absorbance was recorded at 400 nm using a microplate reader. Flavonoid content was derived from a standard curve (y = 0.0008x + 0.047, R² = 0.9884), with results expressed as micrograms of rutin equivalents (RE) per milliliter of juice (μg RE/mL).
DPPH radical scavenging activity
-
DPPH radical scavenging activity was assessed using a modified DPPH assay. For the blank control, an equivalent volume of extraction liquid substituted the juice sample. Absorbance was measured at 515 nm with a microplate reader. The scavenging activity percentage was calculated using the equation:
DPPHradicalscavengingactivity(%)=Ac−AsAc×100% As represents the absorbance of the juice sample, and Ac is determined relative to the absorbance of the blank control.
Color measurement
-
The color of Aronia melanocarpa juice was measured using an ST60 colorimeter (3nh Shenzhen Three NH Technology Co., Ltd., Shenzhen, China). The color parameters measured were L* (lightness), a* (red-green chromaticity), and b* (yellow-blue chromaticity), where L* values range from 0 (black) to 100 (white), a* values indicate green when negative and red when positive, and b* values show blue when negative and yellow when positive.
Sensory evaluation
-
A sensory evaluation was conducted by a panel consisting of six assessors of varying ages, in accordance with CNIS GB 7101-2022 standards. The evaluations were performed under controlled environmental conditions—uniform ventilation, consistent illumination, and no direct sunlight. Evaluated attributes included color, aroma, mouthfeel, texture, after-taste, acidity and sourness, and overall acceptance. Assessment was conducted using a 9-point hedonic scale, with criteria detailed in Supplementary Table S1.
E-nose analysis
-
Volatile compounds and odors in Aronia melanocarpa juice were analyzed with a PEN 3 Airsense E-nose device (Airsense, Germany). Juice samples were heated at 80 °C for 15 min before to analysis. The E-nose was set to a 400 mL/min injection flow rate, with 5 s of preparation time, 140 s of detection time, and 120 s of cleaning time. Data were collected between 132 and 134 s of the measurement. Sensors were configured to detect specific compounds such as aromatic organics, nitrogen oxides, ammonia, hydrogen, alcohols, aldehydes, ketones, aliphatic aromatics, methyl compounds, sulfides, aromatic and organosulfides, and long-chain alkanes. Supplementary Table S2 presents the ten sensors of the E-nose along with the substances to which each sensor is sensitive. Data were analyzed using WinMuster software (Version 1.6.2.22).
Statistical analysis
-
All experimental treatments and determinations were performed in triplicate. Data were presented as mean ± standard deviation (SD). Statistical differences among variables were determined using a one-way ANOVA followed by a Tukey test, with significance defined at p < 0.05. Statistical analysis was performed in SPSS version 24 (IBM, USA). Advanced data analysis, including principal component analysis, linear discriminant analysis, and loading plots, was performed using Winmuster software. Radar charts and column charts were created using OriginPro 2021 and GraphPad Prism 10, respectively. Correlation analysis was carried out using Pearson's method at
www.chiplot.online . A graphic abstract was produced usinghttps://BioRender.com . -
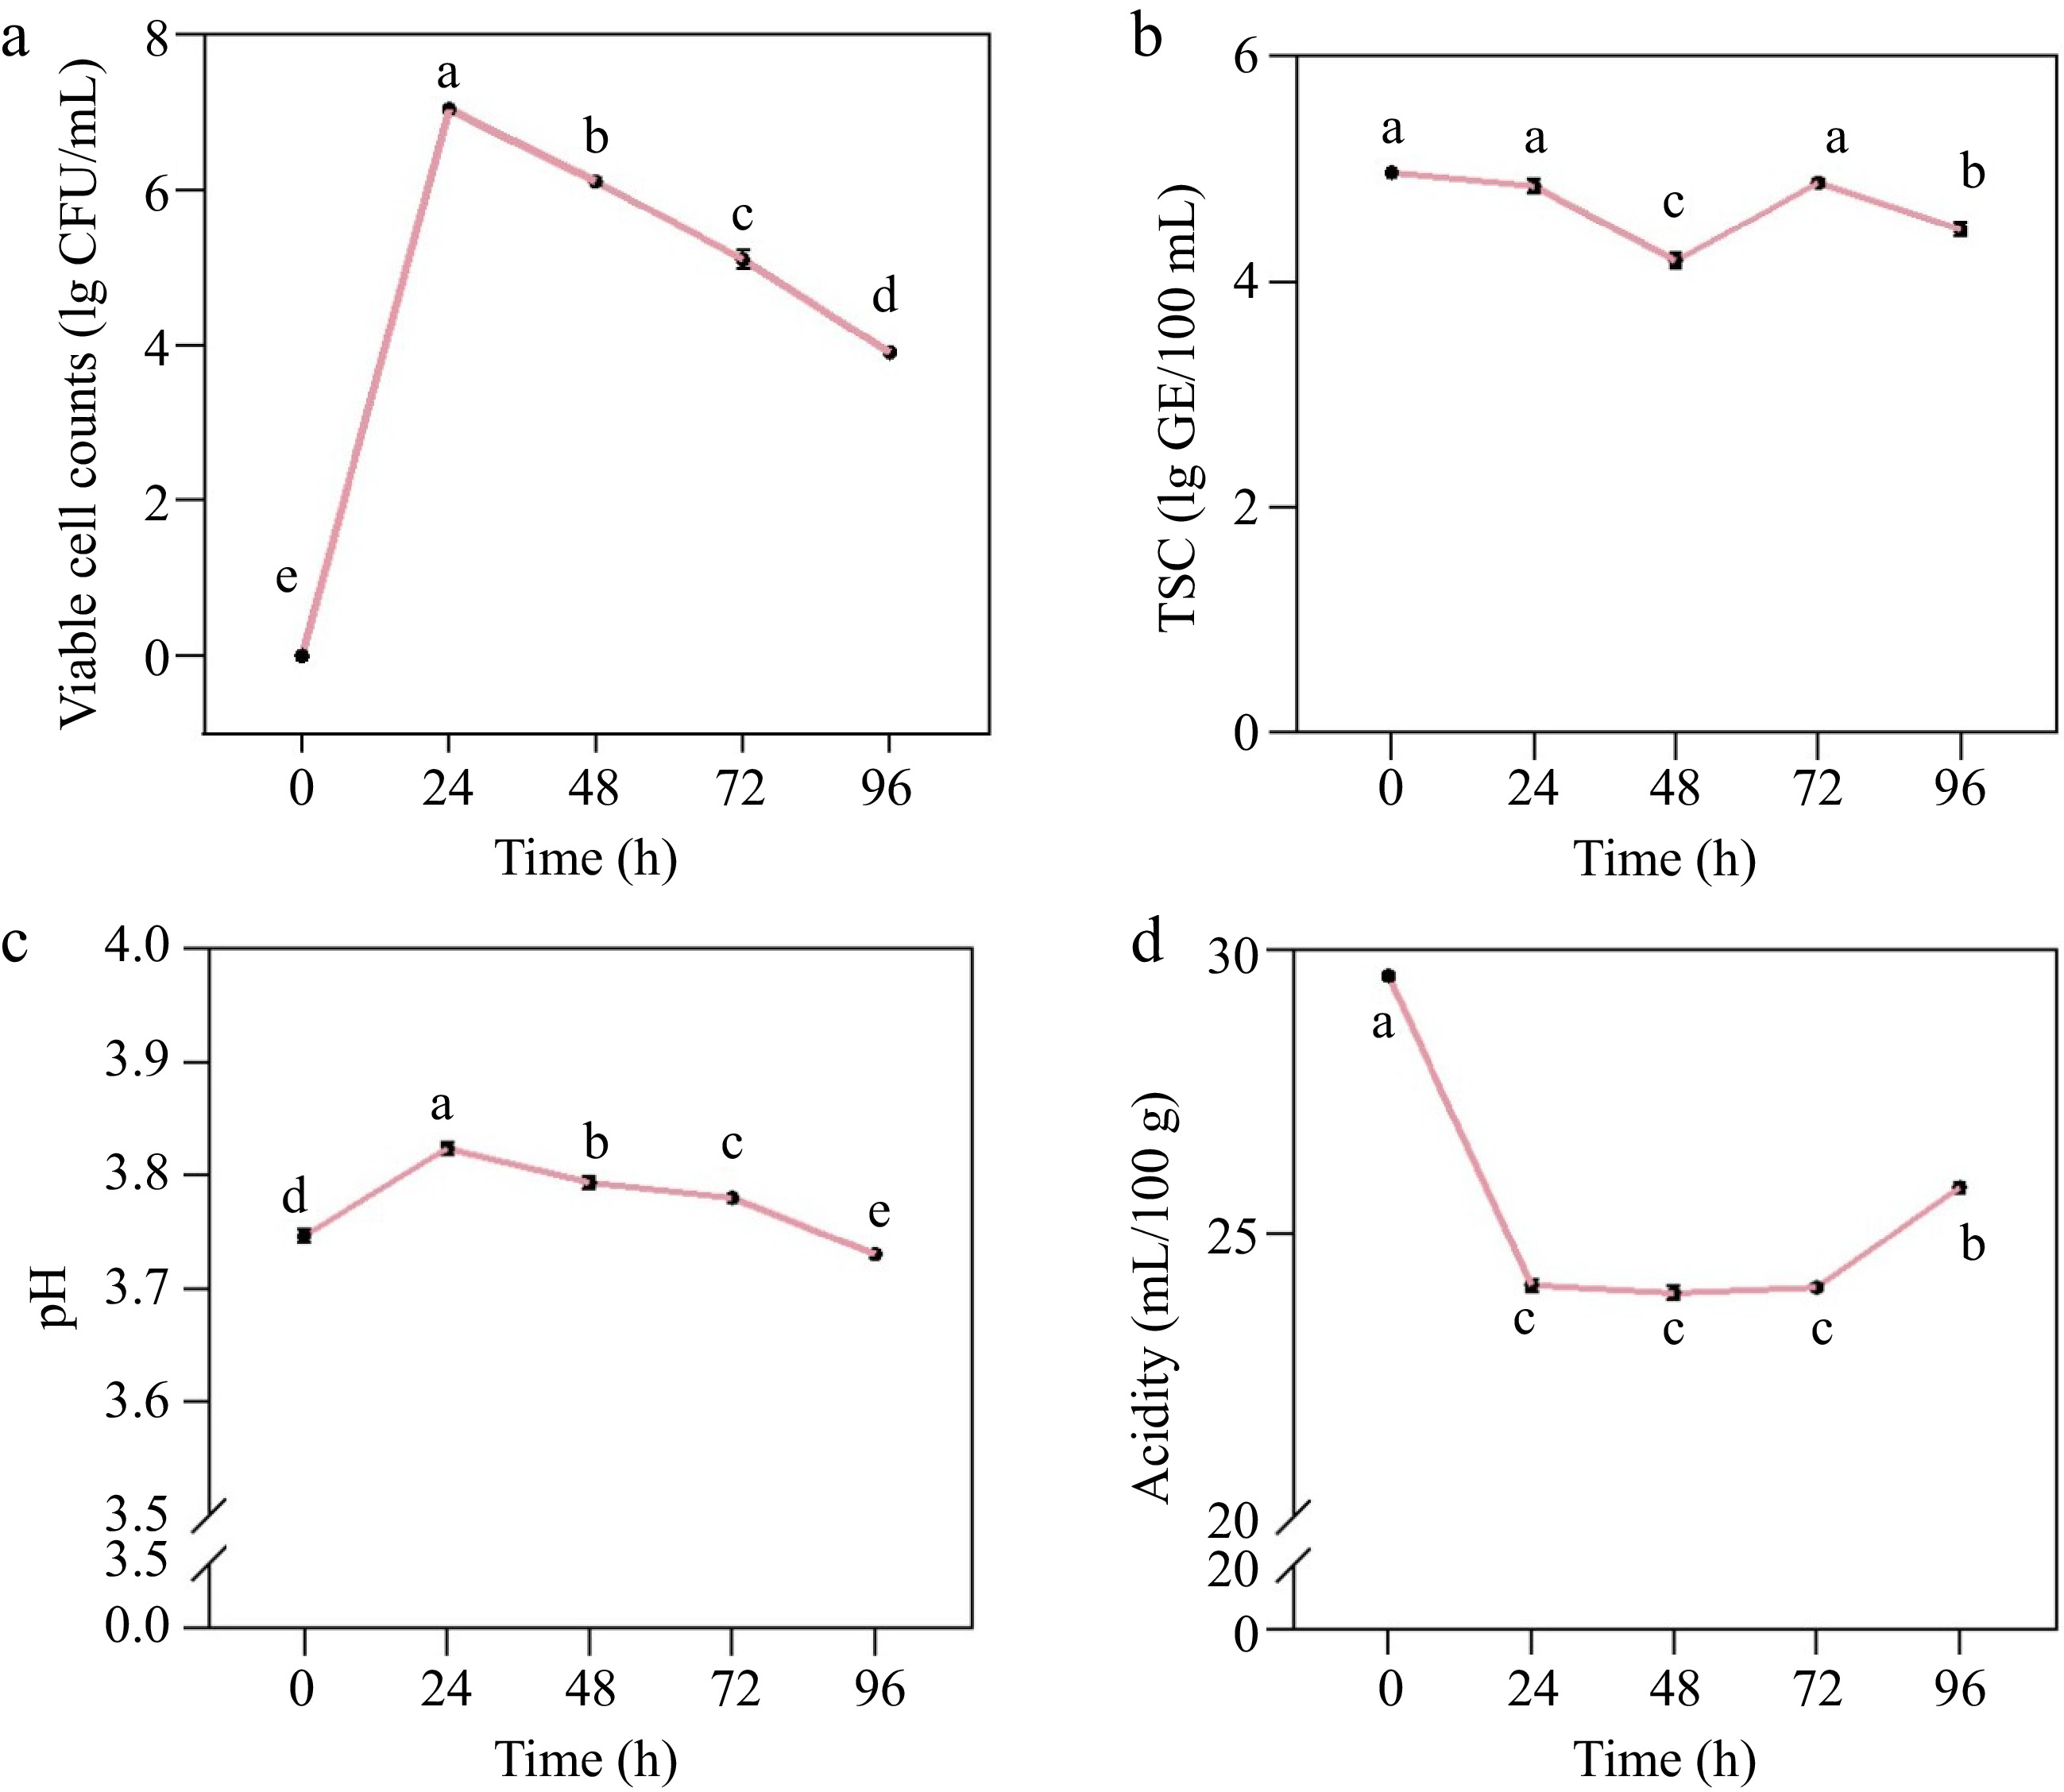
Effective adaptation of mixed strains to Aronia melanocarpa juice was observed within 24 h, peaking at a viable cell count of 7.03 lg CFU/mL. Subsequently, a significant decline was noted, with counts dropping to 3.90 lg CFU/mL by 96 h (p < 0.05) (Fig. 1a).
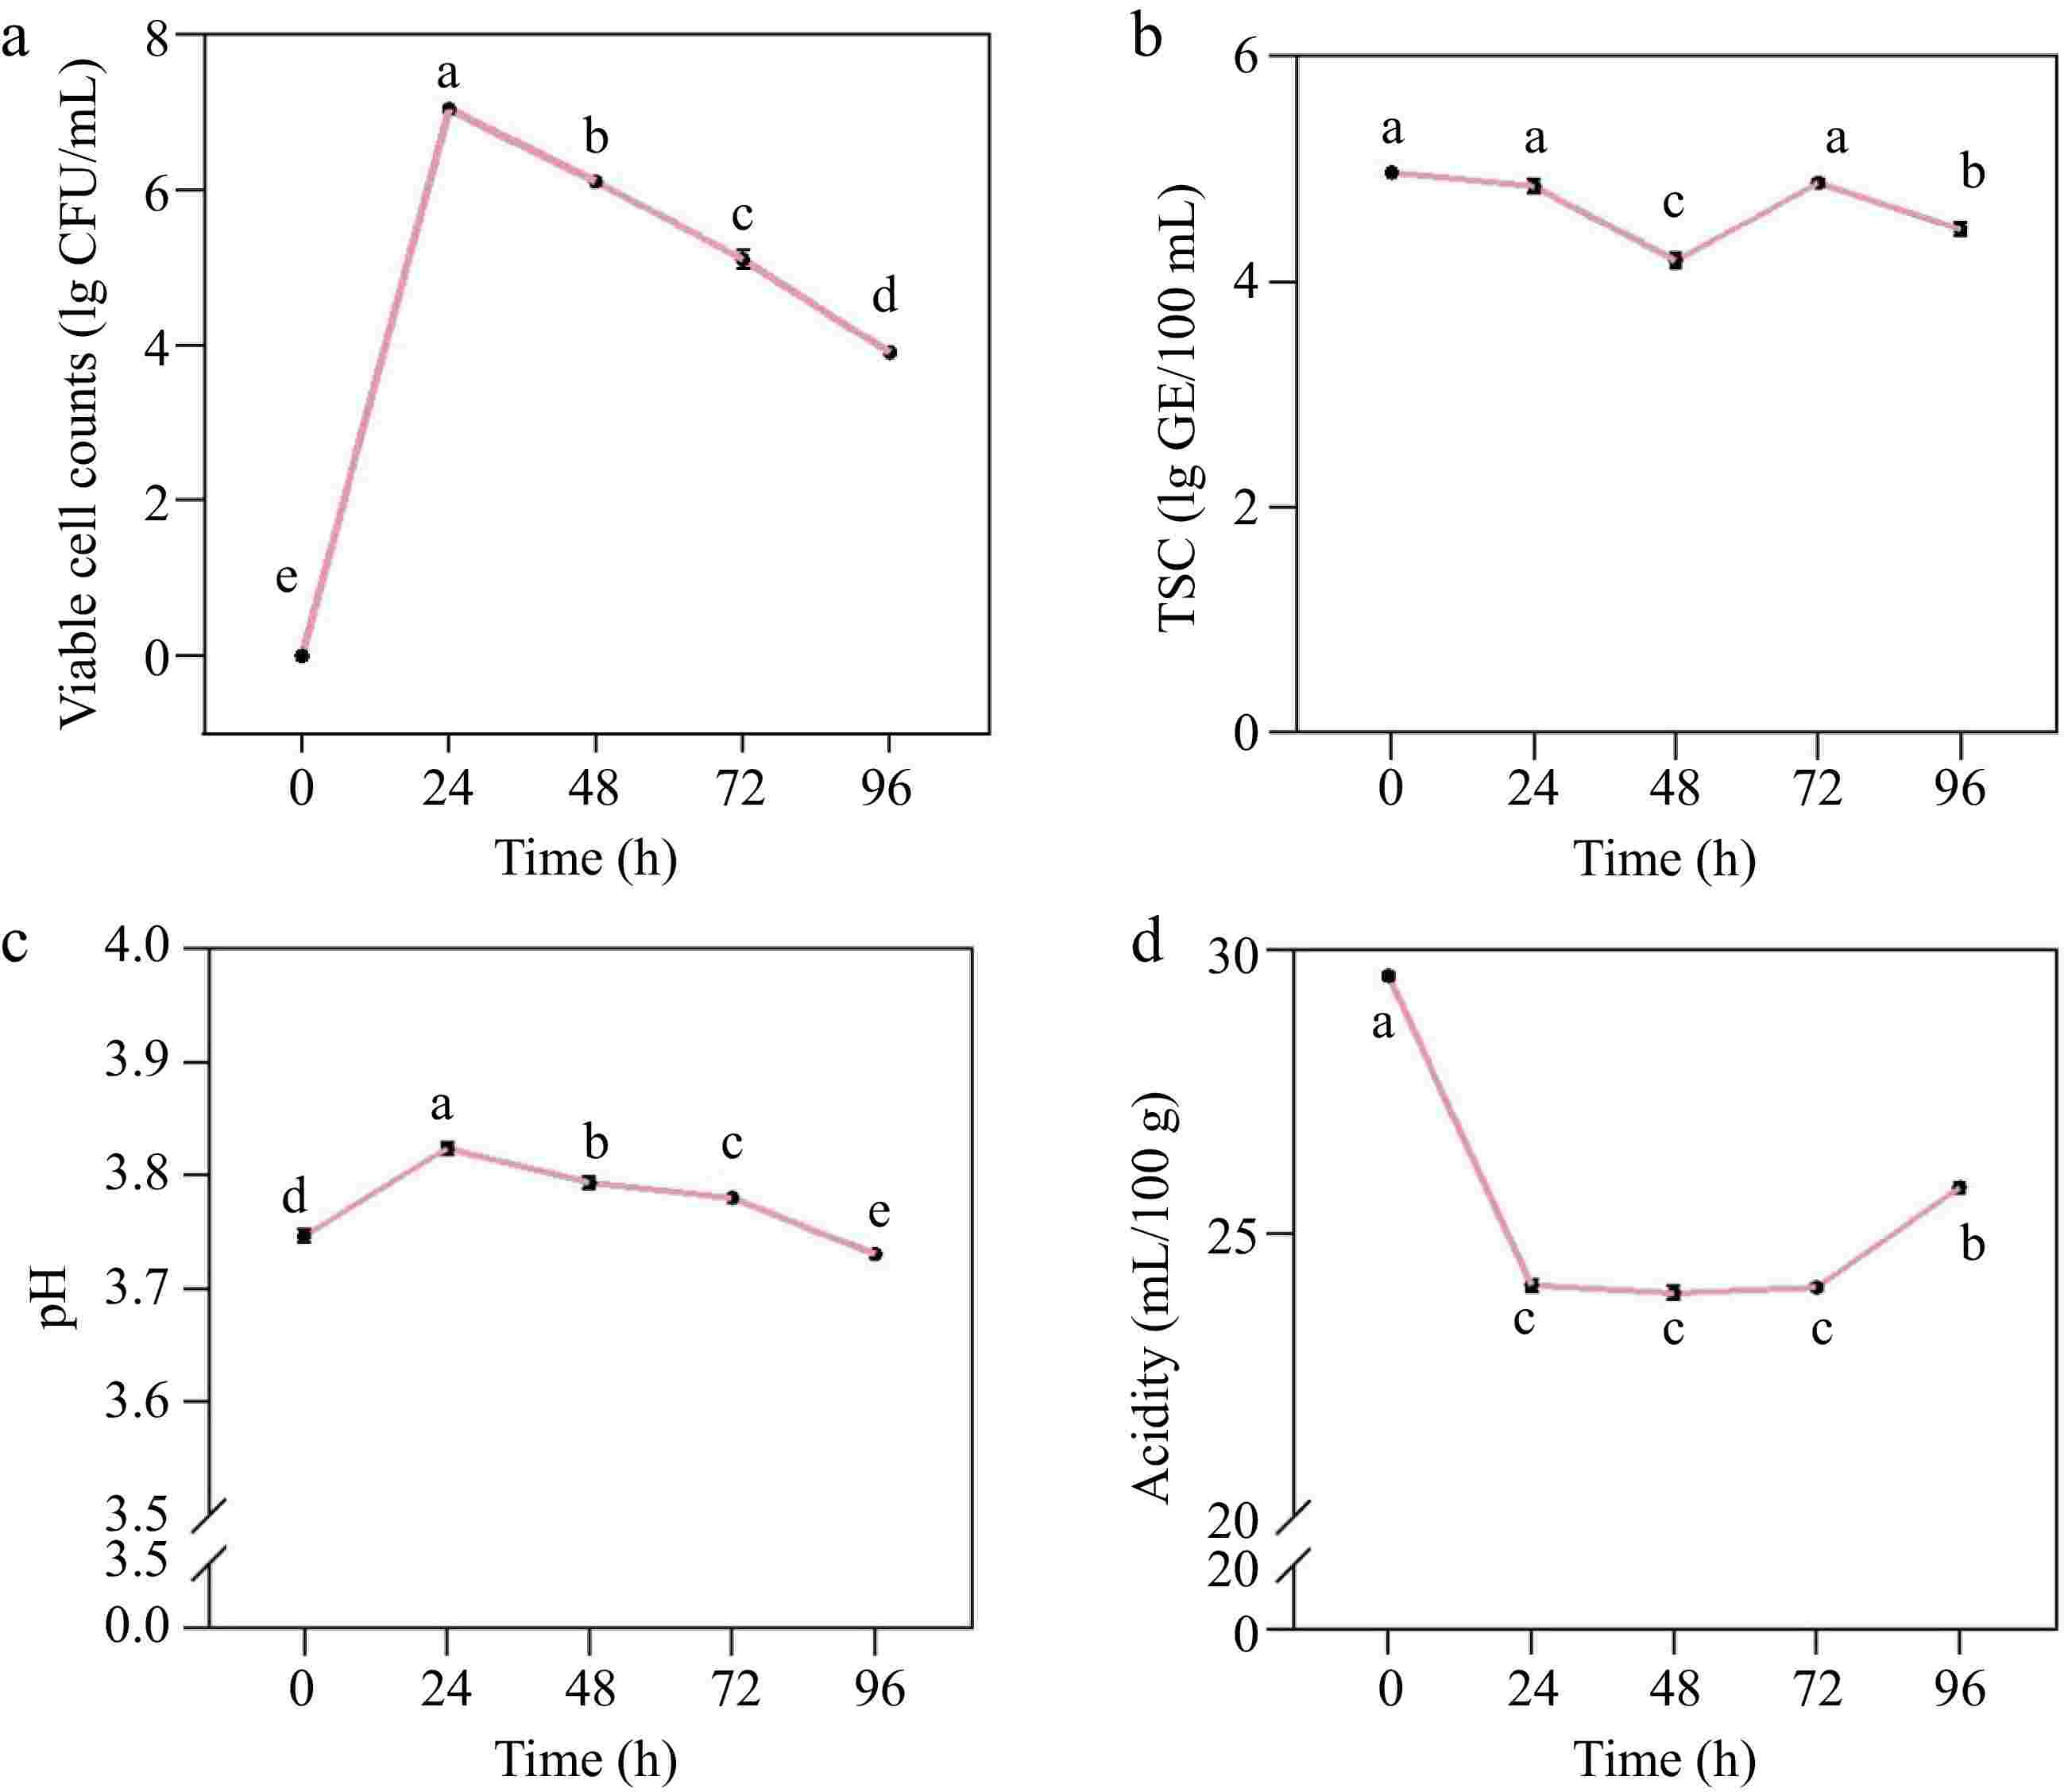
Figure 1.
Microbial and physicochemical properties of Aronia melanocarpa juice with different fermenting times. (a) Viable cell counts, (b) TSC, (c) pH, (d) acidity. Means of different lowercase letters are significant differences (p < 0.05).
Total sugar content of fermented Aronia melanocarpa juices
-
The initial TSC in Aronia melanocarpa juice was 4.97 g glucose equivalents/100 mL. There was no change in TSC during the first 24 h of fermentation; however, a 13.7% reduction occurred between 24 and 48 h (p < 0.05), followed by a 16.6% increase between 48 h and 72 h (p < 0.05). Subsequently, an 8.5% decrease was observed after 72 h, resulting in an ultimate value of 4.46 g GE/100 mL at 96 h. The minimum value was 4.18 g GE/100 mL at 48 h (Fig. 1b).
Change in pH and acidity
-
The pH of the Aronia melanocarpa juice initially increased from 3.75 to 3.82 over 24 h, then decreased gradually in the subsequent hours, reaching its lowest value of 3.73 at 96 h (p < 0.05) (Fig. 1c). Acidity decreased significantly in the first 24 h of fermentation, from 29.55 to 24.08 mL/100 g at 24 h (p < 0.05), with no significant difference seen between 24, 48, and 72 h. The lowest acidity was recorded at 48 h, measuring 23.94 mL/100 g. Acidity then rose to 25.81 mL/100 g by 96 h, which was still lower than that of the unfermented juice (p < 0.05) (Fig. 1d). Overall, between 0−24 h and 72−96 h of fermentation, the acidity showed a reverse trend with the pH (Fig. 1b, c).
Antioxidant activity of fermented Aronia melanocarpa juices
-
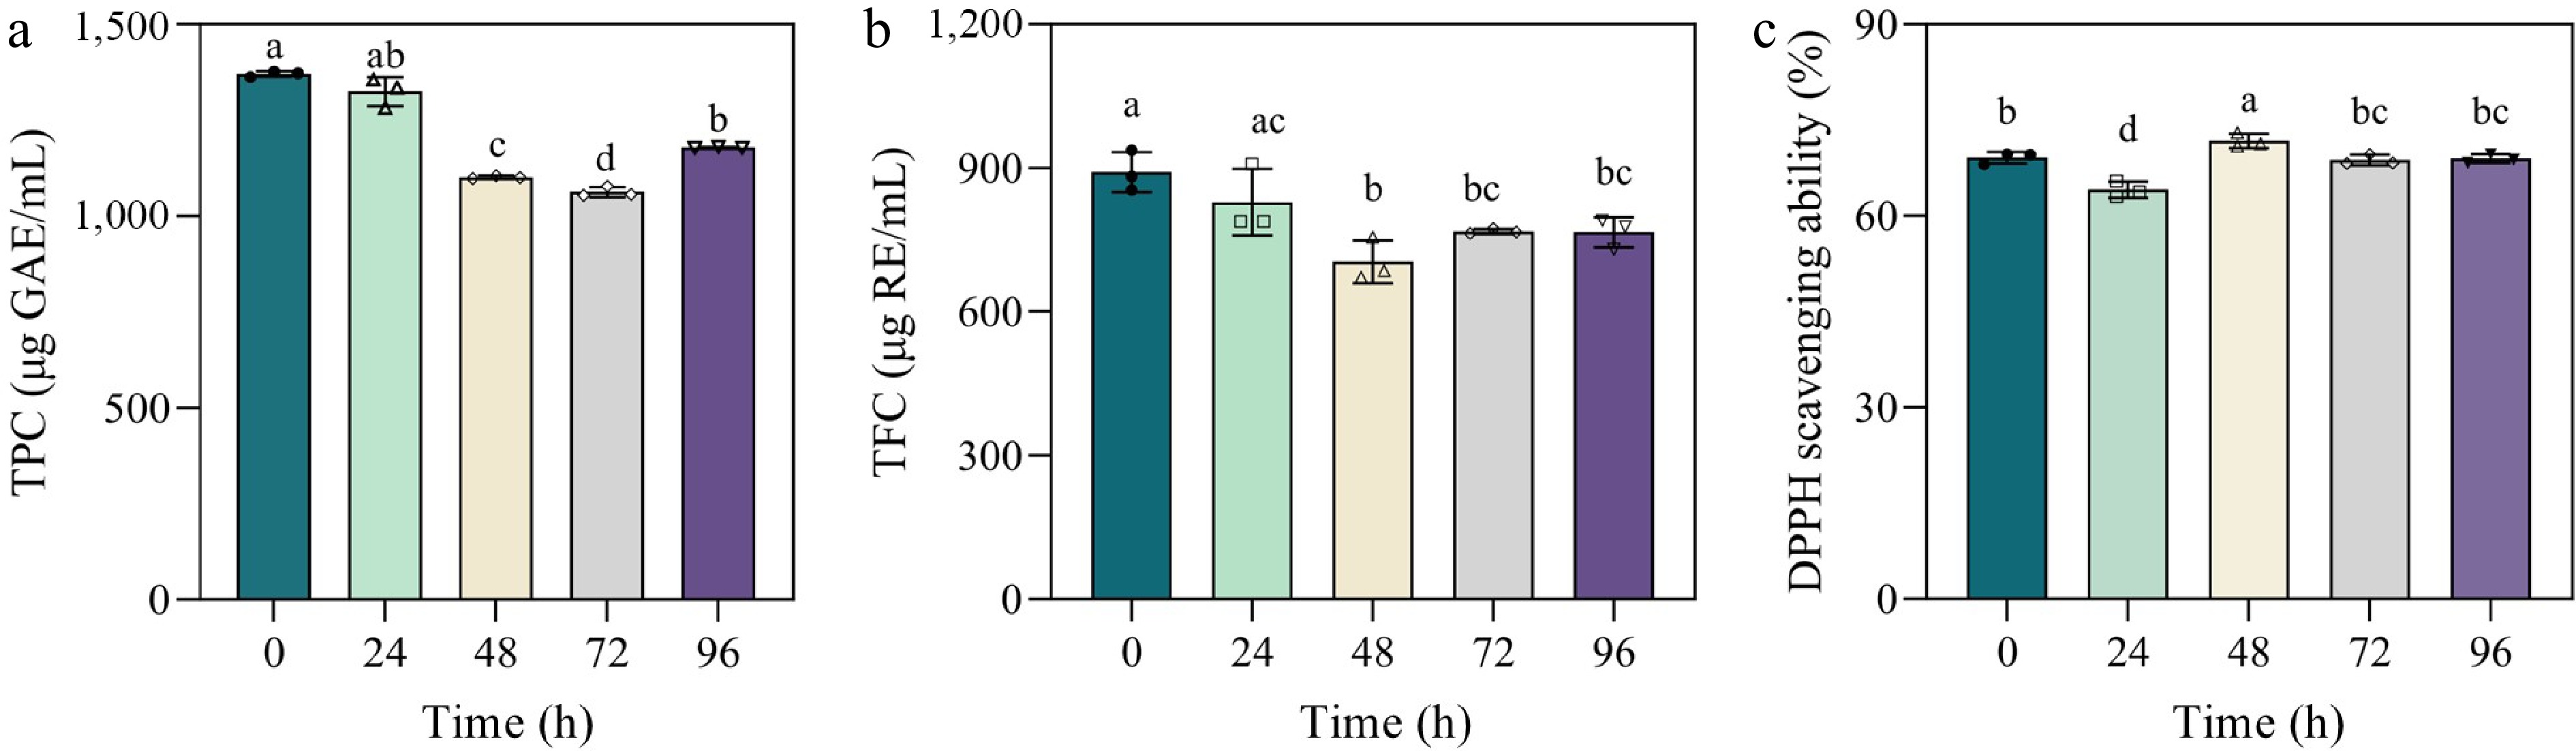
The TPC levels in fermented Aronia melanocarpa juices remained relatively stable during the first 24 h. The highest TPC was recorded in the unfermented juice at 1,370 μg GAE/mL. Following a gradual decline, the lowest TPC of 1,062.19 μg GAE/mL was observed at 72 h. Subsequently, TPC increased to 1,178.77 μg GAE/mL by 96 h (p < 0.05) (Fig. 2a). The initial TFC of the juice was 890.92 μg RE/mL, showing no significant change at 24 h. By 48 h, TFC decreased significantly to 704.17 μg RE/mL (p < 0.05), followed by a slight increase to 765.83 μg RE/mL at 96 h, which remained below the initial value (Fig. 2b). DPPH activity decreased significantly within the first 24 h from 69.1% to 64.1% (p < 0.05), then increased markedly to a peak of 71.7% at 48 h, which was significantly higher than in other samples (p < 0.05) (Fig. 2c). Throughout the study, Aronia melanocarpa juice samples maintained DPPH scavenging activity above 60%, demonstrating the fruit's robust antioxidant capacity.
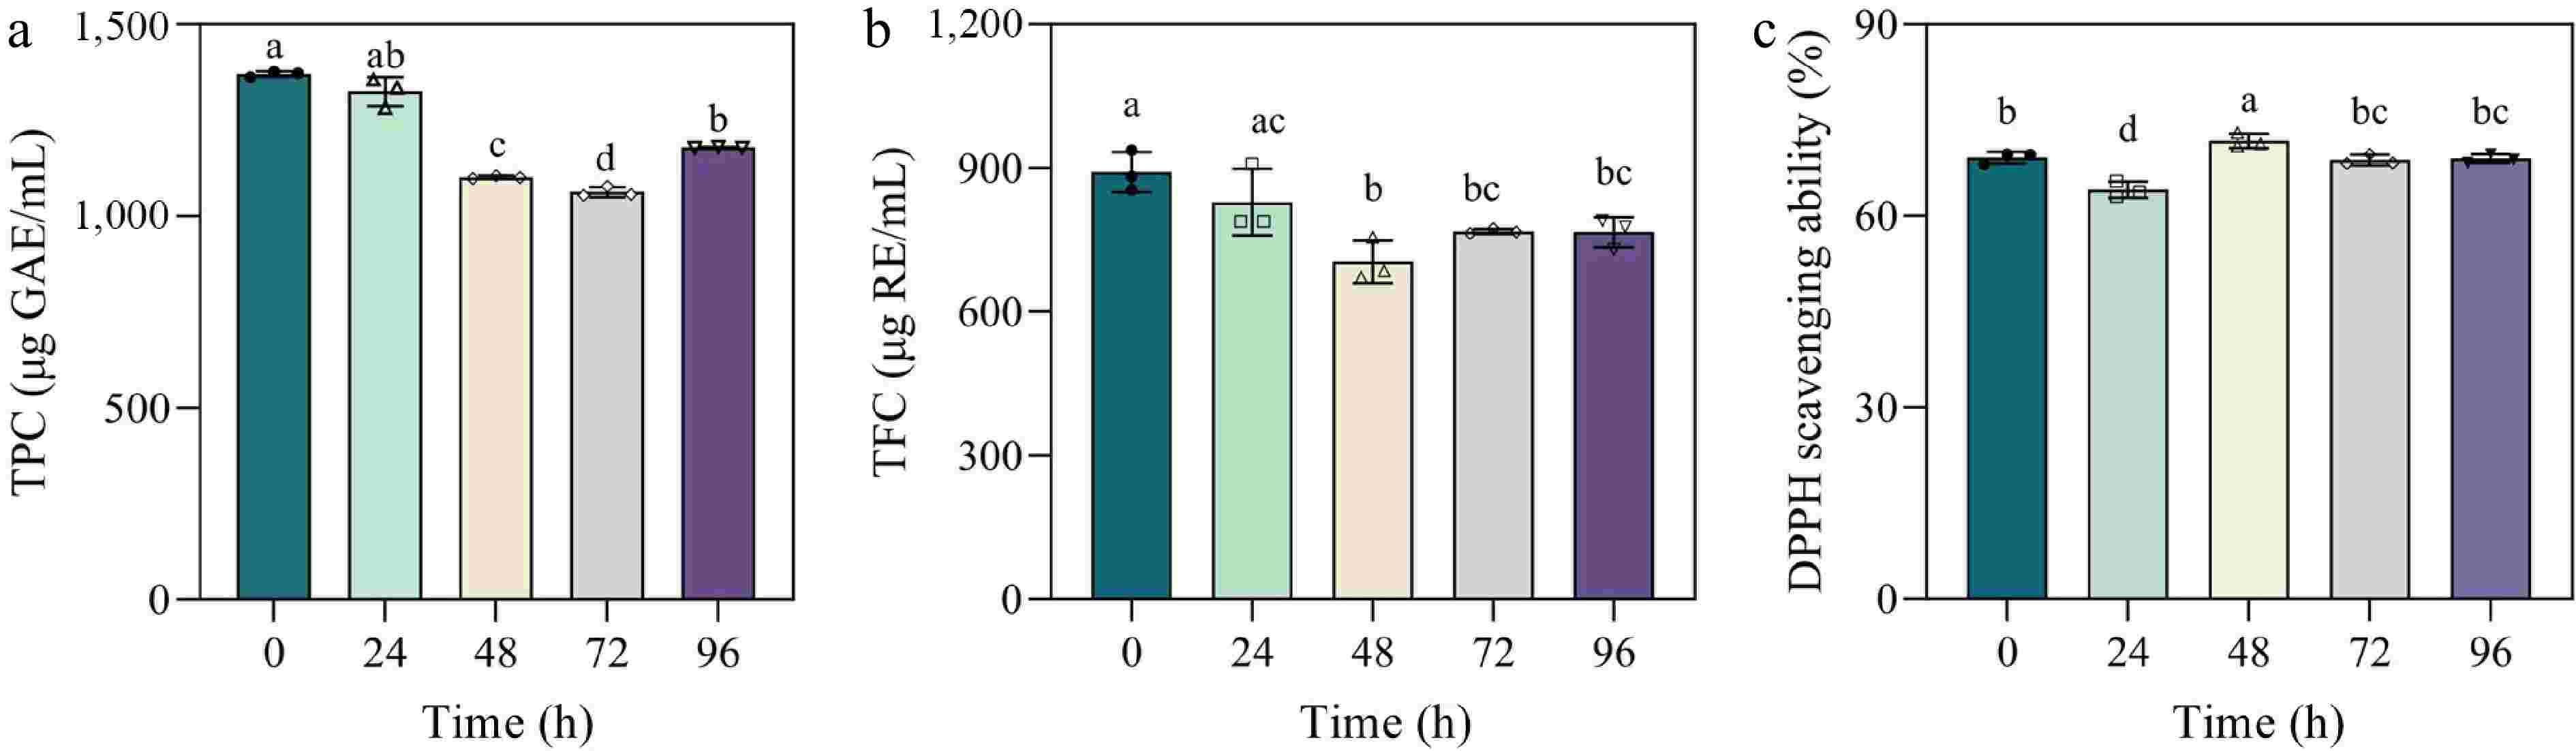
Figure 2.
Antioxidant activity of Aronia melanocarpa juice with different fermenting times. (a) TPC, (b) TFC, (c) DPPH scavenging activity. Means of different lowercase letters are significant differences (p < 0.05).
Color assessment and sensory evaluation
-
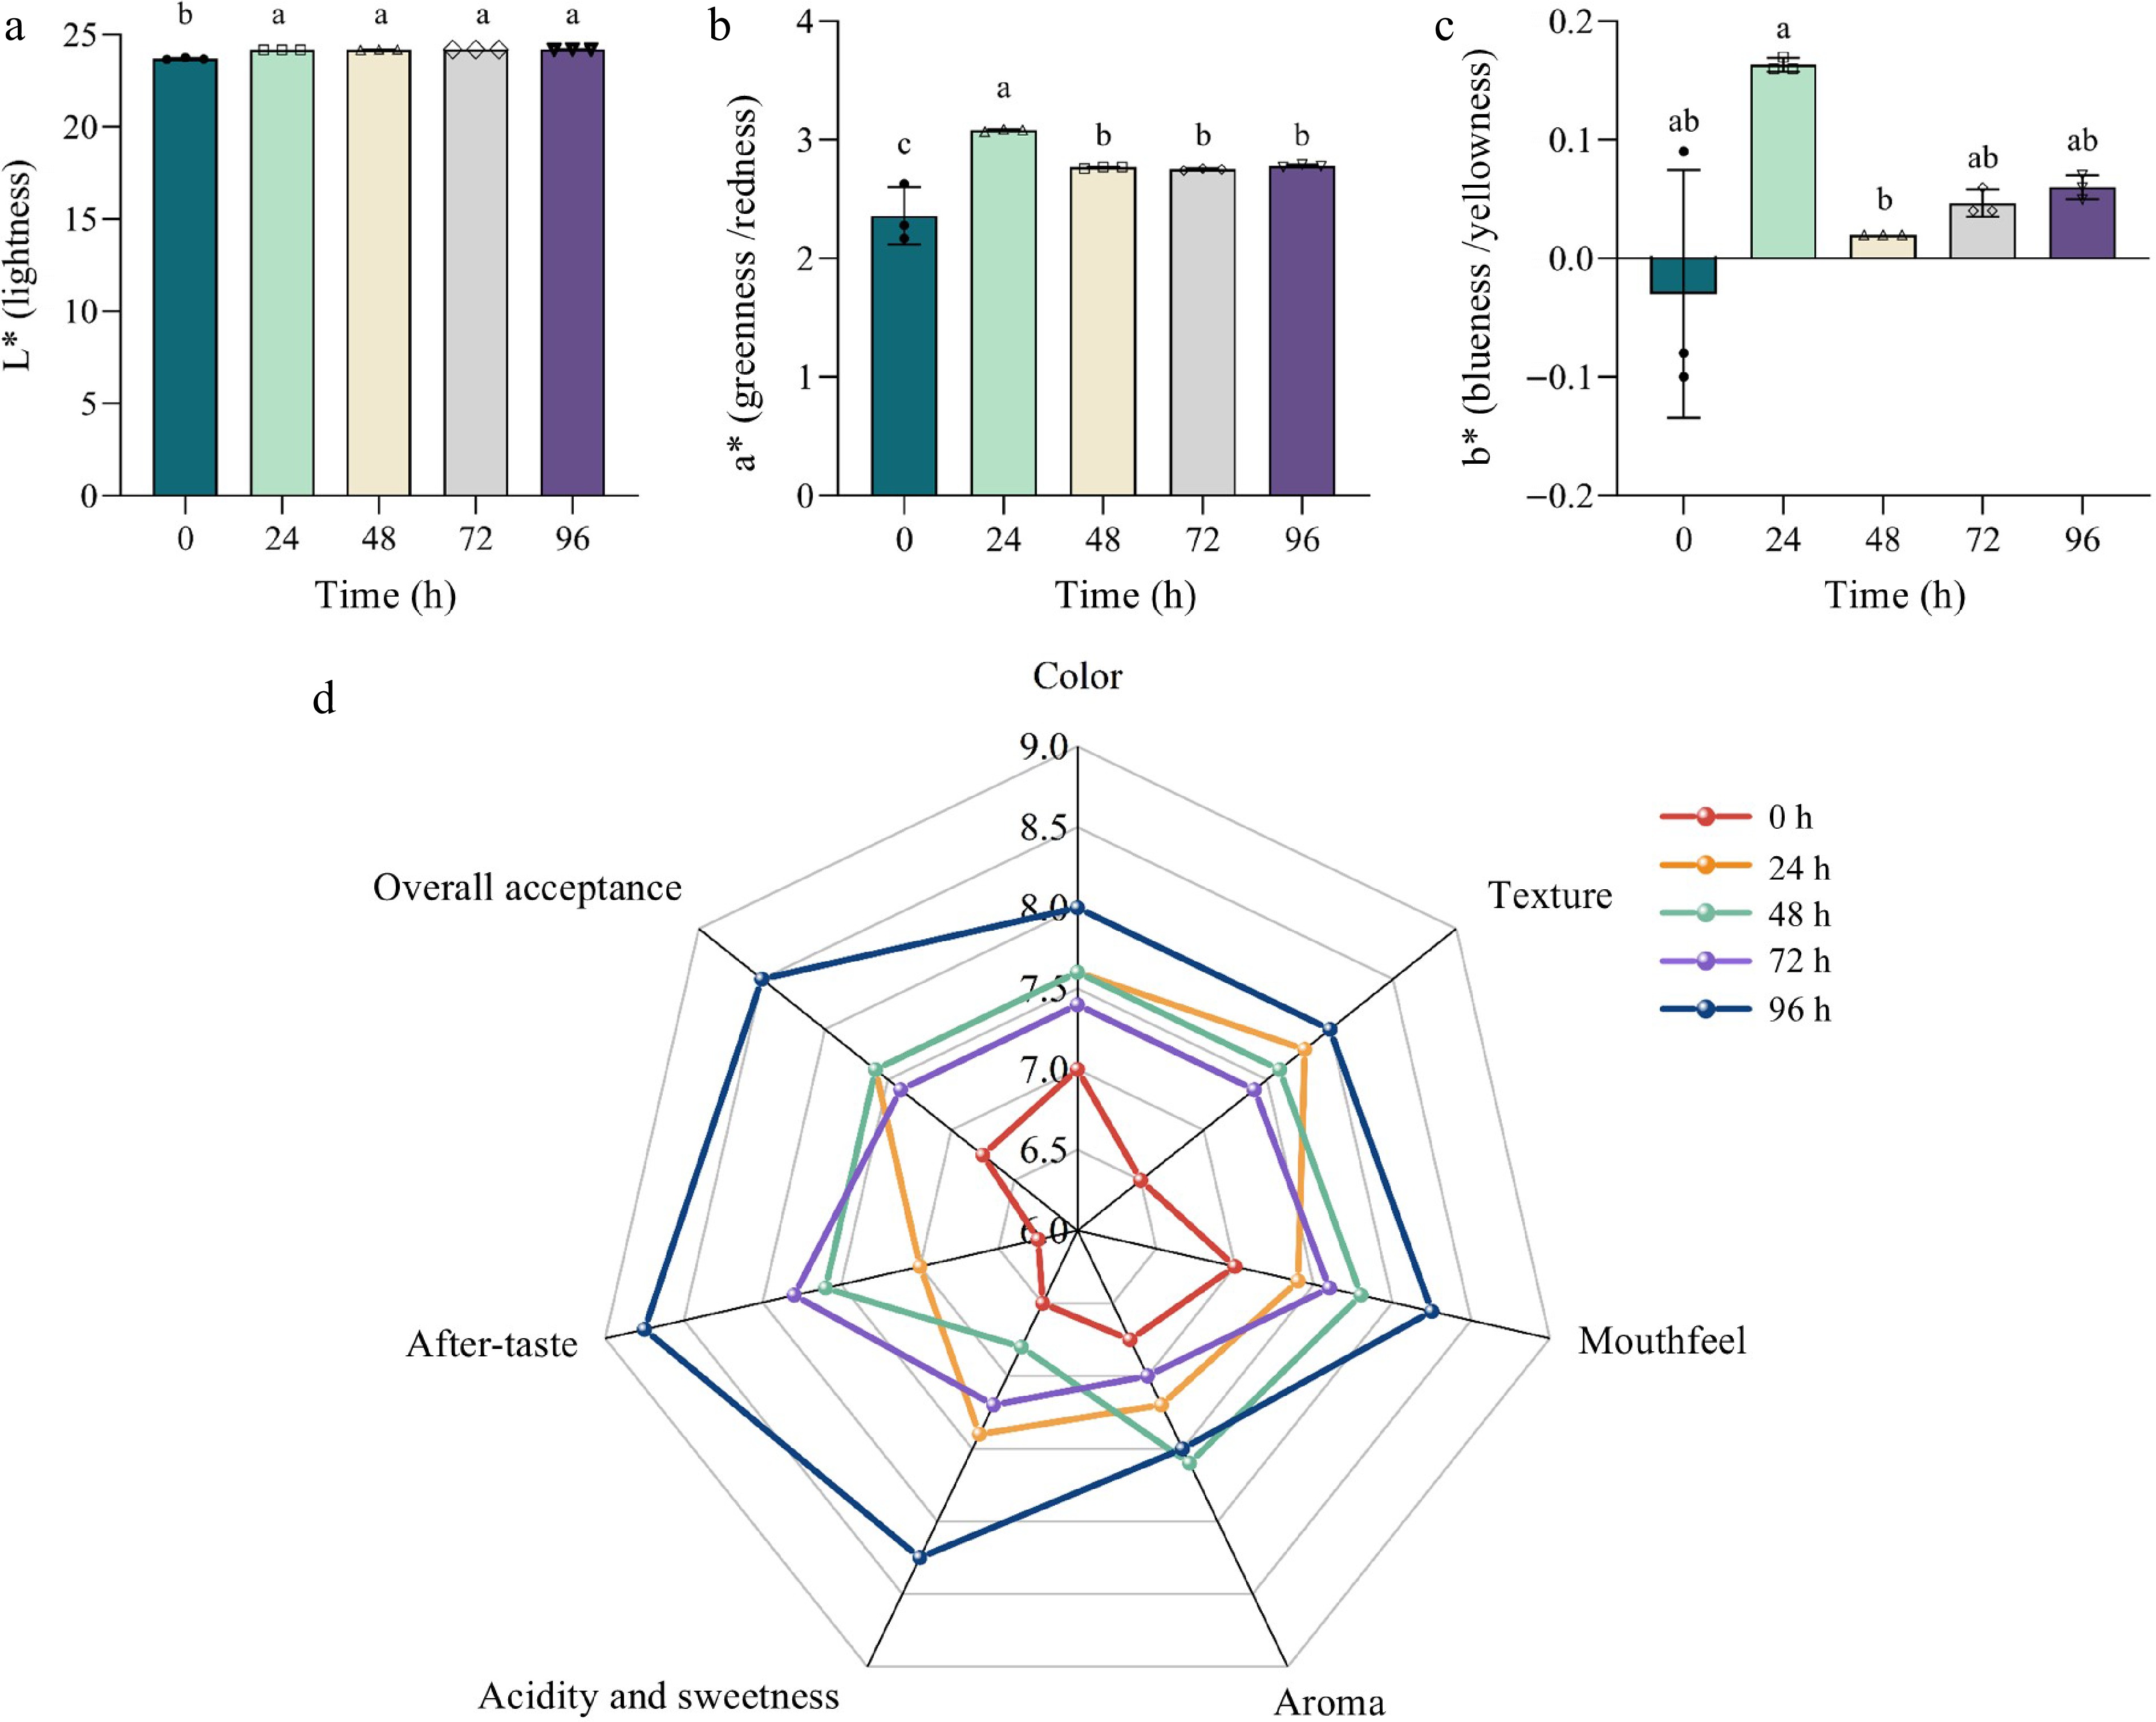
The color parameters were measured and expressed by L* (lightness), a* (redness), and b* (yellowness) values, which showed significant increases throughout the fermentation process (p < 0.05) (Fig. 3a−c). Sensory evaluations of the fermented Aronia melanocarpa juice were graphically represented on a radar chart (Fig. 3d). All sensory attributes, including color, texture, mouthfeel, aroma, acidity and sweetness, after-taste, and overall acceptance, were improved during fermentation. Specifically, the average overall acceptance scores at 0, 24, 48, 72, and 96 h were 6.75, 7.6, 7.6, 7.4, and 8.5, respectively. The 96-h juice achieved the highest rating, indicating a sensory preference for longer fermentation times. The 24-h and 48-h samples also scored relatively high, followed by the 72-h and the initial 0-h samples. In addition, the 24-h and 48-h juices scored well in texture and mouthfeel, respectively. Juices from 72 and 96 h showed the highest ratings in the after-taste category. Moreover, the 96-h sample excelled in most indices, including color, texture, mouthfeel, acidity and sweetness, after-taste, and overall acceptance, while the 48-h sample was noted for optimal aroma. Overall, fermentation markedly enhanced the sensory appeal of Aronia melanocarpa juice compared to its unfermented counterpart.
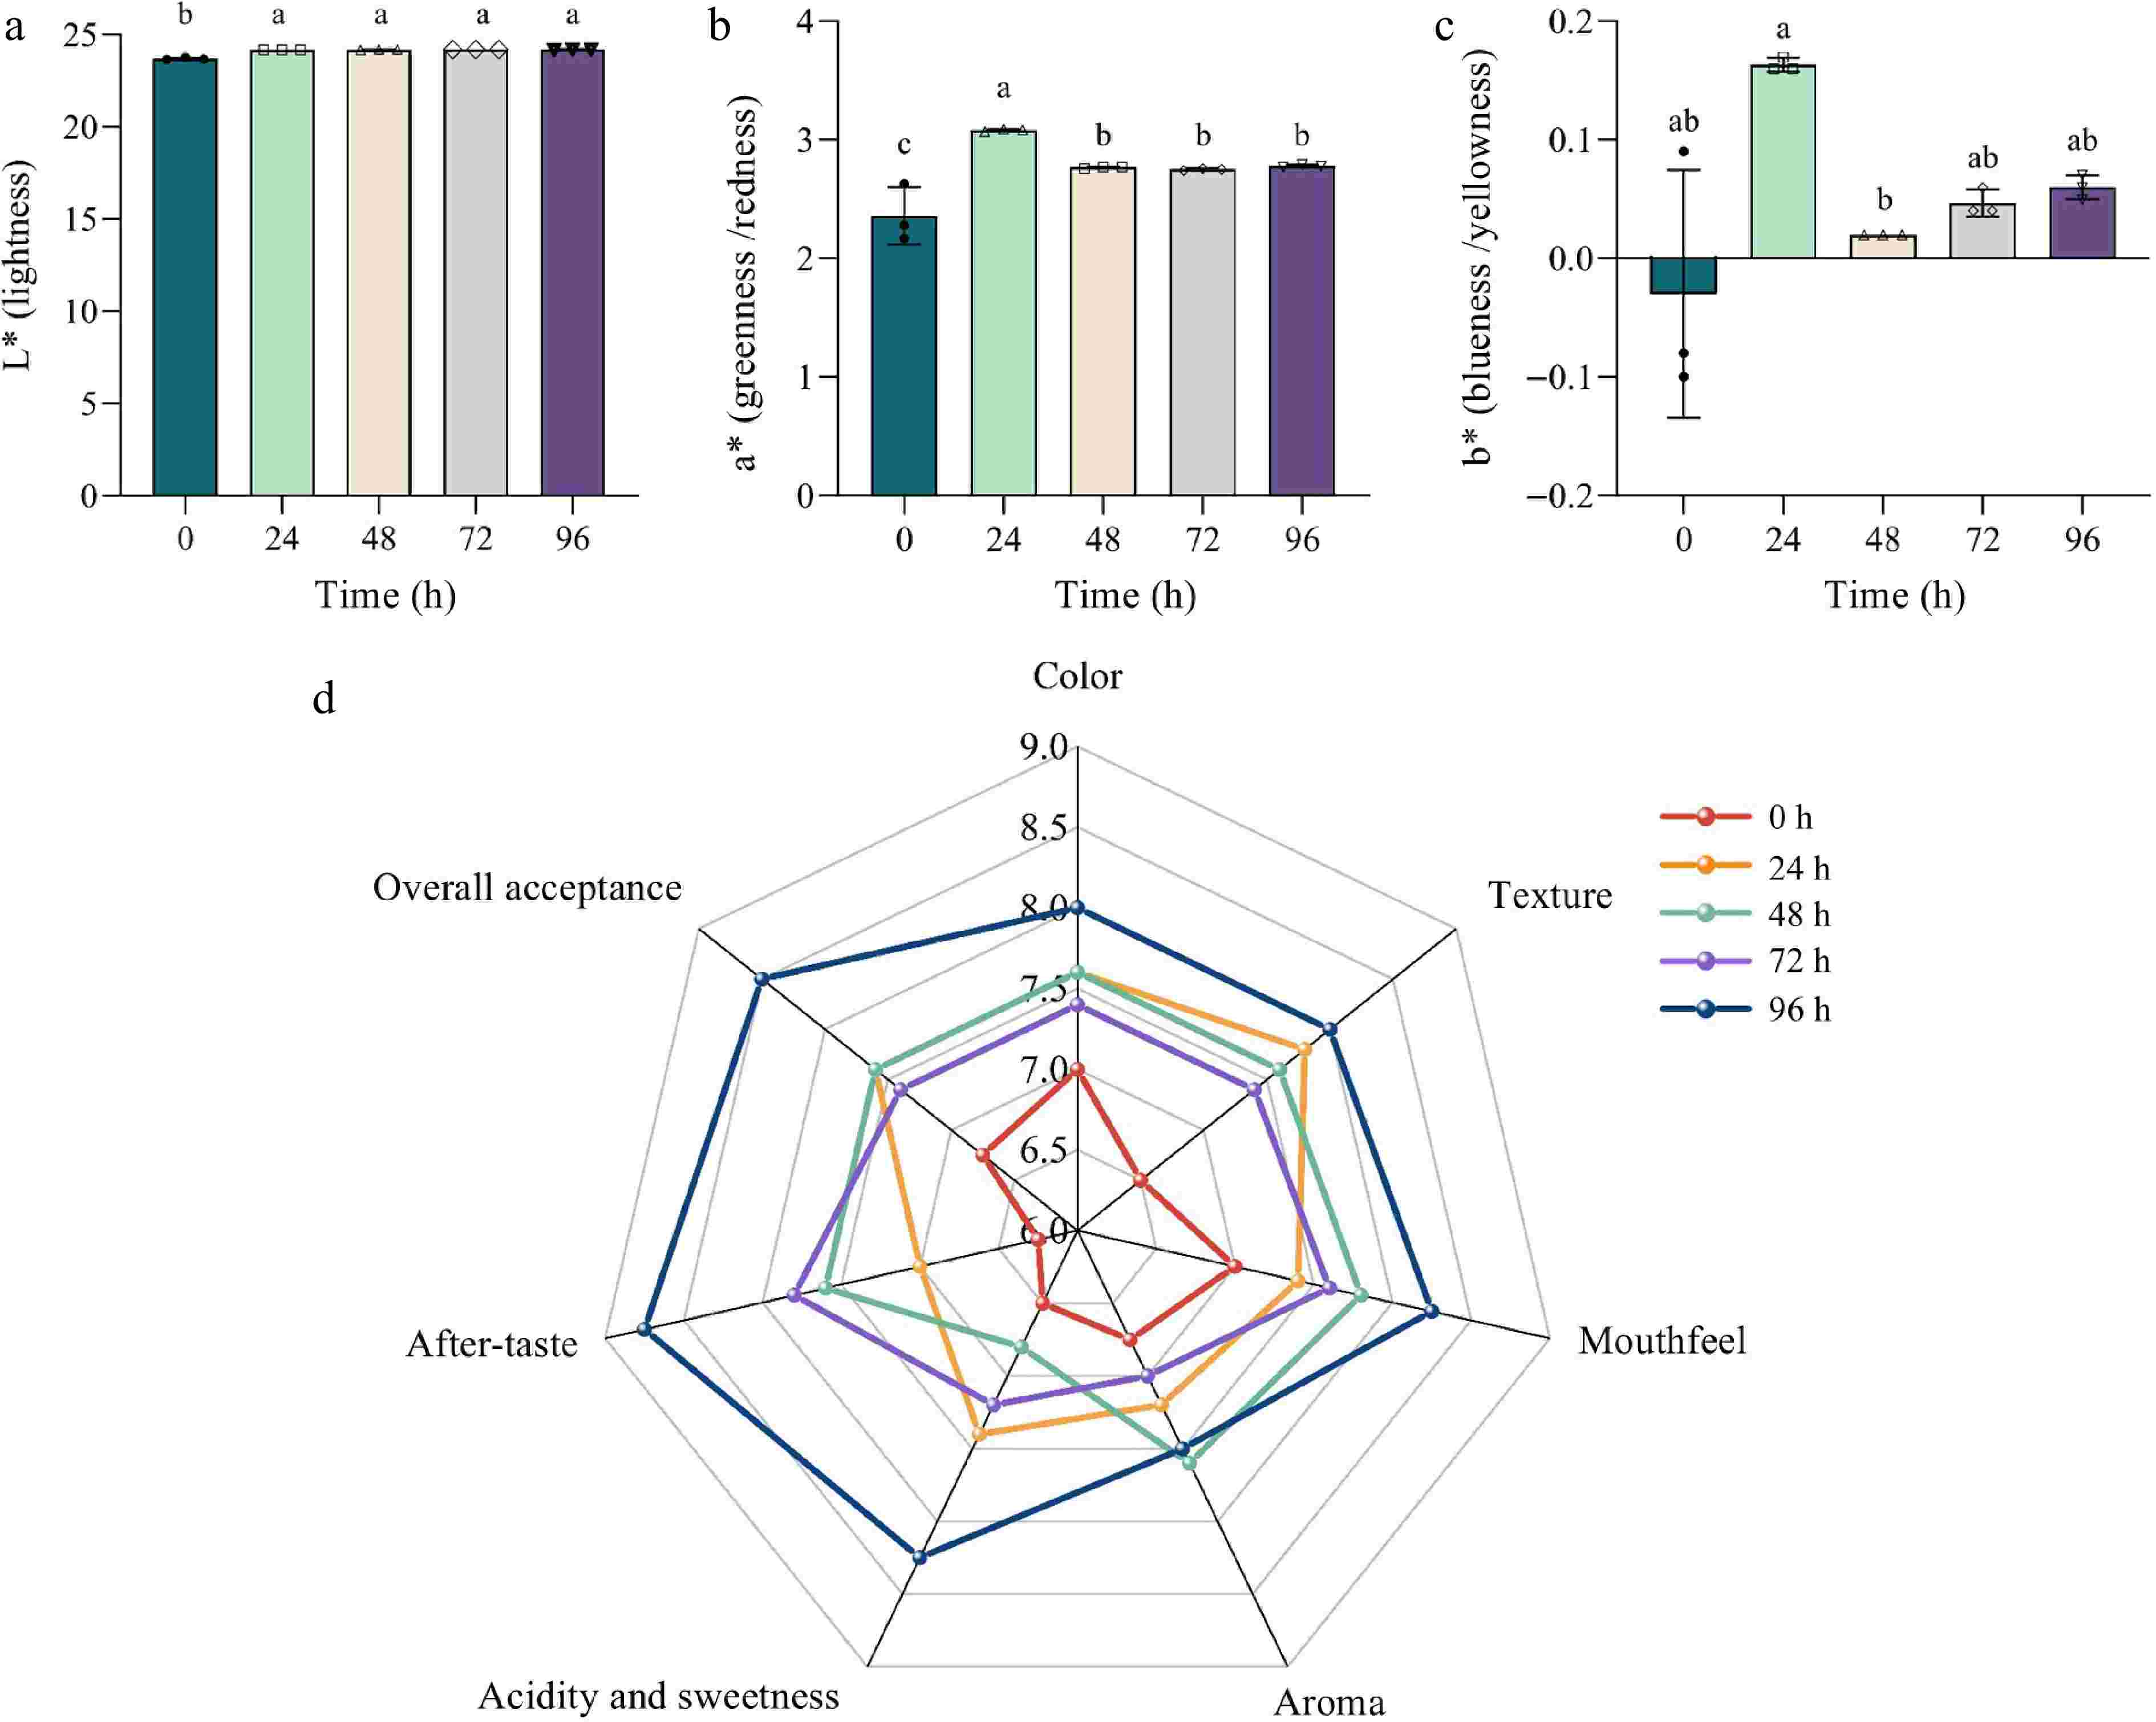
Figure 3.
Color indices and sensory scores of Aronia melanocarpa juice. (a) L* value, (b) a* value, (c) b* value, (d) radar chart of sensory evaluations. Means of different lowercase letters are significant differences (p < 0.05).
E-nose analysis
-
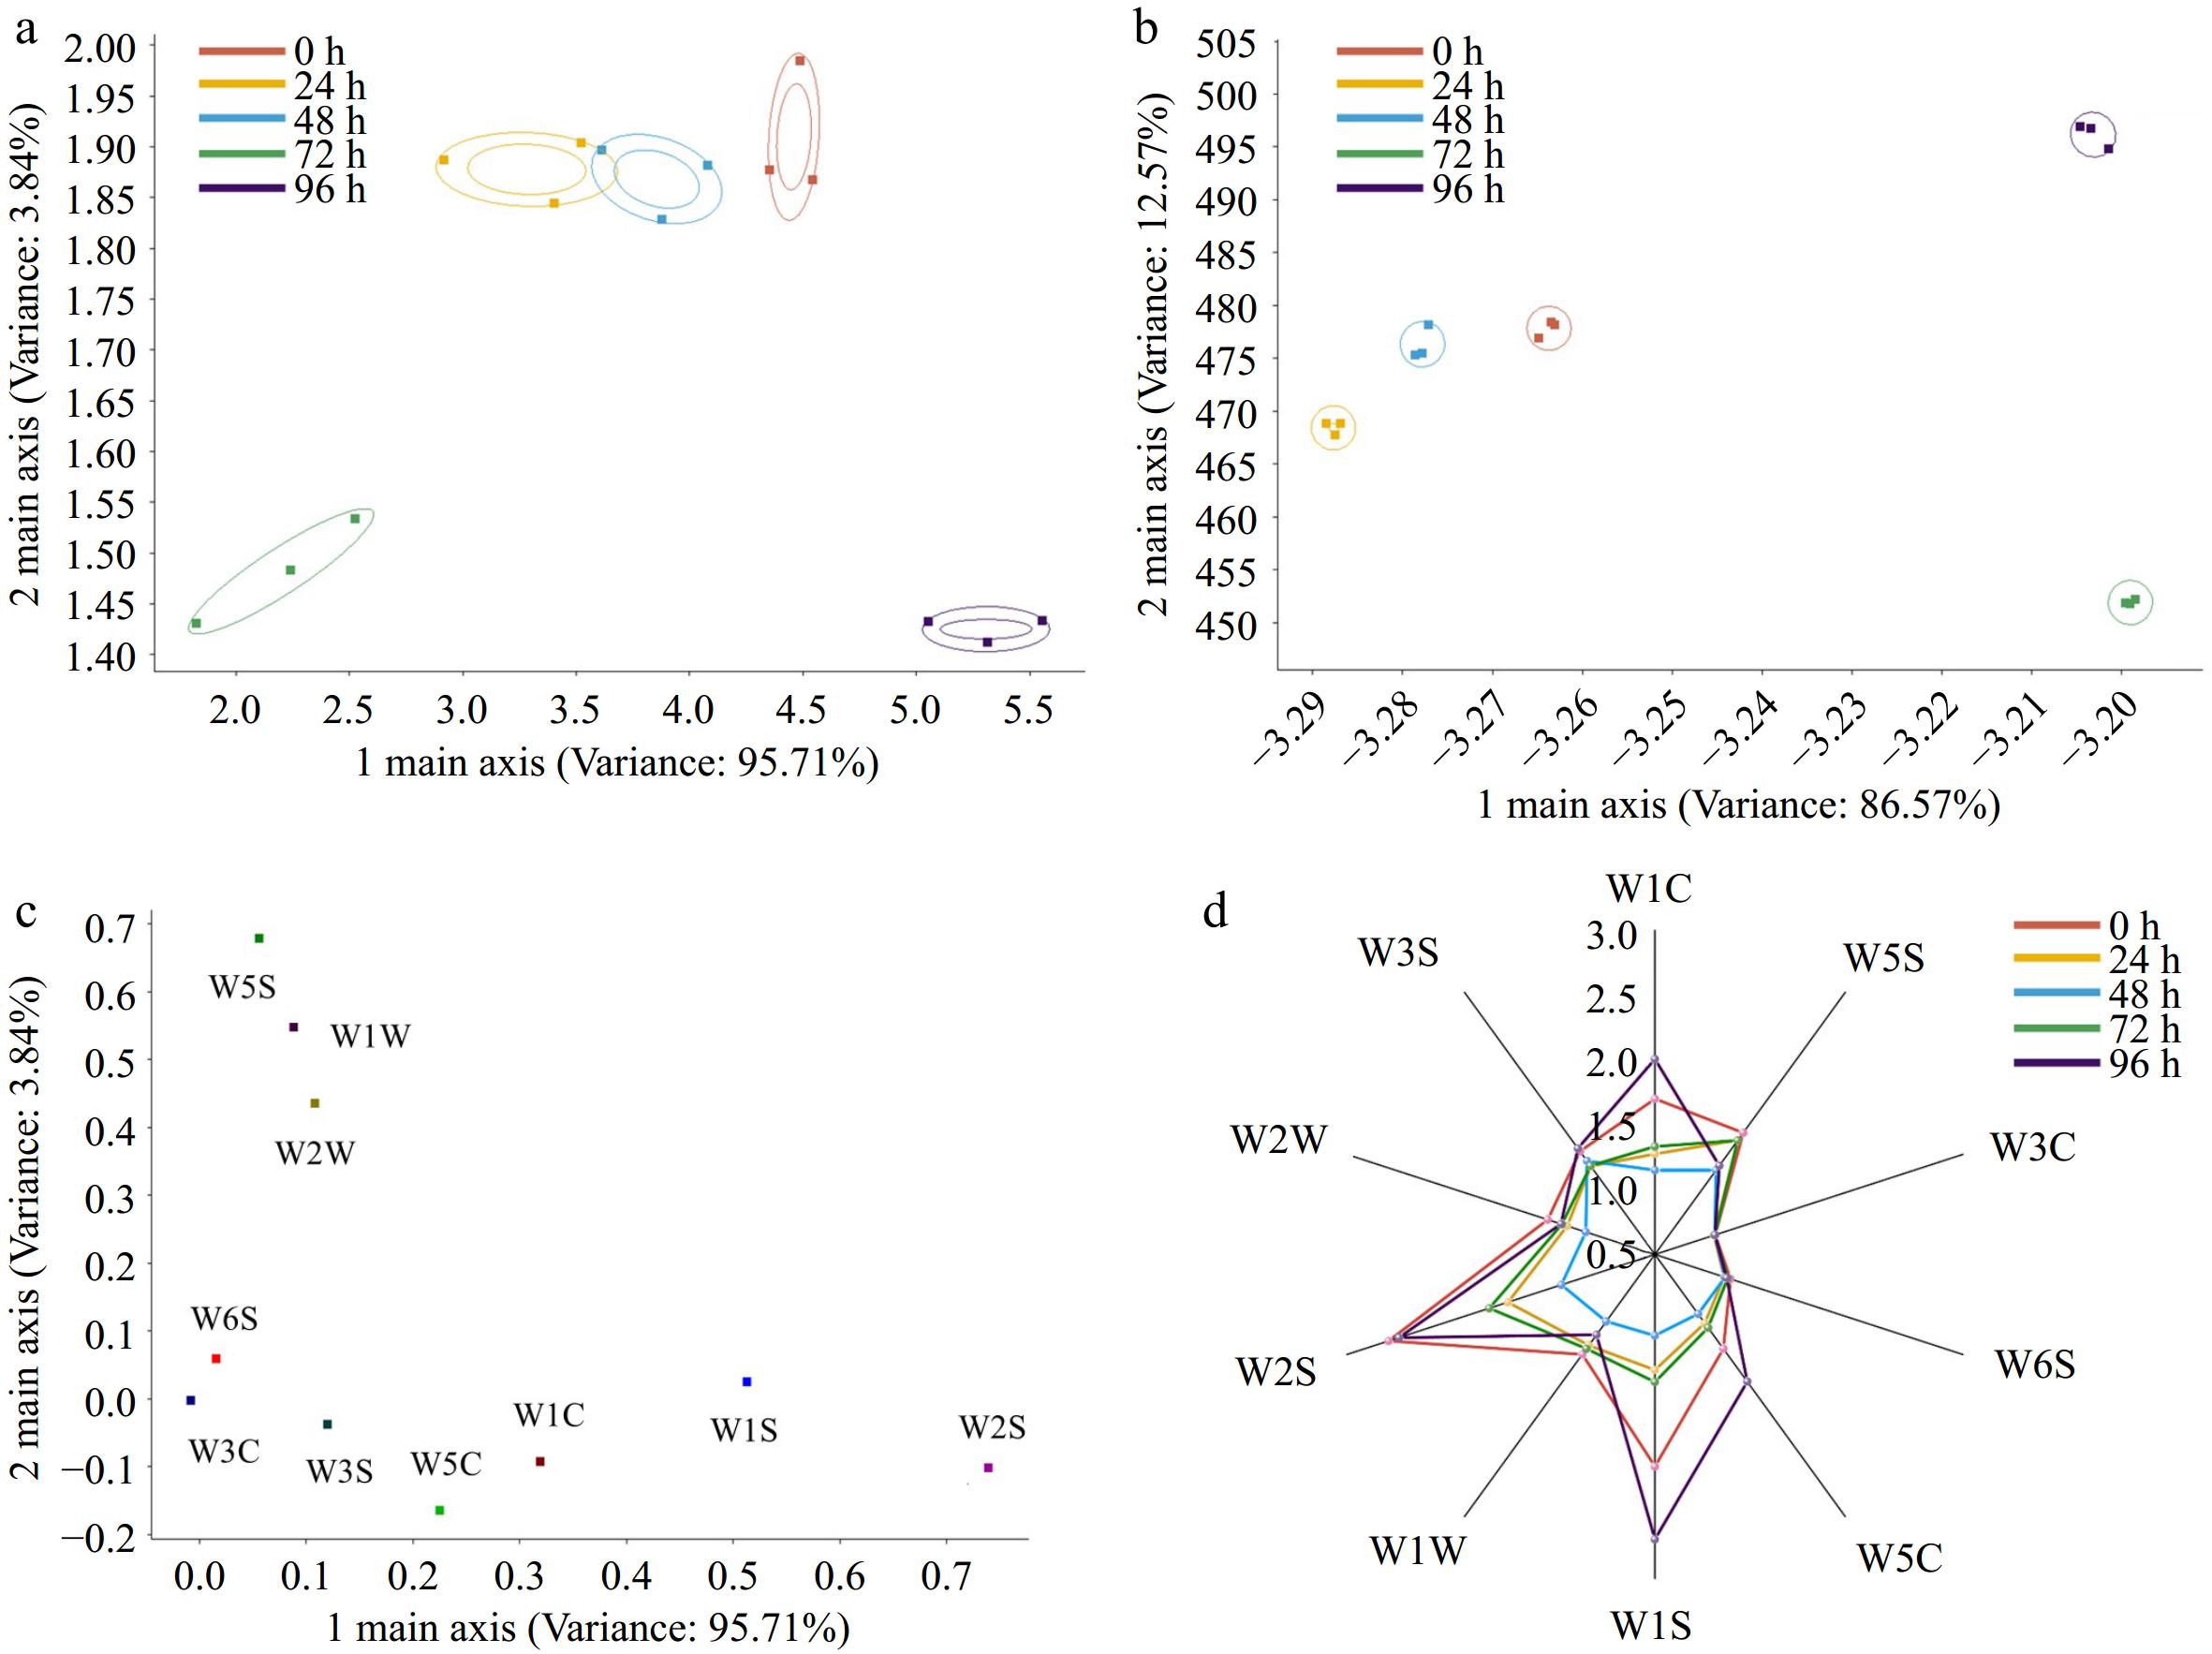
The E-nose analysis was conducted to assess the flavor profiles of fermented Aronia melanocarpa juice. Principal component analysis (PCA) was utilized to examine the differences in volatile compounds across various fermentation times, with results displayed in Fig. 4a. The first principal component (PC1) accounted for 95.71% of the variance, while the second principal component accounted for 3.84%, totally explaining 99.55% of the total variance, indicating that these components adequately represent the aromatic variation in the juice. The PCA plot differentiated the fermented juice from the unfermented, confirming the sensors' capability to distinguish between them. The overlapping of the 24-h and 48-h samples suggested similar aroma profiles between these two durations.
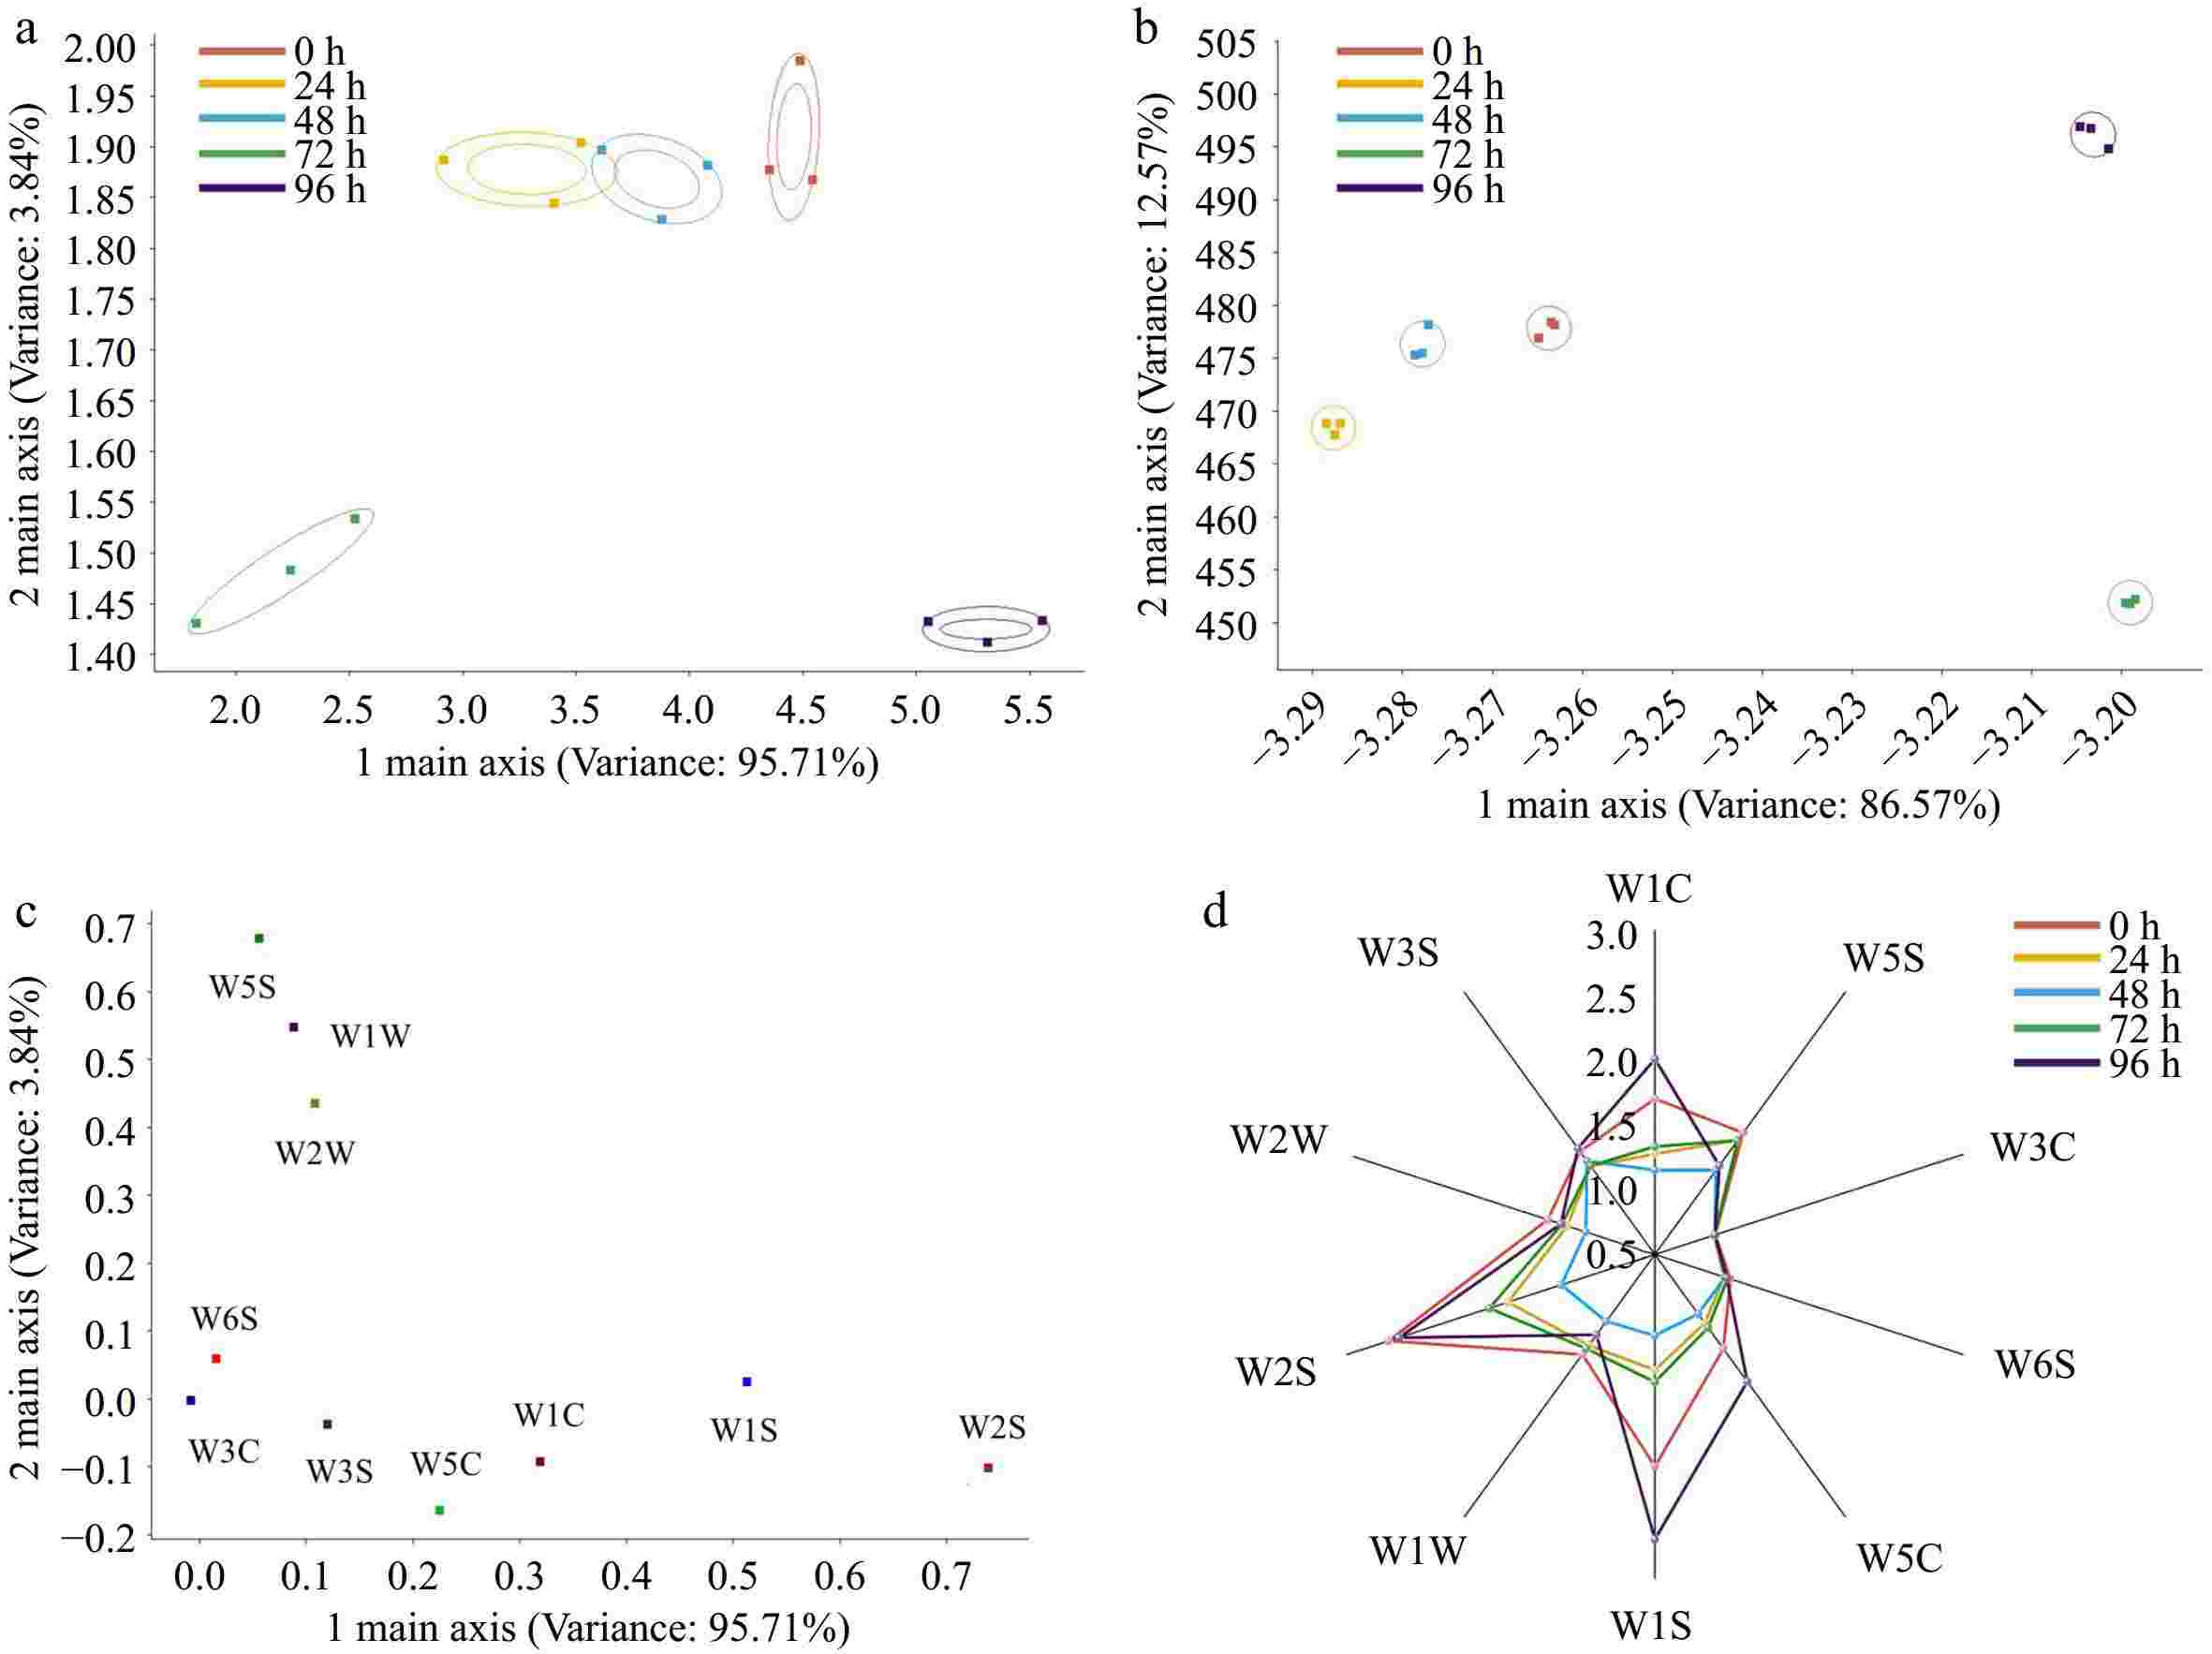
Figure 4.
E-nose analysis. (a) Principal analysis plot, (b) linear discriminant analysis plot, (c) loading plot, (d) radar chart of E-nose sensors.
Linear discriminant analysis (LDA) was applied to achieve clearer separation among the sample groups. The first and second linear discriminants explained 86.57% and 12.57% of the variance, respectively, totaling 99.14%. The LDA plot (Fig. 4b) effectively separated all sample groups, illustrating that juices fermented for different durations possess distinct aromatic profiles. Based on the loading plot (Fig. 4c), sensor W2S, which detects alcohols, aldehydes, and ketones, had the highest impact on differentiating the first principal component. Sensor W5S, sensitive to nitrogen oxides, had the highest influence on the second principal component.
Changes in sensor signal intensities were graphically represented in a radar chart (Fig. 4d). All sensors, except for sensor W3C, which detects ammonia, exhibited significant variations in their electrical signal intensities (p < 0.05). Notably, sensors W5S and W6S, which are sensitive to nitrogen oxides and hydrogen gas, respectively, showed significant decreases in signal intensity in all fermented samples compared to the 0-h control (p < 0.05). Sensors W2S and W2W, responsible for detecting alcohols, aldehydes, ketones, aromatics, and organosulfides, registered lower readings in fermented juice than in unfermented juice. The greatest impact on the volatile profiles brought by the fermentation was aromatic organic compounds, aliphatic aromatics, and methyl compounds at 96 h, where sensors W1C, W5C, and W1S recorded significantly higher values compared to other time points, especially at 0 h.
Correlation analysis between E-nose sensors and fermenting times
-
Correlation analysis of the Aronia melanocarpa juice across different fermentation times resulted in two distinct clusters, each demonstrating similar volatile compound profiles. The first cluster grouped the juices fermented for 48, 96 h, and the unfermented juice. Conversely, the second cluster comprised the 48-h and 72-h fermentation samples. At 0 h and at 96 h of fermentation, sensors W1S, W2S, and W1C recorded increased intensities, signaling a relatively high expression of methyl compounds, alcohols, aldehydes, ketones, and aromatic organic compounds. The 24-h and 72-h samples showed strong responses from sensors W2S and W5S, which are sensitive to alcohols, aldehydes, ketones, and nitrogen oxides. Notably, the 48-h samples exhibited lower sensor responses across all sensors. Additionally, all juice samples showed relatively high levels of sensor W2S, associated with alcohols, aldehydes, and ketones. The distribution of sensor W1S, detecting methyl compounds, was most prominent in the 96-h samples, while sensor W2S showed the highest levels in the unfermented juice (Fig. 5a).
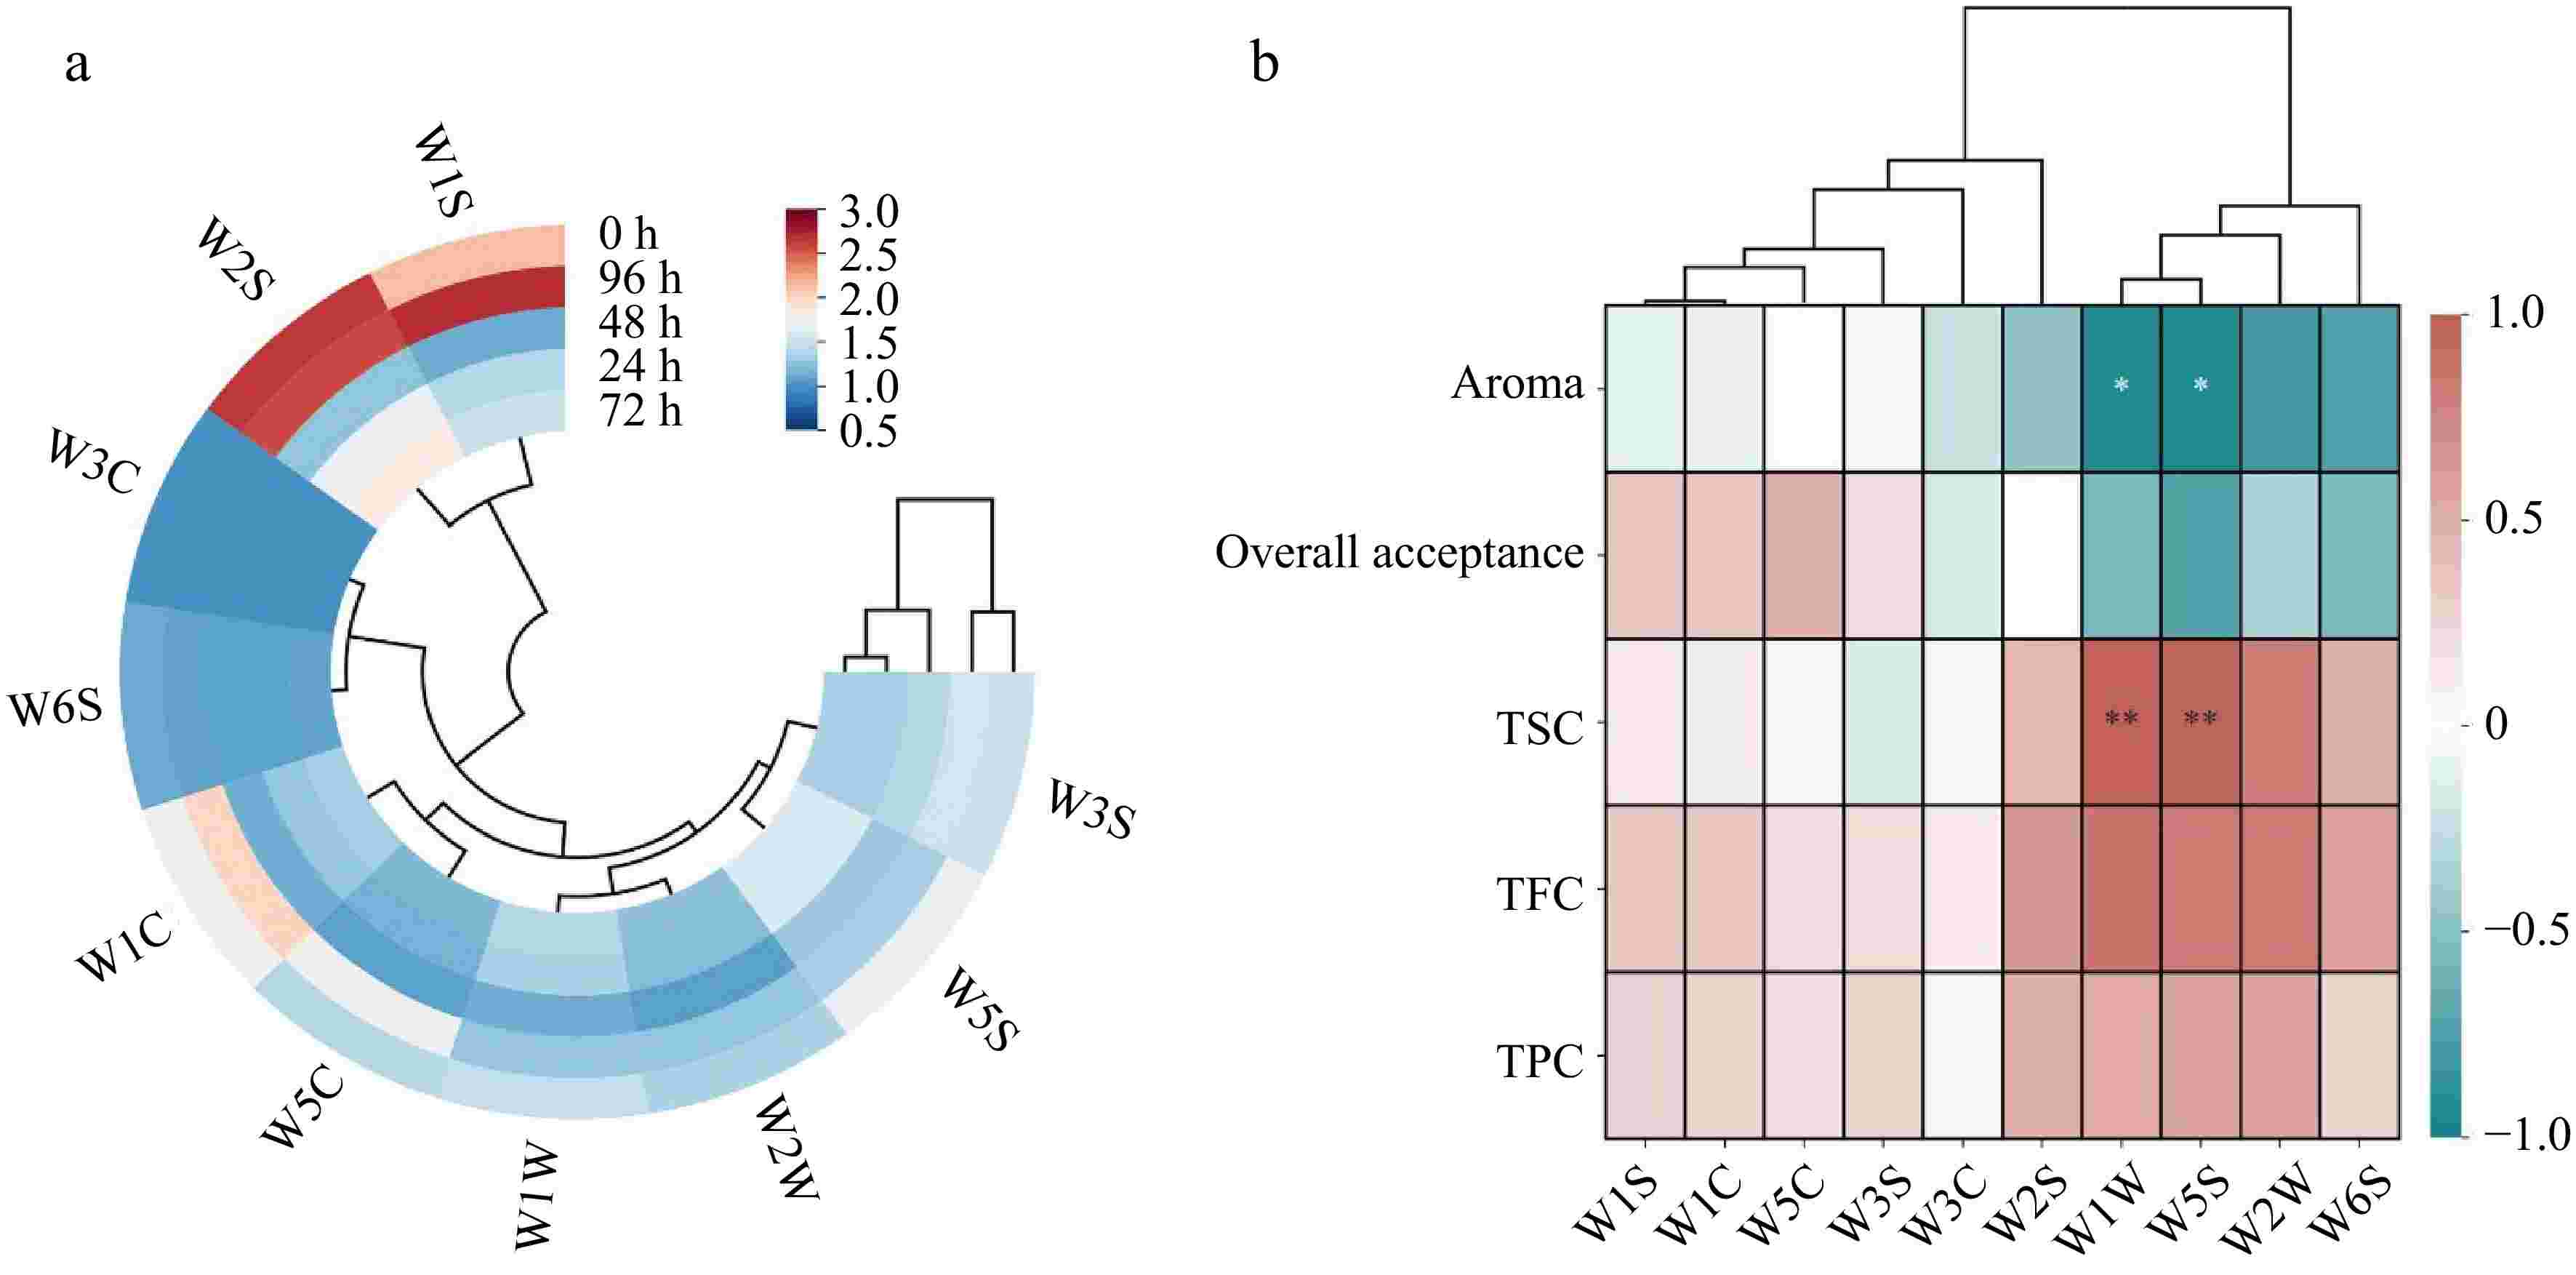
Figure 5.
Circle heatmap of correlation analysis between (a) fermenting times and E-nose sensors. The color bar ranged from blue to red, representing a positive correlation from 0.5 to 3. Double matrices correlation heatmap between (b) E-nose sensors and sensory evaluations in all fermenting times. * indicates significant mark (p < 0.05), ** indicates significant mark (p < 0.01). The color bar ranged from green to pink, representing a correlation relationship from negative to positive.
Further correlation analysis explored the relationships between E-nose sensor responses and various juice quality parameters such as aroma, overall acceptance, total sugar content, total phenolic content, and total flavonoid content across all fermentation times (Fig. 5b). Interestingly, sensors W1W and W5S demonstrated significant negative correlations with the aroma index (p < 0.05), indicating that the presence of sulfide compounds and nitrogen dioxide adversely affected the aroma of the Aronia melanocarpa juice. In contrast, positive correlations were observed between sensors W1W, W5S, and the TSC, indicating an intricate connection between volatile compounds and sugar levels in the juice.
Correlation analysis between quality indices and sensory evaluations
-
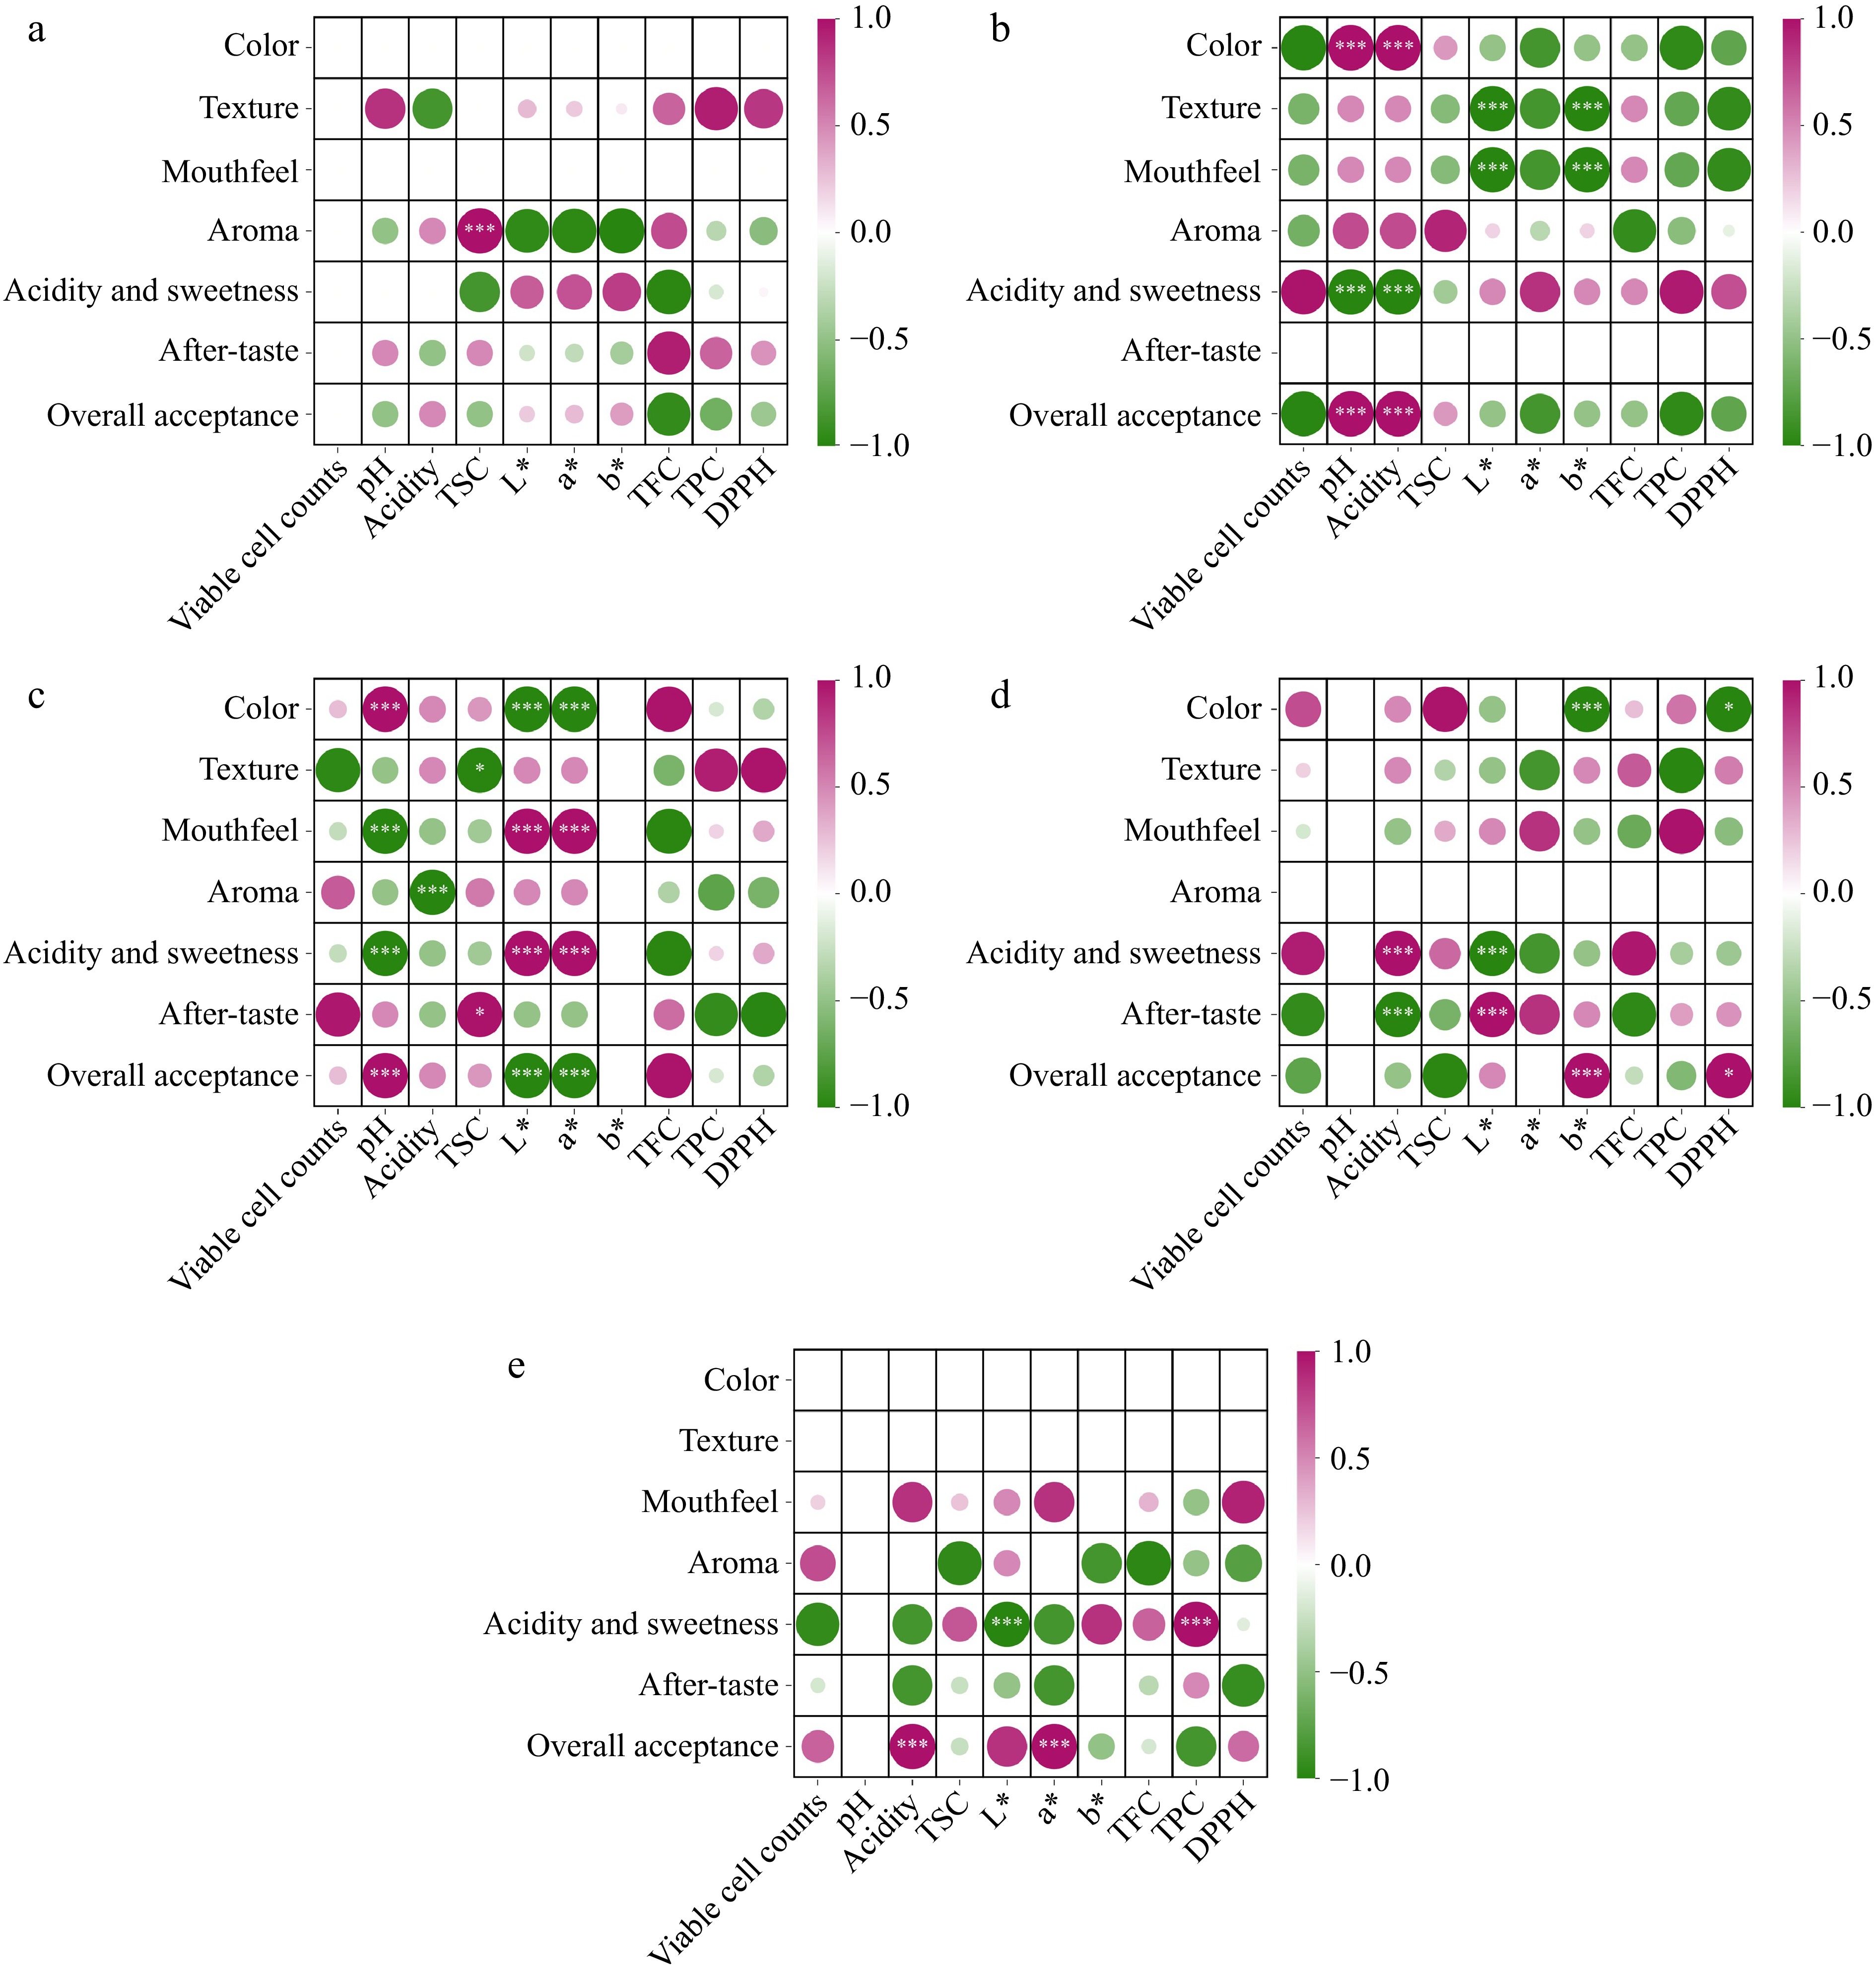
Correlation analyses were performed to examine the relationships between various quality indices and sensory evaluations at different fermentation times (Fig. 6a−e). In the unfermented juice, a significant positive correlation was observed between aroma and TSC (p < 0.001), while other correlations were not substantial (Fig. 6a). Notably, for the 24-h fermented juice, a clear negative correlation existed between pH and sour-sweet balance, as well as between acidity and sour-sweet balance (p < 0.001) (Fig. 6b). The 48-h juice sample, which achieved the highest aroma score (Fig. 3d), displayed a strong negative correlation between aroma and acidity (Fig. 6c). For the juice with 72 h of fermentation, the acidity presented a negative correlation with after-taste index (p < 0.001). Besides, the color index exhibited a negative correlation with the b* value (p < 0.001) (Fig. 6d). In the 96-h sample, TPC was negatively correlated with the overall acceptance, whereas the TSC was positively correlated with the balance of acidity and sweetness. A positive correlation was found between overall acceptance and both acidity and a* (Fig. 6e).
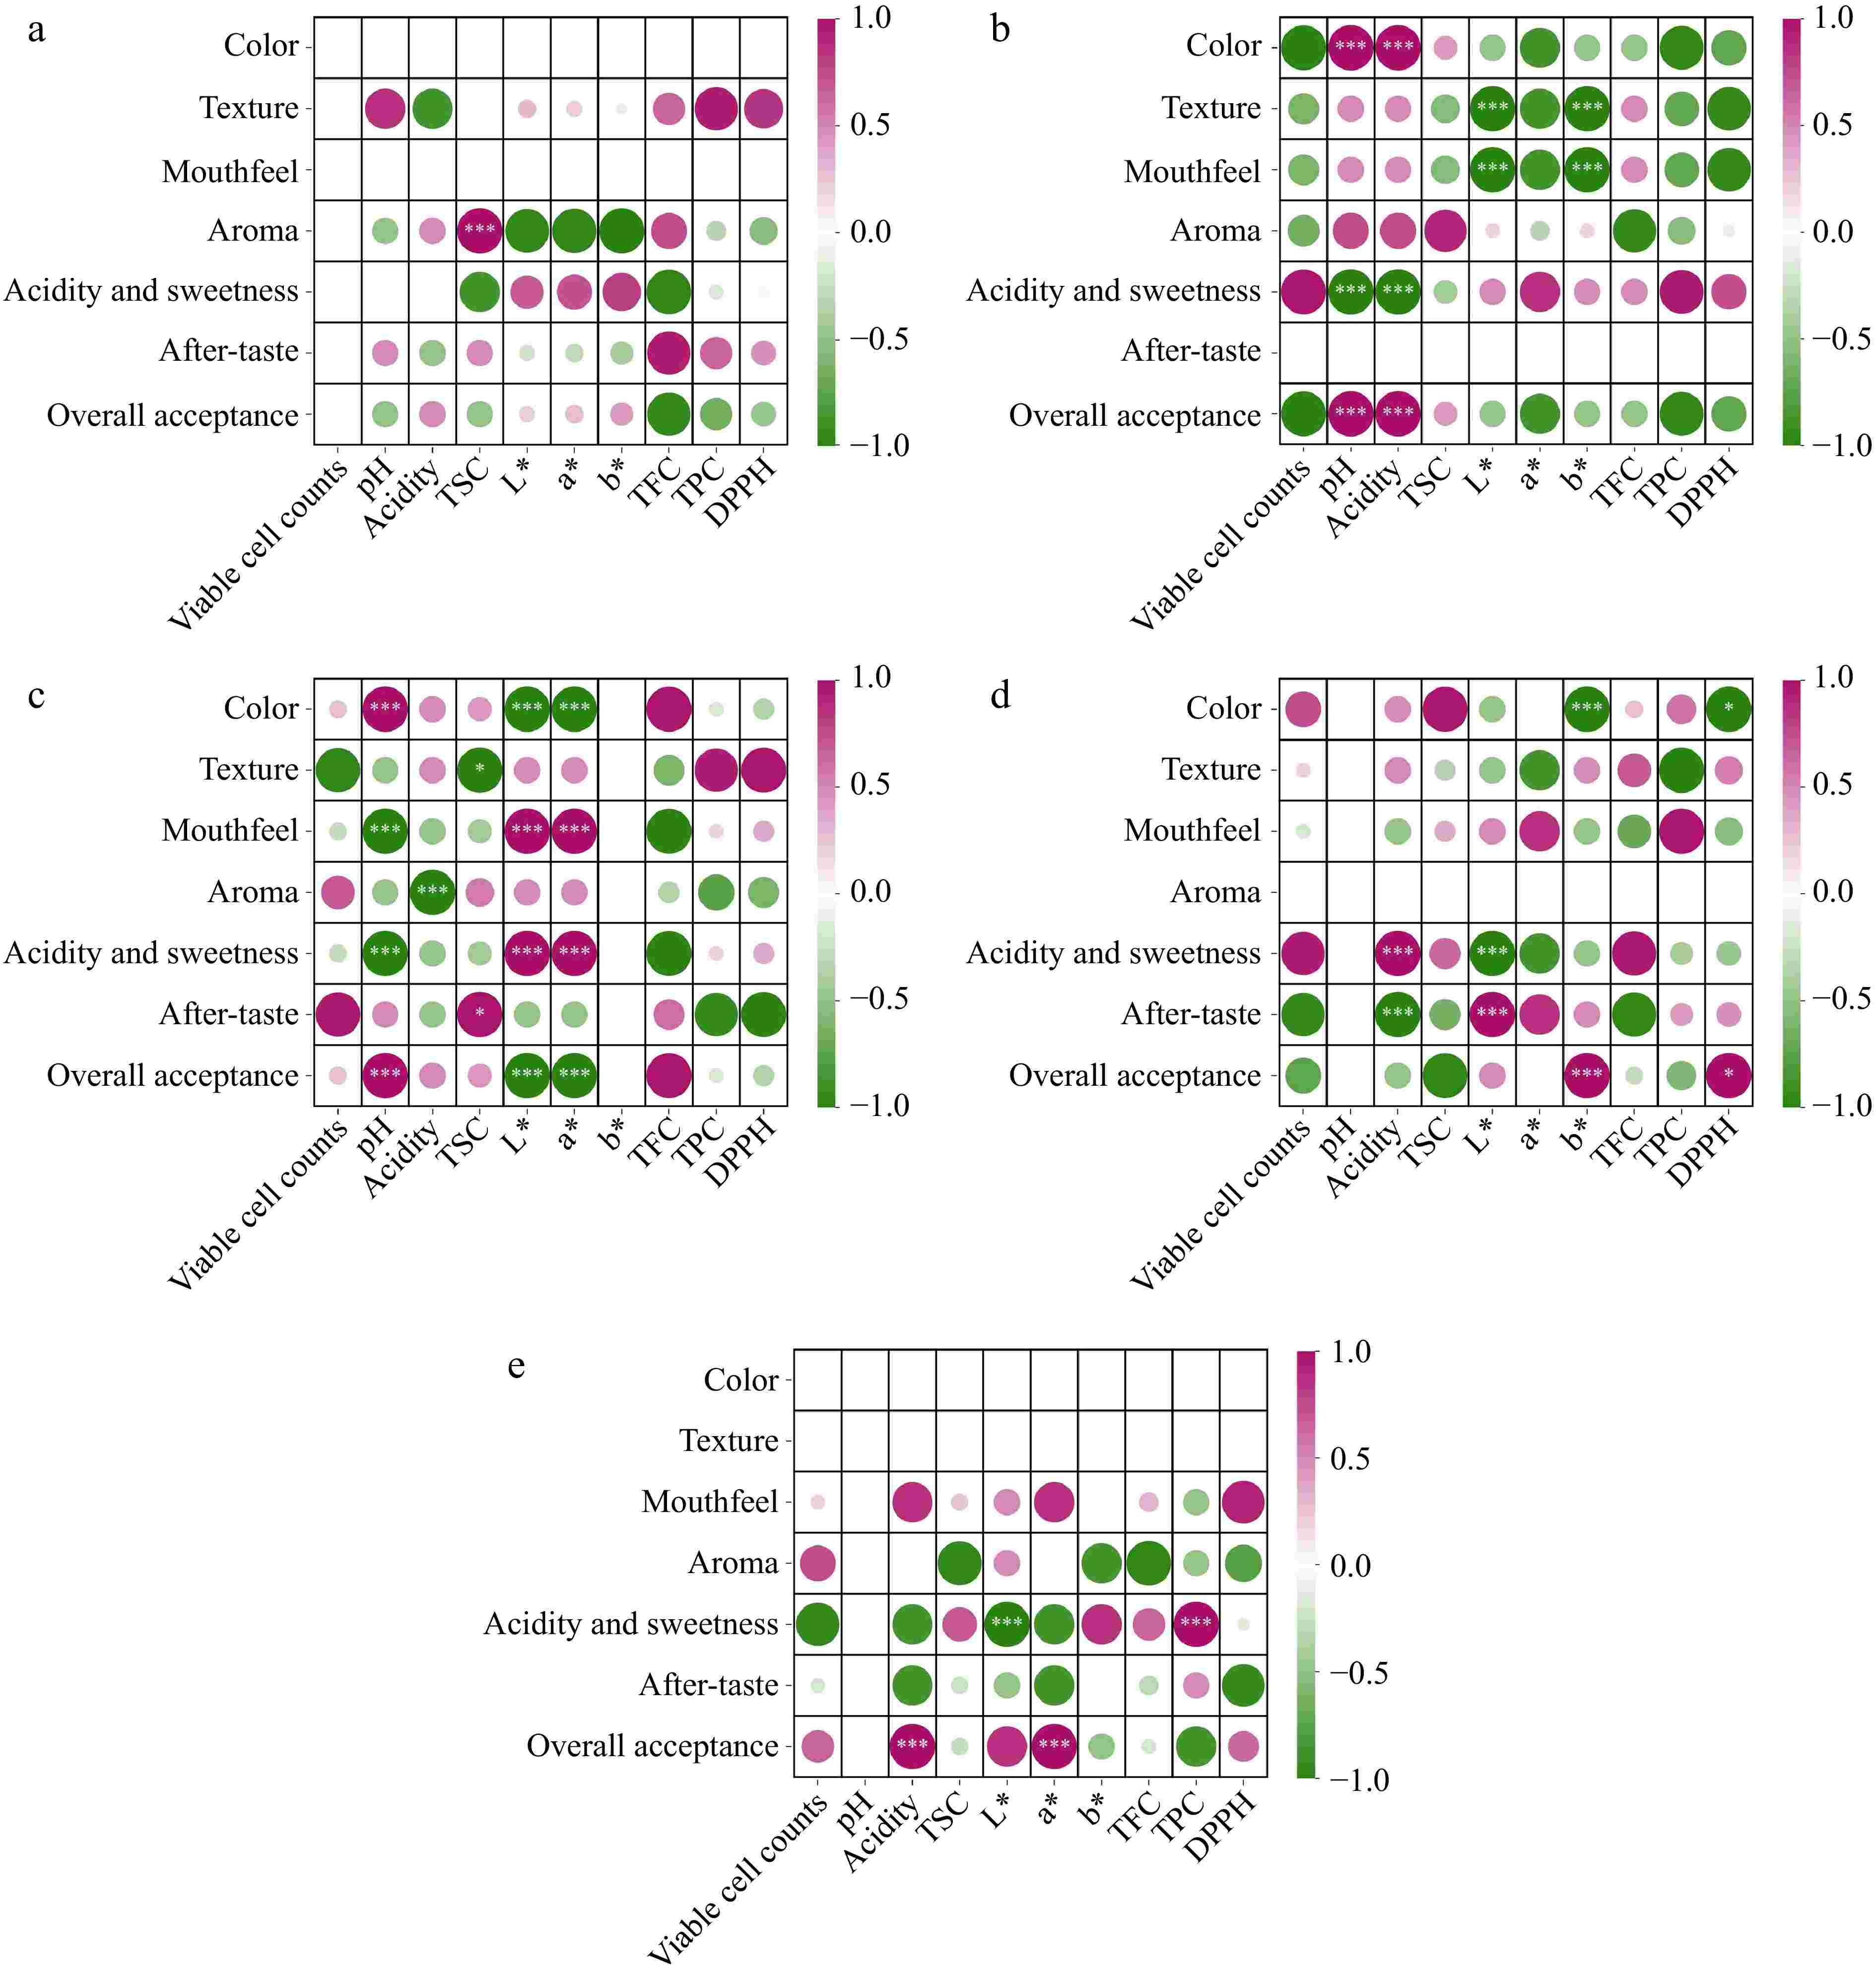
Figure 6.
Double matrices heatmap of correlation analysis between quality indices and sensory evaluations of different fermenting times. (a) 0 h, (b) 24 h, (c) 48 h, (d) 72 h, (e) 96 h. The color bar ranged from green to pink, representing a correlation relationship from negative to positive. * indicates significant mark (p < 0.05), ** indicates significant mark (p < 0.01), *** indicates significant mark (p < 0.001).
-
The application of mixed Lactobacillus strains to ferment Aronia melanocarpa juice brought significant changes to the physicochemical properties, antioxidant capacity, and sensory attributes of the juice. The viability of cells declined notably after the first 24 h of fermentation, probably attributable to the acidic environment generated by lactic acid bacteria, along with evidence that low pH influences cell viability[10]. Despite this, the juice reached the required viable counts for probiotic standards at 24 and 48 h of fermentation, with colony counts exceeding 6 lg CFU/mL[21].
According to the literature, during lactic acid bacteria fermentation, sugars are typically transformed into lactic acid and other by-products[22], which can explain the overall reduction in sugar content in fermented juice compared to the unfermented one. The first decrease in total sugar concentration of fermented Aronia melanocarpa juice can be attributed to the metabolic activity of bacteria that consume sugars as their main nutrient source[23]. This discovery aligns with the reduction in sugar content of the fermented sweet lemon due to bacterial consumption[24]. However, the lactic acid bacteria can produce polysaccharides, such as exopolysaccharides, through various pathways along with the fermentation[22]. For example, earlier research has demonstrated the potential of Lactobacillus strains, especially the Lactiplantibacillus plantarum, to release exopolysaccharides in fermentation[25]. This process increased sugar content, aligning with the recorded increase in TSC in fermented fig juice[26]. Furthermore, sugar may not be the sole carbon source of lactic acid bacteria metabolism[27], which may also account for the growth in the total sugar content between 48 and 72 h of fermentation in the study.
The study documented an initial rise in pH within 24 h of fermentation, subsequently followed by a decrease. This pattern corresponds to findings from another investigation[28]. However, such pH elevation in the early stage of fermentation is not observed in the majority of lactic acid bacteria-fermented fruit juices, even those involving similar strains[17]. This may be linked with the initial low pH of Aronia melanocarpa. Throughout the fermentation, pH levels were maintained below 4.0. The low pH was beneficial to the preservation of the product[29]. The acidity is a result of dynamic fluctuations in the concentrations of all inorganic acids and organic acids. In the first 24 h and between 72 and 96 h, the changes in acidity reversed with the increase in pH. The organic acid may have suffered from significant changes during the fermentation due to the dynamics of lactic acid and malic acid within the juice[28]. The fermentation could produce lactic acid as the main end product[30], increasing the acidity, while the malic acid, the principal organic acid of Aronia melanocarpa, might be consumed in malolactic fermentation[28], which was converted into lactic acid[31]. Hence, it is supposed that the relatively stable acidity from 48−72 h is thought to reflect a balance between organic acid depletion and the increase in inorganic acid. The depletion in organic acid was caused by the faster rate of malic acid consumption than the production of lactic acid, including the lactic acid from the bacteria metabolism and the transformation from malic acid. The phenomenon accorded with a study in fermented apple juice, whose major organic acid is also malic acid[16]. Furthermore, the lactic acid bacteria can also produce metabolites that can neutralize acidity, such as NH3 released from amino acid catabolism[32]. It could also be responsible for the dynamics of the acidity of Aronia melanocarpa juice.
Total phenolic and flavonoid components in Aronia melanocarpa juice are essential to its antioxidant activity, offering substantial health benefits[10]. Initially, the study observed a decrease in total phenolic compounds, subsequently followed by an increase. Contrary to the initial reduction, multiple studies have shown that lactic acid bacteria fermentation generally increases total phenolic content, hence considerably enhancing the juice's antioxidant action[15,31]. In this study, the decrease in TPC might be related to the unstable properties of phenolic compounds, which may undergo oxidation and degradation in fermentation[27]. In addition, the mixed strains used in this study exhibited relatively low viability, which might negatively affect the transformation of bioactive components into active forms. Flavonoids, key phenolic compounds in Aronia melanocarpa juice, comprise several subgroups, including flavanols (catechins), flavonols, anthocyanins, and proanthocyanidins[33]. In contrast to expectations, flavonoid concentrations in the juice decreased after 48, 72, and 96 h of fermentation compared to unfermented samples. This finding contradicts other studies where both total flavonoid content and total phenolic content were reported to increase[34,35]. The decline in flavonoid levels could be associated with a notable fall in flavonol glycosides, as evidenced by relevant research[28]. Variations in the concentration of bioactive components during lactic acid bacteria fermentation can be impacted by multiple variables, including the specific starter culture involved in the fermentation and the ingredients employed as the fermenting substrate[15]. The DPPH assay, a critical measurement for fermented Aronia melanocarpa juice, indicates the antioxidant activity and nutritional value of the final product. Despite reductions in total phenolic content and total flavonoid content, these did not significantly impact the DPPH scavenging activity of the fermented juice. This anomaly could be attributed to the degradation of Aronia melanocarpa cell walls during fermentation, enabling the liberation of phenolic compounds from their bound states into bioavailable forms[2]. In addition, fermentation might increase concentrations of benzoic acid and benzaldehyde, which possess remarkable antioxidant activity[36], maintaining the DPPH level. The decrease in DPPH activity at 24 h is consistent with other studies on fermented tropical fruit juices[17]. Notably, DPPH levels in all tested Aronia melanocarpa juice samples remained above 60%, a relatively high level compared to other fruits.
Color, a crucial physical index, is closely related to sensory properties in food products. During the fermentation of Aronia melanocarpa juice, color changes may be predominantly influenced by the variations in anthocyanin content. These alterations may arise from the synthesis of acetaldehyde by Lactiplantibacillus plantarum, which can promote the generation of pyranoanthocyanins through malolactic fermentation[37]. Research indicates that shifts in anthocyanin hues, comprising blue, red, violet, and pink are associated with alterations in pH during fermentation[38]. This suggests that pH modifications significantly impact anthocyanin stability, hence resulting in the color of the juice.
Sensory evaluation results demonstrated that fermentation significantly enhanced the sensory acceptance of Aronia melanocarpa juice. This finding aligned with previous research on the probiotic fermentation of fruit juice[31]. Aronia melanocarpa juice fermented for 96 hours displayed the highest sensory scores, which accorded with the results from E-nose detection, which revealed significant enhancements in specific sensor signals. This suggested a correlation between sensory evaluations and changes in volatile compounds[2]. This study innovatively added brown sugar to the fermentation mix, potentially moderating the astringent flavor of Aronia melanocarpa juice and improving its sensory qualities. A noted reduction in acidity of the fermented juice enhanced sensory attributes, as high acidity might diminish sensory acceptability.
Responses of the electric nose sensors of Aronia melanocarpa juice demonstrated an abundance of alcohols, aldehydes, and ketones, matching with previous research[15]. The observed variability in the levels of alcohols, aldehydes, and ketones may be attributed to dynamic shifts during the fermentation process. For instance, earlier studies noted high levels of alcohol compounds in fermented Aronia melanocarpa juice[15]. However, a decrease in aldehydes and ketones was reported during Lactobacillus fermentation of pears[39].
Correlation analyses between E-nose sensors and flavor attributes of Aronia melanocarpa juice demonstrated that sulfides and nitrogen oxides negatively correlated with the aroma index, as the volatile sulfur compounds can either enhance or diminish flavor characteristics in a variety of foods[40].
Dynamic correlation analyses further elucidated the connections between quality indices and sensory properties. A pronounced negative correlation between aroma and acidity observed at 48 h may stem from the production of flavor substances such as organic acids and aroma compounds by the bacteria[41]. In the 96-h samples, TSC demonstrated a positive correlation with acidity and sweetness scores, suggesting that the presence of sugar may neutralize the excessive sourness of unprocessed Aronia melanocarpa, improving the sour-sweet balance. The negative correlations between overall acceptance and total phenolic content could be attributed to the astringent properties of high phenolic concentrations[42]. Interestingly, the study noted a positive relationship between color indices (L* and a*) and overall sensory acceptability, indicating that visual attributes substantially impact consumer perceptions.
-
This study evaluated the effects of fermentation with Lactiplantibacillus plantarum 1243 and Lacticaseibacillus paracasei 139 on the physicochemical properties, antioxidant activity, and flavor characteristics of Aronia melanocarpa juice. The results revealed that the microbiological activity of the lactic acid bacteria strains remained stable for the first 24 h, with microbial counts reaching 7.03 lg CFU/mL. As the carbon and nitrogen sources in the juice were depleted, the viable microbial count gradually decreased, reaching 3.90 lg CFU/mL after 96 h. Lactic acid fermentation was found to decrease the overall acidity and total sugar content of the juice. The concentrations of phenolic and flavonoid compounds initially remained stable, followed by a gradual decline, whereas DPPH radical scavenging activity increased significantly in 48 h of fermentation, reaching a peak of 71.7%. Sensory evaluation and E-nose analysis revealed that fermentation with Lactiplantibacillus plantarum 1243 and Lacticaseibacillus paracasei 139 reduced undesirable flavors and astringency in the juice. Additionally, fermentation led to a significant increase in the levels of aromatic organic compounds, aliphatic aromatics, and methyl compounds, which enhanced the overall aroma and flavor profiles of the juice. In future research, the specific metabolites of lactic acid bacteria are expected to be quantified and analyzed with functional evaluations.
This work was supported by the Guangdong Province Key Area R&D Program Project (2022B0202050001), Guangdong Provincial Seed Industry Revitalization Special Program (2022-WPY-00-008), and the South China Agricultural University 2024 College Students' Innovation and Entrepreneurship Training Program (S202310564098).
-
The authors confirm contribution to the paper as follows: investigation: Chen R, Liu M, Wu J; methodology: Liu M, Wu J, Chen J; data curation: Chen R, Chen J; formal analysis: Liu M, Yang X; software: Fang Y; visualization: Fang Y, Dong S; supervision: Chen R; writing – original draft: Wu Y; writing – review and editing: Dong S; resources, validation: Fang Z; conceptualization: Fang X, Dong S, Yang X; project administration: Fang X, Dong S; funding acquisition: Fang X. All authors reviewed the results and approved the final version of the manuscript.
-
All data generated or analyzed in this study are included within this manuscript.
-
The authors declare that they have no conflict of interest.
- Supplementary Table S1 Detailed grading of sensory evaluation.
- Supplementary Table S2 Corresponding substances to the sensors.
- Copyright: © 2025 by the author(s). Published by Maximum Academic Press on behalf of China Agricultural University, Zhejiang University and Shenyang Agricultural University. This article is an open access article distributed under Creative Commons Attribution License (CC BY 4.0), visit https://creativecommons.org/licenses/by/4.0/.
-
About this article
Cite this article
Wu Y, Chen R, Liu M, Fang Y, Wu J, et al. 2025. The effects of Lactobacillus fermentation on the quality changes and flavor characteristics of Aronia melanocarpa juice using physicochemical analysis and electronic nose techniques. Food Innovation and Advances 4(1): 99−107 doi: 10.48130/fia-0025-0010 

Figure 1.
Microbial and physicochemical properties of Aronia melanocarpa juice with different fermenting times. (a) Viable cell counts, (b) TSC, (c) pH, (d) acidity. Means of different lowercase letters are significant differences (p < 0.05).