


-
Current trends in analytical monitoring include the miniaturization of equipment, the potential of in situ analysis, decrease in the amount of sample required and the reduction of organic components[1,2]. The development of new and miniaturized light sources in comparison with traditional light sources such as tungsten bulbs, has allowed the advance of inexpensive, miniaturized, and robust methods. An example of this is the LED, which has been coupled into portable microfluidic chips for fluorescent detection[3−5].
Digital image analysis (DIA) has been widely used in analytical chemistry due to its ease of operation, portability, speed and good analytical performance[5−7]. Briefly, an image or video of colorimetric or luminescent reactions is converted into measurable data that is correlated with analyte concentration.
One of the trends in analytical chemistry research is the development of user-friendly and universally accessible tools. Since the early 2000s, there has been a significant increase in the number of scientific publications employing scanners, digital cameras, webcams, and smartphones in chemical analysis methodologies. Despite their existence, there are few studies using digital microscopes to capture images[8]. Digital microscopes are image capture devices that can be connected directly to a computer or laptop. These devices allow the use of zoom for manual or automatic magnification of objects in an optical range of 50 to 1000x, which can be adjusted to different systems[9].
Quinine is one of the main compounds in tonic, a popular carbonated drink in which quinine is used as a flavoring, due to the fact that it gives it its characteristic bitter taste. However, since at high doses it can cause side effects, the American FDA has limited its concentration to a maximum of 83 ppm (approximately four thousandths of that used medically for different medical treatments).
Precisely because of its quinine content, tonic water provides some properties, such as: it is a digestive drink, inducing secretion and reflecting the salivary and gastric glands, it also exerts vascularization of the gastric mucosa.
On the other hand, it also became the main compound used in the medical treatment of malaria, until other much more effective synthetic drugs, such as primaquine, chloroquine or quinacrine, replaced it. Quinine is however still used in the treatment of resistant malaria.
In turn, it also provides other therapeutic benefits. For example, it is a recognized antipyretic, analgesic and antimalarial.
A digital image-based fluorimetric method, using a 3D printed platform and a UV-LED camera made of biodegradable polylactic acid (PLA), for quantification of quinine in beverages was proposed by da Silva et al.[10], presenting detection limits and quantification of 6.9 × 10⁻⁸ and 1.39 × 10⁻⁵ mol·L−1. A smartphone was used as a detector and the 3D camera was irradiated by four LEDs for excitation of the molecule, requiring a more robust system for cooling and system power.
This work presents the development of a fluorimetric system, based on the analysis of digital images, for the determination of quinine in commercial samples of tonic water; using a digital microscope as an image capture device and a monochromatic LED as a radiation source.
-
Analytical grade reagents and doubly deionized water (DDI water, resistivity 18.2 MΩ) from a Milli-Q system (Millipore, Bedford, MA, USA) were used to prepare the solutions. An intermediate solution of 100 mg·L−1 of quinine was prepared by dissolving extra pure quinine sulfate dihydrate, C2OH24N2O2·2H2O (Scharlau, Spain) in sulfuric acid, H2SO4 (Scharlau, Spain) 0.05 mol·L−1 and analytical standards at concentrations of 2, 4, 6, 8 and 10 mg·L−1 were used in the construction of the analytical curve.
Fluorimetric system
-
The proposed fluorimetric system consists of a device, printed with a 3D FormLabs2 stereolithographic printer, to accommodate the capture device, a cuvette and a radiation source, which is powered by the USB ports of a computer, using an adjustable voltage source.
The electrical circuit shown in Fig. 1 was used to create the voltage source. When connected to the computer, allows control of the intensity of the radiation source. The switch may be used to turn off the light of the LED in order to obtain the dark current of the detector.
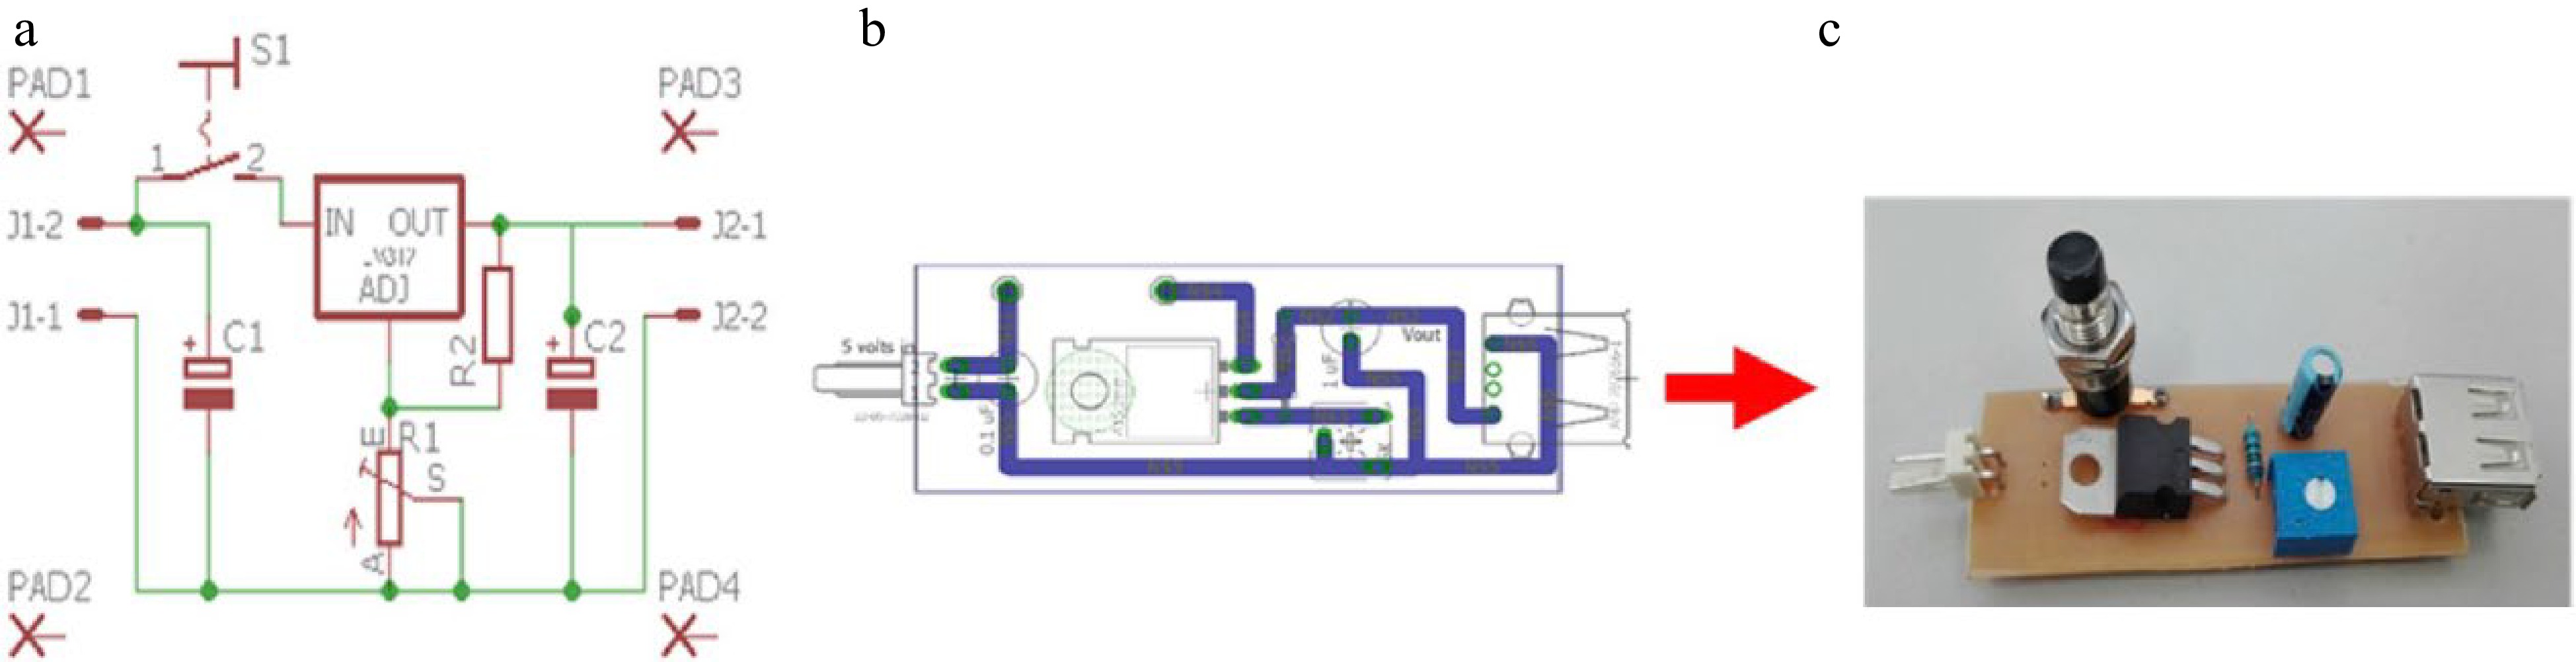
Figure 1.
Fluorimetric system adjustable voltage source. (a) Schematic figure created with the Eagle program. (b) Board figure created with Eagle. (c) Photo of the electronic device.
The design of the 3D device is shown in Fig. 2, and is used to support the digital microscope, the photometric cell and the light source was elaborated with the aid of the Rhinoceros 5 program. The LED was positioned perpendicular to the detector, i.e., as a source of radiation, aiming to excite the chemical compound under study, a 5 mm LED was used, with a wavelength of 346 nm.
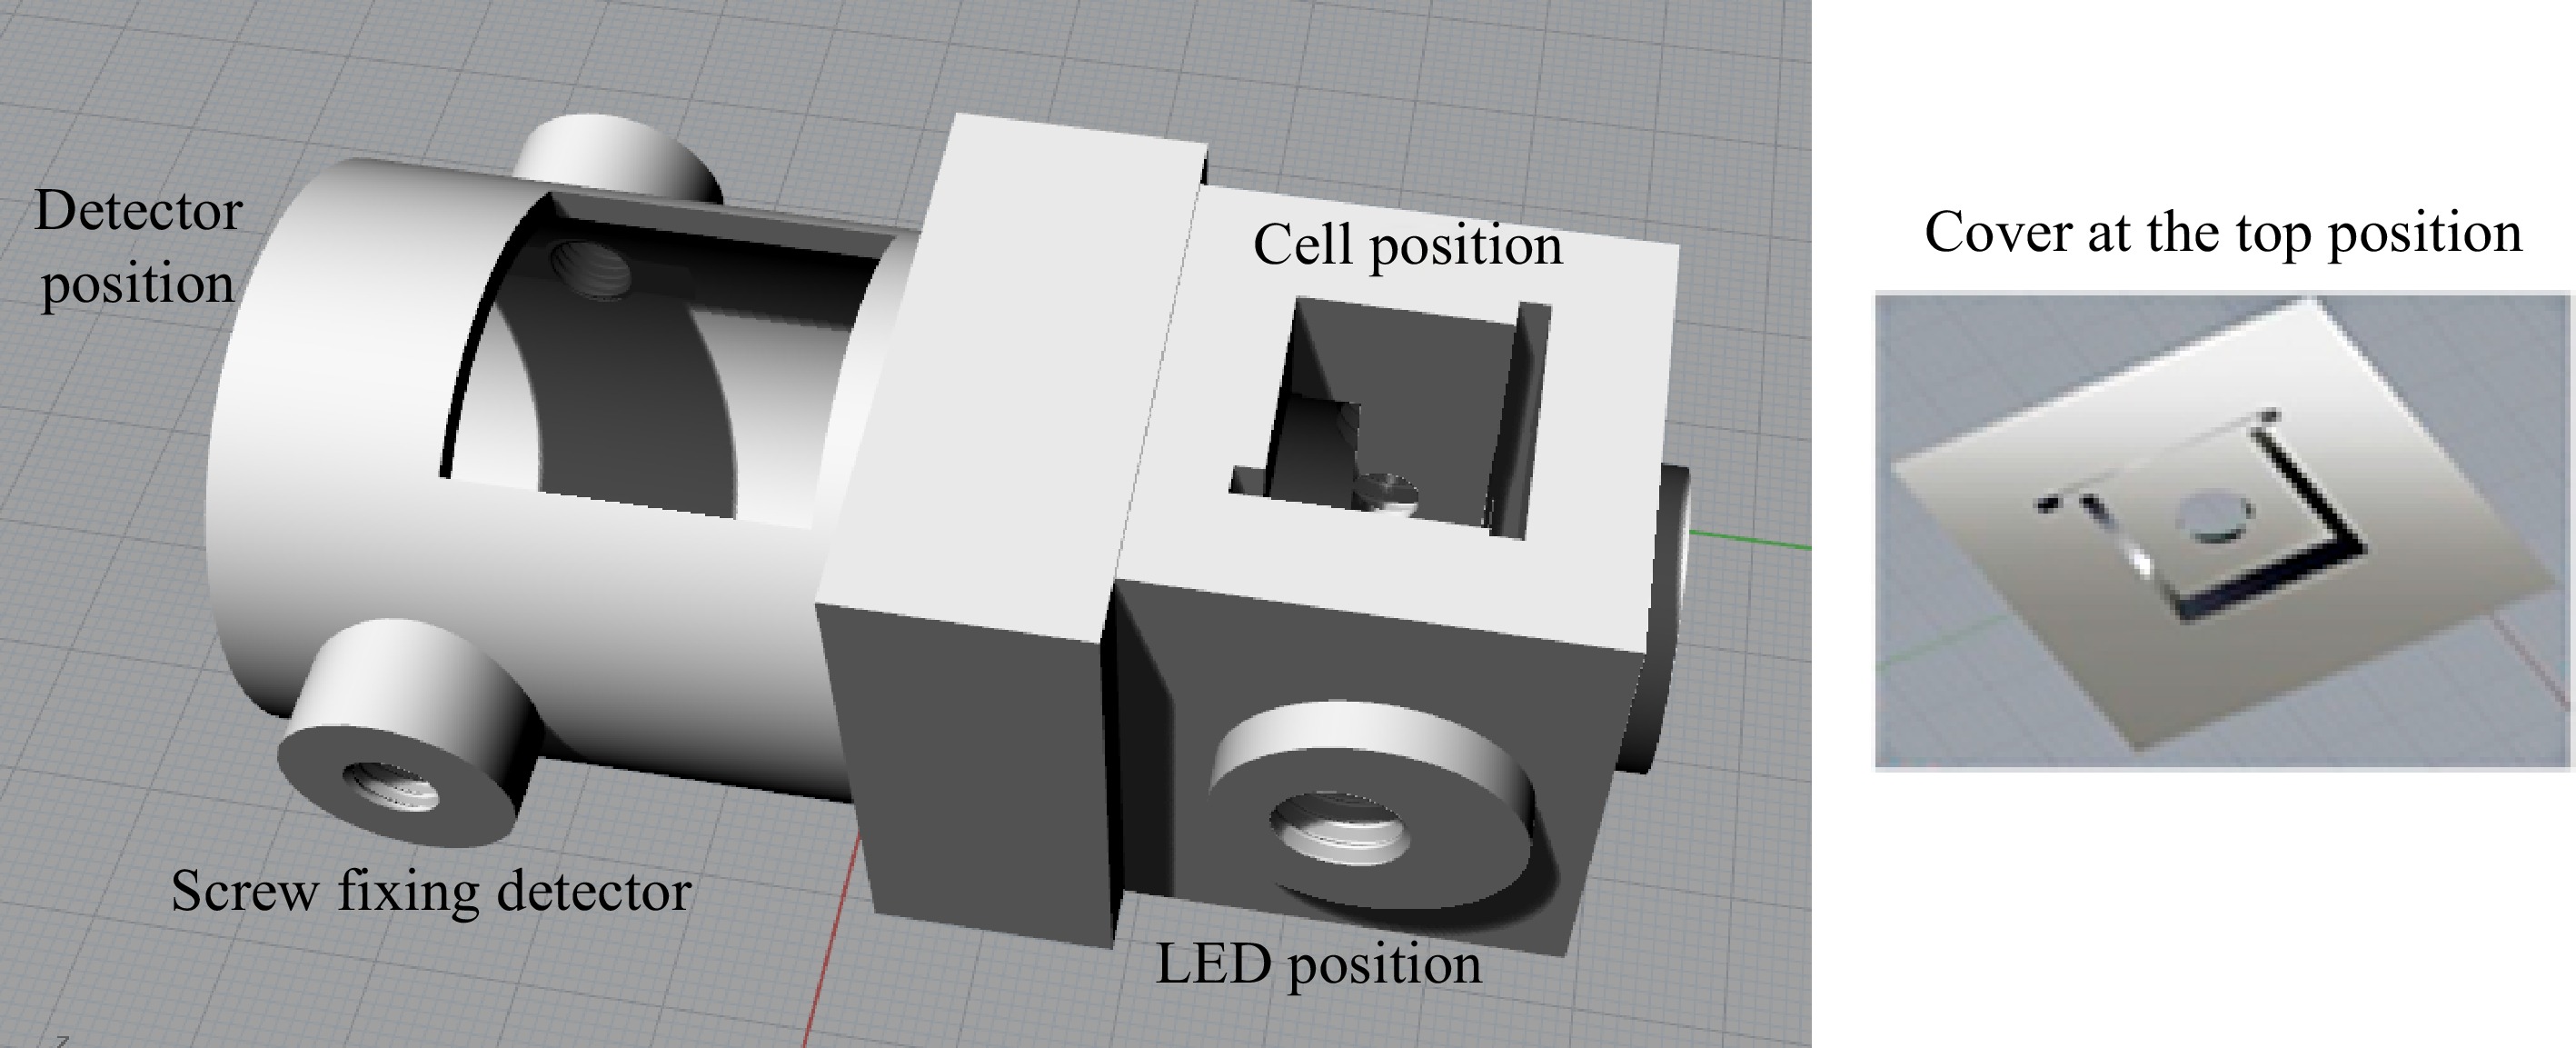
Figure 2.
Design of the 3D device using the fluorimetric system, elaborated with the aid of the Rhinoceros 5 program.
A photograph of the 3D device is shown in Fig. 3, showing that a digital microscope, Knup KP-8012, was used to capture the images.
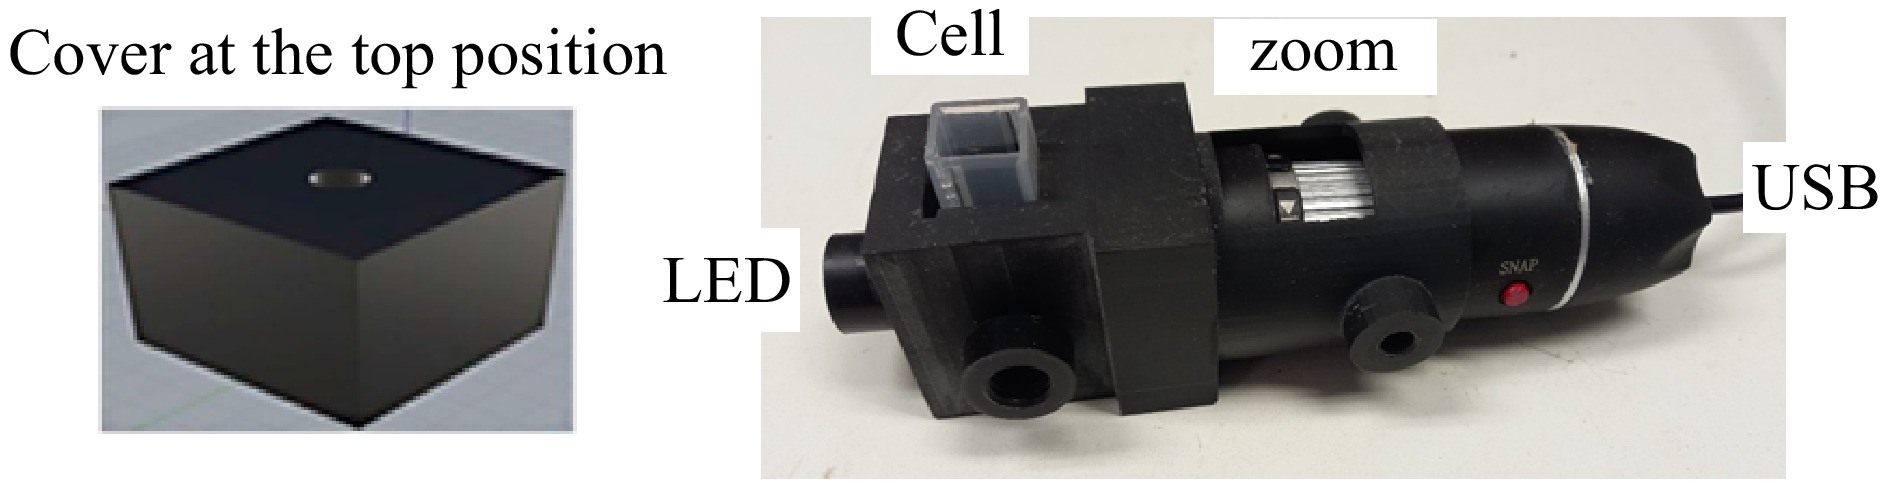
Figure 3.
Photograph of the 3D fluorimetric system.
Acquisition and processing of images
-
In the acquisition stage, with the help of YouCam software, the images were filed in JPEG format and processed with Chemostat software (version: V2 030918.d3e5d19)[11]; ROI on center pixel, size 100 × 100, coordinates x-230 and y-180.
In possession of color data from the RGB space, the analytical signal was calculated from the intensities of the B (blue) channel and the vector norm processing was analyzed.
Validation and application of the system
-
The proposed system was employed for the determination of quinine in tonic water samples commercially available in the city of Palma de Mallorca, Balearic Islands, Spain. Because it is a carbonated drink, the samples were subjected to agitation to eliminate the carbon dioxide present in the composition. Then, the samples were diluted 10 times, with a 0.05 mol·L−1 sulfuric acid solution and the readings were performed.
-
In dilute H2SO4 solutions, quinine sulfate is present as a di-cationic species, which is quite stable and whose molecular structure is shown in Fig. 4. Thus, blank, analytical standards and samples were prepared in solutions of H2SO4 0.05 mol·L−1.
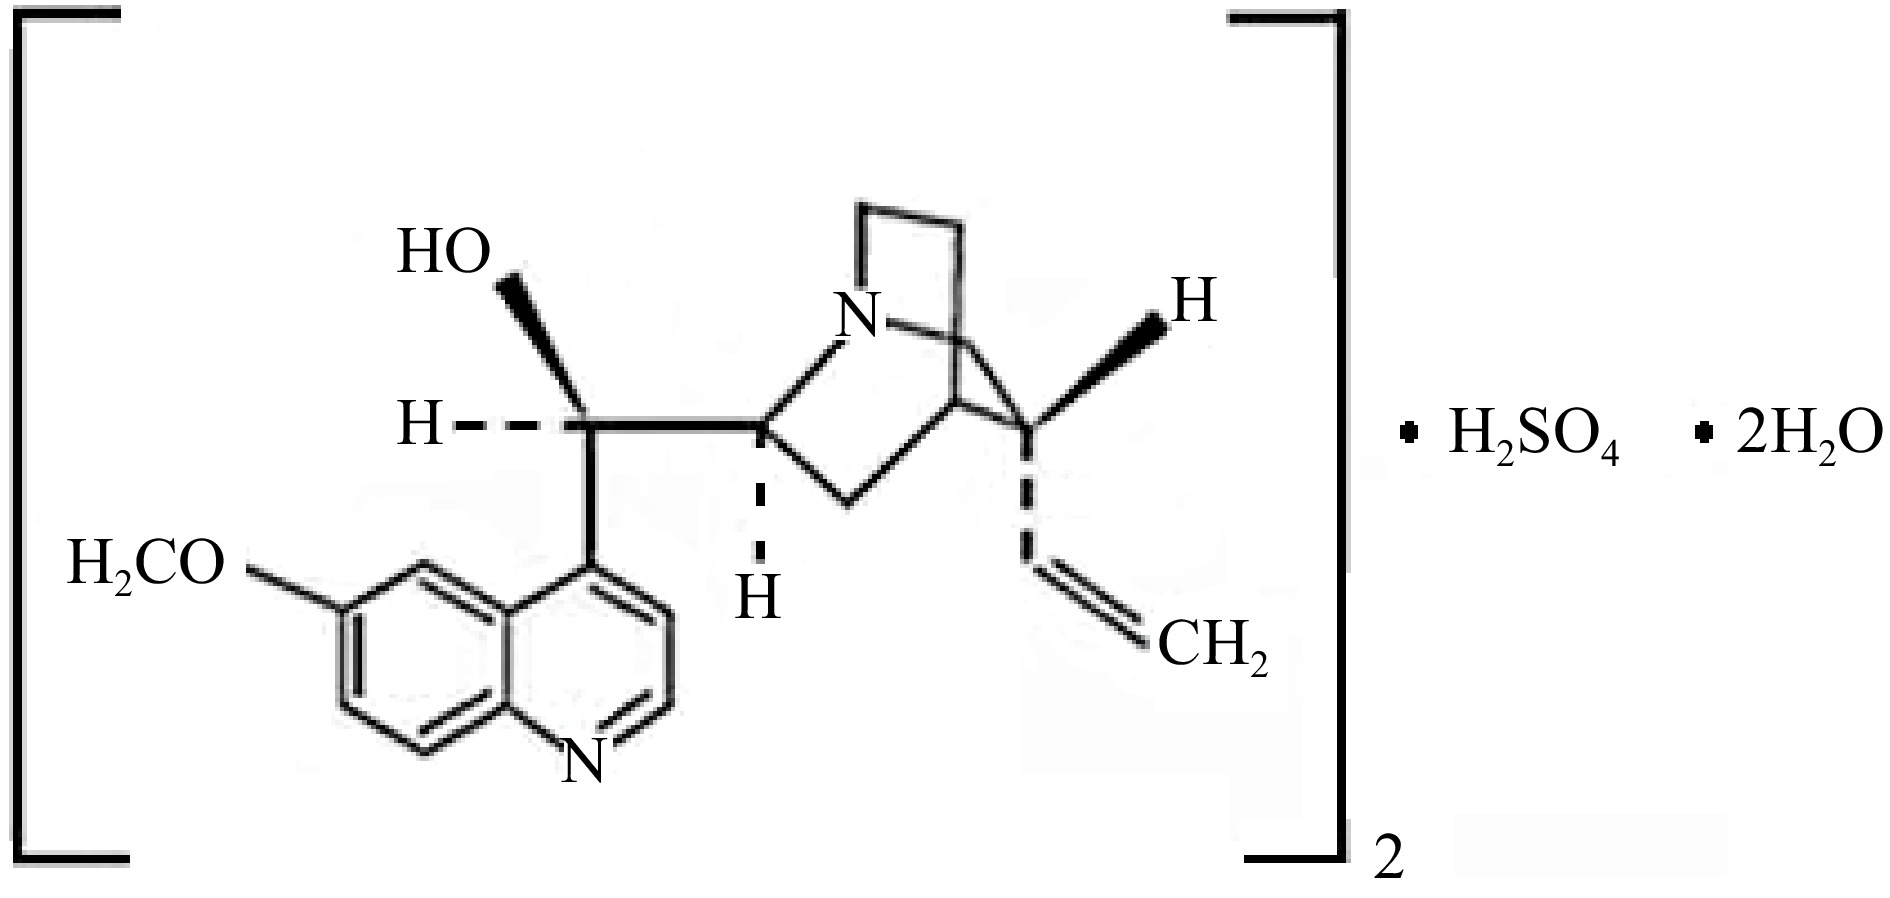
Figure 4.
Structure of quinine sulfate in diluted H2SO4 solutions.
Observing the spectra, obtained with a Perkin Elmer LS-50B luminescence spectrometer, it was noted that the maximum intensity of absorption and emission occurs at wavelengths of 347 and 452 nm, respectively (Fig. 5). In the proposed fluorimetric system, a conventional 5 mm LED was used as the source of radiation/excitation with a wavelength of approximately 346 nm.
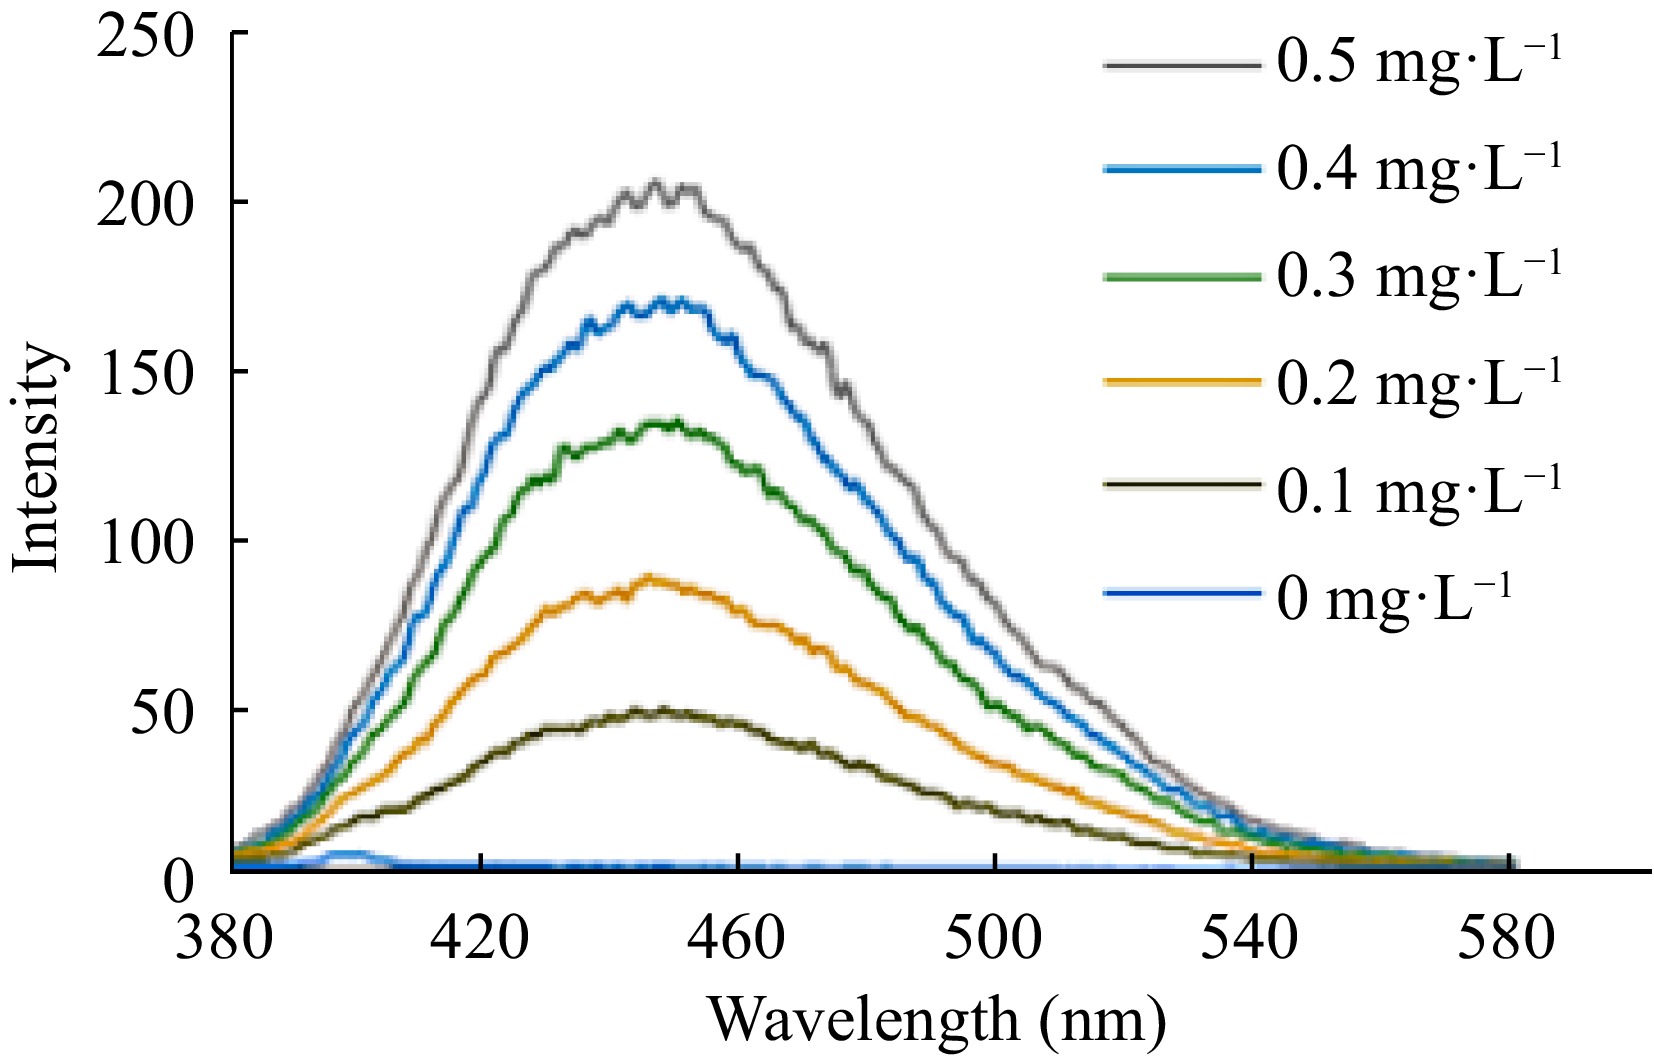
Figure 5.
Emission spectra of quinine.
LEDs, whose suitability was investigated and validated, have interesting characteristics for application in portable fluorimetric systems, such as, for example, emission of monochromatic light, popularity, low cost and availability of colors.
Smartphones, webcam and scanners are devices commonly used in digital image analysis[12−15]; although it exists, there is a limited number of studies that use a portable microscope for image capture[8,9]. The application of a USB microscope in the proposed fluorimetric system, presented satisfactory results, producing a better focusing of the image.
Two factors were analyzed in order to apply the system: 1) The intensity of the radiation source; minimum and maximum; and 2) the use of a cover in the cuvette compartment to control the internal lighting. After analyzing the curves and analytical parameters presented, the conditions of maximum intensity of the radiation source and the use of a lid, printed in 3D, on the upper part of the cuvette holder were selected. Therefore, the procedure was quite simple: the sample and standards were place in the cuvette, which was then covered with the cover holding the LED, and a photo was taken.
With the conditions defined, the images of white and pattern analytical data were obtained, as shown in Fig. 6.
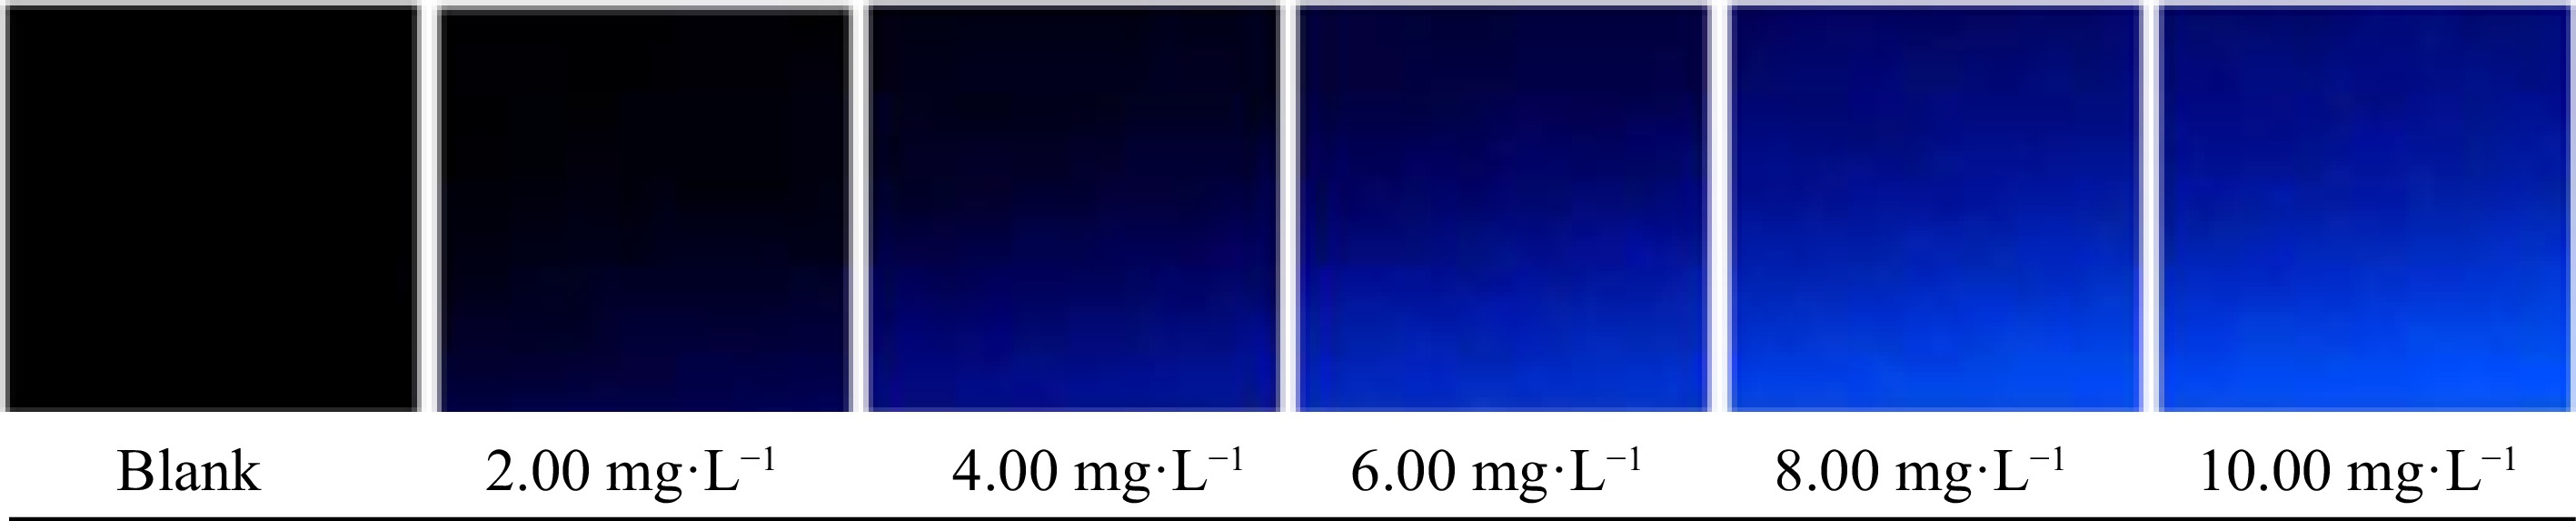
Figure 6.
Digital images of the blank and analytical standards.
Mathematical processing of RGB space color data
-
After obtaining the intensities of the RGB channels, considering that the phenomenon of fluorescence is related to the emission of radiation and that quinine, in a diluted acid solution, presents a maximum intensity of emission at a wavelength of 452 nm, corresponding to the blue color in the CEI chromaticity diagram, the B channel intensities showed better correlation with the concentration variation as can be seen in Table 1. da Silva et al.[10], in their quinine quantification study in beverages, also observed that the B channel had the highest fluorescence intensity and was used in the determinations
Table 1. Mean RGB intensities for blanks and analytical standards in triplicate.
Quinine/H2SO4 0.05 mol L−1
(mg L−1)R G B 0 (Blank) 0 0 0 0 (Blank) 0 0 0 0 (Blank) 0 0 0 2 0.29 0.26 24.25 2 0.5 0.26 23.6 2 0.42 0.24 24.31 4 0.6 2.65 66.73 4 0.57 2.92 66.87 4 0.64 3.04 67.99 6 0.6 10.01 104.05 6 0.67 9.56 102.35 6 0.66 9.67 103.41 8 0.67 20.74 139.35 8 0.65 20.84 139.99 8 0.65 20.73 139.73 10 0.66 34.5 170.52 10 0.65 34.54 169.93 10 0.68 34.19 170.65 R: red; G: green; B: blue. Thus, the intensities of the blue channel were used in the construction of the analytical curve (Fig. 7). Seeking to verify the construction of the analytical signal, considering the contributions of the intensities of the R, G and B channels, the mathematical processing norm vector was evaluated.
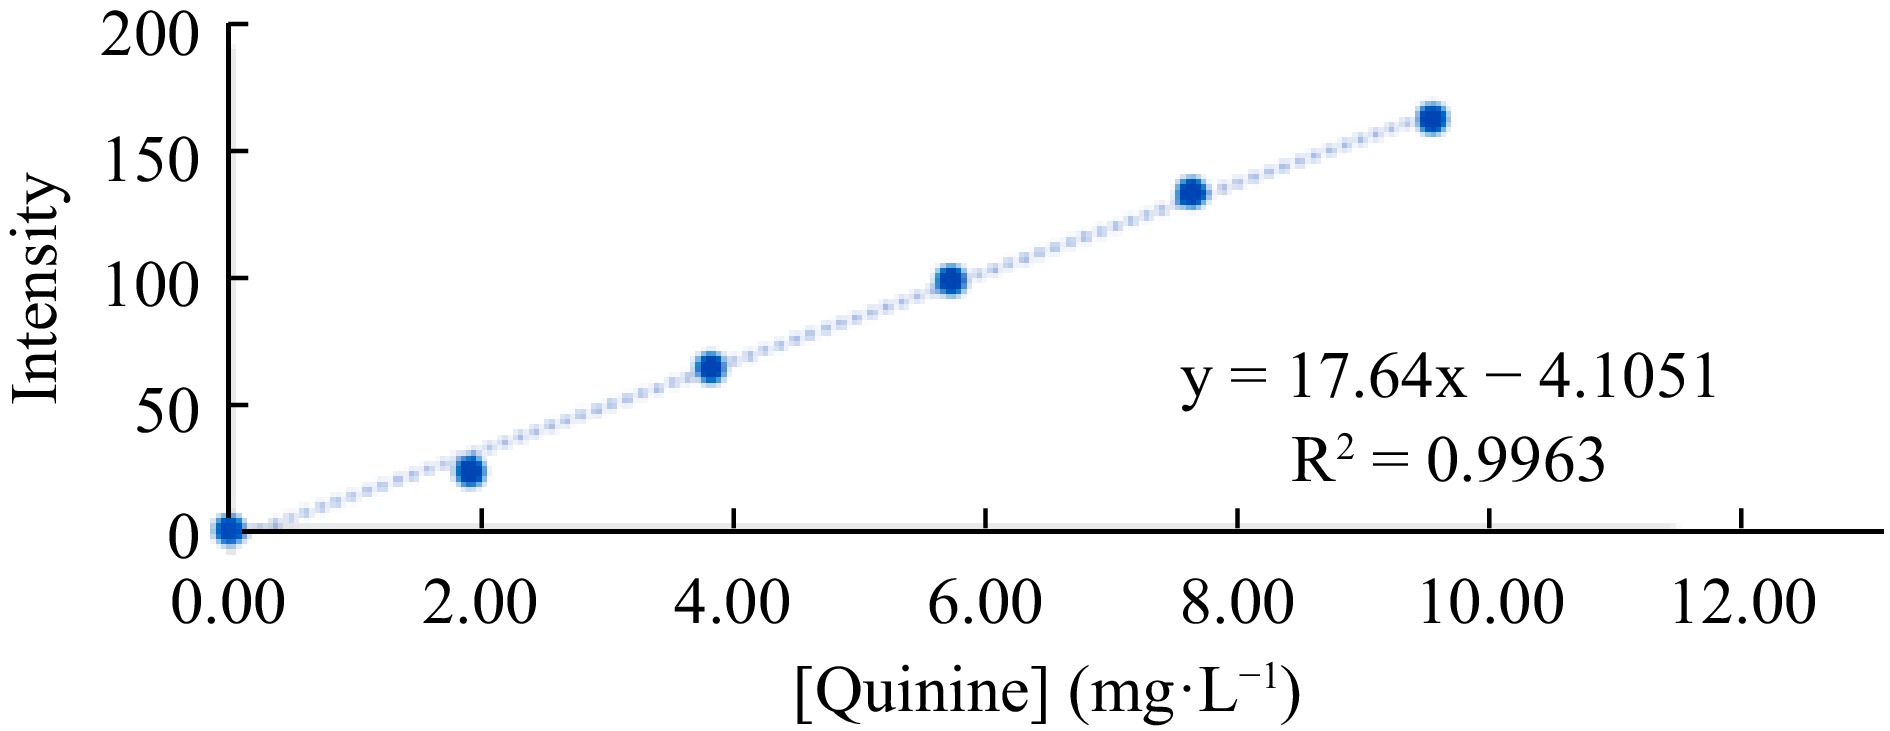
Figure 7.
Analytical curve for quinine determination, constructed from the blue channel intensity values.
It is possible to observe, in Fig. 8, that the vector norm mathematical processing presented a behavior similar to the use of channel B intensities, without mathematical processing. Featuring a greater slope of the analytical curve and sensitivity, in terms of detection and quantification limits, a standard processing vector was used in the application of the fluorimetric system.
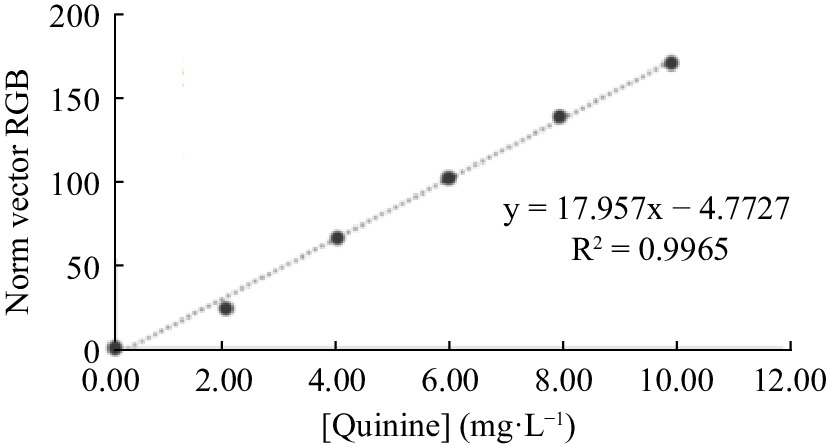
Figure 8.
Analytical curve for quinine determination, built from the mathematical processing standard vector of RGB intensities values.
Method validation
-
The analytical blank was included in the projection of the analytical curve and all curve concentrations were analyzed in triplicate, allowing a more robust regression and evaluation of curve linearity, among other analytical parameters. The adequacy of the fit of the analytical curve, constructed from the color data for the fluorimetric system for quinine determination, was confirmed by the correlation coefficient (R2) equal to 0.998.
Linearity
-
The R2 of the analytical curve is commonly used to evaluate the linearity of a method, based on the analysis of its proximity to the value 1. However, the R value must be associated with the linear relationship between the concentration and the signal; in the evaluation of linearity the experimental and critical F values must be analyzed.
Seeking to evaluate the linearity of the proposed method, the experimental F value, corresponding to the ratio between the residual variance and the pure squared error, given by Equation 1, and the tabulated critical F were compared.
$ \mathrm{F}_{\exp }=\left(\dfrac{s_{y / x}}{s_{y}}\right)^{2} $ (1) Since Sy/x is the residual standard deviation and Sy is the pure error, there are two statistical hypotheses: H0, called the null hypothesis, and the alternative hypothesis (H1). The null hypothesis must be rejected, at the α significance level studied, if Fexp exceeds the critical value at the α level, F (α, I - 2, I – L), where I is the number of calibration samples and L is the number of concentration levels.
Considered the best indicator of linearity, suitable for statistically verifying whether the residual variance is greater than the pure squared error, derived from the study of samples in triplicate, the test was applied in the linearity analysis of the proposed fluorimetric method. An experimental F value, 4449, was observed, much higher than the tabulated critical F, 4.45, resulting in the rejection of the null hypothesis, thus having linearity in the dynamic range of work analyzed, LQ at 10 mg·L−1.
Detection and qualification limits
-
The sensitivity of a method is commonly expressed in terms of the limits of detection (LD) and quantification (LQ). However, many works estimate the LD, minimum detectable quantities, applying the old IUPAC definition, based on the concentration of the analyte that gives a signal at least three times greater than the standard deviation of the blank signal, considering the slope of the curve analytics.
In general terms, the most recent IUPAC recommendation defines the LD as a concentration level for which the risk of false negatives, also called β errors or Type II errors, has an associated β probability, as shown by Equation 2.
$ \mathrm{LD}=t(\alpha, v) \sigma_{c, 0}+t(\beta, v) \sigma_{c, L D}=\dfrac{3,3 S_{ x / y}}{A} \sqrt{1+h_{0}+\frac{1}{I}} $ (2) Where, t(α,v)σc,0 + t(β,v)σc,LD are Student coefficients with v degrees of freedom and probability α and β, respectively, σc,0 and σc,LD are the concentration standard errors for blank and LD levels; A is the slope of the calibration curve, I is the number of calibration samples and Sy/x is the residual standard deviation. h0 can be obtained by assuming σc,0 = σc,LD, 95% confidence level (α = β = 0.05) and a large number of degrees of freedom. The same concept is applied in the calculation of LQ.
The old definition significantly underestimates the values of LD and LQ, and the current recommendation often results in higher values. The proposed method presented detection and quantification limits of 0.99 and 1.46 mg·L−1, at a 95% confidence interval, with data obtained from vector norm mathematical processing.
Precision
-
Precision provides the dispersion of measured values around a mean value, and its numerical value is estimated by the relative standard deviation (RSD), expressed in Equation 3, where s is the standard deviation and
$\overline x $ $ DRP=\dfrac{100S}{\overline{X}} $ (3) Precision was evaluated in terms of repeatability performing nine determinations on samples containing a concentration equivalent to the average concentration of the analytical curve, DPR values of 1.15% and 1.13% were obtained, as shown in Table 2.
Table 2. Accuracy of the method verified in terms of DRP%.
Sample Repetitions (mg·L−1) DRP% Sample F 4.82 4.73 4.8 4.91 4.86 4.8 4.88 4.87 4.88 1.15 Sample G 5.49 5.54 5.39 5.54 5.39 5.46 5.5 5.56 5.52 1.13 Accuracy
-
Accuracy reflects the proximity between the measured value (xi) and a reference value considered true (Xv) and is related to the absolute error of a measurement. Accuracy was verified by comparing the results obtained from the proposed method, based on digital image analysis, with the results obtained from a PerkinElmer LS-50B luminescence spectrometer, wavelength of 346 nm, as shown in Table 3.
Table 3. Accuracy of the proposed method.
Sample Proposed method
(mg/100 g)Luminescence PerkinElmer
LS-50B (452 nm) (mg/100 g)A 55.0 ± 0.19 55.1 ± 0.01 B 64.3 ± 0.02 64.2 ± 0.02 C 47.8 ± 0.22 47.9 ± 0.02 It was observed that there is no significant difference between the values measured with the proposed method and the values of the reference method.
Application
-
The proposed method was applied in the determination of quinine in seven samples of tonic water, as shown in Table 4, and contents from 47.8 to 66.7 mg·L−1 were calculated.
Table 4. Quinine contents in commercial samples of tonic water, obtained in the application of the proposed method.
Sample [Quinine] ± SD (mg·L−1) A 54.68 ± 0.29 B 64.82 ± 0.24 C 66.72 ± 0.23 D 49.38 ± 0.38 E 63.66 ± 0.25 F 48.20 ± 0.40 G 47.77 ± 0.43 Decree No. 6871, of June 4, 2009, which regulates Law No. 8918 (July 1994), which provides for standardization, classification, registration, inspection, production and supervision of beverages, establishes in Art. 25 that 'Quinine tonic water is a soft drink that contains, obligatorily, three to seven milligrams of quinine or its salts, expressed in anhydrous quinine, per one hundred milliliters of beverage'. Thus, the calculated concentrations of the studied samples are within the standard established by current legislation.
-
The fluorimetric system showed satisfactory performance for the determination of quinine in commercial samples of tonic water. A system presents possibilities for improvement, observing the calculated merit figures, from detailed studies of factors that influence the system; such as the focus magnification range of the digital microscope and the electric power supply current for the LED.
The proposed method presents higher detection and quantification limits than those presented by da Silva et al.[10], 6.9 × 10⁻⁸ and 1.39 × 10⁻⁵ mol·L−1, but stands out for its simplicity and greater range linear working dynamics. Considering the high levels of quinine in the samples of interest, the proposed method is an alternative to the reference method.
The authors acknowledge financial support from the Spanish Ministry of Economy and Competitiveness (MINECO) through Project CTQ-2016-77155-R co-financed by FEDER funds. Kaewta Danchana acknowledges the financial support from the Conselleria d'Innovacio, Recerca I Turisme of the Govern de les Illes Balears and of the Fons Social Europea (FPI/1867/2016). Brazilian authors thank the fellowship and support from the Brazilian agencies Conselho Nacional de Desenvolvimento Científico e Tecnológico (CNPq), Coordenação de Aperfeiçoamento de Pessoal de Nível Superior (CAPES) (Finance Code 001), and Fundação de Amparo à Pesquisa do Estado da Bahia (FAPESB).
-
The authors declare that they have no conflict of interest.
- Copyright: © 2024 by the author(s). Published by Maximum Academic Press on behalf of Nanjing Agricultural University. This article is an open access article distributed under Creative Commons Attribution License (CC BY 4.0), visit https://creativecommons.org/licenses/by/4.0/.
-
About this article
Cite this article
de Souza CT, Danchana K, Ferreira SLC, Cerdà V. 2024. Fluorimetric determination of quinine using a portable system and digital image processing. Food Materials Research 4: e001 doi: 10.48130/fmr-0023-0036 

Fluorimetric determination of quinine using a portable system and digital image processing
- Received: 12 July 2023
- Revised: 21 August 2023
- Accepted: 28 August 2023
- Published online: 02 January 2024
Abstract: The development of a portable device created by 3D printing for fluorimetric measurements is an efficient tool for analytical applications in situ or in the laboratory presenting a wide field of applications in the environmental and food field. This device uses a light-emitting diode (LED) as a radiation source and a digital microscope as a detector. Digital images obtained by the interaction between the radiation source and the sample were analyzed with the help of the YouCam software, the images were filed in JPEG format and processed with the Chemostat software.The entire system is connected to a notebook, which serves as an LED and detector power supply without the need for any additional power source. The proposed device was used for the determination in situ of quinine in water and beverage samples, respectively. For the validation of the developed system, the results obtained were compared with a conventional spectrofluorometer with a t-test at a 95% confidence level. The proposed system provides satisfactory precision and accuracy values. The proposed method presented detection and quantification limits of 0.99 and 1.46 mg·L−1, at a 95% confidence interval.
-
Key words:
- Fluorimetric determination /
- Quinine /
- Portable system /
- Digital Imaging