


-
Packaging is a vital function in the modern food industry, as it protects, preserves, communicates, and markets the food products to the consumers[1,2]. Packaging materials have a long history and wooden boxes have been used as packaging containers and transportation appliances for a long time[2]. However, as the global demand for wood keeps rising, so does the price of solid wood, synthetic materials such as laminated veneer lumber (LVL) and other laminated timber materials have emerged as alternatives to traditional timber packaging. LVL is usually made from small-diameter logs through the processes of veneer cutting and drying, splicing, and gluing, assembling and hot pressing[3,4]. LVL not only has a higher utilization rate than other boards, but also has the natural characteristics of wood with the advantages of uniform engineering performance, high strength, good dimensional stability, and more to meet the standards required for timber structures in buildings, bridges, furniture, and other fields[5,6]. LVL can be classified into structural and non-structural types according to its application[7]. Compared with structural veneer laminated materials, non-structural veneer laminates are widely used in China for packaging[8]. However, the moisture content of lumber can often affect its quality negatively, causing cracks, swelling, warping, mold, surface protrusion or even shedding due to water absorption[9,10]. Moreover, problems related to dimensional stability and physical and mechanical properties can also occur[11,12].
The moisture migration of LVL affects its modulus of elasticity, bending strength, swelling rate, and decay resistance, it is important to understand the moisture behavior and distribution of LVL under different environmental conditions[13,14]. According to existing studies, moisture in wood generally exists in two forms: bound water, which is usually located in the cell wall; or free water, which is distributed in the inner cavity and other spaces[15]. The term ‘fiber saturation point’ refers to the condition when the cell wall is saturated with water and no free water exists[16−18]. Studies have shown that the physical properties of solid wood materials below the fiber saturation point are negatively correlated with the amount of bound water, while they have little relationship with the content of free water. LVL has a similar relationship between conventional solid wood and free water after being processed by adhesives, heat, water and compression during the manufacturing process. However, there are still some knowledge gaps regarding how different factors such as veneer species, adhesive type and amount, pressing temperature and pressure affect the moisture content and distribution of LVL. Furthermore, conventional heat-drying methods for wood moisture analysis are usually time-consuming, unable to analyze the phase and distribution of moisture, and often destructive to the wood[9,19,20]. Low-field nuclear magnetic resonance (LF-NMR) is a non-destructive, non-invasive detection technique developed in recent years, which allows the fast detection of free and bound water and their distribution in wood without damaging samples. Previous studies mainly investigated the changes of free and bound water of different wood materials under different drying conditions[21], the moisture signals above and below the fiber saturation point[22], the water absorption and drying process of wood with different hardness[23], the moisture content in specific areas of laminated wood[24], the effects of cold and heat treatments on wood properties[25]. However, most of the research results obtained by using NMR technology to study the water content and composition of wood raw materials are mostly focus on solid wood materials and there is very little research on synthetic panels.
LVL has many advantages over solid wood, such as uniform engineering performance, high strength, good dimensional stability, and high utilization rate. However, the moisture content of lumber can often affect its quality negatively, causing cracks, swelling, warping, mold, surface protrusion or even shedding due to water absorption. Moreover, problems related to dimensional stability and physical and mechanical properties can also occur. Therefore, it is important to understand the moisture behavior and distribution of LVL under different environmental conditions. The aim of this study is to investigate the moisture change pattern of packaging LVL during the process of water absorption and drying, and to provide theoretical basis and data support for the quality control of packaging laminates based on the analysis of LF-NMR technology.
-
As shown in Fig. 1, the LVL used in this research was cut into specimens of 40 mm × 40 mm × 35 mm, which were the dimensions required for the bending test. The specimens were dried in an oven at 103 °C for 24 h and weighed (M0) to obtain their initial mass. Then, the specimens were soaked in distilled water for different durations (0, 0.5, 1, 2, 3, 6, 12, 24, 48, and 96 h) at a constant soaking temperature of 20 °C. The top part of the specimen was kept 25 mm below the water’s surface to ensure uniform water penetration. Each specimen was taken out the water at different durations and their surface was wiped with paper towels to remove any excess water, then weighted (M1) and T2 relaxation times and MRI images were collected.
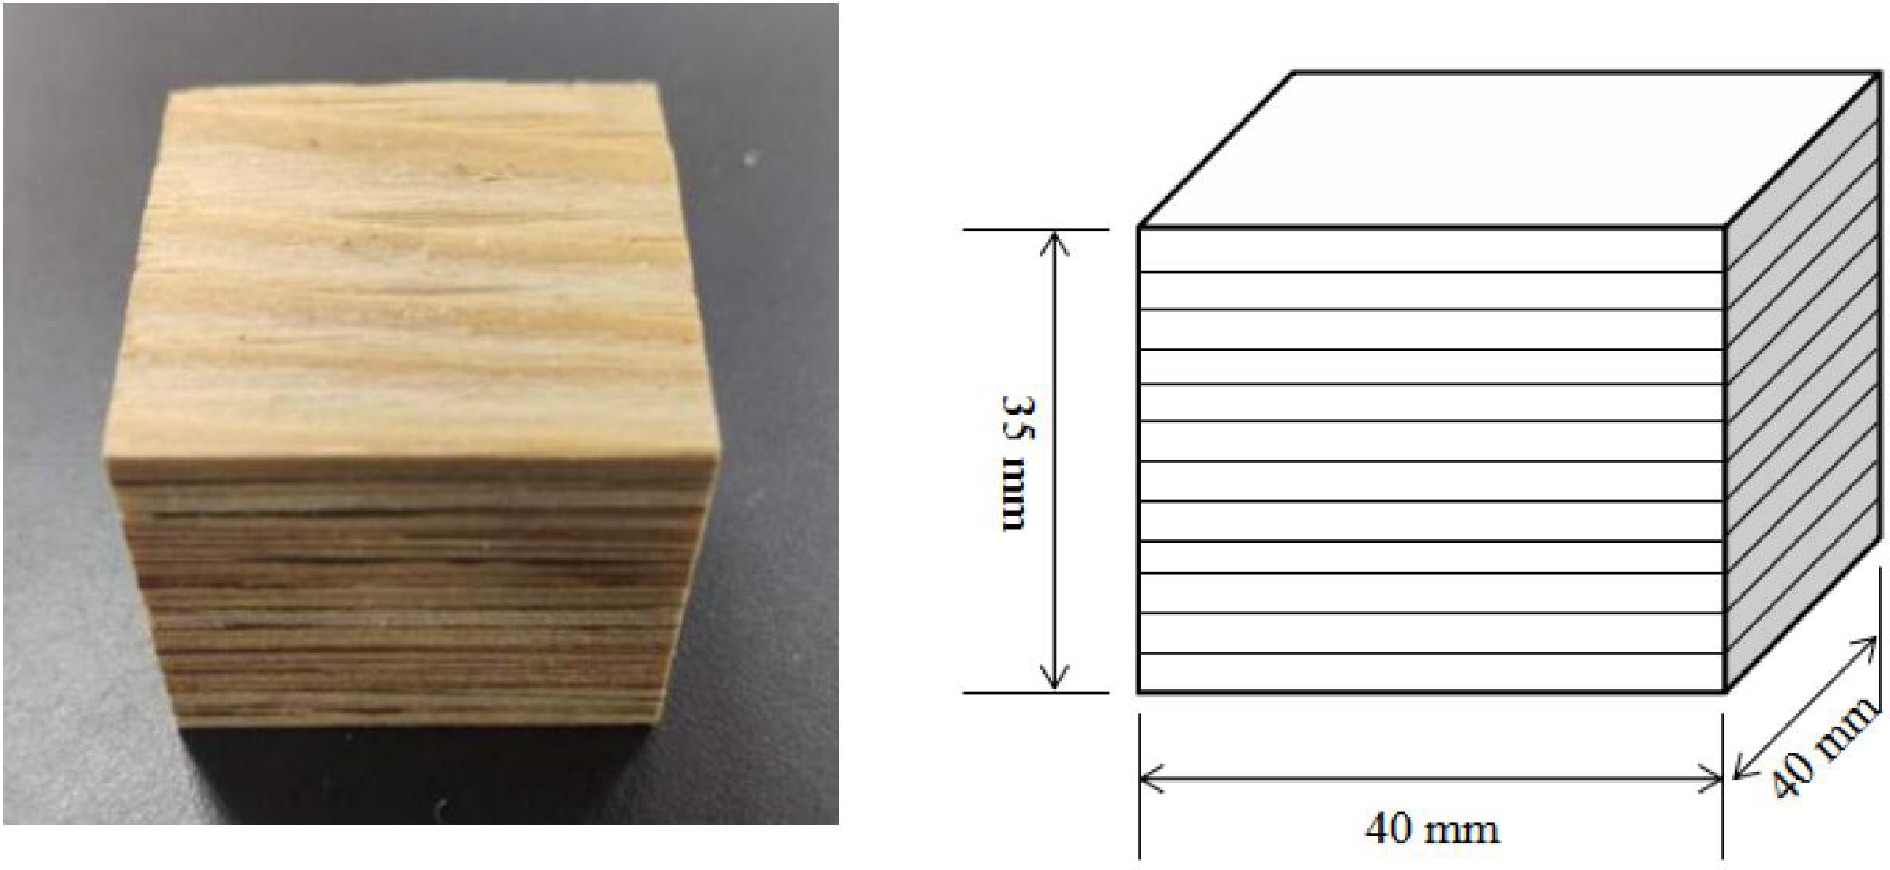
Figure 1.
Experimental laminated veneer lumber samples (40 mm × 40 mm × 35 mm). Left, physical picture; right, schematic diagram.
T2 relaxation analysis
-
T2 relaxation was performed by a LF-NMR Analyzer (MesoMR23-60H, Suzhou Niumag Analytical Instrument Co., Jiangsu, China), which has a permanent magnet of 0.5T and a diameter radio frequency of 60 mm, corresponding to a proton resonance frequency of 23.40 MHz at 32 ± 0.01 °C with 90° and 180° pulses of 19 μs and 38 μs. Samples at different durations were placed in a nuclear magnetic tube into the magnetic cavity of a low-field nuclear magnetic device with a magnetic field strength of 0.5T to acquire T2 relaxation information. Measurement conditions were the following: TW (time waiting) = 1800 ms, TE (time echo) = 0.25 ms, NECH (number of echoes) = 18,000, NS (number of scan) = 16. Experimental temperature and humidity were 23.5 °C and 29.1%.
MRI analysis
-
Magnetic resonance imaging (MRI) was performed with the same LF-NMR analyzer. Samples at different durations were placed in a nuclear magnetic tube into the magnetic cavity of a low-field nuclear magnetic device with a magnetic field strength of 0.5T to acquire the T2 weighted image was obtained. The main parameters were the following: slice width = 4 mm, slice gap = 1 mm, TR (time repetition) = 1,800 ms, TE (time echo) = 18.12 ms, average = 8, read size = 256, and phase size = 192. Image processing software was used to map and process the MRI image.
Sample drying
-
After absorption, samples were dried with hot air at ahigh temperature of 105 °C and a low temperature of 65 °C for 0.5, 1, 2, 4, 8, and 20 h. At each drying time point the sample was weighed to determine its moisture content based on the ISO 3130:1975 standard, and NMR T2 spectrum and NMR imaging were subsequently determined and tested as above. The tested parts were put in the oven, dried at 103 ± 2 °C for 6 h, then cooled in the dryer for 0.5 h, and weighed for the first time. Then, after drying at 103 °C for 1 h, the samples were taken out and cooled in a dryer for 0.5 h and weighed for a second time. This process was repeated until the difference between the two masses did not exceed 0.5%, that is, the constant weight.
Data processing
-
The relaxation time, peak area, peak area ratio, and other relaxation data were obtained by inverse fitting of the CPMG decay curve with the inverse software provided by the Suzhou Niumag NMR instrument system. The data showed in the paper was processed and displayed by its special software. Differences in T2 relaxation characteristics were analyzed by SAS 9.2, the analysis of variance was adopted by one-way ANOVA and Duncan's multiple comparisons. The results were expressed as mean ± standard deviation.
-
Figure 2 displays the mass changes in the samples during the process of moisture absorption. The average weight of the samples in the experimental group increased from 36.86 g to 53.54 g compared with the control set, which means that the experimental group absorbed more moisture than the control set. In the beginning of the absorption process, the sample weight changed rapidly, indicating a high rate of moisture absorption. This may be due to the large difference between the moisture content of the samples and the surrounding environment, which created a strong driving force for moisture migration. With the extension of time, although the moisture in samples continuously increased, the rate of absorption gradually decreased. This may be because the moisture content of the samples approached equilibrium with the environment, and the driving force for moisture migration became weaker[15]. After 48 h, the weight of samples was close to saturation, and no longer changed significantly (p < 0.05). This means that the samples reached a steady state of moisture absorption, and no further moisture exchange occurred between them and the environment[26].
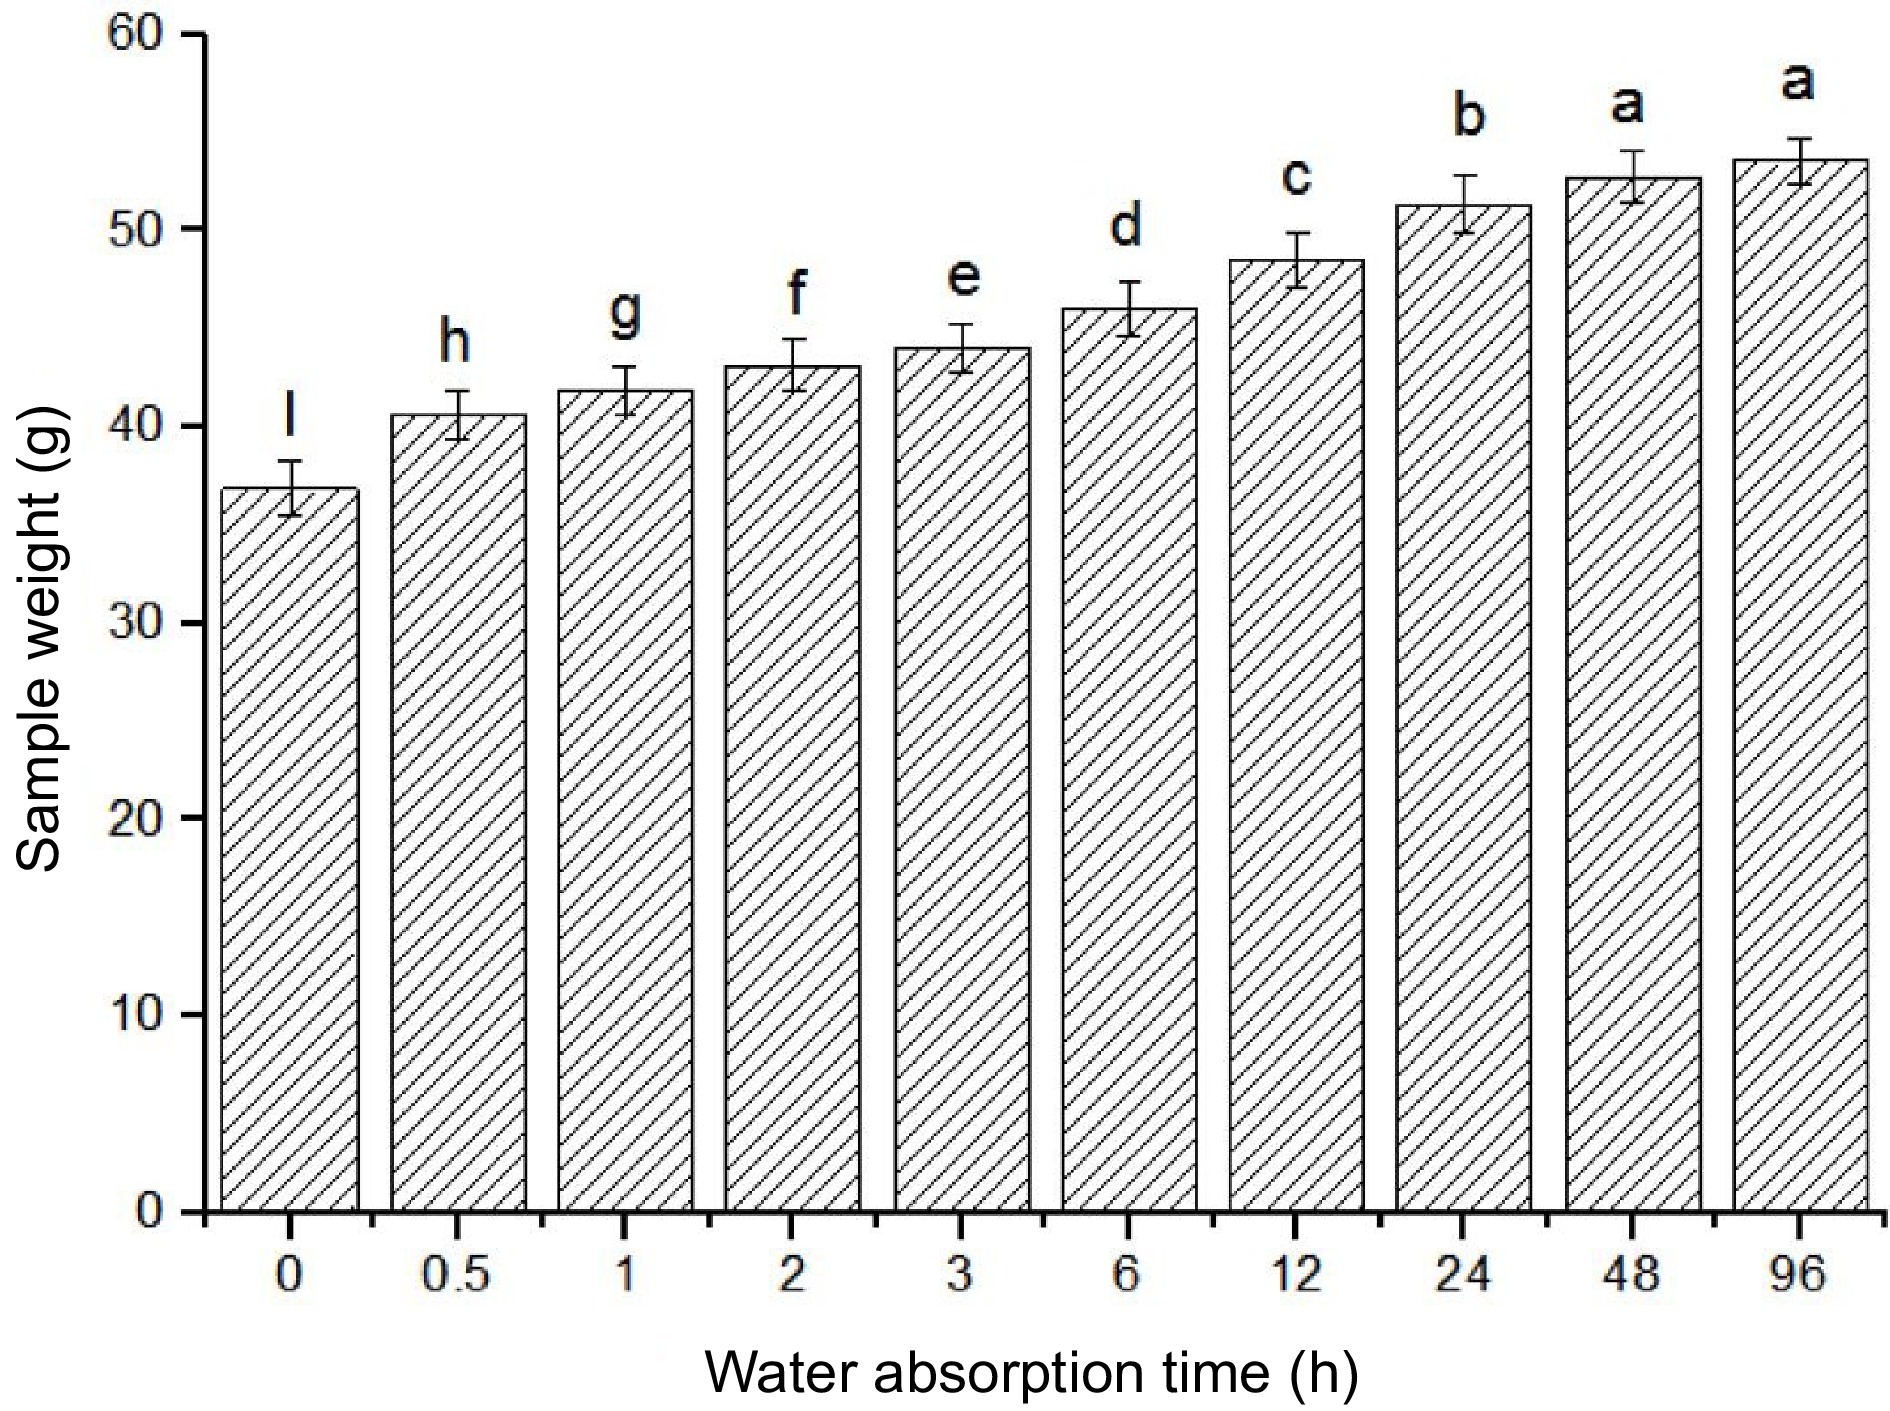
Figure 2.
Effect of water absorption time on sample weight. Note: Means with standard error are indicated, different letters represent significant differences (p < 0.05) in each treatment (n = 10).
Changes in moisture distribution in veneer laminated materials
-
The position of T2 spectrum indicates the binding capability of moisture to wood. The stronger the T2 signal intensity is, the more moisture is present in the sample, and the longer the relaxation time, the weakly bound to the wood which makes it easier to discharge[27]. Figure 3 shows the spectral changes of LVL in the process of moisture absorption. Two obvious relaxation peaks appear in the curve of each absorption time point, indicating that there are two different states of moisture in the wood. The area of the peaks represents the total signal intensity of moisture in each state, i.e. the relative hydrogen content in the wood[28]. As can be seen from Fig. 3, the first peak with a shorter relaxation time corresponds to the strongly bound moisture, which is mainly located in the cell wall and has a strong interaction with the wood matrix. The second peak with a longer relaxation time corresponds to the weakly bound moisture, which is mainly located in the cell lumen and has a weak interaction with the wood matrix. With the increase of absorption time, both peaks increase in area, indicating that both states of moisture increase in the wood. However, the increase rate of the second peak is faster than that of the first peak, indicating that the weakly bound moisture increases more rapidly than the strongly bound moisture. This may be because the weakly bound moisture has a higher mobility and diffusivity than the strongly bound moisture, and can easily fill up the available space in the wood[28].
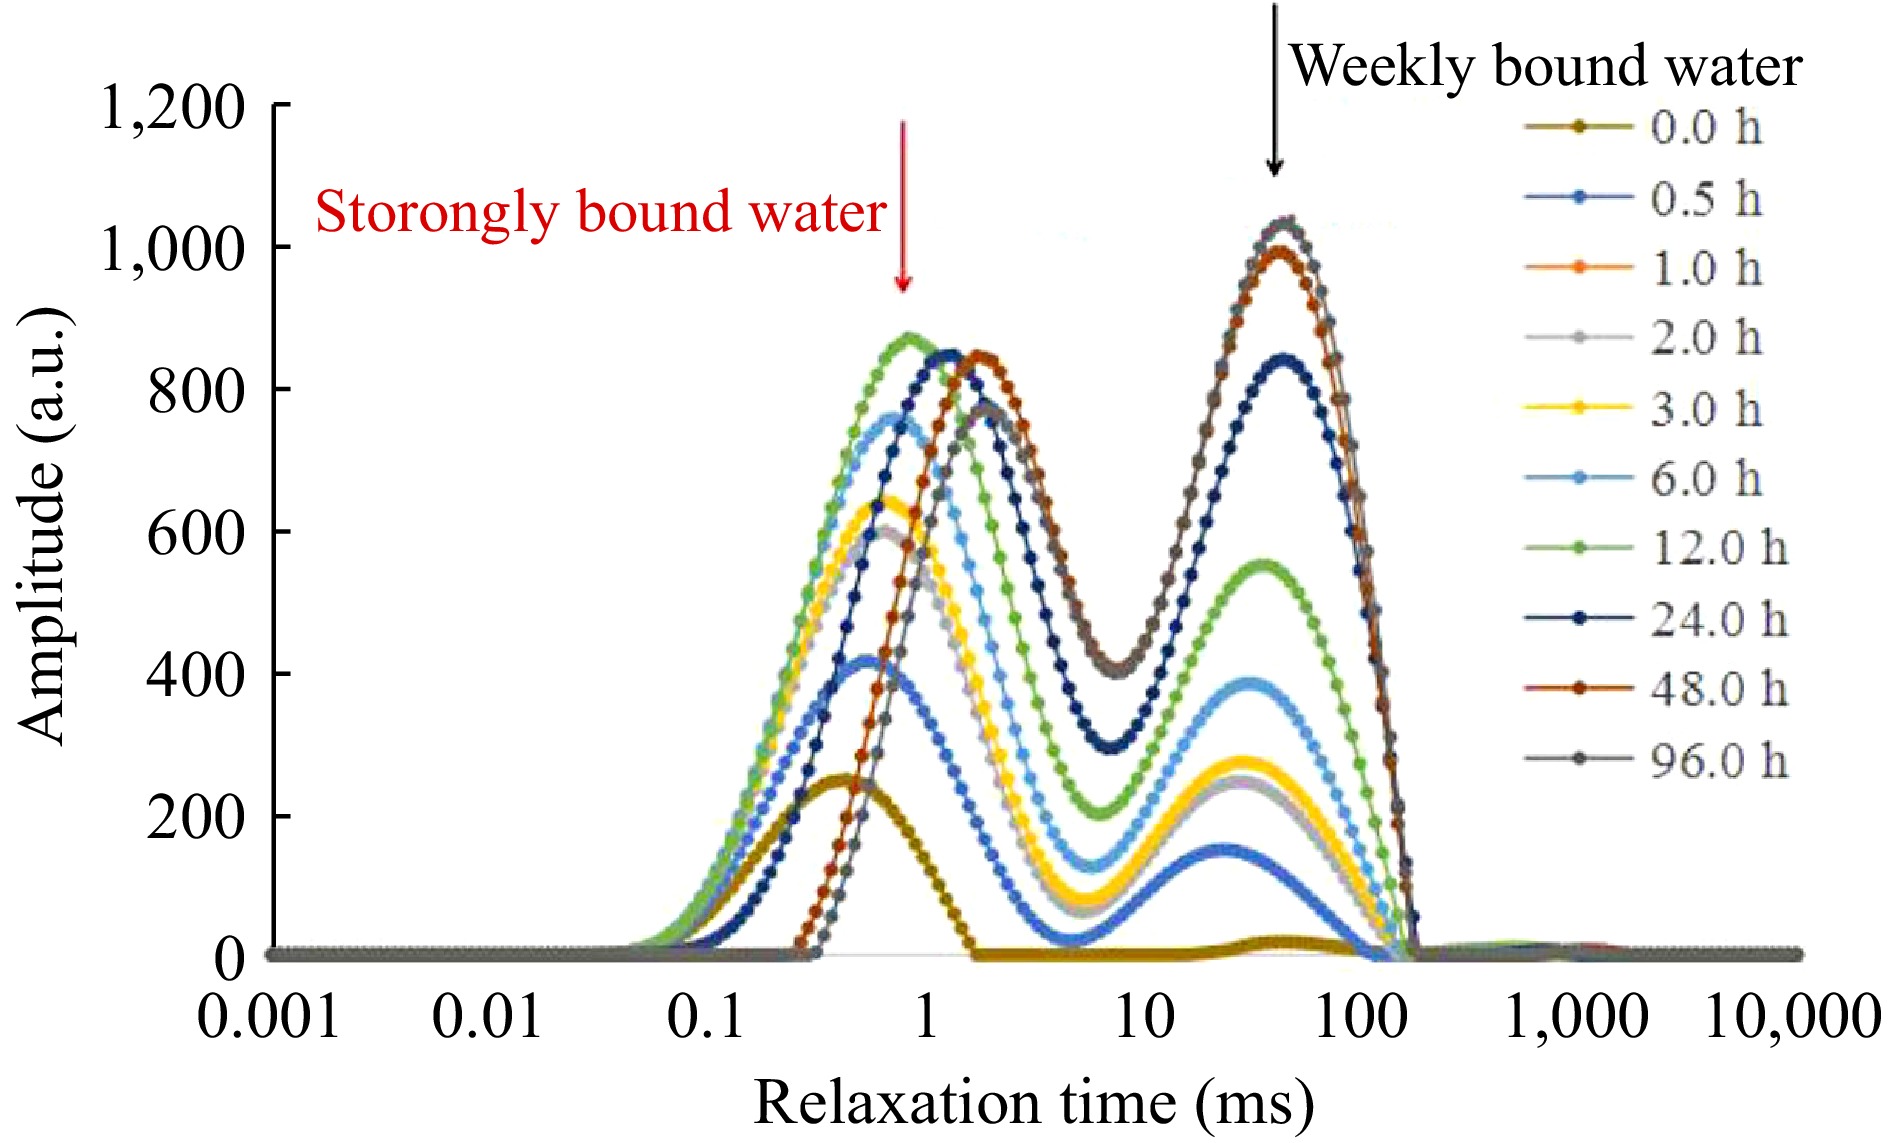
Figure 3.
Changes in T2 relaxation spectra during water absorption.
Moisture in wood is generally divided into three components: hydrated water, bound water, and free water[29,30]. Hydrated water is the most tightly bound to the wood and is the least abundant, decaying to zero within a few tens of microseconds; bound water is the second most tightly bound to the wood, with relaxation times of 10 ms; and free water is the freest, with relaxation times of 100 ms[31]. Therefore, the presence of water molecules in wood can be determined qualitatively according to the T2 value, while the size of the peak area reflects the amount of water in the sample. Figure 4a shows the transverse relaxation spectra of water molecules in LVL at different water absorption times. There are two obvious relaxation peaks in each spectrum, corresponding to the strongly bound water (T21) and the weakly bound water (T22), respectively. The analysis shows that both T21 and T22 increase significantly with the increase of water absorption time, indicating that the overall mobility of water molecules in the sample increases. This may be because more free space in the wood is occupied by water molecules, reducing their interaction with the wood matrix[32]. As the water absorption time continues to extend, the pores in the plate are gradually filled, and the water in the sample approaches the saturation state. At this point, the relaxation time no longer changes significantly, indicating that no further moisture exchange occurs between the sample and the environment[15].
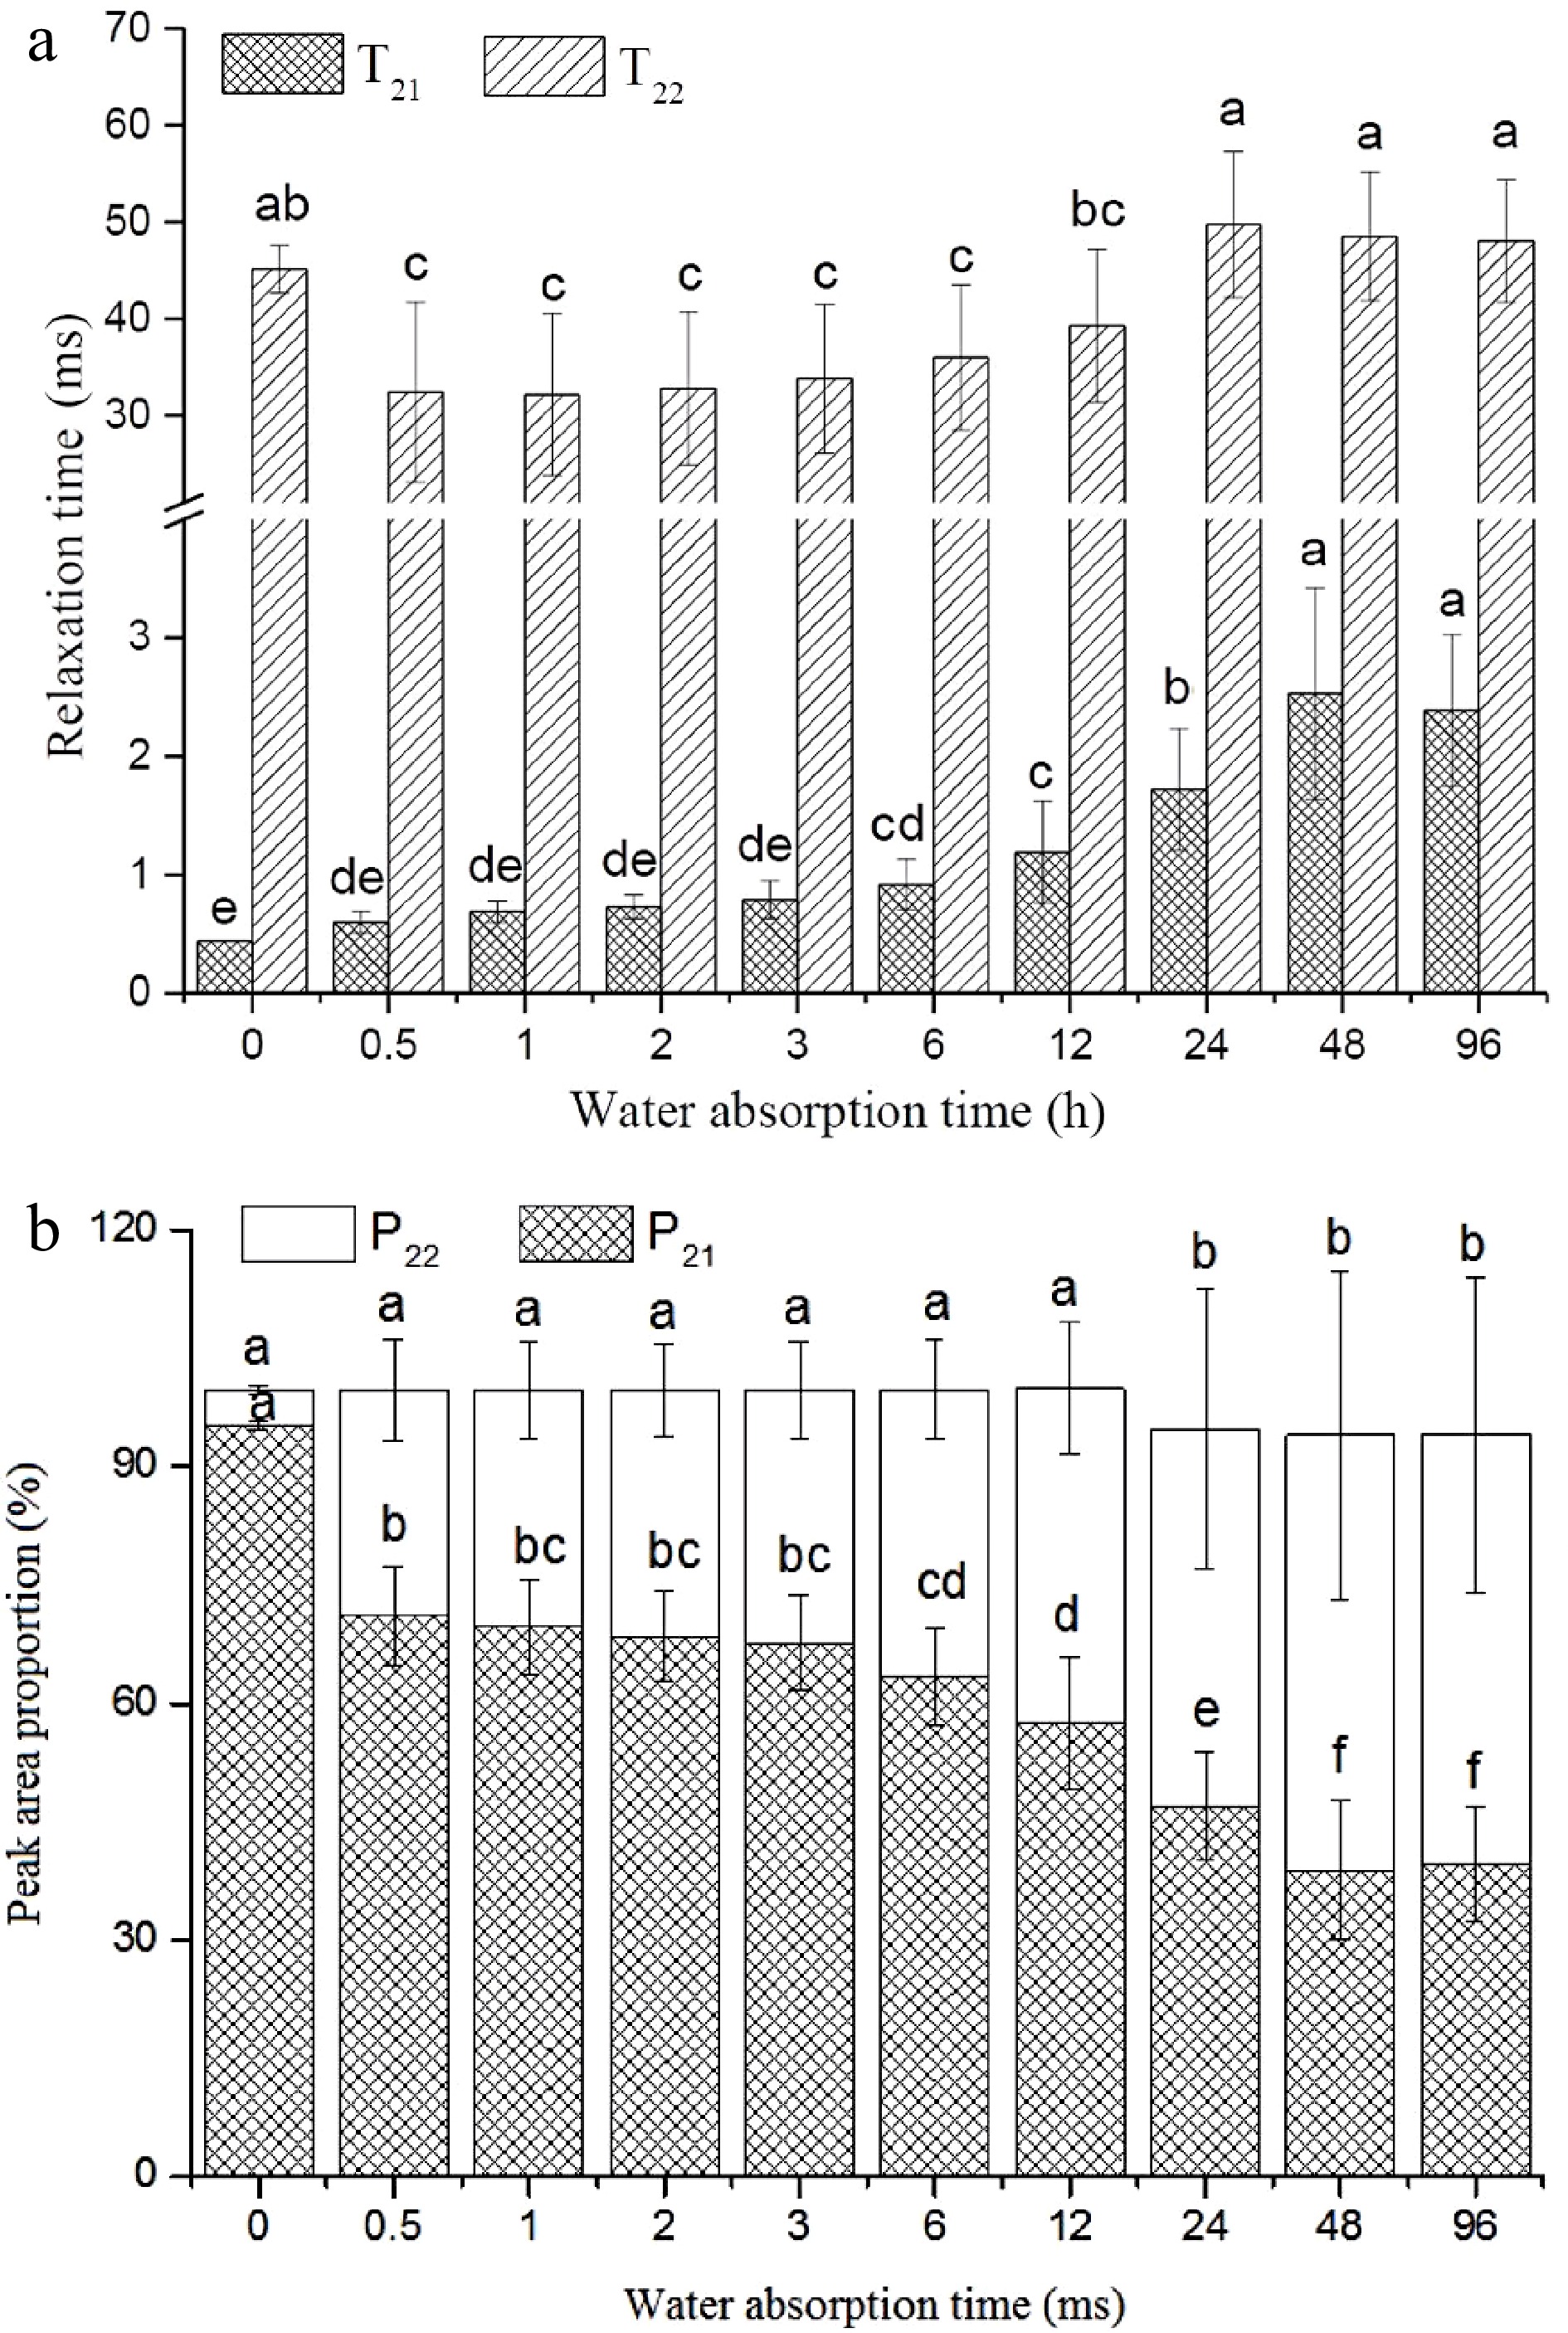
Figure 4.
Relaxation times and peak area ratios of water in laminated veneer lumber sample after water absorption. Note: Means with standard error are indicated, different letters represent significant differences (p < 0.05) in each treatment (n = 10).
The amount of peak area can be used to reflect the amount of moisture in the sample, and by establishing a relationship curve between water mass and signal quantity for the peak area of NMR[27,33], we were able to analyze the moisture content changes in the lumber during the treatment process. Further analysis of the peak areas and peak area ratios of the samples are shown in Table 1 and Fig. 4b, showed that the total signal of the samples increased significantly with the increase of water absorption time and reached a stable value after 48 h. The total signal reflects the total amount of water in the sample. The signal of strongly bound water increased first, then decreased, while the signal of weakly bound water increased gradually. The signal of each state of water reflects the relative amount of water in that state. We can see that the total amount of water in the sample increased significantly, but the relative amount of strongly bound water decreased, while the relative amount of weakly bound water increased. Combining the data in Table 1 with Fig. 4b, it is apparent that during the process of water absorption, both the strongly bound water and the weakly bound water increased in absolute terms, but at different rates, with the weakly bound water increasing faster than the strongly bound water. The proportion of weakly bound water increased relatively, while the proportion of strongly bound water decreased relatively. This indicates that the state of water in the sample changed from strongly bound to weakly bound as the water absorption time increased.
Table 1. Peak area of laminated veneer lumber sample of different water absorption time.
Water
absorption
timeA21 A22 A2 Control 160.41 ± 11.39f 7.48 ± 1.00f 168.37 ± 11.99e 0.5 318.31 ± 42.43e 135.93 ± 60.31e 455.56 ± 100.71d 1 381.52 ± 36.28d 171.29 ± 65.32de 554.56 ± 98.67d 2 441.11 ± 38.18c 209.57 ± 73.62de 652.67 ± 108.44c 3 470.18 ± 32.41bc 238.79 ± 77.29cd 711.00 ± 105.75c 6 513.33 ± 18.04ab 302.35 ± 82.23c 817.64 ± 82.08b 12 518.82 ± 68.02a 384.47 ± 81.43b 904.74 ± 28.58a 24 432.31 ± 65.19c 523.85 ± 130.30a 913.49 ± 26.70a 48 351.22 ± 81.30de 580.79 ± 120.04a 897.33 ± 21.79a 96 341.68 ± 62.32de 552.65 ± 117.83a 860.42 ± 16.26ab Different letters of superscripts in each column represent significant differences (p < 0.05) in each treatment (n = 10). Magnetic resonance imaging
-
LF-NMR weighted imaging can be used to highlight a particular component of a sample by adjusting the repetitive sampling wait time and echo time. These two parameters affect the degree of recovery and decay of the NMR signal, which is related to the relaxation times of different components in the sample. Depending on the different repetitive sampling wait and echo times, MRI can be divided into T1-weighted imaging, T2-weighted imaging, and proton density-weighted imaging. T1-weighted imaging is used to highlight the components with short relaxation times in the sample, such as strongly bound water in wood; T2-weighted imaging is used to highlight the components with long relaxation times, such as weakly bound water in wood; and the proton density-weighted imaging is used to highlight the distribution of all hydrogen protons in the sample, regardless of their relaxation times. The NMR signal in the wood samples is mainly derived from hydrogen protons in the moisture. The higher the absolute moisture content, the higher the hydrogen proton density, and the higher the pixel signal intensity of the proton density-weighted image for the same specification lumber[24,28,34]. Thus, the distribution of moisture in the wood can be reflected by the proton density-weighted imaging. Figure 5 shows the proton density-weighted images of wood samples at different water absorption times. With the extension of water absorption time, the brightness of proton density-weighted imaging gradually increases until there is no further significant change. This indicates that the pores in the sample are gradually filled with water during the absorption process, and the moisture content reaches a saturation level. This is consistent with the results obtained by spectral line test, which also showed that the total signal of water molecules increased significantly and stabilized after a certain absorption time.
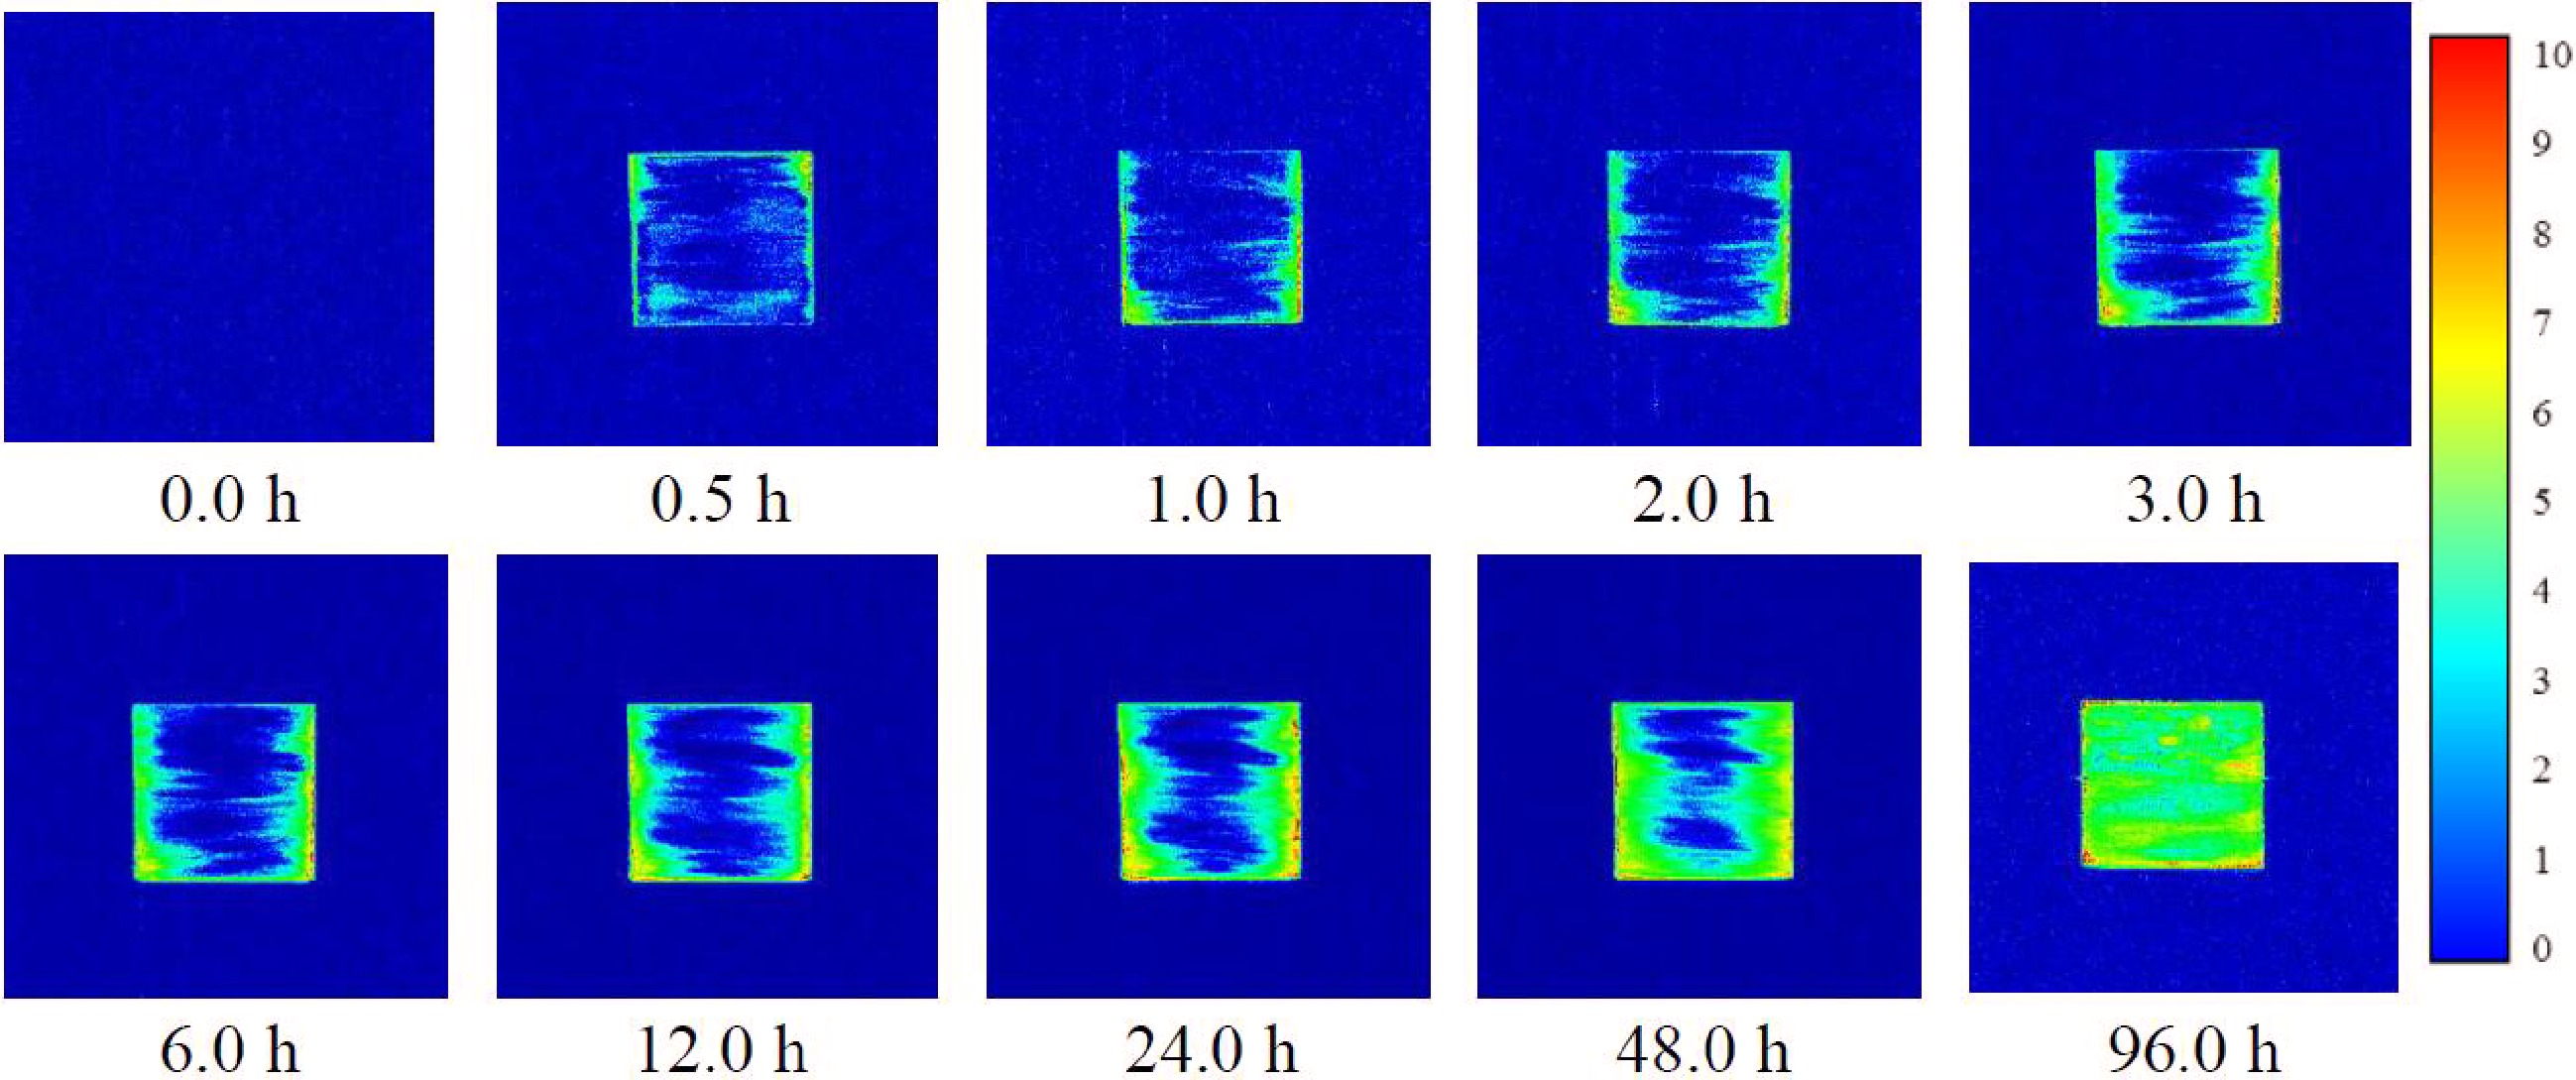
Figure 5.
T2-weighted MRI images of laminated veneer lumber sample of different water absorption time.
Prediction model of moisture content in the drying process
-
To obtain more samples with different moisture content, saturated samples were taken and dried at 65 and 105 °C for different durations, ranging from 0.5 to 20 h. The sample weight and the NMR T2 spectrum were measured after each drying period. Figure 6 shows the changes of weight in laminated veneer lumber sample after water absorption. The results indicate that the sample weight reached a stable value after the sample was dried at 105 °C for 8 h, meaning that no more water was lost from the sample. However, when the sample was dried at 60 °C, the weight still showed a decreasing trend even after 8 h, meaning that some water was still present in the sample. Fig. 7a & b show that the peak of the weakly bound water decreased significantly at the beginning of the drying, indicating that this state of water was easier to evaporate from the sample. The area of the strongly bound water decreased gradually as the drying time continued to be extended, indicating that this state of water was harder to evaporate from the sample. After 20 h of drying, there was almost no signal for samples under both conditions, indicating that almost all water was removed from the samples.
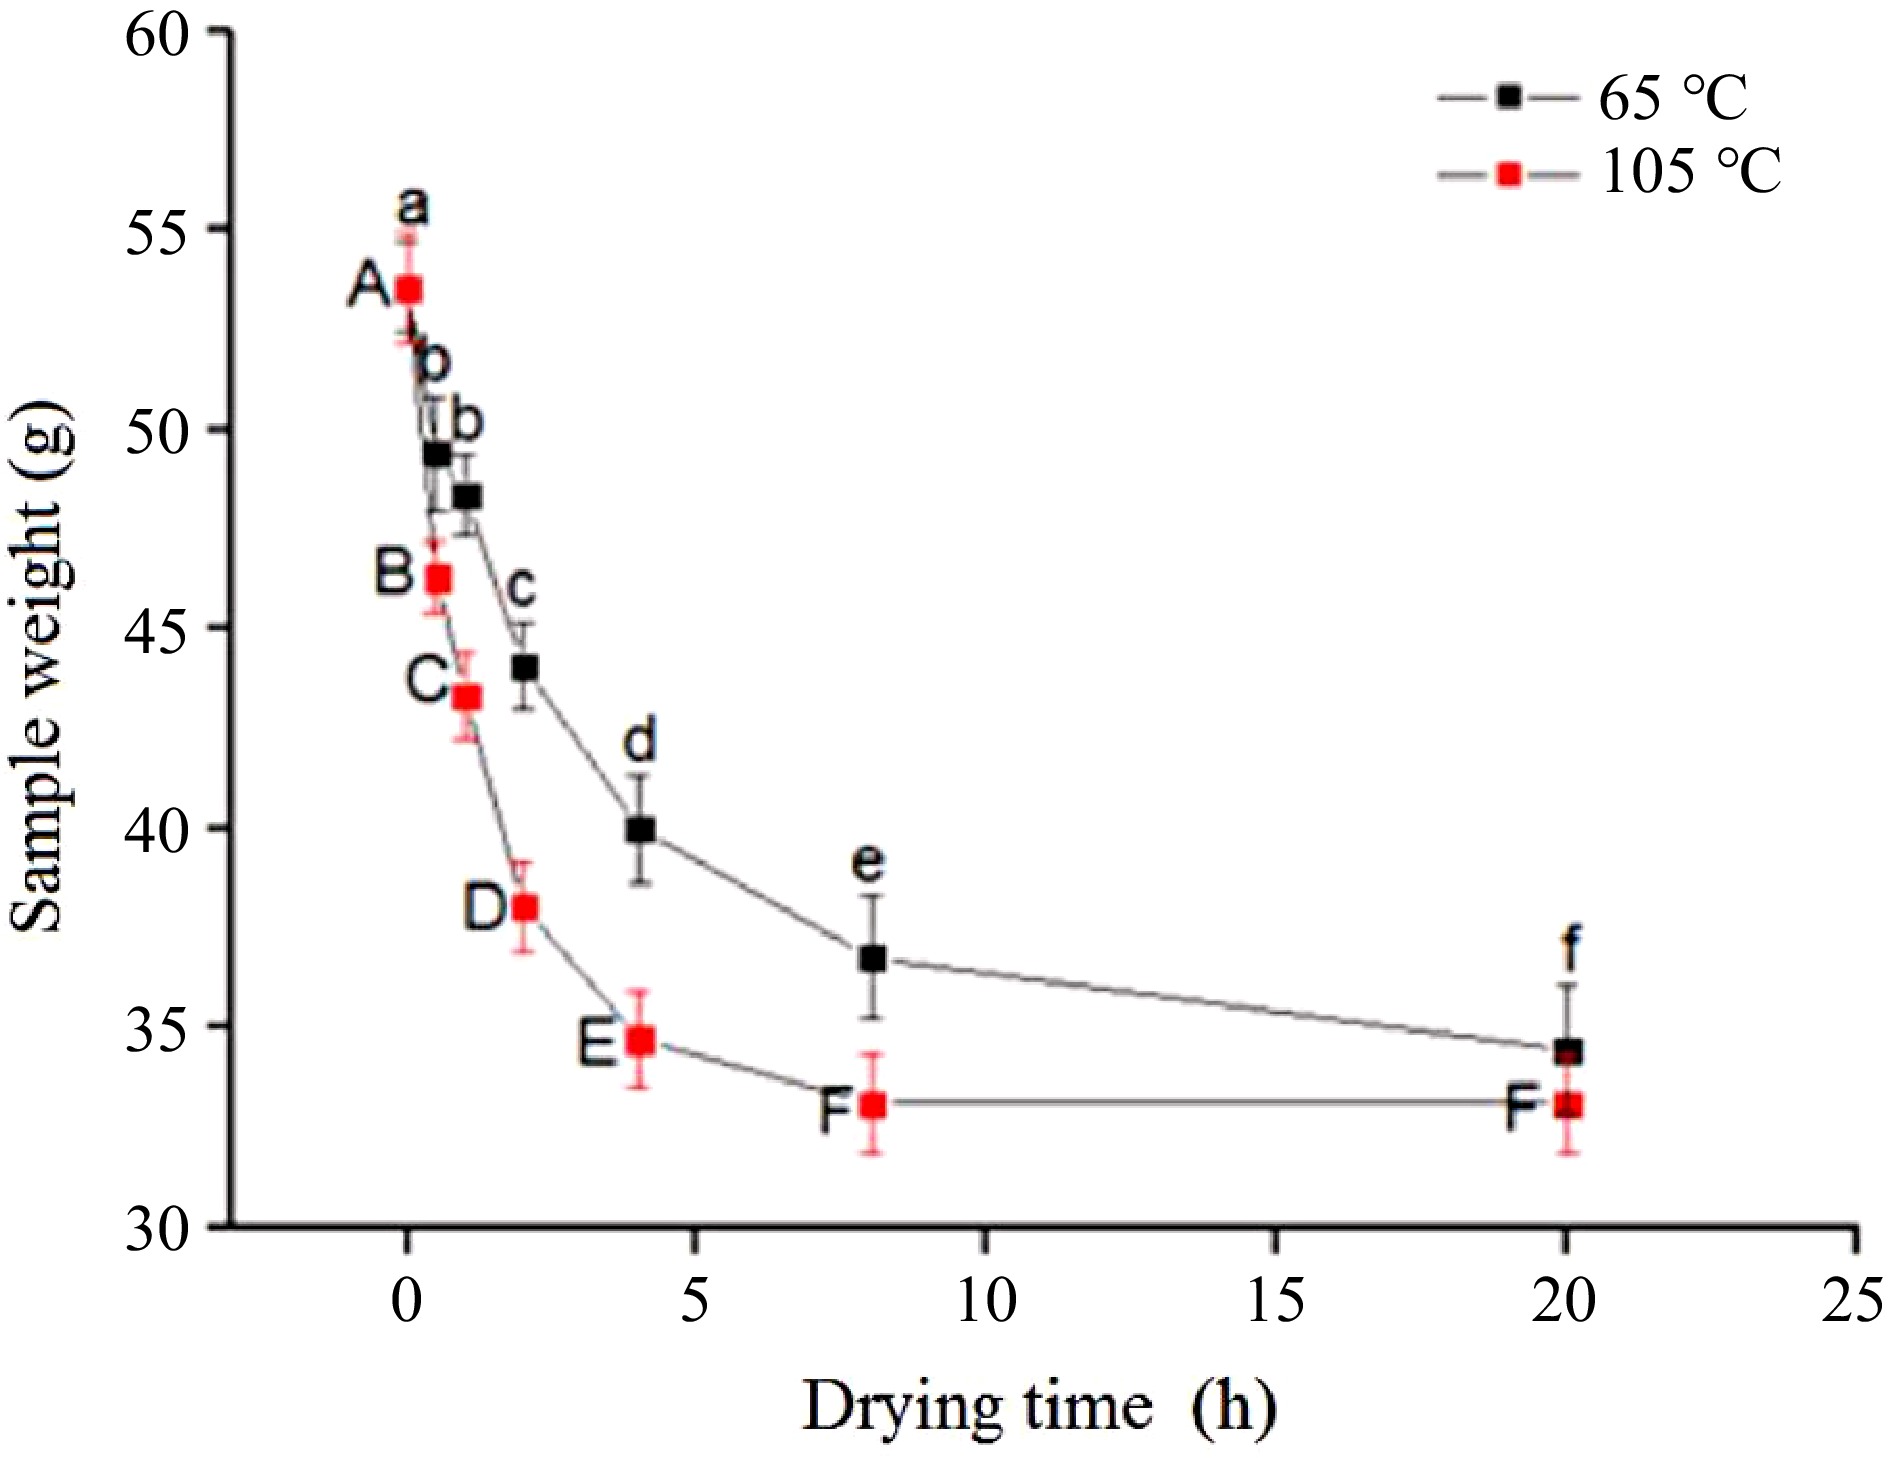
Figure 6.
Changes of weight in laminated veneer lumber sample after water absorption. Note: Means with standard error are indicated, different letters represent significant differences (p < 0.05) in each treatment (n = 10).
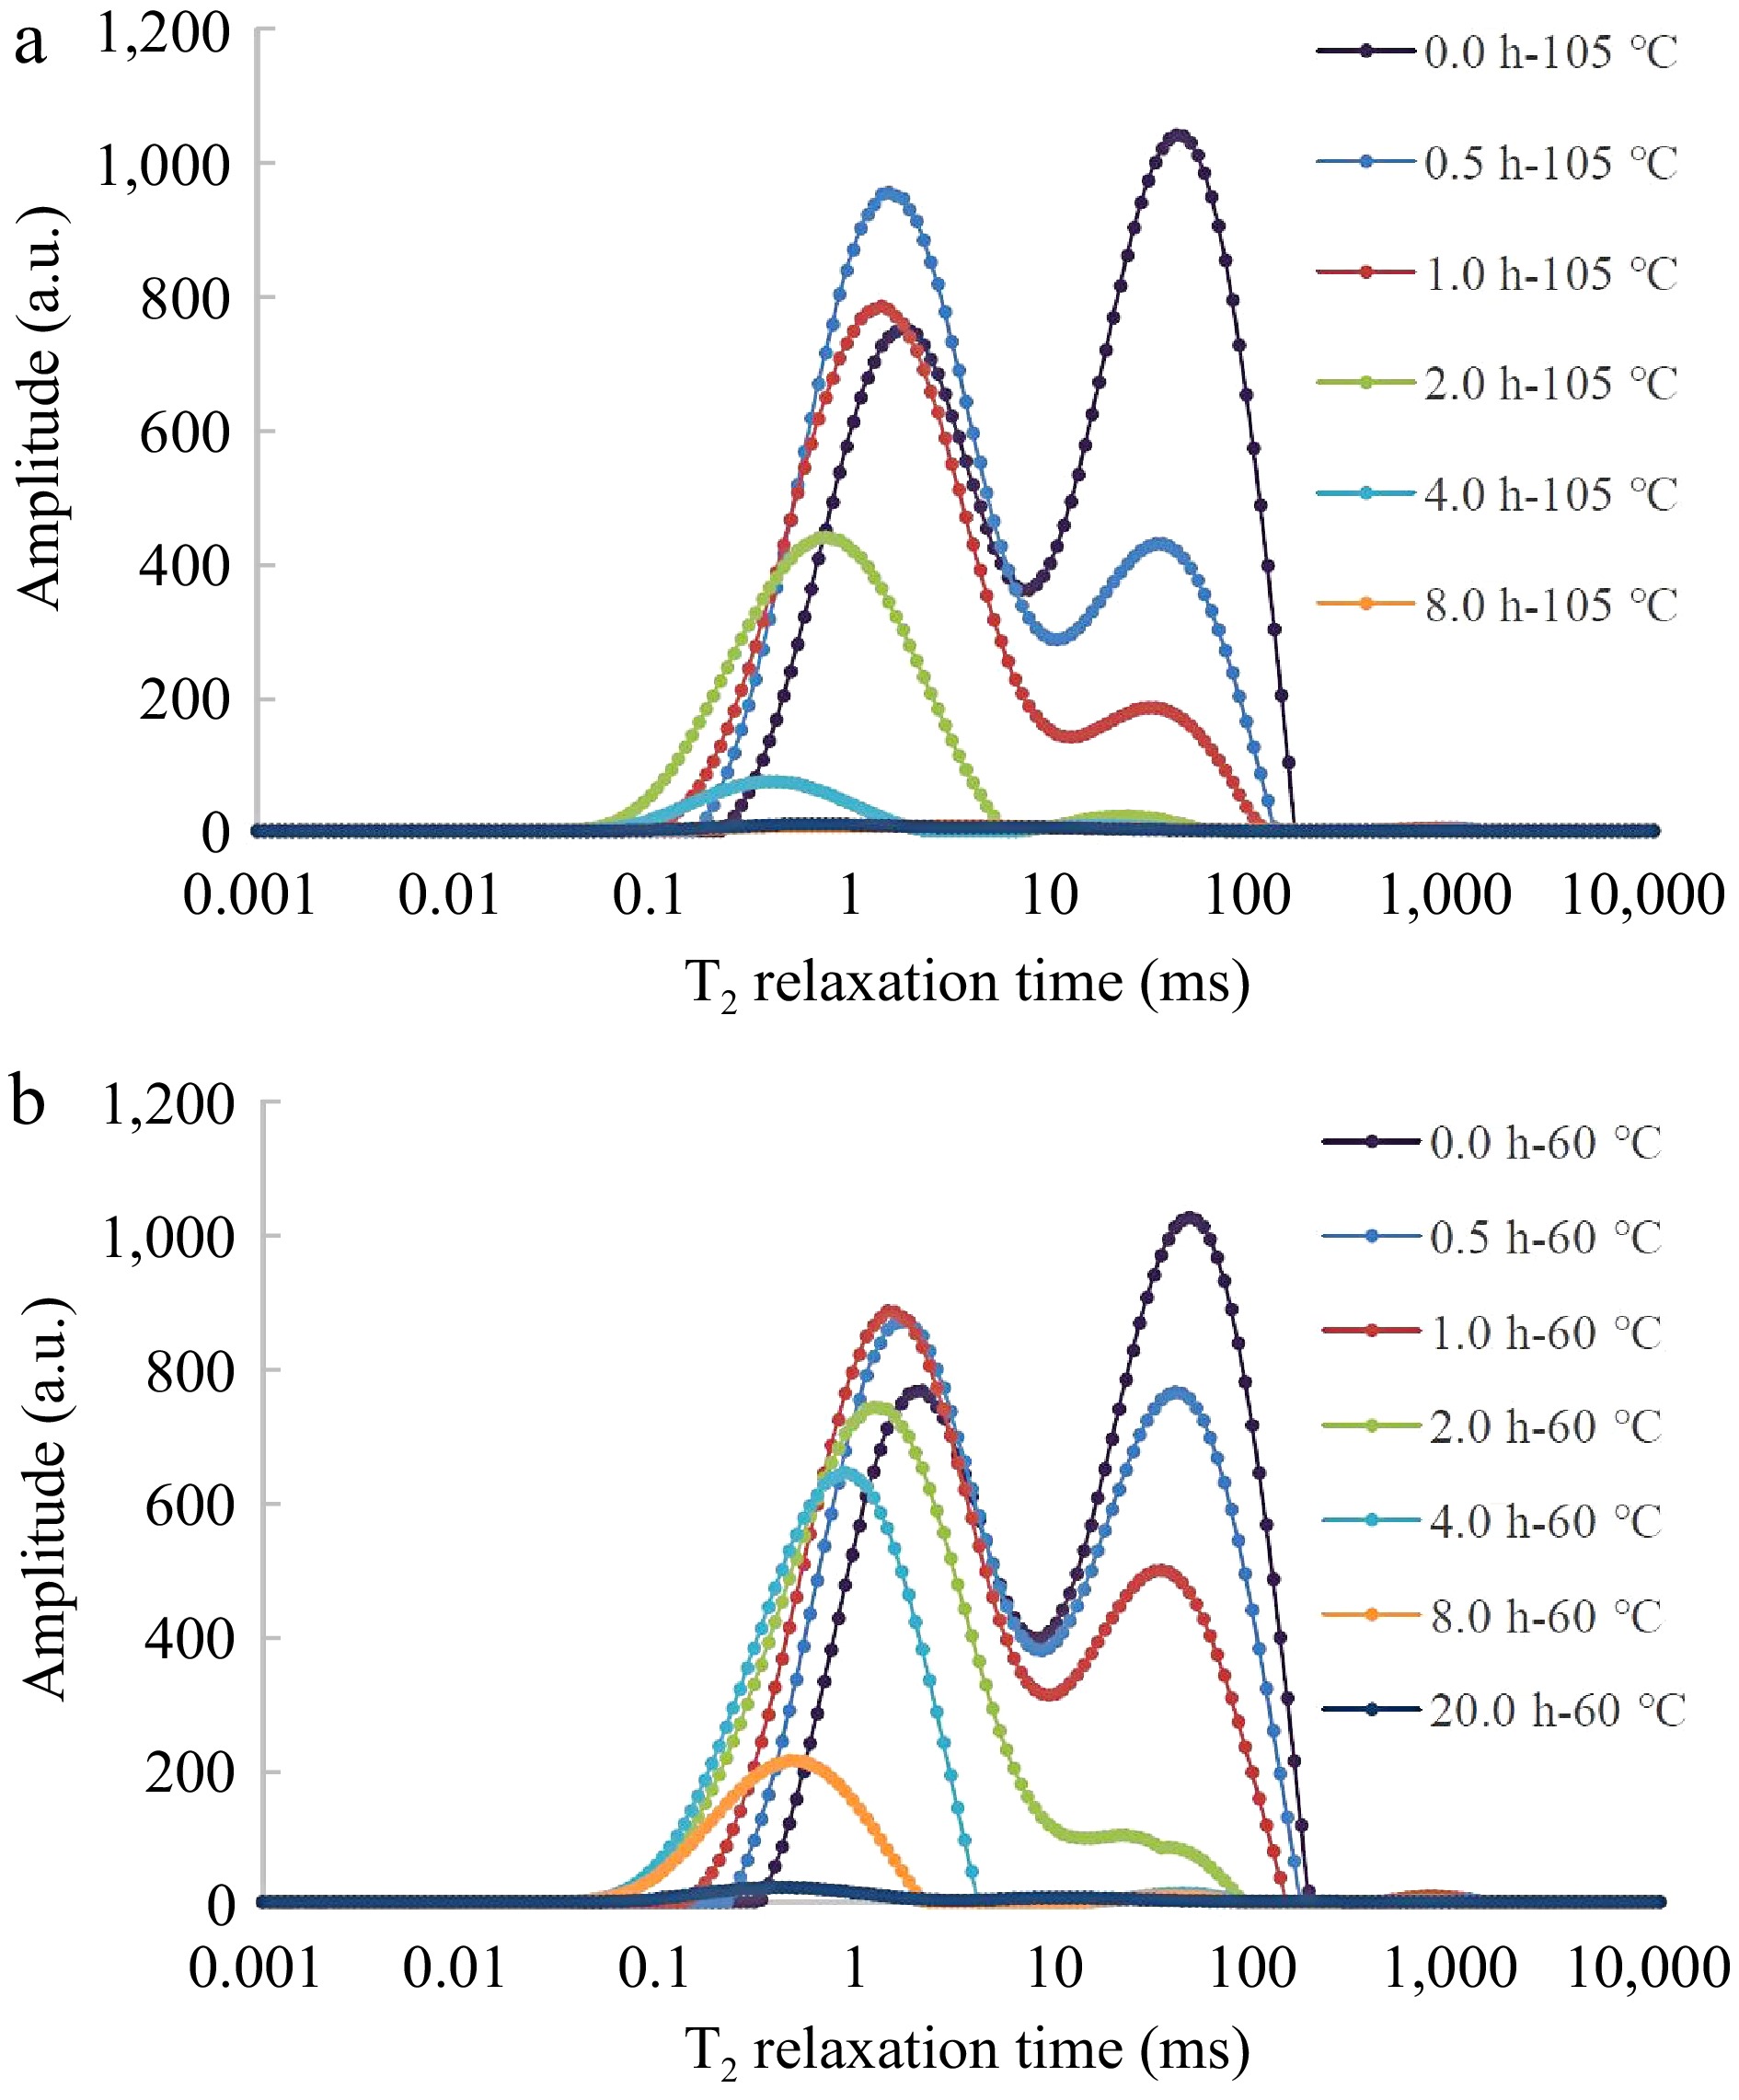
Figure 7.
Changes in T2 relaxation spectra during drying process. (a) Dried at 105 °C, (b) dried at 60 °C.
The multi-component relaxation spectrum can directly reflect the existence and distribution of water molecules in the laminates, but it is not possible to quantitatively determine the moisture in the samples based on the relaxation spectrum[35]. This is because the relaxation spectrum only shows the relative amount of water in each state, not the absolute amount of water in the sample. The peak area of the signal peak in the multi-component relaxation spectrum is related to the number of hydrogen protons contained in the sample, so a model can be formed to quantitatively analyze the water content in the plate by establishing a relationship between the nuclear magnetic signal quantity and the moisture content. The nuclear magnetic signal quantity is proportional to the peak area of the signal peak, while the moisture content is proportional to the mass of water in the sample. In this paper, the relationship between nuclear magnetic signal quantity and moisture quality is established by using a linear regression method, and the moisture content is obtained through the nuclear magnetic test during the drying process and calibration of the lumber. The drying process is used to obtain different levels of moisture content in the sample, and the calibration of the lumber is used to obtain the actual mass of water in the sample. By comparing these two values, a model can be formed to calculate the moisture content from the nuclear magnetic signal quantity.
The porosity standard samples with different water content were calibrated to obtain standard curves of water quality and nuclear magnetic signal quantity, as shown in Fig. 8. The water quality is the mass of water in the sample, while the nuclear magnetic signal quantity is the total area of the NMR T2 spectrum. The standard curves show the linear relationship between these two variables, which can be used to calculate the water quality from the nuclear magnetic signal quantity[32]. The total NMR area corresponding to samples with different moisture content in the drying process was taken and substituted into the standard curves to obtain the NMR moisture content, which is the predicted moisture content based on the NMR method. The weighing moisture content was obtained by the weighing method, which is the actual moisture content based on the mass difference before and after drying. The NMR moisture content and weighing moisture content were fitted in Fig. 9, and a high correlation coefficient was obtained. The results showed a high fitting degree between the predicted moisture content and the weighing moisture content, indicating that the NMR method can accurately determine the moisture in wood.
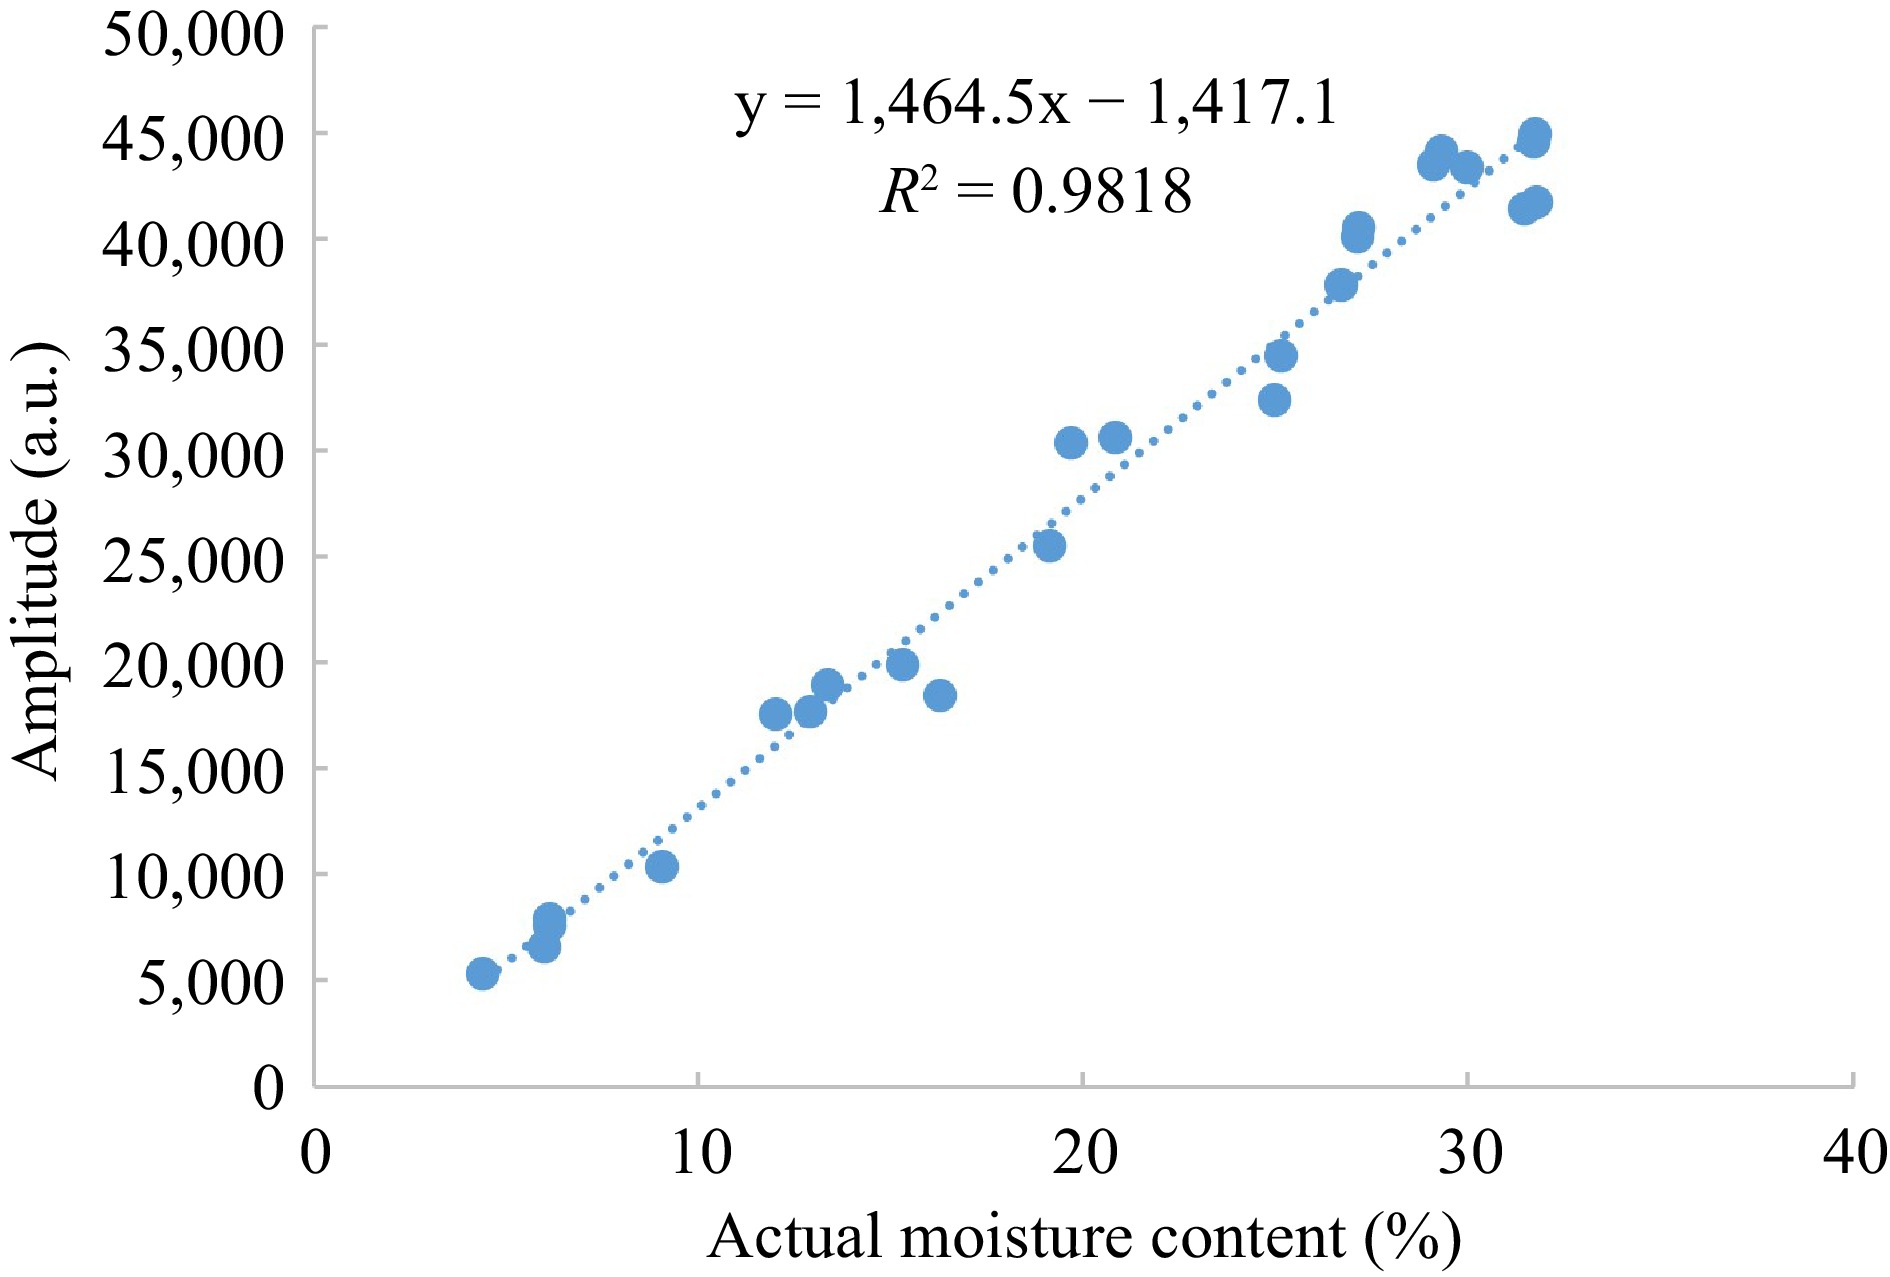
Figure 8.
Standard curves of water quality and nuclear magnetic signal quantity.
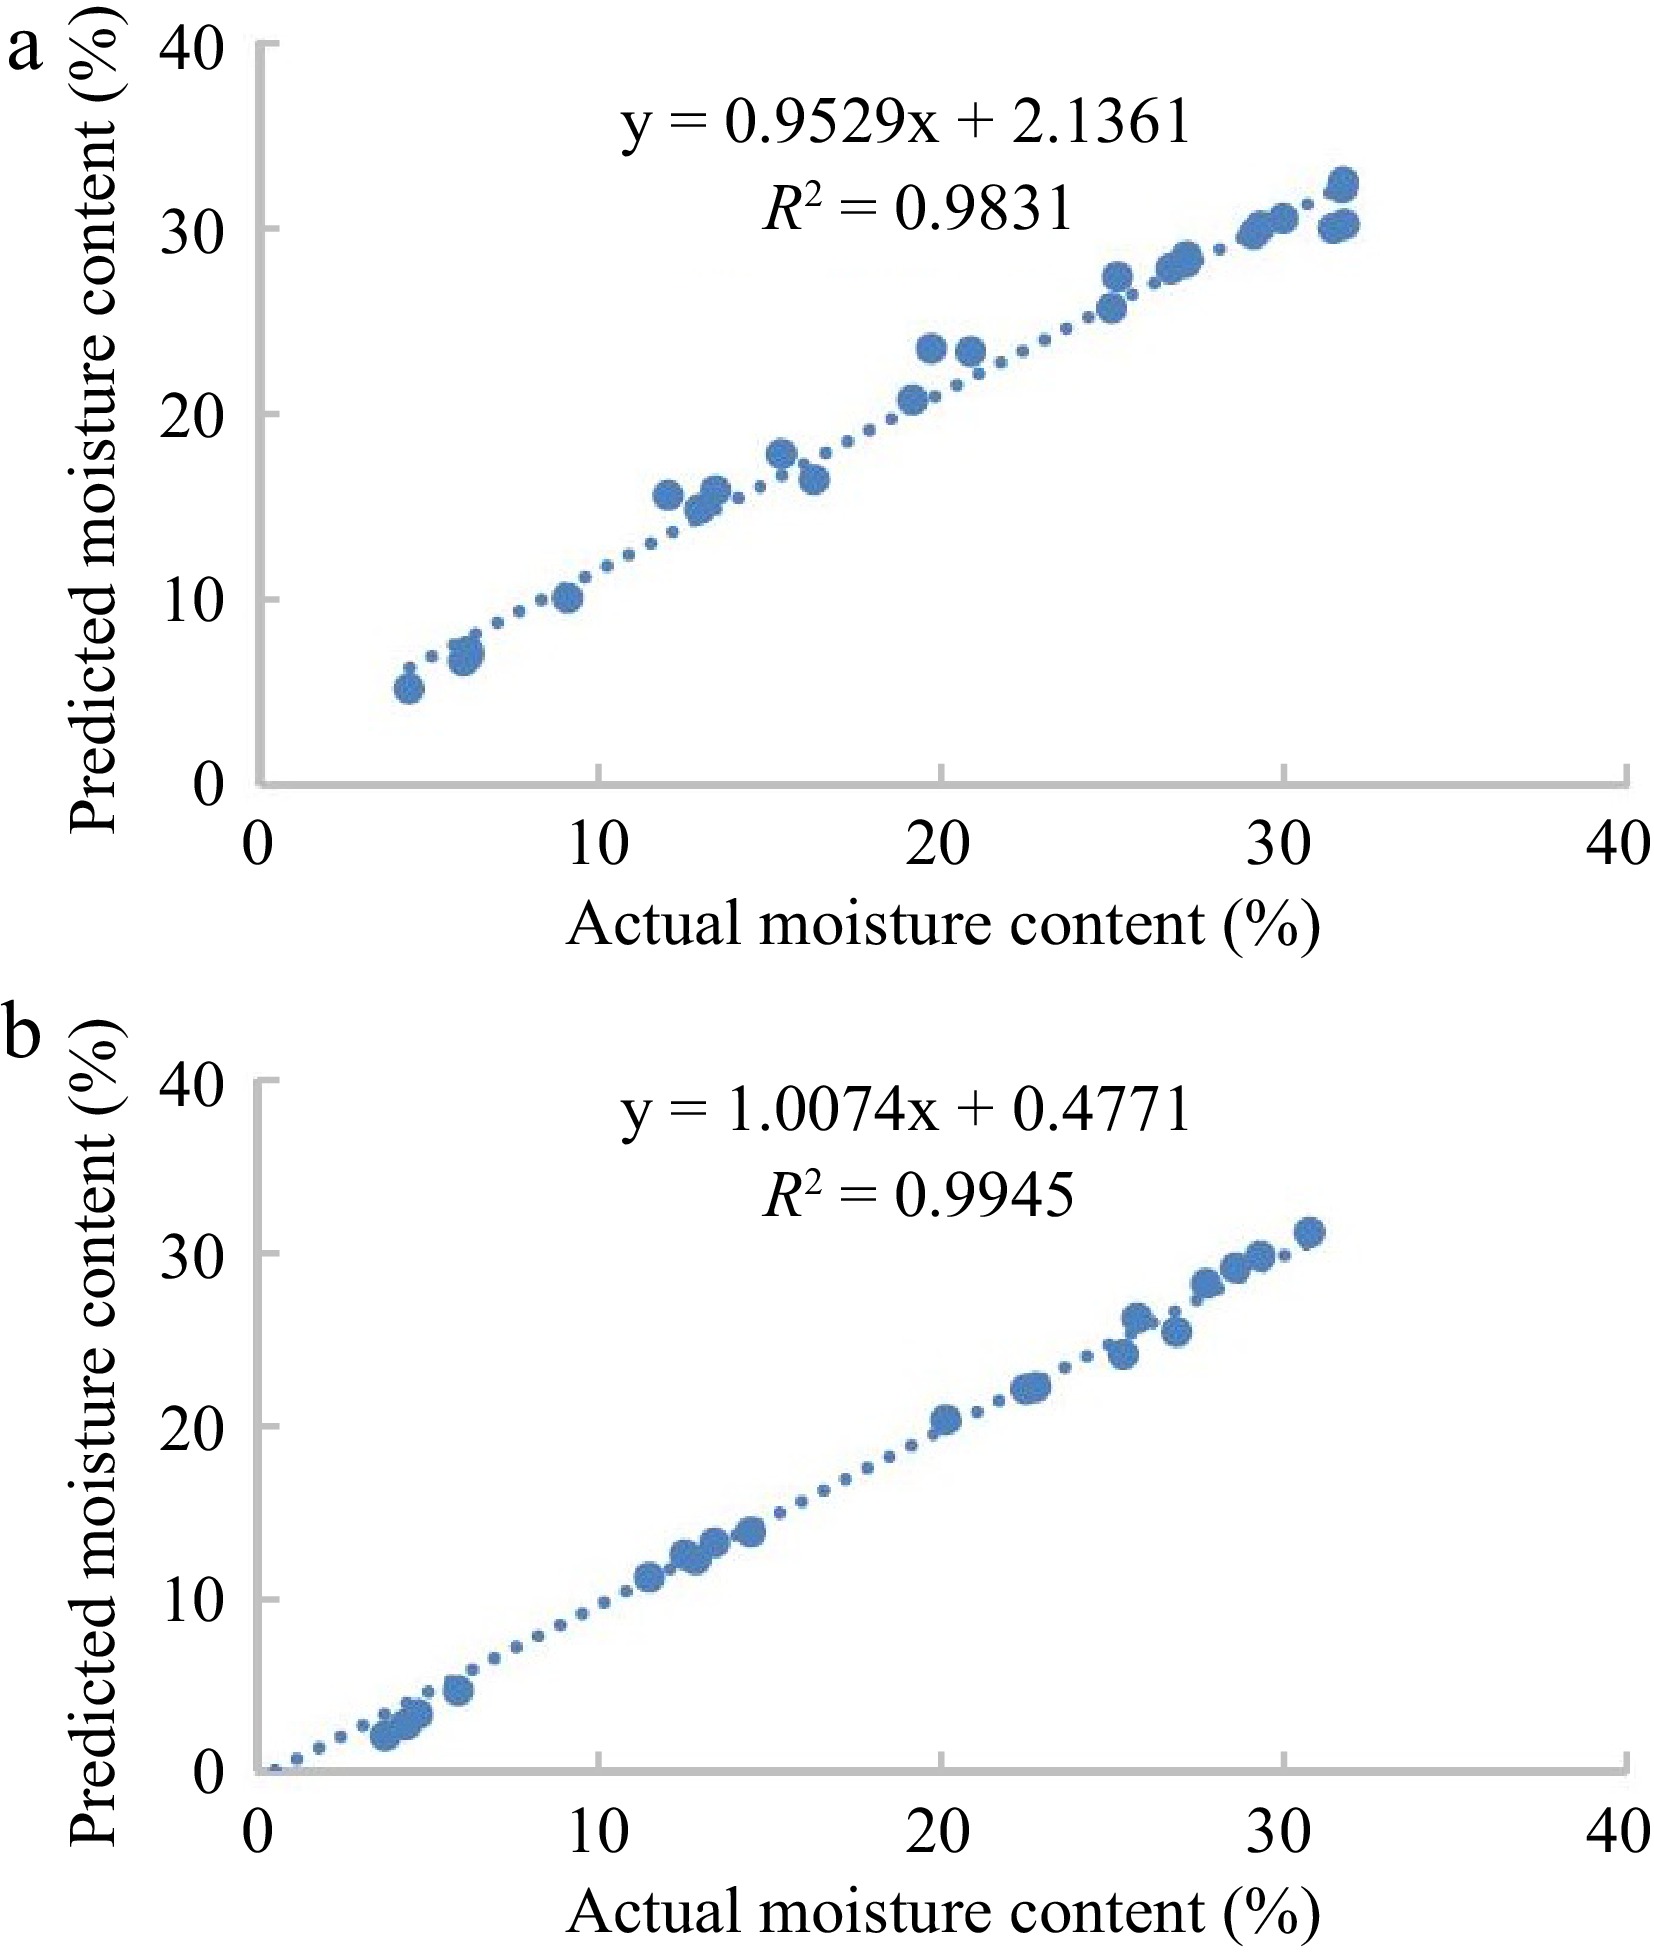
Figure 9.
Comparison of water content by the nuclear magnetic predicted method and weighing method. (a) Dried at 105 °C, (b) dried at 60 °C.
-
In this study, the moisture behavior of laminated veneer lumber (LVL) during the water absorption and drying processes were studied by low filed nuclear magnetic resonance (LF-NMR) and magnetic resonance imaging (MRI) techniques. The result shows that the moisture in LVL can be divided into strongly bound water and weakly bound water, which have different mobility, diffusivity, and relaxation times. It also shows that the moisture content in LVL can be calculated from the nuclear magnetic signal quantity, and the moisture distribution in LVL can be reflected by the NMR weighted imaging. It further shows that the drying process affects the moisture loss and state change of LVL, and the NMR method can accurately determine the moisture in wood during the drying process. The result provides useful information for the design and application of LVL in different environments, such as indoor or outdoor, humid or dry, etc., which can help to improve the performance and durability of LVL products. Our findings can contribute to the improvement or optimization of LVL production or application, such as by selecting appropriate wood species, adhesive types, curing conditions, and coating methods to reduce the moisture migration and improve the performance of LVL.
-
The authors confirm contribution to the paper as follows: conceptualization: Zhu Y, Lu S; methodology: Yan J, Li S; software: Chen Z, Feng S; validation: Ouyang W; formal analysis: Lu S; investigation: Feng S; resources: Li Z; data curation: Ouyang W; writing—original draft preparation: Zhu Y; writing—review and editing: Yan J; supervision: Li Z. All authors have read and agreed to the published version of the manuscript.
-
The datasets generated during and/or analyzed during the current study are available from the corresponding author on reasonable request.
This research was supported by Natural Science Foundation of Jiangsu Province (BK20230210), Suzhou Vocational University research courses (SZDYKC-230407). A special thank you to Nina Rogers, a professional copywriter based in the UK, who helped us proofread this article to ensure it is grammatically and typographically correct. Authors also thank UK freelancer Mrs Nitika Wilson for English language editing and review.
-
The authors declare that they have no conflict of interest.
- Copyright: © 2024 by the author(s). Published by Maximum Academic Press on behalf of Nanjing Agricultural University. This article is an open access article distributed under Creative Commons Attribution License (CC BY 4.0), visit https://creativecommons.org/licenses/by/4.0/.
-
About this article
Cite this article
Zhu Y, Yan J, Lu S, Ouyang W, Li S, et al. 2024. Moisture migration analysis of laminated veneer lumber based on low field nuclear magnetic resonance. Food Materials Research 4: e003 doi: 10.48130/fmr-0023-0038 

Moisture migration analysis of laminated veneer lumber based on low field nuclear magnetic resonance
- Received: 02 August 2023
- Revised: 17 September 2023
- Accepted: 17 October 2023
- Published online: 15 January 2024
Abstract: Moisture migration is an important factor affecting the performance and durability of laminated veneer lumber (LVL), a common packaging material. In this paper, we used low-field nuclear magnetic resonance (LF-NMR) and magnetic resonance imaging (MRI) technology to investigate the moisture migration of LVL during water absorption and drying. The results showed that as LVL absorbed water, the signals of both strongly and weakly bound water in the pores increased significantly with time until the samples were fully saturated, and the NMR signals did not change much. The drying process of LVL started with a significant decrease of weakly bound water signals, followed by a gradual decrease of strongly bound water signals until the moisture content in the samples had completely evaporated. MRI was used to observe the water distribution during the water absorption and drying process and found that the visual images were consistent with the quantified NMR spectral results. We also found a linear relationship between the NMR signal and the water mass, and a high correlation between the NMR and weighing results. Our results demonstrated that the combination of LF-NMR relaxation technology and MRI technology is an effective method to analyze the moisture distribution and migration for LVL laminates.
-
Key words:
- Laminated veneer lumber /
- Moisture /
- Water absorption /
- Drying /
- LF-NMR