-
Surimi gel, known as 'concentrated myofibrillar protein'[1], is a kind of gel prepared by processing fish tissue according to fixed steps, such as rinsing, dehydration, and chopping, then adding a certain number of auxiliary materials for crushing, molding, heating and cooling. Salt-soluble myofibrillar protein (mainly myosin) of surimi denatures and unfolds after heating, and then re-crosslinks and polymerizes to form large protein aggregates[2], which is the internal mechanism of forming the gel structure. To enhance the texture and taste of surimi gel products, 2%−3% salt is added to promote the formation of the protein gel network structure and enhance the solubility and functional properties of the products[3,4]. Nonetheless, numerous studies have confirmed that excessive salt intake may result in risks of disease to human health, such as hypertension, and coronary heart disease[5]. Therefore, the development of low-salt surimi products will be widely focused on in future research.
Recently, two strategies have been innovatively proposed to improve or maintain the gel properties of low-salt surimi products: one is to use exogenous additives or sodium salt substitutes[6−8], and the other is to exploit new processing technologies[9−11]. Glutamine transaminase (TGase) is the most effective surimi quality improver to enhance the functional properties of protein, which could catalyze acyl donors in proteins (γ-Hydroxylamine group) and acyl receptors (lysine residue, primary amine compound, etc.) undergo acyl transfer reaction to form cross-linked structures[12−14]. Previous studies by Jiang et al.[15] revealed that the cross-linking effect of TGase catalysis depends on the content and spatial distribution of available substrates. In addition, lysine, as an ideal exogenous additive, has been widely used in different meat protein gel systems, which can effectively improve the gel properties of low-salt surimi gel[16] and emulsified chicken sausage[17]. Many researchers have spent a lot of time to obtain higher-quality surimi gel products through the combination of two or more exogenous additives. Many scientists devoted themselves to obtaining higher quality surimi gel products through the combination of two or more exogenous additives. For example, Cao et al.[18] demonstrated that lysine (Lys) could bring about the dissociation of actin under the condition of the presence of TGase, promoting the cooking yield and gel properties of oxidative damaged MP. Similar findings reported by Cando et al.[19] indicated that Lys could induce the changes in protein structure, which were favorable terms to heighten the cross-linking effect of TG and improve the strength of surimi gel.
Recently, the term ε-Poly-lysine (ε-PL) was followed with interest since it's a natural amino acid polymer produced by microbial fermentation, and was speculated that it has a similar molecular structure and potential effect to Lys[20]. ε-PL, which is generally composed of 25−30 lysine residues connected by amide bonds (by ε-Amino and α-Carboxyl group), was often used as an antibacterial agent for the preservation of meat products and aquatic products[21]. Li et al.[21] explored the effect of preservative coating with ε-PL on the quality of sea bass fillets during storage. It turned out that, ε-PL treatment evidently reduced the thiobarbituric acid and volatile base nitrogen values of bass slices during storage, inhibited the growth of microorganisms, and improved the water retention, texture, and flavor characteristics of the fish. A previous study by Cai et al.[20] proved the bacteriostatic and fresh-keeping effect of the composite coating of protein and sodium alginate on Japanese sea bass, and found that the composite coating had an effect on inhibiting the proliferation of sea bass microorganisms (Escherichia coli, lactic acid bacteria, yeast, etc.), fat oxidation, protein degradation, and nucleotide decomposition. As a natural cationic polypeptide, ε-PL has the advantages of no biological toxicity and low viscosity of aqueous solution. It is noteworthy that it can produce strong electrostatic adsorption with negatively charged amino acids[22]. Its effective modification of protein helps it fully interact with gel component molecules and groups[23], which may play a role in enhancing the texture and water retention of protein gel.
Nevertheless, few reports are based on the addition of ε-PL to explore the influence mechanism on TGase-catalyzed surimi gel properties. The current study sought to shed light on the effects of different additions of ε-PL on TGase-induced cross-linking effect and the performance of composite surimi gel, to provide a theoretical basis and reference for further research and development of 'low salt', efficient and healthy surimi products.
-
Testing materials, including marine surimi, transglutaminase (TG, enzyme activity 100 IU/g), and ε-Polylysine (ε-PL, ≥ 99% purity) were supplied by Jiangsu Yiming Biological Technology Co., Ltd (Jiangsu, China). Egg white protein was purchased from Henan Wanbang Chemical Technology Co., Ltd (Henan, China). All other chemicals were from Shanghai Yuanye Biochemical Co., Ltd (Shanghai, China) and were at least analytical grade. The ingredients of the surimi gel are shown in Table 1.
Table 1. Surimi samples with different treatments.
Groups Surimi
(g)TGase
(w/w, %)Egg white
Protein
(w/w, %)ε-PL
(w/w, %)NaCl
(w/w, %)CK 300 − − − 0.5 TE 300 0.4 7.0 − 0.5 TE + P1 300 0.4 7.0 0.005 0.5 TE + P2 300 0.4 7.0 0.01 0.5 TE + P3 300 0.4 7.0 0.02 0.5 TE + P4 300 0.4 7.0 0.04 0.5 TE + P5 300 0.4 7.0 0.06 0.5 Preparation of mixed surimi samples
-
The prepared block surimi was firstly put into the chopping machine (or tissue masher) and chopped for 2 min, then different mass fractions of ingredients were added, while the chopping time was extended to 5 min (the temperature should be controlled below 10 °C during this process). The exhausted surimi paste was poured into the special mold (50 mm × 20 mm), which was heated in two stages to form the heat-induced surimi gel (40 °C water bath for 40 min; 90 °C water bath for 20 min). Above prepared surimi gel underwent an ice water bath for 30 min and finally stored overnight at 4 °C for further use.
Rheological characteristics of mixed surimi samples
-
Mixed surimi samples with different treatments were determined under a Haake Mars 60 Rheometer (Thermo Fisher Scientific, Germany) with 35 mm stainless steel parallel plates referring to the method described by Cao et al.[18], and each determination was repeated three times. After centrifugation (1,000× g, 3 min) and 4 °C, the degassed surimi sol (~2 g) was equilibrated at 4 °C for 3 min before measurement.
Apparent viscosity
-
The shear stress of the mixed surimi sol was measured at shear rates between 0−100 s−1.
Dynamic rheological behavior
-
The rheological properties of the mixed surimi sols were measured in an oscillatory mode of CD-Auto Strain at 0.02% and 0.1 Hz frequency, respectively. The heating temperature range is set to 20~90 °C while the heating rate is 1 °C·min−1.
Strength of mixed surimi gels
-
The TA-XT Plus physical property analyzer (TA-XT Plus, Stable Micro Systems Ltd, Surrey, UK) was used to analyze the mixed surimi gel strength of each group of samples (n ≥ 3) at room temperature, and the cube-shaped surimi gel samples are measured through the P/0.5 probe. Referring to the method previously described by Fang et al.[24], the test parameters are as follows, pre-test and test rate (1 mm·s−1); rate after measurement (5 mm·s−1); depressing degree (30%); trigger force (5 g); data acquisition rate (400 p/s).
Textural properties of mixed surimi gels
-
Concerning the method of Jirawat et al.[25], texture profile analysis (TPA) was employed to record the hardness, elasticity, cohesion, chewiness, and resilience of mixed surimi gels. It is well known that TPA can explore the textural properties of food through the texture analyzer (TA-XT Plus, Stable Micro Systems Ltd, Surrey, UK) equipped with a P/75 probe to simulate human oral chewing action and obtain the texture characteristic values related to human sensory evaluation. The physical property parameter settings were as follows: downforce (5 g), compression degree (50%), pre-test speed, test speed, and post-test speed (1.0 mm·s−1).
Cooking loss of mixed surimi gels
-
The cooking loss of surimi gel under different treatments was determined referring to the protocol of Dong et al.[26]. The cooked surimi gel sample was instantly absorbed dry and weighed (W5). The cooking loss (CL) is calculated as follows:
$\rm CL\;(g/100\;g)=(M_{1}-M_{2})/M_{1} \times 100 $ (1) Where M1, weight of the sample before cooking; M2, weight of the sample after cooking.
Low-field nuclear magnetic resonance (LF-NMR) of mixed surimi gels
-
The LF-NMR of the mixed surimi gel was detected by a PQ001-20-025V NMR analyzer (Niumag Analytical Instruments Co., Ltd, Suzhou, China) referring to the previous method conducted by Li et al.[27]. Relevant characteristic parameters were set as follows: sampling frequency (200 KHZ), echo time (0.3 ms), and cumulative number (8). Keeping the surimi gel sample (approximately 2 g) at room temperature for 30 min, they were carefully put into a cylindrical nuclear magnetic tube (15 mm in diameter), and finally, the relaxation time (T2) was recorded using the Carr Purcell Meiboom Gill (CPMG) pulse sequence.
Color difference of mixed surimi gels
-
CM-5 colorimeter (Konica Minolta Sensing, Inc., Tokyo, Japan) was used for surimi gel with different treatments following to the procedure of Wang et al.[28]. Several 1 cm thick slices were cut from surimi samples (n = 3) selected from different treatment groups, and the gel whiteness was calculated according to the following formula:
$ \mathrm{W}\mathrm{h}\mathrm{i}\mathrm{t}\mathrm{e}\mathrm{n}\mathrm{e}\mathrm{s}\mathrm{s}=100-\sqrt{{(100-{\mathrm{L}}^{\mathrm{*}})}^{2}+{{\mathrm{a}}^{\mathrm{*}}}^{2}+{{\mathrm{b}}^{\mathrm{*}}}^{2}} $ (2) Scanning electron microscopy (SEM) of mixed surimi gels
-
According to the previously described procedure by Gao et al.[29], the square-shaped surimi gels (4 mm × 4 mm × 4 mm) were immersed in 0.1 mol·L−1 phosphate buffer (pH 7.2) containing 2.5% (v/v) glutaraldehyde for 24 h. The above samples were washed using phosphate buffer (0.1 mol·L−1, pH 7.2) three times and then subsequently dehydrated in a series of alcohol solutions. The microstructures of the mixed surimi gels were imaged using an FEI Verios 460 SEM (FEI Inc., Hillsboro, OR, USA).
Thiobarbituric acid-reactive substances (TBARS) determination
-
The TBARS value was analyzed by the method described by Hu et al.[30] with slight modification. Thiobarbituric acid solution (1.5 mL) and 8.5 mL of trichloroacetic acid solution were added to the sample in turn, the mixture was bathed in water at 100 °C for 30 min. The supernatant was extracted and centrifuged twice (3,000× g, 5 min): (1) The original supernatant (5 mL) was taken and the same amount of chloroform for mixed centrifugation; (2) The second supernatant (3 mL) and petroleum ether (1.5 mL) were taken for mixed centrifugation. Finally, a small amount of lower liquid was taken to determine the absorbance (A532 nm). The final result was expressed in malondialdehyde equivalent (mg·kg−1).
Statistical analysis
-
All statistical analyses of data were investigated by statistical product and service solutions IBM SPSS Statistics version 23.0 (IBM SPSS Inc., Chicago, USA). The LSD all-pairwise multiple comparison method was used for the least significance analysis, and p < 0.05 was considered to indicate significance. The experimental data are expressed as mean ± standard deviation (SD) and plotted using Origin 2019 (Origin Lab, Northampton, MA, USA) software.
-
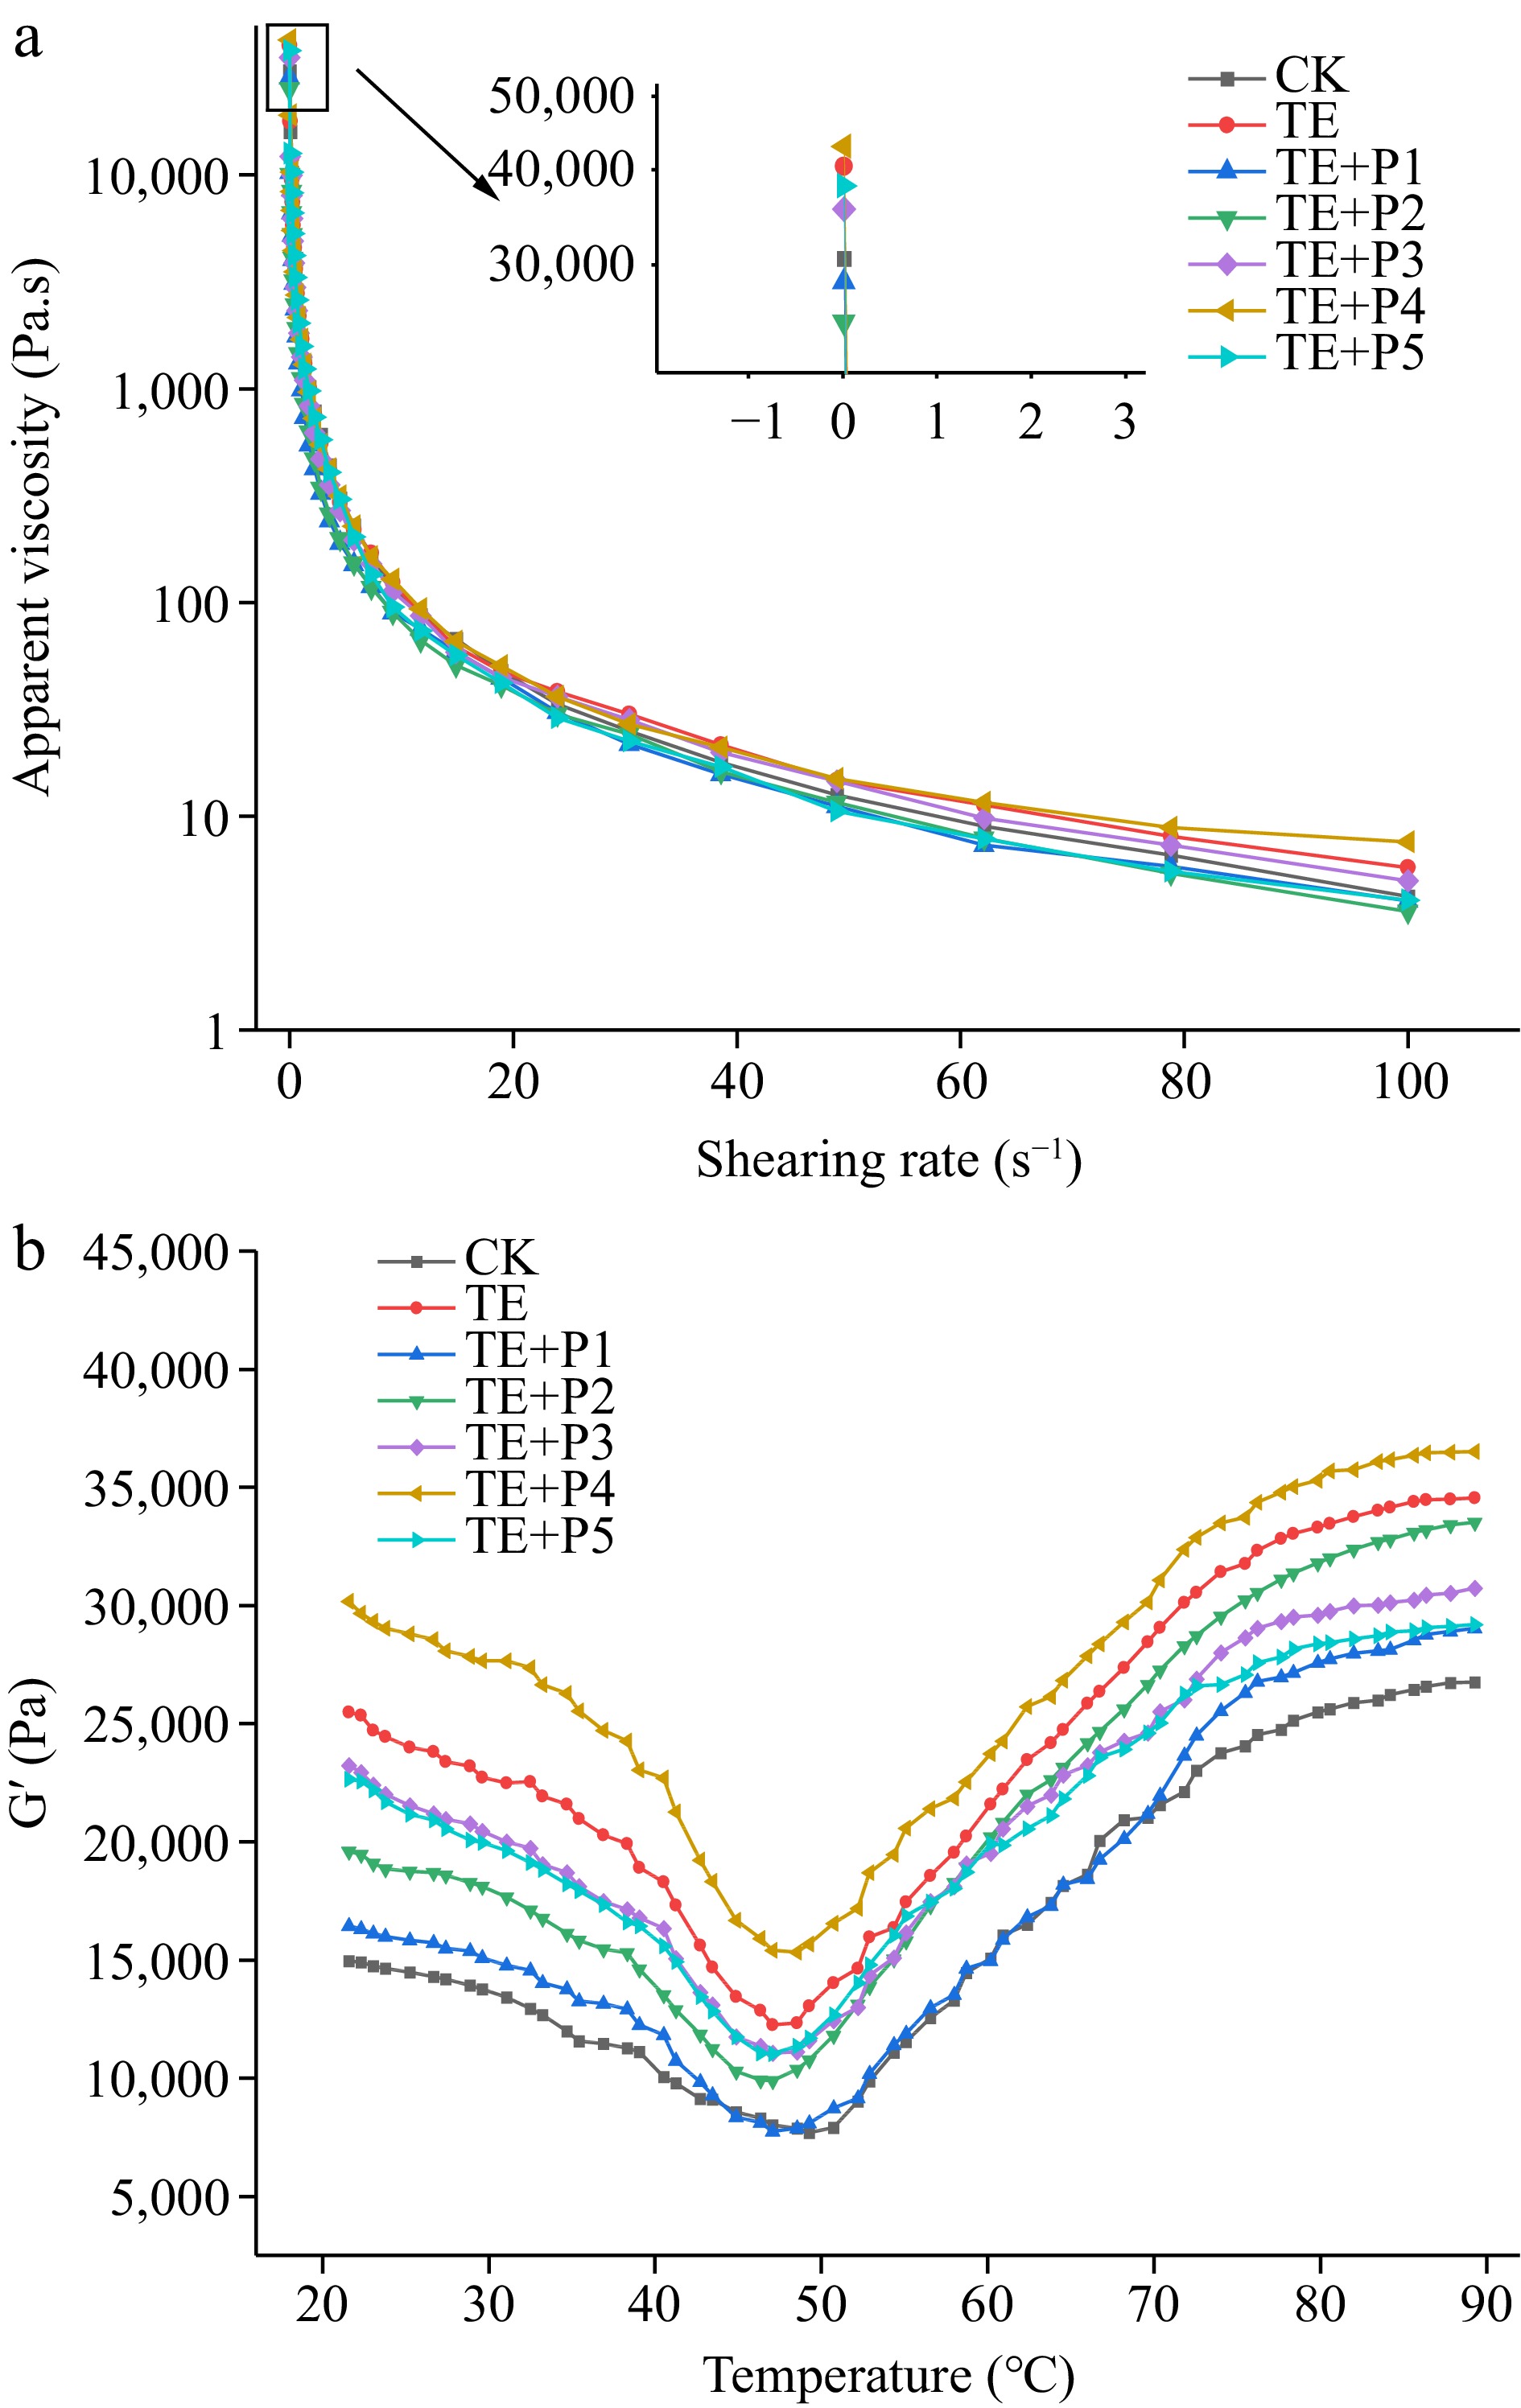
The steady-state shear flow curve can be used to characterize the interaction between proteins. The steady shear flow changes of apparent viscosity (Pa·s) of composite surimi with shear rate (s−1) under different treatments are shown in Fig. 1a. The apparent viscosity of all samples decreased significantly (p < 0.05) with increasing shear rate, exhibiting shear-thinning behavior[31]. In the range of shear rates from 0.1 to 100 s−1, the samples with TGase addition were always higher than the control, indicating that the induction of TGase enhanced the cross-linking of surimi proteins and formed a more stable structure. The surimi samples added with a lower proportion of ε-PL (0.005% and 0.01%) were regarded as lower viscosity fluid (Fig. 1a). The possible reason was that the low concentration of ε-PL provided a weak effect on the pH value of the surimi system. As a consequence, the content of the net charge provided was relatively small and the electrostatic interaction between the surimi proteins was weakened[20].
Dynamic elastic properties during gelation
-
The elastic modulus (G′) mainly depends on the interaction between protein molecules, which can reflect the change of elasticity in the heat-induced surimi gel. As shown in Fig. 1b, the gel process of surimi in the control group was a thermodynamic process consisting of two typical stages. In the first stage, the value of G' showed a gradual downward trend in the range of 20~50 °C. This is mainly because, (1) the activity of endogenous protease in surimi is increased; (2) the myosin light chain subunits of surimi are dissociated under the action of protease, forming myosin and actin[24]; (3) heat-induced hydrogen bonds break between protein molecules, thus enhancing the fluidity of the gel system[31]. The second stage: From 50 to 73 °C, the G' value increases rapidly. As the temperature continues to rise to 90 °C, the G 'value keeps rising steadily. At this time, the gel network structure gradually became stable and irreversible.
Compared with several curves in Fig. 1b, TGase treatment could significantly increase the G' value. The change trend of G' value of the samples added with TGase and ε-PL were similar to that of the control group, but the former increased faster and the maximum value of G' was also significantly higher. The temperature corresponding to the first peak of G' gradually decreased (PL1≈PL2 < PL4≈TE < PL3≈PL5 < CK), indicating that the process of protein denaturation and aggregation was advanced. This result showed that the proper amount of ε-PL (0.04%) in combination with TGase can reduce the thermal denaturation temperature of protein-forming gel and improve the forming ability of composite gel, which was unanimous with the changes in texture and properties of surimi gel (Table 2). Furthermore, the addition of a small amount (0.005%) or an excessive amount (0.06%) of ε-PL made the mixed surimi protein system more unstable, affecting the ability of TG-induced gel formation as the last resort[32].
Table 2. Effect of different treatments on the textural properties of surimi gels.
Groups Hardness (g) Springiness Cohesiveness Chewiness (g) Resilience CK 811.40 ± 45.28de 0.81 ± 0.01a 0.53 ± 0.02b 498.36 ± 21.58c 0.21 ± 0.01e TE 1105.80 ± 61.83c 0.83 ± 0.01a 0.56 ± 0.01b 510.40 ± 26.04c 0.24 ± 0.00bcd TE + P1 736.01 ± 18.49e 0.80 ± 0.03a 0.61 ± 0.00a 348.78 ± 18.36d 0.23 ± 0.01cde TE + P2 777.45 ± 39.61de 0.80 ± 0.01a 0.60 ± 0.02a 307.03 ± 12.97e 0.22 ± 0.00de TE + P3 869.66 ± 45.82d 0.83 ± 0.02a 0.63 ± 0.01a 485.06 ± 22.73c 0.28 ± 0.00a TE + P4 1492.80 ± 77.13a 0.83 ± 0.01a 0.60 ± 0.01a 721.74 ± 31.55a 0.26 ± 0.01ab TE + P5 1314.60 ± 84.10b 0.81 ± 0.00a 0.60 ± 0.02a 652.36 ± 30.24b 0.25 ± 0.01bc Different lowercase letters in the same column indicated significant differences (p < 0.05). Strength of surimi gels
-
Gel strength is one of the vital indicators to test the quality of surimi products, which directly affects the texture characteristics and sensory acceptance of the products. The strength of mixed surimi gel with TGase was significantly enhanced by 23.97% (p < 0.05) compared with the control group after heat-inducing. This enhancement is probably caused by the crosslinking promotion of TGase (Fig. 2a). A deeper explanation is that under the catalysis of TGase, the ε-amino group on lysine and the γ-amide group on glutamic acid residues undergo acylation reaction inside or between proteins, forming ε-(γ-Glutamyl)-lysine covalent cross-linking bond which promotes the production of the protein gel network[26].
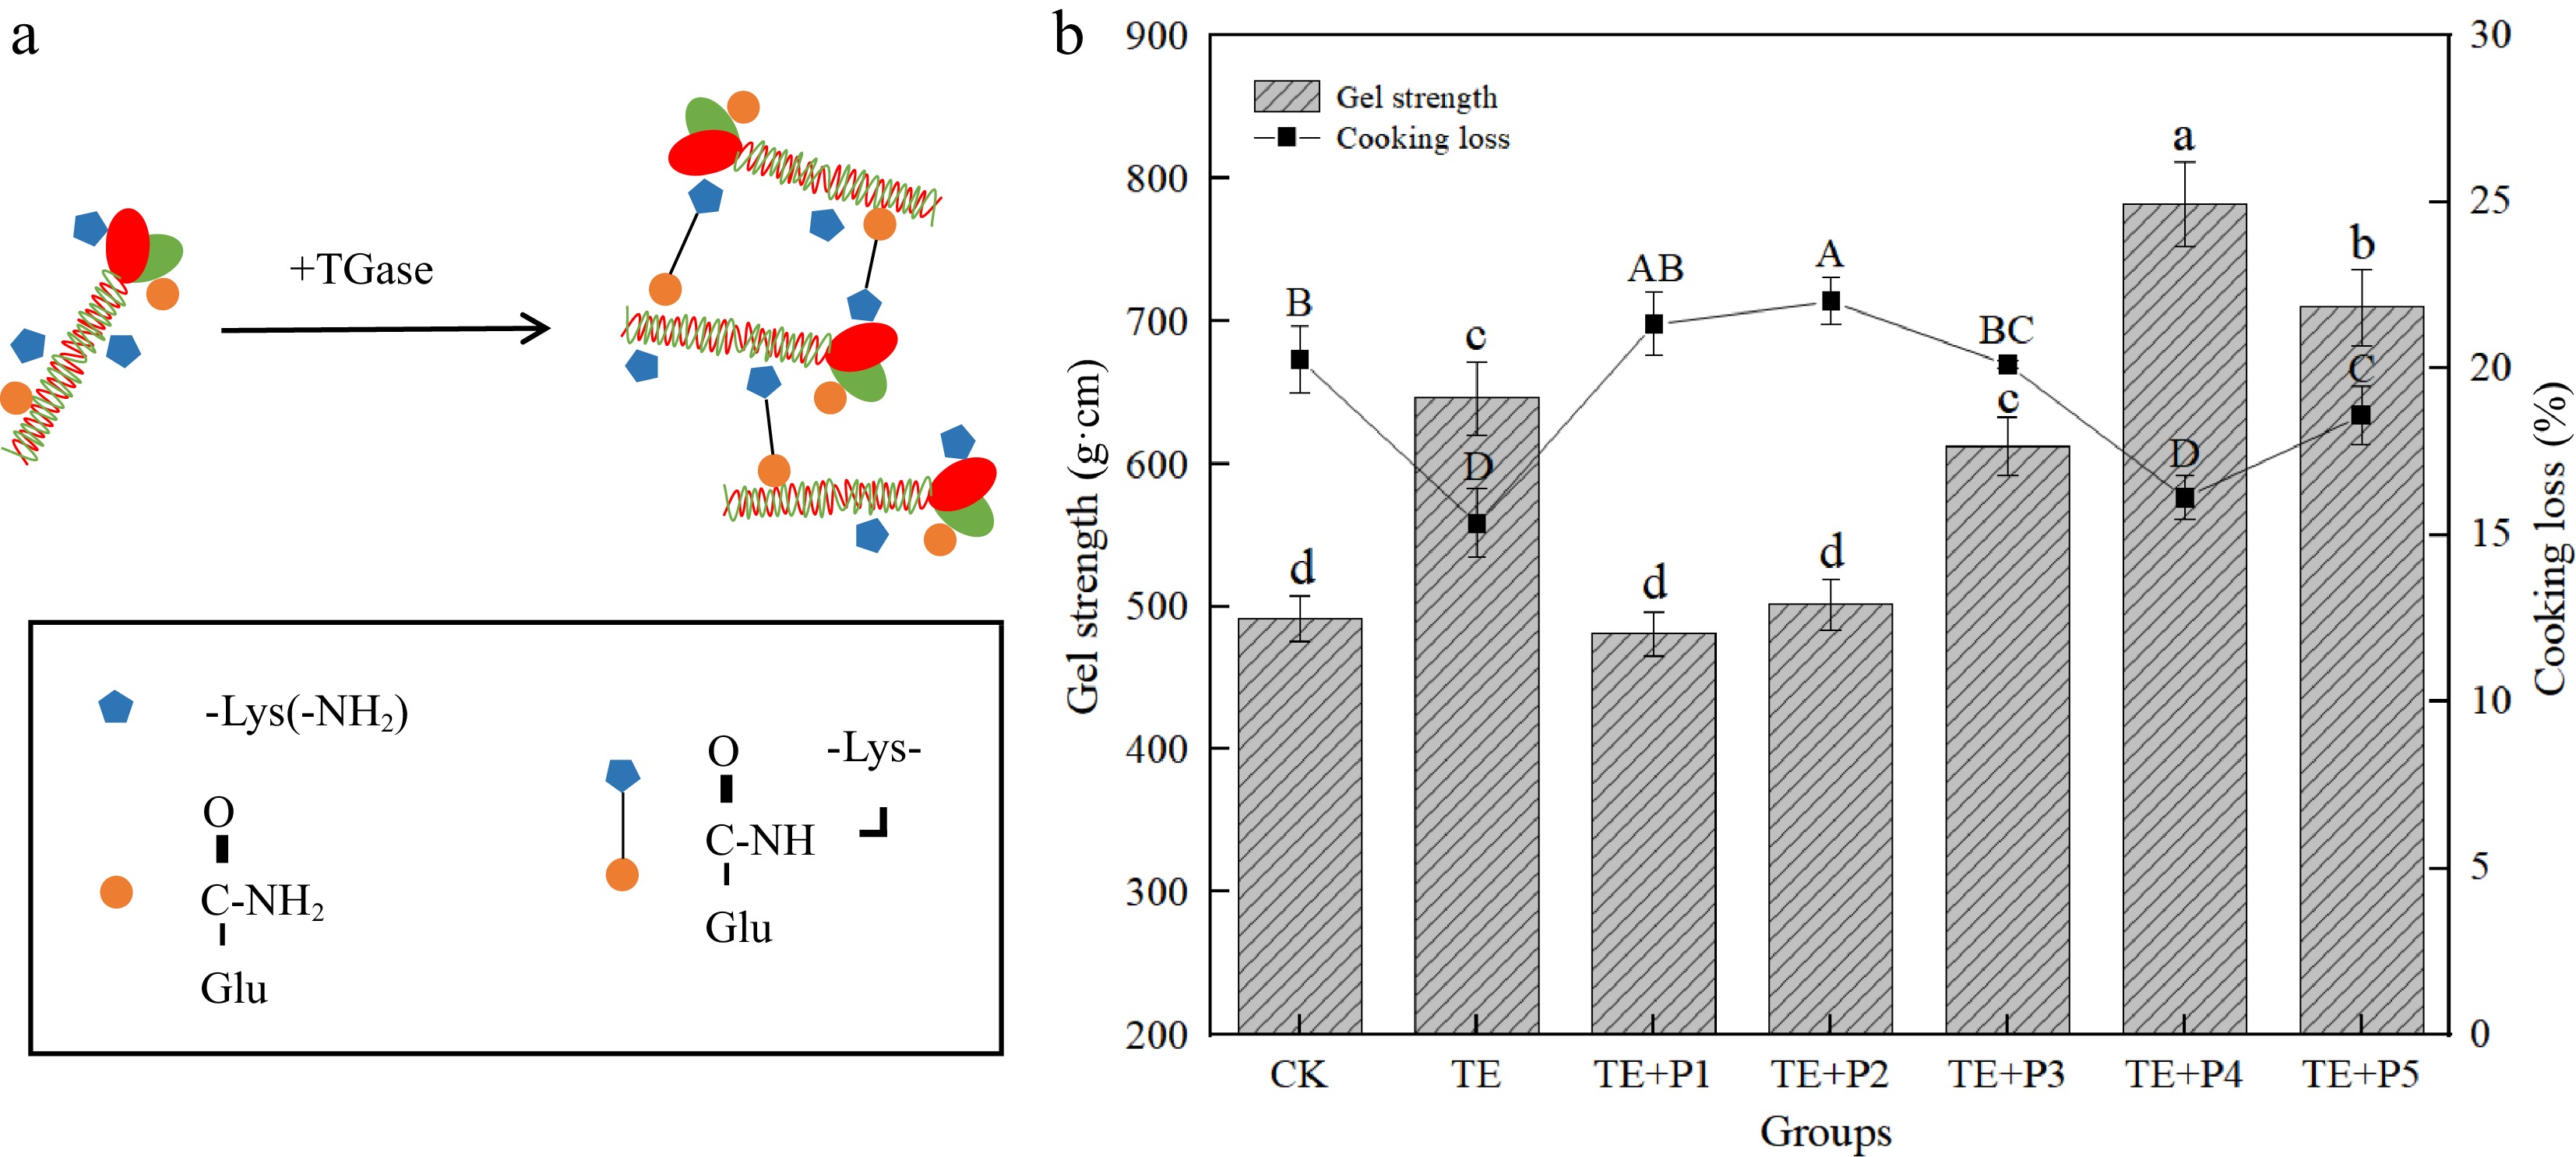
Figure 2.
(a) Catalytic reaction of glutamine transaminase and (b) effect of different treatments on gel strength and cooking loss of surimi gel. a−d/A−D: values with different lowercase letters indicate significant difference (p < 0.05).
On the basis of adding TGase, the strength of the mixed gel with ε-PL concentration ranging from 0.005% to 0.03% was lower than that of TE (Fig. 2b). It was speculated that the surimi sample with low concentration ε-PL was a fluid with lower viscosity, and the interaction between protein and water is strengthened, while the electrostatic interaction between proteins is further weakened[33]. This was also consistent with the change in rheological properties in Fig. 1a. Nevertheless, with the increase of ε-PL content to 0.04%, the gel strength of surimi gel significantly increased and reached the highest value (781.63 g·cm), which was about 21.03% higher than that of the TE group (p < 0.05) (Fig. 2b). The increase of gel strength in this process was obtained due to the following three possible reasons, (1) ε-PL is a cationic amino acid with positive charge, which can improve the pH value of protein or meat product system; (2) The interaction between the ε-amino group of ε-PL and the aromatic residue of protein, namely the cation-π interaction, can change the structure of meat protein[34]; (3) Protein (mixed surimi system) with high ε-amino group content, TGase has strong gel improving ability[35].
Such synergy (ε-PL = 0.04%), as a comprehensive result of different impactors, is that after the surimi was mixed under the optimal ratio conditions, the synthesis of TGase enzyme catalysis, pH value shift, changes in protein and amino acid composition, etc., increased the strength of various forces, thus forming a denser stereoscopic network structure. Note that when the content of ε-PL reached 0.06%, the gel strength of the corresponding surimi gel decreased by 10% compared with 0.04%. Similarly, others reported the result that alkaline amino acids led to the reduction of the strength of the myosin gel of bighead carp[36].
Textural properties of surimi gels
-
TPA, also known as whole texture, is a comprehensive parameter that determines the sensory quality of surimi gel, including hardness, elasticity, cohesion, chewiness, and resilience[37]. As shown in Table 2, the addition of TGase significantly improved the texture properties of surimi gel (p < 0.05), which is related to TGase's ability to induce surimi protein to form more ε-(γ-Glu)-Lys covalent bond during heating[38] (Fig. 2a). Compared with the cross-linking induced by TGase alone, the gel hardness of the mixed surimi gel treated with ε-PL showed a similar change to the gel strength (Fig. 2b). As the concentration of ε-PL increased from 0.005% to 0.04%, the hardness of surimi gel gradually increased until it reached the maximum (1,492.80 g). At the same time, we also observed that the elasticity, cohesion, and chewiness of the composite gel reached the highest values with the 0.04% ε-PL, and these were higher than those of the TGase-only group. Similar to the findings of Ali et al.[39], the author found that the combination of ε-PL and beetroot extract can effectively replace nitrite, which produced a marked effect in maintaining the color of Frankfurt sausage and improving the texture and performance. However, the data we collated above (Table 2) also showed a clear phenomenon, that is, the addition of ε-PL with lower concentration (0.005%−0.02%) or highest concentration (0.06%) was not conducive to the combination with TGase to improve the texture characteristics of mixed surimi gel.
Cooking loss of mixed surimi gels
-
Cooking loss indicates the water holding capacity of heated surimi, which usually represents the stability of the three-dimensional network structure of surimi gel[40]. The 0.4% TGase significantly reduced the cooking loss of surimi samples (p < 0.05), which was 4.91% lower than that of the control group (Fig. 2b). When the addition of PL (combined with TGase) gradually increased from 0.005% to 0.04%, the cooking loss of surimi showed a decreasing trend and reached the minimum at 0.04%. The ε-PL-added surimi gel samples had higher cooking loss compared with that of only with TGase. Most notably, this may be due to ε-PL is able to further exert the cross-linking effect of TGase. A similar finding was reported in the study by Ma et al.[22], adding ε-PL is able to improve the solubility of myofibrillar proteins. Proteins with high solubility are more easily induced by TGase during heating, which aggravates the cross-linking between ε-PL-protein or protein-protein and forms a disordered gel network structure with relatively weaker water-holding capacity.
Color of surimi gels
-
As shown in Table 3, the high lightness (L*), low yellowness (b*), and high whiteness of surimi in the control group were relatively low, with values of 72.49, 10.42, and 70.56 respectively. After TGase was added to induce cross-linking, these values increased significantly (p < 0.05), which may be related to the photochromic effect of water molecules released from gel matrix under TGase-induced surimi protein cross-linking reported in the previous study[41]. Furthermore, on the basis of adding TGase, it was interesting to see that the L* and whiteness values of surimi gel first increased and then gradually decreased with the increase in ε-PL concentration. The influence of ε-PL combined with TGase on the whiteness of gel can be attributed to three reasons: (1) The addition of ε-PL can effectively increase the substrate content of TGase, and promote the cross-linking between proteins, so as to obtain a much more compact surimi gel structure, which affects the refractive index of light; (2) The water retention performance of the high surimi gel was significantly improved with the addition of ε-PL[42] (Fig. 2b), at this time, the L* value (positively related to the whiteness) value showed a decreasing trend with the decrease of the surface free water content of the gel sample; (3) With the increase of ε-PL concentration, some colored substances, formed due to the accelerated Maillard reaction rate during the preparation of gel, may have an adverse effect on the improvement of gel whiteness[43]. After adding TGase to induce cross-linking, although the whiteness value of composite surimi was significantly enhanced, ε-PL was not enough to further improve the whiteness value of final mixed surimi gel, and high concentration so far as to have a negative impact on the whiteness value.
Table 3. Effect of different treatments on the color of surimi gels.
Groups L* a* b* Whiteness CK 72.49 ± 0.82e −0.92 ± 0.01e 10.42 ± 0.33d 70.56 ± 0.65d TE 77.82 ± 0.34ab −0.23 ± 0.02c 12.29 ± 0.29bc 74.64 ± 0.26ab TE + P1 78.39 ± 0.40a −0.14 ± 0.01a 12.46 ± 0.12ab 75.05 ± 0.41a TE + P2 78.42 ± 0.43a −0.17 ± 0.0b 12.46 ± 0.15ab 75.07 ± 0.32a TE + P3 77.48 ± 0.16b −0.18 ± 0.02b 12.37 ± 0.09abc 74.31 ± 0.11b TE + P4 76.34 ± 0.05c −0.22 ± 0.01c 12.73 ± 0.02a 73.13 ± 0.04c TE + P5 75.48 ± 0.18d −0.26 ± 0.01d 12.01 ± 0.14c 72.70 ± 0.19c Different lowercase letters in the same column indicated significant differences (p < 0.05). Changes in moisture distribution of surimi gels
-
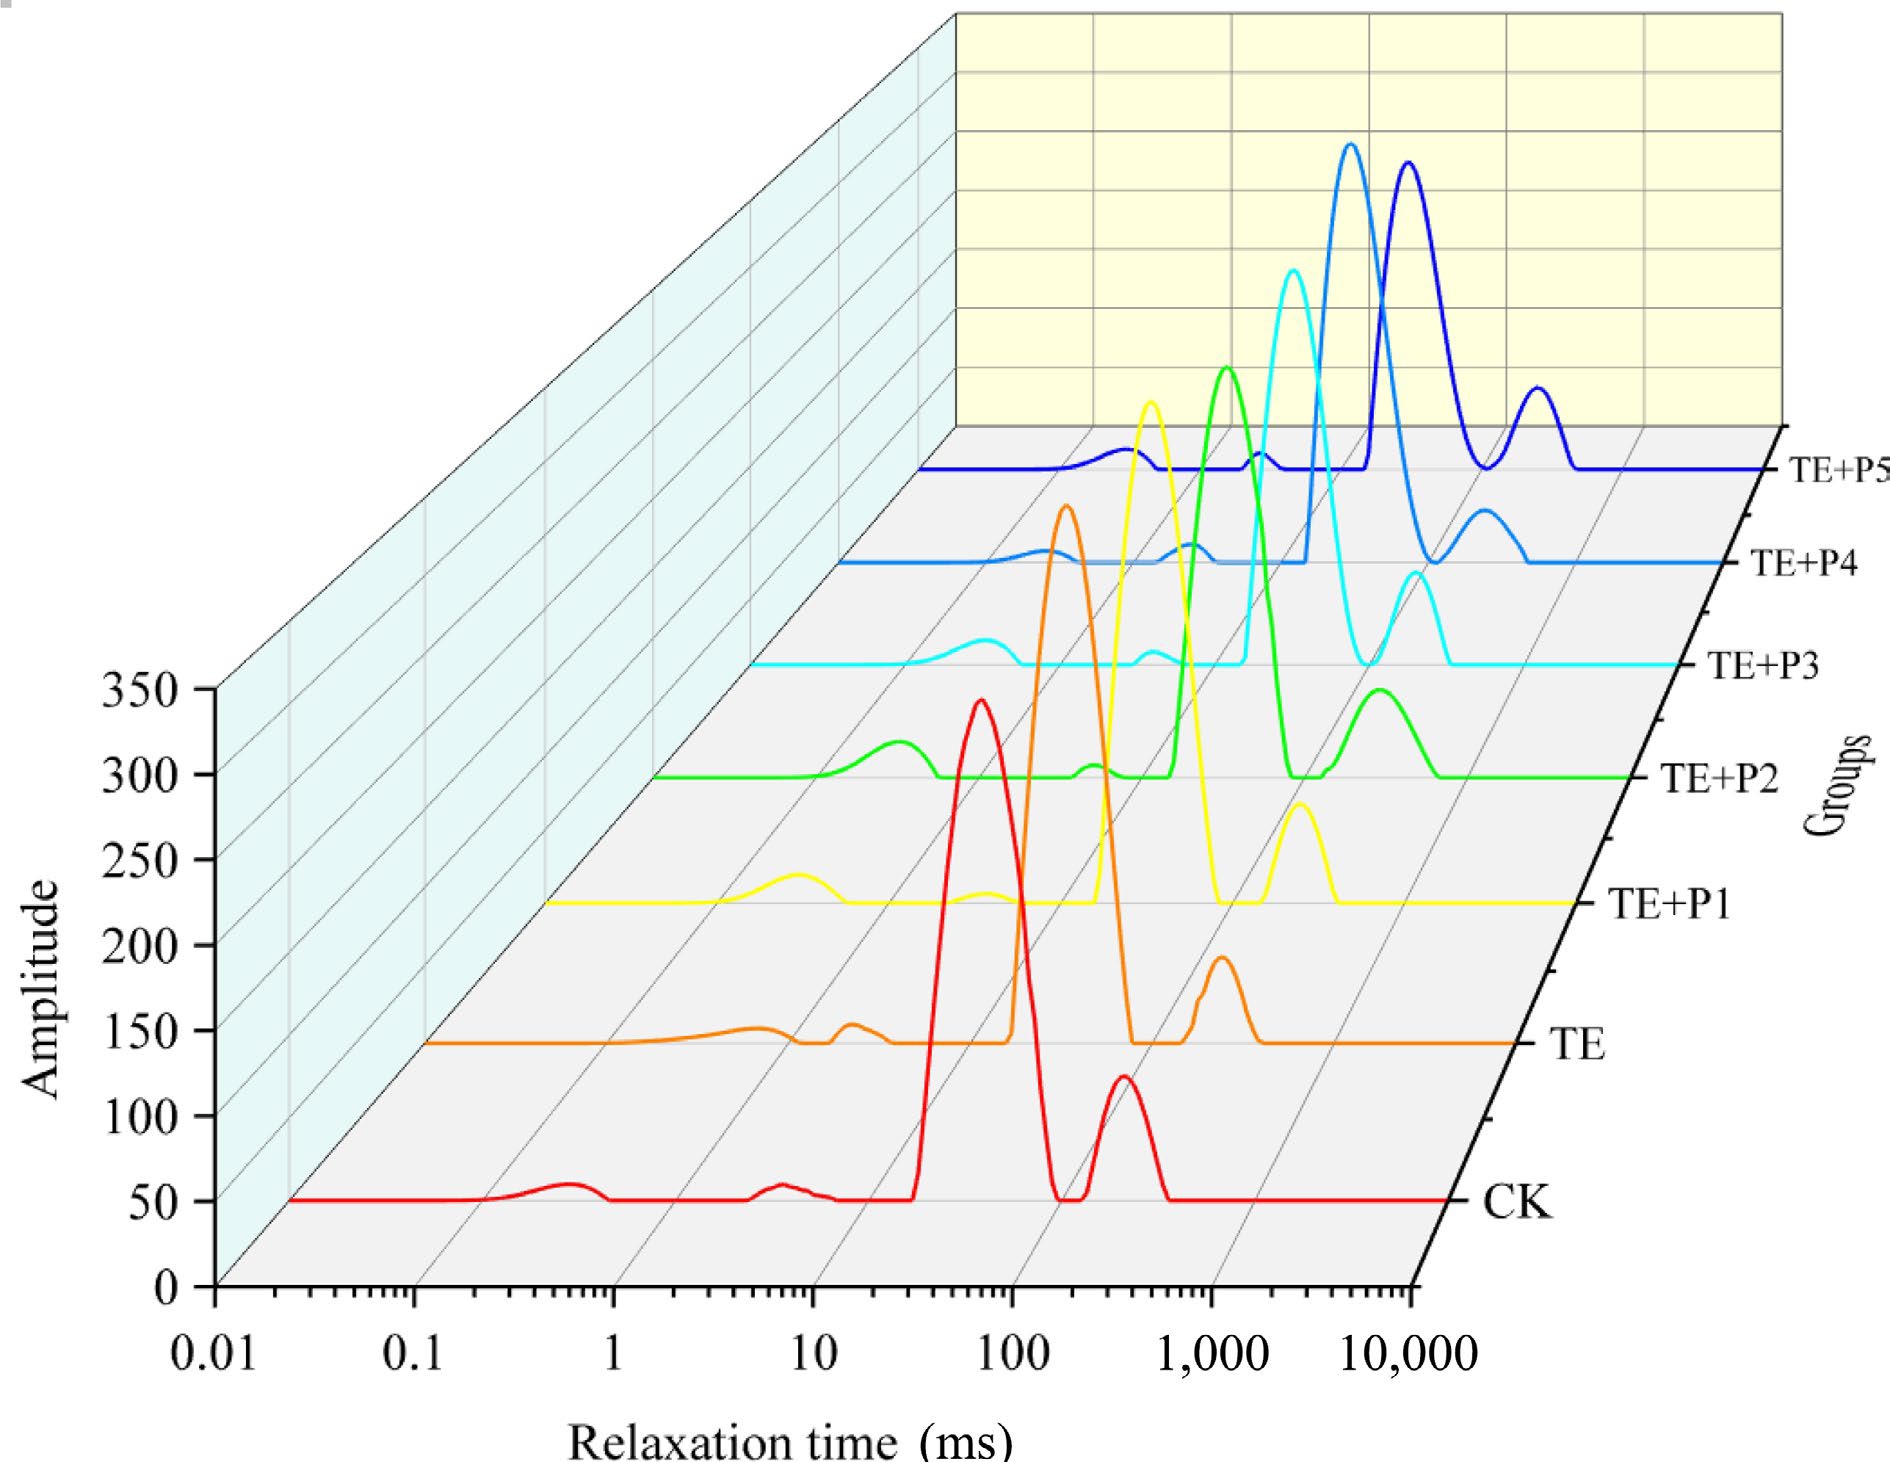
The water distribution in surimi gel products was measured by LF-NMR[44], and the results were inverted to obtain the transverse relaxation time (T2), which reflects the strength of water fluidity[45]. There are four fitted wave peaks which are assigned to four different water distribution states and wave peak ranges (Fig. 3, Table 4): strong bound water T21 (0.1−1 ms), weak bound water T22 (1−10 ms), non-flowing water T23 (10−100 ms) and free water T24 (100−1,000 ms)[46]. At the same time, similar characteristics (the main peak is centered on T23) are possessed by the water distribution of all surimi gel samples. The addition of TGase increased the proportion of non-flowing water, accompanying the significant decrease in the content of free water (p < 0.05), compared with the control group. It proved that the addition of TGase brought this phenomenon, namely the bound water in surimi gel was partially transferred to the non-flowing, which also indicated the reduction of cooking loss of surimi samples induced by TGase (Fig. 2). On the basis of adding TGase, the low level of ε-PL (0.005%, 0.01% and 0.02%) inhibited the transition of free water in surimi gel to non-flowing water, in which the proportion of T23 decreased by 2.05%, 2.74%, and 1.42% respectively compared with the surimi gel only with TGase, while T24 increased by 15.76%, 14.17%, and 4.43% respectively. The proportion of P23 in the surimi gel sample (ε-PL = 0.04%) was equivalent to that of the TE group, implying that the addition of appropriate ε-PL was not directly connected with the changes in water distribution in surimi after TGase-induced cross-linking, and slight addition would have a negative impact, which was unanimous with the above research results of cooking loss (Fig. 2a).
Table 4. Effect of different treatments on the transverse relaxation time T2 of surimi gel.
Groups P21 (%) P22 (%) P23 (%) P24 (%) CK 2.175 ± 0.186c 1.198 ± 0.012e 82.863 ± 0.691bc 13.764 ± 0.091a TE 1.938 ± 0.095d 2.166 ± 0.043a 85.144 ± 1.336a 10.752 ± 0.033e TE + P1 2.705 ± 0.067b 1.414 ± 0.009d 83.435 ± 1.616b 12.446 ± 0.105c TE + P2 3.005 ± 0.003a 1.845 ± 0.056b 82.874 ± 1.739bc 12.276 ± 0.108c TE + P3 3.107 ± 0.063a 1.715 ± 0.033c 83.950 ± 1.587ab 11.228 ± 0.086d TE + P4 1.770 ± 0.018d 2.099 ± 0.059a 85.021 ± 1.756a 11.110 ± 0.144d TE + P5 3.121 ± 0.007a 1.758 ± 0.107bc 82.136 ± 1.091c 12.985 ± 0.018b Different lowercase letters in the same column indicated significant differences (p < 0.05). Scanning electron microscopy of surimi gels
-
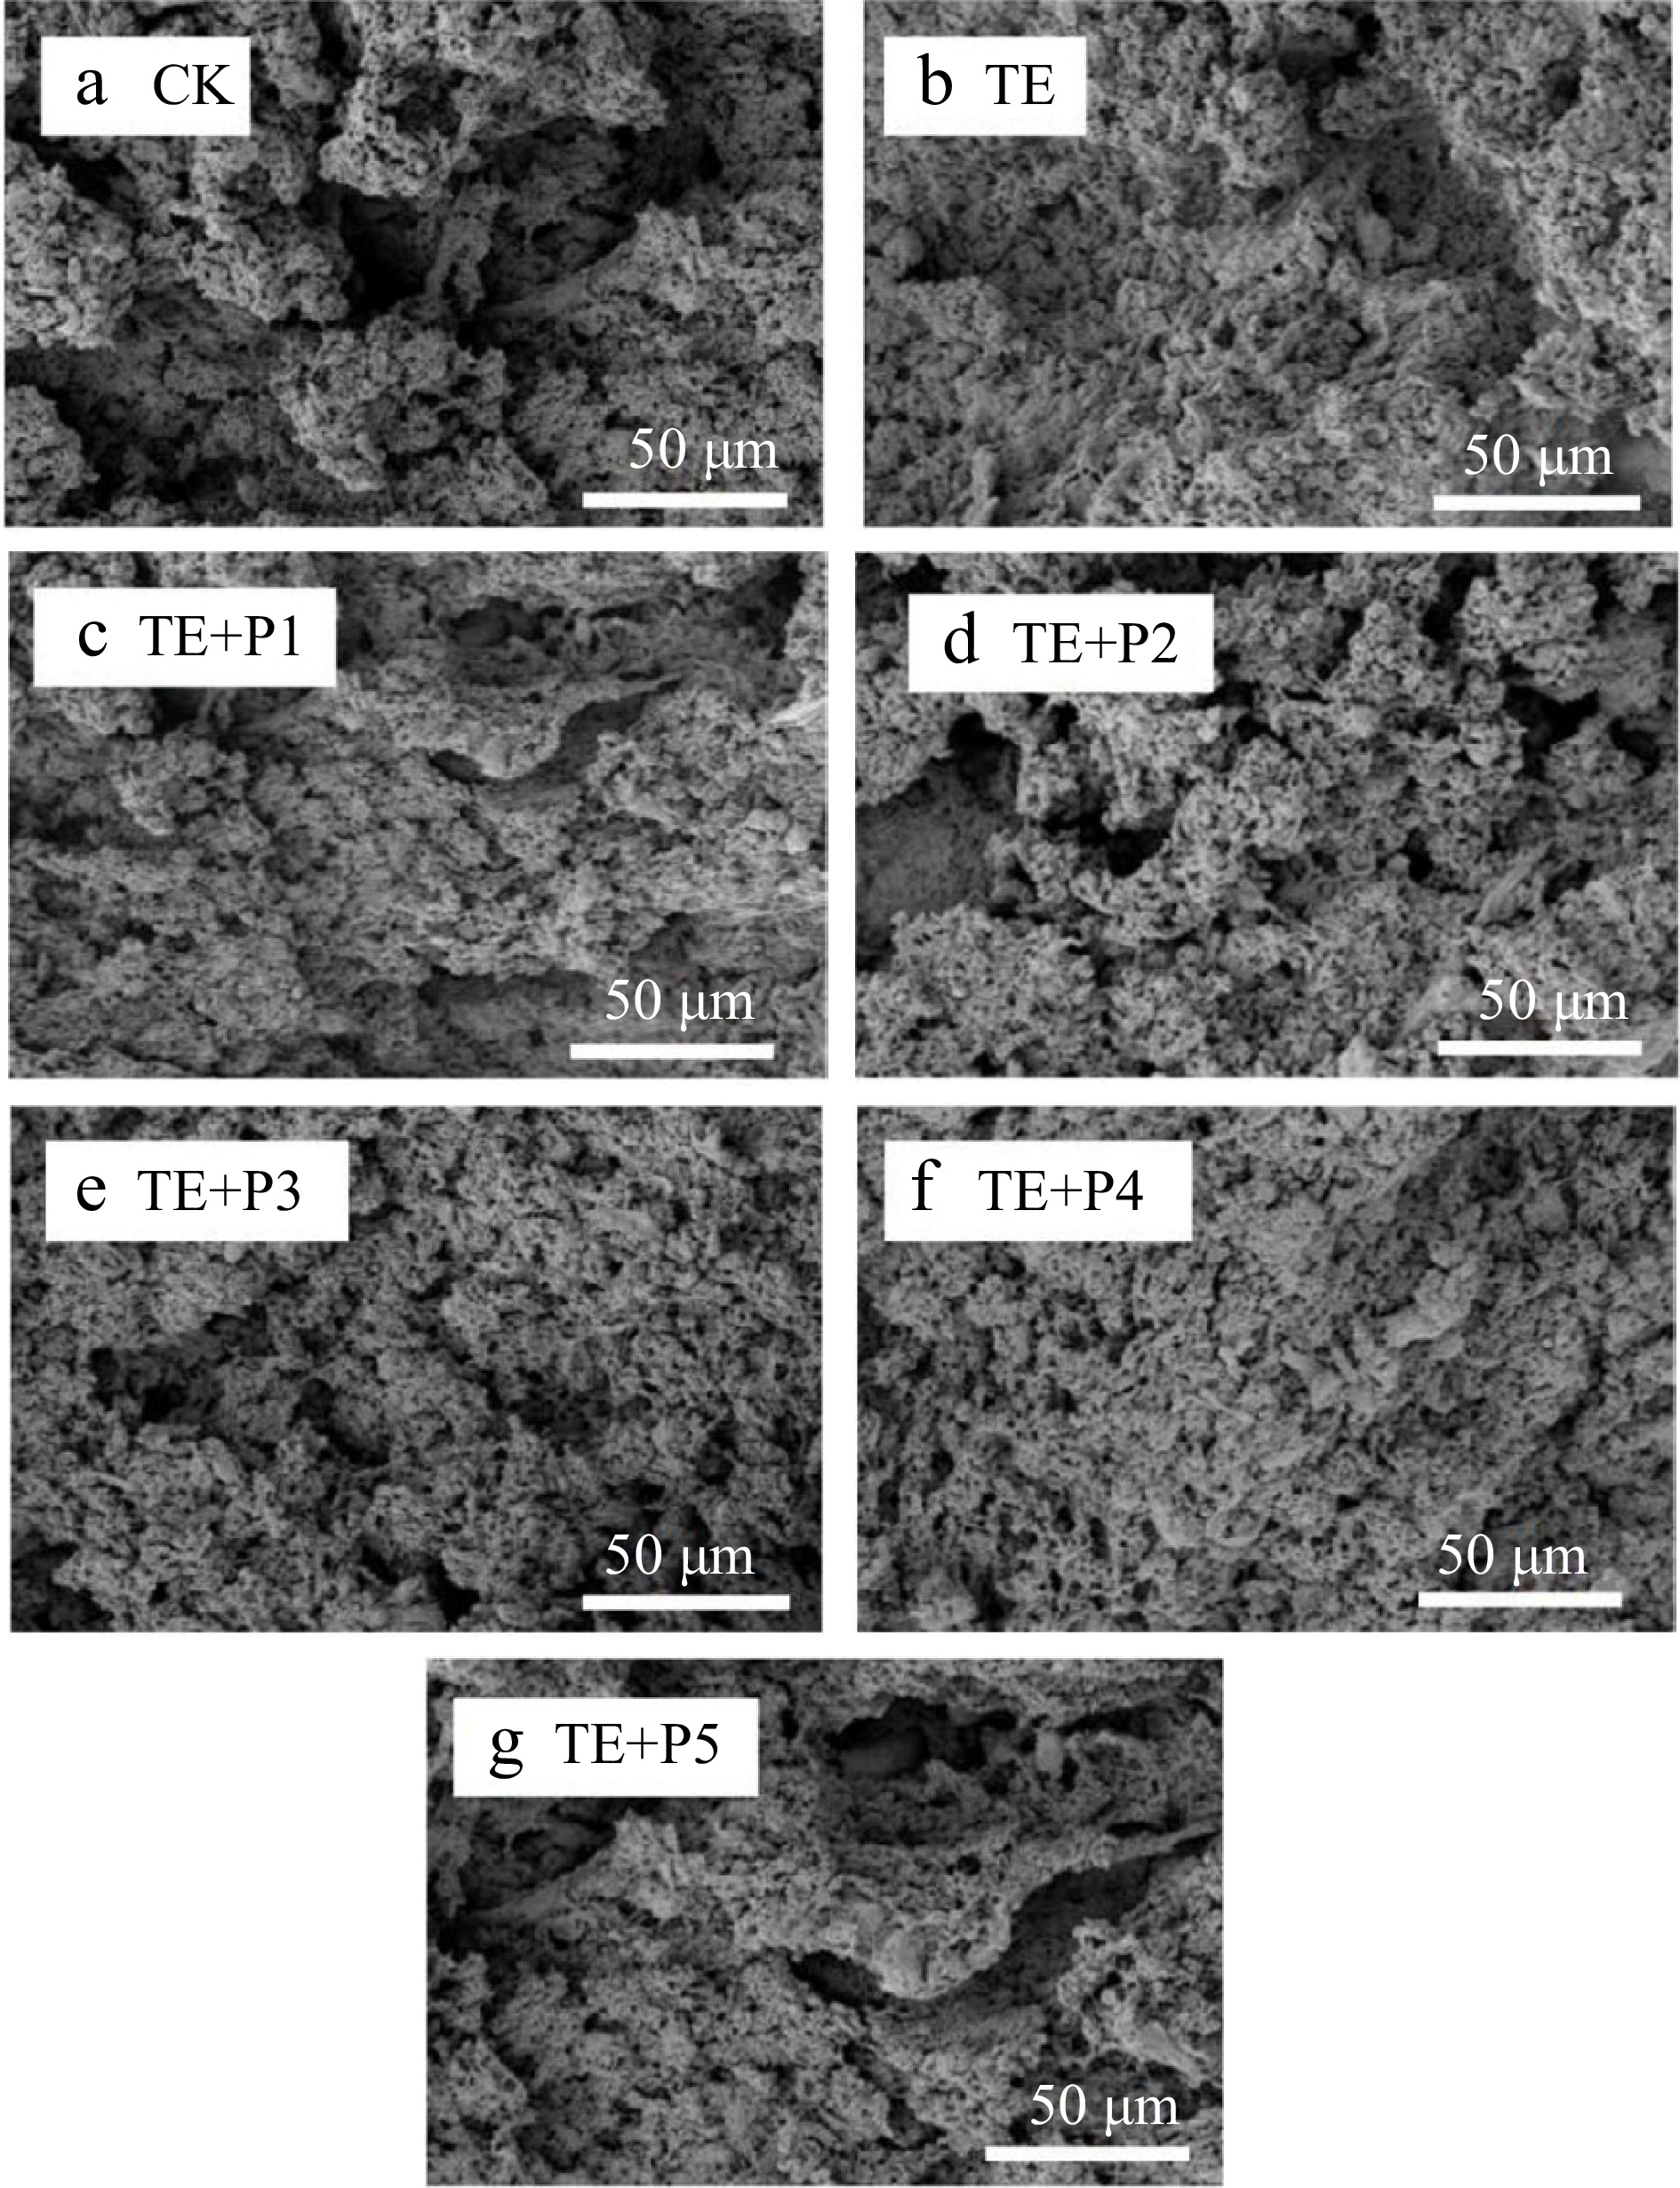
The effect of different treatment methods on the microstructure of surimi gel was observed by SEM. As shown in Fig. 4, the microstructure of the control surimi gel (Fig. 4a) was observed to be enormously loose, uneven, and irregular, with large pores, which explained the reason why the control surimi gel had low strength and large cooking loss (Fig. 2b). In addition, the morphological properties of another group of surimi gel (TGase-induced) are appreciably different from the scanning electron micrograph mentioned above (Fig. 4b). Numerous compact and evenly distributed small pores were observed, instead of the loose structure in the control sample, which accounted for the fact that TGase could interact with proteins to form a more uniform and orderly three-dimensional network structure in the process of gel formation[47]. Moreover, similar findings were also reported in the previous studies of Dong et al.[26]. When treated with TGase and ε-PL (from 0.05% to 0.04%), the surface of the surimi gel sample gradually became flat through observation (Fig. 4f). We found that some smaller pores were formed and some larger pores were slightly supplemented visually. Remarkably, when the addition of ε-PL increased to 0.06% (Fig. 4g), the structure of surimi gel was not as uniform as before, and some large and irregular holes appeared obviously. This phenomenon might be related to moderate ε-PL, especially 0.02%, which can promote the cross-linking of TGase with protein and the aggregation/denaturation of different components, which agreed with the change of coagulation strength of surimi samples.
Thiobarbituric acid-reactive substances (TBARS) determination
-
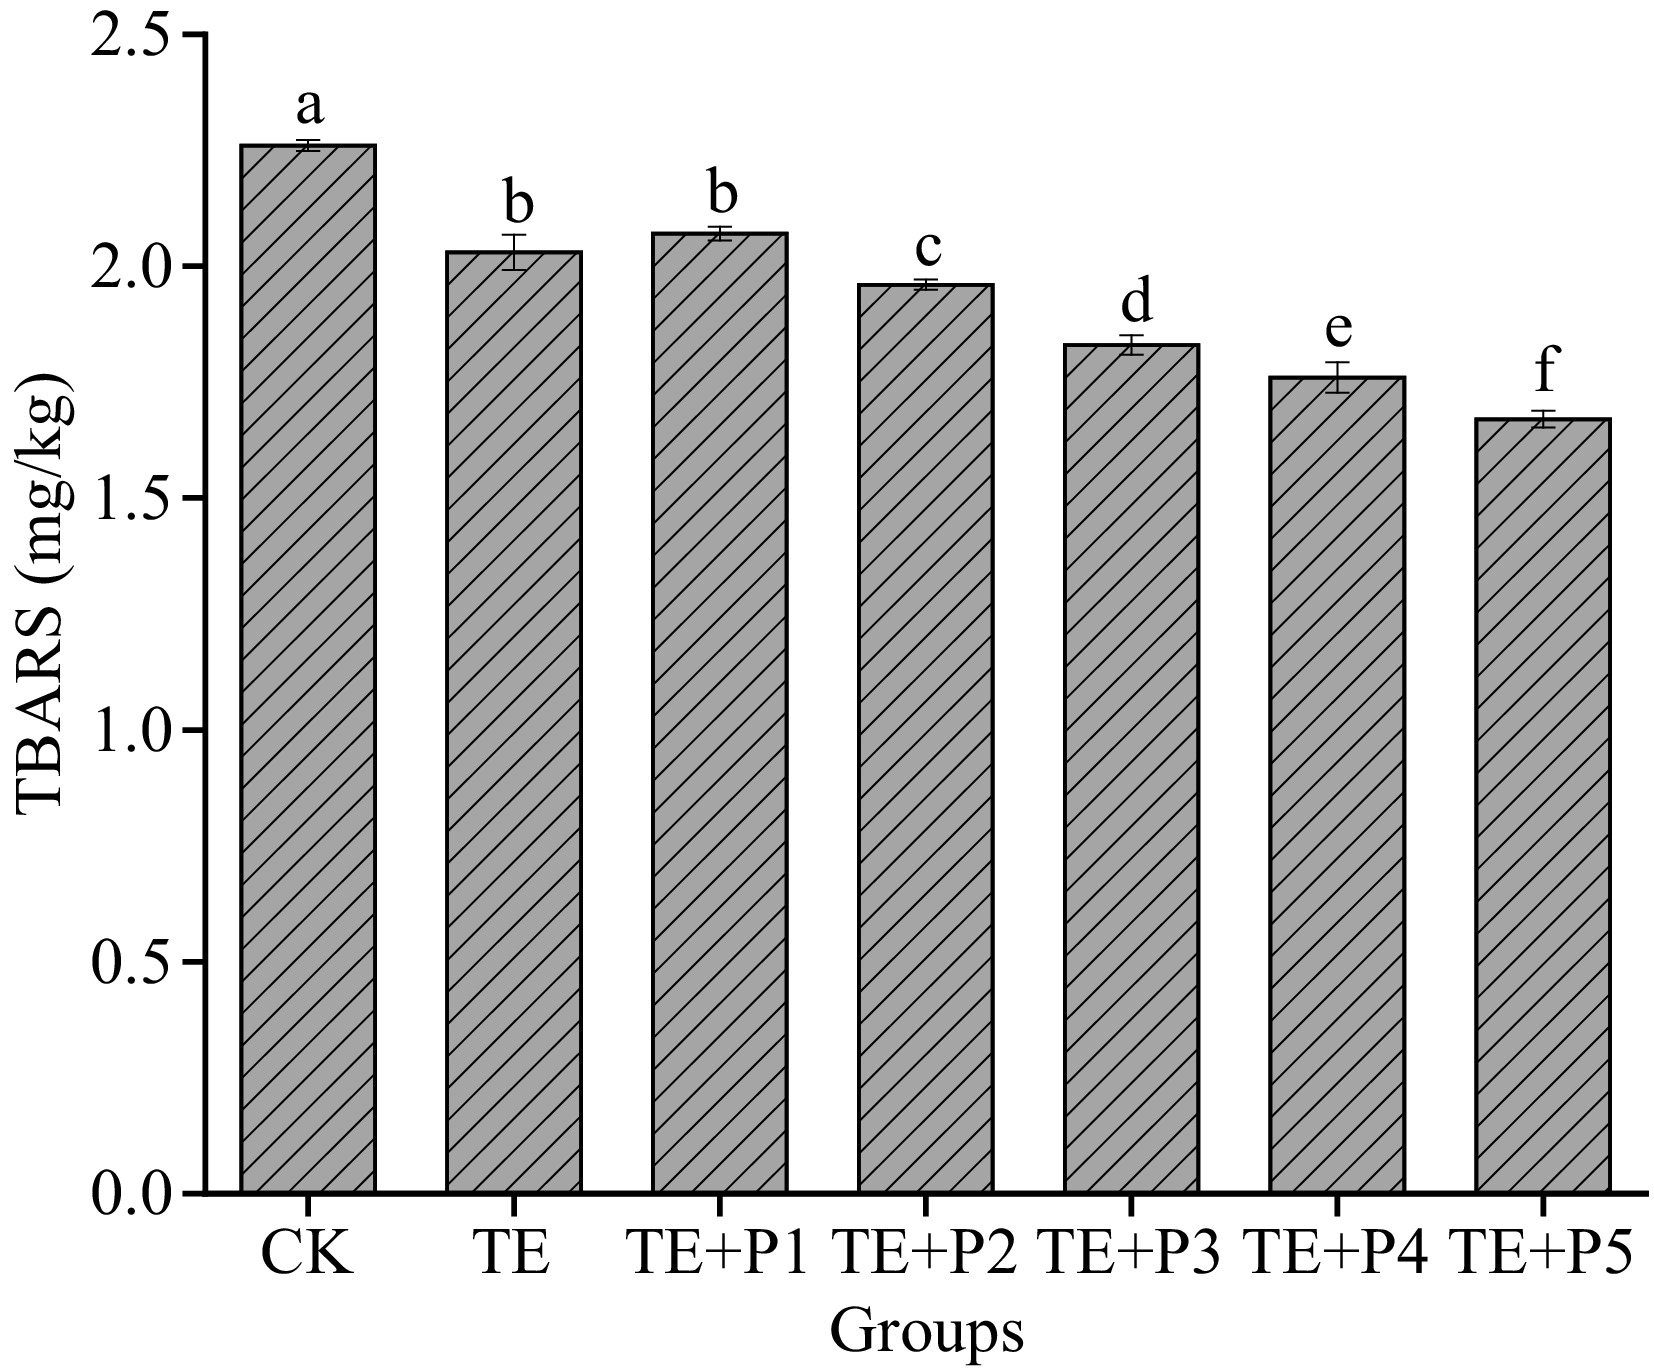
TBARS value, which can reflect the degree of lipid oxidation and rancidity of surimi, is an important indicator for the occurrence of oxidation[48]. Some substances in surimi, such as unsaturated fatty acids, will inevitably undergo oxidative decomposition to produce a large amount of malondialdehyde (MDA), the latter reacts easily with thiobarbituric acid (TBA) reagent to produce red compounds with maximum absorbance at 532 nm. As illustrated in Fig. 5, when TGase and a certain amount of PL (from 0.005% to 0.06%) were added, the TBARs value of surimi gels decreased to 2.03 and 1.67 mg/kg respectively, compared with the control group (2.26 mg/kg). This shows that the addition of both can significantly reduce the TBARS value of surimi gel (p < 0.05), considered to be a cue for the fat oxidation of surimi being inhibited. In addition, we also found that the antioxidant effect of PL was dose-dependent. The ε-PL can be chelated by ferrous ions along with the ability to scavenge free radicals like hydroxyl radicals, ensuring its antioxidant properties[33]. The ε-PL was prospectively considered as an antioxidant additive to prevent surimi protein from deteriorating induced by oxidation[49]. Similarly, making use of lysine or ε-PL as antioxidants in plant protein and meat protein has been widely reported[33, 50]. Fan et al.[42] confirmed that ε-PL addition has a significant effect on maintaining a high total phenolic content and vitamin C levels in fresh lettuce, which also shows that it has certain antioxidant activity.
-
The addition of ε-PL at different concentrations had an apparent impact on the characteristics of TGase-induced mixed surimi gel, accompanied by the following situations: The 0.04% ε-PL provided a synergistic effect to promote the aggregation and crosslinking of surimi proteins induced by TGase; The rheology, LF-NMR and SEM results showed that the appropriate concentration (0.04%) of ε-PL apparently enhanced the initial apparent viscosity and elasticity of surimi samples, which was conducive to the formation of a more dense and uniform three-dimensional network structure, further limiting the flow of water in surimi and the exudation of hydrophilic substances; Simultaneously, the network strength was strengthened along with the texture properties of the mixed surimi gel. Furthermore, ε-PL had a strong ability to inhibit lipid oxidation in mixed surimi gel, showing a concentration dependence. When the content of ε-PL ran to lowest (0.005%−0.01%) or highest (0.6%), the improvement of the quality of surimi mixed gel was opposite to the above. The results show that ε-PL can be perceived as a prospective polyfunctional food additive to improve the texture properties, nutritional advantages, and product stability of surimi products.
This work was financially supported by the Natural Science Basic Research Program of Shaanxi (No. 2023-JC-YB-146), the fund of Cultivation Project of Double First-Class Disciplines of Food Science and Engineering, Beijing Technology & Business University (No. BTBUKF202215), the Innovation Capability Support Plan of Shaanxi (No. 2023WGZJ-YB-27), the Agricultural Technology Research and Development Project of Xi'an Science and Technology Bureau (No. 22NYYF057), and Jiangsu Yiming Biological Technology Co., Ltd. in China.
-
The authors confirm contribution to the paper as follows: study conception and design: Cao Y, Xiong YL, Yuan F, Liang G; data collection: Liang G, Cao Y, Li Z, Liu M; analysis and interpretation of results: Li Z, Cao Y, Liang G, Liu Z, Liu M; draft manuscript preparation: Li Z, Cao Y, Liu ZL. All authors reviewed the results and approved the final version of the manuscript.
-
The datasets generated during and/or analyzed during the current study are available from the corresponding author on reasonable request.
-
The authors declare that they have no conflict of interest.
-
# Authors contributed equally: Zhaorui Li, Guangcan Liang
- Copyright: © 2024 by the author(s). Published by Maximum Academic Press on behalf of Nanjing Agricultural University. This article is an open access article distributed under Creative Commons Attribution License (CC BY 4.0), visit https://creativecommons.org/licenses/by/4.0/.
-
About this article
Cite this article
Li Z, Liang G, Cao Y, Yuan F, Liu M, et al. 2024. Role of ε-Poly-lysine in mixed surimi gel: concentration, underlying mechanism, and application. Food Materials Research 4: e010 doi: 10.48130/fmr-0024-0001
Role of ε-Poly-lysine in mixed surimi gel: concentration, underlying mechanism, and application
- Received: 18 November 2023
- Revised: 24 December 2023
- Accepted: 27 December 2023
- Published online: 01 March 2024
Abstract: The effects of different concentrations of ε-Poly-lysine (ε-PL: 0.005%, 0.01%, 0.02%, 0.04%, and 0.06%) on the marine fish-egg white protein compound gels, treated with 0.4% TGase induced cross-linking were systematically investigated under low salt and phosphorus-free conditions (0.5% NaCl). The results showed the combination of ε-PL and TGase had a synergistic effect on improving sectional gel properties of composite surimi samples. Wherein the rheological, LF-NMR, and SEM results confirmed that the addition of ε-PL based on 0.4% TGase significantly improved the gel strength (to the highest value: 781.63 g·cm), apparent viscosity, and G 'value of the composite surimi sample, as well as reduced the internal water fluidity of surimi, accompanied by the emergence of a more dense and uniform gel network structure. Notably, ε-PL treatment significantly inhibited fat oxidation in the compound surimi gel and the degree of inhibition was proportional to its addition (decreased from 2.03 to 1.67 mg·kg−1). However, the addition of a small amount (0.005%) or an excessive amount (0.06%) of ε-PL on the gel properties of composite surimi samples witnessed the negative effects of the changes in the internal water distribution state and the cooking loss. To sum up, moderate ε-PL (0.04%) treatment combined with TGase induction can maximize the performance of mixed surimi gel and inhibit fat oxidation. The research results supply a diverse perspective and theoretical basis for the development of 'low salt and no phosphorus' surimi product ingredients.
-
Key words:
- Marine fish surimi /
- Gelling properties /
- ε-Poly-lysine /
- Transglutaminase


