ARTICLE   Open Access    

Exploring the metabolic and flavoromic variations of germinated sunflower seed during roasting conditions

More Information
  • The metabolite and flavor characteristics of roasted germinated sunflower seeds (RGSF) were evaluated and compared with those of roasted ungerminated sunflower seeds (RUSF) by gas chromatograph-flame ionization detector (GC-FID) and headspace solid phase microextraction combined with gas chromatography-mass spectrometry (HS-SPME-GC-MS). During roasting, α-tocopherol, β-sitosterol, fructose, and glucose content were higher at 125 °C compared to those at 135 and 145 °C in RGSF, and lower reductions of alanine, glycine, phenylalanine, serine, asparagine, and γ-aminobutyric acid (GABA) content at 125 °C in RGSF. Considering their nutritional value, it is suggested that sunflower seeds are roasted at 125 °C. The dominant volatile compounds in RGSF were α-pinene, furfural, pyrazines, 1-octen-3-ol, and 2-methylbutanal. High-temperature heating for long term led to a large accumulation of unpleasant odors like pyridine, hexanal and nonanal, especially in RUSF. To examine the distribution of the individual metabolites and flavor compounds among different roasting conditions. A heatmap diagram combined with agglomerative hierarchical clustering (AHC) analysis and principal component analysis (PCA) showed that most Maillard reaction substitutes (amino acids and reducing sugars), products (2-methylpyrazine 2-ethyl-3,5-dimethyl-pyrazine, and 3-ethyl-2,5-dimethylpyrazine), and Strecker degradation products (3-methylbutanal, 2-methylbutanal, and isobutanal) contributed to separate RGSF from RUSF.
  • Agricultural management practices impact soil physicochemical properties to a remarkable extent. Degradation of soil health has led to a contraction in agricultural production and soil biodiversity particularly due to conventional farming practices, indiscriminate use of inorganic fertilizers (INF) and inadequate input of residues[1]. Organic or inorganic fertilizers have been regarded as a critical component of agriculture to accomplish global food security goals[2]. The exogenous supply of fertilizers could easily alter soil properties by restoring the nutrients that have been absorbed by the plants[2]. Thus, implementing adequate nutrient management strategies could boost plant yield and sustain plant health. Tillage affects the soil, especially for crop production and consequently affects the agro-ecosystem functions. This involves the mechanical manipulation of the soil to modify soil attributes like soil water retention, evapotranspiration, and infiltration processes for better crop production. Thus, tillage practices coupled with fertilizer inputs may prove a viable strategy to improve soil health components such as nutrient status, biodiversity, and organic carbon.

    Soil serves as a major reservoir of nutrients for sustainable crop production. Intensive cultivation due to growing population burden has led to the decline of soil nutrient status that has adversely affected agricultural production. Various researchers have assessed the soil nutrient budget and the reasons behind decline of nutrient content in soil[3]. Soil management strategies have assisted in overcoming this problem to a greater extent. Tillage practices redistribute soil fertility and improve plant available nutrient content due to soil perturbations[4]. Different tillage and fertilization practices alter soil nutrient cycling over time[5]. Fertilization is an important agricultural practice which is known to increase nutrient availability in soil as well as plants[6]. A report has been compiled by Srivastava et al.[7], which assessed the effectiveness of different fertilizers on soil nutrient status in Indian soils.

    Soil biota has a vital role in the self-regulating functions of the soil to maintain soil quality which might reduce the reliance on anthropogenic activities. Soil microbial activities are sensitive to slight modifications in soil properties and could be used as an index of soil health[8]. Maintenance of microbial activity is essential for soil resilience as they influence a diverse range of parameters and activities including soil structure formation, soil SOM degradation, bio-geochemical cycling of nutrients etc.[9]. Various researchers have identified microbial parameters like microbial biomass carbon (MBC), potentially mineralizable nitrogen (PMN), soil respiration, microbial biomass nitrogen (MBN), and earthworm population as potential predictors of soil quality. Geisseler & Scow[10] have compiled a review on the affirmative influence of long-term mineral fertilization on the soil microbial community.

    Being the largest terrestrial carbon (C) reservoir, soil organic carbon (SOC) plays a significant role in agricultural productivity, soil quality, and climate change mitigation[11]. Manure addition, either solely or along with INF augments SOC content which helps in the maintenance and restoration of SOM more effectively as compared to the addition of INF alone[12]. Enhancement of recalcitrant and labile pools of SOC could be obtained through long-term manure application accentuating the necessity of continuous organic amendments for building up C and maintaining its stability[13]. Generally, compared with manure addition, INF application is relatively less capable of raising SOC and its labile fractions[14]. Alteration in SOC content because of management strategies and/or degradation or restoring processes is more prominent in the labile fraction of soil C[15]. Several fractions of soil C play vital roles in food web and nutrient cycles in soils besides influencing many biological properties of soil[16]. Thus, monitoring the response of SOC and its fractions to various management practices is of utmost importance.

    A positive impact on SOC under manure application coupled with INF in rice-wheat systems has been reported, as compared to sole applications of INFs[17]. Although ploughing and other mechanical disturbances in intensive farming cause rapid OM breakdown and SOC loss[18], additional carbon input into the soil through manure addition and rational fertilization increases carbon content[13]. Wei et al.[19] in light sandy loam soil of China found that the inclusion of crop straw together with inorganic N, P and K fertilizers showed better results for improving soil fertility over sole use of inorganic fertilizers. Zhu et al.[20] studied the influence of soil C through wheat straw, farmyard manure (FYM), green manure, and rice straw on plant growth, yield, and various soil properties and found that the recycling of SOM under intensive cultivation is completely reliant on net OM input and biomass inclusion. However, most of the studies on residue management and organically managed systems could not provide clear views regarding the relations between the quality of OM inputs and biological responses towards it. The disintegration of soil aggregates due to ploughing, use of heavy machinery, and residue removal has been reported widely under conventional tillage (CT) practices[21]. On the contrary, improvement in SOC stabilization has also been observed by some scientists[22]. Under CT, the disintegration of macro-aggregates into micro-aggregates is a prominent phenomenon, while conservation tillage has been identified as a useful practice for increasing macro-aggregates as well as carbon sequestration in agricultural soils[23]. By and large, the ploughing depth (0–20 cm) is taken into consideration for evaluating the impact of tillage and straw retention on soil aggregation[24], while degradation in deeper layers of soil is becoming a major constraint towards soil quality together with crop yield[25].

    Hence, the present review would be useful in determining how tillage practices and inorganic and organic fertilization impact nutrient availability in the soil, microbial composition and SOC fractions besides stocks under different land uses.

    Agricultural production is greatly influenced by nutrient availability and thus nutrient management is required for sustaining higher yields of crop. The term 'nutrient availability' refers to the quantity of nutrients in chemical forms accessible to plant roots or compounds likely to be converted to such forms throughout the growing season in lieu of the total amount of nutrients in the soil. For optimum growth, different crops require specifically designed nutrient ratios. Plants need macronutrients [nitrogen (N), phosphorus (P), potassium (K) in higher concentrations], secondary nutrients [calcium (Ca), magnesium (Mg), sulphur (S) in moderate amounts as compared to macronutrients] and Micronutrients [Zn (zinc), Fe (iron), Cu (copper), B (boron), Mn (manganese), Mo (molybdenum) in smaller amounts] for sustainable growth and production[26]. Fertilizers assist the monitoring of soil nutrient levels by direct addition of required nutrients into the soil through different sources and tillage practices may alter the concentration of available plant nutrients through soil perturbations. Various studies on the influence of fertilization and tillage practices on available plant nutrients have been discussed below.

    Yue et al.[27] reported that long-term fertilization through manure/INF improved the macronutrient content of Ultisol soil in China. Two doses of NPK (2NPK) considerably improved soil properties over a single dose (NPK). Combined application (NPK + OM) resulted in higher hydrolysable N and available P over the sole OM application. The total K content was higher under the treatments NPK, 2NPK and NPK + OM than sole OM treatment, whereas available K was higher in treatments NPK + OM and 2NPK over the sole OM and NPK. Likewise, OM, INF, and OM + INF were evaluated for their potential to regulate the soil macronutrient dynamics. Organic manure significantly improved the soil N content, whereas INF showed comparable results to that of the control treatment. Besides, all the treatments improved available P and exchangeable K concentration[28].

    Hasnain et al.[29] performed comparative studies of different ratios of INF + compost and different application times for the chemical N fertilizer on silty loamy soils of China. The available nitrogen and phosphorous content were greater in conjoint OM + INF application over the bare INF and control application irrespective of N application time. Soil quality substantially improved with increasing ratio of compost and 70:30 (INF to compost ratio) was found to be most suitable to maintain soil fertility and nutrient status. Another study by Liu et al.[30] reported the superior effects of NPK + pig manure and NPK + straw to improve soil available P and K over the control and sole NPK treatments. However, total N concentration did not exhibit any significant variation under any treatment.

    Shang et al.[31] accounted the positive impact of vermicompost and mushroom residue application on grassland soil fertility in China. The addition of organic manures improved available P and K content to a considerable extent. Under moisture-deficit winter wheat-fallow rotation, another study quantified the influence of residue management approaches and fertilizer rate on nutrient accrual. Residue burning resulted in no decline in soil macronutrient content, whereas the perpetual addition of FYM for 84 years significantly improved total N and extractable K and P concentration. Thus, residue incorporation along with FYM application may prove beneficial in reducing the temporal macronutrient decline[32].

    Ge et al.[33] examined the effects of NPK and NPK along with manure (NPKM) addition on the macronutrient status of Hapli-Udic Cambisol soil. The NPKM application resulted in the highest increase in total N, available-P and K concentration as compared to NPK and control. Likewise, mineral fertilization reduction and partial substitution with organic amendments have posed a significant influence on soil macronutrient status. Soil available P and K decreased after INF reduction[34]. Chen et al.[35] evinced that integrated application of manure and mineral fertilizers to red clay soil (typical Ultisols) improved hydrolyzed nitrogen and available P due to an increase in the decomposition of organic matter (OM) and N bio-fixation than sole mineral fertilizers and control.

    A long-term experiment was carried out out by Shiwakoti et al.[36] to ascertain the influence of N fertilization and tillage on macronutrient dynamics in soil. Nitrogen fertilization produced higher crop biomass which might have improved total N and P concentration in soil. Moreover, the reduced interaction between soil colloids and residue or greater cation exchange sites due to tillage practices could have augmented K concentration in 0−10 cm soil depth. Likewise, among tillage systems combined organic (poultry manure) and inorganic (lime and fertilizers) fertilization, no-tillage, and reduced tillage with organic fertilization resulted in higher availability of P owing to minimal disturbance of soil which decreases contact surface between phosphate ions and adsorption sites. Greater losses of K in runoff water under NT resulted in lower K availability under NT than CT[37].

    The influence of tillage systems on soil nutrient dynamics showed that minimal soil disturbances under zero tillage prohibited redistribution of soil nutrients and resulted in the highest available N, P, and K in the surface soil[38]. The influence of tillage timing on soil macronutrient status has also been assessed under tillage treatments that are fall tillage (FT), spring tillage (ST), no tillage (NT), and disk/chisel tillage (DT/CT) on mixed mesic Typic Haploxerolls soil. All the tillage systems differed in the quantity of residues generated. Thus, variation in the decomposition of crop residue and mineralization of SOM resulted in variable rates of nutrient release. The FT and ST had the highest N content over DT/CT and NT systems at corresponding depth. The N content also decreased with soil depth irrespective of tillage treatment. The available P and extractable K were highest under NT at the top 10 cm soil depth and increased over time[39]. Residue management in combination with tillage treatments (ST and CT) has been reported to affect the soil macronutrient status in Bangladesh. Tillage treatments enhanced the total N content to a considerable extent. Moreover, 3 years of residue retention led to a higher concentration of total N, available P and K in the soil.

    The combinations of N, P, and K in different ratios together with two rates of organic fertilizer (OF) applied on the aquic Inceptisol having sandy loam texture influenced the micronutrient status of the soil[40]. Soil Zn content decreased with time when no fertilizer was applied as compared to organic fertilizer (OF) application. The mineral fertilizer treatments led to a substantial increase in DTPA-extractable micronutrients in the soil. The higher micronutrient concentration due to higher OM highlights the importance of maintaining OM for soil fertility and higher crop production. Further studies revealed that long-term application of sole N fertilizers led to a significant decline in total Zn and Cu, whereas Mn and Fe status improved through atmospheric deposition. Phosphorus and OF addition along with straw incorporation markedly increased total Zn, Cu, Fe, and Mn. The DTPA-extractable Mn, Zn, Fe, and Cu were also higher in OF treatment, thus demonstrating the beneficial effects of constant OM application for maintaining the nutrient status of soil[41].

    López-Fando & Pardo[42] quantified the impact of various tillage practices including NT, CT, minimum tillage (MT), and zone-tillage (ZT) on soil micronutrient stocks. Tillage systems did exhibit a significant influence on plant available Fe stocks in the topsoil; however, diminished with depth under ZT, NT and MT. Manganese was higher in NT and ZT at all depths and increased with soil depth. Zinc was highest under NT and other results did not vary significantly as in the case of Cu. The SOC levels were also found to be responsible to affect micronutrients due to tillage practices. Likewise, in Calciortidic Haploxeralf soil the distribution of soil micronutrients (Zn, Mn, Fe, Cu) was ascertained under different tillage practices (CT, MT, and NT). The micronutrient status was highest under NT in the upper layers due to the higher SOC level[43].

    Sharma & Dhaliwal[44] determined that the combined application of nitrogen and rice residues facilitated the transformation of micronutrients (Zn, Mn, Fe, Cu). Among different fractions, the predominant fractions were crystalline Fe bound in Zn, Mn, and Cu and amorphous Fe oxide in Fe with 120 kg N ha˗1 and 7.5-ton rice residue incorporation. The higher content of occluded fractions adduced the increment in cationic micronutrient availability in soil with residue incorporation together with N fertilization due to increased biomass. Rice straw compost along with sewage sludge (SS) and INF also affected the micronutrient availability under the RW cropping system. Nitrogen fertilization through inorganic fertilizers and rice straw compost and sewage sludge (50% + 50%) improved soil micronutrient status due to an increase in SOM over sole NPK fertilizers[45]. Earlier, Dhaliwal et al.[46] in a long-term experiment determined that different combinations of NPK along with biogas slurry as an organic source modified the extractable micronutrient status of the soil.

    A comparative study was carried out by Dhaliwal et al.[47] to ascertain the long-term impact of agro-forestry and rice–wheat systems on the distribution of soil micronutrients. The DTPA-extractable and total Cu, Zn, Fe, and Mn were greater in the RW system due to the reduced conditions because of rice cultivation. Under the RW system Zn removal was higher which was balanced by continuous Zn application. The higher availability of Fe under the RW system was due to reduced conditions. Contrarily, Mn was greater under the agro-forestry system owing to nutrient recycling from leaf litter.

    The long-term impact of integrated application of FYM, GM, WCS (wheat-cut straw) and INF on the soil micronutrients (Zn, Mn, Cu, and Fe) have been studied by Dhaliwal et al.[48]. The FYM application substantially improved DTPA-extractable Zn status followed by GM and WCS, whereas Cu content was maximum in the plots with OM application. The highest Fe concentration was recorded in treatment in which 50% recommended N supplied through FYM. This could be ascribed to the release of micronutrients from OM at low soil pH.

    Shiwakoti et al.[49] studied the dual effects of tillage methods (MP, DP, SW) and variable rates of N (0, 45, 90, 135 and 180 kg ha−1) on the distribution of micronutrients under a moisture-deficit winter wheat-fallow system. The soil Mn content was highest under the DP regime. Inorganic N application reduced Cu content in the soil. Comparative studies with adjacent undisturbed grass pasture indicated the loss of Zn and Cu to a significant extent. Thus, DP along with nitrogen added through inorganic fertilizers could improve micronutrient concentration in the soil. Moreover, the results implied that long-term cultivation with nitrogen fertilization and tillage results in the decline of essential plant nutrients in the soil. Thus, organic amendments along with INF may prove an effective approach to increase soil micronutrient content. In another study conducted by Lozano-García & Parras-Alcántara[50] tillage practices such as NT under apple orchard, CT with the wheat-soybean system and puddling (PD) in the rice-rice cropping system were found to affect nutrient status. Under CT, Cu content was lowest and Zn content was highest. On the contrary, puddling caused an increase in Fe and Mn concentration owing to the dispersion of soil aggregates which reduced the percolation of water and created an anaerobic environment thereby enhancing the availability of Fe and Mn.

    Tillage practices along with gypsum fertilization have been known to affect secondary nutrient concentrations in soil. In a long-term experiment, FYM application showed maximum response to increased S concentration due to the maximum addition of OM through FYM over other treatments as S is an essential component of OM and FYM[32]. Higher Mg content was recorded in FYM and pea vine treatments because the application of organic matter through organic manure or pea vines outright led to Mg accrual. The lower Mg concentration in topsoil than the lower layers was due to the competition between Mg and K for adsorbing sites and thus displacement of Mg by K. Han et al.[28] while ascertaining the impact of organic manures and mineral fertilizers (NPK) on soil chemical attributes determined that INF application reduced exchangeable calcium, whereas no significant changes were exhibited in the magnesium concentrations. The OM application significantly increased both the calcium and magnesium concentrations in the soil.

    While ascertaining the effect of different tillage treatments such as CT, NT, and MT on exchangeable and water-soluble cations, Lozano-García & Parras-Alcántara[50] recorded that NT had greater content of exchangeable Ca2+ and Mg2+ than MT and CT. The exchangeable Ca2+ decreased with depth, however, opposite results were observed for Mg2+ which might be due to the higher uptake of Mg2+ by the crop. On another note, there might be the existence of Mg2+-deficient minerals on the surface horizon. Alam et al.[51] studied the temporal effect of tillage systems on S distribution in the soil and observed that available S was 19%, 31%, and 34% higher in zero tillage than in minimum tillage, conventional tillage, and deep tillage, respectively.

    Kumar et al.[38] appraised the impact of tillage systems on surface soil nutrient dynamics under the following conditions: conventional tillage, zero till seeding with bullock drawn, conventional tillage with bullock drawn seeding, utera cropping and conservation tillage seeding with country plough and observed that tillage had a significant impact on the available S content. Compared with conventional tillage, zero and minimum tillage had higher S content as there was none or limited tillage operations which led to the accumulation of root stubble in the soil that decomposed over time and increased S concentration.

    Soil is considered a hotspot for microbial biodiversity which plays an important role in building a complex link between plants and soil. The microbial components exhibit dynamic nature and, therefore, are characterized as good indicators of soil quality[52]. These components include MBC, MBN, PMN and microbial respiration which not only assist in biological transformations like OM conversion, and biological nitrogen fixation but also increase nutrient availability for crop uptake. Management strategies such as fertilizer inputs and tillage practices may exert beneficial effects on soil biota as discussed below.

    Soil is an abode to a considerable portion of global biodiversity. This biodiversity not only plays a pivotal role in regulating soil functions but also provides a fertile ground for advancing global sustainability, especially agricultural ventures. Thus, the maintenance of soil biodiversity is of paramount importance for sustaining ecosystem services. Soil biodiversity is the diverse community of living creatures in the soil that interact not only with one another but also with plants and small animals to regulate various biological activities[53]. Additionally, it increases the fertility of soil by converting organic litter to SOM thereby enhancing SOC content. Thus, the SOM measures the number and activity of soil biota. Furthermore, the quality and amount of SOC, as well as plant diversity have a considerable impact on the soil microbial community structure[54].

    Dangi et al.[55] ascertained the impact of integrated nutrient management and biochar on soil microbial characteristics and observed that soil amended with biochar or the addition of organic manures influenced microbial community composition and biomass and crop yield. After two years, the higher rates of biochar significantly enhanced the levels of gram-positive and gram-negative bacterial phospholipid fatty acid (PLFA), total arbuscular mycorrhizal fungal (AMF) than lower rates, unfertilized and non-amended soil. Luan et al.[56] conducted a comparison study in a greenhouse to assess the effects of various rates of N fertilizer and kinds (inorganic and organic) on enzyme activities and soil microbial characteristics. Microbial growth (greater total PLFAs and microbial biomass carbon) and activity were promoted by manure substitution of mineral fertilizer, particularly at a higher replacement rate. On account of lower response in bacterial over fungal growth, manure addition led to a greater fungi/bacteria ratio. Furthermore, manure application significantly enhanced microbial communities, bacterial stress indicators and functional diversity. Lazcano et al.[57] determined the influence of different fertilization strategies on microbial community structure and function, soil biochemical properties and crop yield three months after addition of fertilizer. The integrated fertilizer regimes augmented microbial growth with improved enzyme activity as compared to sole inorganic amendments. Bacterial growth showed variable response with variation in fertilizer regime used whereas fungal growth varied with the amount of fertilizer added. Compared to mineral fertilizers, manure application led to a rapid increase in PLFA biomarkers for gram-negative bacteria. The organic amendments exhibited significant effects even at small concentration of the total quantity of nutrients applied through them; thus, confirming the viability of integrated fertilizer strategies in the short term.

    Kamaa et al.[58] assessed the long-term effect of crop manure and INF on the composition of microbial communities. The organic treatments comprised of maize (Zea mays) stover (MS) at 10 t ha−1 and FYM @ 10 t ha−1, INF treatments (120 kg N, 52.8 kg P-N2P2), integrated treatments (N2P2 + MS, N2P2 + FYM), fallow plot and control. The treatment N2P2 exhibited unfavourable effects on bacterial community structure and diversity that were more closely connected to the bacterial structure in control soils than integrated treatments or sole INF. In N2P2, fungal diversity varied differently than bacterial diversity but fungal diversity was similar in the N2P2 + FYM and N2P2 + MS-treated plots. Thus, the total diversity of fungal and bacterial communities was linked to agroecosystem management approaches which could explain some of the yield variations observed between the treatments. Furthermore, a long-term experiment was performed by Liu et al.[59] to study the efficiency of pig manure and compost as a source for N fertilization and found unique prokaryotic communities with variable abundance of Proteobacteria under compost and pig manure treatments.

    Recently, Li et al.[60] assessed the influence of different tillage practices (no-tillage, shallow tillage, deep tillage, no-tillage with straw retention, shallow tillage with straw retention and deep tillage with straw retention) on microbial communities and observed that tillage practices improved the bacterial Shannon index to a greater extent over the no-tillage plots in which the least value was recorded. Another research study by He et al.[61] reported the effect of tillage practices on enzyme activities at various growth stages. Across all the growth stages, enzyme activities of cellobiohydrolase (CBH), β-xylosidase (BXYL), alkaline phosphatase (AP), β-glucosidase (BG), β-N-acetylglucosamines (NAG) were 17%−169%, 7%−97%, 0.12%−29%, 3%−66%, 23%−137% greater after NT/ST, NT, ST, ST/PT, and PT/NT treatments as compared to plow tillage. The NT/ST treatment resulted in highest soil enzyme activities and yield, and thus was an effective and sustainable method to enhance soil quality and crop production.

    Microbes play a crucial role in controlling different soil functions and soil ecology and microbial community show significant variation across as well as within the landscape. On average, the total biomass of microbes exceeds 500 mg C kg soil−1[62]. Microbial biomass carbon is an active constituent of SOM which constitutes a fundamental soil quality parameter because SOM serves as a source of energy for microbial processes and is a measure of potential microbial activity[48,63]. Soil systems that have higher amounts of OM indicate higher levels of MBC. Microbial biomass carbon is influenced by many parameters like OM content in the soil, land use, and management strategies[64]. The MBC and soil aggregate stability are strongly related because MBC integrates soil physical and chemical properties responds to anthropogenic activities.

    Microbial biomass is regarded as a determinative criterion to assess the functional state of soil. Soils having high functional diversity of microbes which, by and large, occurs under organic agricultural practices, acquire disease and insect-suppressive characteristics that could assist in inducing resistance in plants[65]. Dou et al.[66] determined that soil microbial biomass C (SMBC) was 5% to 8% under wheat-based cropping systems and zero tillage significantly enhanced SMBC in the 0−30 cm depth, particularly in the upper 0 to 5 cm. According to Liang et al.[67], SMBC and soil microbial biomass N (SMBN) in the 0−10 cm surface layer were greater in the fertilized plots in comparison to the unfertilized plots on all sampling dates whereas microbial biomass C and N were highest at the grain filling stage. Mandal et al.[68] demonstrated that MBC also varied significantly with soil depth. Surface soil possessed a maximum MBC value than lower soil layers due to addition of crop residues and root biomass on the surface soil. The MBC content was highest with combined application of INF along with farmyard manure and GM, whereas untreated plots showed minimum MBC values. The incorporation of CR slows down the rate of mineralization processes; therefore, microbes require more time to decompose the residues and utilize the nutrients released[69]. On the other hand, incorporation of GR having a narrow C:N ratio enhances microbial activity and consequently accelerates mineralization in the soil. Malviya[70] also recorded that the SMBC contents were significantly greater under RT than CT, regardless of soil depth which was also assigned to residue incorporation which increases microbial biomass on account of higher carbon substrate in RT.

    Naresh et al.[71] studied the vertical distribution of MBC under no-tillage (NT), shallow (reduced) tillage and normal cultivated fields. A shallow tillage system significantly altered the tillage induced distribution of MBC. In a field experiment, Nakhro & Dkhar[72] examined the microbial populations and MBC in paddy fields under organic and inorganic farming approaches. The organic source used was a combination of rock phosphate, FYM and neem cake, whereas a mixture of urea, muriate of potash and single super phosphate was used as an inorganic source. The organically treated plots exhibited the highest MBC compared to inorganically treated plots and control. Organic carbon exhibited a direct and significant correlation with bacterial and fungal populations. The addition of organic fertilizers enhanced the content of SOC and consequently resulted in higher microbial count and MBC. Ramdas et al.[73] investigated the influence of inorganic and organic sources of nutrients (as minerals or INF) applied over a five-year period on SOC, MBC and other variables. It was observed that the addition of FYM and conjoint application of paddy straw (dry) and water hyacinth (PsWh) (fresh) significantly increased the SOC content than vermicompost, Chromolaena adenophorum (fresh) and Glyricidia aculeate (fresh), and Sesbania rostrata (fresh).

    Xu et al.[74] evaluated the influence of long-term fertilization strategies on the SOC content, soil MBN, soil MBC, and soil microbial quotient (SMQ) in a continuous rice system and observed that MBC at the main growth stages of early and late rice under 30% organic matter and 70% mineral fertilizer and 60% organic matter and 40% mineral fertilizer treatments was greater as compared to mineral fertilizer alone (MF), rice straw residues and mineral fertilizer (RF), and no fertilizer (CK) treatments. However, SMBC levels at late growth stages were greater in comparison to early growth stages. A recent study by Xiao et al.[75] demonstrated that increasing tillage frequency (no-tillage, semi-annual tillage, and tillage after every four months, two months, and one month) decreased soil MBC. Microbial biomass carbon content was significantly greater in no-till treatment (597 g kg−1) than in tillage every four months (421 g kg−1), two months (342 g kg−1) and one month (222 g kg−1). The decrease in the content of MBC in association with tillage practices is due to soil perturbations which enhanced soil temperature, diminished soil moisture content, and resulted in the destruction of microbial habitat and fungal hyphae. Therefore, the MBC content eventually affected the N cycle.

    Li et al.[76] reported that in comparison to CT, NT and RT resulted in increased MBC content and NT significantly increased MBC by 33.1% over CT. Furthermore, MBC concentration was 34.1% greater in NT than RT. The increase in MBC concentration was correlated with the results of increase in SOC concentration. Site-specific factors including soil depth and mean annual temperature significantly affected the response ratio of MBC under NT as compared to the duration of NT.

    Microbial biomass nitrogen (MBN) is a prominent indicator of soil fertility as it quantifies the biological status of soil. Soil MBN is strongly associated with organic matter of the soil. The nitrogen in MBN has a rapid turnover rate thereby reflecting the changes in management strategies way before the transformations in total N are discernable[77].

    In an experiment on continuous silage maize cultivation with crop rotation, Cerny et al.[78] observed that organic fertilizers exerted an affirmative influence on the soil MBN. During the application of organic manure MBN decreased, but there was higher MBN content as compared to control. However, addition of mineral nitrogenous fertilizers exerted an adverse effect on MBN content in experiments with maize. El-Sharkawi[79] recorded that organic matter-treated pots resulted in maximum MBN content than urea-treated pots. The sludge application enhanced total MBN and, therefore, could implicitly benefit crop production particularly in poor soils[18]. Sugihara et al.[80] observed that during the grain-filling stage in maize, residue and/or fertilizer addition exerted a pronounced influence on soil microbial dynamics; however, a clear effect of residue and ⁄or fertilizer addition was not observed. Microbial biomass nitrogen reduced dramatically from 63–71 to 18–33 kg N ha˗1 and C:N ratio at the same time increased more than ten-fold in all plots.

    Malik et al.[81] apprised that the organic amendments significantly enhanced MBN concentrations up to 50% more than the unamended soil. Wang et al.[82] evaluated the influence of organic materials on MBN content in an incubation and pot experiment with acidic and calcareous soils. The results revealed that MBN content which was affected by the different forms of organic amendments, increased by 23.37%−150.08% and 35.02%−160.02% in acidic and calcareous soils, respectively. The MBN content of both soils decreased with the increase in the C/N ratio of the organic materials, though a higher C/N ratio was effective for sustaining a greater MBN content for a very long time.

    Dhaliwal & Bijay-Singh[52] observed higher MBN levels in NT soils (116 kg ha−1) than in cultivated soils (80 kg ha−1). Kumar et al.[83] ascertained that in surface layer, MBN content was 11.8 mg kg−1 in CT which increased to 14.1 and 14.4 mg kg−1 in ZT and RT without residue retention and 20.2, 19.1 and 18.2 mg kg−1 in ZT, RT and CT with residue incorporation, respectively (Table 1). In the subsurface layer, the increased tendency on account of tillage and crop residue retention was identical to those of 0−15 cm layer but the magnitude was comparatively meagre (Table 1). In comparison to control, the persistent retention of crop residues led to significant accrual of MBN in the surface layer.

    Table 1.  Effect of different treatments on contents of various fractions of soil organic carbon[38].
    TreatmentsPMN (mg kg−1)MBC (mg kg−1)MBN (mg kg−1)DOC (mg kg−1)
    Depths (cm)
    0−1515−300−1515−300−1515−300−1515−30
    Tillage practices
    ZTR12.411.2562.5471.120.218.9198.6183.6
    ZTWR8.57.6350.4302.114.112.6167.1159.2
    RTR10.69.9490.2399.319.117.2186.4171.6
    RTWR7.66.6318.1299.814.413.7159.5148.7
    CTR9.38.5402.9354.418.216.6175.9168.9
    CT6.75.6307.9289.511.89.7142.5134.6
    Nitrogen management
    Control3.62.8218.3202.910.810.4103.792.3
    80 kg N ha−15.34.4241.1199.414.912.2128.3116.9
    120 kg N ha−18.97.6282.7220.916.516.1136.8123.6
    160 kg N ha−19.88.4343.9262.919.418.1164.8148.9
    200 kg N ha−110.49.7346.3269.622.721.7155.7136.4
    ZTR = Zero tillage with residue retention, ZTWR = Zero tillage without residue retention; RTR = Reduced tillage with residue retention, RTWR = Reduced tillage without residue retention, CTR = Conventional tillage with residue incorporation; CT = Conventional tillage without residue incorporation.
     | Show Table
    DownLoad: CSV

    Xiao et al.[75] determined that the MBN content decreased with tillage treatment having highest value in no tillage treatment, however, the difference among the treatments was negligible. Soil perturbations decreased the aggregate size and thus lower the soil aeration and exposure of fresh organic matter which restricted the growth of microorganisms. The results also concluded that MBN content is highly sensitive to tillage. Ginakes et al.[84] assessed the impact of zone tillage intensity on MBN in a corn-kura clover cropping sequence. Microbial biomass nitrogen was influenced by time and type of tillage treatment. Temporal studies revealed that MBN was higher after tillage treatment than the values possessed before tillage. Under different tillage treatments, higher values were recorded in ST (shank-till) and DT (double-till) over NT and RZT (zone-till) treatments.

    Another biological parameter, PMN, is a crucial parameter of soil fertility due to its association with soil N supply for crop growth. Also, PMN indicates the status of soil microbial community associated with PMN, whether it is improving or degrading. Forest soils are characterized by greater levels of PMN than CT receiving conventional chemical fertilizers which could be assignable to improved microbial activity in the former soils than the latter[48,77]. Aulakh et al.[85] assessed the effect of various combinations of fertilizer N, P, FYM and wheat residue (WR) applied to soybean and soybean residues added to wheat under CT and CA. The added fertilizers of N and P, FYM, and crop residue enhanced the mean weight diameter and water-stable aggregates thus favoured the development of macro-aggregates. The treatment INF + FYM + crop residue performed better among all the treatments. The net flux of mineral nitrogen from the mineralizable fraction is used to measure potentially mineralizable N which indicates the balance between mineralization and immobilization by soil microbes[77]. Nitrogen mineralization is widely used to assess the ability of SOM to supply inorganic nitrogen in the form of nitrate which is the most common form of plant-available nitrogen. Kumar et al.[83] observed an increase in PMN which was higher in surface soil than sub-surface soil thereby implying that high OC accumulation on account of crop residue retention was the most probable cause.

    Verma & Goyal[86] assessed the effect of INM and organic manuring on PMN and observed that PMN was substantially affected by different organic amendments. Potentially mineralizable nitrogen varied between 19.6−41.5 mg kg−1 soil with greater quantity (2.5%) in vermicompost applied plots than FYM treated plots. The INF treatments resulted in lower PMN content which could be due to nutrient immobilization by microbes. Mahal et al.[87] reported that no-till resulted in higher PMN content than conventional tillage treatments. This trend was due to the maintenance of SOM due to the residue cover and reduction of soil erosion under no-tillage system[88]. On the contrary, tillage practices led to the loss of SOC owing to loosened surface soil and higher mineralization of SOM.

    Soil respiration is referred as the sum of CO2 evolution from intact soils because of the respiration by soil organisms, mycorrhizae and roots[89]. Various researchers have proposed soil respiration as a potential indicator of soil microbial activity[52,77]. Gilani & Bahmanyar[90] observed that addition of organic amendments enhanced soil respiration more than the control and synthetic fertilizer treatments. Moreover, among organic amendment treatments, highest soil respiration was observed in sewage-sludge treated soils. Under controlled conditions in saline-sodic soil, Celis et al.[91] reported that sewage sludge resulted in a higher soil respiration rate than mined gypsum and synthetic gypsum. The application of gypsum because of minimal organic matter intake had little effect on soil respiration. The addition of organic matter especially during early spring led to higher microbial biomass and soil respiration albeit diminished levels of nitrate-N. Moreover, SOM hinders the leaching of nitrate ions thereby resulting in a better soil chemical environment[71].

    Faust et al.[92] observed that microbial respiration was associated with volumetric water content. The respiration declined with less availability of water, thus the lesser the tillage intensity, the more the volumetric water content which consequently resulted in higher microbial respiration. Another study by Bongiorno et al.[93] reflected the influence of soil management intensity on soil respiration. Reduced tillage practices resulted in 51% higher basal respiration than CT. Furthermore, this investigation suggested that microbial catabolic profile could be used as a useful biological soil quality indicator. Recently, Kalkhajeh et al.[94] ascertained the impact of simultaneous addition of N fertilizer and straw-decomposing microbial inoculant (SDMI) on soil respiration. The SDMI application boosted the soil microbial respiration which accelerated the decomposition of straw due to N fertilization. The C/N ratio did not affect the microbial respiration at elongation and heading stages, whereas N fertilization enhanced the microbial respiration to a greater extent than the unfertilized control. Additionally, the interaction between sampling time and basal N application significantly affected microbial respiration.

    Gong et al.[95] apprised the effect of conventional rotary tillage and deep ploughing on soil respiration in winter wheat and observed that deep ploughing resulted in a higher soil respiration rate than conventional rotary tillage. Soil moisture content and temperature are the dominating agents influencing soil respiration which is restricted by the soil porosity.

    Soil organic carbon plays a vital role in regulating various soil functions and ecosystem services. It is influenced by numerous factors like tillage practices and fertilization. Moreover, modified management practices may prove beneficial to avoid SOC loss by increasing its content. An exogenous supply of fertilizers may alter the chemical conditions of soil and thus result in transformation of SOC. Tillage practices lead to frequent soil disturbances which reduce the size of soil aggregates and accelerate the oxidation of SOC thereby reducing its content. The literature on the influence of fertilization and tillage practices on the transformation of SOC is discussed below.

    Soil organic carbon is a major part of the global carbon cycle which is associated not only with the soil but also takes part in the C cycling through vegetation, oceans and the atmosphere (Figs 1 & 2). Soil acts as a sink of approximately 1,500 Pg of C up to 1 m depth, which is greater than its storage in the atmosphere (approximately 800 Pg C) and terrestrial vegetation (500 Pg C) combined[96]. This dynamic carbon reservoir is continuously cycling in diverse molecular forms between the different carbon pools[97]. Fertilization (both organic and mineral) is one of the crucial factors that impart a notable influence on OC accretion in the soil. Many researchers have studied the soil C dynamics under different fertilizer treatments. Though inorganic fertilizers possess the advantage of easy handling, application and storage, they do not contribute to soil organic carbon. On the contrary, regardless of management method, plant residues are known to increase organic carbon content.

    Figure 1.  Impact of different fertilization regimes on abundance of the microbial biomarker groups . Error bars represent the standard error of the means and different letters indicate significant differences at p < 0.05 among treatments. Source: Li et al.[60].
    Figure 2.  Soil organic carbon (SOC) dynamics in the global carbon cycle.

    Katkar et al.[98] reported a higher soil quality index under conjunctive nutrient management strategies comprising addition of compost and green leaves along with mineral nutrients. Mazumdar et al.[99] investigated the impact of crop residue (CR), FYM, and leguminous green manure (GM) on SOC in continuous rice-wheat cropping sequence over a 25-year period. At the surface layer, the maximum SOC content was recorded under NPK + FYM than NPK + CR and NPK + GM treatments. SOC was significantly lower under sole application of INFs (NPK) than the mixed application of organic and inorganic treatments. A higher range of SOC content was recorded at a depth of 0.6 m in the rice-wheat system (1.8–6.2 g kg−1) in farmyard manure (FYM)-treated plots than 1.7–5.3 g kg−1 under NPK, and 0.9–3.0 g kg−1 in case of unfertilized plots[100]. In a research study Dutta et al.[101] reported that rice residue had a higher decomposition rate (k¼ 0.121 and 0.076 day−1) followed by wheat (0.073 and 0.042 day−1) and maize residues (0.041 day−1) when their respective residues placed on soil surface than incorporated in the soils. Naresh et al.[102] found FYM and dhaincha as GM/ sulphitation press mud (SPM) treatments are potent enough to enhance the SOC. Maximum SOC content was noted in 0–5 cm depth that reduced gradually along the profile. In surface soil, the total organic content (TOC) under different treatments varied with source used to supply a recommended dose of nitrogen (RDN) along with conventional fertilizer (CF).

    Cai et al.[103] ascertained that long-term manure application significantly improved SOC content in different size fractions which followed the sequence: 2,000–250 μm > 250–53 μm > 53 μm fraction. Naresh et al.[22] determined that mean SOC content increased from 0.54% in control to 0.65% in RDF and 0.82% in RDF + FYM treatment and improved enzyme activity; thus, ultimately influenced nutrient dynamics under field conditions. The treatments RDF + FYM and NPK resulted in 0.28 Mg C ha−1 yr−1 and 0.13 Mg C ha−1 yr−1, respectively and thus higher sequestration than control. Zhao et al.[104] determined that in the surface layer, significant increase in SOC content in each soil aggregate was noticed under straw incorporation treatments over no straw incorporated treatments (Fig. 3). Moreover, the aggregate associated OC was significantly higher in the surface layer than the sub-surface layer. The highest increment in aggregate-associated OC was noted in both maize and wheat straw (MR-WR) added plots followed by MR and least in WR. Besides, all of the three straw-incorporated treatments exhibited notable increase in SOC stock in each aggregate fraction in the surface layer of the soil. In the subsurface (20−40 cm) layer under MR-WR, significant rise in SOC stock of small macro-aggregates was observed, whereas there was a reduction in SOC stock in the silt + clay fraction than other treatments. The straw-incorporated treatments increased the quantity of mineral-associated organic matter (mSOM) and intra-aggregate particulate organic matter, (iPOM) within small macro-aggregates and micro-aggregates especially in the topmost layer of the soil.

    Figure 3.  Distribution of OC in coarse iPOM (intra-aggregate particulate organic matter) fine iPOM, mSOM (mineral-associated matter), and free LF (free light fraction) of small macro-aggregates and micro-aggregates in the 0–20 cm and 20–40 cm soil layers under MR-WR (return of both maize and wheat straw), MR (maize straw return), WR (wheat straw return). Different lowercase and uppercase letters indicate significant differences at p < 0.05 among treatments and depths respectively[104].

    Srinivasarao et al.[105] reported that SOC content was reduced with the addition of INFs (100% RDN) alone as compared to the conjunctive application of inorganic and organic or sole FYM treatments. Earlier, Srinivasarao et al.[106] reported that FYM treated plots exhibited greater per cent increase in SOC stock than mineral fertilized plots and control. Tong et al.[107] ascertained that the application of NP and NPK significantly improved SOC stocks. On the contrary, fertilized soils could also exhibit decrease in carbon content than control. Naresh et al.[108] determined that higher biomass C input significantly resulted in greater particulate organic carbon (POC) content. Zhang et al.[109] ascertained that long-term addition of NPK and animal manures significantly improved SOC stocks by a magnitude of 32%−87% whereas NPK and wheat/ and or maize straw incorporation enhanced the C stocks by 26%−38% than control. Kamp et al.[110] determined that continuous cultivation without fertilization decreased SOC content by 14% than uncultivated soil. However, super optimum dose of NPK, balanced NPK fertilization and integration of NPK with FYM not only improved SOC content but also SOC stocks over the first year. In conventionally tilled cotton-growing soils of southern USA, Franzluebbers et al.[111] estimated that carbon sequestration averaged 0.31 ± 0.19 Mg C ha−1 yr−1. Mandal et al.[112] reported maximum SOC stock in the surface layer of the soil (0–15 cm) which progressively diminished with depth in each land use system. A significant decrease in SOC stock along the profile depth was also observed by Dhaliwal et al.[47] in both croplands and agroforestry. In the topmost soil layer, highest SOC stock was recorded in rice–fallow system while the lowest was in the guava orchard[112].

    Nath et al.[113] determined that there was accrual of higher TOC in surface layers as compared to lower layers of soil under paddy cultivation. This accrual could be adduced to left-over crop residues and remnant root biomass which exhibited a decreasing trend with soil depth. Das et al.[114] determined that integrated use of fertilizers and organic sources resulted in greater TOC as compared to control or sole fertilizer application. Fang et al.[115] observed that the cumulative carbon mineralization differed with aggregate size in top soils of broad-leaved forests (BF) and coniferous forests (CF). However, in deep soil it was greater in macro-aggregates as compared to micro-aggregates in BF but not in CF (Fig. 4). By and large, the percent SOC mineralized was greater in macro-aggregates as compared to micro-aggregates. Dhaliwal et al.[100] ascertained that SOC accrual was considerably influenced by residue levels and tillage in surface soil (0−20 cm); albeit no variation was observed at lower depth (20−40 cm). The SOC content was greater in zero-tilled and permanently raised beds incorporated with residues as compared to puddled transplanted rice and conventionally planted wheat. Pandey et al.[116] reported that no-tillage prior to sowing of rice and wheat increased soil organic carbon by 0.6 Mg C ha–1 yr–1. The carbon sequestration rate on account of no-tillage or reduced tillage ranged between 0−2,114 kg ha–1 yr–1 in the predominant cropping system of South Asia, Xue et al.[117] observed that the long-term conventional tillage, by and large, exhibited a significant decline in SOC owing to degradation of soil structure, exposing protected soil organic matter (intra-soil aggregates) to microbes. Therefore, the adoption of no-tillage could hamper the loss of SOC thereby resulting in a greater or equivalent quantity of carbon in comparison to CT (Fig. 5).

    Figure 4.  (a) Soil aggregate fractions of two depths in two restored plantations of subtropical China, (b) organic carbon and (c) its mineralization from various soil aggregates within 71 d at various soil depths in two restored plantations of subtropical China. Error bars show the standard error of the mean. The different letters represent significant differences among the different soil aggregate fractions within a depth at p < 0.05[115].
    Figure 5.  The concentrations of (a) SOC, (b) total nitrogen (TN), and (c) soil C:N ratio for 0–50 cm profile under different tillage treatments in 2012 and 2013. NT = no-till with residue retention; RT = rotary tillage with residue incorporation; PT = plow tillage with residue incorporation; and PT0 = plow tillage with residue removed. The lowercase letters indicate statistical difference among treatments at p < 0.05[117].

    Singh et al.[118] determined that carbon stock in the 0-40 cm layer increased by 39, 35 and 19% in zero-tilled clay loam, loam, and sandy loam soils, respectively as compared to conventional tilled soils over a period of 15 years. Kuhn et al.[119] also apprised about the advantages of NT over CT vis-a-vis SOC stocks across soil depths. In the surface layer (0−20 cm) NT, by and large, resulted in higher SOC stocks as compared to CT; however, SOC stocks exhibited a declining trend with soil depth, in fact, became negative at depths lower than 20 cm. Sapkota et al.[120] observed that over a period of seven years, direct dry-seeded rice proceeded by wheat cultivation with residue retention enhanced SOC at 0-60 cm depth by a magnitude of 4.7 and 3.0 t C ha−1 in zero-tillage (ZTDSR-ZTW + R) and without tillage (PBDSR-PBW + R), respectively. On the contrary, the conventional tillage rice-wheat cropping system (CTR-CTW) decreased the SOC up to 0.9 t C ha−1 (Table 2).

    Table 2.  Influence of tillage and crop establishment methods on SOC stock and its temporal variation under rice–wheat system[120].
    Tillage and crop establishment methodsDepths (m)
    0–0.050.05–0.150.15–0.30.3–0.60–0.6
    Total SOC (t/ha)
    CTR-CTW3.5e7.1c8.77.026.2c
    CTR-ZTW3.9d7.6bc8.86.526.7c
    ZTDSR-CTW4.2d7.5bc9.26.327.3c
    ZTDSR-ZTW4.9c8.9ab8.26.228.2bc
    ZTDSR-ZTW+R6.1a9.0ab9.86.831.8a
    PBDSR-PBW+R5.5b9.3a9.36.030.1ab
    MSD0.41.72.01.42.49
    Treatment effect
    (p value)
    < 0.0010.040.1580.267< 0.001
    Initial SOC content3.6 ±
    0.15
    8.1 ±
    1.39
    8.78 ±
    1.07
    6.7 ±
    0.73
    27.1 ±
    1.21
    Change in SOC over seven years (t/ha)
    CTR-CTW−0.16−0.99−0.040.28−0.90
    CTR-ZTW0.28−0.500.01−0.20−0.41
    ZTDSR-CTW0.62−0.570.45−0.340.16
    ZTDSR-ZTW1.340.84−0.62−0.461.09
    ZTDSR-ZTW+R2.490.961.040.164.66
    PBDSR-PBW+R1.891.220.51−0.642.98
    CTR-CTW = Conventionally tilled puddled transplanted rice followed by conventionally tilled wheat, CTR-ZTW = Conventionally tilled puddled transplanted rice followed by zero-tilled wheat, ZTDSR-CTW = Zero-tilled direct dry-seeded rice followed by conventionally tilled wheat, ZTDSR-ZTW = Zero-tilled direct dry-seeded rice followed by zero-tilled wheat, ZTDSR-ZTW+R = Zero-tilled direct dry-seeded rice followed by zero-tilled wheat with residue retention, PBDSR-PBW+R = Direct dry-seeded rice followed by direct drilling of wheat both on permanent beds with residue retention, MSD, minimum significant difference. Significant different letters indicate significant differences at p < 0.05.
     | Show Table
    DownLoad: CSV

    Labile organic carbon (LC) is that fraction of SOC that is rapidly degraded by soil microbes, therefore, having the highest turnover rate. This fraction can turn over quickly on account of the change in land use and management strategies. From the crop production perspective, this fraction is crucial as it sustains the soil food cycle and, hence, considerably impacts nutrient cycling thereby altering soil quality and productivity. Short-term management could influence the labile fraction of carbon[121]. However, some site-specific problems and regional factors may influence their distribution in soil layers[102].

    Banger et al.[122] observed significant alteration in labile pools of C, for instance, particulate organic matter (POM), water-soluble C (WSC) and light fraction of C (LFC) because of the addition of fertilizers and/or FYM over a 16-year period. Particulate organic matter, LFC and WSC contributed 24%–35%, 12%–14% and 0.6%–0.8%, respectively, towards SOC. The increase in concentration of SOC including its pools like POC and the sequestration rate due to integrated nutrient management was also reported by Nayak et al.[123]. Gu et al.[124] observed that mulch-treated soils (straw and grass mulch) had significantly greater levels of LOC, POC, DOC and EOC as compared to no mulch-treated soils which could be adduced to the addition of straw, root and its sections into the soil. The content of labile C fractions across all treatments exhibited a decreasing trend with soil depth[23, 102, 125].

    In a long-term experiment, Anantha et al.[126] observed that the total organic carbon apportioned into labile carbon, non-labile, less labile, and very labile carbon constituted around 18.7%, 19.3%, 20.6% and 41.4% of the TOC, respectively (Table 3). Zhu et al.[20] determined that straw incorporation had a substantial impact on TOC and labile C fractions of the soil which were greater in straw incorporated treatments as compared to non-straw treatments across all the depths. Wang et al.[127] reported that the light fraction organic carbon (LFOC) and DOC were significantly greater in the straw-applied treatments than the control by a magnitude of 7%–129% for both the early and late season rice. The treatments NPK + FYM or NPK + GR + FYM resulted in greater content of very labile and labile C fractions whereas non-labile and less labile fractions were greater in control and NPK + CR treatment. There was 40.5% and 16.2% higher C build-up in sole FYM treated plots and 100% NPK + FYM, respectively over control. On the other hand, a net depletion of 1.2 and 1.8 Mg ha−1 in carbon stock was recorded under 50% NPK and control treatments, respectively. Out of the total C added through FYM, only 28.9% was stabilized as SOC, though an external supply of OM is a significant source of soil organic carbon[69]. Hence, to sustain the optimum SOC level at least an input of 2.3 Mg C ha−1 y−1 is required. A comparatively greater quantity of soil C in passive pools was observed in 100% NPK + FYM treatment. The increase in allocation of C into the passive pool was about 33%, 35%, 41% and 39% of TOC in control, suboptimal dose, optimal dose and super optimal dose of NPK which indicates that the concentration of passive pools increased with an increase in fertilization doses. Water-soluble carbon (WSC) was 5.48% greater in the upper soil layer as compared to lower layer of soil. In surface soil (0−15 cm), the values of light fraction carbon (LFC) were 81.3, 107.8, 155.2, 95.7, 128.8, 177.8 and 52.7 mg kg−1 in ZT without residue retention, ZT with 4 t ha−1 residue retention, ZT with 6 t ha−1 residue retention, FIRB without residue addition and FIRB with 4 and 6 t ha−1 residue addition and CT, respectively (Table 4). Tiwari et al.[128] determined that the decrease in POC was due to reduction in fine particulate organic matter in topsoil whereas decrement in dissolved organic carbon was observed largely in subsoil. Therefore, in surface soils fine POC and LFOC might be regarded as preliminary evidence of organic C alteration more precisely, while DOC could be considered as a useful indicator for subsoil. Reduction in allocations of fine POC, LFOC and DOC to SOC caused by tillage and straw management strategies indicated the decline in quality of SOC. A higher SOC concentration was recorded in the conjoint application of INF + FYM (0.82%) and sole application of INF (0.65%) than control (0.54%). Kumar et al.[83] reported that the CT without residue retention had significantly lower labile carbon fractions (27%–48%) than zero-tillage with 6-ton residue retention. Moreover, residue-retained fertilized treatments had significantly greater labile fractions of C than sole fertilized treatments[125]. Kumar et al.[83] reported highest change in DOC in zero-till with residue retention (28.2%) in comparison to conventional tillage practices. In ZT, absence of soil perturbations resulted in sustained supply of organic substrata for soil microbes which increases their activity. On the contrary, CT practices resulted in higher losses of C as CO2 due to frequent disturbances.

    Table 3.  Oxidisable organic carbon fractions in soils (g kg−1) at different layers[126].
    TreatmentDepths (cm)
    0−1515−3030−45Total
    Very Labile C
    Control3.6 ± 0.5c1.4 ± 0.3b1.3 ± 0.2a6.3 ± 0.4b
    50% NPK4.6 ± 0.3bc2.1 ± 0.7ab1.5 ± 0.1a8.1 ± 0.9a
    100% NPK4.4 ± 0.3bc2.3 ± 0.2a1.4 ± 0.5a8.0 ± 0.7a
    150% NPK5.0 ± 0.2ab2.6 ± 0.2a1.5 ± 0.1a9.0 ± 0.3a
    100% NPK + FYM4.8 ± 0.2ab2.0 ± 0.2ab1.3 ± 0.3a8.1 ± 0.2a
    FYM5.9 ± 1.3a2.2 ± 0.2a1.4 ± 0.3a9.5 ± 1.6a
    Fallow4.2 ± 0.7bc1.5 ± 0.5b0.7 ± 0.3b6.3 ± 0.8b
    Lbile C
    Control2.4 ± 0.3a1.0 ± 0.2a0.8 ± 0.4a4.2 ± 0.6a
    50% NPK1.7 ± 0.4ab0.9 ± 0.5a0.7 ± 0.2a3.3 ± 0.7a
    100% NPK1.8 ± 0.4ab0.8 ± 0.5a0.6 ± 0.3a3.2 ± 0.8a
    150% NPK1.2 ± 0.3b0.7 ± 0.2a0.9 ± 0.2a2.8 ± 0.4a
    100% NPK + FYM1.9 ± 0.3ab0.7 ± 0.2a0.7 ± 0.3a3.4 ± 0.2a
    FYM2.5 ± 0.9a0.7 ± 0.3a0.7 ± 0.2a3.9 ± 0.9a
    Fallow2.2 ± 1.0ab1.0 ± 0.3a1.0 ± 0.4a4.1 ± 1.1a
    Less labile C
    Control1.5 ± 0.3c0.6 ± 0.4c0.4 ± 0.0c2.6 ± 0.7d
    50% NPK1.8 ± 0.1c0.4 ± 0.1c0.5 ± 0.2c2.7 ± 0.1cd
    100% NPK2.5 ± 0.3ab0.8 ± 0.1bc1.1 ± 0.2ab4.4 ± 0.1b
    150% NPK2.6 ± 0.2a0.9 ± 0.1bc0.4 ± 0.2c3.9 ± 0.1b
    100% NPK + FYM2.7 ± 0.6a1.5 ± 0.2a1.4 ± 0.1a5.6 ± 0.7a
    FYM1.9 ± 0.7bc1.7 ± 0.2a1.0 ± 0.2b4.5 ± 0.7ab
    Fallow1.5 ± 0.3c1.3 ± 0.7ab0.9 ± 0.4b3.8 ± 1.2bc
    Non labile C
    Control1.2 ± 0.5b1.2 ± 0.3a0.2 ± 0.2b2.6 ± 0.5b
    50% NPK1.2 ± 0.9b1.7 ± 0.8a0.7 ± 0.4ab3.5 ± 1.8ab
    100% NPK1.3 ± 0.6b1.5 ± 0.6a0.5 ± 0.2ab3.3 ± 1.0ab
    150% NPK1.4 ± 0.3b1.5 ± 0.2a0.8 ± 0.1a3.7 ± 0.3ab
    100% NPK + FYM2.0 ± 0.8b1.3 ± 0.1a0.3 ± 0.3ab3.5 ± 0.7ab
    FYM3.7 ± 1.3a1.0 ± 0.2a0.5 ± 0.5ab5.1 ± 1.9a
    Fallow2.1 ± 0.2b1.4 ± 0.7a0.4 ± 0.2ab3.9 ± 0.9ab
    Values in the same column followed by different letters are significantly different at p < 0.001, ± indicates the standard deviation values of the means.
     | Show Table
    DownLoad: CSV
    Table 4.  Influence of tillage and nitrogen management on distribution of carbon fractions in soil[83].
    TreatmentsWSOC
    (g kg−1)
    SOC
    (g kg−1)
    OC
    (g kg−1)
    BC
    (g kg−1)
    POC
    (mg kg)
    PON
    (mg kg−1)
    LFOC
    (mg kg−1)
    LFON
    (mg kg−1)
    Depths (cm)
    0−1515−300−1515−300−1515−300−1515−300−1515−300−1515−300−1515−300−1515−30
    Tillage practices
    ZTR28.826.223.119.39.619.134.694.281342.8967.9119.5108.1194.7154.814.812.3
    ZTWR25.324.618.414.87.877.213.763.19981.1667.494.686.5120.5104.711.810.3
    RTR27.025.922.418.28.688.174.133.871230.2836.9109.797.8170.9144.913.711.6
    RTWR23.721.818.114.27.667.073.122.96869.4604.482.676.6107.197.39.78.6
    CTR26.124.421.817.48.497.963.823.481099.1779.498.489.3143.8115.912.810.9
    CT21.820.916.113.16.215.642.892.63617.5481.869.257.690.873.69.67.9
    Nitrogen management
    Control21.114.916.113.16.135.481.581.07709.7658.631.726.3123.9104.36.45.8
    80 kg N ha−128.321.217.814.76.466.162.461.75860.7785.668.456.2132.8116.17.66.9
    120 kg N ha−129.522.119.116.17.256.713.262.18952.2808.989.578.5150.6127.69.78.6
    160 kg N ha−130.223.120.818.27.757.283.822.661099.5823.896.883.4168.5145.710.29.8
    200 kg N ha−131.125.421.318.77.937.484.153.421153.1898.4103.997.3176.2152.911.710.6
    WSOC = Water soluble organic carbon, SOC = Total soil organic carbon, OC = Oxidizable organic carbon, BC =Black carbon, POC = particulate organic carbon, PON = particulate organic nitrogen, LFOC = labile fraction organic carbon, and LFON = labile fraction organic nitrogen. ZTR = Zero tillage with residue retention, ZTWR = Zero tillage without residue retention; RTR = Reduced tillage with residue retention, RTWR = Reduced tillage without residue retention, CTR = Conventional tillage with residue incorporation; CT = Conventional tillage without residue incorporation.
     | Show Table
    DownLoad: CSV

    The soil characteristics such as plant available nutrients, microbial diversity and soil organic carbon transformation are dwindling on account of intensive cultivation under conventional tillage practices, therefore, demand relevant management approaches for soil and crop sustainability. Long-term application of organic amendments significantly increases soil properties by increasing plant available macro, micro, secondary nutrients and soil organic C, whereas the increase in organic C by INF application is, by and large, due to increment in organic C content within macro-aggregates and in the silt + clay compartments. The soil organic carbon and other plant available nutrients were significantly greater in conservation tillage systems as compared to conventional tillage (CT) that conservation approaches could be an exemplary promoter of soil productivity by modifying soil structure thereby protecting SOM and maintaining higher nutrient content. The mean concentration of different fractions of carbon MBN, PMN and soil respiration under integrated nutrient management treatments was higher as compared with to control. Therefore, the conjoint use of organic manures or retention of crop residues with inorganic fertilizers is imperative to reduce the depletion of SOC while sustaining crop production as a realistic alternative. Future research should focus mainly on the usage of organic and mineral fertilizers in conjunction with conservation tillage approaches to sustain the soil environment.

    The authors confirm contribution to the paper as follows: study conception and design: Dhaliwal SS, Shukla AK, Randhawa MK, Behera SK; data collection: Sanddep S, Dhaliwal SS, Behera SK; analysis and interpretation of results: Dhaliwal SS, Gagandeep Kaur, Behera SK; draft manuscript preparation: Dhaliwal SS, walia, Shukla AK, Toor AS, Behera SK, Randhawa MK. All authors reviewed the results and approved the final version of the manuscript.

    Data sharing not applicable to this article as no datasets were generated or analyzed during the current study.

    The support rendered by the Departemnt of Soil Science, PAU, Ludhiana, RVSKVV, Gwailor, CSSRI, Karnal, IISS, Bhopal, School of Organic Farming, PAU Ludhiana and Washington State University, USA is fully acknowledged .

  • The authors declare that they have no conflict of interest.

  • [1]

    Malik MA, Saini CS. 2017. Polyphenol removal from sunflower seed and kernel: Effect on functional and rheological properties of protein isolates. Food Hydrocolloids 63:705−15

    doi: 10.1016/j.foodhyd.2016.10.026

    CrossRef   Google Scholar

    [2]

    Hadidi M, Aghababaei F, McClements DJ. 2023. Sunflower meal/cake as a sustainable protein source for global food demand: Towards a zero-hunger world. Food Hydrocolloids 147:109329

    doi: 10.1016/j.foodhyd.2023.109329

    CrossRef   Google Scholar

    [3]

    Li D, Hu X. 2011. Fatty acid content of commonly available nuts and seeds. In Nuts and seeds in health and disease prevention, eds. Preedy VR, Ross Watson R, Patel VB. 1st Edition. London, UK: Academic Press. pp. 35−42. https://doi.org/10.1016/B978-0-12-375688-6.10004-0

    [4]

    Yoshida H, Hirakawa Y, Abe S. 2001. Influence of microwave roasting on positional distribution of fatty acids of triacylglycerols and phospholipids in sunflower seeds (Helianthus annuus L.). European Journal of Lipid Science and Technology 103(4):201−7

    doi: 10.1002/1438-9312(200104)103:4<201::AID-EJLT201>3.0.CO;2-6

    CrossRef   Google Scholar

    [5]

    Shu XL, Frank T, Shu QY, Engel KH. 2008. Metabolite profiling of germinating rice seeds. Journal of Agricultural and Food Chemistry 56(24):11612−20

    doi: 10.1021/jf802671p

    CrossRef   Google Scholar

    [6]

    Dziki D, Gawlik-Dziki U, Kordowska-Wiater M, Domań-Pytka M. 2015. Influence of elicitation and germination conditions on biological activity of wheat sprouts. Journal of Chemistry 2015:649709

    doi: 10.1155/2015/649709

    CrossRef   Google Scholar

    [7]

    Charve J, Chen C, Hegeman AD, Reineccius GA. 2011. Evaluation of instrumental methods for the untargeted analysis of chemical stimuli of orange juice flavour. Flavour and Fragrance Journal 26(6):429−40

    doi: 10.1002/ffj.2078

    CrossRef   Google Scholar

    [8]

    Woo HM, Kim KM, Choi MH, Jung BH, Lee J, et al. 2009. Mass spectrometry based metabolomic approaches in urinary biomarker study of women's cancers. Clinica Chimica Acta 400(1-2):63−69

    doi: 10.1016/j.cca.2008.10.014

    CrossRef   Google Scholar

    [9]

    Wishart DS. 2016. Emerging applications of metabolomics in drug discovery and precision medicine. Nature Reviews Drug Discovery 15:473−84

    doi: 10.1038/nrd.2016.32

    CrossRef   Google Scholar

    [10]

    Toya Y, Shimizu H. 2013. Flux analysis and metabolomics for systematic metabolic engineering of microorganisms. Biotechnology Advances 31:818−26

    doi: 10.1016/j.biotechadv.2013.05.002

    CrossRef   Google Scholar

    [11]

    Schauer N, Fernie AR. 2006. Plant metabolomics: towards biological function and mechanism. Trends in Plant Science 11:508−16

    doi: 10.1016/j.tplants.2006.08.007

    CrossRef   Google Scholar

    [12]

    Wishart DS. 2008. Metabolomics: applications to food science and nutrition research. Trends in Food Science and Technology 19:482−93

    doi: 10.1016/j.jpgs.2008.03.003

    CrossRef   Google Scholar

    [13]

    Na Jom K, Frank T, Engel KH. 2011. A metabolite profiling approach to follow the sprouting process of mung beans (Vigna radiata). Metabolomics 7(1):102−17

    doi: 10.1007/s11306-010-0236-5

    CrossRef   Google Scholar

    [14]

    Amaral JS, Casal S, Seabra R M, Oliveira BPP. 2006. Effects of roasting on hazelnut lipids. Journal of Agricultural and Food Chemistry 54(4):1315−21

    doi: 10.1021/jf052287v

    CrossRef   Google Scholar

    [15]

    Anjum F, Anwar F, Jamil A, Iqbal M. 2006. Microwave roasting effects on the physico-chemical composition and oxidative stability of sunflower seed oil. Journal of the American Oil Chemists' Society 83(9):777−84

    doi: 10.1007/s11746-006-5014-1

    CrossRef   Google Scholar

    [16]

    Javidipour I, Erinç H, Baştürk A, Tekin A. 2017. Oxidative changes in hazelnut olive, soybean, and sunflower oils during microwave heating. International Journal of Food Properties 20(7):1582−92

    doi: 10.1080/10942912.2016.1214963

    CrossRef   Google Scholar

    [17]

    Walton D, Randall B, Poienou M, Nevenimo T, Moxon J, et al. 2017. Shelf Life of Tropical Canarium Nut Stored under Ambient Conditions. Horticulturae 3(1):24

    doi: 10.3390/horticulturae3010024

    CrossRef   Google Scholar

    [18]

    Lee SW, Jeung MK, Park MH, Lee SY, Lee JH. 2010. Effects of roasting conditions of sesame seeds on the oxidative stability of pressed oil during thermal oxidation. Food Chemistry 118(3):681−85

    doi: 10.1016/j.foodchem.2009.05.040

    CrossRef   Google Scholar

    [19]

    Vaidya B, Eun JB. 2013. Effect of roasting on oxidative and tocopherol stability of walnut oil during storage in the dark. European Journal of Lipid Science and Technology 115(3):348−55

    doi: 10.1002/ejlt.201200288

    CrossRef   Google Scholar

    [20]

    Basha SM, Young CT. 1985. Changes in the polypeptide composition of peanut (Arachis hypogaea L.) seed during oil roasting. Journal of Agricultural and Food Chemistry 33(3):350−54

    doi: 10.1021/jf00063a008

    CrossRef   Google Scholar

    [21]

    Damame SV, Chavan JK, Kadam SS. 1990. Effects of roasting and storage on proteins and oil in peanut kernels. Plant Foods for Human Nutrition 40(2):143−48

    doi: 10.1007/BF02193772

    CrossRef   Google Scholar

    [22]

    Mariod AA, Ahmed SY, Abdelwahab SI, Cheng SF, Eltom AM, et al. 2012. Effects of roasting and boiling on the chemical composition amino acids and oil stability of safflower seeds. International Journal of Food Science and Technology 47(8):1737−43

    doi: 10.1111/j.1365-2621.2012.03028.x

    CrossRef   Google Scholar

    [23]

    Lamberts L, Joye IJ, Beliën, T, Delcour JA. 2012. Dynamics of γ-aminobutyric acid in wheat flour bread making. Food Chemistry 130(4):896−901

    doi: 10.1016/j.foodchem.2011.08.004

    CrossRef   Google Scholar

    [24]

    Srisang N, Varanyanond W, Soponronnarit S, Prachayawarakorn S. 2011. Effects of heating media and operating conditions on drying kinetics and quality of germinated brown rice. Journal of Food Engineering 107(3-4):385−92

    doi: 10.1016/j.jfoodeng.2011.06.030

    CrossRef   Google Scholar

    [25]

    Siegmund B, Murkovic M. 2004. Changes in chemical composition of pumpkin seeds during the roasting process for production of pumpkin seed oil (Part 2: Volatile compounds). Food Chemistry 84(3):367−74

    doi: 10.1016/S0308-8146(03)00241-3

    CrossRef   Google Scholar

    [26]

    Shu CK. 1999. Pyrazine formation from serine and threonine. Journal of Agricultural and Food Chemistry 47(10):4332−35

    doi: 10.1021/jf9813687

    CrossRef   Google Scholar

    [27]

    Kim SJ, Yoon HN, Rhee JS. 2000. Effects of roasting temperatures on the formation of headspace volatile compounds in perilla seed oil. Journal of the American Oil Chemists' Society 77(4):451

    doi: 10.1007/s11746-000-0073-x

    CrossRef   Google Scholar

    [28]

    Li CC, Hou LX. 2018. Review on volatile flavor components of roasted oilseeds and their products. Grain & Oil Science and Technology 1(4):151−56

    doi: 10.3724/sp.j.1447.gost.2018.18052

    CrossRef   Google Scholar

    [29]

    Agila A, Barringer S. 2012. Effect of roasting conditions on color and volatile profile including HMF level in sweet almonds (Prunus dulcis). Food Science 77(4):C461−C468

    doi: 10.1111/j.1750-3841.2012.02629.x

    CrossRef   Google Scholar

    [30]

    Vázquez-Araújo L, Verdú A, Navarro P, Martínez-Sánchez F, Carbonell-Barrachina ÁA. 2009. Changes in volatile compounds and sensory quality during toasting of Spanish almonds. International Journal of Food Science and Technology 44:2225−33

    doi: 10.1111/j.1365-2621.2009.02063.x

    CrossRef   Google Scholar

    [31]

    Jing B, Guo R, Wang M, Zhang L, Yu X. 2020. Influence of seed roasting on the quality of glucosinolate content and flavor in virgin rapeseed oil. LWT 126:109301

    doi: 10.1016/j.lwt.2020.109301

    CrossRef   Google Scholar

    [32]

    Lee J, Vázquez-Araújo L, Adhikari K, Warmund M, Elmore J. 2011. Volatile compounds in light medium, and dark black walnut and their influence on the sensory aromatic profile. Journal of Food Science 76(2):C199−C204

    doi: 10.1111/j.1750-3841.2010.02014.x

    CrossRef   Google Scholar

    [33]

    Vázquez-Araújo L, Enguix L, Verdú A, García-García E, Carbonell-Barrachina AA. 2008. Investigation of aromatic compounds in toasted almonds used for the manufacture of turrón. European Food Research and Technology 227(1):243−54

    doi: 10.1007/s00217-007-0717-6

    CrossRef   Google Scholar

  • Cite this article

    Guo S, Lan W, Chen X, Ge Y. 2024. Exploring the metabolic and flavoromic variations of germinated sunflower seed during roasting conditions. Food Materials Research 4: e012 doi: 10.48130/fmr-0024-0004
    Guo S, Lan W, Chen X, Ge Y. 2024. Exploring the metabolic and flavoromic variations of germinated sunflower seed during roasting conditions. Food Materials Research 4: e012 doi: 10.48130/fmr-0024-0004

Figures(6)  /  Tables(4)

Article Metrics

Article views(3263) PDF downloads(403)

Other Articles By Authors

ARTICLE   Open Access    

Exploring the metabolic and flavoromic variations of germinated sunflower seed during roasting conditions

Food Materials Research  4 Article number: e012  (2024)  |  Cite this article

Abstract: The metabolite and flavor characteristics of roasted germinated sunflower seeds (RGSF) were evaluated and compared with those of roasted ungerminated sunflower seeds (RUSF) by gas chromatograph-flame ionization detector (GC-FID) and headspace solid phase microextraction combined with gas chromatography-mass spectrometry (HS-SPME-GC-MS). During roasting, α-tocopherol, β-sitosterol, fructose, and glucose content were higher at 125 °C compared to those at 135 and 145 °C in RGSF, and lower reductions of alanine, glycine, phenylalanine, serine, asparagine, and γ-aminobutyric acid (GABA) content at 125 °C in RGSF. Considering their nutritional value, it is suggested that sunflower seeds are roasted at 125 °C. The dominant volatile compounds in RGSF were α-pinene, furfural, pyrazines, 1-octen-3-ol, and 2-methylbutanal. High-temperature heating for long term led to a large accumulation of unpleasant odors like pyridine, hexanal and nonanal, especially in RUSF. To examine the distribution of the individual metabolites and flavor compounds among different roasting conditions. A heatmap diagram combined with agglomerative hierarchical clustering (AHC) analysis and principal component analysis (PCA) showed that most Maillard reaction substitutes (amino acids and reducing sugars), products (2-methylpyrazine 2-ethyl-3,5-dimethyl-pyrazine, and 3-ethyl-2,5-dimethylpyrazine), and Strecker degradation products (3-methylbutanal, 2-methylbutanal, and isobutanal) contributed to separate RGSF from RUSF.

    • Sunflower seed is an important economic oil seed worldwide after soybean, palm and rapeseed[1]. Global sunflower seed production was estimated to be over 50 million tons in 2022/2023[2]. It is primarily consumed as vegetable oil and meal, either alone or in the blends of different nuts and other components[3]. Sunflower seeds not only have potential as a protein source but also have high nutritional value in the human diet due to their excellent nutritional quality and relatively low content of anti-nutrient factors, which provide a large number of antioxidants, minerals, and unsaturated fatty acids.

      Roasting is a great way to prepare the seeds for snacking. During the roasting process, not only is the typical nutty aroma formed, but with the high-temperature heating, nutrients change. Sunflower seeds are susceptible to oxidation during roasting and storage[4]. The rate of oxidation and rancidity of fat are highly dependent on the roasting time and temperature. Thus optimum roasting temperature and time are necessary for addition to desirable flavor and nutritional quality. To improve the nutritional quality of sunflower seeds, seed germination technology has been extensively used as the nutritional components of entire seeds are increased during germination, such as free amino acids, dietary fiber, minerals, phenolic compounds and antioxidant capacity[5,6]. Therefore, the germinated and ungerminated sunflower seeds were used as materials for investigating the effects of roasting conditions on metabolite and flavoromic profiles of sunflower seeds.

      Metabolomics and Flavouromics are novel omics studies used for considering overall targeted and non-targeted compounds in food[7]. Metabonomics has been used in many research fields, including medicine[8,9], microbiology[10], horticulture[11] and nutrition[12], to understand metabolic reactions and to identify metabolites/biomarkers associated with given conditions or treatments. In the last few years, flavor profiling has been used in many fields. One of the most promising applications in profiling of volatile organic compounds is the HS-SPME-GC-MS. This is a useful technique that allows the collection of sensory analysis to detect the overall aromatic spectrum of samples. It is a new technology that enables the acquisition of the sensory analysis for the detection of the overall aromatic profile of samples. PCA and AHC which give an overview of useful data to detect outliers and evaluate the relationships between samples and variables and between variables themselves.

      As far as we know, it is the first application of metabolite and flavor profiling being applied for metabolite and flavor analysis of sunflower seed roasted at different temperatures and times. Detailed untargeted metabolite and flavor of sunflower seeds can provide the opportunity to better understand the relevant roasting process. The aim is to find the effects of roasting conditions on the metabolite and flavor profiles of sunflower seeds.

    • Sunflower seeds were bought in a local Thai market. The seeds were placed in aluminum foil bags and then stored in the refrigerator at 4 °C. The seeds were then germinated for further analysis.

    • Internal standard for semi-quantitative of fraction I was tetracosane, 5α-cholestan-3ß-ol was used as an internal standard for fraction II, phenyl-β-D-glucopyranoside was for fraction III, and p-chloro-L-phenylalanine was for fraction IV. Retention time standards were undecane, hexadecane, tetracosane, triacontane, octatriacontane. The reagents were bought from Sigma (Sigma-Aldrich, St. Louis, MO, USA).

      Ethyl decanoate was used as an internal standard for volatile compounds. The reference standards used for volatile compounds identification experiments were prepared with 0.5% (weight/volume) concentration of acetone. N-alkanes (C6−C26) were used as the criterion for the calculation of the retention index. All the reference standards for volatiles identification were purchased from Sigma-Aldrich, USA.

    • Soak 400 g seeds in 2 l of distilled water at room temperature for 8 h. The soaked sunflower seeds were placed in an incubator with humidity type KBF 240 (Binder, Tuttlingen, Germany) in darkness at 25 °C for 24 h. Germinated and ungerminated seeds were baked in an oven (Model UF55, Memmert, Thailand) at 125, 135, and 145 °C for 30−60 min. The seeds were cooled to room temperature, husked and ground by the grinder (Panasonic, Japan), and packaged in the aluminum bag. Raw sunflower seed was used as a control sample.

    • The procedures for extraction and fractionation of sunflower flour followed a previous method with some modifications[13]. Fraction I contained fatty acid methyl esters (FAMEs) and hydrocarbons, fraction II contained free fatty acids (FFAs) and sterols, fraction III contained silylated sugars and sugar alcohols, and fraction IV contained organic acids and amino acids. GC-FID analysis was run by an Agilent Technologies HP 6890+ equipped with FID (320). Obtain and integrate GC-FID data using HP-ChemStation A.06.03 (Hewlett Packard, Polo Alto, CA, USA). The capillary column was DB-1 (60 m × 0.32 mm, 0.25 μm) (J&W Scientific, Agilent, USA). The flow rate of helium was 1.8 ml/min. The splitless injection was performed at 280 °C. The initial column temperature was set at 100 °C, then it rose to 320 °C at 4 °C/min (maintained for 15 min). The components of sunflower seed were identified by comparison of retention time between the analyte chromatographic peak and the reference standard chromatographic peak.

    • One mg/ml ethyl decanoate was dissolved in 10% methanol. Ethyl decanoate was added to sunflower seed powder in the proportion of 100 μg/2 g. The sample was incubated for 20 min at 60 °C for the equilibration of the volatiles. A 50/30 μm DVB/CAR/PDMS SPME fiber (57348-U, Supelco) was inserted into the headspace bottle, and the headspace extraction was carried out at 60 °C for 30 min.

      The volatile components were analyzed by an Agilent 7890A gas chromatograph equipped with a 5975C mass spectrometer. A DB-1 (60 m × 0.25 mm, 0.25 μm) MS column was used for GC-MS. The volatiles were thermally desorbed for 20 min at 250 °C in a splitless mode. Helium entered the column at a constant flow rate of 1.5 ml/min. The initial oven temperature was 50 °C for 1 min. Next, the temperature rose to 100 °C at 5 °C/min (for 5 min), then to 140 °C at 4 °C/min (for 5 min), then to 180 °C at 5 °C/min (for 2 min), and finally to 250 °C at 10 °C/min (for 7 min). The source temperature of mass spectrometer was 230 °C, the transmission line temperature was 225 °C, and the quadrupole temperature was 150 °C. The ionization voltage was 70 eV and the scanning range was m/z 50-550.

      Pure component mass spectra were automatically extracted from highly complex GC-MS data files using AMDIS (Automated Mass Spectral Deconvolution and Identification System, version 2.66, USA). These purified spectra were used for a search in a mass spectral library. The volatile compounds were identified according to the NIST library (NIST 11, Version 2.0, Gaithersburg, USA) and comparison mass spectra with reference standards. Based on the internal standard area, the relative concentration of each compound was calculated.

    • PCA and AHC analysis were used to analyze the correlation between and within groups. The data were subjected to one-way analysis of variance (ANOVA) by XLSTAT version 2016.7 (Addinsoft, NY, USA). Differences between means were assessed with Tukey's range test at a 95% significance level (p < 0.05).

    • This study investigated the metabolic and flavor profiles of 19 samples (including 18 roasting treatment samples and the raw sample) obtained from RUSF and RGSF at 125, 135, and 145 °C for 30, 45, and 60 min. A total of 169 metabolites and flavor compounds identified by GC-FID and HS-SPME-GC-MS were analyzed using PCA (Spearman correlation) to determine the main sources of variation in the dataset (Fig. 1). PC1 and PC2 explained 44.29% of the data variability of 169 compounds. The clustering of RUSF grouped to the right was separated from the clustering of RGSF grouped to the left. The aldehydes (2-methylbutanal, 3-methybutanal, isobutanal, 2-phenyl-2-butenal), pyrazines (2,3-dimethylpyrazine, 3-ethyl-2,5-dimethylpyrazine, 2-methylpyrazine) and 2-heptanone were grouped to the top side on PC2 (positively associated with RGSF at the higher temperature). The amino acids and reducing sugars were grouped to the left side (negatively associated with RGSF).
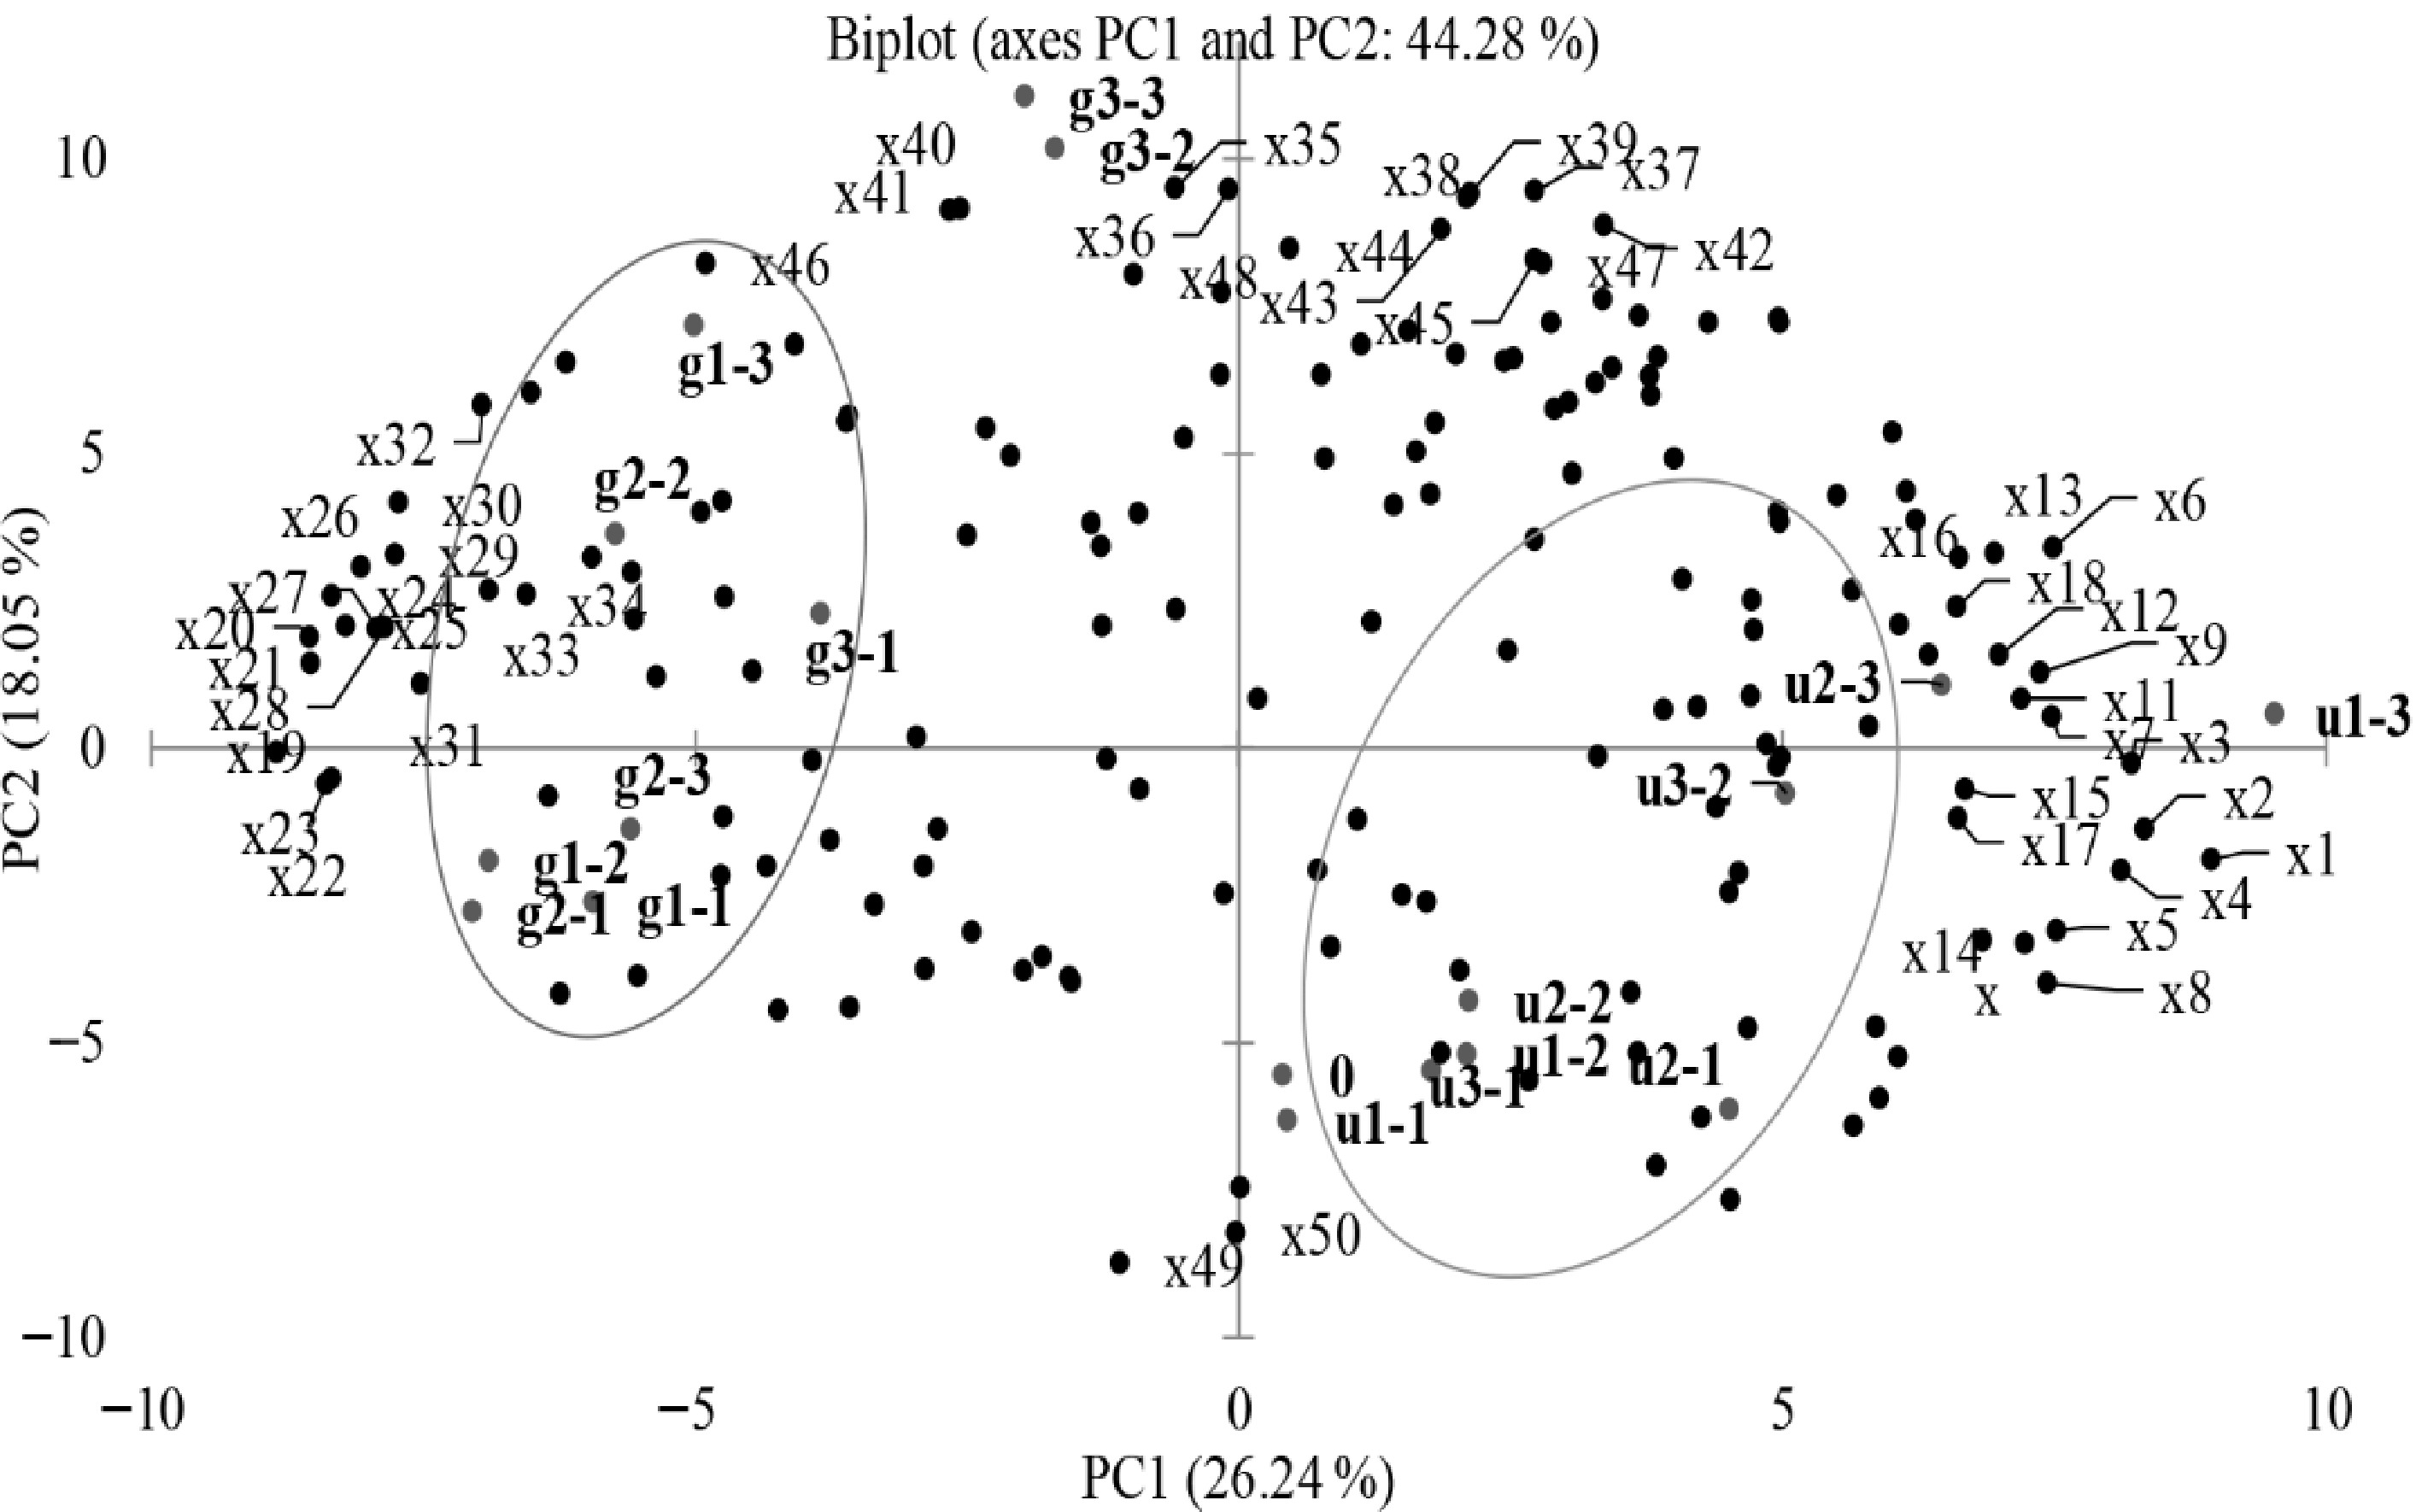
      Figure 1. 

      Biplot of metabolic and flavor profiles of RUSF and RGSF. Compound codes are explained in Table 1 (loading score higher than or equal to 0.7). The sample names represent RUSF described as: u1-1 = 125 °C 30 min, u1-2 = 125 °C 45 min, u1-3 = 125 °C 60 min, u2-1 = 135 °C 30 min, u2-2 = 135 °C 45 min, u2-3 = 135 °C 60 min, u3-1 = 145 °C 30 min, u3-2 = 145 °C 45 min, u3-3 = 145 °C 60 min. The sample names represent RGSF described as: g1-1 = 125 °C 30 min, g1-2 = 125 °C 45 min, g1-3 = 125 °C 60 min, g2-1 = 135 °C 30 min, g2-2 = 135 °C 45 min, g2-3 = 135 °C 60 min, g3-1 = 145 °C 30 min, g3-2 = 145 °C 45 min, g3-3 = 145 °C 60 min

      To examine the distribution of the individual metabolite and flavor compound among different roasting conditions, a heatmap diagram combined with AHC was applied for the selected 50 compounds which had a loading value higher than 0.7 (Fig. 2). The 50 compounds are shown in Table 1. Amino acids and reducing sugars were higher in RGSF compared to RUSF because of the increase of these metabolites during germination. Meanwhile, RGSF appears to have higher levels of pyrazines (2-methylpyrazine 2-ethyl-3,5-dimethyl-pyrazine, and 3-ethyl-2,5-dimethylpyrazine). The grouping result of AHC followed the PCA which grouped the samples into two groups. The most volatile compounds were clustered to the left. The majority of metabolites, Maillard reaction substitutes (amino acids and reducing sugars), products (pyrazines), and Strecker degradation products (3-methylbutanal, 2-methylbutanal, and isobutanal) clustered to RGSF group. The observed differentiation between RUSF and RGSF reflected the volatile compounds were formed more in RUSF compared to RGSF. The groups of shorter roasting times were separated from those of longer roasting times both in RUSF and RGSF. The results indicated that the metabolic and flavor profiles were affected by temperature and time significantly.
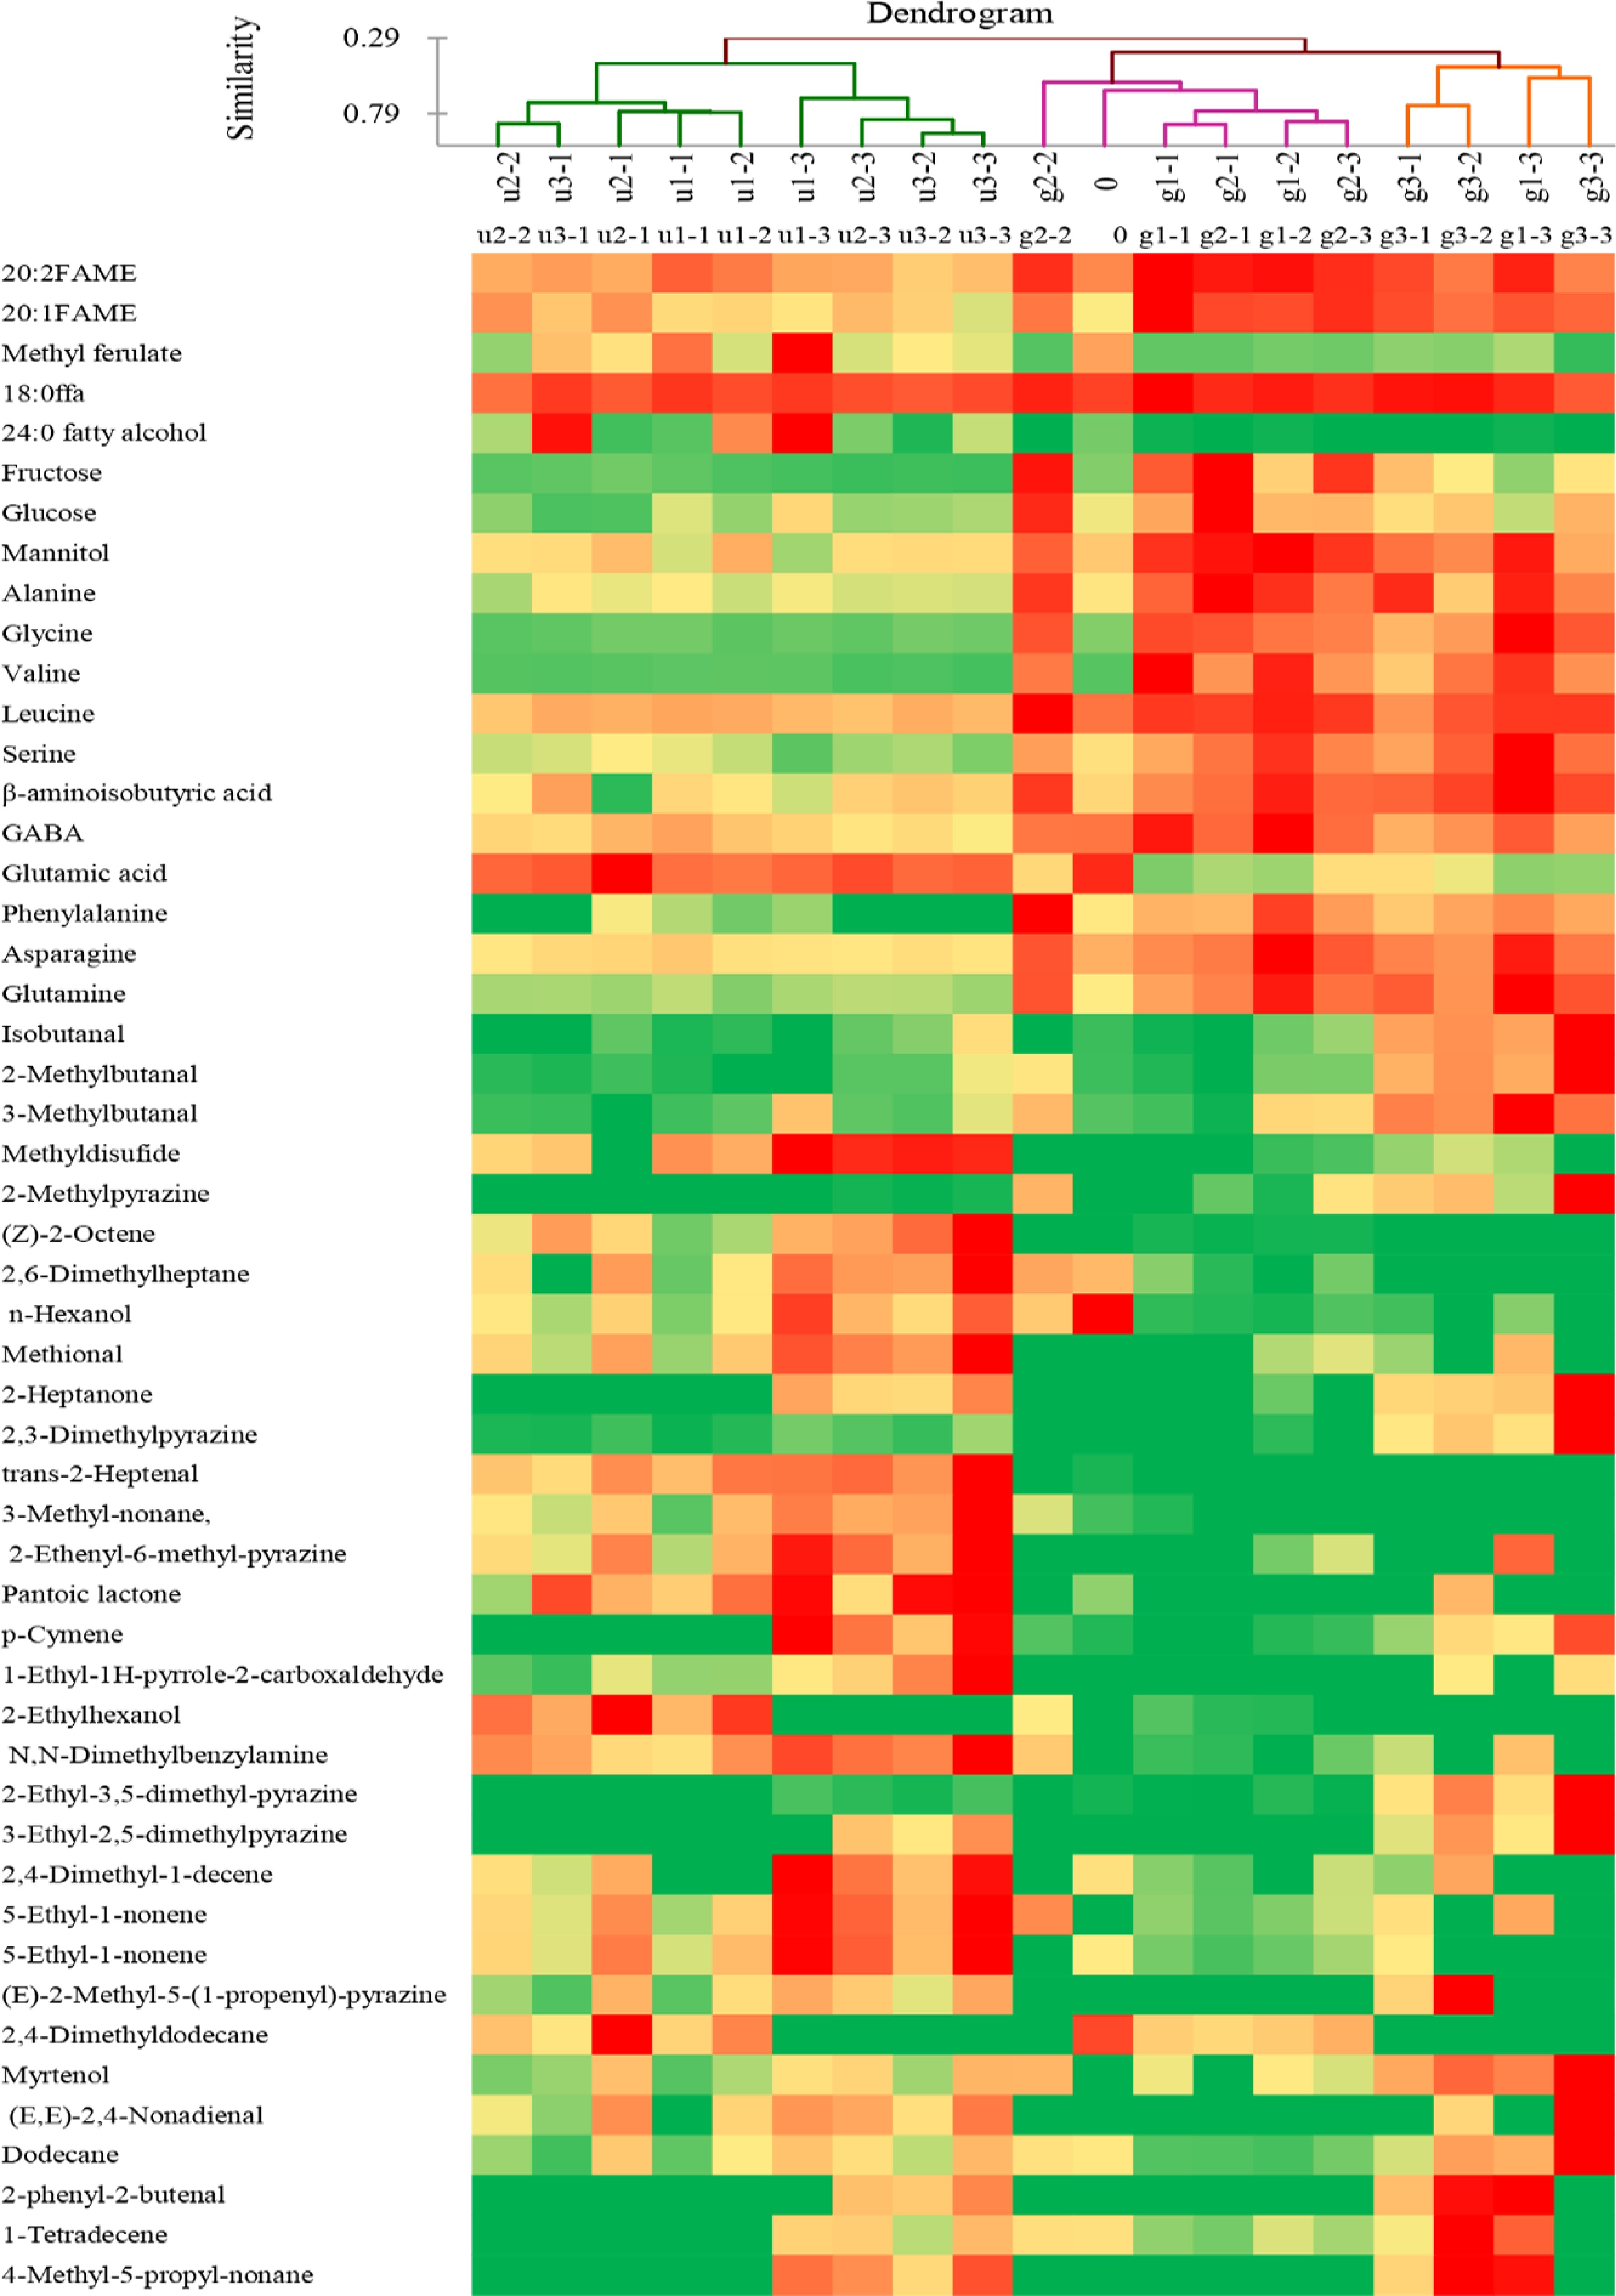
      Figure 2. 

      Heatmap and AHC dendrogram of metabolic and flavor profiles of RUSF and RGSF. The compounds with loading scores higher than 0.7 were presented in the heatmap. Metabolite levels correspond to the color temperature. The higher the temperature (red), the higher the content of the corresponding compound.

      Table 1.  Varimax rotated factor loadings of the significant principal components of the metabolic and flavor profiles of RUSF and RGSF.

      PCA codeCompoundsPC1PCA codeCompoundsPC1
      x1trans-2-Heptenal0.960x27Valine−0.850
      x23-Methyl-nonane0.894x28Mannitol−0.842
      x3Pantoic lactone0.881x29Glycine−0.832
      x45-Ethyl-1-nonene0.871x30Glutamine−0.828
      x5(Z)-2-Octene0.807x3120:1FAME−0.806
      x61-Ethyl-1H-pyrrole-2-carboxaldehyde0.804x32β-Aminoisobutyric acid−0.745
      x7N,N-Dimethylbenzylamine0.802x33Glucose−0.739
      x824:0 fatty alcohol0.798x3418:0ffa−0.701
      x9Methional0.791
      x10Glutamic acid0.776PC2
      x112-Ethenyl-6-methyl-pyrazine0.772x35Myrtenol0.846
      x12Methyldisufide0.751x362-Ethyl-3,5-dimethyl-pyrazine0.844
      x13(E)-2-Methyl-5-(1-propenyl)-Pyrazine0.746x37p-Cymene0.840
      x14Methyl ferulate0.735x382-Heptanone0.837
      x152,6-Dimethylheptane0.717x393-Ethyl-2,5-dimethylpyrazine0.831
      x162,4-Nonadienal,(E,E)-0.711x403-Methylbutanal0.813
      x17n-Hexanol0.710x412-Methylbutanal0.813
      x182,4-Dimethyl-1-decene0.709x424-Methyl-5-propyl-nonane0.789
      x19Fructose−0.948x432-Phenyl-2-butenal0.782
      x20Asparagine−0.916x441-Tetradecene0.754
      x21Leucine−0.914x45Dodecane0.738
      x2220:2FAME−0.900x462-Methylpyrazine0.732
      x23GABA−0.894x472,3-Dimethylpyrazine0.731
      x24Serine−0.893x48Isobutanal0.714
      x25Alanine−0.879x492,4-Dimethyldodecane−0.778
      x26Phenylalanine−0.865x502-Ethylhexanol−0.732
    • Changes in the representation of different metabolites observed during the roasting process are shown in Figs 36. FAMEs detected in fraction I were produced by transesterification of lipid extract. In our previous study, FAMEs decreased significantly (p < 0.05) after germination. Therefore, the contents of FAMEs were lower in RGSF compared to those in RUSF (Fig. 3). In RUSF, roasting resulted in increases in C16:0, C18:0, and C18:1, and a decrease in C18:3. Roasting temperature and time influenced the composition of C18:2 to a small extent in RGSF, but the decrease of C18:2 occurred in RUSF. The results indicated that roasting resulted in a loss of the content of unsaturated fats. Previous studies also showed that higher baking temperatures of soybeans and hazelnuts resulted in higher relative percentages of saturated fat acids, while lower relative percentages of polyunsaturated fatty acids[14]. C16:0 increased at 125 °C, an even more increase was observed at 135 and 145 °C in RUSF and RGSF. C18:0 showed the same behavior. The results indicated that roasting resulted in a loss of the content of unsaturated fats (C18:2 and C18:3) and an increase of C18:1. This difference might be attributed to hydrolytic and oxidative degradation of the lipid fraction during roasting. An increase of C18:1 has been also reported for 15 min microwave roasting of sunflower seeds[15]. However, microwave heating for 9 min did not remarkably affect the fatty acid composition of sunflower seeds[16].
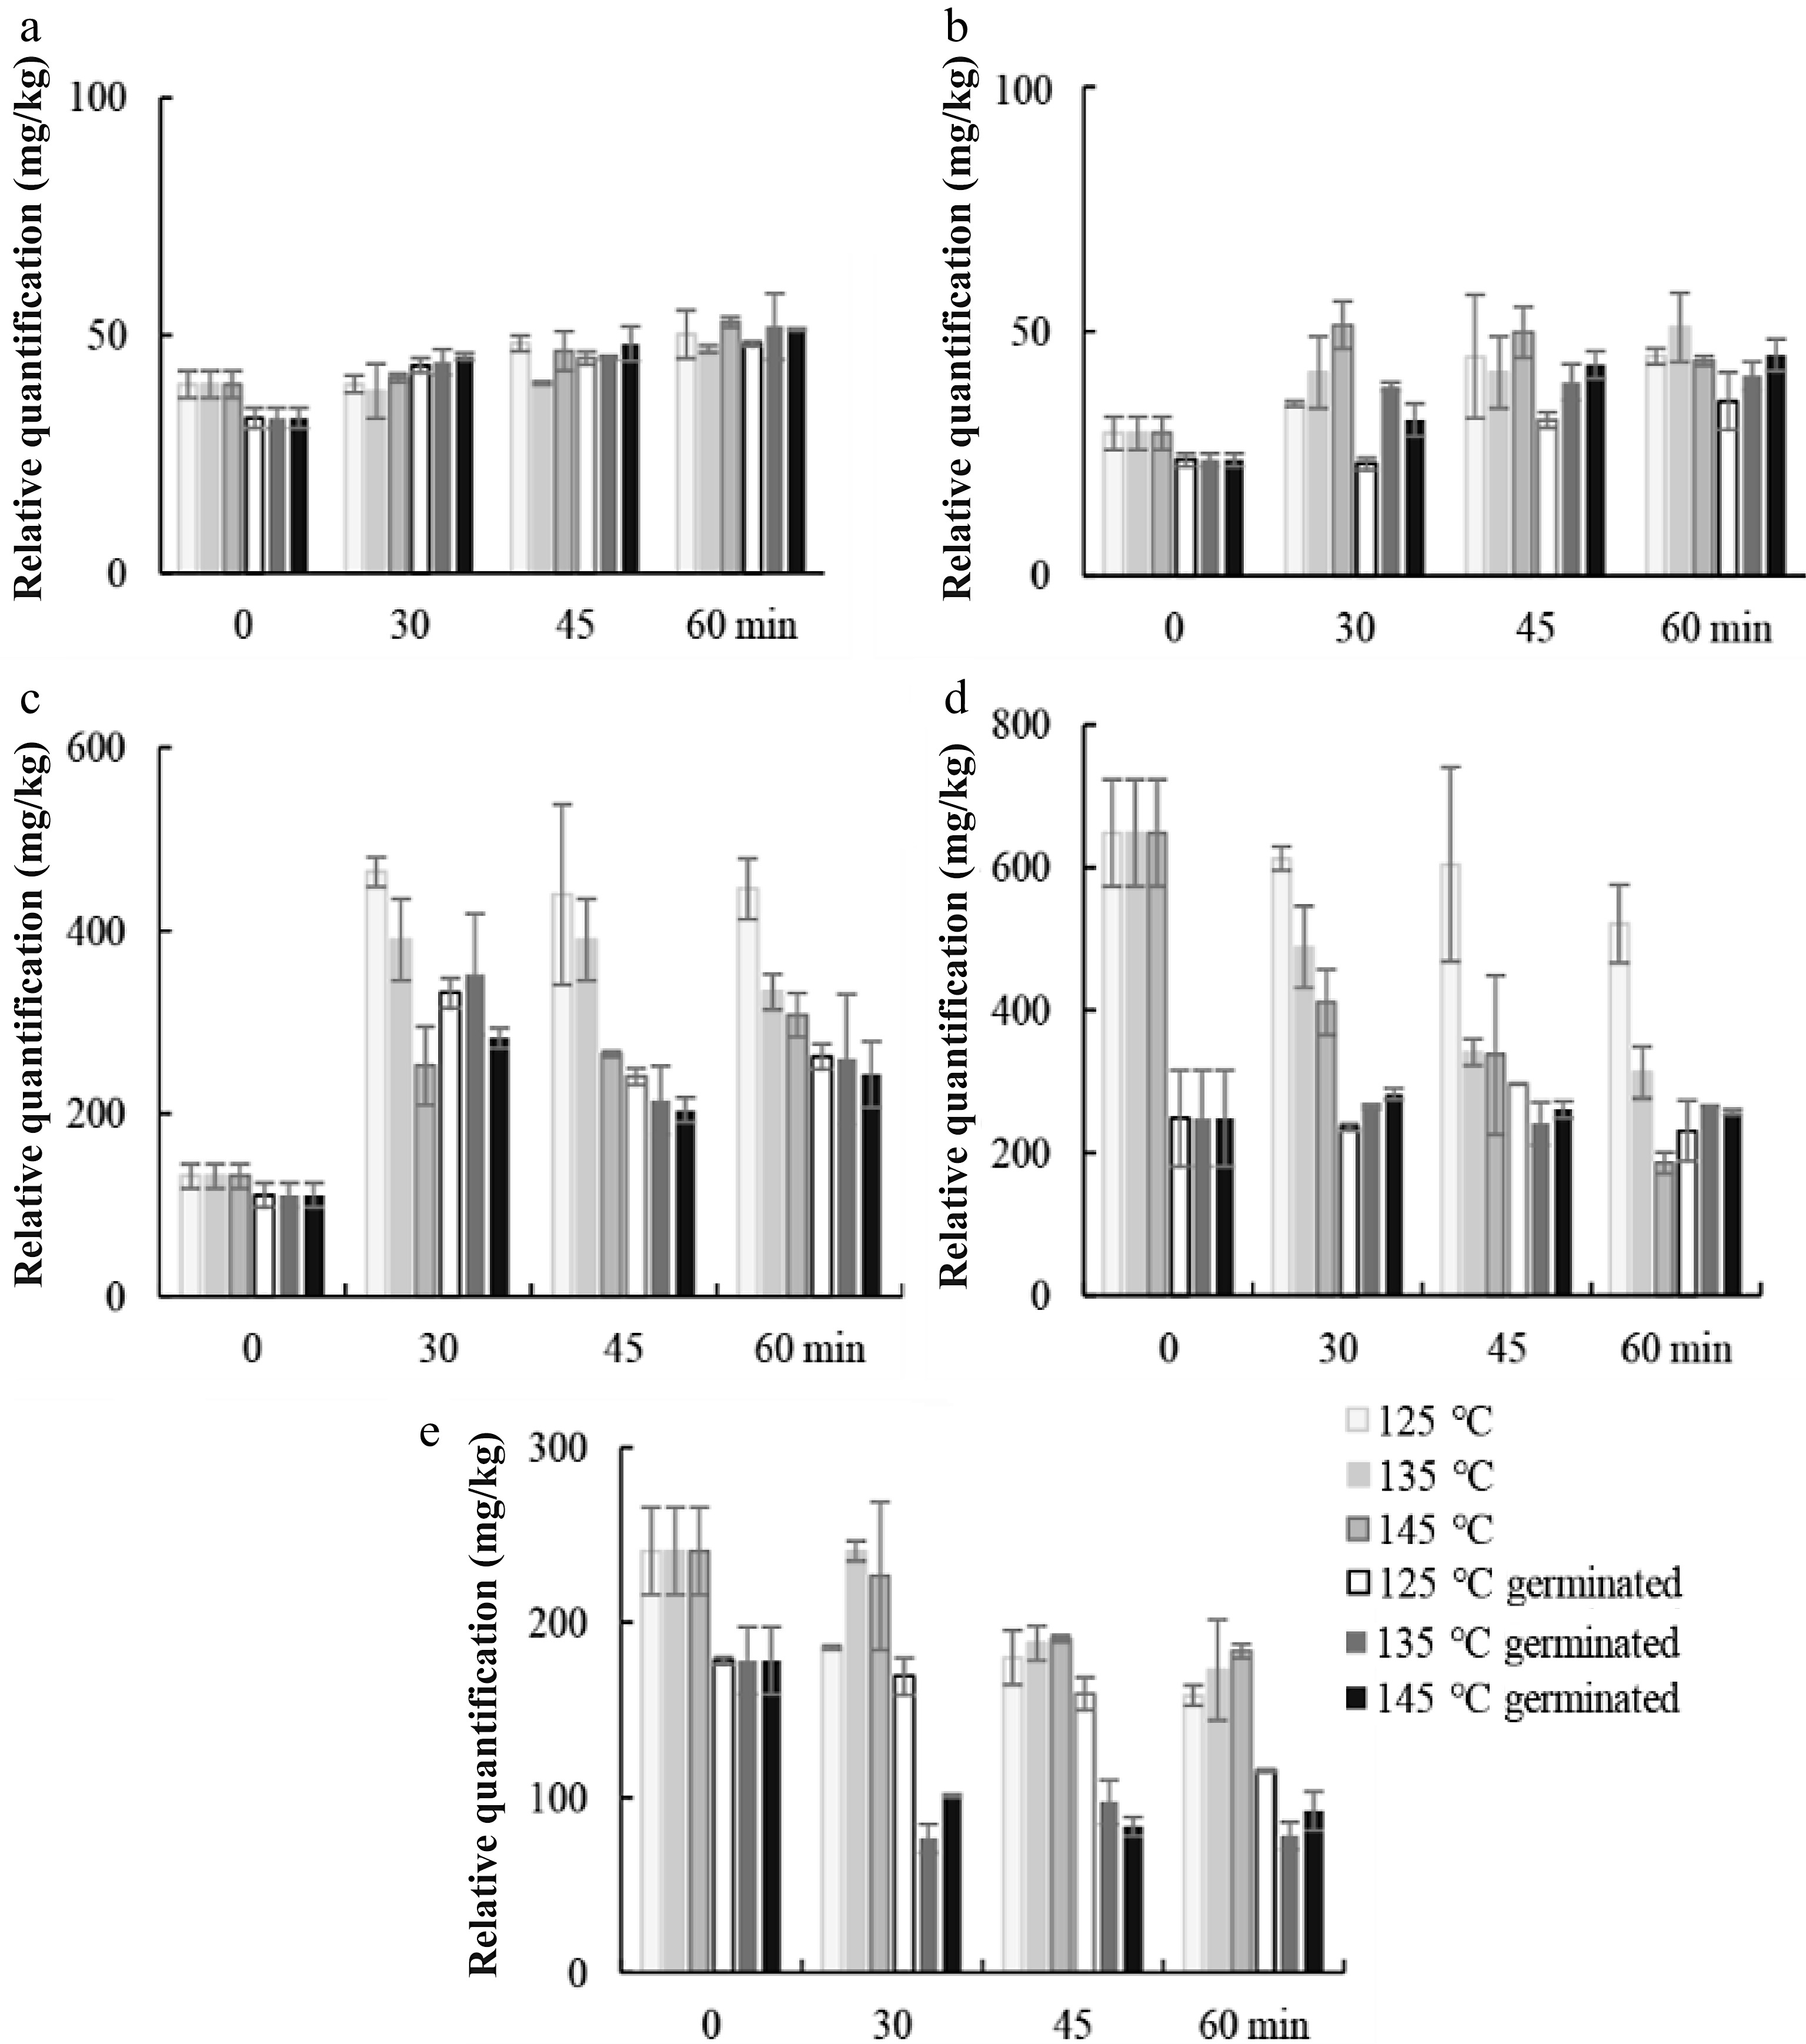
      Figure 3. 

      Changes in relative quantification of representative compounds in fraction I. (a) C16:0 FAME, (b) C18:0 FAME, (c) C18:1 FAME, (d) C18:2 FAME, and (e) C18:3 FAME during roasting of ungerminated and germinated sunflower seeds at 125, 135, and 145 °C.

      Peroxide value (PV) and FFA are evidence of autoxidation and hydrolytic rancidity, respectively[17]. The content of FFAs of sunflower seeds submitted to the different roasting conditions are presented in Fig. 4. The predominant FFAs in sunflower seed were C16:0, C18:0, C18:1, C18:2, and C18:3. C18:1, C18:2, and C18:3 was more affected by roasting than C16:0 and C18:0. Roasting at 145 °C for 60 min caused the reduction of FFAs especially for unsaturated FFAs. The longer the roasting time, the less the content of C18:1, C18:2, and C18:3. The higher the temperature, the more the reduction of C18:1, C18:2, and C18:3. Sesame seeds roasted at high temperature long term increases more lipid oxidation products[18]. As FFAs increased at the first 24 h of germination in our previous study, FFAs content in germinated sunflower was higher compared to that in RUSF during roasting. The lower decrease of C18:3 in RGSF compared to that in RUSF may be due to the higher content of α-tocopherol present in germinated seeds, slow down the lipid oxidation rate. However, the higher decrease of C18:1 was observed in RGSF. The results were similar to a previous report[15].
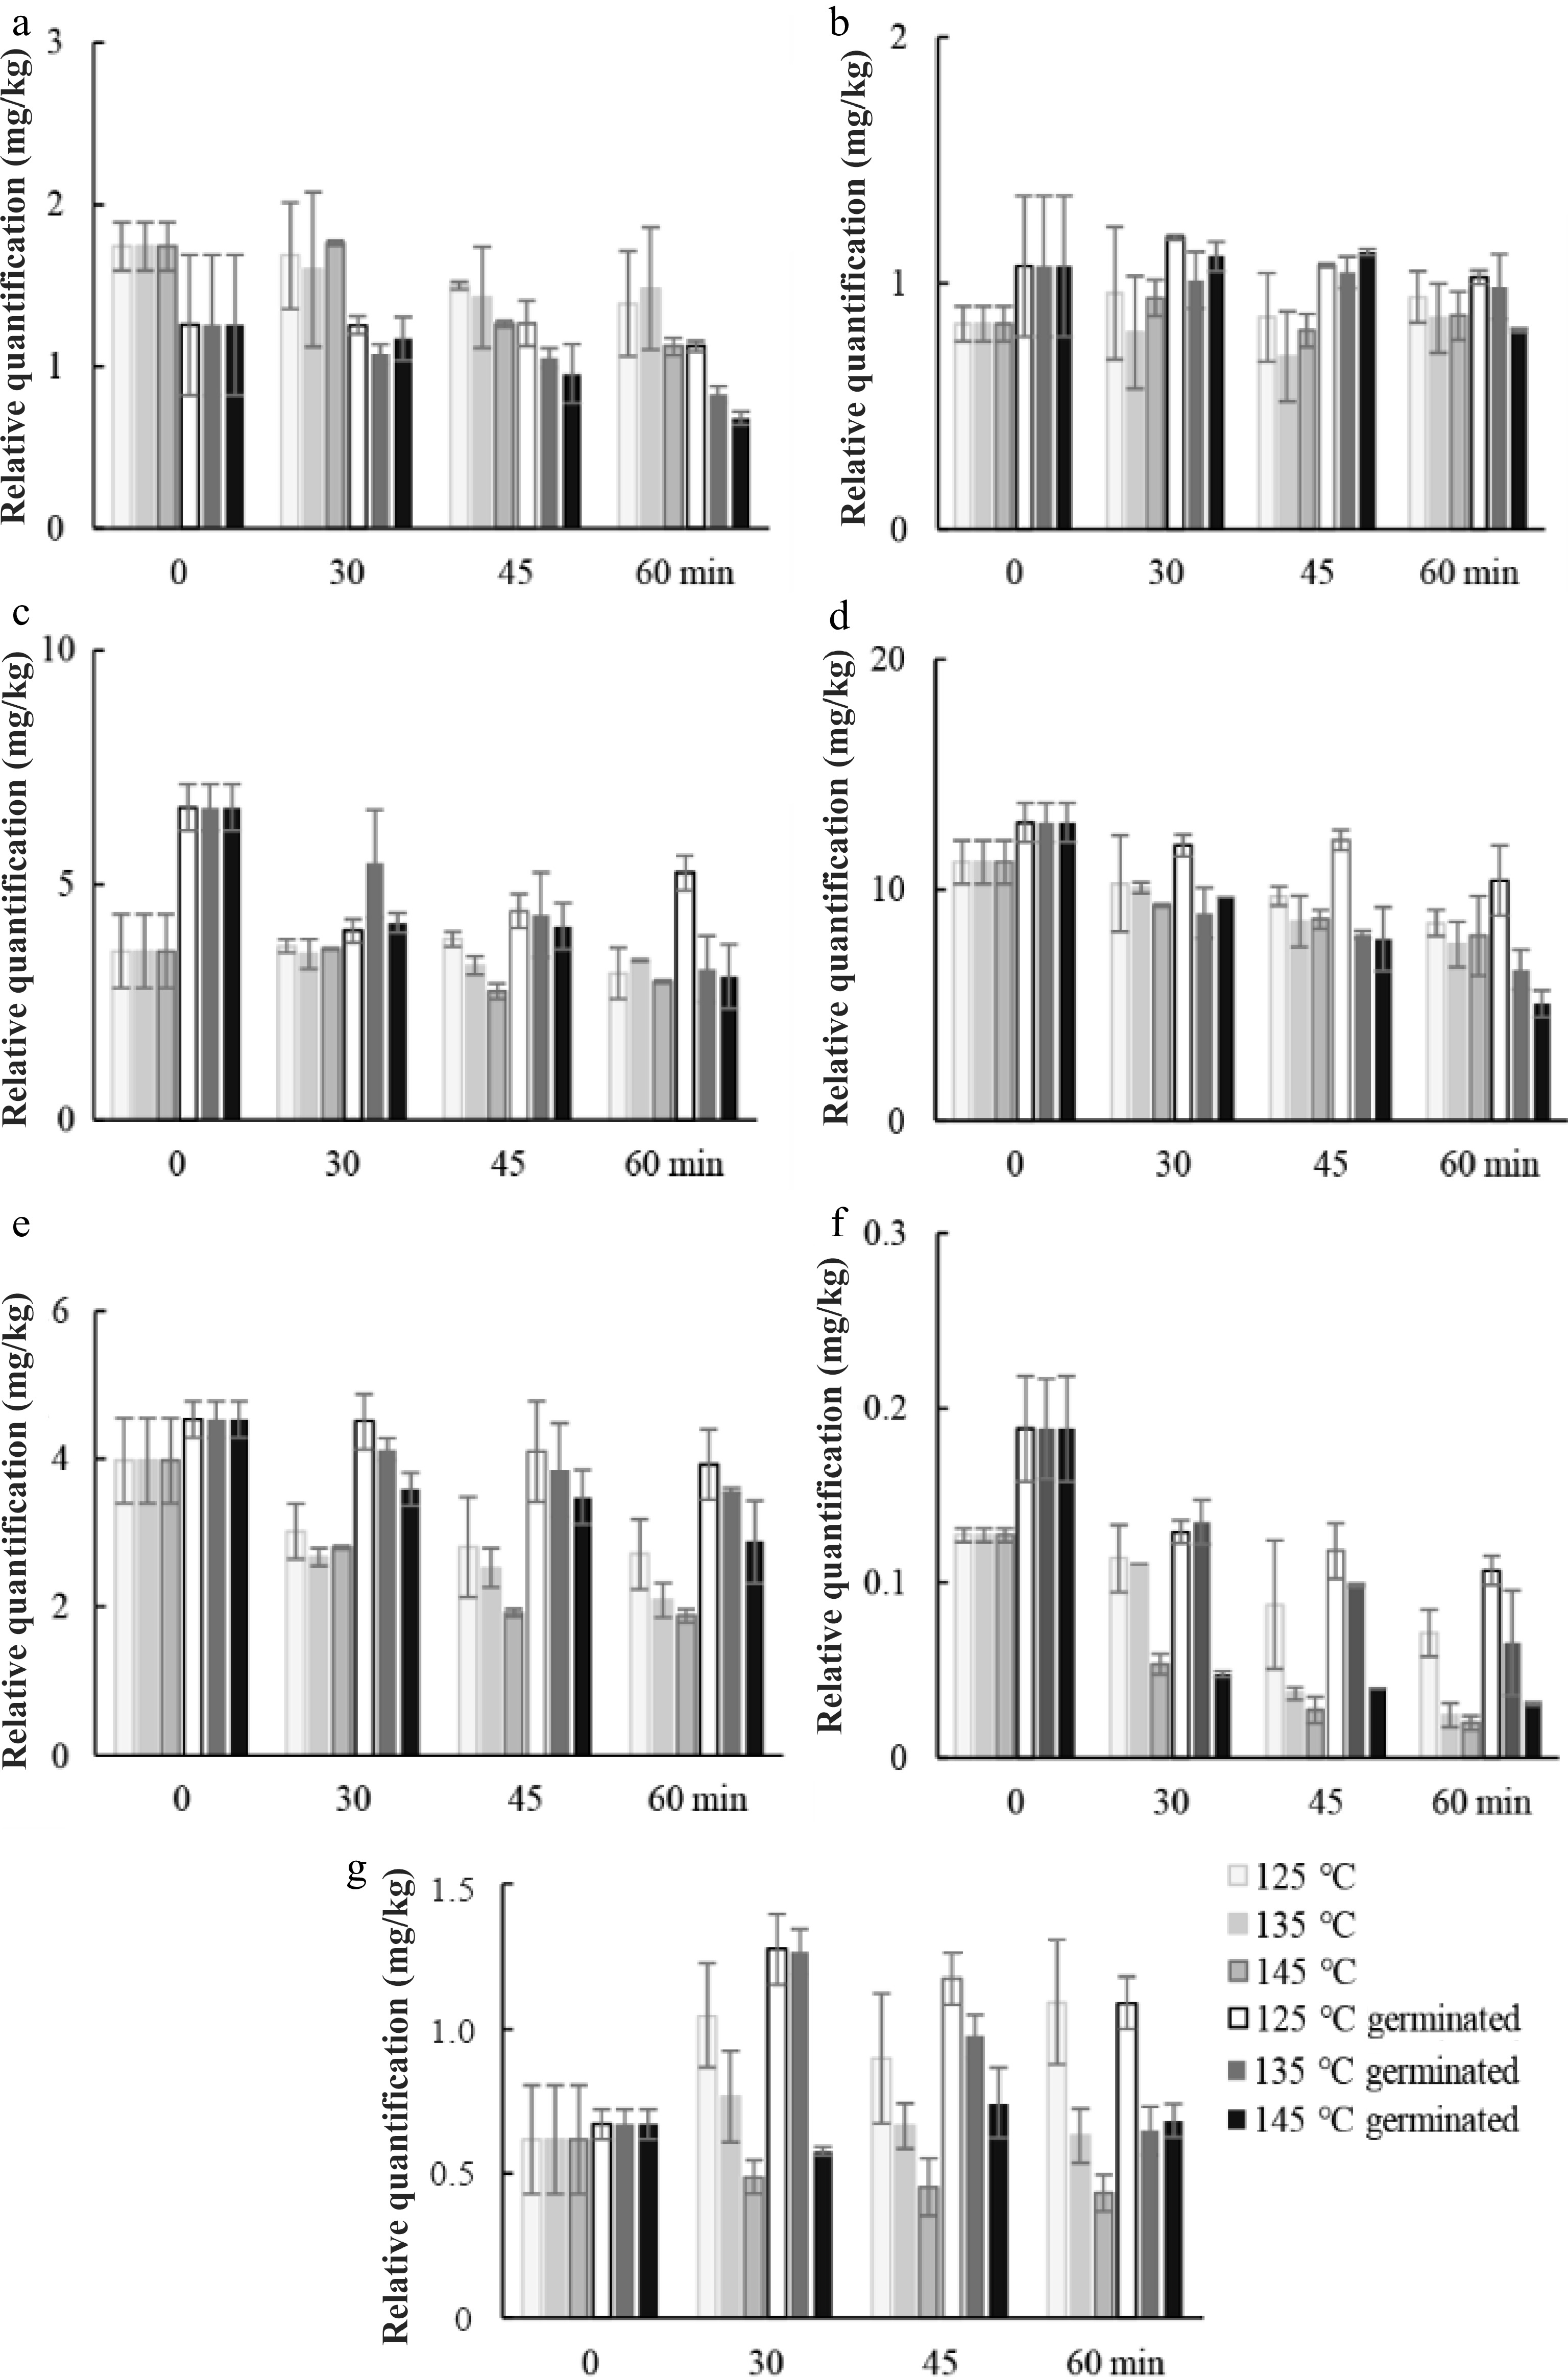
      Figure 4. 

      Changes in relative quantification of representative compounds in fraction II. (a) C16:0 ffa, (b) C18:0 ffa, (c) C18:1 ffa, (d) C18:2 ffa, (e) C18:3 ffa, (f) α-tocopherol, and (g) β-sitosterol during roasting of germinated and ungerminated sunflower seeds at 125, 135, and 145 °C.

      The effect of roasting on α-tocopherol content of the sunflower seeds is shown in Fig. 4. α-Tocopherol was the predominant tocopherol in the sunflower seeds. Germination increased α-tocopherol. As the results revealed, α-Tocopherols in ungerminated and germinated sunflower seeds exposed to roasting significantly (p < 0.05) decreased with temperature and time. The result was in agreement with those of Vaidya & Eun[19]. As a-tocopherol is not stable, higher temperatures and long-time heating resulted in a large loss of α-tocopherol. The highest content of α-tocopherol was observed at 125 °C for 30 min in RGSF. The value of α-tocopherol in different oils reported in the previous study was comparable to this study. Alpha-Tocopherol reduced around 20% after 15 min by microwave heating[15]. The highest rate of loss of α-tocopherol during heating was reported in the sunflower seeds[4].

      Sterols, mainly found in the cell membranes are steroid alcohols, they are hydrophobic, hence, typically associated with the lipid fraction in plants. The sterols found in sunflower oils include β-sitosterol, stigmasterol, and campesterol. The change observed for β-sitosterol is shown in Fig. 4. An increase of β-sitosterol was observed in RUSF and RGSF at 125 and 135 °C less than 45 min, and increased more at 125 °C in RGSF compared to that in RUSF. While β-Sitosterol significantly decreased (p < 0.05) at 145 °C in RGSF and RUSF.

      Fructose and glucose concentration was significantly higher (p < 0.05) in RGSF as a result of germination (Fig. 5). Roasting at 145 °C for a longer duration (45 and 60 min) might cause a higher reduction of fructose and glucose as the result of Maillard reaction. Sucrose decreased in RUSF and RGSF except for 125 °C of roasting, while mannitol increased during roasting.
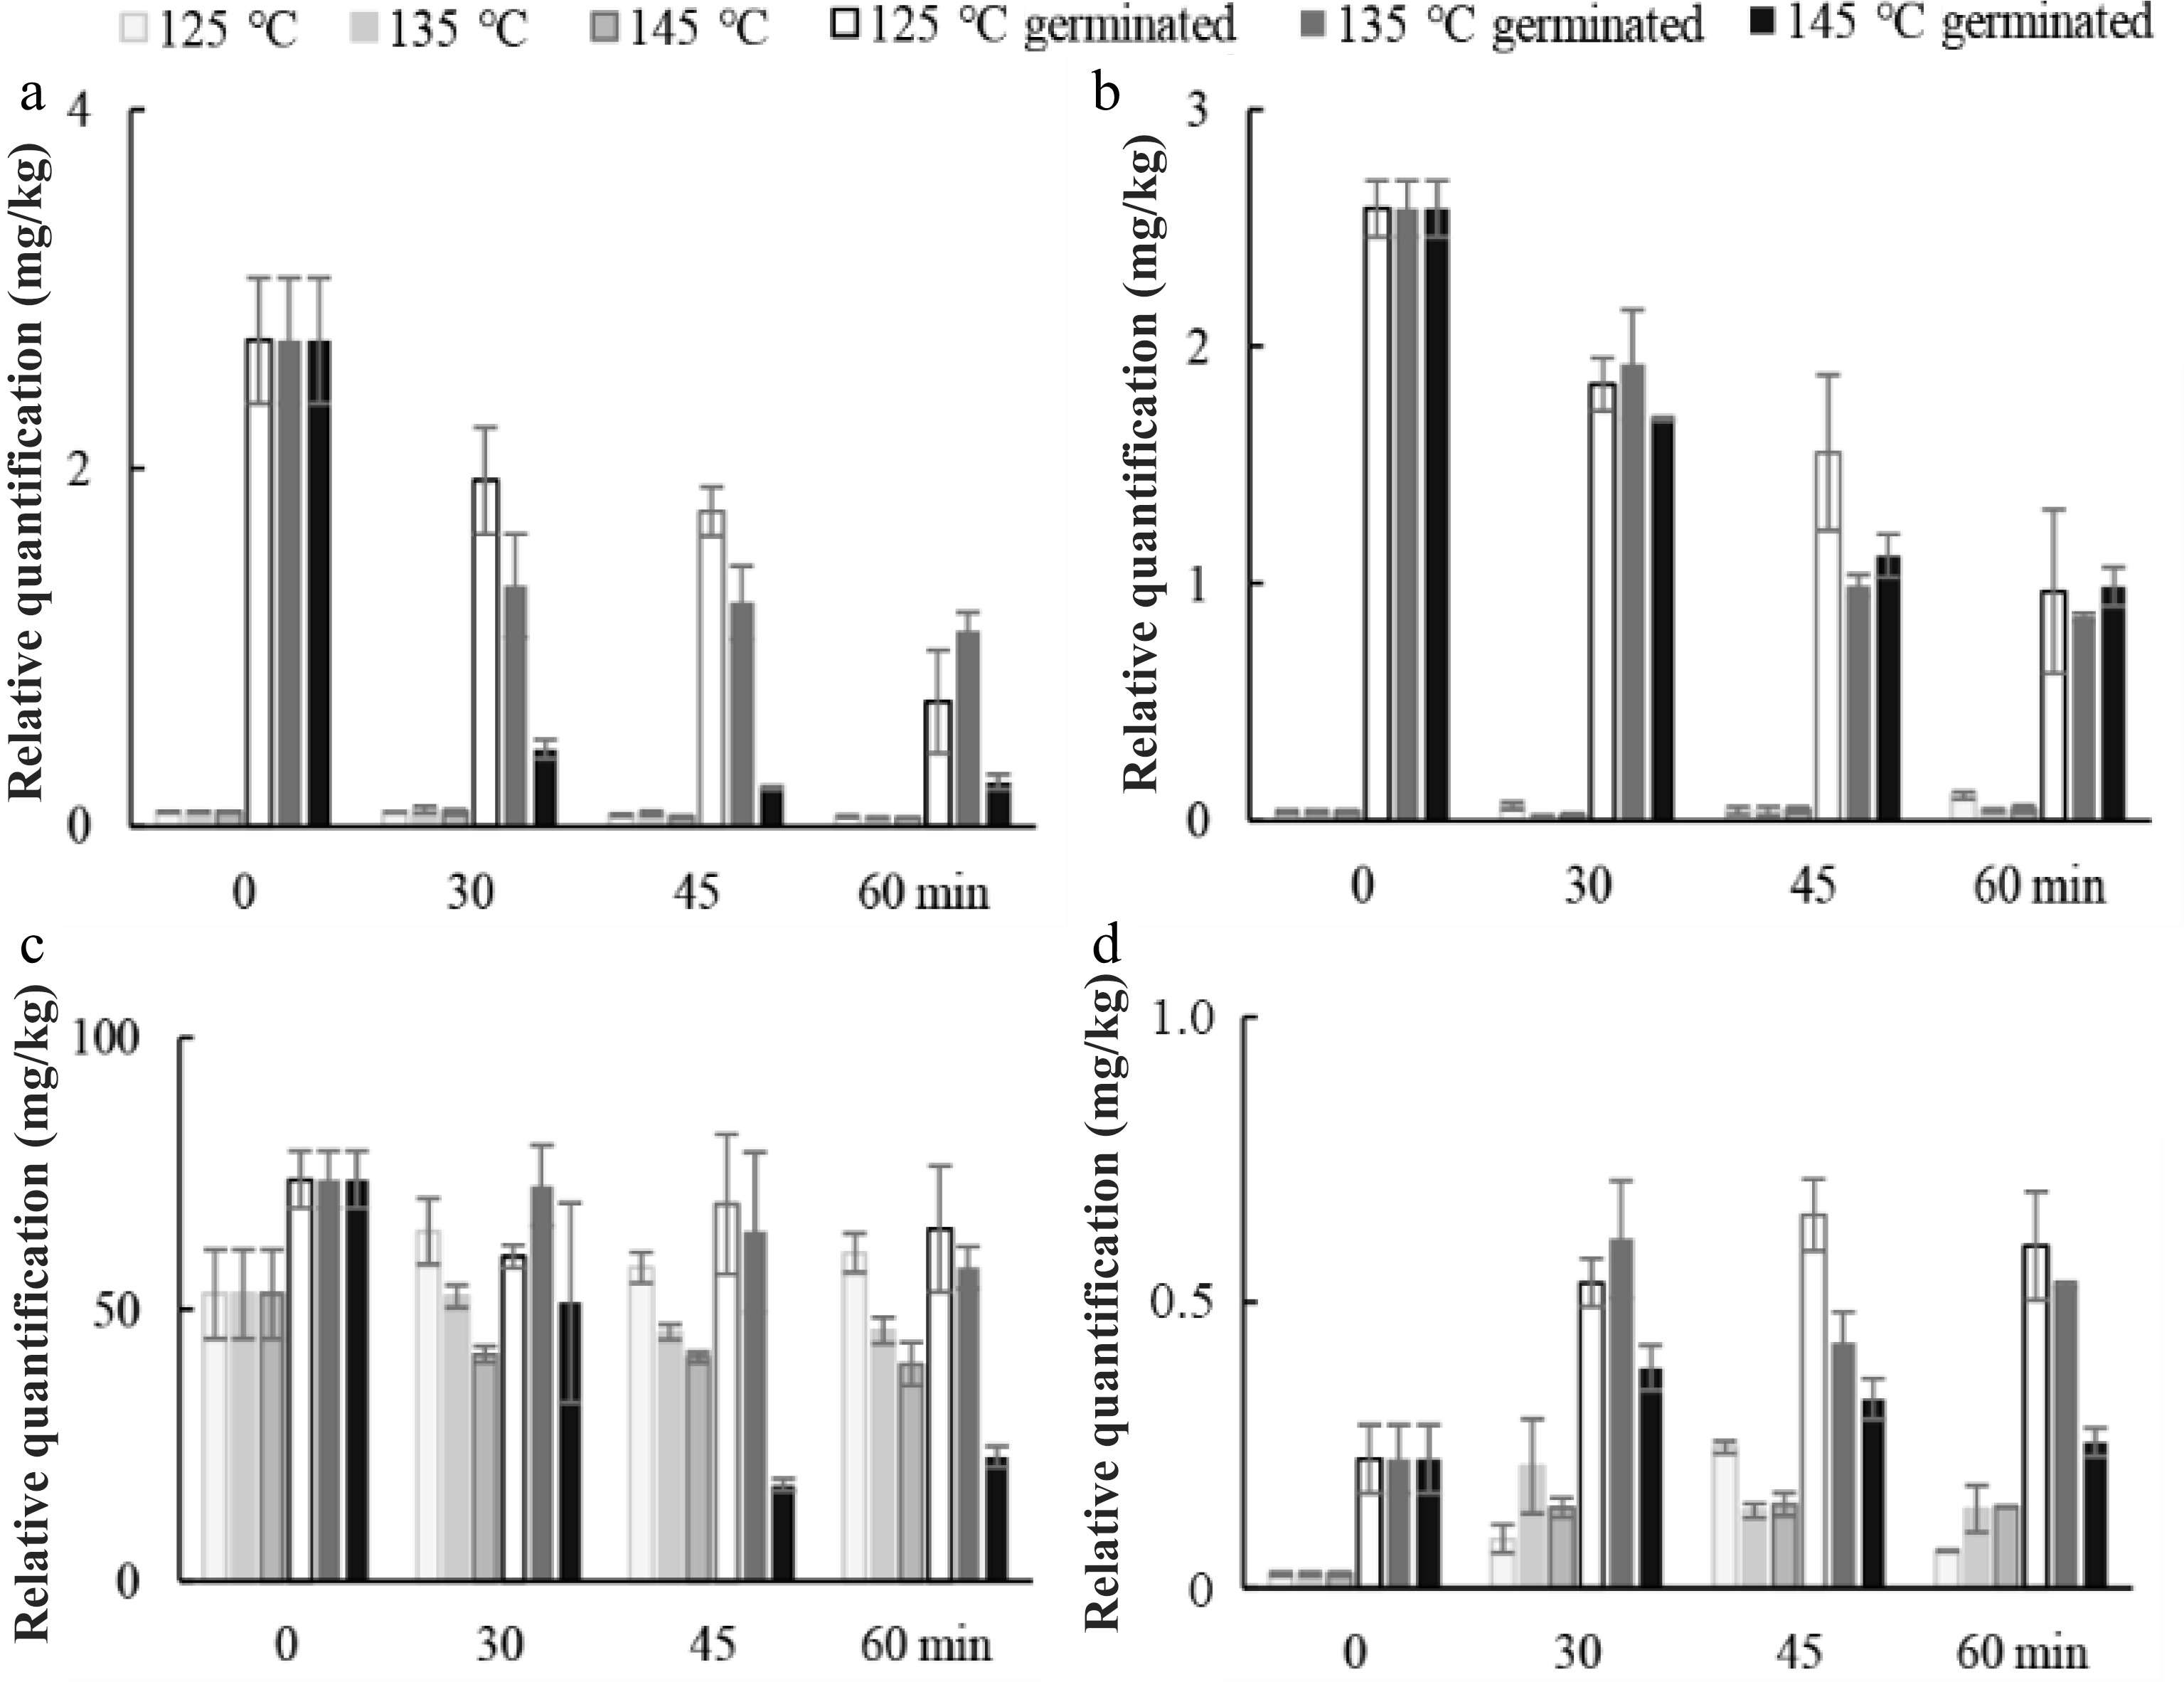
      Figure 5. 

      Changes in relative quantification of representative compounds in fraction III. (a) fructose, (b) glucose, (c) sucrose, (d) mannitol during roasting of ungerminated and germinated sunflower seeds at 125, 135, and 145 °C.

      The effects of roasting conditions on amino acid profiles and GABA of sunflower seeds are shown in Fig. 6. Free amino acids (alanine, glycine, serine, and phenylalanine) initially at low levels in RUSF, were highly decreased during roasting, especially at 145 °C. Roasting resulted in the reduction of alanine, glycine, threonine, phenylalanine, serine, asparagine, and GABA content in both RUSF and RGSF at three temperatures. This fact might be related to their inherent thermal stabilities. The decrease in amino acids may be due to their heat destruction[20]. The statement also agree with those reported by Damame et al.[21]. However, the increase of leucine and threonine content was observed during roasting. Therefore, possibly protease enzymatic activity could be taking place during this step, despite this not having been described previously. Lower temperature resulted in a lower loss of amino acid. The processes of boiling and roasting generally have very high total amino acid content compared with the fresh safflower seeds[22]. The reason for the variation in results among studies is not known. The amino acid content of RGSF was significantly (p < 0.05) higher than those of RUSF because of the increase of amino acids during germination. The content of alanine, glycine, phenylalanine, serine, asparagine, and GABA was higher at 125 °C compared to the other two temperatures. A 56%−72% decrease in GABA content was observed for RUSF. The overall changes of GABA at lower temperatures were much less than those observed at the higher temperature. GABA was largely involved in Maillard reaction during baking, resulting in GABA trace levels in wheat bread samples[23]. Whereas, the drying temperature did not significantly affect the GABA content of cooked germinated brown rice, except at the temperature of 130 °C for hot air drying[24]. Germination markedly improved GABA content in the RGSF. The content of GABA was greater higher at 125 °C than that at 135 and 145 °C. Roasting for 45 min at 125 °C resulted in the lowest reduction in GABA content.
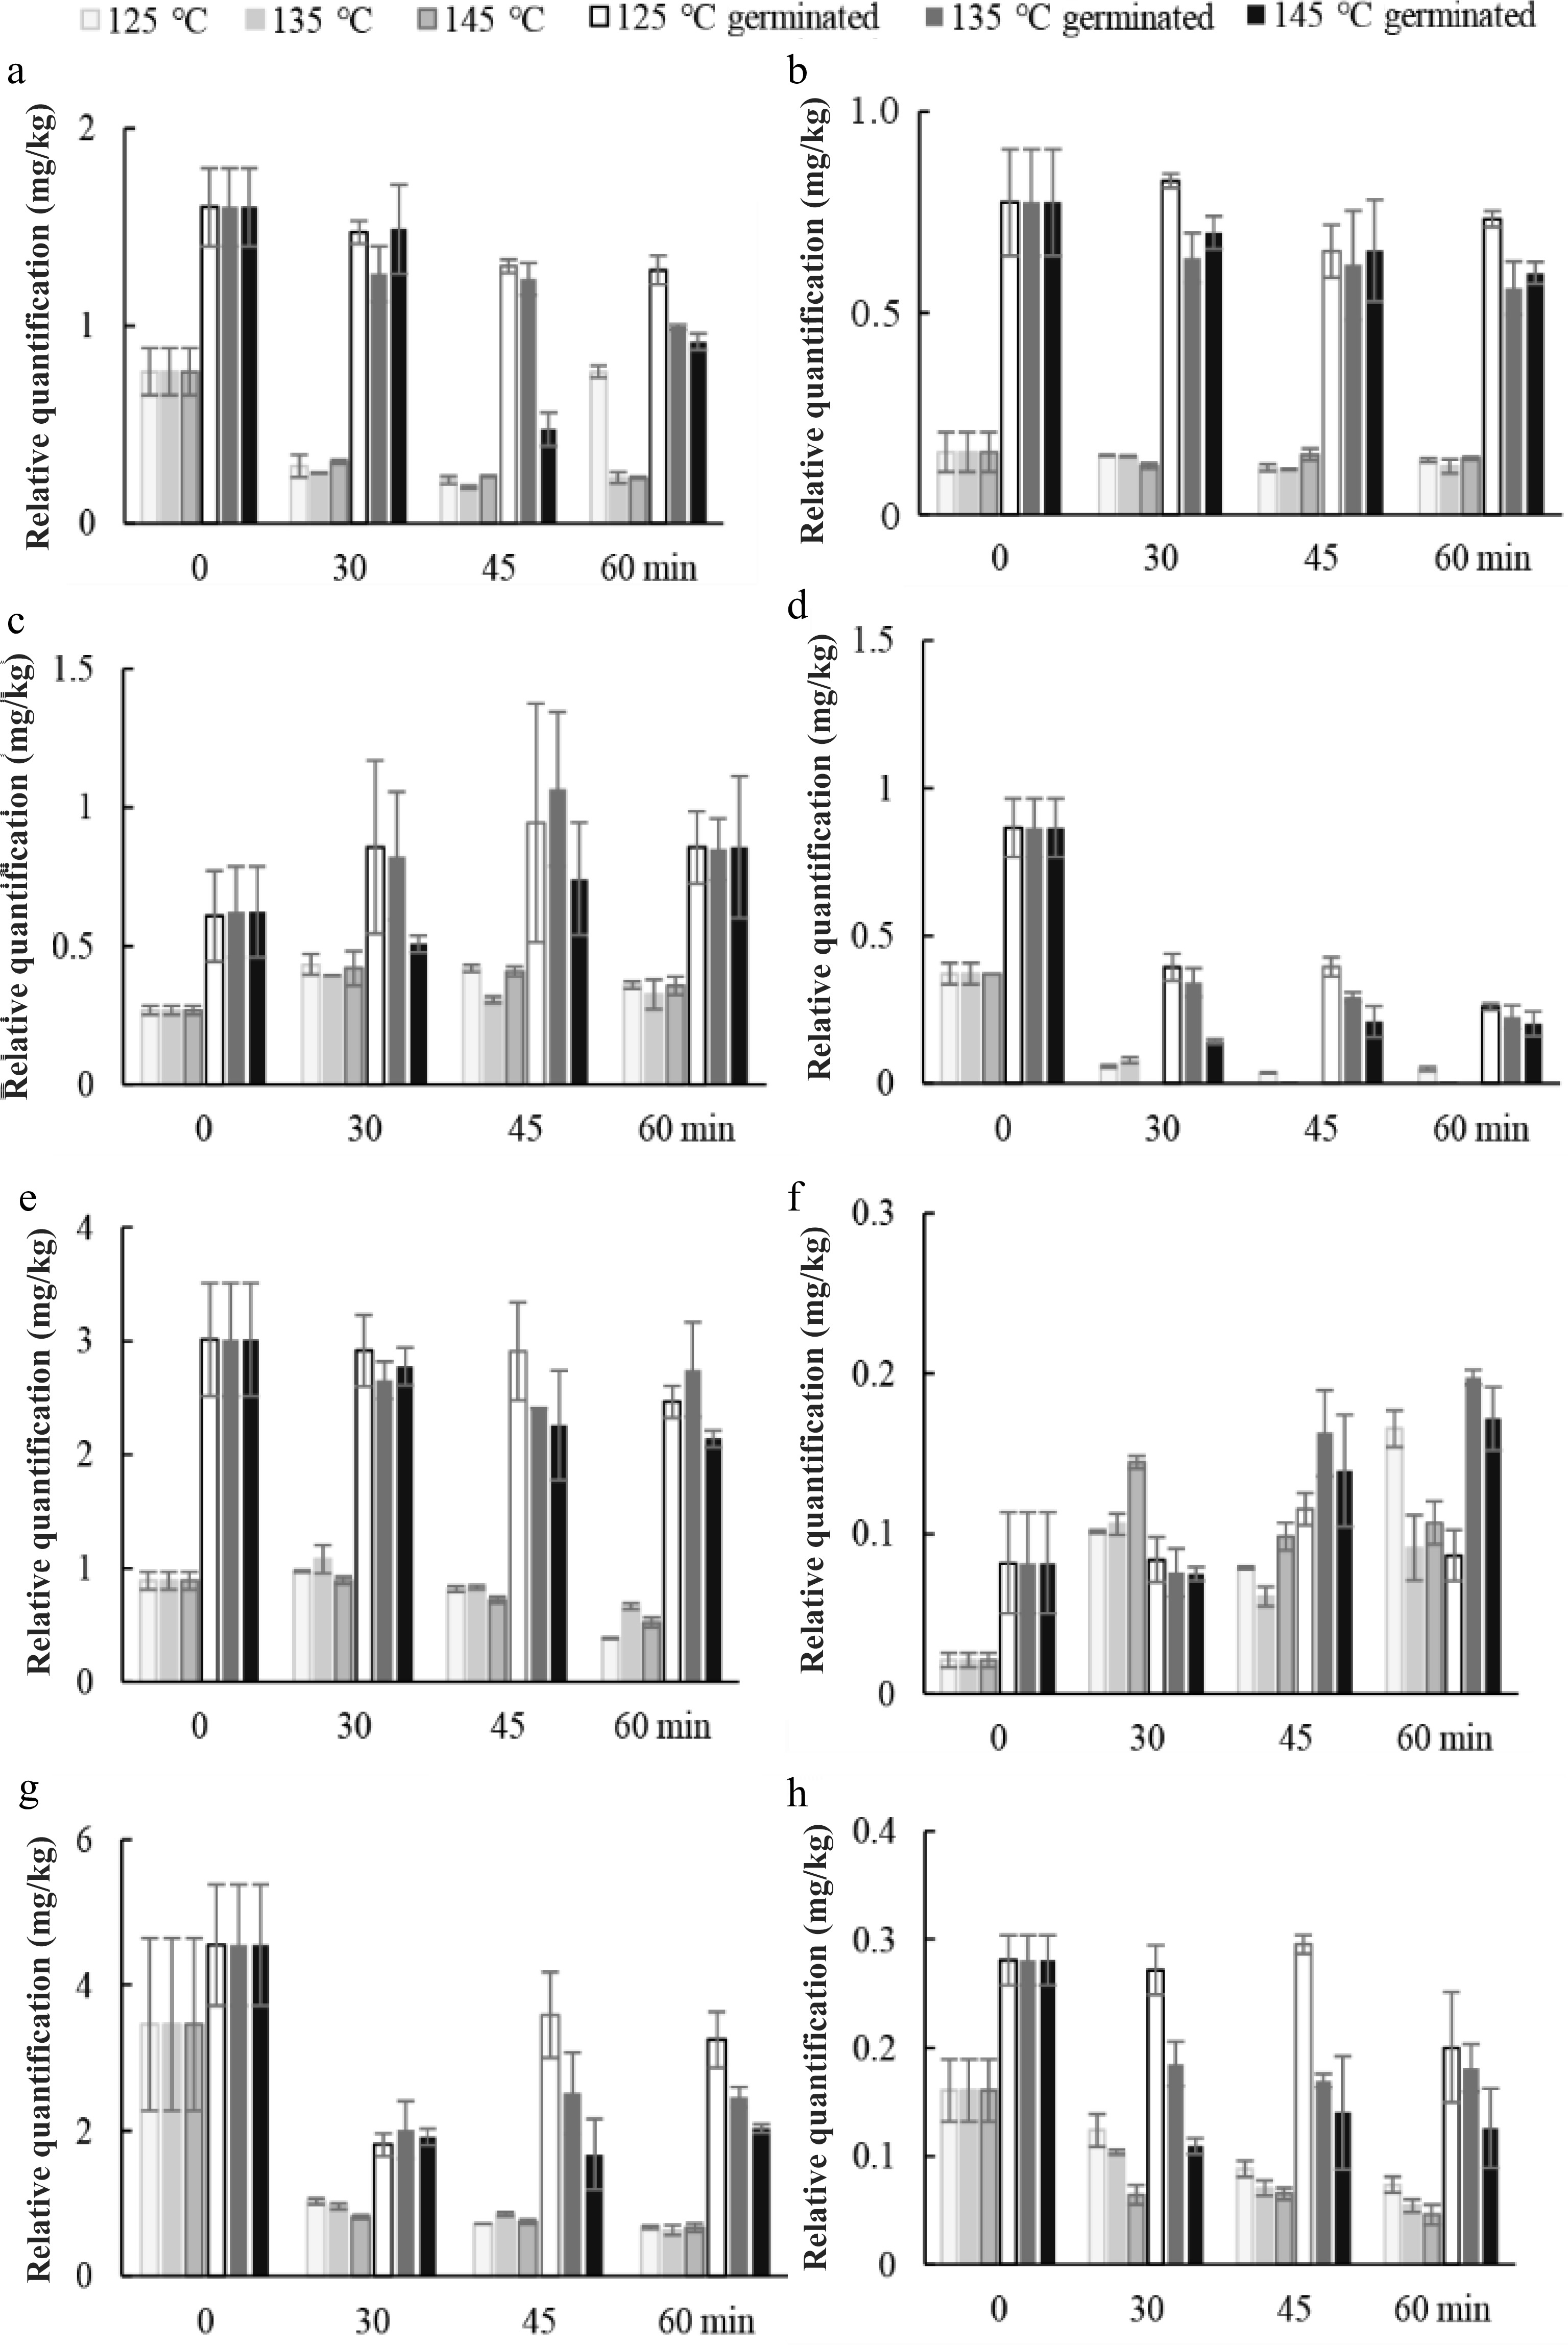
      Figure 6. 

      Changes in relative quantification of representative compounds in fraction IV. (a) alanine, (b) glycine, (c) leucine, (d) phenylalanine, (e) serine, (f) threonine, (g) asparagine, and (h) GABA during roasting of germinated and ungerminated sunflower seed at 125, 135, and 145 °C.

    • Flavoromics investigates sample constituents considered collectively and opens new perspectives for correlating the particular sensory attributes of food with its chemical composition. Tables 2 & 3 show concentrations (μg/g) of volatile components in RUSF and RGSF at 125, 135 and 145 °C for 30, 45, and 60 min. The main volatile components in RUSF and RGSF were 2-methylbutanal, pyridine, α-pinene, β-pinene, furfural, hexanal, pyrazines. The main volatile compounds in raw sunflower seeds were α-pinene, hexanal, furfural, octane, γ-butyrolactone. Table 4 shows the key odorants content obtained from RUSF and RGSF. 2,5-Dimeththylpyrazine, 2,3-dimethylpyrazine, 3-ethyl-2,5-dimethylpyrazine, 2-ethyl-3-methylpyrazine, and 2-ethyl-3,5-dimethylpyrazine, found in the RUSF and RGSF were to be considered representative of the active compound, suggesting that nutty, roast characteristics might contribute greatly to the aroma of roasted sunflower seeds.

      Table 2.  Concentration (μg/g) of volatile components in RUSF roasted from 125, 135, and 145 °C for 30, 45, and 60 min.

      ComponentsRIRelative concentration (μg/g)
      0125 °C135 °C145 °C
      30 min45 min60 min30 min45 min60 min30 min45 min60 min
      Isobutanal6290.21 ± 0.060.10 ± 0.030.17 ± 0.040.35 ± 0.090.36 ± 0.050.48 ± 0.061.22 ± 0.16
      3-Methylbutanal6460.28 ± 0.070.21 ± 0.060.31 ± 0.081.60 ± 0.430.19 ± 0.030.31 ± 0.040.18 ± 0.020.26 ± 0.040.74 ± 0.10
      2-Methylbutanal6620.54 ± 0.140.27 ± 0.070.55 ± 0.150.37 ± 0.050.77 ± 0.100.25 ± 0.030.77 ± 0.102.11 ± 0.28
      3-Penten-2-one7110.45 ± 0.120.04 ± 0.010.32 ± 0.090.19 ± 0.050.59 ± 0.160.25 ± 0.030.42 ± 0.060.23 ± 0.030.23 ± 0.030.67 ± 0.09
      Pyridine7170.11 ± 0.031.51 ± 0.411.19 ± 0.323.13 ± 0.840.74 ± 0.102.66 ± 0.360.92 ± 0.122.81 ± 0.382.7 ± 0.36
      Toluene7510.24 ± 0.070.15 ± 0.040.29 ± 0.080.27 ± 0.070.19 ± 0.060.36 ± 0.050.40 ± 0.050.17 ± 0.020.18 ± 0.030.63 ± 0.08
      Hexanal7571.35 ± 0.360.68 ± 0.181.35 ± 0.363.35 ± 0.091.74 ± 0.471.00 ± 0.131.96 ± 0.260.81 ± 0.112.50 ± 0.348.49 ± 1.14
      Octane7962.67 ± 0.720.13 ± 0.030.54 ± 0.155.50 ± 1.481.77 ± 0.470.60 ± 0.081.15 ± 0.161.09 ± 0.15
      Furfural8000.95 ± 0.250.57 ± 0.150.87 ± 0.232.98 ± 0.801.92 ± 0.521.21 ± 0.163.46 ± 0.473.63 ± 0.495.09 ± 0.688.18 ± 1.10
      2,3,3-Trimethyl-1,4-pentadiene8050.12 ± 0.030.34 ± 0.091.21 ± 0.320.87 ± 0.230.41 ± 0.060.89 ± 0.120.85 ± 0.111.97 ± 0.26
      Z-2-Octene8100.04 ± 0.010.26 ± 0.070.59 ± 0.160.61 ± 0.160.35 ± 0.050.67 ± 0.090.75 ± 0.101.07 ± 0.14
      2,6-Dimethylheptane8280.67 ± 0.181.34 ± 0.360.25 ± 0.030.86 ± 0.120.12 ± 0.020.40 ± 0.051.02 ± 0.14
      Ethylcyclohexane8300.54 ± 0.130.22 ± 0.060.41 ± 0.111.72 ± 0.460.68 ± 0.180.40 ± 0.050.85 ± 0.110.25 ± 0.030.56 ± 0.071.63 ± 0.22
      n-Hexanol

      8491.94 ± 0.521.23 ± 0.330.31 ± 0.080.20 ± 0.050.63 ± 0.170.35 ± 0.050.56 ± 0.070.16 ± 0.020.29 ± 0.040.04 ± 0.01
      γ-Butyrolactone8501.15 ± 0.310.30 ± 0.080.90 ± 0.242.25 ± 0.601.36 ± 0.370.78 ± 0.101.72 ± 0.230.37 ± 0.051.43 ± 0.193.19 ± 0.43
      Methional8540.13 ± 0.040.16 ± 0.040.59 ± 0.160.42 ± 0.110.54 ± 0.070.64 ± 0.080.39 ± 0.050.51 ± 0.070.64 ± 0.09
      2-Methyloctane8630.47 ± 0.130.36 ± 0.101.26 ± 0.340.33 ± 0.040.73 ± 0.100.29 ± 0.040.36 ± 0.050.97 ± 0.15
      2-Heptanone8660.42 ± 0.110.24 ± 0.030.23 ± 0.030.54 ± 0.07
      3-Methyl-octane8700.26 ± 0.070.05 ± 0.010.24 ± 0.060.81 ± 0.220.34 ± 0.090.20 ± 0.030.49 ± 0.070.14 ± 0.020.29 ± 0.040.96 ± 0.13
      2,5-Dimethylpyrazine8850.20 ± 0.050.99 ± 0.270.98 ± 0.281.71 ± 0.462.47 ± 0.660.81 ± 0.112.56 ± 0.340.54 ± 0.075.17 ± 0.6910.19 ± 1.37
      2,3-Dimethylpyrazine8910.55 ± 0.071.30 ± 0.17
      n-Nonane8990.28 ± 0.070.06 ± 0.020.22 ± 0.060.70 ± 0.190.37 ± 0.100.16 ± 0.020.51 ± 0.070.14 ± 0.020.33 ± 0.040.96 ± 0.13
      Benzaldehyde9260.35 ± 0.090.11 ± 0.030.16 ± 0.040.60 ± 0.160.63 ± 0.170.36 ± 0.050.40 ± 0.050.08 ± 0.010.87 ± 0.120.75 ± 0.10
      α-Pinene9307.57 ± 2.037.05 ± 1.8912.50 ± 3.412.70 ± 3.410.79 ± 2.96.56 ± 0.8813.71 ± 1.84.72 ± 0.6310.20 ± 1.421.85 ± 2.9
      Camphene9430.34 ± 0.090.06 ± 0.020.48 ± 0.130.20 ± 0.050.41 ± 0.110.28 ± 0.040.53 ± 0.070.17 ± 0.020.36 ± 0.050. 96 ± 0.13
      Thujane-2,4(10)-diene9460.04 ± 0.010.61 ± 0.160.04 ± 0.000.14 ± 0.020.35 ± 0.05
      Phenol9510.27 ± 0.070.08 ± 0.020.25 ± 0.070.55 ± 0.150.24 ± 0.060.11 ± 0.010.29 ± 0.040.06 ± 0.01
      1-Octen-3-ol9590.27 ± 0.060.06 ± 0.020.27 ± 0.060.17 ± 0.020.38 ± 0.050.06 ± 0.01
      β-Phellandrene9650.24 ± 0.070.15 ± 0.040.39 ± 0.101.83 ± 0.490.48 ± 0.130.20 ± 0.030.52 ± 0.070.13 ± 0.020.37 ± 0.050.80 ± 0.11
      3-Methylnonane9680.13 ± 0.030.04 ± 0.010.14 ± 0.040.50 ± 0.130.19 ± 0.050.10 ± 0.010.26 ± 0.040.05 ± 0.01
      β-Pinene9700.76 ± 0.200.16 ± 0.040.98 ± 0.261.66 ± 0.450.85 ± 0.230.53 ± 0.071.15 ± 0.150.37 ± 0.051.25 ± 0.173.00 ± 0.40
      2-Ethyl-3-methylpyrazine9740.14 ± 0.040.36 ± 0.100.54 ± 0.150.88 ± 0.241.63 ± 0.442.27 ± 0.312.86 ± 0.380.18 ± 0.021.96 ± 0.263.89 ± 0.52
      2-Pentylfuran9760.33 ± 0.090.21 ± 0.060.14 ± 0.041.53 ± 0.410.54 ± 0.140.13 ± 0.020.30 ± 0.040.07 ± 0.010.53 ± 0.071.17 ± 0.16
      3(E)-3-methyl-3-nonene9810.18 ± 0.050.07 ± 0.020.16 ± 0.040.58 ± 0.150.29 ± 0.080.13 ± 0.020.31 ± 0.040.07 ± 0.010.16 ± 0.020.74 ± 0.10
      Pantoic lactone9870.12 ± 0.030.05 ± 0.010.06 ± 0.020.14 ± 0.040.07 ± 0.010.19 ± 0.030.32 ± 0.040.49 ± 0.07
      4-Decene9890.32 ± 0.090.18 ± 0.050.34 ± 0.090.51 ± 0.140.26 ± 0.041.03 ± 0.140.22 ± 0.030.56 ± 0.081.84 ± 0.25
      Phenylacetaldehyde10070.27 ± 0.070.34 ± 0.090.77 ± 0.211.26 ± 0.220.47 ± 0.130.13 ± 0.020.27 ± 0.040.95 ± 0.131.25 ± 0.171.29 ± 0.17
      p-Cymene10110.11 ± 0.030.05 ± 0.010.37 ± 0.100.23 ± 0.060.07 ± 0.010.16 ± 0.020.33 ± 0.040.70 ± 0.09
      D-Limonene10200.27 ± 0.070.16 ± 0.040.28 ± 0.081.15 ± 0.310.44 ± 0.120.20 ± 0.030.47 ± 0.060.10 ± 0.010.17 ± 0.020.39 ± 0.05
      1,4-Butanediol diacetate10410.92 ± 0.250.15 ± 0.040.89 ± 0.240.71 ± 0.181.26 ± 0.300.49 ± 0.071.50 ± 0.200.22 ± 0.030.69 ± 0.091.68 ± 0.23
      2-Ethyl-3,5-dimethylpyrazine10530.19 ± 0.050.19 ± 0.040.36 ± 0.100.30 ± 0.080.12 ± 0.020.53 ± 0.070.07 ± 0.011.11 ± 0.152.09 ± 0.28
      N-allyl- cyclopentanecarboxamide10561.52 ± 0.410.58 ± 0.161.37 ± 0.371.71 ± 0.461.02 ± 0.140.67 ± 0.09
      2,4-Dimethyl-1-decene10650.25 ± 0.070.12 ± 0.030.23 ± 0.060.89 ± 0.240.27 ± 0.070.17 ± 0.020.57 ± 0.080.11 ± 0.020.38 ± 0.051.01 ± 0.14
      Nonanal10810.32 ± 0.090.21 ± 0.060.51 ± 0.140.79 ± 0.210.24 ± 0.060.54 ± 0.070.63 ± 0.080.44 ± 0.060.56 ± 0.071.06 ± 0.14
      6-Ethyl-3-octanone10830.38 ± 0.101.25 ± 0.340.48 ± 0.130.26 ± 0.030.73 ± 0.100.16 ± 0.030.39 ± 0.051.19 ± 0.16
      2,6-Dimethylundecane11201.64 ± 0.451.09 ± 0.150.54 ± 0.073.97 ± 0.53
      6,6-Dimethylundecane11400.42 ± 0.110.22 ± 0.060.44 ± 0.121.99 ± 0.530.84 ± 0.220.35 ± 0.051.26 ± 0.170.19 ± 0.030.65 ± 0.091.94 ± 0.26
      5-Methylundecane11570.28 ± 0.080.10 ± 0.020.39 ± 0.100.74 ± 0.200.66 ± 0.180.19 ± 0.020.51 ± 0.070.09 ± 0.010.26 ± 0.020.74 ± 0.10
      3-Methylundecane11710.68 ± 0.180.48 ± 0.060.26 ± 0.030.70 ± 0.09
      1-Dodecene11890.27 ± 0.070.13 ± 0.030.17 ± 0.050.45 ± 0.120.58 ± 0.160.19 ± 0.030.49 ± 0.070.010 ± 0.010.26 ± 0.030.67 ± 0.09
      Dodecane12010.35 ± 0.100.13 ± 0.040.34 ± 0.090.73 ± 0.190.65 ± 0.190.20 ± 0.030.55 ± 0.070.13 ± 0.020.31 ± 0.040.80 ± 0.11
      3-Methyltridecane13680.09 ± 0.020.10 ± 0.01
      1-Tetradecene13880.14 ± 0.040.07 ± 0.020.14 ± 0.040.25 ± 0.070.40 ± 0.110.10 ± 0.010.31 ± 0.040.12 ± 0.020.13 ± 0.010.44 ± 0.06
      Tetradecane13990.13 ± 0.030.06 ± 0.020.02 ± 0.000.19 ± 0.050.09 ± 0.010.03 ± 0.000.01 ± 0.000.03 ± 0.010.31 ± 0.04
      Octyl methacrylate14240.18 ± 0.030.17 ± 0.050.33 ± 0.090.35 ± 0.090.11 ± 0.010.29 ± 0.040.06 ± 0.010.14 ± 0.020.40 ± 0.04
      7-Methyltridecane14290.20 ± 0.050.08 ± 0.020.16 ± 0.040.38 ± 0.100.40 ± 0.110.12 ± 0.020.33 ± 0.040.06 ± 0.020.116 ± 0.020.41 ± 0.05
      Calarene14330.31 ± 0.080.12 ± 0.030.33 ± 0.090.62 ± 0.170.57 ± 0.150.20 ± 0.030.42 ± 0.060.08 ± 0.010.24 ± 0.020.70 ± 0.09
      Chamigrene14560.12 ± 0.030.12 ± 0.030.20 ± 0.050.07 ± 0.01
      5,6-Dipropyldecane14650.46 ± 0.120.18 ± 0.050.39 ± 0.100.86 ± 0.230.27 ± 0.040.14 ± 0.02
      β-Bisabolene14990.27 ± 0.070.03 ± 0.010.33 ± 0.090.42 ± 0.110.20 ± 0.030.27 ± 0.040.07 ± 0.010.21 ± 0.030.48 ± 0.06

      Table 3.  Concentrations (μg/g) of volatile components in RGSF roasted from 125, 135, and 145 °C for 30, 45, and 60 min.

      ComponentsRIRelative concentration (μg/g)
      0125 °C135 °C145 °C
      30 min45 min60 min30 min45 min60 min30 min45 min60 min
      Isobutanal6290.21 ± 0.060.06 ± 0.020.40 ± 0.112.39 ± 0.600.55 ± 0.152.41 ± 0.652.78 ± 0.705.77 ± 1.32
      3-Methylbutanal6460.28 ± 0.040.22 ± 0.031.22 ± 0.175.28 ± 0.750.04 ± 0.011.80 ± 0.251.17 ± 0.172.85 ± 0.402.58 ± 0.373.12 ± 0.44
      2-Methylbutanal6620.54 ± 0.080.29 ± 0.041.07 ± 0.155.47 ± 0.772.54 ± 0.361.06 ± 0.155.11 ± 0.726.81 ± 0.9614.02 ± 1.98
      3-Penten-2-one7110.45 ± 0.060.09 ± 0.010.11 ± 0.020.40 ± 0.060.46 ± 0.060.25 ± 0.030.22 ± 0.03
      Pyridine7170.11 ± 0.020.03 ± 0.001.06 ± 0.150.35 ± 0.051.41 ± 0.20
      1-Pentanol7440.19 ± 0.030.03 ± 0.010.03 ± 0.010.09 ± 0.020.22 ± 0.040.05 ± 0.010.13 ± 0.020.93 ± 0.16
      Toluene7510.24 ± 0.040.11 ± 0.020.06 ± 0.010.12 ± 0.020.09 ± 0.020.60 ± 0.100.16 ± 0.030.09 ± 0.020.12 ± 0.020.84 ± 0.14
      Hexanal7571.35 ± 0.230.82 ± 0.141.19 ± 0.200.54 ± 0.091.33 ± 0.231.48 ± 0.250.79 ± 0.131.29 ± 0.223.75 ± 0.64
      2-Methylpyrazine7950.40 ± 0.072.80 ± 0.481.50 ± 0.258.58 ± 1.464.52 ± 0.776.63 ± 1.127.82 ± 1.3324.15 ± 4.10
      Octane7962.67 ± 0.450.24 ± 0.040.18 ± 0.030.28 ± 0.050.91 ± 0.150.32 ± 0.05
      Furfural8000.79 ± 0.100.37 ± 0.050.36 ± 0.053.69 ± 0.470.53 ± 0.071.33 ± 0.1721.17 ± 2.7095.00 ± 12.09
      Z-2-Octene8100.12 ± 0.020.10 ± 0.010.04 ± 0.010.10 ± 0.01
      Furfuryl alcohol8251.41 ± 0.180.24 ± 0.033.64 ± 0.460.13 ± 0.021.56 ± 0.201.27 ± 0.16
      2,6-Dimethylheptane8280.67 ± 0.080.17 ± 0.020.05 ± 0.010.80 ± 0.100.14 ± 0.02
      Ethylcyclohexane8300.54 ± 0.070.22 ± 0.030.14 ± 0.020.76 ± 0.100.12 ± 0.010.60 ± 0.080.25 ± 0.030.85 ± 0.11
      n-Hexanol8491.94 ± 0.490.06 ± 0.010.03 ± 0.010.16 ± 0.040.04 ± 0.010.54 ± 0.140.10 ± 0.020.08 ± 0.02
      γ-Butyrolactone8501.15 ± 0.290.53 ± 0.130.36 ± 0.090.70 ± 0.182.24 ± 0.57
      Methional8540.35 ± 0.091.09 ± 0.280.45 ± 0.110.31 ± 0.08
      2-Methyloctane8630.47 ± 0.120.20 ± 0.050.09 ± 0.021.70 ± 0.43
      2-Heptanone8660.07 ± 0.020.30 ± 0.040.24 ± 0.060.26 ± 0.071.03 ± 0.20
      3-Methyloctane8700.26 ± 0.070.01 ± 0.030.08 ± 0.020.32 ± 0.080.06 ± 0.021.06 ± 0.270.15 ± 0.040.32 ± 0.08
      Heptanal8750.13 ± 0.030.08 ± 0.020.01 ± 0.010.03 ± 0.010.04 ± 0.000.02 ± 0.000.02 ± 0.00
      2-Acetylfuran8780.36 ± 0.040.33 ± 0.051.07 ± 0.12
      2,5-Dimethylpyrazine8830.20 ± 0.030.06 ± 0.012.13 ± 0.3013.15 ± 1.860.44 ± 0.0613.1 ± 1.8525.71 ± 3.6472.55 ± 10.28
      Ethylpyrazine8850.49 ± 0.072.84 ± 0.402.37 ± 0.343.99 ± 0.56
      2,3-Dimethylpyrazine8910.27 ± 0.041.82 ± 0.261.63 ± 0.232.82 ± 0.409.58 ± 1.26
      n-Nonane8990.28 ± 0.040.10 ± 0.010.11 ± 0.020.48 ± 0.070.06 ± 0.010.76 ± 0.110.14 ± 0.020.22 ± 0.010.33 ± 0.05
      Benzaldehyde9260.35 ± 0.050.14 ± 0.030.20 ± 0.031.34 ± 0.190.07 ± 0.010.58 ± 0.080.21 ± 0.120.86 ± 0.151.62 ± 0.23
      α-Pinene9307.57 ± 1.073.76 ± 0.533.58 ± 0.6011.23 ± 1.594.65 ± 0.6638.85 ± 5.4910.93 ± 1.557.37 ± 1.0410.93 ± 1.5533.03 ± 4.67
      Camphene9430.34 ± 0.050.18 ± 0.030.17 ± 0.020.66 ± 0.090.15 ± 0.021.65 ± 0.230.42 ± 0.060.42 ± 0.050.33 ± 0.063.24 ± 0.46
      Thujane-2,4(10)-diene9460.06 ± 0.010.11 ± 0.020.45 ± 0.060.03 ± 0.000.48 ± 0.070.17 ± 0.020.54 ± 0.080.87 ± 0.12
      Phenol9510.27 ± 0.040.18 ± 0.030.11 ± 0.020.28 ± 0.04
      1-Octen-3-ol9590.27 ± 0.050.20 ± 0.046.18 ± 1.1413.38 ± 2.01
      β-Phellandrene9650.24 ± 0.050.10 ± 0.010.08 ± 0.020.32 ± 0.060.10 ± 0.021.21 ± 0.220.30 ± 0.060.16 ± 0.03
      3-Methylnonane9680.13 ± 0.020.07 ± 0.010.40 ± 0.07
      β-Pinene9700.76 ± 0.140.37 ± 0.070.62 ± 0.110.40 ± 0.074.15 ± 0.761.02 ± 0.190.26 ± 0.05
      2-Ethyl-3-methylpyrazine9740.74 ± 0.110.06 ± 0.010.99 ± 0.186.84 ± 1.260.21 ± 0.043.70 ± 0.684.11 ± 0.72
      2-Pentylfuran9760.33 ± 0.060.16 ± 0.020.36 ± 0.070.05 ± 0.010.44 ± 0.080.27 ± 0.051.70 ± 0.31
      3(E)-3-methyl-3-nonene9810.18 ± 0.020.08 ± 0.010.14 ± 0.030.47 ± 0.090.04 ± 0.010.48 ± 0.080.14 ± 0.030.27 ± 0.050.68 ± 0.13
      Pantoic lactone9870.12 ± 0.020.44 ± 0.05
      4-Decene9890.32 ± 0.060.26 ± 0.050.04 ± 0.011.50 ± 0.280.24 ± 0.05
      Phenylacetaldehyde10070.27 ± 0.040.14 ± 0.020.78 ± 0.115.15 ± 0.690.04 ± 0.010.61 ± 0.090.41 ± 0.061.11 ± 0.161.13 ± 0.110.77 ± 0.11
      p-Cymene10110.11 ± 0.020.12 ± 0.020.88 ± 0.120.27 ± 0.040.18 ± 0.030.49 ± 0.071.15 ± 0.163.73 ± 0.50
      D-Limonene10200.27 ± 0.040.10 ± 0.010.13 ± 0.020.26 ± 0.030.05 ± 0.010.77 ± 0.110.26 ± 0.040.83 ± 0.120.69 ± 0.10
      2-Ethyl-3,5-dimethylpyrazine10530.36 ± 0.050.02 ± 0.000.73 ± 0.106.59 ± 0.930.10 ± 0.015.84 ± 0.8316.60 ± 2.3530.74 ± 4.85
      N-allyl- cyclopentanecarboxamide10561.52 ± 0.220.65 ± 0.090.63 ± 0.090.38 ± 0.050.93 ± 0.131.31 ± 0.192.82 ± 0.40
      3-Ethyl-2,5-dimethylpyrazine10590.66 ± 0.090.53 ± 0.081.78 ± 0.253.83 ± 0.54
      2,5-Diethylpyrazine10630.27 ± 0.040.07 ± 0.010.49 ± 0.07
      2,4-Dimethyl-1-decene10650.25 ± 0.040.10 ± 0.010.07 ± 0.010.16 ± 0.020.11 ± 0.020.51 ± 0.07
      1-Methyl-4-isopropenylbenzene10720.55 ± 0.083.04 ± 0.436.89 ± 0.81
      Nonanal10810.32 ± 0.070.15 ± 0.030.15 ± 0.020.92 ± 0.190.10 ± 0.020.76 ± 0.160.24 ± 0.040.35 ± 0.071.96 ± 0.42
      2-Acetyl-3-methylpyrazine10851.85 ± 0.393.08 ± 0.65
      5-Ethyl-1-nonene10860.18 ± 0.040.16 ± 0.030.79 ± 0.170.11 ± 0.021.00 ± 0.190.25 ± 0.050.40 ± 0.09
      2,6-Dimethylundecane11201.20 ± 0.201.20 ± 0.25
      Verbenol11280.38 ± 0.100.47 ± 0.122.62 ± 0.420.23 ± 0.061.92 ± 0.490.64 ± 0.161.11 ± 0.282.87 ± 0.654.07 ± 1.04
      2,3-Diethyl-5-methylpyrazine11330.49 ± 0.130.31 ± 0.081.33 ± 0.341.79 ± 0.46
      2,6-Diethyl-3-methylpyrazine11350.39 ± 0.100.15 ± 0.040.11 ± 0.040.23 ± 0.010.85 ± 0.222.69 ± 0.57
      6,6-Dimethylundecane11400.42 ± 0.110.22 ± 0.050.22 ± 0.061.24 ± 0.320.10 ± 0.021.56 ± 0.090.33 ± 0.080.46 ± 0.121.26 ± 0.15
      5-Methylundecane11570.28 ± 0.030.10 ± 0.020.10 ± 0.020.30 ± 0.080.09 ± 0.020.68 ± 0.150.14 ± 0.040.28 ± 0.070.83 ± 0.21
      2-Methyl-5-[(1E)-1-propenyl]pyrazine11600.45 ± 0.121.85 ± 0.47
      Myrtenal11700.18 ± 0.050.73 ± 0.10
      3-Methylundecane11710.64 ± 0.120.48 ± 0.160.20 ± 0.050.79 ± 0.151.93 ± 0.49
      1,4-Butanediol diacetate11770.92 ± 0.230.03 ± 0.010.04 ± 0.010.75 ± 0.190.04 ± 0.010.12 ± 0.030.05 ± 0.010.25 ± 0.061.31 ± 0.33
      Myrtenol11780.19 ± 0.050.21 ± 0.020.67 ± 0.170.44 ± 0.110.17 ± 0.020.50 ± 0.010.80 ± 0.021.26 ± 0.32
      2,5-Dimethyl-3-(2-methylpropyl)-pyrazine11810.39 ± 0.020.43 ± 0.110.37 ± 0.09
      1-Dodecene11890.27 ± 0.070.06 ± 0.020.11 ± 0.030.79 ± 0.150.09 ± 0.010.41 ± 0.100.13 ± 0.030.24 ± 0.041.04 ± 0.26
      Dodecane12010.35 ± 0.090.10 ± 0.010.09 ± 0.020.75 ± 0.190.10 ± 0.030.40 ± 0.100.15 ± 0.020.27 ± 0.070.88 ± 0.192.03 ± 0.36
      3-Methyl-2(E)-undecene12030.12 ± 0.020.04 ± 0.010.03 ± 0.000.34 ± 0.05
      3-Methyltridecane13680.07 ± 0.010.32 ± 0.04
      1-Tetradecene13880.14 ± 0.020.07 ± 0.010.10 ± 0.010.48 ± 0.070.05 ± 0.010.15 ± 0.020.07 ± 0.010.11 ± 0.020.73 ± 0.10
      Tetradecane13990.13 ± 0.020.20 ± 0.030.01 ± 0.000.02 ± 0.000.21 ± 0.03
      Octyl methacrylate14240.18 ± 0.030.07 ± 0.010.07 ± 0.010.47 ± 0.050.05 ± 0.010.20 ± 0.030.08 ± 0.010.14 ± 0.020.56 ± 0.08
      7-Methyltridecane14290.20 ± 0.030.07 ± 0.010.08 ± 0.010.56 ± 0.080.06 ± 0.010.24 ± 0.020.08 ± 0.010.16 ± 0.030.65 ± 0.12
      Calarene14330.31 ± 0.040.12 ± 0.020.09 ± 0.010.74 ± 0.100.12 ± 0.020.56 ± 0.150.19 ± 0.020.23 ± 0.030.78 ± 0.11
      Chamigrene14560.12 ± 0.020.04 ± 0.010.23 ± 0.03
      5,6-Dipropyldecane14650.46 ± 0.050.16 ± 0.020.17 ± 0.030.37 ± 0.050.14 ± 0.020.18 ± 0.030.40 ± 0.06
      β-Bisabolene14990.27 ± 0.040.10 ± 0.010.09 ± 0.020.83 ± 0.120.15 ± 0.020.64 ± 0.090.20 ± 0.030.19 ± 0.040.77 ± 0.110.26 ± 0.04

      Table 4.  Key odorants content obtained from RUSF and RGSF which were roasted at 125, 135, and 145 °C for 30, 45, and 60 min.

      CompoundsOdor qualityRUSF seedsRGSF seeds
      Pyrazines
      2,5-DimethylpyrazineRoasty, flowery, cocoa5,7,9,103,4,8.9,10
      2,3-DimethylpyrazineNut, peanut, cocoa, meat9,103,4,8,9,10
      3-Ethyl-2,5-dimethylpyrazinePotato, roastN4,8,9,10
      2-Ethyl-3-methylpyrazineNutty, cereal like1,2, 3,4,5,6,7,8,91,3,4,7,8,9
      2-Ethyl-3,5-dimethylpyrazineNutty2,3,4,5,6,7,8,9,101,2,3,4,7,8,9,10
      Aldehydes
      2-MethylbutanalCocoa, almond1,2,5,6,7,8,9,101,2,3,4,6,7,8,9,10
      3-MethylbutanalMalt1,2,4,6.7.8,9,101,2,3,4,5,6,7,8,9,10
      HexanalGreen, fatty1,2,3,4,5,6,7,8,9,101,2,4,5,6,7,8,9,10
      FurfuralBread, almond, sweet7,8,9,104,9,10
      HeptanalFat, citrus, rancidNN
      NonanalFatty, green1,3,4,6,7,8,9,101,4,6.8.9
      BenzaldehydeAlmond, sugarNN
      PhenylacetaldehydeFlowery, honey like1,2,3,4,5,6,7,8,9,101,2,3,4,5,6,7,8,9,10
      Ketones
      2-HeptanoneSoapNN
      ɣ-ButyrolactoneCreamy1,4,5,7,9,1010
      Alcohols
      1-PentanolBalsamic510
      1-HexanolResin, flower, green1,2,5,71,6
      Furfuryl alcoholSweet, caramellicN5
      PyridineBurnt, smoky4,7,9,10N
      Sulfur compounds
      Dimethyl disulfideOnion, cabbage, putridN9,10
      MethionalCooked, potato2,3,4,7,8,9,11,12,133,4,7,8
      Others
      α-PinenePine, turpentine1,2,3,5 ,6,9,11,12,131,2,3,4,5,6,7,8,9,10
      2-AcetylfuranPeanut, sweetNN
      Number representation: 1 (raw seed), 2 (125 °C 30 min), 3 (125 °C 45 min), 4 (125 °C 60 min), 5 (135 °C 30 min), 6 (135 °C 45 min), 7 (135 °C 60 min), 8 (145 °C 30 min), 9 (145 °C 45 min), 10 (145 °C 60 min).

      The dominant pyrazines presented in RUSF were 2-ethyl-3,5-dimethylpyrazine, 2,6-diethyl-3-methylpyrazine, 2,3-dimethylpyrazine, 2-ethyl-3-methylpyrazine, 2,5-dimethylpyrazine. While the major pyrazines in the RGSF samples were 2-methylpyrazine, 2,3-dimethylpyrazine, 2,5-dimethylpyrazine, 2-ethyl-6methylpyrazine, 2-methyl-5-ethylpyrazine and 2-ethyl-3,5-dimethylpyrazine. These compounds formed during Maillard reaction, under conditions similar to those used in this study has been reported in a previous study[25]. The reducing sugars and amino acids increased during germination that leads to a significant increase of pyrazines in RGSF compared to RUSF. Heating L-threonine could form 2,5-dimethylpyrazine. Dehydration of heating L-serine following decarbonylation could form products or intermediates methylpyrazine and ethylpyrazine[26]. The content of 2-methylpyrazine, 2,5-dimethylpyrazine, 2,3-dimethylpyrazine, 2-ethyl-3,5-dimethylpyrazine at 60 min were 24.15, 72.53, 9.58, and 30.74 μg/g in RGSF, respectively. During roasting ungerminated sunflower seeds, 2,3-dimethylpyrazine required a minimum reaction time of 45 min, corresponding to a temperature of at least 145 °C. When heated at 145 °C for 45 and 60 min, the concentrations of 2,3-dimethylpyrazine were 0.55 and 1.30 μg/g, respectively. 2,5-Dimethylpyrazine, 2-ethyl-3-methylpyrazine, 2-ethyl-3,5-dimethylpyrazine increased as time and temperature increase. The concentration range of 2,5-dimethylpyrazine was 0.20 to 10.19 μg/g, the concentration in the raw material was the lowest, and the highest concentration was found after roasting at 145 °C for 60 min. The concentration of 2-ethyl-3-methylpyrazine ranged from 0.14 (raw material) to 3.89 μg/g (145 °C for 60 min). 2-ethyl-3,5-dimethylpyrazine was 0.19 μg/g of seed roasting at 125 °C for 30 min, reached to the highest concentration at 145 °C for 60 min (2.09 μg/g). The formation of the 2,6-diethyl-3-methylpyrazine requires a minimum reaction time of 45min at the corresponding temperature of 125 and 135 °C, a minimum reaction time of 30 min at 145 °C. It indicated that the heat treatment of seeds was necessary for the formation of these compounds. These pyrazines had also been reported in previous studies on the typical flavor of other roasting seed, such as pumpkin seed[25], perilla seeds[27]. The results of previous studies indicated that the minimum roasting temperature required for the formation of these compounds in pumpkin seeds was 100 °C, and the temperature required for the formation of pyrazine was higher than 150 °C.

      Aldehydes mainly contribute to the overall flavor of roasted oilseed. They mainly came from the lipid oxidation and degradation or Strecker reaction[28]. Fourteen aldehydes were identified in the RUSF which varied with different roasting conditions. The concentrations of isobutanal, 2-methylbutanal, 3-methylbutanal, and phenylacetaldehyde increased significantly during the roasting process, especially at 60 min. 2-Methylbutanal and 3-methylbutanal was responsible for a pleasing odor in many roasted foods[29]. The concentration of these compounds were significantly higher (p < 0.05) in RGSF compared to those in RUSF. Benzaldehyde contributed to bitter aroma[30], showed higher content in sunflower seeds at the 145 °C for 60 min. Hexanal detected in the RGSF (0.55−3.75 μg/g) was lower than that in the RUSF (0.48−8.49 μg/g). Higher temperature and long-time heating led to the large accumulation of undesirable flavor notes, such as hexanal, nonanal, and pyridine, especially in RUSF. Meanwhile, reduction of unsaturated fats (C18:2 and C18:3) were observed in RUSF and RGSF. The short chain branched aldehydes might be attributed to hydrolytic and thermal oxidative decomposition of unsaturated fatty acids[31].

      Aliphatic alcohols, mostly formed by the decomposition of hydroperoxides of fatty acids or the reduction of aldehydes[32,33]. The major alcohols in RGSF included furfuryl alcohol, hexanol, 1-octen-3-ol, verbenol, myrtenol. 1-Pentanol, hexanol, 1-octen-3-ol, and 3-methyl-2-propyl-1-pentanol were identified in RUSF. In RGSF, furfuryl alcohol began to appear and reached max at 30 min at all temperatures, and decreased with the increasing time. Hexanol decrease with prolonged time may be due to the formation of hexanal. Hexanol showed the same behavior in RUSF, the highest concentration was observed at 125 °C. 1-Octen-3-ol which contributes to an herbaceous aroma is generated from thermal decomposition of methyl linoleate hydroperoxide. It began to appear at 125 and 135 °C for 60 min and 145 °C for 45 min and reached maximum at 145 °C for 60 min (13.38 μg/g), but the content in RUSF decreased significantly with roasting temperature and time.

      Besides, terpenes including α-pinene and β-pinene were also important constituents of aroma. α-Pinene was the most abundant volatile component in RGSF. The concentration of α-pinene ranged from 3.58 to 38.85 μg/g in RGSF, 7.05 to 21.85 μg/g in RUSF and 7.57 μg/g in raw seed. β-Pinene has a woody-green pine-like smell. It reached max at 135 °C for 60 min with a concentration of 4.15 μg/g. In RUSF, β-pinene concentration increased from 0.76 to 3.00 μg/g with increasing temperature and time.

    • The germination process leads to structural modification and synthesis of new compounds. The content of fructose, glucose, amino acids, and GABA increased during germination. In addition, aroma precursors, such as reducing sugars and free amino acids are formed during germination. Therefore, germinated sunflower seeds are used in the roasting process to improve the nutritional quality of sunflower seed. To obtain the high nutritional quality of roasted sunflower seeds, the roasting temperature and time should not exceed 135 °C and 45 min. The best roasting temperature was suggested to roast at 125 °C. Metabolomics and flavormics technologies were able to differentiate the roasted sunflower seeds based on the roasting temperature and time. The roasting temperature and time had a significant effect on the metabolic and flavor profiles of RUSF and RGSF. Differences in these flavors between RUSF and RGSF may have been driven by differences in concentrations of precursor substances which increased due to the germination process. Pyrazines have a positive correlation with amino acids and reducing sugars. The amino acids, reducing sugars, pyrazines, and aldehydes could be identified as the biomarker to predict the flavor in the roasting process.

    • The authors confirm contribution to the paper as follows: study conception and design: Ge Y, Guo S, Lan W, Chen X; material preparation, data collection and analysis: Guo S, Ge Y; draft manuscript preparation: Guo S; manuscript revision: Ge Y, Guo S, Lan W, Chen X. All authors read and approved the final manuscript.

    • The data that support the findings of this study are available from the corresponding author upon reasonable request.

    • Dr. Weijie Lan and Dr. Xiao Chen's valuable comments and suggestions are acknowledged.

      • The authors declare that they have no conflict of interest.

      • Copyright: © 2024 by the author(s). Published by Maximum Academic Press on behalf of Nanjing Agricultural University. This article is an open access article distributed under Creative Commons Attribution License (CC BY 4.0), visit https://creativecommons.org/licenses/by/4.0/.
    Figure (6)  Table (4) References (33)
  • About this article
    Cite this article
    Guo S, Lan W, Chen X, Ge Y. 2024. Exploring the metabolic and flavoromic variations of germinated sunflower seed during roasting conditions. Food Materials Research 4: e012 doi: 10.48130/fmr-0024-0004
    Guo S, Lan W, Chen X, Ge Y. 2024. Exploring the metabolic and flavoromic variations of germinated sunflower seed during roasting conditions. Food Materials Research 4: e012 doi: 10.48130/fmr-0024-0004

Catalog

  • About this article

/

DownLoad:  Full-Size Img  PowerPoint
Return
Return