-
The adoption of the Sustainable Development Goals (SDGs) in 2015 has emphasized the importance of sustainable natural resource management. Within this context, the fishery industry plays a critical role in ensuring food security and nutrition, as well as providing a valuable source of raw materials[1]. In 2018, this sector achieved a volume of 178.5 million tons, experiencing a Compound Annual Growth Rate (CAGR) of 4.8% between 2022 and 2027[2]. However, this growing trend in the consumption of aquatic food has led to a notable increase in waste generation, primarily due to the perishable nature of these foods and the existence of inedible parts such as bone and skin. Despite being waste, these leftovers contain valuable compounds, with collagen being a particularly noteworthy example, known for its interesting properties and diverse industrial applications[3]. Among the commonly consumed marine fish in Malaysia are sardines[4], which contain up to 50% collagen (dry weight base) in the bones and scales[5]. Hence, sardine waste could serve as a viable alternative to mammalian collagen and its derivatives in Malaysia.
Fish collagen consists of polypeptide chains featuring repeating triplets of glycine along with the amino acids proline and hydroxyproline. Its unique properties including biocompatibility, negligible antigenicity, high biosafety, and cost-effectiveness, make it attractive for various industries such as medical, cosmetic, nutraceutical, food, and pharmaceutical[6]. It could be utilized in different forms such as injectable solutions, thin substrates, porous sponges, nanofibrous matrices, and micro- and nano-spheres, showcasing its versatility and significance in these sectors[7]. However, the extraction process could markedly influence collagen properties such as molecular weight, solubility, viscosity, and thermal stability[8].
Recently, collagen has been extracted from several fish species, such as Amazonian freshwater fish pirarucu[9], purple-spotted bigeye snapper[10], Atlantic cod[11], blacktip reef shark skin[12], starfish[13], Nile tilapia[14]. Current extraction methods often involve acidic treatment or enzymatic hydrolysis which could be complex and operate under harsh conditions, impacting collagen quality[15]. In addition, these methods result in an environmentally harmful waste stream that necessitates additional treatment[16]. Deep eutectic solvents and eutectic mixtures have emerged as alternatives, offering milder conditions and higher yield and quality of the extracted collagen[15]. However, one of the most important challenges faced with the application of deep eutectic solvents is their high viscosities, which can affect mass transfer rates and make handling and processing more challenging[17].
To address this issue, exploring alternative solvents derived from natural resources that are less harmful to the environment is a viable approach. Plant extracts, particularly those rich in organic acids, offer a promising solution[18]. Bananas rank as one of the most extensively consumed and traded crops worldwide. Its production volume increased from 69 million tons in 2000–2002 to 119.8 million tons in 2020. However, the peel, which accounts for a substantial portion of the fruit’s weight (35%–40%), generates over 41.9 million tons of waste annually, presenting significant environmental challenges[19]. Enhancing the recycling and reuse of banana peel (BP) could provide an environmentally friendly waste management solution while adding value to the peel. BP contains a wealth of dietary fiber, pectin, and more than 40 polyphenol antioxidants, such as ferulic acid and rutin, known for their strong antioxidant and antimicrobial characteristics[20].
The use of plant extracts containing reducing agents in nanoparticle synthesis has attracted considerable attention due to their eco-friendly nature and potential applications. These natural extracts, such as those from green tea, neem, and aloe vera, contain bioactive compounds that function as reducing agents in the synthesis process. By utilizing these extracts, researchers have been able to produce nanoparticles with unique properties suitable for a wide range of applications, especially in food and environment applications[21]. However, to the best of our knowledge, there are no reports in the literature on the use of plant extracts as solvents for the extraction of collagen. Hence, the use of BP water extracts as solvents for collagen extraction from sardine bone presents a sustainable approach, aligning with the principles of green chemistry. This study aims to investigate the possibility of collagen extraction from sardine bone using BP water extract and maximize the collagen yield. The extracted collagen will be characterized by its physicochemical properties. Overall, this research contributes to the growing body of knowledge on sustainable waste management and green chemistry practices, highlighting the potential of utilizing agricultural and fish processing waste to produce valuable products.
-
Sardine processing waste including bones obtained from a sardine processing company (Maperow Sdn. Bhd.) located in Kuala Terengganu, Terengganu, Malaysia. Green banana (Musa) peels, pineapple (Morris) pomace, mango (Chok Anan) peel, and coconut (Cocos Nucifera) husk were collected from local markets in Kuala Nerus, Terengganu, Malaysia between June, and July 2023. Citric acid monohydrate (≥ 99.0%), sodium hydroxide (≥ 98%), sodium chloride (99.0%−100.5%), and methanol (≥ 99, 9%) were purchased from Sigma-Aldrich, Germany.
Methods
-
This study investigated the feasibility of extracting collagen from sardine bones using a water extract derived from BP. Additionally, it thought to evaluate the potential of water extracts from other fruit waste sources, including mango peel (MP), pineapple pomace (PP), and coconut husk (CH), for collagen extraction under optimum conditions. This research aimed to contribute to sustainable waste management practices by exploring the potential application of biomass waste extracts in collagen extraction processes.
Preparation of water extract from fruit waste
-
Bananas, mangoes, pineapples, and coconuts were procured from local markets in Kuala Nerus, Terengganu (Malaysia), during June and July 2023. The fruits were then washed with tap water, and the desired parts of interest; BP, MP, PP, and CH; were carefully separated. Subsequently, the samples were dried in an air-circulating oven at 60 °C for 3 d until they reached a constant weight. The dried materials were then ground into a powder using a mortar and sieved to collect the particles with a mesh size of 120 μm.
For the preparation of water extracts, 50 g of each powdered sample was placed in a beaker and extracted with 500 mL of distilled water by heating the mixture at 60 °C for 30 min. After cooling, the mixture was filtered to obtain a brownish filtrate (Fig. 1), referred to as the water extract in this study. These extracts were then stored at 10 °C in a refrigerator for further analysis.
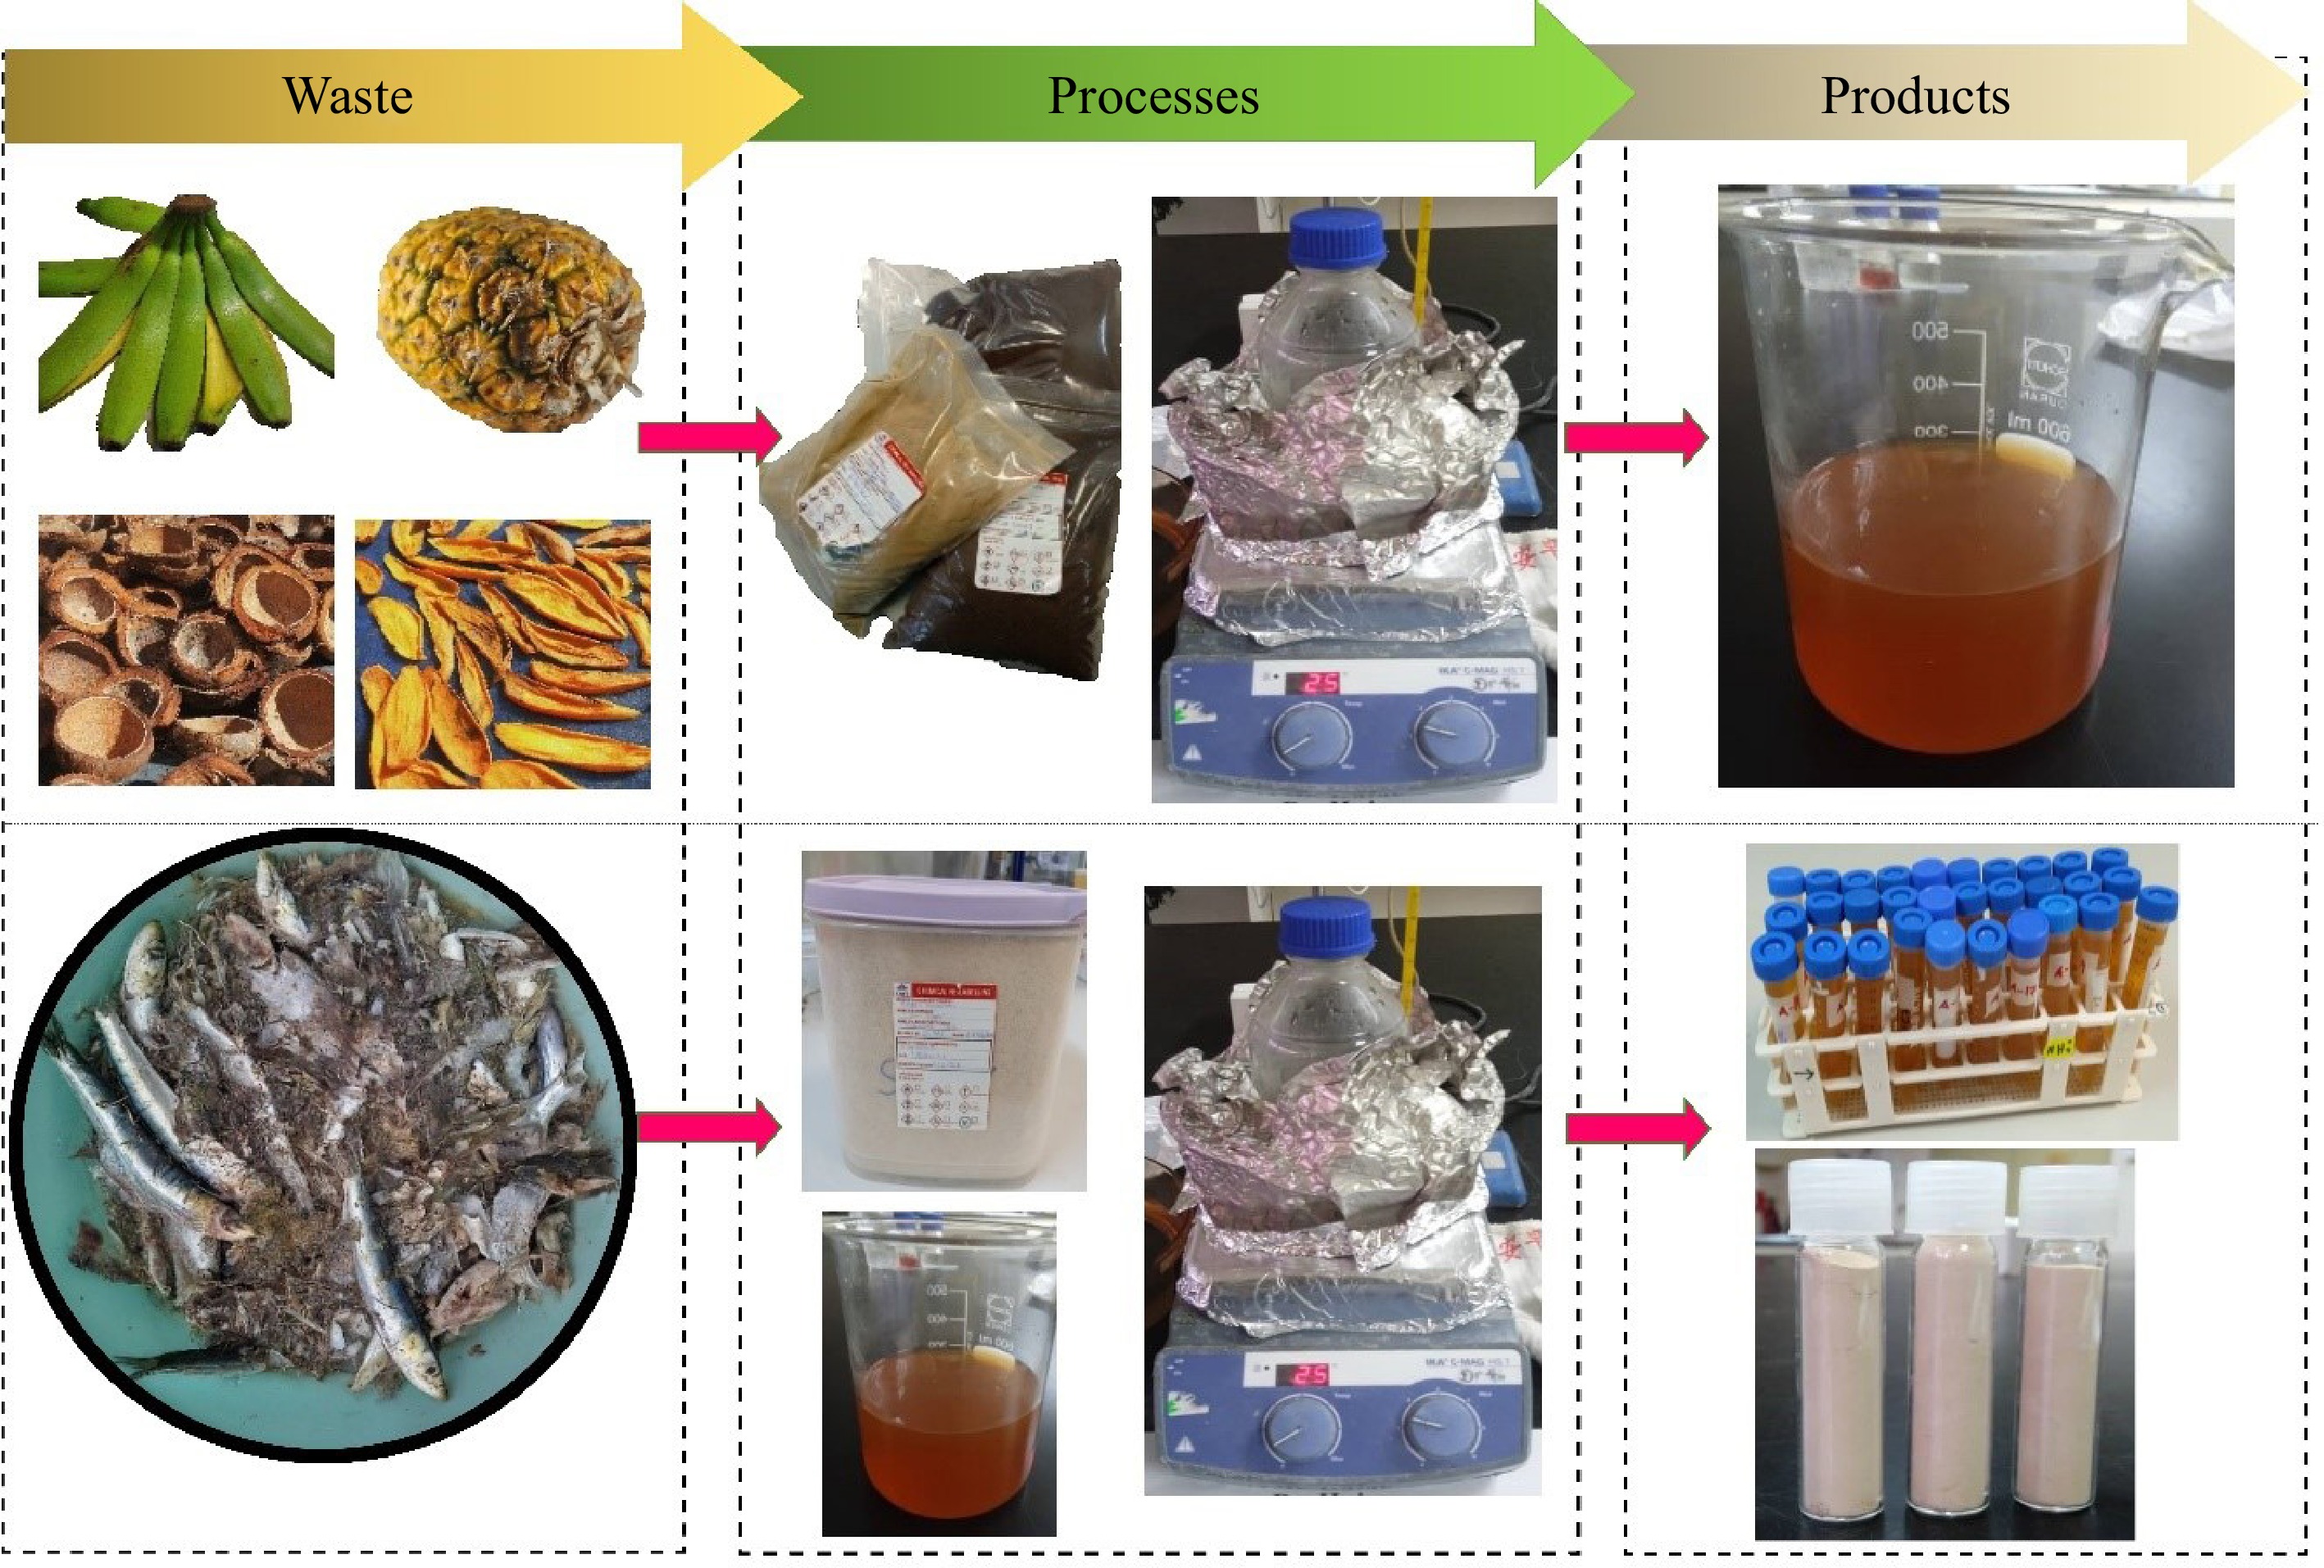
Figure 1.
The processes involved in preparation of water extracts from fruit waste (top), and extraction of collagen from sardine bone using the water extracts (bottom).
Preparation of fish waste
-
Sardine processing waste, primarily bones, was collected from Maperow Sdn. Bhd., in August 2023, and transferred in insulated cooler boxes to AKUATROP research labs. Then they were thoroughly washed with tap water to remove any remaining flesh and impurities. Subsequently, they were dried in an air-circulating oven at 40 °C until they were fully dried and reached a constant weight. To increase the extraction efficiency, the dried bones were pulverized into a powder, sieved to collect particles with a mesh size of 120 μm, and stored in a chiller at 10 °C before further use.
Experimental design
-
This study investigated the influence of process parameters on collagen extraction from sardine bones using a water extract from BP. Central Composite Design (CCD) was employed, incorporating three independent variables; temperature (T), sardine bone to water extract ratio (R), and extraction time (time), each at three coded levels (−1, 0, 1). The impact of these variables on the collagen extraction yield was studied over the range of 27−43 °C for T, 1:15−1:28 for R, and 8−88 h for time, respectively. These ranges were selected based on preliminary experiments. The experimental trials were conducted according to a design matrix (Table 1), and upon completion, the collagen extraction yield was analyzed using Response Surface Methodology (RSM) with a quadratic polynomial equation as shown in Eqn (1).
Table 1. Collagen extraction experimental yield from sardine bone using water extract from BP according to a three-level-three factors CCD experimental matrix.
Trial no. Variables Yield (%) T (°C) R (g mL−1) time (h) 1 35 1:20 48 7.2 2 30 1:25 24 3.3 3 40 1:15 24 3.5 4 30 1:15 24 2.0 5 35 1:20 48 7.9 6 35 1:20 8 1.3 7 40 1:25 72 9.1 8 40 1:15 72 5.5 9 27 1:20 48 3.9 10 30 1:15 72 2.6 11 35 1:12 48 1.6 12 35 1:20 88 6.5 13 35 1:28 48 5.6 14 35 1:20 48 7.6 15 35 1:20 48 7.3 16 40 1:25 24 4.2 17 43 1:20 48 7.7 18 30 1:25 72 8.1 19 35 1:20 48 7.4 20 35 1:20 48 7.2 $ Y={b}_{0}+\sum _{i=1}^{n}{b}_{i}{X}_{i}+\sum _{i=1}^{n}{b}_{ii}{X}_{i}^{2}+\sum _{i=1}^{n}\sum _{j \gt 1}^{n}{b}_{ij}{X}_{i}{X}_{j} $ (1) where, the intercept, linear, quadratic, and interaction coefficients are denoted by b0, bi, bii, bij, respectively, with Y representing the response. The number of variables studied and optimized in the experiments are represented by n. The coded independent variables are denoted with Xi and Xj.
The statistical analysis of all experimental data was performed using Minitab software, version16. The quality of the developed model was assessed using the correlation value (R2), whereas its statistical significance was evaluated through analysis of variance (ANOVA).
Collagen extraction
-
Collagen was extracted using a modified version of the method described by Liu & Huang[22]. Briefly, in each trial, varying amounts of sardine bone powder were added to 350 mL of the water extract derived from BP and experiments were carried out under the conditions detailed in Table 1. Each experiment was performed three times. After extraction, the remaining fish bones were separated by centrifugation at 8,000× g for 15 min. The supernatant was then salted out by adding NaCl to a final concentration of 0.9 mol L−1, and the collagen was separated by centrifugation at 10,000× g for 20 min at 4 °C. It is crucial to emphasize that the water extract from BP was chosen as the solvent for the process optimization due to more availability of BP in Kula Nerus and further investigations using other water extracts were conducted under the optimal conditions. Additionally, a comparative experiment was performed using citric acid as a conventional solvent, serving as the reference study. Equation (2) was used to calculate the collagen extraction yield.
$ \mathrm{Yield}\left(\text{%}\right)=\dfrac{\mathrm{Weight\; of\; collagen\; }\left(\mathrm{g}\right)}{\mathrm{Weight\; of\; Sardine\; bone\; powder}\; \left(\mathrm{g}\right)}\times100{\text{%}} $ (2) Characterization
FT-IR analysis
-
The presence of collagen in the extracted samples was assessed using FT-IR analysis. Samples were analyzed by an FT-IR spectrophotometer (IRTracer-100, Shimadzu, Japan) equipped with an attenuated total reflectance cell (ATR) featuring a diamond crystal. The spectra were recorded over the range of 4,000−400 cm−1, with 64 scans accumulated, and a resolution of 16 cm−1.
TGA analysis
-
The thermal stability of collagen is strongly influenced by its hydroxyproline content and the physiological temperature of fish[3]. To assess the thermal stability of the sample extracted under optimum conditions, Thermogravimetric Analysis (TGA) was employed (622 Star System, Mettler Toledo, USA). The sample was tightly sealed in an aluminum crucible before being subjected to TGA under a nitrogen atmosphere. TGA was performed at a heating rate of 10 °C min−1, with the temperature ranging from 0−250 °C to analyze the denaturation process. The denaturation energy was calculated by integrating the curve obtained from the experimental data[23].
Proximate analysis
-
The proximate composition of the sample extracted under optimum conditions was determined following the AOAC 2000 recommended procedures[24]. Moisture content was determined by placing the sample into an aluminum dish and by drying it in a forced-air convection oven at 105 °C overnight. Ash content was measured by incinerating the sample in a muffle furnace at 600 °C. Kjeldahl method was used to assess the protein content of the samples[24]. This method involved sample digestion, followed by distillation, and titration. The lipid content was determined by extracting the samples using a Soxhlet apparatus and petroleum ether as solvent. Crude fiber was determined by digesting the samples with sulfuric acid and sodium hydroxide. The energy content of the samples was determined using bomb calorimetry, where the measured heat of combustion directly reflects the material's energy content[24].
UV-visible analysis
-
To identify the chemical composition of water extracts, UV-visible spectra of water extracts derived from BP, CH, MP, and PP were analyzed using a spectrophotometer (UV-1800, Shimadzu, Japan). All the samples were directly transferred to the cuvette without additional preparation. The recorded spectra covered the wavelength range of 400−800 nm.
GC-MS analysis
-
The chemical profile of water extracts was analyzed using GC-MS machine (GCMS-QP 2010 Ultra, Shimadzu, Japan). The analysis employed a ZB-5MS column (20 m × 0.18 mm, film thickness 0.18 μm, Shimadzu). The injector temperature was set at 250 °C, and a split injection mode was used with a ratio of 30:1. The oven temperature started at 100 °C and was held for 2 min before ramping up to 280 °C at a rate of 10 °C min−1, where it was held for an additional 15 min. The carrier gas was helium at a flow rate of 1 mL min−1. Component identification was achieved by comparing the mass spectra with the NIST MS 14.0 database.
-
Table 2 summarizes the regression model for the collagen extraction yield. Using the experimental data presented in Table 1, a quadratic model equation was developed to describe the relationship between the input variables and response. This equation includes linear, interactive, and quadratic terms, aiming to provide a comprehensive understanding of the correlation. In this context, T stands for extraction temperature, R represents the sardine bone-to-water extract ratio, and time indicates the extraction time.
Table 2. Estimated regression coefficients of the model, T-value, and p-value for the collagen extraction yield using the water extract from BP.
Term Coefficient T-value p-value Constant 7.424 41.50 0.000 T 0.935 7.88 0.000 R 1.320 11.12 0.000 time 1.555 13.10 0.000 T × T −0.465 −4.02 0.002 R × R −1.246 −10.78 0.000 time × time −1.145 −9.91 0.000 T × R −0.314 −2.02 0.071 T × time 0.176 1.14 0.282 R × time 0.891 5.75 0.000 Table 2 shows the T- and p-values for the fitted second-order polynomial model. These values were used to assess the significance of each parameter in the model. The null hypothesis for this test assumes that a parameter's coefficient is equal to zero. If the T-value exceeds the critical T-value, the null hypothesis is rejected. The p-value indicates the probability of a parameter coefficient being zero, and a p-value exceeding 0.05 suggests the parameter can be excluded from the model as it lacks significant effect at a 95% confidence level[25]. Hence, in this study, only two interactive parameters, T × R and T × time, were found to be not significant in collagen extraction.
On the other hand, the model's validity was confirmed by ANOVA, revealing a p-value of 0.000, which indicates that the regression is significant at the confidence level of 95% (p < 0.05)[25]. Both the F-value and the p-value of the lack-of-fit indicate that there is no lack of fit at the confidence level of 95%, as the calculated F-value is less than the critical F-value obtained from the F-distribution table.
The p-value for the lack of fit is another statistical measure used to assess the adequacy of a model in fitting the data. It tests the hypothesis that the model fits the data well, indicating no significant lack of fit. If the p-value is lower than the chosen significance level (e.g., 0.05), it suggests that the model does not adequately explain the data, and there is a significant lack of fit[26]. For this model, the reported p-value is 0.062, which is higher than 0.05.
In linear regressions, the correlation coefficient (R2) assesses the overall goodness of fit of the model, quantifying how well the model explains the variation in the dependent variable using the independent variables[26]. In this case, it's value of 0.9835 indicates the independent variables account for 98.35% of the variation in the collagen extraction (Fig. 2).
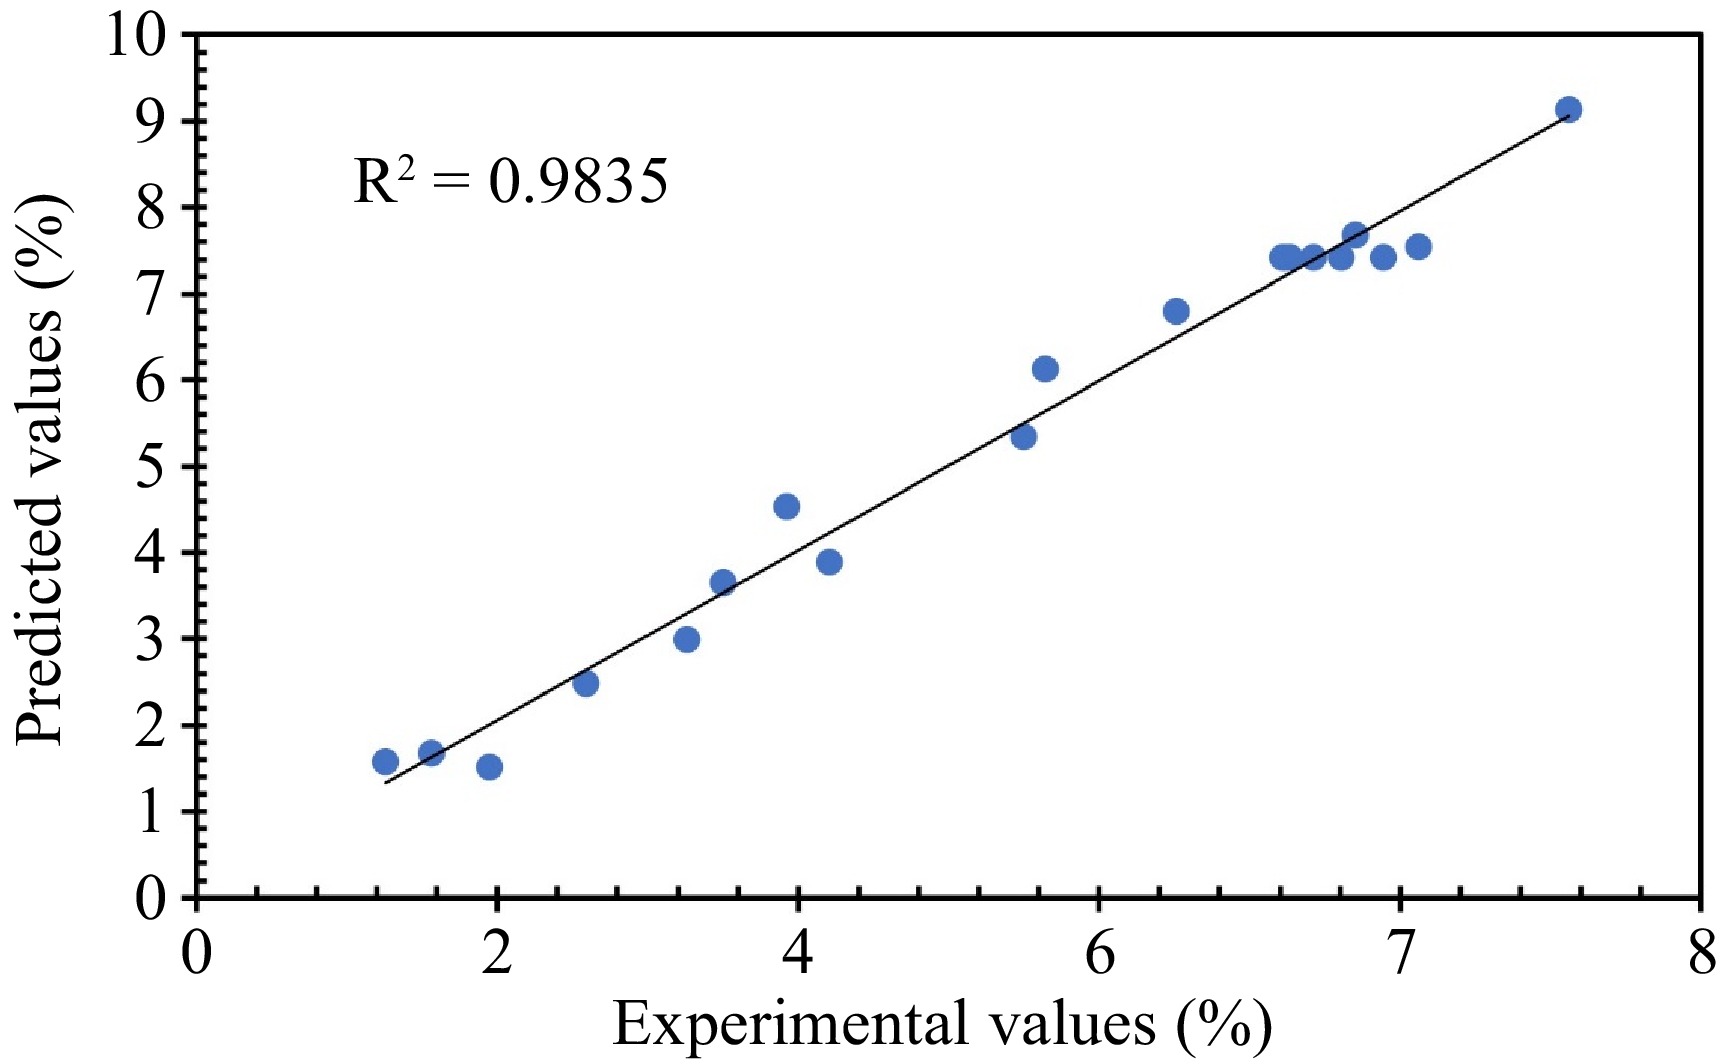
Figure 2.
The plot of the predicted values, calculated by fitting the models, vs experimental values for collagen extraction yield using the water extract from BP.
Effect of extraction parameters on collagen yield
-
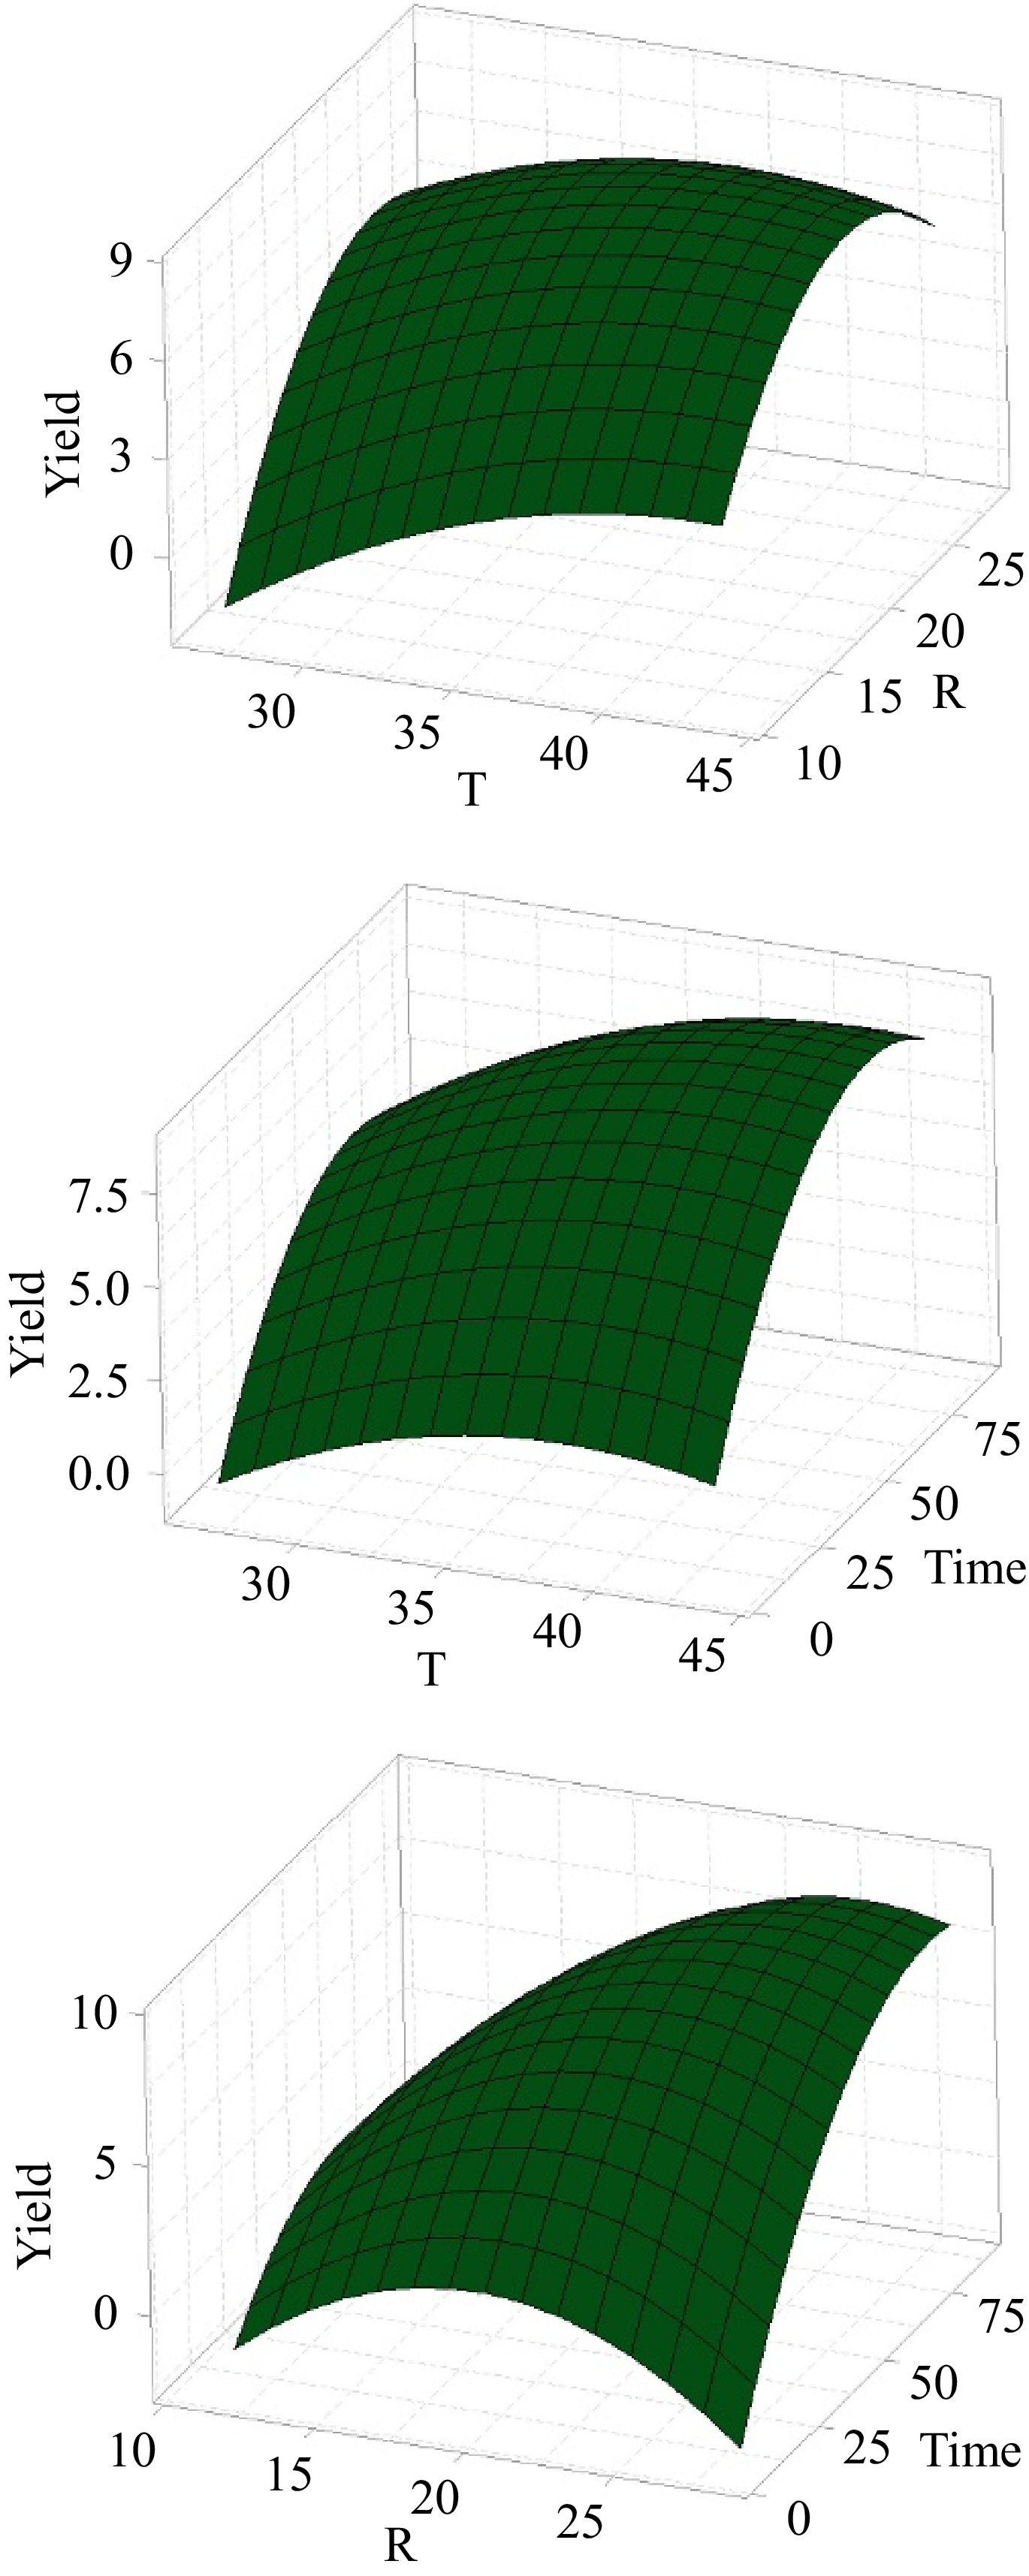
The coefficients presented in Table 2 provide insights into the variable's impact on the collagen extraction yield. Notably, extraction time emerges as the most influential variable with a positive regression coefficient of 1.555, indicating that longer extraction times enhanced collagen extraction yield, consistent with findings in existing literature[27]. Figure 3 illustrates surface plots for collagen extraction using the water extract from BP. Notably, an extraction time of 8 h resulted in a low yield of 1.3%, underscoring the need for adequate extraction duration. For a moderate extraction time of 24 h, yields varied widely depending on other extraction conditions. The highest yield 9.1%, was obtained after 72 h, demonstrating that prolonged extraction time improved yield. However, extending extraction times beyond 72 to 88 h led to a gradual decrease in yield due to collagen degradation[28].
The second most influential variable is the sardine bone-to-solvent ratio, with a positive coefficient of 1.320 (Table 2). This study examined ratios ranging from 1:12 to 1:28 (Table 1). Increasing the ratio from 1:12 to 1:20 boosted yield, but further increasing to 1:28 led to a decrease in yield. A higher sardine bone-to-solvent ratio of 1:25 resulted in higher yields than a ratio of 15, regardless of temperature. For instance, at 40, increasing the ratio from 1:15 to 1:25 improved the yield from 5.5% to 9.1%. Similarly, at 30, the yield increased from 2.6% to 8.1% with the same ratio change. These trends suggest that the sardine bone-to-solvent ratio influences collagen extraction yield in several ways. Within the 1:12−1:20 range, there are enough solvent molecules for sardine bone in the extraction medium. Increasing the ratio within this range can enhance the contact surface area between the sardine bone and the solvent molecules as well as improvement of the solvent molecules diffusion rate into the sardine bone matrix, thereby facilitating collagen extraction. Moreover, a higher ratio can ensure that all parts of the sardine bone are in direct contact with the extracting solvent, maximizing collagen extraction[28].
Temperature, the least influential variable, has a positive coefficient of 0.935 (Table 2). This study examined temperatures ranging from 27 to 43 °C. Collagen extraction yield increased as the temperature rose within the range of 27−40 °C. The yields are generally higher around 35 to 40 °C. At 40 °C, yields were consistently higher than 30 °C. Higher temperatures accelerate the reaction rate, solubility, and diffusion rates, leading to increased collagen extraction yield. Specifically, at 40 °C with a ratio of 1:25, and 72 h, the yield was 9.1%, while it dropped to 5.5% for a ratio of 1:15 under the same conditions. At 43 °C, the yield was 7.7%, suggesting that temperatures slightly above 40 °C can still maintain high yields, but extremely high temperatures may not be necessary. The yield at 43 °C with a ratio of 1:20 after 48 h was 7.7%. These results are due to collagen degradation at temperatures higher than 40 °C[29,30]. At 27 °C, the yield dropped to 3.9%, indicating reduced extraction efficiency at lower temperatures.
Process optimization
-
The response optimizer tool in Minitab software predicted the optimum values of the selected variables. These values include a temperature of 40 °C, a sardine bone-to-solvent ratio of 24, and an extraction time of 74 h, which were determined to achieve a maximum collagen extraction yield of 9.21%. Then the optimum response variables were tested to validate the model predictions, resulting in a collagen extraction yield of 9.82%, which closely aligns with the model prediction. This result indicates that the model is reliable and can effectively predict the optimal conditions for maximizing collagen extraction yield.
Effect of water extracts from different types of waste
-
The results presented in Table 3 underscore the significant impact of solvent pH on collagen extraction yield. Collagen exhibits higher solubility under acidic conditions[31]. Therefore, solvents with lower pH values, like PP (pH 4.46) and MP (pH 4.80), are expected to be more effective in extracting collagen. The highest extraction yield (13.58%) is achieved with PP, due to its lowest pH compared to other solvents. Conversely, CH, with the highest pH (6.85), yielded the lowest (2.10). Citric acid and BP, with a pH value of 5.87, also resulted in lower extraction yields. This trend can be attributed to the decreasing solubility of collagen as pH rises, leading to diminished extraction efficiencies.
Table 3. Collagen extraction yield for different solvents under optimum conditions, including temperature of 40 °C, sardine fish bone to solvent ratio of 24, after 74 h of extraction.
Biomass source for water extract Solvent pH Collagen yield (%) BP 5.87 9.82 CH 6.85 2.10 PP 4.46 13.58 MP 4.80 11.79 Citric acid 5.87 4.06 Another important parameter is solvent purity. As described in the solvent preparation section, water extracts were obtained by boiling biomass powder in water. Consequently, these extracts are not pure and likely contain various chemicals extracted simultaneously from the waste feedstock. The chemical composition of these water extracts, established through GC-MS analysis are listed in Table 4.
Table 4. GC-MS profile of solvents extracted from biomass including BP, CH, PP, and MP.
Retention time Name Molecular formula Molecular
weight (g mol−1)BP 3.136 Oxalic acid C2H2O4 90.036 6.331 Malic acid C4H6O5 134.088 8.102 Citric acid C6H8O7 192.124 9.634 2,4-di-tert-butylphenol C14H22O 220.33 14.638 Methyl palmitate C17H34O2 270.46 CH 3.892 p-Coumaric acid C9H8O3 164.154 8.102 Syringic acid C9H10O5 198.17 16.551 Epicatechin C15H14O6 290.27 PP 6.331 Malic acid C4H6O5 134.088 8.102 Citric acid C6H8O7 192.124 8.587 Ferulic acid C10H10O4 194.18 MP 4.743 Succinic acid C4H6O4 118.088 6.331 Malic acid C4H6O5 134.088 8.102 Citric acid C6H8O7 192.124 10.660 3-Deoxy-d-mannoic lactone C6H10O4 146.14 10.985 3-Deoxy-d-mannoic acid C6H12O5 162.14 20.551 Mangiferin C19H18O11 422.38 The GC-MS analysis reveals that BP, PP, and MP contain malic acid and citric acid, whereas these acids are absent in the water extract of CH. In contrast, the CH water extract contains p-coumaric acid and syringic acid, which are weaker acids compared to malic acid and citric acid. These results confirm variations in pH among the water extracts.
To investigate the impact of the chemical composition of the water extracts on the extraction yield, the hierarchical structure of fish bone is illustrated in Fig. 4. This extraction process likely involves the dissolution of mineral components, facilitating the extraction of collagen from the bone matrix. Collagen is embedded in minerals within the structure of fish bone. Releasing these minerals as soluble salts could liberate the embedded collagen from the fishbone matrix[32], leading to an increase in the collagen extraction yield. Among the different acids present in the water extracts, citric acid, and malic acid can form chelates with minerals in the fishbone.
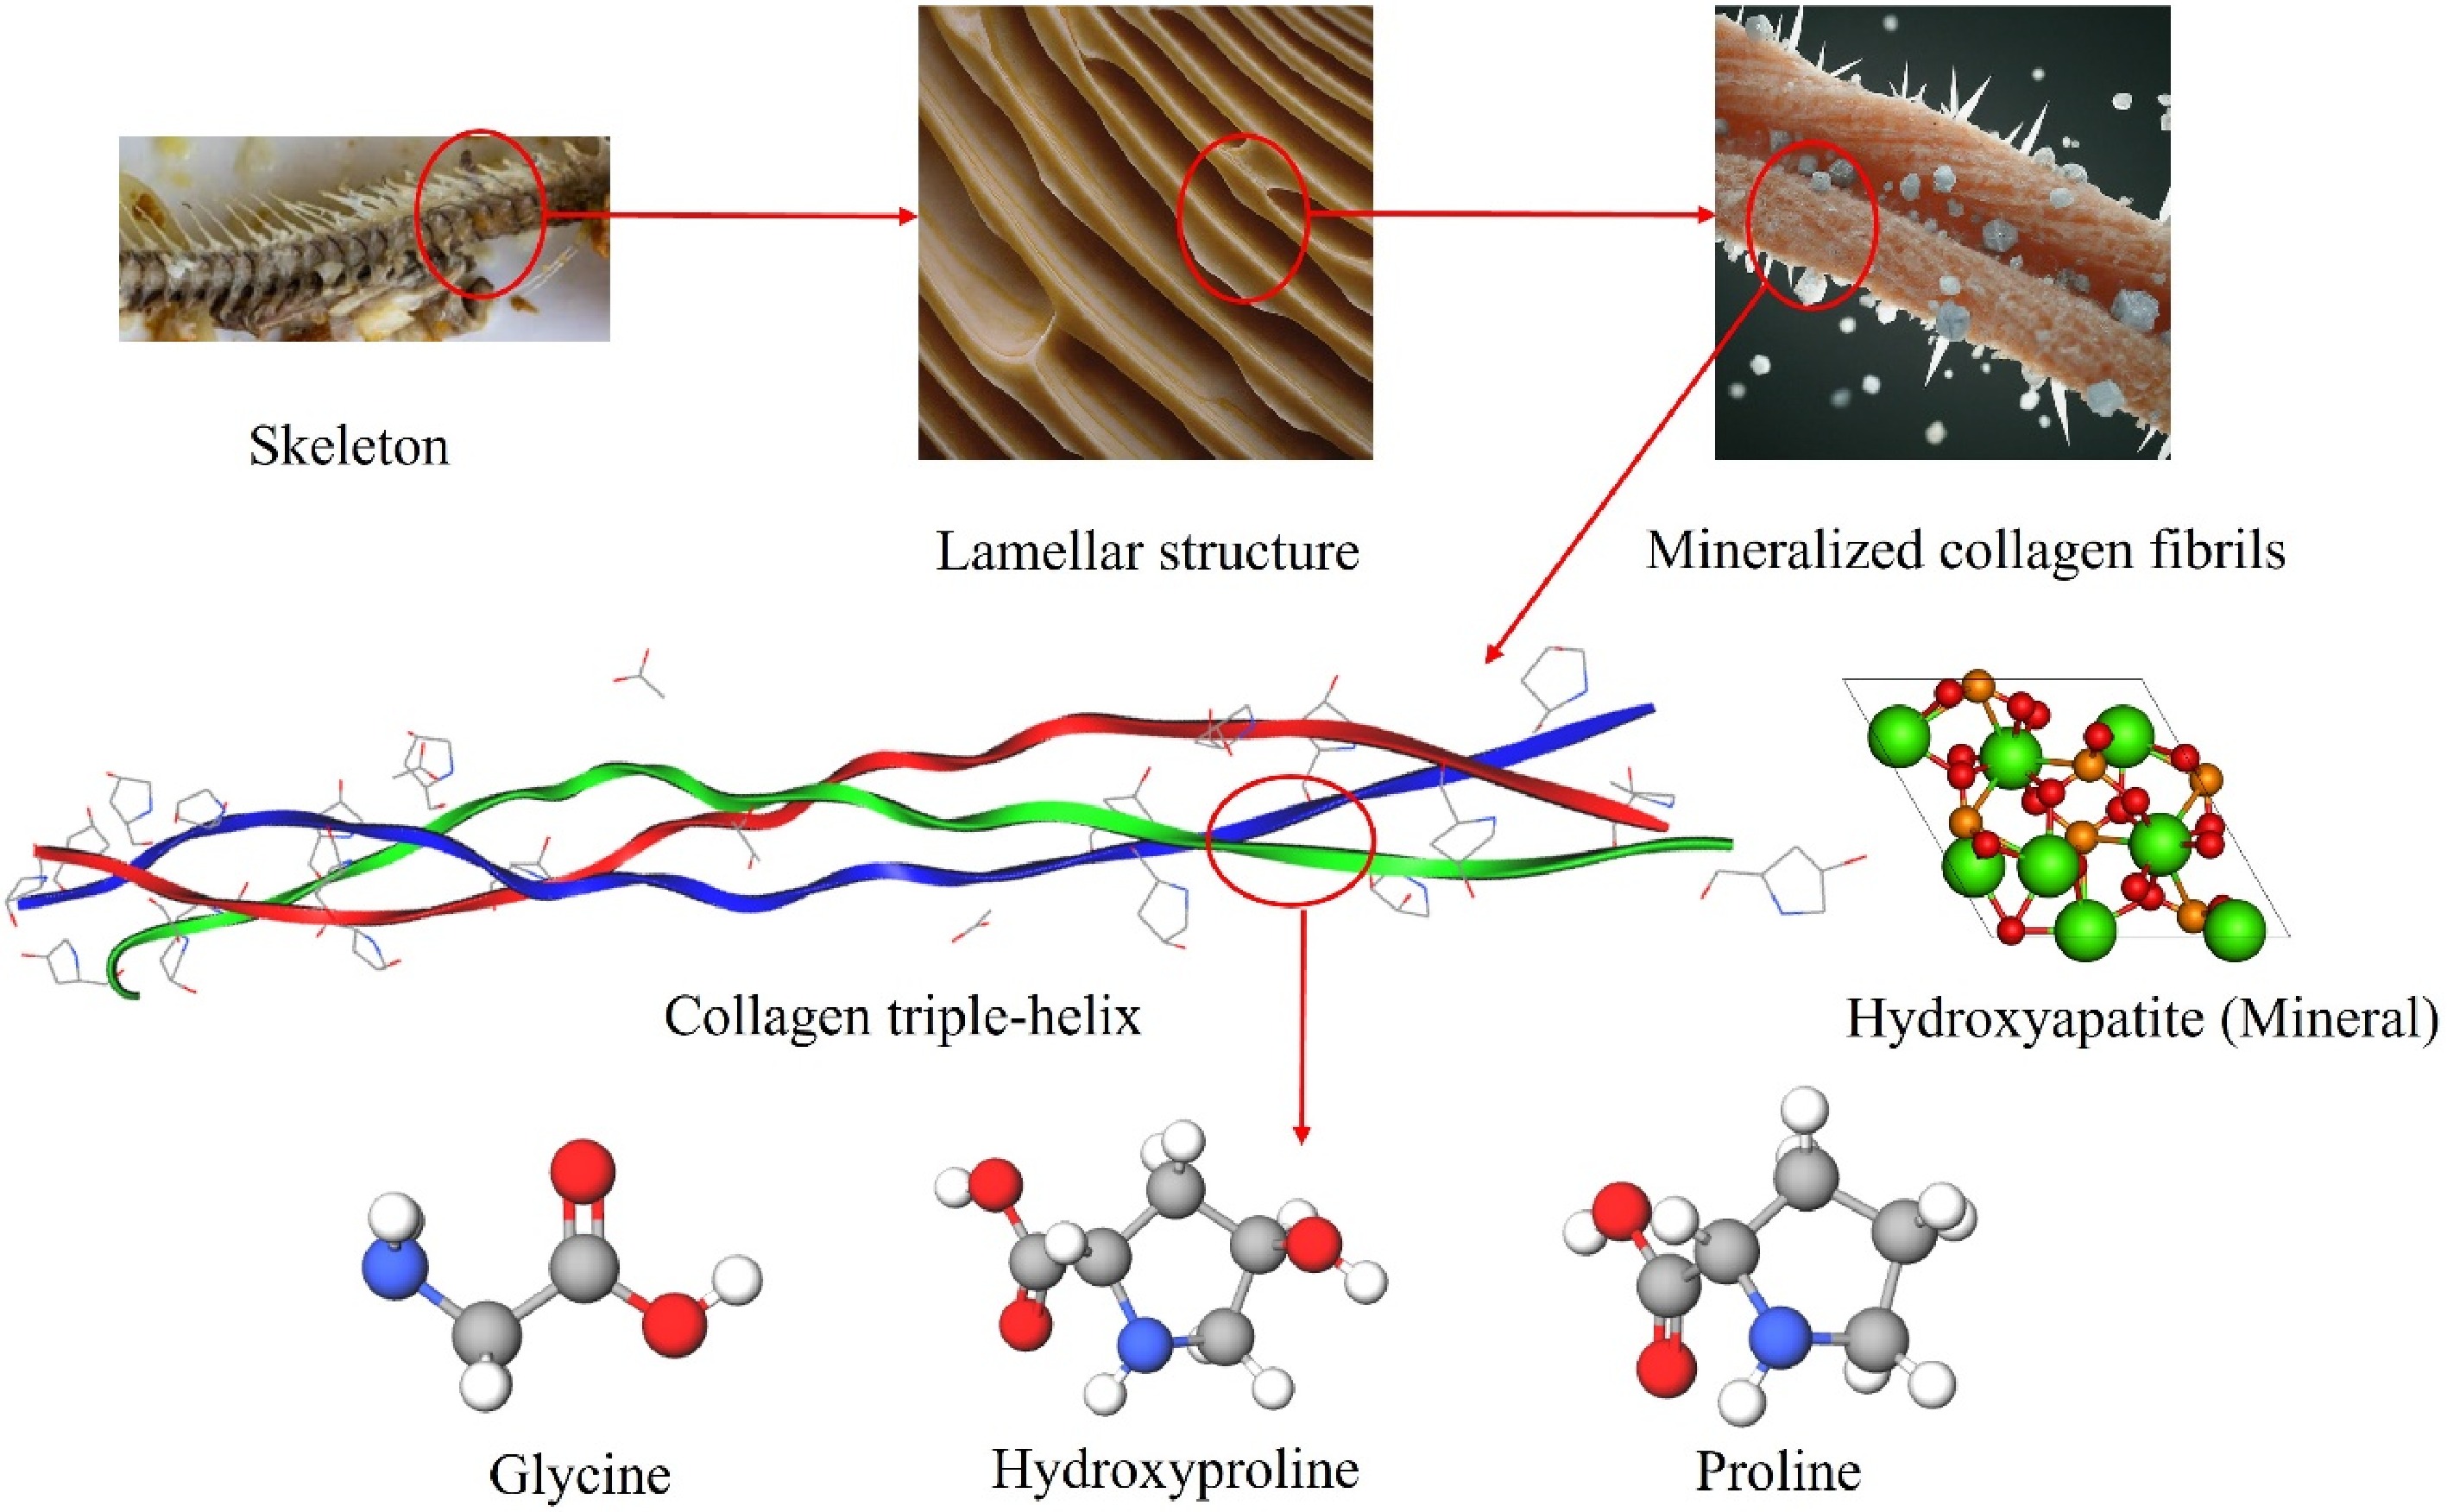
Figure 4.
Hierarchical structure of fish bone and amino acids found in collagen structure[33].
FT-IR analysis
-
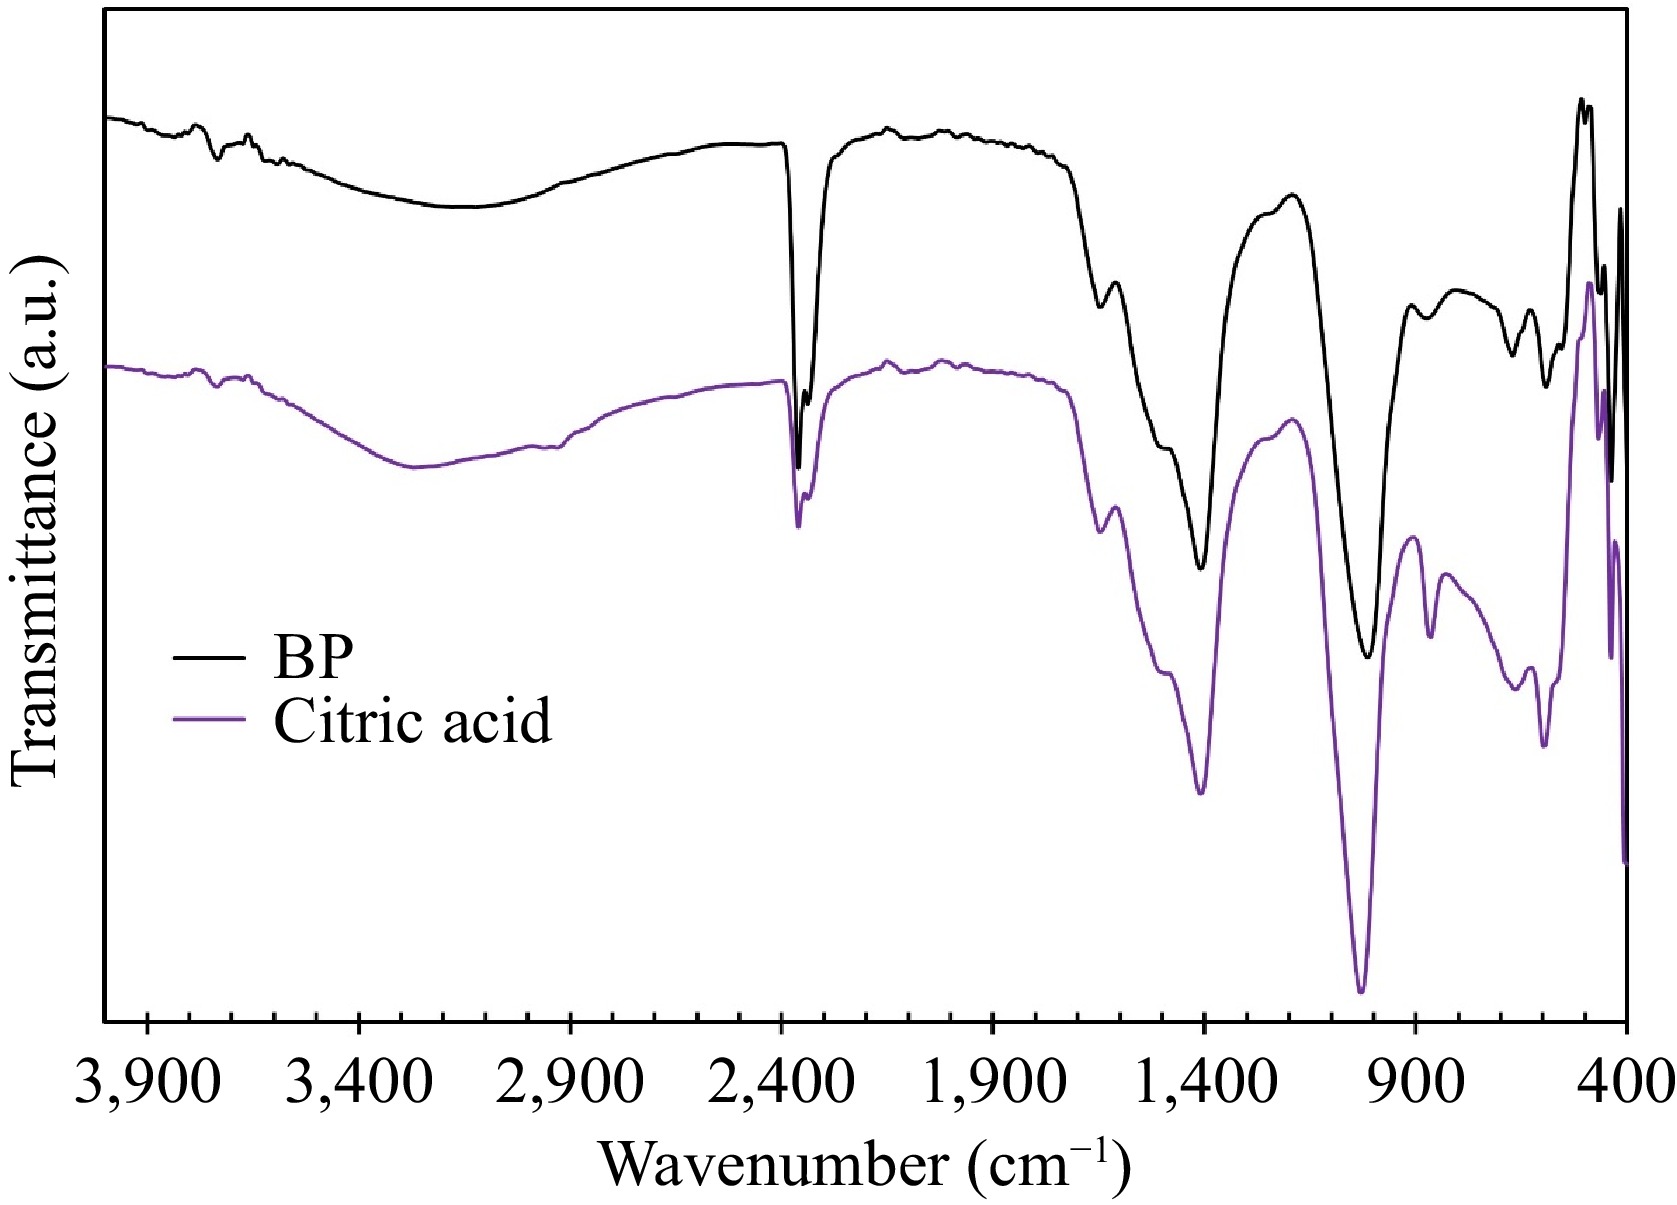
The FT-IR spectra of collagen extracted using citric acid and BP extract are compared in Fig. 5. These spectra show similarity, with a broad band in the range of 3,250−3,650 cm−1, corresponding to hydrogen bonds in the collagen structure. Peaks at 2,962.66 and 2,931.80 cm−1 are attributed to -C-H (CH3) and -C-H (CH2) stretching, respectively. The peak at 16,443.35 cm−1 is associated with amid I, while the one at 1,530 cm−1 is attributed to amid II[15]. These peaks confirm the presence of collagen in the extracted samples. Notably, the spectra exhibit two sharp peaks at 2,360.87 and 2,337.72 cm−1. Before analysis, the samples were subjected to heat treatment for 6 h at 60 °C to remove water. This heat treatment step could lead to the decomposition of organic chemicals from the water extracts, releasing CO2, which could then be absorbed on the surface of the sample[34]. Therefore, the presence of CO2 is observed in the spectra.
TGA analysis
-
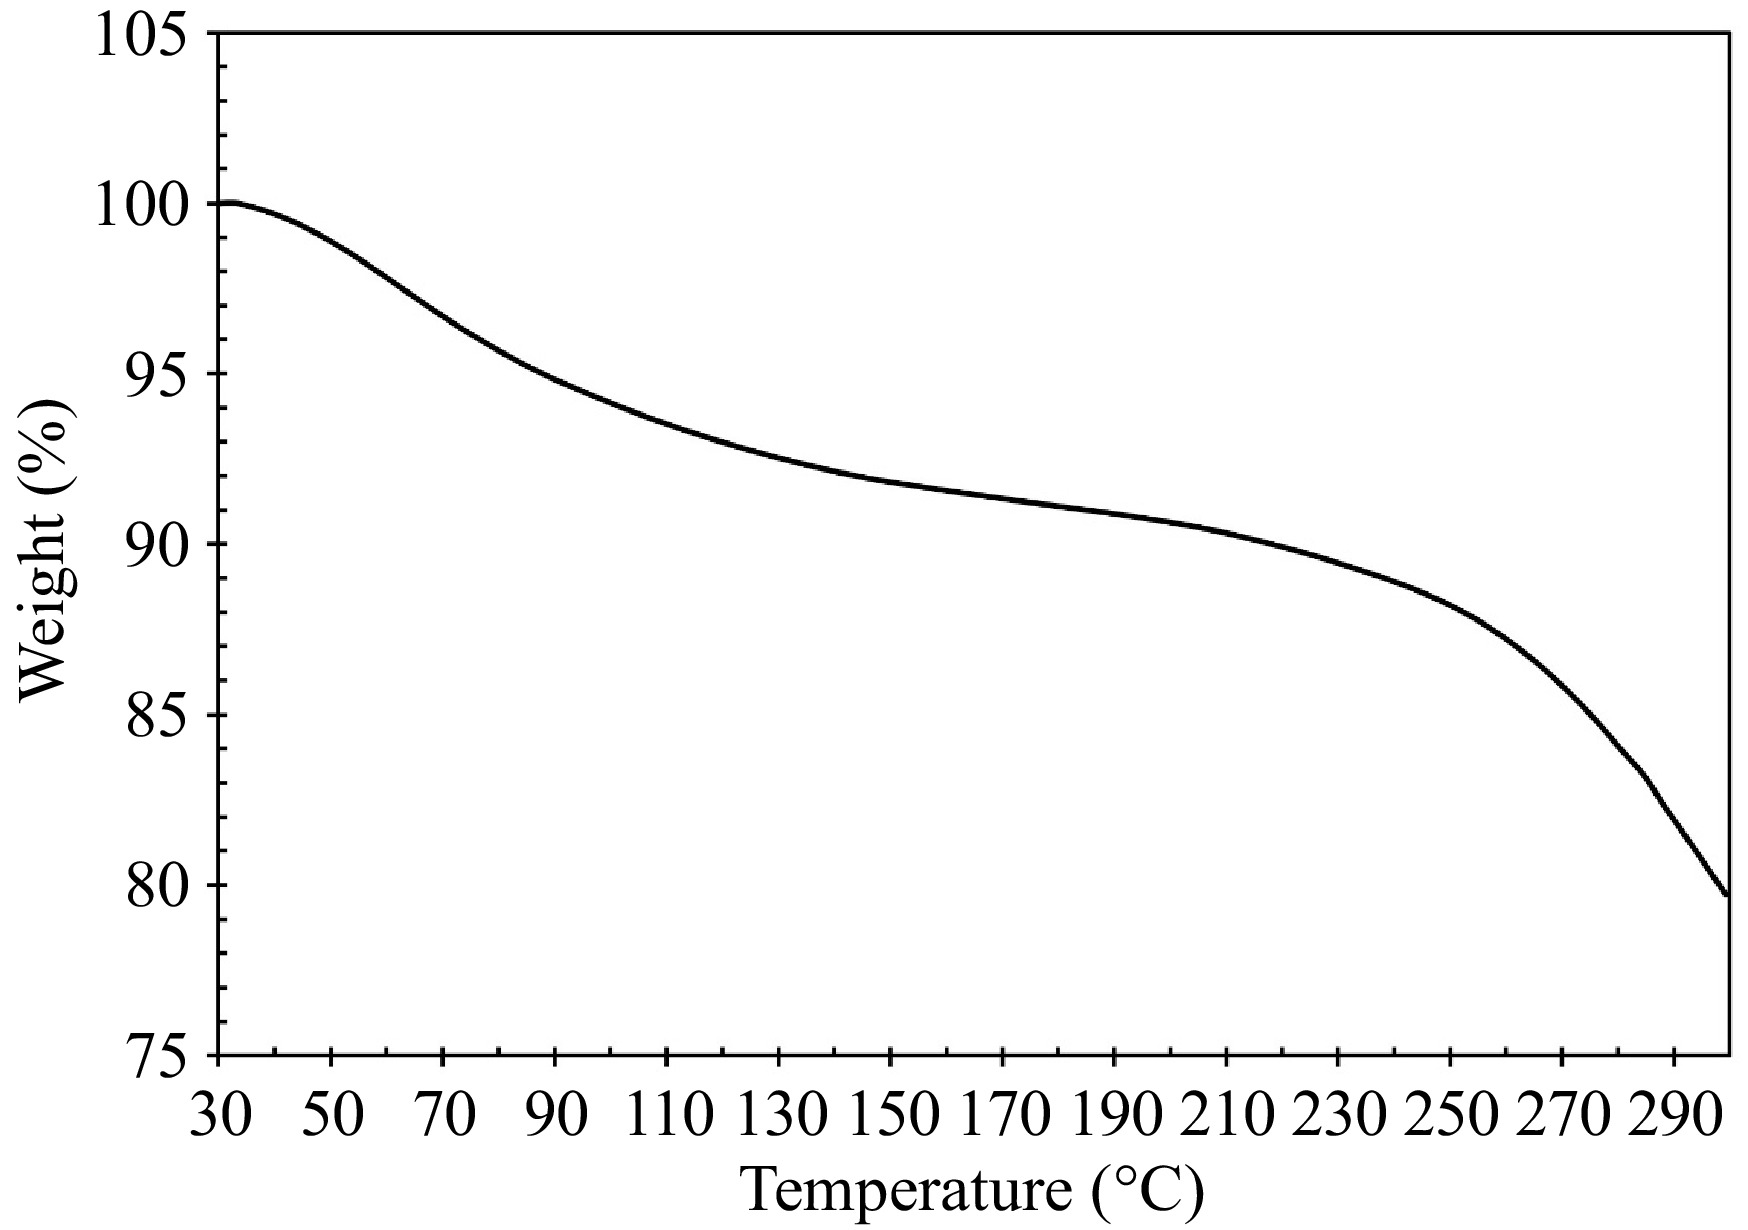
To evaluate the thermal stability of the samples obtained under optimal conditions, TGA was employed, and the results are presented in Fig. 6. Two mass losses are seen upon heating the sample. The first mass loss is observed at 75.33 °C, accounting for 7.15% of the total mass. This low-temperature mass loss is due to the evaporation of water[35]. Another mass loss is observed at 282.17 °C, accounting for 11.14% of the total mass. During this stage, organic compounds within the sample undergo decomposition or combustion, leading to the release of gases such as CO2, NH3, and H2S. this process is often associated with the degradation of proteins present in the collagen samples[36].
The denaturation temperature of collagen type I is intricately linked to its hydroxyproline content, higher hydroxyproline levels correspond to increased thermal stability of collagen type I[37]. Additionally, the thermal stability is influenced by the physiological temperature of the fish species[30]. Collagen from tropical and subtropical fish tend to exhibit higher thermal stability, with freshwater fish collagen generally being more stable than that from marine species[3].
Proximate analysis
-
Table 5 presents the proximate analysis of both the sardine bone and the collagen extracted under optimal conditions. The sardine bone has a high ash content of 51.04%, while the extracted collagen has a content of 12.76%. The fishbone mainly consists of calcium, phosphorus, and other minerals essential for bone structure and strength [2]. The ash found in the extracted collagen is due to the presence of minerals dissolved in the water extract during the collagen extraction process. Both the sardine bone and the extracted collagen have the same moisture content of 8.0%, attributed to humidity absorption[2].
Table 5. Proximate analysis of sardine fish bone and extracted collagen at optimum conditions; temperature of 40 °C, fishbone to solvent ratio of 24, and extraction time of 74 h.
Sardine fish bone Collagen sample Total ash (%) 51.04 12.76 Moisture (%) 8.0 8.0 Protein (%) 22.3 73.3 Total fat (%) 0.9 0.1 Carbohydrate (%) 5 5 Crude fiber (%) < 0.1 < 0.1 Energy kcal 100 g−1 117 316 The protein content of the extracted collagen is 73.3%, much higher compared to the sardine bone, 22.3%. This indicates that the extraction process is highly effective in isolating collagen from the fishbone. Both the sardine fish bone and the extracted collagen sample have low fat content (< 1%). Sardines, similar to the fish used in this study, exhibit a fat content ranging from 2.64% to 25.52% due to variations in catch season, location[38], sampling time, and through washing of sardine bones during preparation.
Both the sardine bone and the collagen sample have the same carbohydrate content, 5.0%. Fish bones contain a small amount of carbohydrates, primarily in the form of complex sugars, which provide structure and flexibility to the bones[2]. The other source of carbohydrate detected in the collagen sample could come from those absorbed from the water extract. Both the sardine bone and the collagen sample have very low crude fiber content, less than 0.1%. The collagen sample has an energy content of 3.16 kcal g−1, higher than the one for sardine bone's 1.17 kcal g−1. This higher energy content can be attributed to the collagen sample's higher protein content, as protein provides more energy per gram compared to other macronutrients[39]. Overall, the proximate analysis results indicate that the collagen extraction process is highly effective in isolating collagen from sardine bone, resulting in a collagen sample with significantly higher protein content and energy value compared to the original fish bone.
UV-Vis analysis
-
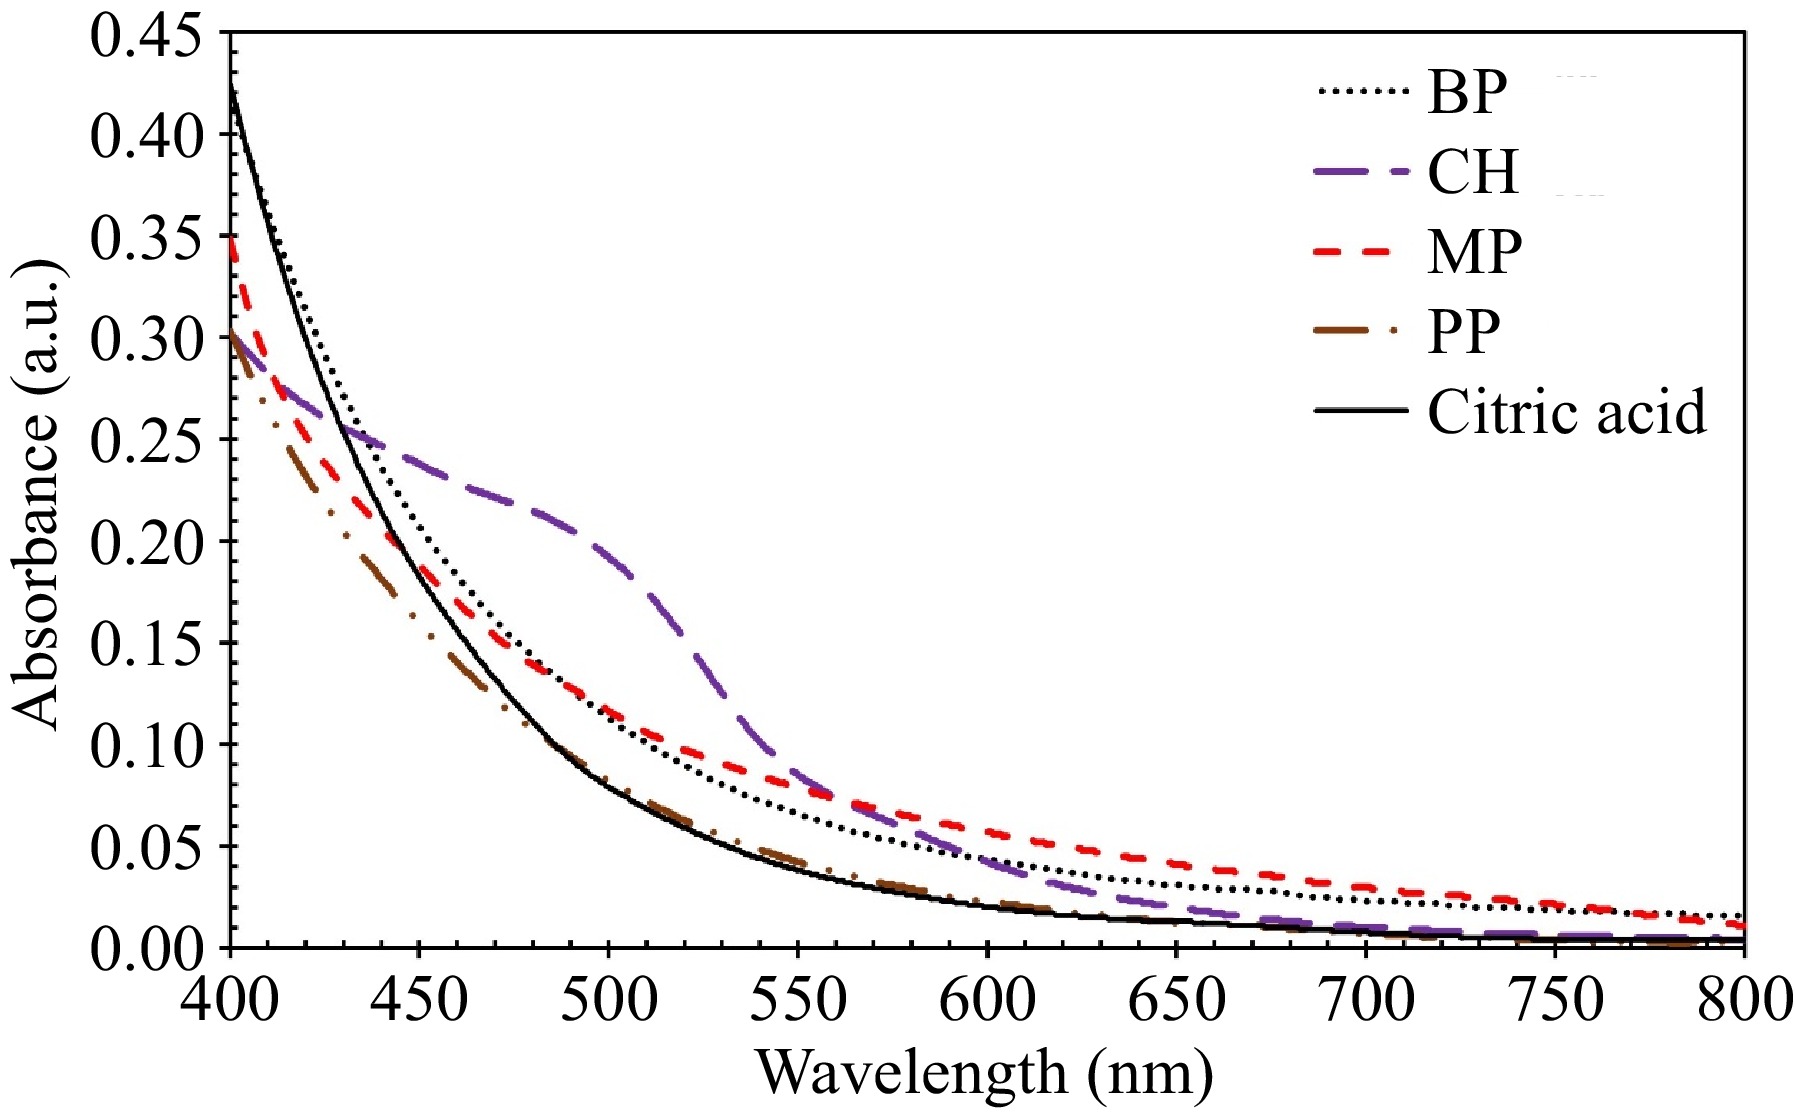
UV-Vis spectra of water extracts from various feedstocks, including BP, CH, PP, MP, and, citric acid as a reference, are presented in Fig. 7. The spectra were recorded in the range of 400−800 nm due to the instability of the light source of the spectrophotometry machine at wavelengths lower than 400 nm. Standing out among the spectra is CH, due to its significantly different composition, as detailed in Table 3.
-
This study explores the potential of collagen extraction from sardine bones with water extracts from various biomass waste sources (BP, CH, PP, and MP). This method has the potential to significantly reduce waste and promote environmental sustainability. These extracts can act as environmentally friendly acidic alternatives in processing biomass. They could effectively replace traditional acids, like acetic, and citric acid, commonly used in chemical processes. By using these extracts, the process of converting biomass into valuable products becomes more sustainable and aligns better with overall goals for sustainable development.
-
Sardine bone powder, with its rich chemical composition as shown in Table 4, serves as a valuable source of protein and minerals. It can be incorporated as a fortifying agent in staple foods such as bread rolls and cookies, offering a natural source of calcium[40]. Moreover, the powder holds the potential for producing fertilizers suitable for certified organic farming, providing essential nutrients for optimal plant growth[41].
Water extracts from fruit waste, such as BP, CH, PP, and MP are rich in polyphenols, which exhibit remarkable antioxidant and antimicrobial properties. These bioactive compounds hold immense promise for utilization across various industries, including food, pharmaceuticals, and medicine, due to their potent antioxidant and antimicrobial capabilities[42].
Proteins are indispensable macronutrients vital for providing energy and supporting tissue repair, muscle development, and overall health[43]. Collagen powder, boasting a high protein content of 73%, emerges as a versatile ingredient applicable across diverse industries, particularly in food. It can serve as a potent protein supplement, enriching products like protein bars, and beverages[44]. With an energy content of 3.16 kcal g−1, collagen offers a substantial source of dietary energy, further enhancing its nutritional value due to its impressive protein concentration. Fish collagen offers several health benefits, e.g. skin, joint, bone, heart, muscle growth and repair[43]. On the other hand, herbal plants such as llicium verum have well-known beneficial effects, such as lowering blood glucose and serum lipids, and anti-aging properties[43]. Combining fish collagen with herbal yogurt has been found to produce bioactive peptides with angiotensin-I converting enzyme (ACE) inhibitory activity. When fish collagen was added to yogurt containing Illicium verum (IV), Psidium guajava (PG), or Curcuma longa (CL), the pH decreased and the amount of OPA peptide increased during storage[45]. Similarly, yogurt containing Lycium barbarum with or without fish collagen showed an increased OPA peptide amount and improved whey protein degradation[46]. Codonopsis pilosula (CP) yogurt with fish collagen exhibited higher ACE inhibitory activity and better sensory evaluation[47]. In plant-based cheeses, the addition of fish collagen increased peptide content and ACE inhibitory activity in cheeses made with IV, PG, or CL[43]. Overall, the incorporation of fish collagen in herbal yogurt and cheese can lead to the production of bioactive peptides with ACE inhibitory activity.
-
The present findings demonstrate that acidic water extracts from various biomass wastes (BP, CH, PP, and MP) can effectively extract collagen from sardine bones. However, the type of biomass waste extract used significantly affects the efficiency of the extraction process. Among them, PP with the lowest pH (4.46) demonstrated the highest effectiveness, yielding 13.58% collagen. Analysis of the collagen samples extracted under optimum conditions—40 °C, sardine bone-to-solvent ratio of 1:24, and an extraction time of 74 h—revealed a high protein content in the extracted powder. This makes the product suitable for numerous applications, particularly in the food industry. Furthermore, the water extracts were found to be rich in polyphenols, exhibiting remarkable antioxidant, and antimicrobial properties, making them suitable for various applications, especially in the food industry. Therefore, future research should focus on optimizing the water extract preparation and collagen extraction conditions to obtain collagen powder, water extract, and collagen-enriched water extracts with specific properties. Exploring the potential applications of these products in different industries is also recommended.
-
The authors confirm contribution to the paper as follows: study conception and design, draft manuscript preparation, supervision: Rastegari H; data collection: Rastegari H, Nor Adzmi NZ; analysis and interpretation of results: Rastegari H, Nor Adzmi NZ; co-supervision: Mohtar NF, Kasan NA; manuscript editing: Nadi F; sardine processing waste supplying: Muda MR (Maperow Sdn Bhd representor); communication with Maperow Sdn Bhd: Abdul Rahim AI; lab arrangements: Kamaruzzan AS, Draman ASH. All authors reviewed the results and approved the final version of the manuscript.
-
The data generated during and/or analyzed during the current study are available from the corresponding author on reasonable request.
This research was supported by the Research Management Office (RMO) at Universiti Malaysia Terengganu, through Talent and Publication Enhancement-Research grant (TAPE-RG, Vot. No. 55497) and partial fund by the Ministry of Higher Education, Malaysia through the Fundamental Research Grant Scheme (FRGS) FRGS/1/2020/STG01/UMT/02/4 (Vot. No. 59631). The authors would like to thank Maperow Sdn Bhd for providing the sardine processing waste.
-
The authors declare that they have no conflict of interest.
- Copyright: © 2024 by the author(s). Published by Maximum Academic Press on behalf of Nanjing Agricultural University. This article is an open access article distributed under Creative Commons Attribution License (CC BY 4.0), visit https://creativecommons.org/licenses/by/4.0/.
-
About this article
Cite this article
Rastegari H, Nor Adzmi NZ, Nadi F, Mohtar NF, Abdul Rahim AI, et al. 2024. Water extract of banana peel as a green solvent for extraction of collagen from sardine bone. Food Materials Research 4: e023 doi: 10.48130/fmr-0024-0015
Water extract of banana peel as a green solvent for extraction of collagen from sardine bone
- Received: 13 April 2024
- Revised: 03 June 2024
- Accepted: 04 July 2024
- Published online: 03 September 2024
Abstract: Common collagen extraction methods are outdated and unsustainable. This study introduces a more sustainable method using water extract from banana peel to extract collagen from sardine bone, a prevalent marine fish in Malaysia. Banana peel was chosen as the feedstock for solvent preparation due to its abundance and agricultural significance in Malaysia. This study examined how extraction parameters including temperature (27−43 °C), sardine bone-to-solvent ratio (1:15−1:28), and extraction time (8−88 h) affect the collagen extraction yield. FT-IR, TGA, and proximate analysis were used to characterize the collagen extracted, while the water extracts were analyzed using UV-Vis and GC-MS. Under optimum conditions of 40 °C, a sardine bone-to-solvent ratio of 1:24, and an extraction time of 74 h, yielded 9.82% collagen. When citric acid was used as the common solvent, the collagen extracted yield was 4.06%. Further investigation of water extracts from other fruit waste sources, including mango peel, coconut husk, and pineapple pomace, under optimum conditions, obtained an extraction yield of 11.79%, 2.10%, and 13.58%, respectively. This study demonstrated the use of fruit waste extract as an environmentally sustainable method for extracting collagen from marine fish, highlighting an efficient approach to waste valorization.
-
Key words:
- Water extract /
- Banana peel /
- Sardine bone /
- Collagen /
- Waste valorization


