


-
The concept of meat doneness encompasses different levels of cooking achieved through various thermal processing techniques. During cooking, muscle proteins undergo a complex series of physical and chemical changes due to variations in temperature and time[1]. Meat at different levels of doneness exhibits significant differences in colour, flavour, and texture. However, the determination of meat doneness is currently relies on sensory evaluation, highlighting the need for more objective assessment methods.
Objective assessment of beef doneness is primarily quantified through quality indicators and evaluated using discriminant models. Discriminant models have a wide range of applications in meat quality evaluation. Lu et al.[2] developed a quantitative freshness identification model for chilled beef based on colour parameters to achieve real-time, non-destructive quantitative freshness discrimination of chilled beef and shelf-life prediction at the same time. Similarly, Han et al.[3] applied discriminant analysis to detect adulteration between beef and pork by analyzing chemical compositional differences using Fisher's method. Volatile flavor compounds of beef have also been used in discriminant analysis models to classify the quality of beef[4].
Free amino acid content has a profound effect on the colour and flavour of beef. The rate of free amino acid release is influenced by both heating and enzymatic reactions. Proteins are gradually denatured under heating conditions and degraded to produce free amino acids, which are important prerequisites for the formation of beef flavour substances. Xu et al.[5] investigated the effect of different reheat treatments on beef flavour and found that the higher the heat transfer efficiency the higher the free amino acid content. Nyam et al.[6] reported that sousvide chicken breast quality tends to degrade as processing temperatures rise and cooking times lengthen, with higher temperatures and longer cooking times inevitably resulting in a harder texture and greater loss of free amino acids. Enzymes also promote the release of free amino acids in beef. Some degree of enzymatic hydrolysis of beef can improve its physical and chemical properties, making it more appealing to consumers. Wang et al.[7] tendered beef using protein-glutaminase to enhance its edible quality. Gallego et al.[8] used different proteolytic enzymes (bromelain, papain, and flavor protease) to develop textured meats for people with chewing or swallowing problems.
Thus, in this study, a predictive temperature model was developed by quantifying free amino acids with centre temperature as the dependent variable and the concentration of each free amino acid as the independent variable. This model allows for the detected concentration of free amino acid in beef to inform the predictive temperature model, ultimately determining the centre temperature and, thus, the doneness of beef. This approach not only improves the accuracy of the discrimination, but also reveals the patterns of protein hydrolysis and oxidation during heat treatment. Therefore, this study provides an important theoretical basis for refining beef doneness classification.
-
Fresh beef tenderloin (grain-fed domestic cattle) was procured from Yonghui supermarket in Zhengzhou, Henan Province (China). Flavor protease (enzyme activity 20 u/mg (5 g)) and compound protease (enzyme activity 120 u/mg (5 g)) were obtained from Yuanye Biotechnology Co., Ltd (China). Sodium dodecyl sulfate (Sinopharm Chemical Reagent Co., Ltd, Shanghai, China), Coomassie Brilliant Blue R250 (Shanghai Yuanye Bio-Technology Co., Ltd, Shanghai, China), Gel electrophoresis kit (Wuhan Boster Biological Technology., Ltd, Wuhan, China). Sulfosalicylic acid (Tianjin Guangfu Technology Development Co. Ltd, Tianjin, China). All other reagents were of analytical purity.
Methods
Preparation of the different doneness beef sample
-
Fresh beef was meticulously trimmed to remove fascia, following which it was cut into pieces measuring 6 cm × 6 cm × 2 cm, aligned along the muscle fibers. To mitigate juice loss during frying, the electric oven (EG-818P, TOPKITCH, Guangzhou, China) was preheated to 180 °C. The meat pieces were then subjected to frying, with continuous rotations every 10 s to different sides. As the heating time approached the target doneness, an electronic thermometer (MC601, Hangxin, Hangzhou, China) was used to measure the central temperature of the meat sample. Frying was promptly halted upon reaching the desired central temperature. For a diversified taste experience, the beef samples were categorized into different grades based on central temperatures: zero grade (raw meat), first grade (50 °C), second grade (58 °C), third grade (66 °C), fourth grade (73 °C), and fifth grade (80 °C)[9]. Selected samples were freeze-dried for 36 h to assess their physicochemical properties.
Sodium dodecyl sulfate–polyacrylamide gel electrophoresis (SDS-PAGE)
-
For protein extraction, 0.100 g of freeze-dried powder samples was mixed with 10 mL of 3.5% SDS solution. The protein concentration was determined by Coomassie blue staining with bovine serum protein as the standard protein. The solution was subjected to 10 s of vortexing, followed by 30 min in a 37 °C water bath and subsequent centrifugation. Next, 10 μL solution samples were combined with the sample buffer solution (20% glycerol, 0.25 M Tris-HCl, 4% SDS, 2-mercaptoethanol, pH adjusted to 6.8) in a 1:1 volume ratio. The mixture was then heated in a 100 °C constant temperature water bath for 3 min. After cooling to room temperature, 10 μL of the sample was used for electrophoresis. Electrophoresis was performed at 120 V with a 12% separating gel and 5% concentrating gel. Once the test was concluded, the gel was removed and subsequently stained using Coomassie bright blue R250. Ethanol and acetic acid were used to decolorize the gel until it was clear[10].
Enzymatic hydrolysis
-
Shredded beef sample and distilled water (solution concentration is 4.8 g/dL) were mixed in a constant temperature magnetic agitator. Upon reaching a temperature of 53 °C, 1 mol/L NaOH was added to attain a pH of 7.0. Subsequently, 0.4% complex protease (calculated by dry matter mass) and 0.8% flavor protease (calculated by dry matter mass) were added for the enzymatic hydrolysis. After 3 h of constant temperature magnetic stirring at 53 °C, the mixture was placed in a 100 °C constant temperature water bath for 10 min. The supernatant was collected after cooling in an ice bath.[11]
Determination of free amino acid content
-
Two grams of meat sample (accurate to 0.0001 g) and 20 mL of 3% 5-Sulfosalicylic acid dihydrate solution were mixed for 30 min. The mixture was allowed to stand for an additional 10 min before centrifugation at 8,100 g for 15 min. This procedure was repeated three times. The resulting supernatant was diluted 100 times with deionized water and 1 mL of the sample was filtered using a 0.45 μm filter membrane and transferred to a liquid-phase vial. For determination of free amino acids in beef enzymolysis solution, 40 μL of the filtered supernatant was mixed with 100 μL of 10% 5-Sulfosalicylic acid dihydrate solution. After a 1-h stationary phase at 4 °C, the mixture was centrifuged at 14,100 g for 15 min, followed by a final centrifugation of the supernatant at 14,100 g for 5 min. Subsequently, 25 μL of supernatant was mixed with 975 μL of sample diluent for amino acid analyzer (S-433(D), Sykam, Munich, Germany) analysis. Amino acid determination was conducted under the following conditions: column - LCA 106/Na; determination wavelength - 570 + 440 mm; flow rate-eluent pump 0.45 mL/min + derivative pump 0.25 mL/min; column temperature - 60~75 °C gradient temperature control; pressure - 30 to 60 bar; sample size - 50 μL.[12]
Statistical analysis
-
SPSS (version 26.0, IBM Co., USA) and Origin 8.0 (Origin Lab Inc., Massachusetts, USA) software were used for data analysis.
-
The predominant protein component in beef is myofibrillar protein, a complex structure primarily composed of myosin heavy chain (MHC) and actin[13]. Myosin exhibits relatively low thermal stability, with a denaturation temperature range of approximately 40−60 °C. In contrast, actin, characterized by robust thermal stability, generally undergoes denaturation within the 70−80 °C temperature range[14]. It can be seen from Fig. 1 that the optical density of the myosin heavy chain band notably declined at Lv1, while the optical density of small molecular bands was significantly enhanced. This situation indicates that it decomposes into stable small-molecule subunits, signifying initial denaturation[15]. During heat treatment, the polymerization of protein formed macro polymers, which cannot be extracted in SDS buffer, thus the intensity of the small molecule band at Lv3 decreases[16]. Conversely, no significant alteration in the myosin heavy chain was observed between the second and third degrees of maturation, suggesting a stable thermal aggregation state post-denaturation[16]. When the center temperature reaches 73 °C at Lv4, deeper thermal denaturation ensued, myosin, and actin bands were significantly decreased. However, there is no significant change at Lv5. This indicates that the protein thermally aggregates to form a thermally stable state[17]. Consequently, optical density differences in actin were negligible between raw meat and Lv1, Lv2, and Lv3. However, a significant reduction was observed in Lv4.
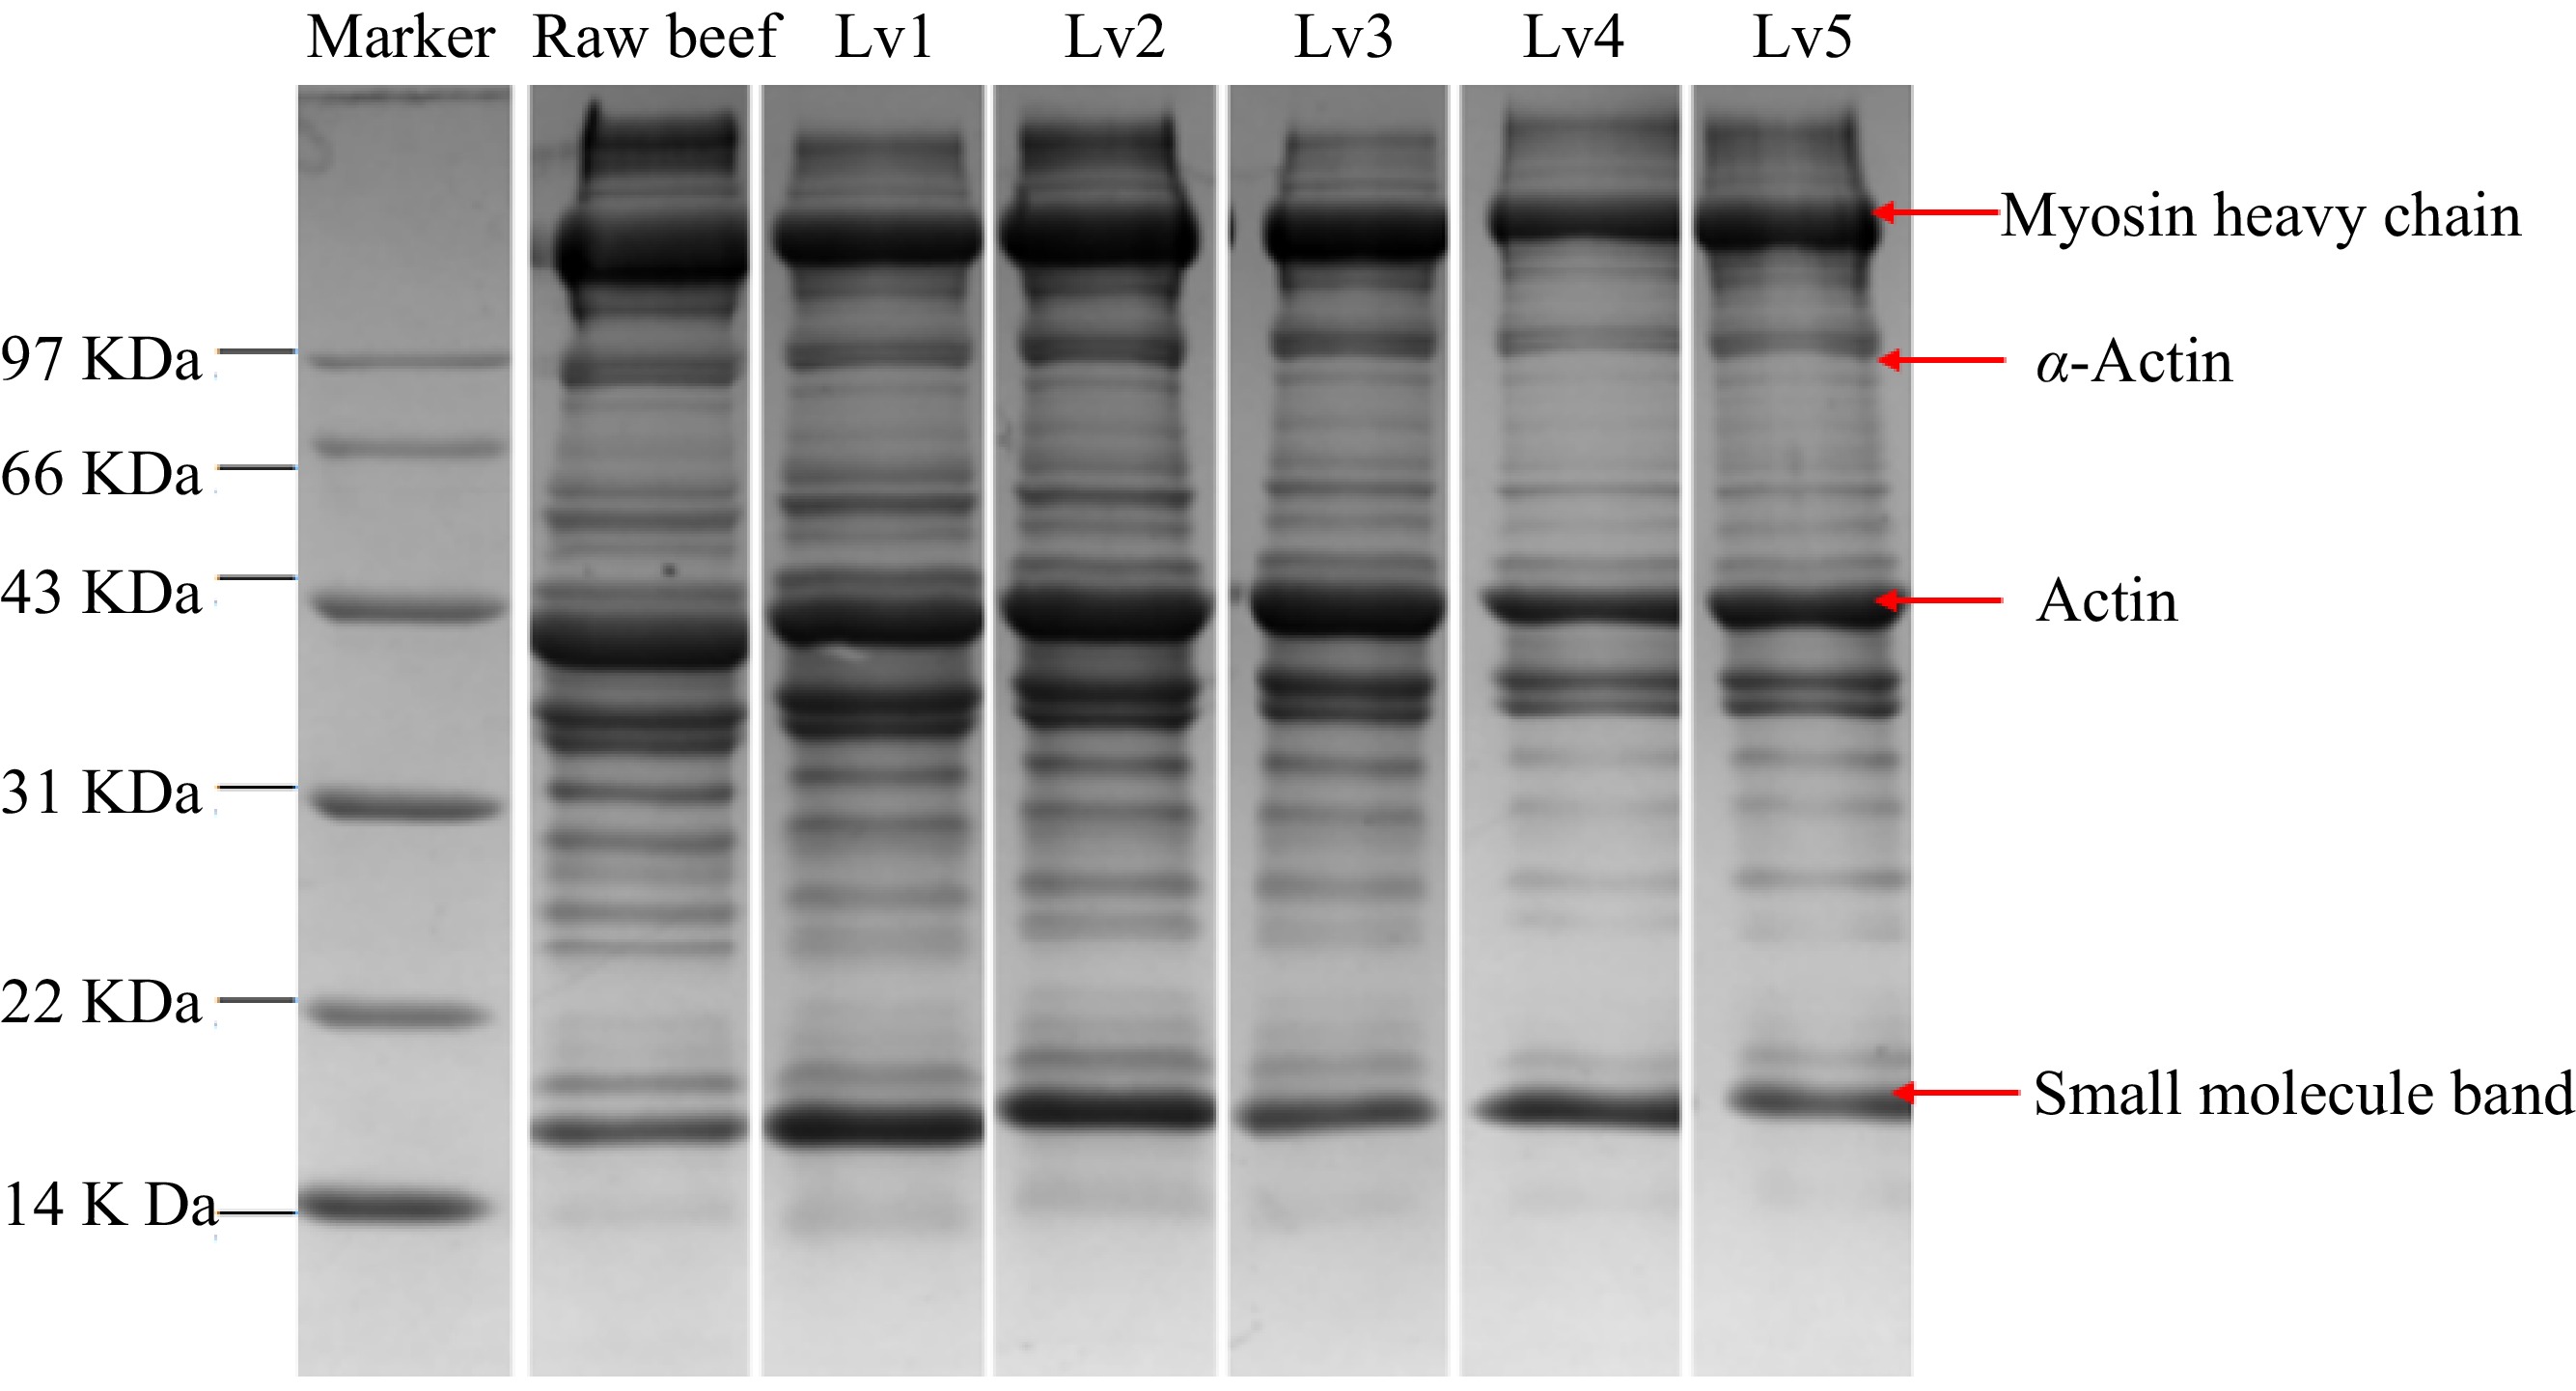
Figure 1.
SDS-PAGE map of beef with different doneness, Lv1−Lv5 represents the center temperature of beef at 50, 58, 66, 73, and 80 °C, respectively.
Free amino acid in beef
-
Certain amino acids eluded definitive quantification due to their lack of distinct peaks at specific wavelengths. Notably, a comparison with the free amino acids measurements indicated decreased aspartic acid and proline levels, while tryptophan content was elevated. This variance could be attributed to variations in beef type and cuts. Tables 1 and 2 show that except for cysteine and tryptophan, whose levels exhibited limited change with increasing doneness, other amino acids displayed varying degrees of degradation. During low-temperature cooking (60−70 °C), protein gradually denatured, releasing free amino acids in a time-dependent manner, thereby resulting in incremental accumulation[6]. Under high-temperature conditions, free amino acids may undergo oxidation, structural damage, or residue modification under high-temperature conditions, or form flavor substances through Maillard reactions[18,19]. Tryptophan, sensitive to time and temperature, underwent rapid oxidation at elevated heating temperatures, hence explaining the lack of significant variance among beef samples of different doneness[20]. Some reports did not detect cystine in the stewed beef soup, possibly due to its vulnerability to oxidation owing to active sulfur atoms[21]. Consequently, the detected content remained low, exhibiting no significant difference among different degrees of maturation[19].
Table 1. Free amino acids in beef samples with different levels of doneness.
Compounds Raw beef (mg/g) Lv1 (mg/g) Lv2 (mg/g) Lv3 (mg/g) Lv4 (mg/g) Lv5 (mg/g) Glu 0.44 ± 0.01a 0.32 ± 0.05bc 0.35 ± 0.06b 0.30 ± 0.03bc 0.26 ± 0.02c 0.18 ± 0.01d Ser 0.32 ± 0.01b 0.32 ± 0.02b 0.34 ± 0.03a 0.28 ± 0.02bc 0.24 ± 0.01c 0.20 ± 0.01c Gly 0.27 ± 0.00a 0.25 ± 0.02b 0.25 ± 0.01b 0.21 ± 0.01c 0.17 ± 0.00d 0.17 ± 0.00d Thr 2.68 ± 0.02a 1.97 ± 0.13bc 2.07 ± 0.09b 1.89 ± 0.57bc 1.87 ± 0.37c 1.18 ± 0.17d Ala 1.09 ± 0.01a 0.96 ± 0.02b 0.92 ± 0.05b 0.82 ± 0.06c 0.73 ± 0.04d 0.62 ± 0.01e Arg 0.28 ± 0.01a 0.21 ± 0.02bc 0.23 ± 0.03b 0.20 ± 0.01bc 0.19 ± 0.01c 0.16 ± 0.01d His 5.20 ± 0.02a 5.05 ± 0.07b 4.85 ± 0.27b 4.45 ± 0.39bc 3.72 ± 0.49c 3.94 ± 0.16c Cys 0.02 ± 0.01a 0.04 ± 0.00a 0.04 ± 0.00a 0.04 ± 0.00a 0.04 ± 0.00a 0.04 ± 0.01a Val 0.22 ± 0.00a 0.17 ± 0.02b 0.17 ± 0.01b 0.14 ± 0.01c 0.12 ± 0.00cd 0.10 ± 0.01d Met 0.19 ± 0.00a 0.15 ± 0.01b 0.14 ± 0.02b 0.11 ± 0.00c 0.10 ± 0.01c 0.09 ± 0.00c Ile 0.20 ± 0.01a 0.14 ± 0.02b 0.14 ± 0.02b 0.11 ± 0.01c 0.08 ± 0.01d 0.08 ± 0.01d Leu 0.29 ± 0.00a 0.23 ± 0.03bc 0.24 ± 0.02b 0.19 ± 0.01c 0.16 ± 0.01d 0.14 ± 0.01d Phe 0.17 ± 0.00a 0.14 ± 0.01b 0.14 ± 0.02b 0.14 ± 0.01b 0.11 ± 0.01b 0.12 ± 0.01b Tyr 0.24 ± 0.01a 0.18 ± 0.01bc 0.20 ± 0.02b 0.15 ± 0.01c 0.13 ± 0.01d 0.12 ± 0.01d Lys 0.26 ± 0.00a 0.18 ± 0.02b 0.20 ± 0.03b 0.16 ± 0.00c 0.14 ± 0.01cd 0.12 ± 0.00d Trp 0.07 ± 0.00a 0.06 ± 0.00a 0.04 ± 0.01a 0.05 ± 0.01a 0.04 ± 0.00a 0.03 ± 0.00a Different superscripts between columns represent significant differences between cultivars (p < 0.05). Lv1−Lv5 represents the center temperature of beef at 50, 58, 66, 73, and 80 °C, respectively. Table 2. Free amino acids in beef hydrolysate with different doneness.
Compounds Raw beef (mg/g) Lv1 (mg/g) Lv2 (mg/g) Lv3 (mg/g) Lv4 (mg/g) Lv5 (mg/g) Glu 0.49 ± 0.03a 0.35 ± 0.01b 0.36 ± 0.02b 0.30 ± 0.09c 0.25 ± 0.06c 0.23 ± 0.09c Ser 0.80 ± 0.04a 0.52 ± 0.05b 0.52 ± 0.03b 0.47 ± 0.02b 0.22 ± 0.16c 0.36 ± 0.03bc Gly 0.16 ± 0.01a 0.15 ± 0.02a 0.16 ± 0.01a 0.12 ± 0.02ab 0.08 ± 0.03b 0.12 ± 0.02ab Thr 1.67 ± 0.10a 1.21 ± 0.16b 1.18 ± 0.05b 1.17 ± 0.24b 1.06 ± 0.10c 0.92 ± 0.14c Ala 1.12 ± 0.04a 0.73 ± 0.08b 0.62 ± 0.07bc 0.54 ± 0.04cd 0.42 ± 0.08d 0.42 ± 0.05d Arg 2.21 ± 0.13a 1.70 ± 0.19b 1.70 ± 0.04b 1.72 ± 0.03b 1.66 ± 0.09c 1.62 ± 0.30c His 9.37 ± 0.72a 9.66 ± 0.45a 9.41 ± 0.09a 8.94 ± 0.53ab 7.82 ± 0.27bc 8.28 ± 0.43c Cys 0.48 ± 0.06a 0.42 ± 0.07a 0.39 ± 0.12a 0.34 ± 0.02b 0.42 ± 0.08a 0.42 ± 0.00a Val 2.34 ± 0.23a 1.56 ± 0.16b 1.40 ± 0.06b 1.36 ± 0.07b 1.39 ± 0.17b 1.44 ± 0.20b Met 1.48 ± 0.11a 1.01 ± 0.17b 0.79 ± 0.13bc 0.70 ± 0.08bc 0.50 ± 0.09d 0.55 ± 0.15d Ile 3.47 ± 0.38a 2.71 ± 0.16b 2.52 ± 0.02b 2.34 ± 0.12b 2.25 ± 0.14b 2.21 ± 0.28b Leu 8.29 ± 1.71a 5.97 ± 0.40b 5.55 ± 0.18b 5.08 ± 0.17b 4.93 ± 0.13c 4.88 ± 0.09c Phe 1.37 ± 0.21a 1.33 ± 0.10a 1.11 ± 0.16ab 1.13 ± 0.04bc 0.91 ± 0.16c 0.76 ± 0.17cd Tyr 0.66 ± 0.09a 0.27 ± 0.03b 0.20 ± 0.03bc 0.11 ± 0.05cd 0.08 ± 0.05d 0.06 ± 0.02d Lys 2.44 ± 0.22a 1.99 ± 0.05b 2.01 ± 0.10b 1.78 ± 0.08c 1.67 ± 0.26c 1.83 ± 0.23c Trp 0.49 ± 0.24a 0.40 ± 0.08a 0.43 ± 0.08a 0.29 ± 0.04a 0.41 ± 0.03a 0.37 ± 0.07a Different superscripts between columns represent significant differences between cultivars (p < 0.05). Lv1−Lv5 represents the center temperature of beef at 50, 58, 66, 73, and 80 °C, respectively. In general, amino acids exhibited a declining trend, with degradation rates varying across different heating phases. The amino acid content varies significantly between raw meat and Lv1, as heat destroys amino acids more than protein breakdown produces them. Subsequent stages of maturation displayed a steady decrease in amino acid content, with increasing beef central temperatures and extended heating times leading to comparable rates of protein hydrolysis and amino acid reaction.
The fitting curve of classified amino acids in relation to beef doneness
-
Figure 2 shows that the changes in classified amino acid contents followed the rule of the logistic curve. Moreover, upon analyzing the slope results, it becomes evident that the curves follow a 'slow-sharp-slow' descending trajectory. While most amino acids exhibit steeper curves during tertiary maturation, AAA stands as an exception. Therefore, the third-degree of maturity (center temperature of 66 °C) was used as the cut-off point of maturity, and this conclusion was consistent with the SDS-PAGE patterns. Under the influence of temperature, the protein continuously generates amino acids, and the amount of releasable amino acids decreases. This diminishes the potency of enzymatic hydrolysis, especially pronounced when central temperatures exceed 66 °C. Such conditions cause proteolytic activity to rival Strecker reactions, resulting in a gradual stabilization of free amino acid content[18].

Figure 2.
(a)−(f) Logistic curve of different amino acids with beef central temperature. (g)−(l) Logistic curve of different amino acids with beef central temperature after enzymatic hydrolysis. Basic amino acids (BAA), acidic amino acids (AAA), hydrophobic amino acids (HAA), sulfur amino acids (SAA), aromatic amino acids (ARAA), total amino acids (TAA).
Mahalanobis distance for beef doneness grading
-
Since beef doneness classification is a descriptive variable, the classification method discriminant analysis method was used to characterize the doneness classification of fried beef. The Fisher discriminant method, which employs multiple discriminant functions for dimensionality reduction and facilitates visual discrimination via projected scatter plots, was chosen due to its wide applicability and independence from specific sample requirements[22].
Figure 2 shows that free amino acids in beef change regularly under the influence of doneness. Accordingly, six discriminative factors-basic amino acids, acidic amino acids, hydrophobic amino acids, sulfur amino acids, aromatic amino acids, and total free amino acids were selected for analysis using 29 beef samples of differing doneness levels. Six discriminant factors were set in SPSS software, namely X1, X2, X3, X4, X5, and X6 input independent variables together, and beef doneness was represented by numbers: 0 (raw meat), 1 (first-grade doneness), 2 (second-grade doneness), 3 (third-grade doneness), 4 (fourth-grade doneness), and 5 (fifth-grade doneness), and distance discriminant analysis was carried out. The results of the discriminative analysis of free amino acids without enzymatic hydrolysis are shown in Table 3, where 89.7% of the initially grouped cases can be classified. The results of the discriminative analysis of free amino acids after enzymatic hydrolysis are shown in Table 4, which was able to classify 62.1% of the originally grouped cases but was not considered due to its low accuracy.
Table 3. Classification results of discriminant analysis (free amino acids without enzymolysis).
Number Discriminant factor (mg/g) BAA AAA HAA SAA ARAA TAA AR DR 1 6.05 0.45 1.46 0.23 0.52 12.53 0 0 2 6.01 0.48 1.46 0.21 0.50 12.57 0 0 3 5.77 0.43 1.39 0.22 0.50 11.93 0 0 4 5.73 0.45 1.39 0.20 0.48 11.97 0 0 5 4.52 0.33 1.57 0.27 0.55 11.17 1 1 6 5.46 0.30 1.05 0.20 0.37 10.29 1 1 7 5.47 0.28 0.96 0.18 0.36 10.04 1 1 8 5.40 0.40 1.17 0.21 0.38 10.75 1 2 9 4.56 0.41 1.41 0.25 0.53 10.72 1 1 10 4.66 0.33 1.39 0.26 0.46 10.47 2 2 11 5.73 0.42 1.25 0.20 0.45 11.13 2 0 12 5.14 0.33 1.01 0.18 0.33 9.93 2 2 13 4.96 0.29 0.98 0.16 0.35 9.88 2 3 14 4.66 0.34 1.40 0.26 0.50 10.49 2 2 15 4.26 0.33 1.29 0.20 0.48 10.25 3 3 16 4.10 0.33 1.37 0.32 0.45 10.27 3 3 17 5.02 0.31 0.96 0.16 0.35 9.26 3 3 18 5.12 0.26 0.87 0.15 0.33 8.84 3 3 19 4.26 0.34 0.88 0.15 0.33 9.61 3 3 20 4.26 0.27 1.21 0.21 0.39 9.62 4 4 21 4.20 0.27 1.18 0.23 0.40 9.48 4 4 22 4.74 0.23 0.76 0.16 0.28 8.26 4 4 23 3.87 0.26 0.71 0.13 0.26 8.36 4 4 24 3.53 0.29 0.74 0.14 0.30 7.67 4 4 25 3.65 0.22 0.91 0.17 0.32 8.04 5 5 26 4.43 0.18 0.65 0.12 0.27 7.22 5 5 27 4.16 0.18 0.71 0.13 0.27 7.48 5 5 28 4.08 0.19 0.69 0.14 0.27 7.19 5 5 29 3.60 0.23 0.98 0.18 0.30 8.06 5 5 AR (Actual result), DR (Results of discrimination). Basic amino acids (BAA), acidic amino acids (AAA), hydrophobic amino acids (HAA), sulfur amino acids (SAA), aromatic amino acids (ARAA), total amino acids (TAA). Table 4. Classification results of distance discriminant analysis (free amino acids after enzymolysis).
Number Discriminant factor (mg/g) BAA AAA HAA SAA ARAA TAA AR DR 1 12.93 0.46 15.3 1.78 2.16 32.7 0 0 2 15.52 0.55 18.36 2.14 2.59 39.57 0 0 3 14.1 0.49 19.54 1.98 2.7 38.7 0 0 4 15.09 0.53 20.9 2.12 2.89 40.96 0 0 5 13.6 0.35 12.53 1.34 1.94 29.43 1 2 6 14.03 0.34 14.54 1.74 2.12 32.41 1 1 7 12.41 0.38 12.66 1.21 1.94 28.1 1 2 8 12.04 0.63 12.82 2.28 3.32 30.51 1 1 9 12.24 0.6 13.79 3.01 2.88 31.9 1 2 10 12.98 0.37 11.93 1.07 1.69 28.13 2 3 11 13.42 0.34 12.35 1.07 1.99 28.99 2 3 12 12.95 0.39 11.7 1.4 1.51 27.91 2 1 13 11.55 0.54 13.25 2 3.11 29.17 2 2 14 11.81 0.58 13.3 2.38 3.61 29.29 2 4 15 12.32 0.17 11.27 1.12 1.5 26.37 3 2 16 13.03 0.32 10.38 0.87 1.5 25.97 3 3 17 11.99 0.4 11.37 1.12 1.59 26.78 3 2 18 11.84 0.5 12.81 1.84 3.22 29.06 3 3 19 11.35 0.56 12.34 2.06 2.65 29.98 3 3 20 11.03 0.26 9.33 0.77 1.15 22.52 4 5 21 11.24 0.32 11.49 1 1.57 25.19 4 5 22 11.17 0.17 10.58 1 1.45 24.5 4 4 23 10.51 0.5 10.16 2.01 2.66 25.28 4 4 24 11.02 0.12 10.85 2.5 2.72 26.23 4 4 25 11.76 0.27 10.97 0.96 1.35 25.4 5 5 26 10.55 0.1 8.68 0.79 1.02 21.28 5 5 27 12.88 0.31 11.16 1.15 1.21 26.71 5 2 28 8.84 0.28 8.36 1.3 1.74 20.34 5 5 29 10.36 0.44 8.66 1.11 2.11 22.53 5 5 Basic amino acids (BAA), acidic amino acids (AAA), hydrophobic amino acids (HAA), sulfur amino acids (SAA), aromatic amino acids (ARAA), total amino acids (TAA). The discriminant function (Fisher projection function) of the free amino acids of beef with different doneness without enzymatic hydrolysis:
Y1 (X) = 0.688X1 + 5.129X2 − 10.502X3 + 4.682X4 + 16.700X5 + 2.701X6 − 27.200
Y2 (X) = 1.731X1 + 10.543X2 + 22.413X3 − 42.895X4 − 27.123X5 − 2.466X6 + 6.933
The function values of Y1 (X) and Y2 (X), respectively, correspond to the horizontal and vertical coordinates of the middle points in Fig. 3, and the group centroid represents the central coordinates of the classified samples, so the samples can be classified according to the projected points[23].
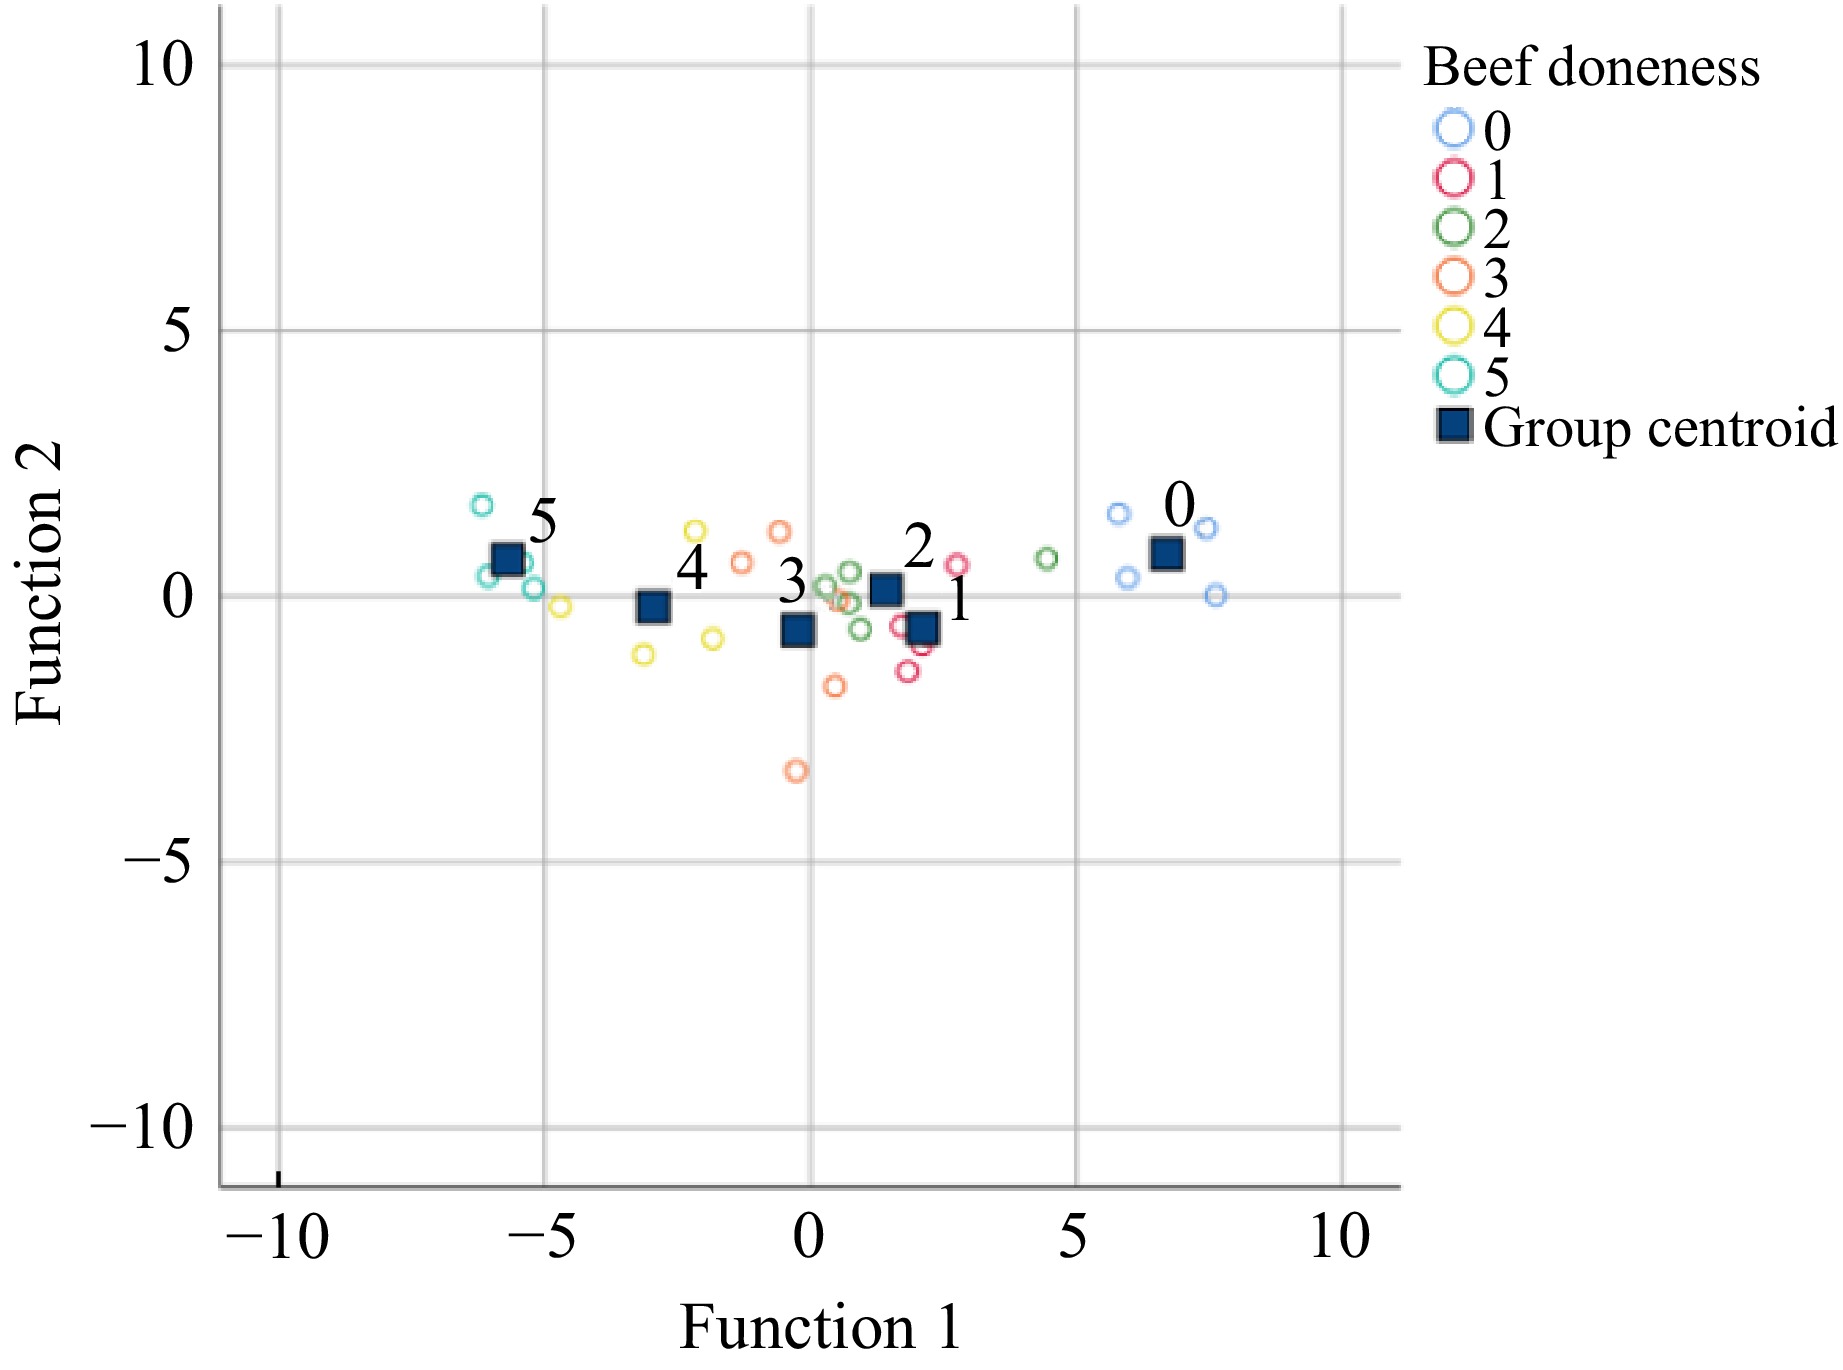
Figure 3.
Scatter diagram of each sample after projection. 0 represents raw beef; 1−5 represents the center temperature of beef at 50, 58, 66, 73, and 80 °C, respectively.
A mathematical modeling discriminant, a model for beef doneness classification
-
Based on the above experimental procedures, let Gk indicates the k-grade doneness of beef, x1, x2, x3, x4, x5, and x6 indicate the BAA, AAA, HAA, SAA, ARAA, and TAA respectively. To obtain a concise statistical model while maintaining a high real judgment rate, the collinearity variables were deleted after an exhaustive search of the database. Let x = (x1, x3, x6)T indicates a 3-dimensional column vector, μk indicates the mean value of Gk, vk indicates the covariance matrix, so the estimates of mean value and covariance matrix are denoted as:
$ {\hat{\mu }}_{k}={\bar{x}}^{\left(k\right)}=\dfrac{1}{{n}_{k}}{\sum }_{i\,=\,1}^{{n}_{k}}{x}_{\left(i\right)}^{\left(k\right)},\quad {\hat{v}}_{k}=\dfrac{1}{{n}_{k}-1}{s}_{k} , $ (1) where,
$ {n}_{k} $ $ {G}_{k} $ $ {x}_{\left(i\right)}^{\left(k\right)} $ $ i $ $ {x}_{\left(i\right)}^{\left(k\right)}=({x}_{1\left(i\right)}^{\left(k\right)},{x}_{3\left(i\right)}^{\left(k\right)},{x}_{6\left(i\right)}^{\left(k\right)}{)}^{T} $ $ {x}_{j\left(i\right)}^{\left(k\right)} $ $ i $ $ j $ $ {G}_{k} $ $ j=\mathrm{1,3},6 $ $ k=\mathrm{0,1},\mathrm{2,3},\mathrm{4,5},i=\mathrm{1,2},\cdots ,{n}_{k} $ $ {{s}}_{{k}}={\sum }_{{i}\,=\,1}^{{{n}}_{{k}}}({{x}}_{\left({i}\right)}^{\left({k}\right)}-{\bar{{x}}}^{\left({k}\right)})({{x}}_{\left({i}\right)}^{\left({k}\right)}-{\bar{{x}}}^{\left({k}\right)}{)}^{{T}} $ $ x $ $ {G}_{k} $ $ d(x,{G}_{k})=(x-{\hat{\mu }}_{k}{)}^{T}{v}_{k}^{-1}(x-{\hat{\mu }}_{k})+\mathit{log}|{v}_{k}|,\quad k=\mathrm{0,1},\mathrm{2,3},\mathrm{4,5}, $ (2) Let the set of
$ {D}_{k}=\{x:d(x,{G}_{k})\le \underset{l\ne k}{min}\;d(x,{G}_{l}\left)\right\}, $ $ k=0,1, 2, 3,4,5 $ $ x \in $ $ {G}_{k} $ $ x $ $ {D}_{k} $ $ k=\mathrm{0,1},\mathrm{2,3},\mathrm{4,5} . $ (3) According to Eqns (2) and (3), simply get the mean value and covariance matrix of each doneness to judge the doneness level of beef.
For the undigested data, the mean value and covariance matrix of each doneness were estimated as:
$ {\hat{\mu }}_{0}=(\mathrm{5.890,0.453,12.250}{)}^{T} ,\;\; {\hat{\mathrm{\mu }}}_{1}=(5.082,0.344,10.594{)}^{{T}} , $ $ {\hat{\mu }}_{2}=(\text{5.030},\text{0.342},\text{10.380}{)}^{T} ,\;\; {\hat{\mu }}_{3}=(\text{4.552},\text{0.314},\text{9.646}{)}^{T} , $ $ {\hat{\mu }}_{4}=(\text{4.120},\text{0.264},\text{8.678}{)}^{T} ,\;\; {\hat{\mu }}_{5}=(\text{3.984},\text{0.200},\text{7.598}{)}^{T} ; $ $ {\hat{v}}_{0}=\left(\begin{array}{ccc}0.027& 0.002& 0.055\\ 0.002& 0& 0.005\\ 0.055& 0.005& 0.121\end{array}\right) ,\; {\hat{v}}_{1}=\left(\begin{array}{ccc}0.246& -0.013& -0.167\\ -0.013& 0.003& 0.014\\ -0.167& 0.014& 0.193\end{array}\right) , $ $ {\hat{v}}_{2}=\left(\begin{array}{ccc}0.195& 0.016& 0.109\\ 0.016& 0.002& 0.022\\ 0.109& 0.022& 0.259\end{array}\right) ,\; {\hat{v}}_{3}=\left(\begin{array}{ccc}0.229& -0.013& -0.272\\ -0.013& 0.001& 0.016\\ -0.272& 0.016& 0.389\end{array}\right) , $ $ {\hat{v}}_{4}=\left(\begin{array}{ccc} 0.205 & -0.009 & 0.153 \\ -0.009& 0& 0\\ 0.153 & 0 & 0.706 \end{array}\right) ,\; {\hat{v}}_{5}=\left(\begin{array}{ccc} 0.125 & -0.008 & -0.138 \\ -0.008 & 0.001 & 0.009 \\ -0.138 & 0.009 & 0.183 \end{array}\right) . $ Based on the above estimation and calculation Eqns (1) and (2), the discriminant results of samples are shown in Table 5.
Table 5. Results of discriminating data without enzymatic decomposition.
AR DR 0 1 2 3 4 5 0 4 0 0 0 0 0 1 0 4 1 0 0 0 2 0 0 5 0 0 0 3 0 0 0 5 0 0 4 0 0 0 0 5 0 5 0 0 0 0 0 5 AR (Actual result), DR (Results of discrimination). According to the above discriminant principles, for the data without enzymatic decomposition, one observed value of beef with a doneness of 1 was misjudged as a doneness level of 2, and the others were all correctly judged, with a positive discriminant rate of 96.55%.
For enzymatic data, the mean and covariance estimates of each maturity are:
$ {\hat{\mu }}_{0}=(\text{14.410},\text{18.525},\text{37.983}{)}^{T} ,\; {\hat{\mu }}_{1}=(\text{12.864},\text{13.268},\text{30.470}{)}^{T} , $ $ {\hat{\mu }}_{2}=(\text{12.542},\text{12.506},\text{28.698}{)}^{T} ,\; {\hat{\mu }}_{3}=(\text{12.106},\text{11.634},\text{27.632}{)}^{T} $ $ {\hat{\mu }}_{4}=(\text{10.994},\text{10.482},\text{24.744}{)}^{T} ,\; {\hat{\mu }}_{5}=(\text{10.878},\text{9.566},\text{23.252}{)}^{T} ; $ $ {\hat{v}}_{0}=\left(\begin{array}{ccc}1.327& 1.963& 3.794\\ 1.963& 5.700& 8.191\\ 3.794& 8.191& 13.286\end{array}\right) ,\; {\hat{v}}_{1}=\left(\begin{array}{ccc}0.794& 0.315& 0.412\\ 0.315& 0.751& 1.351\\ 0.412& 1.351& 3.127\end{array}\right) , $ $ {\hat{v}}_{2}=\left(\begin{array}{ccc} 0.662 & -0.509 & -0.304 \\ -0.509 & 0.547 & 0.434 \\ -0.304 & 0.434 & 0.401 \end{array}\right) ,\; {\hat{v}}_{3}=\left(\begin{array}{ccc} 0.389 & -0.513 & -0.965 \\ -0.513 & 0.914 & 1.526 \\ -0.965 & 1.526 & 3.158 \end{array}\right) , $ $ {\hat{v}}_{4}=\left(\begin{array}{ccc}0.082& 0.097& -0.059\\ 0.097& 0.648& 0.840\\ -0.059& 0.840& 1.925\end{array}\right) ,\; {\hat{v}}_{5}=\left(\begin{array}{ccc}2.329& 1.912& 3.943\\ 1.912& 1.893& 3.610\\ 3.943& 3.610& 7.365\end{array}\right) . $ Based on the above estimation and calculation Eqns (1) and (2), the discrimination results of beef doneness after enzymatic hydrolysis are shown in Table 6.
Table 6. The discriminant results of enzyme decomposition data.
AR DR 0 1 2 3 4 5 0 4 0 0 0 0 0 1 0 5 0 0 0 0 2 0 0 5 0 0 0 3 0 0 0 5 0 0 4 0 0 0 0 5 0 5 0 0 0 1 0 4 AR (Actual result), DR (Results of discrimination). As can be seen from Table 6, one beef of grade 5 was judged as grade 3, and the others were not misjudged. The positive rate of the algorithm is 96.55%.
-
SDS-PAGE analysis reveals intricate interactions between protein denaturation events and corresponding changes in free amino acid composition. Two distinct models were carefully developed to accurately classify the diverse doneness stages of beef subjected to frying conditions. Furthermore, this study thoroughly analyzes the patterns governing free amino acids in beef, both in the presence and absence of enzymolysis. By closely investigating these patterns, changes in proteolytic and oxidative processes under heat treatment conditions can be detected. These insights not only enhance our understanding of the chemical transformations occurring within the meat but also serve as a theoretical foundation for precisely categorizing the doneness of meat-based products. The results of this study and the model can be used as a theoretical reference for the development of instruments or the establishment of standard methods for the determination of doneness based on amino acid analysis.
This work was supported by the Fundamental Research Funds: the National key research and development program (Grant No. 2022YFD2100014); the Central Government Guides Local Science and Technology Development Fund Projects (Grant No. Z20231811012); Postdoctoral research project in Henan Province (Grant No. HN2024067); Henan Science and Technology R&D Joint Fund Application Research Project (Grant No. 242103810082). The authors are very grateful to the CSC for supporting this project. The authors are also grateful to the Institute of Extrusion Engineering Technology, National Engineering Laboratory of Wheat and Corn Deep Processing for their help.
-
The authors confirm contribution to the paper as follows: formal analysis: Sun J, Huang Z, Wang L, Guo N; validation: Sun J, Wang L, Guo N; investigation: Sun J, Wang L, Guo N; draft manuscript preparation: Sun J; visualization: Huang Z, Sun J, Wang L; conceptualization: Huang Z; methodology: Huang Z; writing - review & editing: Huang Z, An H, Abddollahi M, Kovacs Z, Zhan X; funding acquisition: An H, Huang Z; supervision: Huang Z, An H, Kovacs Z. All authors reviewed the results and approved the final version of the manuscript.
-
All data generated or analyzed during this study are included in this article.
-
The authors declare that they have no conflict of interest.
- Copyright: © 2024 by the author(s). Published by Maximum Academic Press on behalf of Nanjing Agricultural University. This article is an open access article distributed under Creative Commons Attribution License (CC BY 4.0), visit https://creativecommons.org/licenses/by/4.0/.
-
About this article
Cite this article
Sun J, Wang L, Huang Z, Guo N, An H, et al. 2024. Dynamics of free amino acids in beef during thermal processing and mathematical modeling of doneness correlation. Food Materials Research 4: e036 doi: 10.48130/fmr-0024-0027 

Dynamics of free amino acids in beef during thermal processing and mathematical modeling of doneness correlation
- Received: 08 August 2024
- Revised: 27 October 2024
- Accepted: 11 November 2024
- Published online: 30 December 2024
Abstract: This research investigates the dynamic changes of free amino acids in beef cooked to different doneness levels and develops a qualitative framework to predict doneness based on chemical attributes. During the frying process, beef proteins and free amino acids exhibit recognizable patterns that correspond to the central temperature. Myosin, being less thermally stable, exhibited a decreasing tendency at the first degree of doneness, while actin showed a distinct change at the fourth degree of doneness. The logarithmic curves adeptly fit hydrophilic and aromatic amino acids. Recognizing the nonlinear relationship between free amino acids and central temperature, Fisher's discriminant analysis was applied, achieving an 89.7% classification rate for non-enzymatic hydrolysis beef beef and 62.1% for enzymatically hydrolyzed beef. Therefore, the discriminatory accuracy for enzymatically hydrolyzed beef was deemed insufficient. By incorporating mean and covariance matrix parameters of beef doneness into a mathematical discriminative model, the discrimination accuracy could be enhanced to 96.55%.
-
Key words:
- Amino acid analysis /
- Doneness classification model /
- Enzymolysis effects