


-
Photosynthetic characteristics are indicative of physiological parameters that correlate with forest primary production[1] and drive carbon uptake[2]. They directly participate in the natural carbon cycle but are sensitive to environmental conditions; they are often used to represent the resistance and resilience of vegetation to extreme climates[3], pests and diseases[4,5], fires[6], and toxic metals[7,8]. Convergent emergence or loss of photosynthetic phenotypes may facilitate adaptation to ecologically similar environments[9].
In forestry, differences in photosynthetic characteristics among different tree species are prominent[10]. The photosynthetic characteristics of leaves within the same species often have significant spatial heterogeneity owing to the complex spatial structure of the crown[11], which is particularly evident in the vertical structure of the crown[12,13]. Light[14,15] and water potential[16] are thought to be the key determining factors of vertical variation patterns in tree crown photosynthetic traits. However, the dominant roles of two species could shift under different forest densities and tree sizes. Generally, in closed canopies, light is the major factor that leads to the spatial heterogeneity of leaf photosynthetic traits[17], causing leaves to alter their structure and physiological function to adapt to the lighting environment. Likewise differences appear between shade and sun leaves within the crown[13]. Sun leaves have a high maximum net CO2 assimilation (Amax), respiration rate (RD), and light compensation point (LCP) but lower light utilization efficiency (LUE) and light saturation point (LSP)[18]. Water potential tends to be the dominant factor for huge dominant trees[19], as it represents the ability to transport the water from the root to the crown. Crown photosynthetic characteristics also show seasonal variation with individual development and environmental changes[20,21]. For example, Amax usually shows a parabolic seasonal variation pattern due to its positive correlation with the temperature (T), solar radiation, and soil moisture[22−24]. However, RD exhibits an opposite 'U'-shaped trend[18] due to the decline of cytochrome-mediated respiration[21] and temperature sensitivity[25].
Studies have shown that spatial and seasonal variations in canopy photosynthetic characteristics are closely associated with the comprehensive impact of light[26], temperature[24,27], humidity[28], and seasonal patterns of leaf structural traits[29,30]. Generally, adequate light and suitable temperature and humidity can promote photosynthesis, by improving light energy utilization[31] and photosynthetic enzyme activity[32], however, some environmental conditions will inhibit photosynthesis[33]. For example, the common natural phenomena 'midday depressions' is a self protection mechanism by regulating blade osmotic pressure and maintaining mesophyll cell activity, in response to the stress of strong light, high temperature and low humidity[34]. Additionally, the age[22,35,36] and sex of dioecious tree species[37] influence the photosynthetic characteristics of leaves to some extent due to the difference of mesophyll cell structure. When simulating the mechanism process model of canopy, forest productivity, and carbon absorption processes, the spatial and seasonal variations in canopy leaf photosynthetic characteristics need to be considered simultaneously, otherwise, incorrect results will be obtained[16]. Therefore, the spatiotemporal heterogeneity and driving mechanisms of canopy photosynthetic characteristics need to be urgently clarified.
This study used the artificial forest of the main afforestation species (Larix olgensis) in the northern area of China as the research object that was tracked and monitored throughout its growing season. The factors of photosynthetic characteristics, leaf morphology, crown structure and environmental factor were collected. The overarching aims of this study are twofold: first, is there a significant difference in photosynthetic characteristics of different crown positions, growing periods and tree individuals? Secondly, what is the variation patterns of photosynthetic characteristics within the tree crown during the growing season? Finally, we provide a comprehensive assessment of the relationships between photosynthetic characteristics and crown structure, leaf morphology and environmental conditions.
-
The experiments were conducted in 2017 at the experimental forest farm of Northeast Forestry University in Maoershan, Haerbin, China (Northern latitude: 45°2′20″~45°18′16″, East longitude: 127°18′0″~127°41′6″; altitude 400 m above sea level). The climate in the Maer Mountain region belongs to the temperate continental monsoon climate, with an average annual temperature of 2.4 °C, the highest temperature being 34 °C and the lowest being −40 °C, approximately 125 d of frost-free period, an average annual precipitation of 700 mm, and dark brown soil as the main type. Total forest coverage is approximately 83.3%, including 14.7% plantation.
Sample selection
-
Five fixed plots of 20 m × 30 m with same site quality in the young L. olgensis plantation are set up, and the trees with a diameter at breast height (DBH) larger than 5 cm in each plot were measured. The specific measurement factors include tree height (H), DBH, crown width (CW) and the relative coordinates (xi, yi) of each tree were investigated. Then the average DBH of five plots were calculated according to the per tree measurement data. A scaffold was built around the sample tree, ensuring that the sample tree was completely surrounded by it, ensuring that all branches of the sample wood and each position of each branch can be measured on the scaffold, each layer is connected by a walkway. After each measurement, the upper tread was removed to avoid the influence on the measurement result caused by the blocking of light. The crown length of each sample tree was divided into several vertical sections based on the whorls from tree top to bottom and numbering began from V1st. Three healthy and fully expanded needles located within each section in the middle of the foliated branches in sunny, semisunny and shaded crowns were selected, according to the sample selection principles based on Liu et al.[38]. The photosynthetic characteristics in each vertical section was the average values of measurements taken from different directions (sunny, semisunny and shaded crown).
Photosynthetic gas exchange measurements
-
The photosynthetic light response (PLR) curves were measured twice per month (the beginning of the month and mid-month) during the growing season (from approximately May 15th to September 10th). All photosynthetic properties were measured with a portable steady-state photosynthesis system (LI-6400XT, LI-COR, Inc., Lincoln, NE, USA) equipped with a standard LED light source (6400-02B, LI-COR, Inc., Lincoln, NE, USA). Sample chamber was acclimated for 20 min at a CO2 concentration of 390 ppm with a CO2 mixer (6400-01, LI-COR, Inc., Logan, NE, USA) to maintain a stable CO2 supply. All sample cluster needles were acclimated under a PAR of 1,400 μmol·m−2·s−1 for 10 to 20 min by the LED light source (6400-02B, LI-COR, Inc., Lincoln, NE, USA). PLR curve was measured at 10 PAR gradients: 2,000, 1,500, 1,200, 1,000, 500, 200, 150, 100, 50, 0 μmol·m−2·s−1. Sample cluster needles were allowed to equilibrate for a minimum of 2 min at each measurement before data was logged, and a calibration (match) was performed after each count. At the same time, the temperature of the leaf (Air temperature, Tair), the relative humidity (Relative humidity, RH) and the vapor pressure deficit (Vapor pressure deficit, VPD) were recorded. After the measurements, the depth into the crown (Depth into crown, DINC) of each measured sample was recorded in the crown, and the relative depth into the crown (Relative depth into crown, RDINC) was calculated according to the crown length (Crown length, CL): RDINC = DINC/CL.
Needle morphology measurements
-
Once the photosynthetic gas exchange measurements were completed, the sample cluster needles were immediately taken back to the laboratory for measuring the needle mass per area (NMA, g·m−2). Each cluster sample was scanned immediately after collection and then surveyed with an image analysis software (Image-Pro Plus 6.0, Media Cybernetics, Inc., Bethesda, USA), resulting in the projected needle area (NA, m2), needle length (l) and needle width (w), and consequently obtained the ratio of needle length to needle width (rlw). Then, the scanned samples were dried to a constant weight at 85 °C and weighed to dry weight (WD). The NMA was calculated: NMA = WD/LA.
Photosynthetic parameters
-
The light-saturated CO2 assimilation (Amax, μmol·m−2·s−1) and dark respiration (RD, μmol·m−2·s−1) were estimated from the PLR curves using the modified Mitscherlich model[39]:
$ {A}_{\mathrm{n}}={A}_{\mathrm{m}\mathrm{a}\mathrm{x}}\,\times\, \left(1-{\mathrm{e}}^{\left(-\mathrm{\alpha }\,\times\, \mathrm{P}\mathrm{A}\mathrm{R}/{A}_{\mathrm{m}\mathrm{a}\mathrm{x}}\right)}\right)-{{R}}_{\mathrm{D}} $ (1) where An is the net CO2 assimilation (μmol·m−2·s−1), Amax is the light-saturated net CO2 assimilation (μmol·m−2·s−1), α is the apparent quantum yield, PAR is the photosynthetically active radiation (μmol·m−2·s−1), and RD is the dark respiration rate (μmol·m−2·s−1).
The light saturated stomatal conductance (gs-sat, mol·m−2·s−1) was determined as the corresponding gs value of Amax. Water-use efficiency (WUEsat, mmol CO2 mol H2O−1) was calculated as the ratio of Amax to gs-sat. As the environment conditions were not maintained under a certain value during the measurement of PLR curves except CO2 concentration (stabilized at 390 ppm).
Statistical analysis
-
Table 1 shows the data summary. Statistical analyses were performed using R software 4.2.2[40]. A three-way repeated-measures analysis of variance (ANOVA) was performed on all experimental variables to evaluate the effects of individual tree (T), period (P), and crown layer (L) on light-saturated CO2 assimilation (Amax), dark respiration (RD), light-saturated stomatal conductance (gs-sat), and water-use efficiency (WUEsat). Pearson's correlation analysis was used to test the relationships among all the measured variables. The significance of all the statistical analyses was at α = 0.05 level. All figures were drawn using the ggplot2 package in R software 4.2.2.
Table 1. Sample tree and data summary. Photosynthetic light response curves (752) were investigated, including 9303 instantaneous environmental and functional factors, from 36 pseudowhorls from five planted Larix olgensis trees.
Statistics Net photosynthetic rate Leaf trait Environmental conditions Spatial position An (μmol·m−2·s−1) LMA (g·m−2) Tair (°C) VPD (kPa) PAR (μmol·m−2·s−1) RDINC No. 9303 752 Mean 5.23 58.5 27.9 1.7 757 0.52 Std. 4.47 20.1 3.6 7 723 0.26 Max. 27.49 127.5 39.4 4.3 2200 0.99 Min. −3.90 14.3 15.5 0.5 0 0.08 An, net CO2 assimilation; LMA, leaf mass per area; Tair, air temperature; VPD, vapor pressure deficit; PAR, photosynthetically active radiation; RDINC, relative depth into the crown (RDINC). No., Mean, Std., Max. and Min. are the numbers, mean value, standard deviation, maximum value and minimum value, respectively. -
Photosynthetic parameters (Amax, RD, gs-sat and WUEsat) and morphological parameters (LMA and rlw) differed significantly among the different measurement phases, individual trees, and vertical locations of the crown (Table 2). Considering the average pattern across the five sample trees, nearly all physiological and morphological parameters of the needles exhibited a similar vertical profile, which decreased noticeably with increasing RDINC (Fig. 1). However, the mean WUEsat of the five sampled trees followed the opposite trend (Fig. 1f). Amax significantly decreased with RDINC (Fig. 1a), and the mean Amax in the top crown (12.84 μmol·m−2·s−1) was almost 2.7 times higher than that in the bottom crown (4.81 μmol·m−2·s−1). Although there were significant tree-specific differences in gs-sat, NMA, and RD (Table 2), their tendencies demonstrated a pronounced decrease with increasing RDIINC (Fig. 1b, c, & d). The mean values of RD, gs-sat, and NMA varied by 2.5-fold, 3.3-fold, and 2.3-fold, respectively, from the top to the bottom of the crown. Mean rlw exhibited a slight decrease with RDINC when RDINC was lower than 0.3 (upper crown) (Fig. 1e) but then sharply decreased when RDINC was greater than 0.4 (middle and lower crown). In contrast, mean WUEsat showed a weak upward trend with increasing RDINC (Fig. 1f), varying by only 0.015 mmol CO2 mol H2O−1 from top to bottom.
Table 2. Results of the three-way repeated measures ANOVA of photosynthetic and morphological parameters.
Effects df Amax gs-sat RD WUEsat NMA rlw T *** *** *** *** *** *** * P *** *** *** *** *** *** *** L *** *** *** *** *** *** *** T×P *** *** *** *** *** * *** T×L * *** *** *** *** *** P×L *** *** *** *** *** *** * T×P×L *** ** *** *** P, measurement period; T, tree specific; L, crown location. The different parameters have been identified and described in the text. *, 0.01 < p ≤ 0.05; **, 0.001 < p ≤ 0.01; ***, p ≤ 0.001. 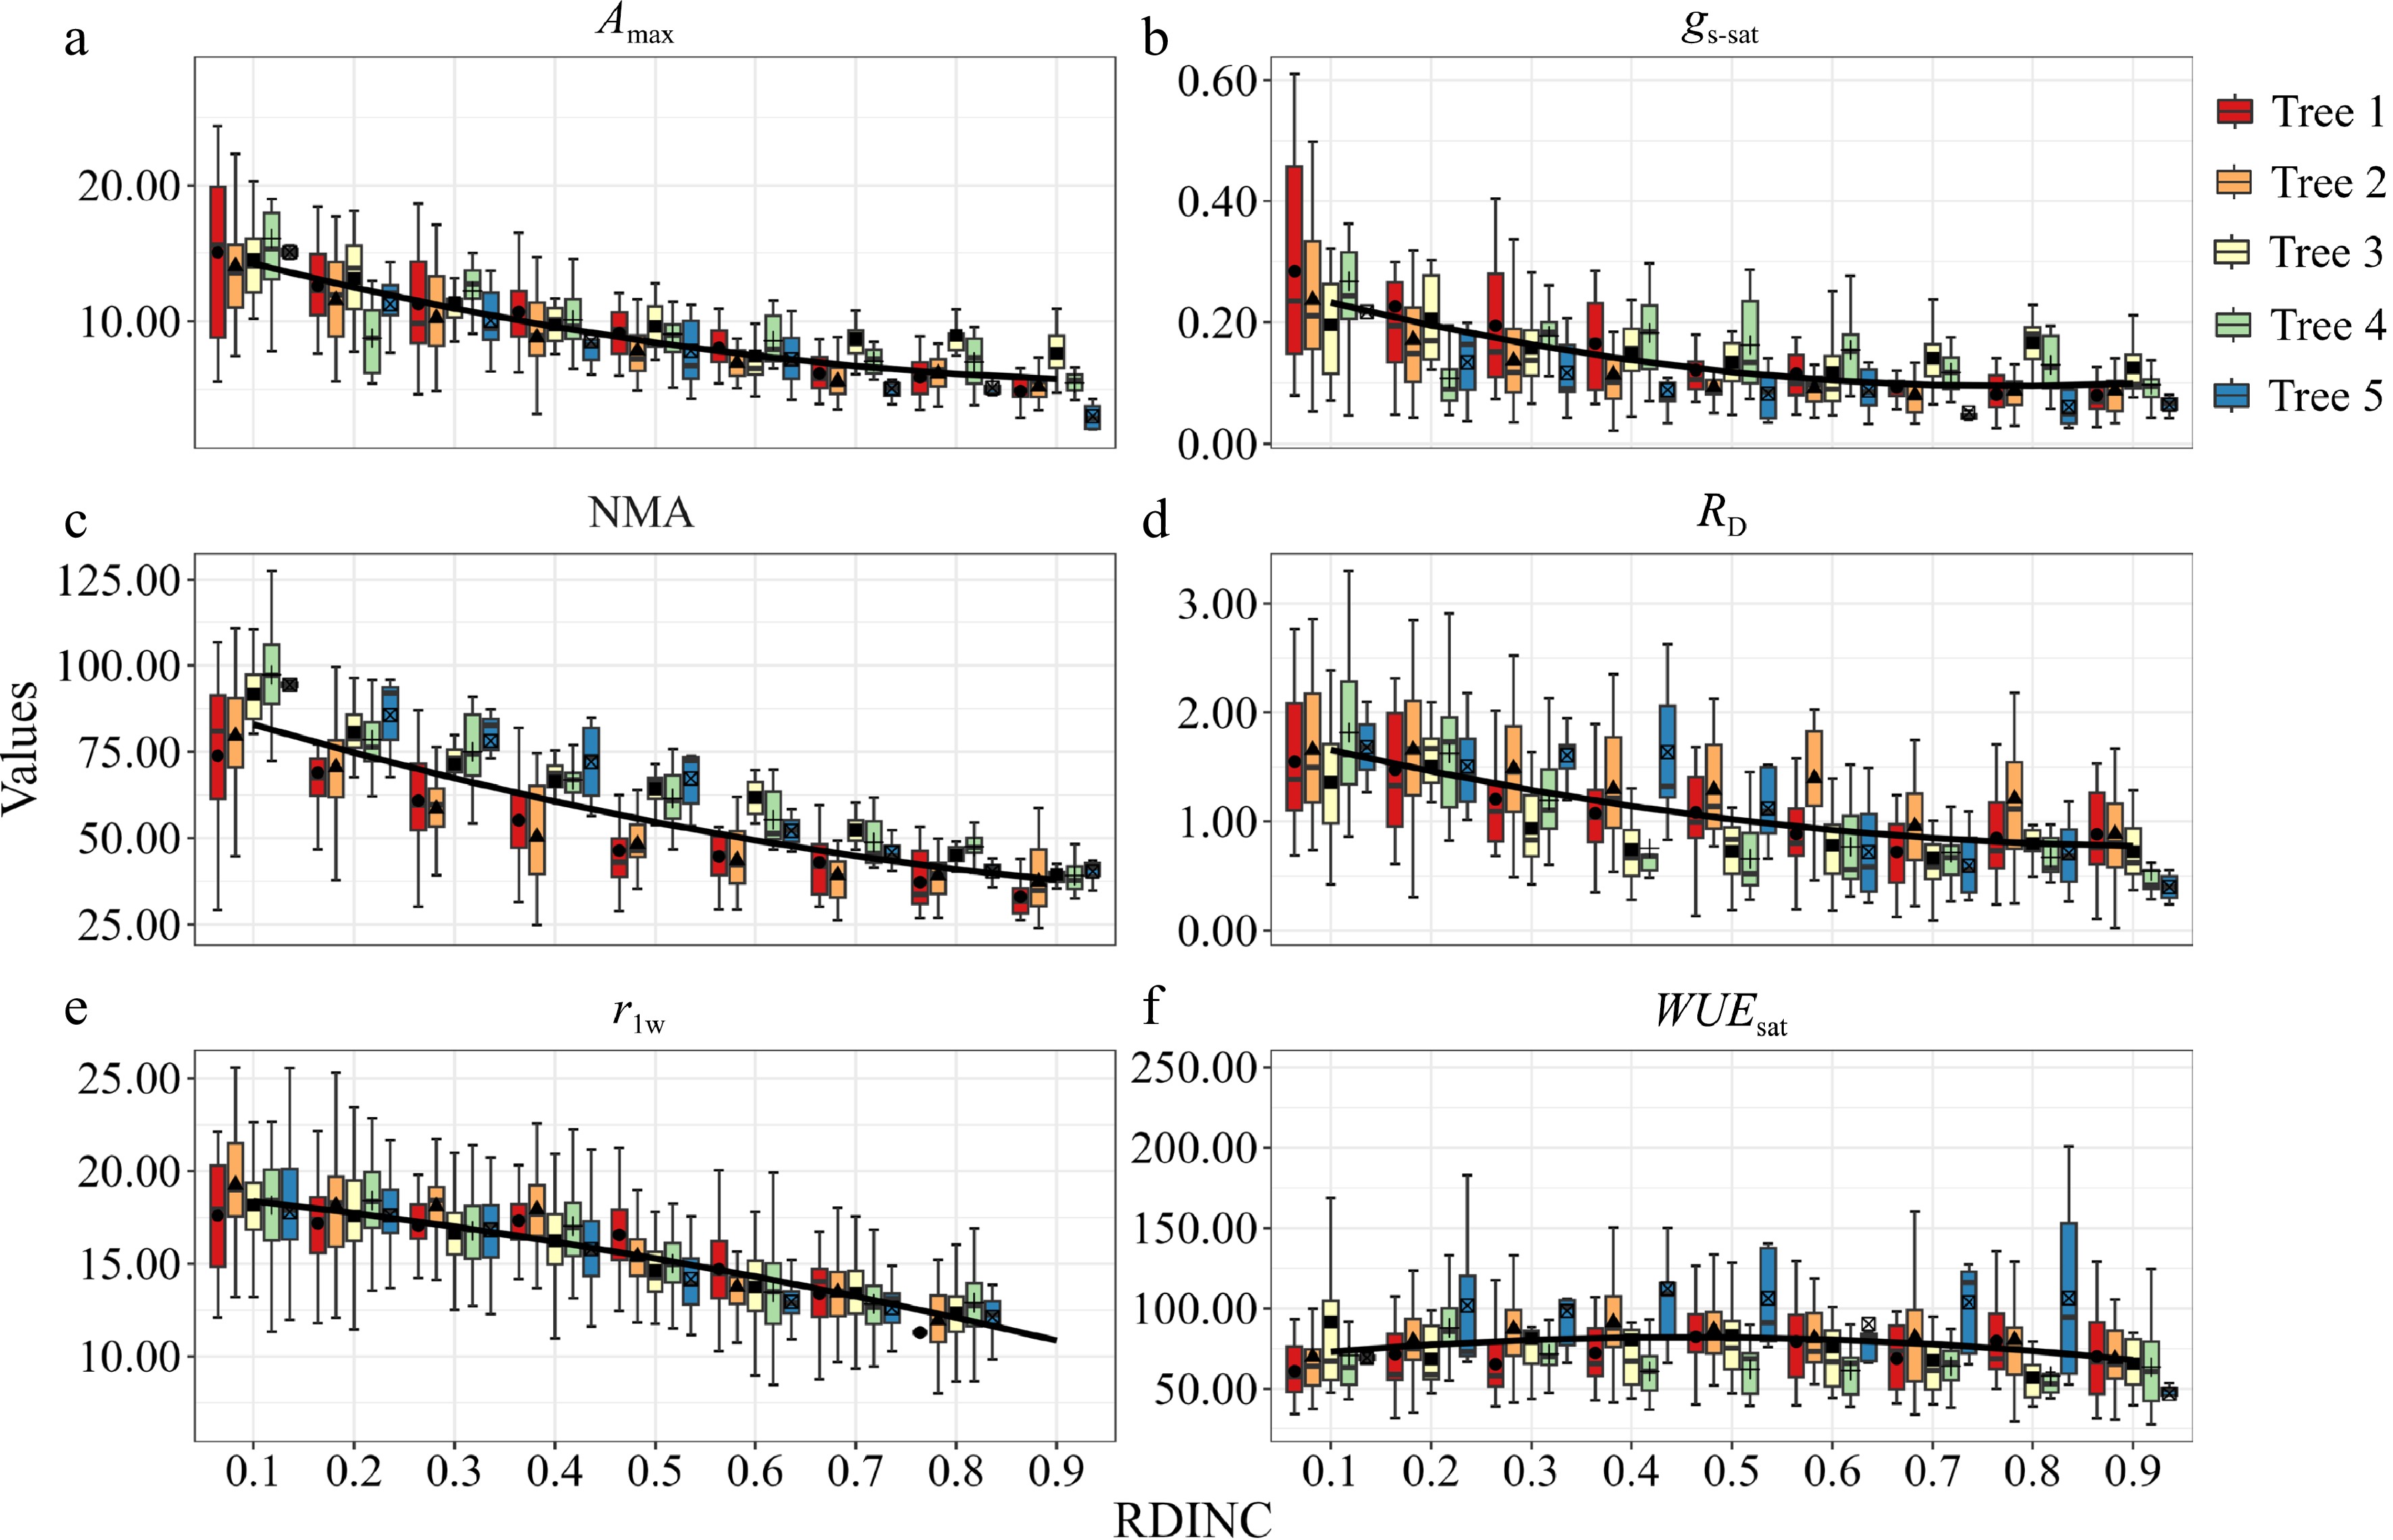
Figure 1.
Vertical profiles of (a) light-saturated net photosynthetic rate (Amax); (b) light-saturated stomatal conductance (gs-sat); (c) needle mass per area (NMA); (d) dark respiration (RD); (e) ratio of length to width of needles (rlw) and (f) light-saturated water use efficiency (WUEsat). Data points represented seasonal mean values (solid bars represented stand error). Black solid line represented mean values of five sample trees (a)−(f).
As mentioned above, photosynthetic and morphological parameters were significantly affected by the vertical location of the crown. However, it is unknown whether the same pattern remains during the entire growth period. Analysis of variance was performed on photosynthetic and morphological parameters based on the vertical locations (upper, middle, and lower crown) in each measurement phase, and the results are summarized in Table 3. rlw was the only parameter that showed a significant vertical difference across the entire growth season (upper > middle > lower crown). Amax, gs-sat, and NMA demonstrated a similar vertical pattern in June, but the mean values of Amax and gs-sat were not significantly different between the upper and middle crown during the early period of needle expansion (PI, May). Mean NMA showed no significant vertical difference within the crown. RD showed no significant difference with respect to vertical location in the crown during the early period of needle expansion but showed significantly greater values in the upper crown than in the middle and lower crowns after June. WUEsat only showed a slight vertical difference at PVI, PVII, and PIV.
Table 3. Summary of physiological and morphological parameters in upper, middle, and lower crown, respectively during growing seasons.
Factors Location PI PII PIII PIV PV PVI PVII PVIII Amax
(μmol·m−2·s−1)Upper 7.07 ± 0.18a 8.67 ± 0.51a 9.77 ± 0.89a 12.11 ± 1.48a 12.16 ± 0.74a 14.18 ± 1.33a 13.74 ± 1.42a 11.42 ± 0.85a Middle 6.76 ± 0.23a 7.19 ± 0.66b 7.82 ± 0.75b 9.19 ± 0.82b 9.03 ± 0.54b 9.03 ± 1.24b 8.11 ± 0.77b 7.88 ± 0.38b Lower 5.80 ± 0.12b 5.93 ± 1.1c 6.57 ± 0.78c 6.03 ± 0.97c 6.48 ± 1.07c 5.15 ± 1.19c 4.3 ± 1.71c 5.47 ± 0.86c RD
(μmol·m−2·s−1)Upper 1.51 ± 0.12a 1.35 ± 0.23a 1.25 ± 0.12a 1.13 ± 0.28a 1.35 ± 0.25a 1.36 ± 0.19a 1.30 ± 0.15a 1.46 ± 0.10a Middle 1.37 ± 0.11a 1.01 ± 0.25b 0.96 ± 0.17b 0.80 ± 0.18b 0.66 ± 0.11b 0.99 ± 0.23b 0.90 ± 0.14b 1.11 ± 0.14b Lower 1.46 ± 0.03a 0.74 ± 0.27c 0.83 ± 0.20b 0.65 ± 0.13b 0.51 ± 0.10b 0.96 ± 0.44b 0.71 ± 0.20c 1.04 ± 0.18b gs-sat
(mol·m−2·s−1)Upper 0.090 ± 0.01a 0.117 ± 0.03a 0.118 ± 0.01a 0.164 ± 0.02a 0.168 ± 0.02a 0.297 ± 0.06a 0.241 ± 0.05a 0.223 ± 0.02a Middle 0.074 ± 0.01a 0.082 ± 0.02b 0.089 ± 0.01b 0.109 ± 0.01b 0.114 ± 0.01b 0.174 ± 0.04b 0.125 ± 0.02b 0.132 ± 0.02b Lower 0.047 ± 0.01b 0.058 ± 0.02c 0.075 ± 0.02c 0.078 ± 0.01c 0.083 ± 0.02c 0.117 ± 0.03c 0.063 ± 0.02c 0.085 ± 0.03c WUEsat
(mmol·mol−1)Upper 92.1 ± 9.6a 93.3 ± 22.1a 102.1 ± 11.4a 79.7 ± 8.0ab 76.0 ± 9.5a 58.9 ± 8.1b 61.1 ± 6.6b 62.5 ± 3.8a Middle 92.0 ± 7.2a 91.0 ± 22.5a 94.0 ± 7.0a 84.2 ± 6.0a 88.0 ± 9.3a 69.5 ± 8.4a 71.7 ± 12.3a 63.9 ± 5.0a Lower 113.7 ± 7.9a 78.8 ± 14.3a 93.6 ± 15.9a 76 ± 12.8b 88.4 ± 25.6a 58.1 ± 16.4b 57.1 ± 16.6b 63.1 ± 13.4a NMA
(g·m−2)Upper 37.8 ± 1.5a 58.6 ± 4.7a 69.6 ± 5.0a 74.5 ± 5.7a 77.9 ± 6.0a 91.7 ± 6.1a 83.9 ± 6.1a 74.6 ± 6.5a Middle 36.4 ± 2.2a 51.2 ± 4.5b 53.9 ± 4.6b 59.4 ± 5.6b 56.7 ± 5.1b 66.9 ± 5.3b 60.8 ± 5.4b 56.2 ± 5.4b Lower 29.1 ± 1.1a 35.9 ± 5.0c 40.4 ± 5.7c 42.9 ± 5.6c 39.6 ± 5.6c 45.6 ± 5.5c 44.1 ± 5.5c 40.8 ± 5.5c rlw Upper 14.2 ± 0.06a 17.8 ± 0.10a 18.6 ± 0.10a 18.0 ± 0.08a 17.7 ± 0.10a 17.9 ± 0.11a 17.4 ± 0.11a 18.6 ± 0.12a Middle 12.9 ± 0.07b 15.7 ± 0.08b 15.3 ± 0.08b 15.2 ± 0.09b 14.9 ± 0.08b 14.4 ± 0.11b 14.9 ± 0.09b 16.2 ± 0.10b Lower 11.5 ± 0.08c 13.3 ± 0.11c 13.3 ± 0.09c 13.0 ± 0.10c 13.5 ± 0.14c 12.6 ± 0.10c 12.9 ± 0.11c 13.6 ± 0.11c Values are Mean ± SE. Mean values with same superscript do not differ significantly (p < 0.05). Seasonal variation of photosynthetic and morphological parameters of needles
-
All photosynthetic and morphological parameters differed significantly among the individual sample trees and fluctuated during the growing seasons (Fig. 2). Mean daily Amax increased with time until late summer (at early August) to a maximum of nearly 9.42 μmol·m−2·s−1 (Fig. 2a). For the remaining season, mean Amax ranged from 8.25 μmol·m−2·s−1 to 8.34 μmol·m−2·s−1. The mean daily RD exhibited a significant decrease over time in early summer to a minimum of near 0.77 μmol·m−2·s−1 and was then restored to 1.04 μmol·m−2·s−1 (Fig. 2d). gs-sat and NMA exhibited a similar time course with an increase during the growing season (Fig. 2b and 2c), but an abnormal peak appeared in early August. Mean WUEsat demonstrated a time course that is opposite to that of gs-sat and NMA (Fig. 2f). Mean NMA increased abruptly at the early period of needle expansion (PI, May), then remained stable until the second half of August (PVII), but finally increased at the end of growth.
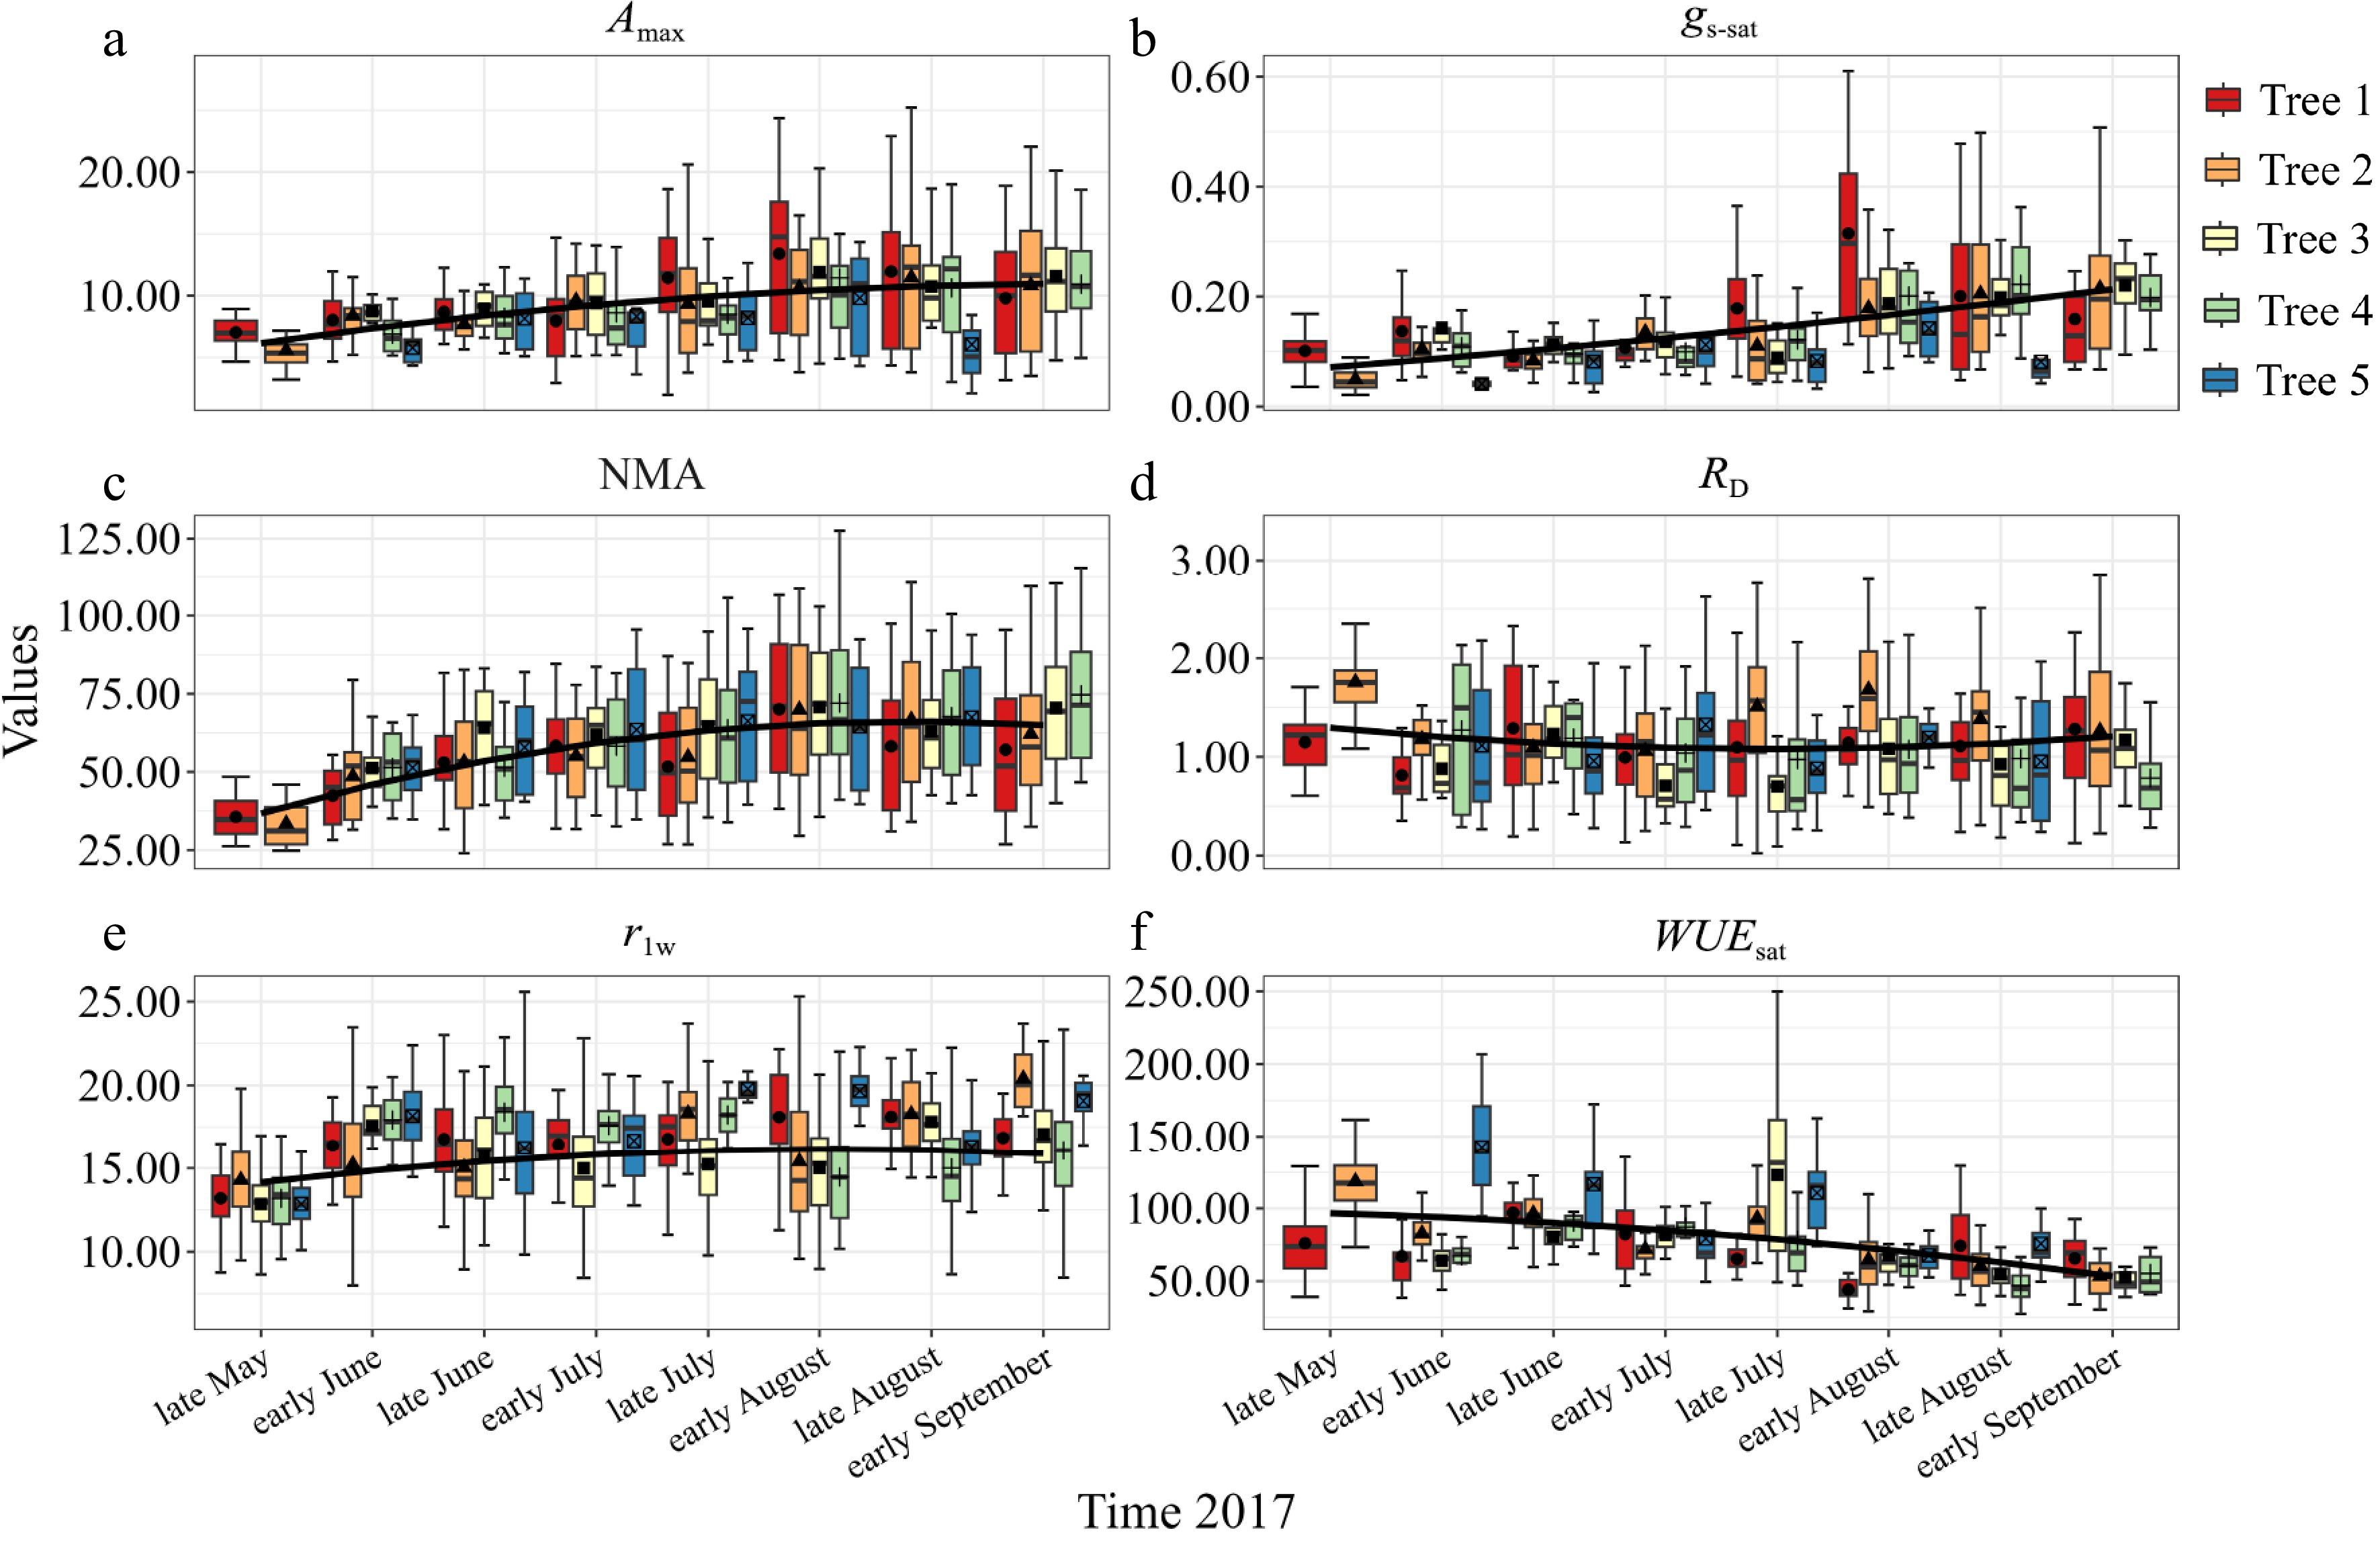
Figure 2.
Seasonal evolution of (a) light-saturated net photosynthetic rate (Amax); (b) light-saturated stomatal conductance (gs-sat); (c) needle mass per area (NMA); (d) dark respiration (RD); (e) ratio of length to width of needles (rlw) and (f) light-saturated water use efficiency (WUEsat) for five sample trees. Data points represent seasonal mean values (solid bars represented stand error). Black solid line represented corrective mean values of five sample trees (a)−(f).
Correlations between photosynthetic and meteorological parameters
-
The relationships between photosynthetic and main meteorological parameters are shown in Fig. 3. Amax significantly correlated to Tleaf, RH, and VPD in the entire treatment (Fig. 3a−c), in which Amax positively correlated to Tleaf and RH but negatively correlated to VPD. The correlation was stronger between Amax and RH (r = 0.46) than between Amax versus Tleaf (r = 0.27) and VPD (−0.28). RD positively and linearly correlated with VPD (r = 0.31, Fig. 3i), but a stronger nonlinear relationship was observed between RD and Tleaf (r = 0.61, Fig. 3g). RH poorly correlated with RD (r = 0.07, Fig. 3h). gs-sat significantly and nonlinearly correlated with RH (positive) and VPD (negative) (Fig. 3e & f). In contrast, WUEsat negatively correlated with RH (r = −0.65, Fig. 3k), positively correlated with VPD (r = 0.64, Fig. 3l), and weakly correlated with Tleaf (r = 0.3, Fig. 3j).
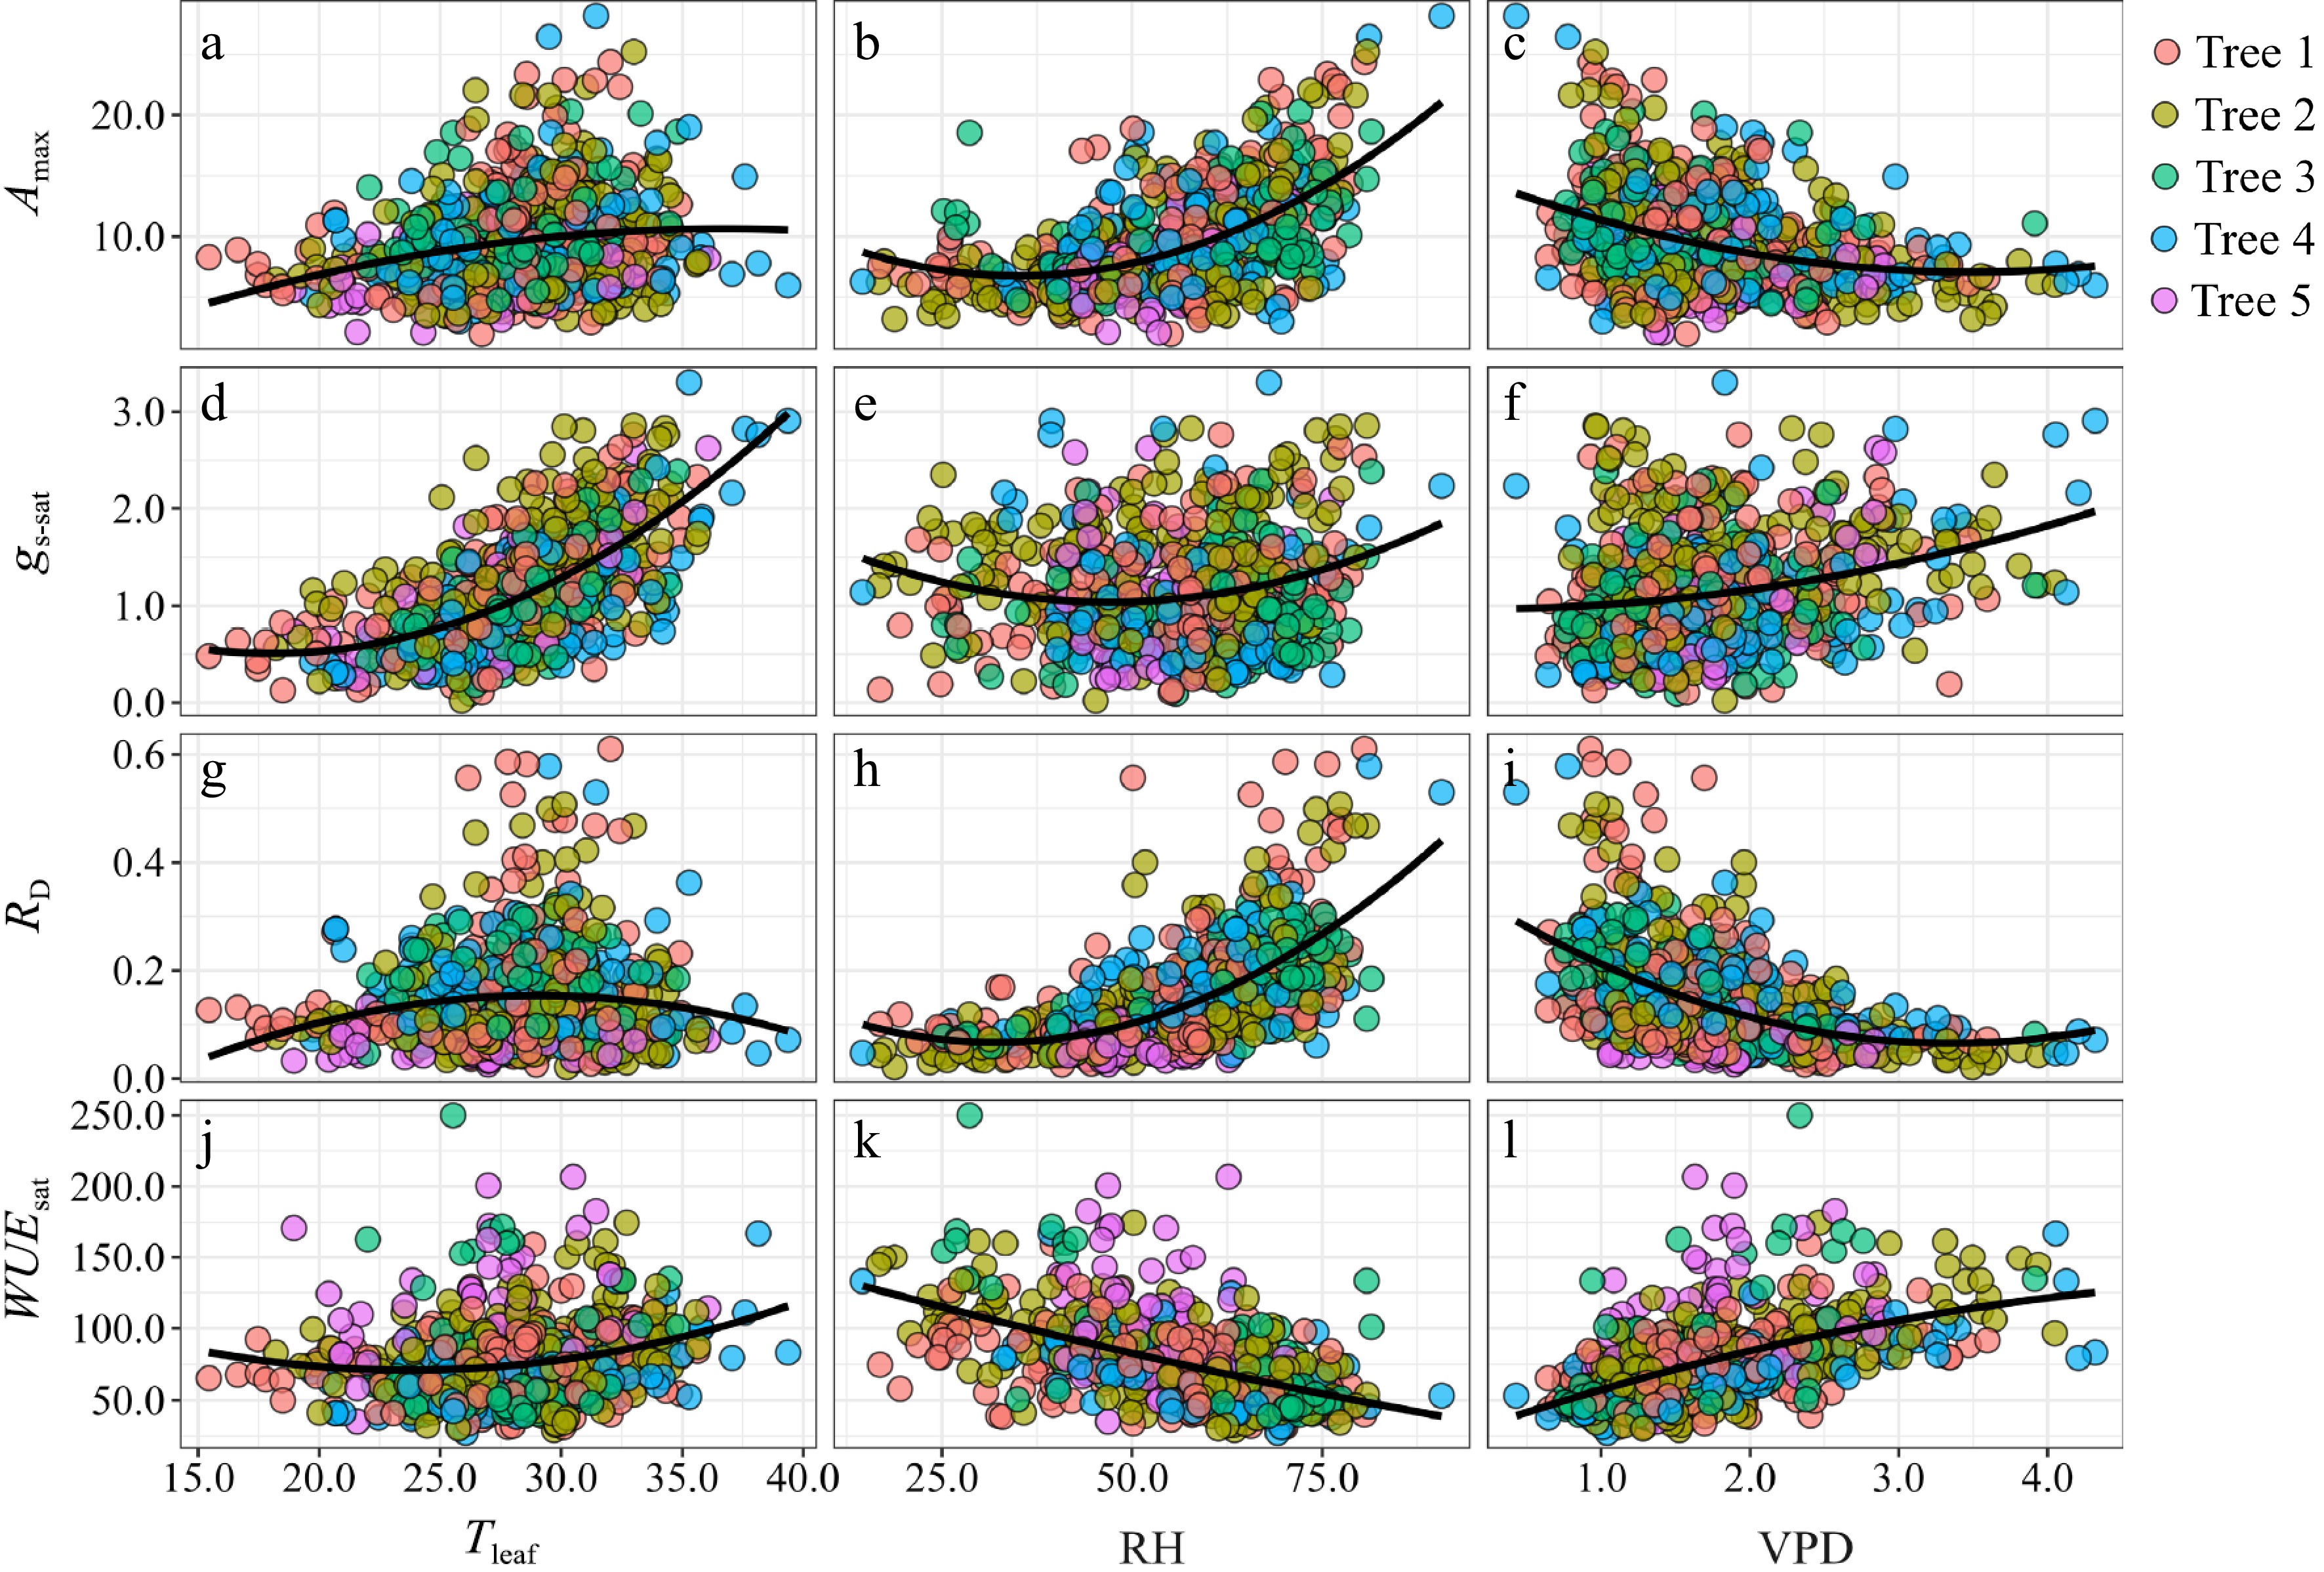
Figure 3.
Relationship between light-saturated net photosynthetic rate (Amax), light saturated stomatal conductance (gs-sat), dark respiration (RD), and light-saturated water use efficiency (WUEsat) and (a), (d), (g), (j) leaf temperature (Tleaf); (b), (e), (h), (k) relative humidity (RH); and (c), (f), (i), (l) vapor pressure deficit (VPD) for five trees.
Relationships between physiological parameters and LMA
-
Amax and RD exhibited a positive and significant correlation with LMA (Fig. 4a & c), but there were slight differences in the correlation coefficients among the individual sample trees. Although gs-sat showed a similar correlation with LMA as Amax and RD, the correlation was weaker (r = 0.35, Fig. 4b). WUEsat only significantly correlated with LMA for two sample trees, even although a significantly negative relationship was observed for all the sample trees (Fig. 4d). WUEsat negatively correlated with LMA but was more significant seasonally than spatially.
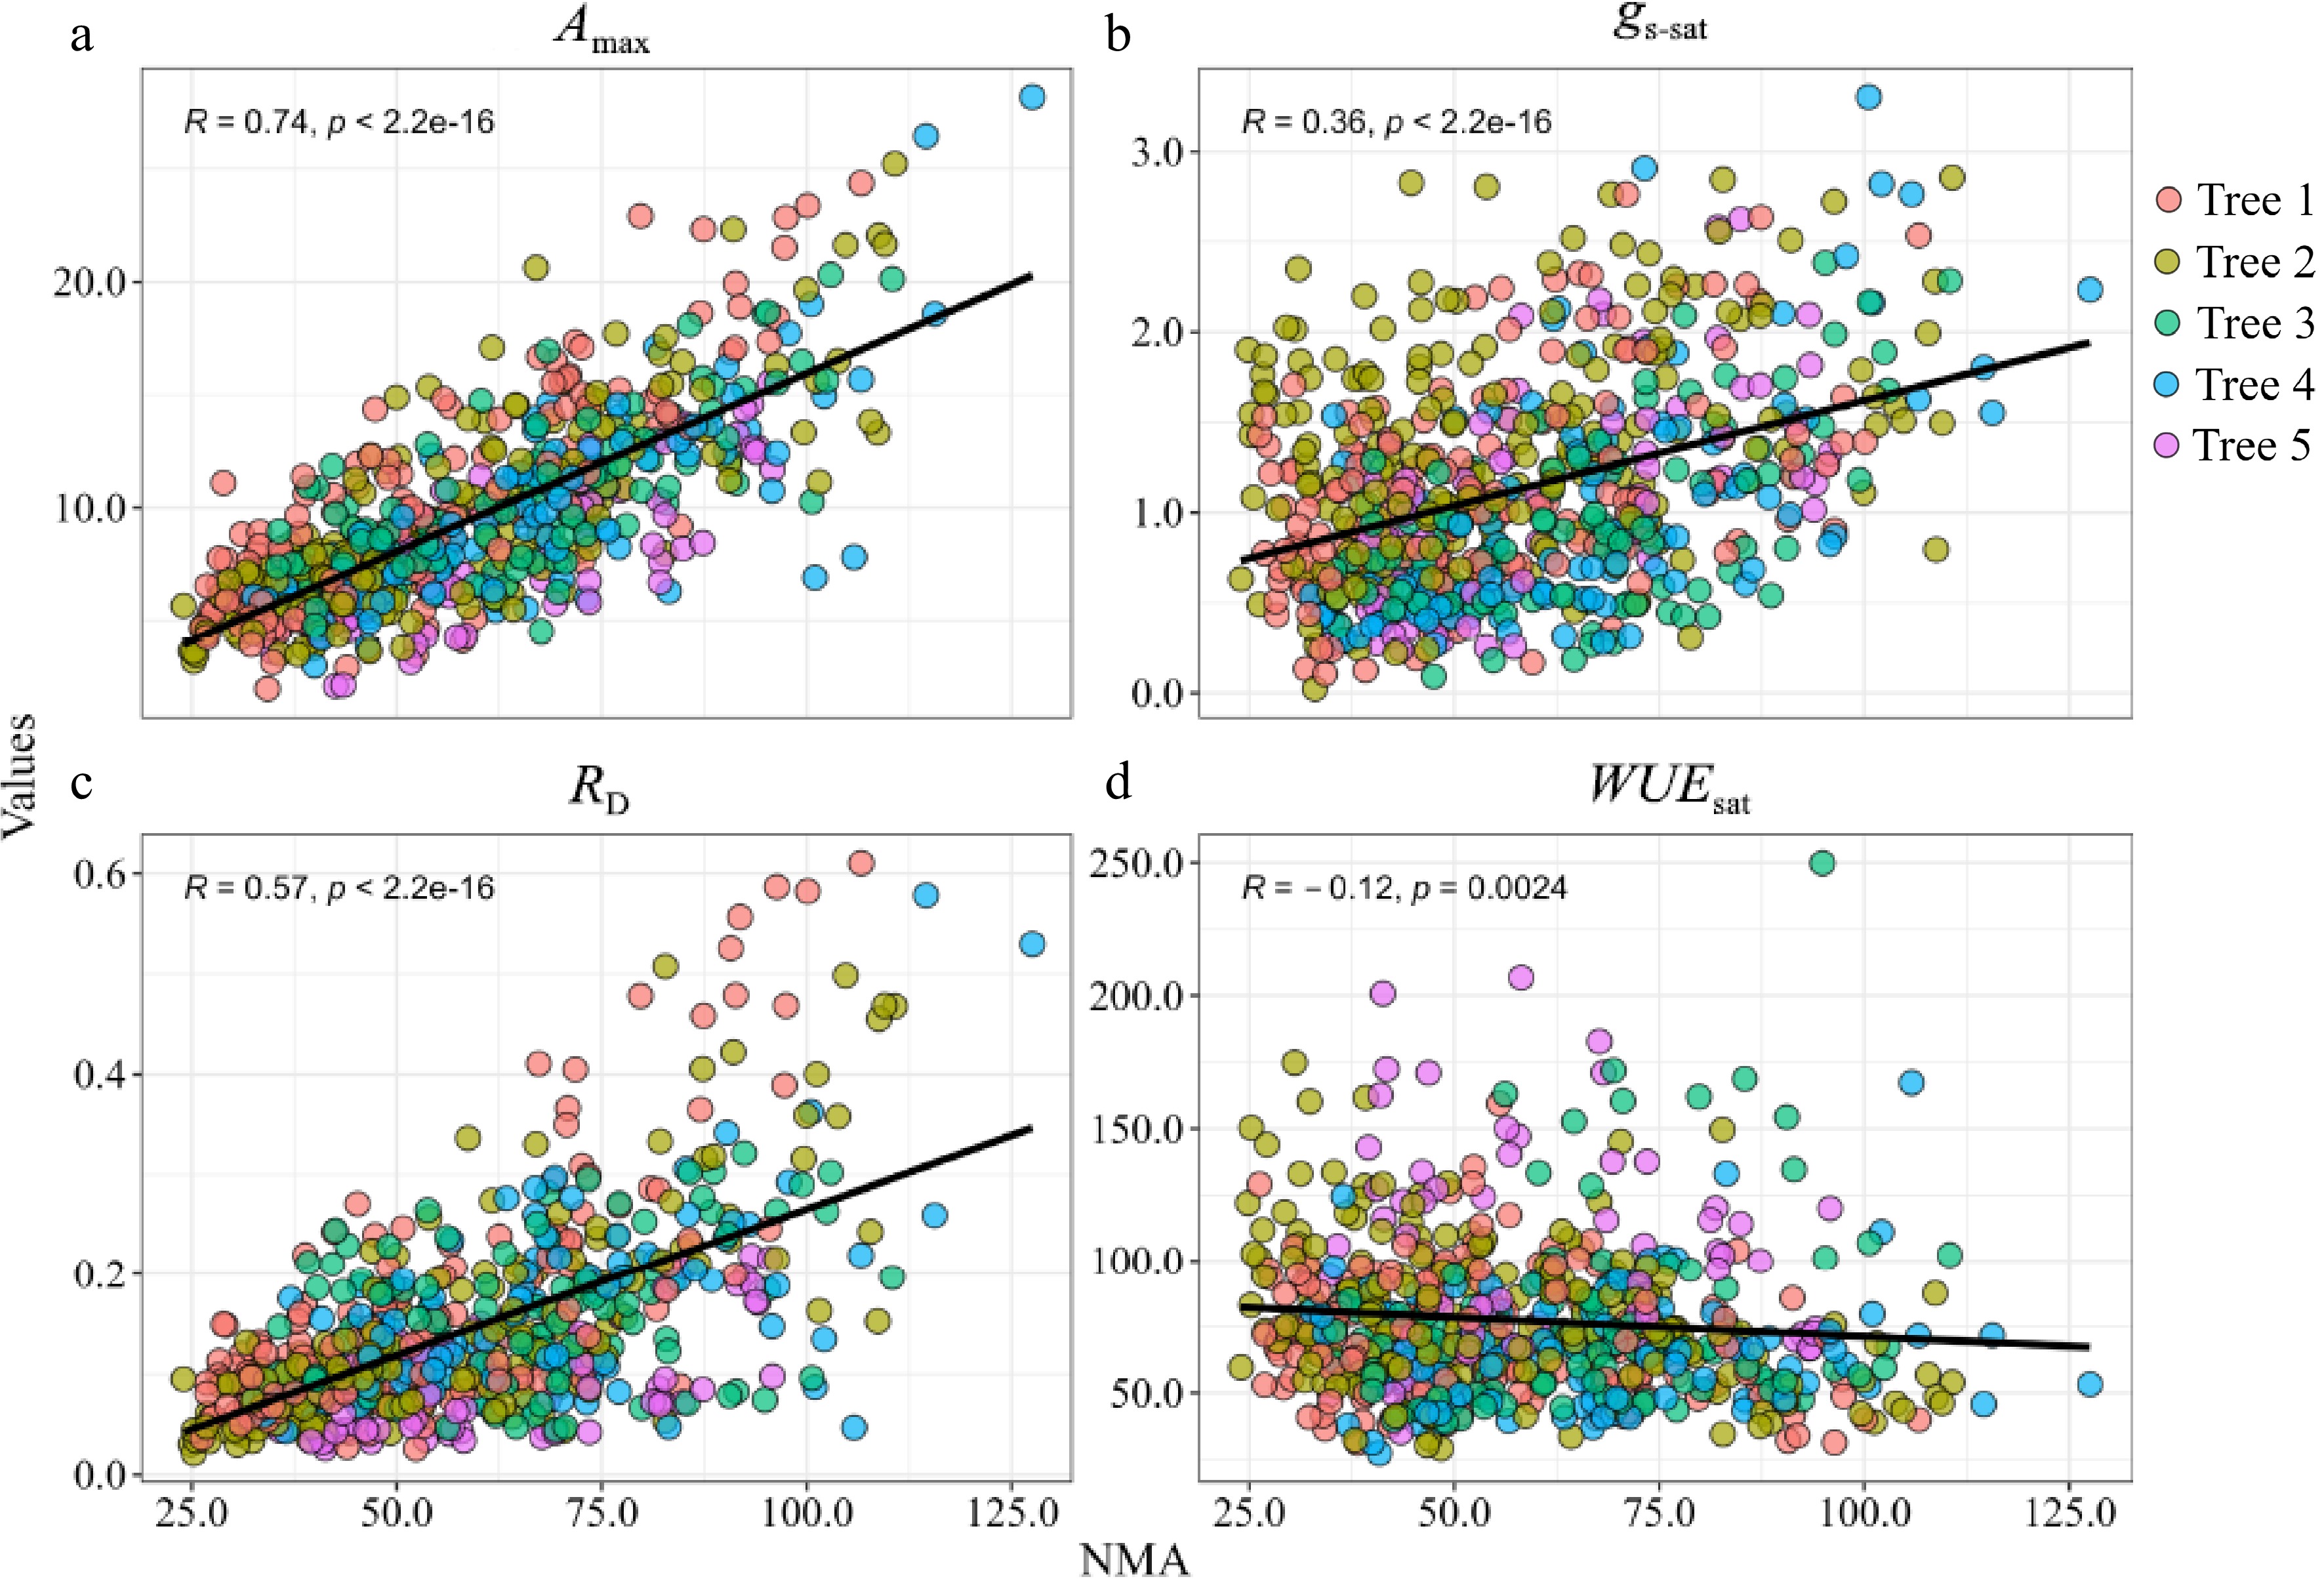
Figure 4.
Relationships between (a) light-saturated net photosynthetic rate (Amax) and needle mass per area (NMA); (b) light-saturated stomatal conductance (gs-sat) and NMA; (c) dark respiration (RD) and NMA; (d) light-saturated water use efficiency (WUEsat) and NMA. R values are the Pearson correlation coefficients. Solid lines represent the fitting result and are based on linear equations.
-
Previous studies have suggested that light[15] and water potential[19,41] are the most important factors affecting the vertical pattern of leaf physiology and morphology, but the primary driver between these two factors is still being debated[42]. Recently, it has become increasingly accepted that the effects of these two factors vary with tree height[43]. Light reportedly affects leaf functions and structures in short trees[15,19], but for tall trees, a decrease in water potential considerably limits their leaf expansion and photosynthetic rate[44]. Our results showed that Amax and gs-sat decreased significantly from crown top to bottom (Fig. 1a & c), which is consistent with that of other studies[45]. Martin et al. reported that shade leaves growing under less irradiance had lower leaf stomatal conductance than sun leaves[18]. RD negatively correlated with RDINC (Fig. 1b), as previously documented for different species[46], because leaves generally adapted to dark environments by reducing RD and Non-photochemical quenching. High leaf tissue density[15] decreased mesophyll conductivity to gas, and restrained RD[45], which was also proved by the higher positive correlation between RD and NMA (Fig. 4c). The vertical pattern of RD partly decreased Amax with increasing tree height but was not significant. NMA is one of the main morphological traits that changes in response to light variations[47]; thus, in our study, NMA followed the same pattern as Amax, gs-sat, and RD (Fig. 1e), suggesting that needles synthesize more photosynthetic tissue with increasing height to maximally use sufficient illumination. Studies revealed that the universal NMA gradient within the tree crowns or forest canopies is likely driven by solute content, leaf thickness[48], leaf turgor pressure[45], and leaf tissue density[15], which reflect the plasticity and adaptability of foliage to the environment. Physiological variations in needles are usually accompanied by a corresponding change in their external form[19]. Our results showed that rlw significantly decreased with increasing RDINC (Fig. 1f), which further implied that trees maximized their photosynthetic efficiency by adjusting their foliage morphology to adapt to different environments in the vertical direction. Variations in WUEsat originate from variations in photosynthetic rate, stomatal conductance, or both[49]. Studies showed that WUEsat negatively correlated with gs-sat[50]. In this study, WUEsat showed an opposite vertical tendency to gs-sat (Fig. 1d), which increased slightly and positively with RDINC, further supporting the opinion that foliage in the lower crown or canopy usually compensates for low resources by improving the utilization efficiency of site resources[51].
Seasonal variation of needle physiology and morphology
-
Understanding the effect of seasonal variations on physiological and morphological parameters is critical for accurate modeling of carbon dioxide uptake by ecosystems, which can then be used to determine the magnitude of ecosystem carbon fluxes[52]. Neglect of this variation may result in incorrect simulations of carbon uptake[53]. Previous studies revealed that Amax and gs-sat generally show a trend similar to a typical parabolic curve during the growing season[22,54] although contrary results have been reported[55]. However, Amax strongly correlated with gs-sat in the above investigations, indicating that stomatal behavior has a pronounced impact on Amax. Our results show that all the physiological and morphological parameters fluctuated during the growth season. Amax had a parabolic seasonal variation, similar to that reported in other studies[22] though accompanied by slight fluctuations in different trees (Fig. 2a), which was probably caused by the high correlation between Amax and seasonal variation of environment conditions (Fig. 3)[38]. Kunert et al. confirmed that short-term exposure to high temperatures poses a considerable threat to conifer species in Central European forest production systems[56]. During spring, an increase in Amax resulted from a gradual increase in photosynthetic capacity[37]. A decrease in Amax during needle senescence is associated with a decrease in mesophyll conductivity to carbon dioxide owing to the increasing size of chloroplasts, starch grains, plastoglobuli, and the resorption of nitrogen[57]. Seasonal variations in leaf photosynthetic traits, including maximum photosynthesis rate, maximum carboxylation rate, and mesophyll and stomatal conductance, can be well explained based on photoperiod variations[2]. In addition, under both winter and drought stress, the main challenge for plants is that electron acceptor regeneration processes markedly slow down compared to primary photosynthetic processes, and this creates an imbalance between absorption and utilization of light energy[28].
Previous studies have suggested that seasonal variations in RD are mainly driven by seasonal patterns in temperature and NMA[58]. It is well known that starch and soluble sugars are the main reactants in the respiratory process; thus, their content directly affects respiration. Temperature also indirectly limits respiration by affecting the activity of enzymes that participate in respiration[59]. A previous study showed that a reduction in leaf expansion phase was due to a decrease in cytochrome-mediated respiration[21]. Our results implied that RD was significantly correlated with Tleaf (Fig. 3b) and NMA (Fig. 4b). The seasonal pattern of RD showed an obvious reduction in the leaf expansion phase and then slightly recovered with a little fluctuation (Fig. 2b), following a similar trend in other studies[60]. NMA showed a progressive increase throughout the growing season (Fig. 2e) owing to the accumulation of structural proteins and calcium. Seasonal variation in WUEsat was different from that in gs-sat (Fig. 2d), probably because WUEsat and gs-sat are negatively correlated[49]. Previous studies on seasonal patterns of leaf length, width, and thickness have shown that they universally follow a saturation or parabolic curve[58] throughout the growth season, reflecting the dynamic nature of photosynthetic acclimation[61]. We also observed variations in leaf shape and found that the ratio of length to width (rlw) showed a saturated tendency (Fig. 2f). The increase at the end of the growing season indicated that the needles started to senescence.
A further analysis of seasonal difference in photosynthetic rates among different canopy positions was conducted (Table 4), and the result indicated that Amax, WUEsat and gs-sat were significantly different in the upper crown but not significant in the lower crown. Conversely, RD showed significant seasonal difference in the lower crown but not significant in the upper crown. Rare studys mentioned relevant results, but some research have proved that photosynthesis was more sensitive to light intensity and respiration was mainly affected by temperature[49−51]. In our study, the closed-canopy caused an obvious seasonal change of light intensity in upper crown, but weak in lower crown. However, the seasonal variation of temperature was evident in the whole crown. Thus, Amax, WUEsat and gs-sat showed different seasonal difference compared to RD.
Table 4. Results of the One-way ANOVA of photosynthetic parameters in each vertical layer.
Vertical layer Photosynthetic parameters Amax RD WUEsat gs-sat 1 ** ** ** 2 ** ** ** 3 ** ** ** 4 ** ** ** 5 * 6 * 7 * 8 * 9 * The different parameters have been identified and described in the text. *, 0.01 < p ≤ 0.05; **, 0.001 < p ≤ 0.01. Relationship between needle physiology and environment
-
Tleaf showed a significant parabolic correlation with Amax (Fig. 3a), corroborating the results of many other studies that focused on different tree species such as, Quercus crispul[57], Picea mariana[62], Pinus cembra[63]. Both RH and VPD showed a significant relationship with Amax (Fig. 3e & i), particularly in the upper crown, presumably because needles in the upper crown are exposed to environmental stresses more frequently, and the variations in RH and VPD in the upper crown are more sensitive and greater[64] than that in other crowns. RD exhibited a typical exponential relationship with Tleaf (Fig. 3b), corroborating the results of other studies[46,58,62]. Both gs-sat and WUEsat significantly correlated with RH (Fig. 3g & h) and VPD (Fig. 3k & l), but the tendencies were diametrically opposite. Similar processes have been observed in other studies[37,50]. Some studies have suggested that variations in WUEsat across dates are primarily driven by gs-sat[49] and our investigation showed that WUEsat significantly correlated to gs-sat (r = −0.71). Thus, we suggest that the relationship among WUEsat, versus RH and VPD is likely caused by the influence of RH and VPD on gs-sat.
Relationship between needle physiology and NMA
-
NMA plays an important role in predicting foliar physiological function, serves as a parameter in ecosystem modeling, and is used as an indicator for potential growth rate[65]. Our results showed that Amax and gs-sat both had a significant positive correlation with NMA (Fig. 4a & c), similar to the results of previous studies on other species[66]. Other studies have shown a negative relationship between mass-based Amax and gs-sat versus NMA, probably because of the vertical pattern of NMA[44]. Han found a negative relationship between Amax and gs-sat versus NMA for Pinus densiflora, probably because of a higher NMA value (> 200 g·m−2) than that in our study (< 130 g·m−2)[67]. Moreover, a NMA value of up to 500 g·m−2 for Pinus monticola [68], 800 g·m−2 for Sequoia sempervirens [19], and 1,000 g·m−2 for Pseudotsuga menziesii and Pinus ponderosa[68]; almost all these species are categorized as tall tree species with a negative relationship between Amax and NMA. Therefore, we speculate that the relatively low NMA in our study may not be sufficient to limit mesophyll conductivity to carbon dioxide, and consequently, Amax and RD is significantly and positively correlated with NMA, probably because of starch and soluble sugar contents[58]. However, WUEsat had a stronger correlation with RH and VPD than with NMA (Figs 3h, l & 4d), indicating that variations in WUEsat across the growing season were primarily driven by the environment rather than by the needle morphology in this study.
-
Our study found that the spatial and seasonal variations of crown photosynthetic parameters for Larix olgensis were directly influenced by NMA, RH and VPD, in which NMA generally reflected the adaptability of leaves to the environmental factors. Thus, clarifying the response relationships between micro-environment and thinning intensity will contribute to the determination of optimal stand density. In addition, our results make it feasible to estimate the crown photosynthetic production and is helpful to further determine the contribution of branches to the trunk, which is the basis when making a pruning plan to produce no-knots wood and enhance the carbon sink capacity of young forests.
-
The authors confirm contribution to the paper as follows: study conception and design: Liu Q, Li F, Xie L; data collection: Liu Q, Xie L; analysis and interpretation of results: Liu Q, Zhang Z, Xie L; draft manuscript preparation: Liu Q, Wang D, Zhang Z, Xie L. All authors reviewed the results and approved the final version of the manuscript.
-
The datasets generated during and/or analyzed during the current study are available from the corresponding author on reasonable request.
This research was financially supported by the Joint Funds for Regional Innovation and Development of the National Natural Science Foundation of China (Project# U21A20244), National Natural Science Foundation of the People's Republic of China (Project# 32201556), and Talent Introduction Research Project of Hebei Agricultural University (Project# YJ201942). We are deeply indebted to the academic staff, past and present postgraduate students of the Department of Forest Management, School of Forestry, Northeast Forestry University, who collected the data in the field.
-
The authors declare that they have no conflict of interest.
- Copyright: © 2024 by the author(s). Published by Maximum Academic Press, Fayetteville, GA. This article is an open access article distributed under Creative Commons Attribution License (CC BY 4.0), visit https://creativecommons.org/licenses/by/4.0/.
-
About this article
Cite this article
Liu Q, Zhang Z, Wang D, Li F, Xie L. 2024. Main drivers of vertical and seasonal patterns of leaf photosynthetic characteristics of young planted Larix Olgensis trees. Forestry Research 4: e001 doi: 10.48130/fr-0023-0029 

Main drivers of vertical and seasonal patterns of leaf photosynthetic characteristics of young planted Larix Olgensis trees
- Received: 05 September 2023
- Revised: 15 November 2023
- Accepted: 22 November 2023
- Published online: 09 January 2024
Abstract: Photosynthetic characteristics of tall trees play important roles in improving the accuracy of ecosystem models, but they are laborious to be accurately measured or estimated owing to the influence of multiple factors. To clarify the main drivers of vertical and seasonal patterns of leaf photosynthetic characteristics of young planted Larix Olgensis trees, we collected data on the photosynthetic, morphological, and meteorological characteristics by a long-term observation throughout the entire growing season. Vertical and seasonal patterns of leaf photosynthetic characteristics and their impact factors were analyzed. Results showed that maximum net CO2 assimilation (Amax), light saturated stomatal conductance (gs-sat), respiration rate (RD), needle mass per area (NMA), and ratio of needle length to needle width (rlw) all significantly and negatively correlated with relative depth into crown (RDINC), that was caused by the adaptive alteration of mesophyll tissue to the differed light intensity and humidity. Amax and gs-sat both showed a similar 'parabolic' seasonal trend, that was not only affected by the variation of environment but also the leaf economic spectrum, such as NMA. Our results suggested that spatiotemporal variations of crown photosynthetic characteristics were directly influenced by leaf economic spectrum but fundamentally affected by the long-term acclimation to surrounding environmental factors. This is helpful to optimize the crown photosynthesis model to assess instantaneous or even long-term photosynthetic production, in order to clarify the balance of supply and demand within crown, and further guide the effective pruning for individual trees.
-
Key words:
- Photosynthesis /
- Crown structure /
- Environmental conditions /
- Seasonal variations