ARTICLE   Open Access    

The grapevine SOC1 homolog, VviMADS8/SOC1a, regulates floral organ specification in tomato

More Information
  • Received: 04 April 2024
    Revised: 02 June 2024
    Accepted: 24 June 2024
    Published online: 09 August 2024
    Fruit Research  4 Article number: e029 (2024)  |  Cite this article
  • The MADS-box protein SUPPRESSOR OF OVEREXPRESSION OF CONSTANS1 (SOC1) is a key floral activator that coordinates external and internal stimuli to ensure timely floral transition. During early development, SOC1 represses floral organ identity to prevent premature differentiation and, thus, is also linked to the successful development of functional flowers. In woody perennials, SOC1 has established a divergent function in the regulation of bud dormancy release. Apart from reducing flowering time in Arabidopsis, little is known about the function of VviSOC1a and its gene regulatory network. In this study, VviSOC1a was functionally characterized through overexpression in tomato, where it was found to promote the development of leaf-like sepals and petals with an increased accumulation of chlorophyll. In severe cases, overexpression of VviSOC1a led to the formation of defective floral organs resulting in plant sterility phenotypes. Gene expression analyses revealed the significant downregulation of important floral organ identity genes in tomato, such as SIMC, SlRIN, SlCMB1, and SlMBP21. Additional downstream impacts on ripening and cuticle-associated gene expression warrant further characterization of VviSOC1a within the context of these crop traits. In silico analysis of the VviSOC1a expression profile revealed patterns distinctive of genes involved in floral induction. This, in combination with an association gene network significantly enriched in flower developmental processes, supports a predicted function for VviSOC1a in floral initiation and floral organ specification.
  • The competition for consumer preference for fresh apples (Malus domestica) from exotic and tropical fruits is intense. Red-fleshed (RF) apple may not only provide a novel point of differentiation and enhanced visual quality, but also a source of increased concentration of potentially health-benefiting compounds within both the fresh fruit and snack/juice markets[1]. Two different types of RF apples have been characterised: Type 1 RF apple has red colouration not only in the fruit core and cortex, but also in vegetative tissues, including stems and leaves; Type 2 RF apples display red pigment only in the fruit cortex[1, 2]. To facilitate trade and lengthen the supply-window, harvested fruit are usually cold stored, which can induce a series of disorders, including physiological breakdown manifesting as a flesh browning disorder (FBD) in RF apples[3, 4]. FBD in RF apples can be caused by senescence, and there is also some evidence to suggest that a large proportion of RF apples are chilling-sensitive (Jason Johnston, Plant & Food Research Hawke's Bay, personal communication).

    Earlier studies suggested that Type 1 RF colour was determined by a promoter mutation of MdMYB10 that has a tandem replication of a myeloblastosis (MYB) binding cis-element (R6) within the promoter, resulting in autoregulation of MdMYB10[5]. However, van Nocker et al.[6] observed a large variation in the degree and pattern of red pigmentation within the cortex among the accessions carrying MdMYB10, and concluded that the presence of this gene alone was not sufficient to ensure the RF colour. A genome-wide association study (GWAS)[3], reported that, in addition to the MdMYB10 gene, other genetic factors (e.g. MdLAR1, a key enzyme in the flavonoid biosynthetic pathway) were associated with RF colour, too. Wang et al.[7] reported that many of the up-regulated genes in RF apples were associated with flavonoid biosynthesis (e.g., chalcone synthase (CHS), chalcone isomerase (CHI), dihydroflavonol 4-reductase (DFR), anthocyanin synthase (ANS), UDP-glucosyltransferase (UGT) and MYB transcription factors). Recently, MdNAC42 was shown to share similar expression patterns in RF fruit with MdMYB10 and MdTTG1, and it interacts with MdMYB10 to participate in the regulation of anthocyanin synthesis in the RF apple Redlove®[8].

    Several transcription factor genes (e.g., MYB, WRKY, bHLH, NAC, ERF, bZIP and HSF) were reported to be differentially expressed during cold-induced morphological and physiological changes in 'Golden Delicious' apples[9]. A study by Zhang et al.[10] showed that ERF1B was capable of interacting with the promotors of anthocyanin and proanthocyanidin (PA) MYB transcription factors, and suggested that ethylene regulation and anthocyanin regulation might be linked in either direction. It was reported that ethylene signal transduction pathway genes or response genes, such as ERS (ethylene response sensor), EIN3 (ethylene-insensitive3) and ERFs (ethylene response factors), may play an important role in the regulatory network of PA biosynthesis[11].

    Espley et al.[12] observed no incidence of FBD in cold-stored fruit of 'Royal Gala', but over-expression of MdMYB10 in 'Royal Gala' resulted in a high rate of FBD in RF fruit, which was hypothesised to be caused by elevated fruit ethylene concentrations before harvest and more anthocyanin, chlorogenic acid (CGA) and pro-cyanidins in RF fruit. In addition, the MYB10 transcription factor was shown to elevate the expression levels of MdACS, MdACO, and MdERF106 ethylene-regulating genes[12]. To elucidate the mechanism regulating the FBD of RF apples, Zuo et al.[13] analysed the transcriptome of tree-ripe apples at 0, 0.5 and 4 h after cutting, and reported that the differentially expressed genes at different sampling points were mainly related to plant–pathogen interactions.

    GWAS is a powerful technique for mining novel functional variants. One of the limitations of GWAS, using SNP arrays, is that they require genotyping of large numbers of individuals, which may be expensive for large populations. DNA pooling-based designs (i.e., bulk segregant analysis) test differential allele distributions in pools of individuals that exhibit extreme phenotypes (XP) in bi-parental populations, large germplasm collections or random mating populations[1416]. In addition to reducing the number of samples to be genotyped, the use of whole genome sequencing (WGS)-based XP-GWAS has the potential to identify small-effect loci and rare alleles via extreme phenotypic selection.

    In this WGS-based XP-GWAS, we investigated the genetic basis of RF and FBD by sequencing the pools of individuals that exhibited extreme phenotypes for these two traits, and analysed the differences in allele frequencies between phenotypic classes. This method combines the simplicity of genotyping pools with superior mapping resolution. We also examined the transcriptome from transgenic apple fruit harbouring the R6:MYB10 promoter as a model for red flesh in apple. Differences in gene expression of a highly pigmented line were compared with expression in control fruit and these genes were then used for comparison with the seedling population. Understanding the genetic basis of the link between RF and FBD will help in design of strategies for selection against FBD in high-quality Type 1 RF apple cultivars.

    A snapshot of visual variation in FBD and WCI is presented in Fig. 1. The average WCI and FBD across all ~900 seedlings ranged from 0 to 7, and from 0% to 58%, respectively. Based on the MLM analysis, the estimated narrow-sense heritability (h2) of WCI and FBD was 0.57 (standard error = 0.18) and 0.09 (standard error = 0.05), respectively. The estimated genetic correlation between WCI and FBD was 0.58, and several fruit quality traits displayed unfavourable correlations with WCI (Supplemental Fig. S1). Seedlings with higher WCI scores were generally characterised by poor firmness and crispness, plus higher astringency and sourness. Estimated phenotypic and genetic correlations between all pairs of traits are listed in Supplemental Table S1.

    Figure 1.  Transverse cross-sections of apple slices showing range in (a) flesh colouration, and (b) flesh browning disorder for Type 1 red-fleshed apple. The weighted cortical intensity (WCI) scores (0−9 scale) and the proportion of the cortex area showing symptoms of flesh browning disorder are also displayed.

    A few seedlings had no red pigment in the cortex, but the average WCI score across all seedlings was 2.25. About two-thirds of the seedlings did not display any FBD symptoms, but among the remaining seedlings, FBD ranged between 1% and 58% (Fig. 2). The average WCI score for the 'low' and 'high' WCI pool was 0.45 and 5.2, respectively, while the average FBD was 0% and 20.6% for the 'low' and 'high' FBD pool, respectively (Supplemental Table S2). The average WCI score of the seedlings in the FBD pools was similar (Low: 5.5; High: 4.6), while the average FBD of the high- and low-WCI pools was 4.5% and 0.1%, respectively.

    Figure 2.  The distribution of weighted cortex intensity (WCI) scores (a) and the internal flesh browning disorder IFBD%; (b) in the population of ~900 apple seedlings. The green and red circles highlight the individuals used to form the 'low' and 'high' pools of samples.

    After filtering, about 204,000 SNPs were used and the average sequencing depth of SNP loci was similar for the two pools (42 vs 44). There was a near-perfect correlation between the Z-test statistics and G-statistics, so only the latter are discussed hereafter. A plot of the G' values, smoothed over 2 Mb windows, is shown for all 17 chromosomes (Chrs) in Supplemental Fig. S2. XP-GWAS identified genomic regions significantly associated with FBD on 12 out of the 17 Chrs (Fig. 3), and putative candidate genes within ±1.0 Mb distanceof the significant G' peaks were identified (Table 1). Additional genomic regions, which did not meet the significance threshold but displayed distinguished G' peaks, were also identified across all chromosomes (Supplemental Table S3).

    Figure 3.  G'-statistics across the linkage groups (LG) showing significant association with the flesh browning disorder (FBD) in apple The horizontal red lines indicate the significance threshold. The putative candidate genes (refer to Table 1) underpinning various G' peaks are also shown.
    Table 1.  A list of the genomic regions associated with internal flesh browning disorder (FBD) in apples. Putative candidate genes residing within these regions are also listed using GDDH13v1.1 reference genome assembly.
    ChrGenomic region (Mb)Putative genes functions
    221.9–23.5Ethylene-responsive element binding factor 13 (MdERF13: MD02G1213600);
    33.1–4.9cinnamate 4-hydroxylase (C4H) enzyme (MD03G1051100, MD03G1050900 and MD03G1051000); MdWRKY2: MD03G1044400; MdWRKY33 (MD03G1057400)
    38.2–9.6ascorbate peroxidase 1 (MdAPX1: MD03G1108200, MD03G1108300)
    314.7–16.6senescence-related MdNAC90 (MD03G1148500)
    336.5–37.5Ethylene response sensor 1 (MdERS1: MD03G1292200); flavonoid biosynthesis protein MdMYB12 (MD03G1297100); Heat shock protein DnaJ (MD03G1296600, MD03G1297000); pectin methylesterase (MdPME) inhibitor protein (MD03G1290800, MD03G1290900, MD03G1291000).
    411.0–13.0phenylalanine and lignin biosynthesis protein MdMYB85 (MD04G1080600)
    422.1–24.4MYB domain protein 1 (MD04G1142200); HSP20-like protein (MD04G1140600); UDP-glucosyltransferase (UGT) proteins UGT85A7 (MD04G1140700, MD04G1140900); UGT85A3 (MD04G1140800); UGT (MD04G1141000, MD04G1141300); UGT85A2 (MD04G1141400); UGT85A4 (MD04G1141500); DNAJ heat shock protein (MD04G1153800, MD04G1153900, MD04G1154100)
    427.6–29.6HCT/HQT regulatory genes MD04G1188000 and MD04G1188400
    629.8–31.7Volz et al. (2013) QTL for IFBD; anthocyanin regulatory proteins MdMYB86 (MD06G1167200); triterpene biosynthesis transcription factor MdMYB66 (MD06G1174200); Cytochrome P450 (MD06G1162600; MD06G1162700, MD06G1162800, MD06G1163100, MD06G1163300, MD06G1163400, MD06G1163500, MD06G1163600, MD06G1163800, MD06G1164000, MD06G1164100, MD06G1164300, MD06G1164400, MD06G1164500, MD06G1164700)
    713.9–15.9heat shock protein 70B (MD07G1116300)
    717.4–19.0Drought-stress WRKY DNA-binding proteins (MdWRKY56: MD07G1131000, MD07G1131400)
    723.6–25.2MdPAL2 (MD07G1172700); drought-stress gene NGA1 (MD07G1162400); DNAJ heat shock family protein (MD07G1162300, MD07G1162200), stress-response protein (MdNAC69: MD07G1163700, MD07G1164000)
    97.9–11.8MD09G1110500 involved in ascorbate oxidase (AO); MdUGT proteins (MD09G1141200, MD09G1141300, MD09G1141500, MD09G1141600, MD09G1141700, MD09G1141800, MD09G1142000, MD09G1142500, MD09G1142600, MD09G1142800, MD09G1142900, MD09G1143000, MD09G1143200, MD09G1143400) involved in flavonoids biosynthesis; heat shock proteins 89.1 (MD09G1122200) and HSP70 (MD09G1137300); Ethylene-forming enzyme MD09G1114800; Anthocyanin regulatory protein MdNAC42 (MD09G1147500, MD09G1147600)
    914.9–16.5triterpene biosynthesis transcription factor protein MdMYB66 (MD09G1183800);
    111.7–3.0ethylene response factor proteins (MdEIN-like 3: MD11G1022400)
    1138.6–40.6Senescence-related gene 1 (MD11G1271400, MD11G1272300, MD11G1272000, MD11G1272100, MD11G1272300, MD11G1272400, and MD11G1272500); Chalcone-flavanone isomerase (CHI) protein (MD11G1273600) and MdbHLH3 (MD11G1286900, MDP0000225680); cytochrome P450 enzyme (MD11G1274000, MD11G1274100, MD11G1274200, MD11G1274300, MD11G1274500, and MD11G1274600); heat shock transcription factor A6B (MdHSFA6B: MD11G1278900) – involved in ABA-mediated heat response and flavonoid biosynthesis.
    122.2–3.5heat shock protein 70-1 ((MD12G1025600, MD12G1025700 and MD12G1026300) and heat shock protein 70 (MD12G1025800 and MD12G1025900 and MD12G1026000); ethylene (MD12G1032000) and auxin-responsive (MD12G1027600) proteins.
    127.2–8.4DNAJ heat shock domain-containing protein (MD12G1065200 and MD12G1067400)
    1327.5–30.5MD13G1257800 involved in polyphenol 4-coumarate:CoA ligase (4CL)
    1337.5–39.5pectin methyl esterase inhibitor superfamily protein MdPMEI (MD13G1278600)
    1425.4–27.5Drought-stress response gene MdWRKY45 (MD14G1154500); chalcone synthase (CHS) family proteins (MD14G1160800 and MD14G1160900); triterpene biosynthesis transcription factor MdMYB66 (MD14G1180700, MD14G1181000, MD14G1180900); anthocyanin biosynthesis protein (MdMYB86: MD14G1172900); cytochrome P450 proteins (MD14G1169000, MD14G1169200, MD14G1169600, MD14G1169700)
    150–1.5Ethylene synthesis proteins (MD15G1020100, MD15G1020300 and MD15G1020500); dihydroflavonol reductase (DFR) gene (MD15G1024100)
    154.6–6.8MdMYB73 (MD15G1076600, MD15G1088000) modulates malate transportation/accumulation via interaction with MdMYB1/10; MdNAC52: MD15G1079400) regulates anthocyanin/PA; heat shock transcription factor B4 (MD15G1080700); stress-response protein MdWRKY7 (MD15G1078200)
    1553.5–54.9MdC3H (MD15G1436500) involved in chlorogenic acid biosynthesis; MdEIN3 (MD15G1441000) involved in regulating ethylene synthesis and anthocyanin accumulation
    168.9–10.9SAUR-like auxin-responsive protein (MD16G1124300) and MdNAC83: (MD16G1125800) associated with fruit ripening; MD16G1140800 regulates proanthocyanidin; MdPAE genes (MD16G1132100, MD16G1140500) regulates ethylene production.
     | Show Table
    DownLoad: CSV

    The ethylene-responsive factor 13 (MdERF13: MD02G1213600) resided within the significant region (21.9–23.5 Mb) on Chr2, while the ascorbate peroxidase 3 (MdAPX3: MD02G1127800, MD02G1132200) resided in the prominent region between 9.45 and 11.28 Mb) (Fig. 3, Table 1). There were several genomic regions showing association with FBD on Chr3. The first region (8.2–9.5 Mb) flanked MdAPX1 (MD03G1108200, MD03G1108300), while MdERF3 (MD03G1194300) and heat shock protein 70 (HSP70: MD03G1201800, D03G1201700) resided within the prominent peak region (25.5–27.5 Mb). Another significant region (36.5–37.5 Mb) at the bottom on Chr3 harboured ethylene response sensor 1 (MdERS1: MD03G1292200), a flavonoid-biosynthesis related protein MdMYB12 (MD03G1297100), HSP DnaJ and pectin methyl esterase (PME) inhibitor proteins (Fig. 3, Table 1).

    The significant G' region (27.6–29.6 Mb) on Chr4 flanked the genes MD04G1188000 and MD04G1188400 involved in the biosynthesis of hydroxycinnamoyl CoA shikimate/quinate hydroxycinnamoyl transferase (HCT/HQT), while the adjacent region (22.1–24.3 Mb) harboured a cluster of UDP-glucosyltransferase (UGT) proteins and HSP (Table 1). Another region between 11.0 and 13.0 Mb encompassed phenylalanine and lignin biosynthesis gene MYB85 (MD04G1080600)[17]. The only significant region associated with FBD on Chr6 spanned between 29.8 and 31.7 Mb, which included a SNP earlier reported associated with FBD[4]. This region also harboured several MYB proteins (MdMYB86: MD06G1167200; MdMYB98: MD06G1172900; MdMYB66: MD06G1174200) and a large cluster of cytochrome P450 proteins (Table 1).

    A significant FBD-associated region (13.9–15.9 Mb) on Chr7 encompassed the HSP 70B (MD07G1116300), while another significant region between 23.6 Mb and 25.2 Mb flanked the gene coding for phenylalanine ammonia lyase 2 (MdPAL2: MD07G1172700), a drought stress gene NGA1 (MD07G1162400), DNAJ HSP, and stress-response protein (MdNAC69: MD07G1163700, MD07G1164000) (Fig. 3, Table 1). A large significant region spanning between 7.9 and 11.8 Mb on Chr9 encompassed the gene MD09G1110500 putatively involved in ascorbate oxidase (AO), HSP (HSP70: MD09G1137300; HSP89.1: MD09G1122200), an ethylene-forming enzyme (MD09G1114800), and MdNAC42 (MD09G1147500, MD09G1147600). Another significant genomic region on Chr9 was between 14.9 and 16.5 Mb, which harbours the MYB domain protein MdMYB66 (MD09G1183800) (Table 1).

    A sharp G' peak region (1.7–3.0 Mb) on Chr11 associated with FBD encompassed ethylene insensitive 3 (MdEIN3: MD11G1022400) along with a cluster of UGT proteins, WD-40, and bHLHL proteins (Table 1). A significant region between 38.6 and 40.6 Mb at the bottom of Chr11 was dominated by clusters of senescence-related genes and cytochrome P450 enzymes. This genomic region also flanked a chalcone-flavanone isomerase (CHI) family protein (MD11G1273600) and a bHLH protein (MdbHLH3: MD11G1286900, MDP0000225680), along with the heat shock transcription factor A6B (HSFA6B: MD11G1278900) (Table 1, Supplemental Table S3).

    The region (2.2–3.3 Mb) associated with FBD on Chr12 flanked genes for the HSP 70 and 70-1, NAC proteins, ethylene and auxin-responsive proteins (Table 1). An adjacent significant region (7.2–8.4 Mb) flanked DNAJ HSP, along with bZIP, bHLH and WD-40 repeat-like proteins (Table 1; Supplemental Table S3). There was a large genomic region on Chr13 showing a significant association with FBD. In this region, the first G' peak (27.5–30.5 Mb) harboured MD13G1257800, which regulates polyphenol 4-coumarate: CoA ligase (4CL) synthesis. The second G' peak region (32.6–34.7 Mb) corresponded to an earlier mapped QTL for flesh browning in white-fleshed apples[18].

    The significant region (25.4–27.5 Mb) on Chr14 harboured various genes for proteins with different putative functions, such as AP2 proteins, WD-40 repeat family proteins, bHLH proteins, MdNAC83 (MD14G1150900), MdWRKY45 (MD14G1154500), chalcone synthase (CHS) family proteins (MD14G1160800 and MD14G1160900), cytochrome P450 proteins, and several MYB domain proteins (MdMYB86: MD14G1172900; MdMYB98: MD14G1179000; MdMYB66: MD14G1180700, MD14G1181000, MD14G1180900) (Fig. 3, Table 1, Supplemental Table S3). A sharp G' peak (15.2–17.2 Mb) on Chr14 did not meet the significance threshold corresponding to the FBD QTL in white-fleshed apples[18].

    The upper 1.5 Mb region on Chr15 associated with FBD encompassed several transcription factor families, including WD-40 repeats, bHLH, bZIP, ethylene synthesis proteins, and dihydroflavonol reductase (DFR) protein (MD15G1024100) (Fig. 3, Table 1; Supplemental Table S3). Another significant region on Chr15 (4.6−6.8 Mb) harboured HSF B4, MdMYB73 (which interacts with MdMYB1/10 to modulate malate transportation) and MdNAC52 (MD15G1079400), which regulates anthocyanin and PA synthesis by directly regulating MdLAR[19]. A significantly associated region at the bottom of Chr15 (53.5–54.9 Mb) harboured MdNAC35 (MD15G1444700), MdC3H (MD15G1436500) involved in the production of p-coumarate 3-hydroxylase (C3H) enzyme, which plays a role in chlorogenic acid biosynthesis, and MdEIN3 (MD15G1441000).

    The significant region between 8.9 and 10.9 Mb on Chr16 harboured a gene for SAUR-like auxin-responsive protein (MD16G1124300) and MdNAC83 (MD16G1125800), both of which have been reportedly associated with apple fruit ripening[20]. This region also encompassed MD16G1140800, which regulates PA[11], and a gene for the pectin acetyl esterase protein MdPAE10 (MD16G1132100) involved in ethylene production and shelf-life[21]. A sharp G' peak region (20.4–22.4 Mb) in the middle of Chr16 flanked MdERF1B (MD16G1216900) and MdMYB15 (MD16G1218000 and MD16G1218900), involved in altering anthocyanin and PA concentrations[10] (Fig. 3, Table 1, Supplemental Table S3).

    The average sequencing depth of the SNP loci (~160,000) retained for marker-trait association was similar for the two WCI pools (41 vs 44). The significant regions were located on Chrs 2, 4, 6, 7, 10, 15 and 16 (Fig. 4). The genomic intervals within ±1.0 Mb of the significant G' peaks, and the putative candidate genes within those intervals, are listed in Table 2. Additional genomic regions, which did not meet the significance threshold but displayed distinct G' peaks, were also identified across most chromosomes ( Supplemental Fig. S2, Supplemental Table S3). A significant region on Chr4 encompassed chalcone synthase (CHS) genes, along with an ERF (MD04G1009000) involved in regulating PA biosynthesis[11].

    Figure 4.  G’-statistics across the linkage groups (LG) showing significant association with the weighted cortex intensity (WCI) in apple. The horizontal red lines indicate the significance threshold. The putative candidate genes (refer to Table 2) underpinning various G' peaks are also shown.
    Table 2.  A list of the genomic regions significantly associated with the weighted cortex intensity (WCI) in apples. Putative candidate genes residing within these regions are also listed using GDDH13v1.1 reference genome assembly.
    ChrGenomic region (Mb)Putative genes functions
    211.2–13.2UDP-glucosyltransferase (UGT) proteins (MD02G1153000, MD02G1153100, MD02G1153200, MD02G1153300; MD02G1153400; MD02G1153500; MD02G1153700; MD02G1153800; MD02G1153900);
    40–1.2Chalcone synthase (CHS) genes (MD04G1003000; MD04G1003300 and MD04G1003400); DNAJ heat shock protein (MD04G1003500); MdERF (MD04G1009000) involved in regulating PA biosynthesis.
    69.5–11.0Ubiquitin protein (MD06G1061100); stress-response WRKY protein MdWRKY21 (MD06G1062800);
    612.1–13.6pectin methylesterase inhibitor superfamily protein (MdPME: MD06G1064700); phenylalanine and lignin biosynthesis gene (MdMYB85)
    616.0–17.6MD06G1071600 (MDP0000360447) involved in leucoanthocyanidin dioxygenase (LDOX) synthesis
    624.0–26.0UDP-glycosyltransferase proteins (MD06G1103300, MD06G1103400, MD06G1103500 and MD06G1103600); auxin response factor 9 (MdARF9: MD06G1111100) and heat shock protein 70 (Hsp 70; MD06G1113000).
    74.1–5.6Ethylene insensitive 3 protein (MdEIN3: MD07G1053500 and MD07G1053800) involved in proanthocyanidins (PA) biosynthesis; ubiquitin-specific protease (MD07G1051000, MD07G1051100, MD07G1051200, MD07G1051500, MD07G1051300, MD07G1051700 and MD07G1051800).
    1015.9–18.3bHLH proteins (MD10G1098900, MD10G1104300, and MD10G1104600); UGT protein (MD10G1101200); UGT 74D1 (MD10G1110800), UGT 74F1 (MD10G1111100), UGT 74F2 (MD10G1111000).
    1035.6–38.6Stress-response WRKY proteins (MdWRKY28: MD10G1266400; MdWRKY65: MD10G1275800). ethylene responsive factors (MdERF2: MD10G1286300; MdERF4: MD10G1290400, and MdERF12: MD10G1290900) and a NAC domain protein (MdNAC73: MD10G1288300); polyphenol oxidase (PPO) genes ((MD10G1298200; MD10G1298300; MD10G1298400; MD10G1298500; MD10G1298700; MD10G1299100; MD10G1299300; MD10G1299400).
    1524.8–26.8heat shock factor 4 (MD15G1283700), drought-stress response WRKY protein 7 (MdWRKY7: MD15G1287300), MdMYB73 (MD15G1288600) involved in ubiquitination and malate synthesis
    1531.7–34.2MYB domain protein 93 (MdMYB93: MD15G1323500) regulates flavonoids and suberin accumulation (Legay et al. 2016); ubiquitin -specific protease 3 (MD15G1318500),
    161.5–3.4MYB domain proteins (MD16G1029400) regulates anthocyanin; senescence-associated gene 12 (MD16G1031600); ethylene response factor proteins (MdERF118: MD16G1043500, and MD16G1047700 (MdRAV1); MdMYB62 ( MD16G1040800) flavonol regulation; malate transporter MdMa2 (MD16G1045000: MDP0000244249), Ubiquitin-like superfamily protein (MD16G1036000),
    165.4–7.4MdMYB88 (MD16G1076100) regulates phenylpropanoid synthesis and ABA-mediated anthocyanin biosynthesis; MdMYB66 (MD16G1093200) regulates triterpene biosynthesis, MdWRKY72 (MD16G1077700) mediates ultraviolet B-induced anthocyanin synthesis.
     | Show Table
    DownLoad: CSV

    There were distinct G' peaks within a large genomic region (spanning between 9.0 and 18.0 Mb) significantly associated with WCI on Chr6 (Fig. 4). The G' peak region 12.1–13.6 Mb encompassed MdMYB85 (MD06G1064300), and a gene for a pectin methyl esterase

    (PME) inhibitor protein (MD06G1064700); while the region between 16.0 and 17.6 Mb flanked the genes involved in leucoanthocyanidin dioxygenase (LDOX) synthesis (Table 2). The auxin response factor 9 (MdARF9: MD06G1111100) and the HSP70 (MD06G1113000) resided in the significant region between 24.0 and 26.0 Mb on Chr6 (Table 2).

    The genomic region (4.1–5.6 Mb) with significant association with WCI on Chr7 flanked MdEIN3 (MD07G1053500, MD07G1053800), which plays an important role in the regulatory network of PA biosynthesis[11]. A significant region (35.6–38.7 Mb) on Chr10 encompassed gene clusters for bHLH and WRKY proteins along with an ethylene repressor factor (MdERF2: MD10G1286300) (Fig. 4, Table 2; Supplemental Table S3). This region also harboured MdERF4 (MD10G1290400), MdERF12 (MD10G1290900) and NAC domain genes (MdNAC73: MD10G1288300), which have been reported to be associated with fruit ripening[20]. In addition, there was a cluster of polyphenol oxidase (PPO) genes residing in this region (Table 2).

    On Chr15, the significant WCI-associated region spanning between 31.7 Mb and 34.2 Mb encompassed several TF families, including MdMYB93 (MD15G1323500) (Fig. 4, Table 2, Supplemental Table S3). A distinguished G' peak region (24.9–26.9 Mb) on Chr15 harboured genes for WD-40 repeat-like proteins, bHLH proteins, redox responsive transcription factor 1 (MD15G1283200), cytochrome P450 proteins, HSF4 (MD15G1283700), and MdWRKY7 (MD15G1287300). The MdMYB73 (MD15G1288600) residing in this region has been shown to interact with MdMYB1/10 and regulates several functions, including cold-stress response, ubiquitination and malate synthesis[22, 23].

    The significant 1.5–3.4 Mb region on Chr16 flanked an anthocyanin repressor MYB protein (MD16G1029400), senescence-associated gene 12 (MD16G1031600), malate transporter MdMa2 (MD16G1045000: MDP0000244249), and two ethylene response factor genes (MdERF118: MD16G1043500; MdRAV1: MD16G1047700), which interact in retaining flesh firmness[24]. The MdMYB62 (MD16G1040800) gene residing in this region is phylogenetically linked to MdMYB8 (MD06G1217200), which plays a major role in flavonoid biosynthesis[25]. Another significant region (5.4–7.4 Mb) on Chr16 harboured several bHLH genes, including MdMYB88 (MD16G1076100) involved in phenylpropanoid synthesis resulting in drought resistance[26] and ABA-mediated anthocyanin production[27]. The MdMYB66 (MD16G1093200) gene, which is involved in triterpene biosynthesis, and the MdWRKY72 (MD16G1077700) gene involved in anthocyanin synthesis, were also present in this region (Table 2, Fig. 4).

    The genomic regions tagged by XP-GWAS were enriched for regulatory functions, and several of these have a paralog (Table 3). For example, paralogues for a trio of genes (MdMYB86, MdMYB98 and Cytochrome 450) resided in the FBD-associated genomic regions on Chr6 and Chr14. Several pairs of genes resided together in the FBD-associated paralog regions; for example, MdNAC90 and germin-like protein 10 on Chr3 and Chr11; WRKY55 and WRKY70 on Chr1 and Chr7; and ERF1 and ERF5 on Chr4 and Chr6. The ethylene response factor MdERF1B had a paralog in the FBD-associated region on Chr13 and Chr16. Interestingly, three copies of MdNAC83 (Chrs 14, 16 17) and four copies of MdMYB66 (Chrs 4, 6, 9 and 14) resided in the FBD-associated regions. A pair of genes (RAV1 and MYB62) resided together in the WCI-associated paralog regions on Chrs13 and 16 (Table 3).

    Table 3.  A list of homologues genes/genomic regions associated with the internal flesh browning disorder (IFBD) and red flesh (WCI) in apples. Putative candidate genes residing within these regions are also listed using GDDH13v1.1 reference genome assembly.
    TraitChr (genomic region: Mb)Gene namePredicted gene IDPutative function
    IFBDChr6 (29.8–31.7 Mb)MdMYB66MD06G1174200Suberin/triterpene deposition
    IFBDChr14 (25.4–27.5 Mb)MdMYB66MD14G1180700, MD14G1181000, MD14G1180900Suberin/triterpene deposition
    IFBDChr4 (7.0–8.1 Mb)MdMYB66MD04G1060200Suberin/triterpene deposition
    IFBDChr9 (14.9–16.5 Mb)MdMYB66MD09G1183800Suberin/triterpene deposition
    IFBDChr6 (29.8–31.7 Mb)MdMYB86MD06G1167200Anthocyanin regulation
    IFBDChr14 (25.4–27.5 Mb)MdMYB86MD14G1172900Anthocyanin regulation
    IFBDChr6 (29.8–31.7 Mb)MdMYB98MD06G1172900Drought stress response
    IFBDChr14 (25.4–27.5 Mb)MdMYB98MD14G1179000Drought stress response
    IFBDChr6 (29.8–31.7 Mb)Cytochrome P450MD06G1162600, MD06G1162700, MD06G1162800, MD06G1163100, MD06G1163300, MD06G1163400, MD06G1163500, MD06G1163600, MD06G1163800, MD06G1164000, MD06G1164100, MD06G1164300, MD06G1164400, MD06G1164500, MD06G1164700Flavonoid and triterpenic metabolism
    IFBDChr14 (25.4–27.5 Mb)Cytochrome P450MD14G1169000, MD14G1169200, MD14G1169600, MD14G1169700Flavonoid and triterpenic metabolism
    IFBDChr3 (14.7–16.6 Mb)MdNAC90MD03G1148500Senescence-related
    IFBDChr11 (16.5–18.5 Mb)MdNAC90MD11G11679000Senescence-related
    IFBDChr14 (25.4–27.5 Mb)MdNAC83MD14G1150900Senescence/ripening-related
    IFBDChr16 (8.9–10.9 Mb)MdNAC83MD16G1125800Senescence/ripening-related
    IFBDChr17 (0–0. 7 Mb)MdNAC83MD17G1010300Senescence/ripening-related
    IFBDChr3 (14.7–16.6 Mb)Germin-like protein 10MD03G1148000Polyphenol oxidase
    IFBDChr11 (16.5–18.5 Mb)Germin-like protein 10MD11G1167000, MD11G1167100, MD11G1167400, MD11G1169200Polyphenol oxidase
    IFBDChr1 (26.9–28.5 Mb)MdWRKY55MD01G1168500Drought stress response
    IFBDChr7 (30.3–31.9 Mb)MdWRKY55MD07G1234600Drought stress response
    IFBDChr1 (26.9–28.5 Mb)MdWRKY70MD01G1168600Drought stress response
    IFBDChr7 (30.3–31.9 Mb)MdWRKY70MD07G1234700Drought stress response
    IFBDChr4 (7.0–8.1 Mb)MdERF1MD04G1058000Ethylene responsive factor
    IFBDChr6 (5.5–7.3 Mb)MdERF1MD06G1051800Ethylene responsive factor
    IFBDChr4 (7.0–8.1 Mb)MdERF5MD04G1058200Ethylene responsive factor
    IFBDChr6 (5.5–7.3 Mb)MdERF5MD06G1051900Ethylene responsive factor
    IFBDChr13 (18.0–20.0 Mb)MdERF1BMD13G1213100Ethylene response factor 1
    IFBDChr16 (20.4–22.4 Mb)MdERF1BMD16G1216900Ethylene response factor 1
    WCIChr13 (2.6–4.4 Mb)MdRAV1MD13G1046100Ethylene responsive factor
    WCIChr16 (1.5–3.4 Mb)MdRAV1MD16G1047700Ethylene responsive factor
    WCIChr13 (2.6–4.4 Mb)MdMYB62MD13G1039900Flavonol biosynthesis
    WCIChr16 (1.5–3.4 Mb)MdMYB62MD16G1040800Flavonol biosynthesis
    IFBDChr9 (7.9–11.8 Mb)MdNAC42MD09G1147500, MD09G1147600Anthocyanin accumulation
    WCIChr17 (11.4–12.4 Mb)MdNAC42MD17G1134400Anthocyanin accumulation
    IFBDChr9 (7.9–11.8 Mb)HSP 70MD09G1137300Heat stress response
    WCIChr17 (11.4–12.4 Mb)HSP 70MD17G1127600Heat stress response
    IFBDChr4 (11.0–13.0 Mb)MdMYB85MD04G1080600Phenylalanine and lignin biosynthesis
    WCIChr6 (12.1–13.6 Mb)MdMYB85MD06G1064300Phenylalanine and lignin biosynthesis
    IFBDChr15 (13.2–14.2 Mb)MdEBF1MD15G1171800Ethylene inhibition
    WCIChr8 (15.2–17.2 Mb)MdEBF1MD08G1150200Ethylene inhibition
    IFBDChr15 (53.5–54.9 Mb)MdEIN3MD15G1441000Ethylene insensitive 3 protein
    WCIChr8 (30.3–31.6 Mb)MdEIN3MD08G1245800Ethylene insensitive 3 protein
    IFBDChr11 (1.7–3.0 Mb)MdEIN3MD11G1022400Ethylene insensitive 3 protein
    WCIChr7 (4.1–5.6 Mb)MdEIN3MD07G1053500, MD07G1053800Ethylene insensitive 3 protein
    IFBDChr15 (4.6–6.8 Mb)MdMYB73MD15G1076600, MD15G1088000Cold-stress response & malate accumulation
    WCIChr15 (24.8–26.8 Mb)MdMYB73MD15G1288600Cold-stress response & malate accumulation
    IFBDChr15 (4.6–6.8M b)MdWRKY7MD15G1078200Anthocyanin accumulation
    WCIChr15 (24.8–26.8 Mb)MdWRKY7MD15G1287300Anthocyanin accumulation
    IFBDChr15 (43.5–45.5 Mb)MdMYB93MD15G1369700Flavonoid & suberin accumulation
    WCIChr15 (31.7–34.2 Mb)MdMYB93MD15G1323500Flavonoid & suberin accumulation
     | Show Table
    DownLoad: CSV

    Paralogs of several regulatory functions were also found in the regions associated with either FBD or WCI; for example, a significant region (7.9–11.8 Mb) harbouring a gene trio (MdNAC42, HSP70 and HSP89.1) on Chr9 was associated with FBD, but the paralogs of this trio also resided in a distinct G' region associated with WCI on Chr17 (Table 3, Supplemental Table S3). Some other examples included MdMYB85 (Chr4 for FBD, and Chr6 for WCI), MdEBF1 (Chr8 for WCI, and Chr15 for FBD), MdEIN3 (Chr8 for WCI, and Chr15 for FBD), and EIN3 (Chr7 for WCI, and Chr11 for FBD). A pair of genes (MdMYB73 and MdWRKY7) resided together in the separate regions associated with FBD (4.6–6.8 Mb) and WCI (24.8–26.8 Mb) within Chr15 (Table 3).

    The red pigmentation in fruit flesh differed amongst transgenic lines, with fruit from line A10 presenting the most deeply pigmented tissues (Supplemental Fig. S3), while those from lines A2 and A4 were similar in having a lower intensity of pigmentation. No pigmentation was observed in the flesh of control 'Royal Gala' (RG) fruit. RNAseq analysis of a representative transgenic line (A2) compared with RG revealed that a total of 1,379 genes were differentially expressed (log 2-fold), with 658 genes upregulated and 721 genes downregulated. This list was then assessed for commonality with the genomic regions and candidate genes from the XP-GWAS.

    Genes that contained mis-sense SNPs (which would result in a change in predicted protein) and that were also differentially expressed between A2 red-fleshed transgenic line and white-fleshed 'Royal Gala' (control) apples included anthocyanin-related flavanone 3-hydroxylase, chalcone synthase and dihydroflavonol 4-reductase (Table 2 & 4). Many more upstream DNA variants (e.g. in potential promoter-controlling elements) were seen in this group of differentially expressed genes (DEGs) that were also in regions underlying WCI or FBD. Genes encoding enzymes that may be involved in FBD, such as a Rho GTPase activating protein, peroxidase, lipoxygenase 1, and ethylene-forming enzyme (ACO4), were DEGs and showed mis-sense SNPs, including a potential stop codon in the Rho GTPase-activating protein (Table 4). This intersection between DNA change and differential expression warrants further research to evaluate the functions of these genes.

    Table 4.  List of candidate genes associated with WCI or FBD in the XP-GWA and R6:MdMYB10 apple datasets.
    Mutations in GWAS apple populationPredicted gene functionExpression in R6 and ‘Royal Gala’ apples
    GeneMissense
    SNPs
    SNP
    Stop
    Upstream
    variants
    DatasetLocusAnnotation and TAIR IDAverage
    RPKM
    R6 flesh
    Average RPKM
    WT flesh
    log2Fold
    Change
    MD02G11322001FBD Supplemental Table S3Chr02:9450615-11289014flavanone 3-hydroxylase
    (F3H, TT6, F3'H) AT3G51240
    387752.47
    MD02G11336003FBD Supplemental Table S3Chr02:9450615-11289014fatty acid desaturase 5
    (FAD5) AT3G15850
    18109.98
    MD02G11537001WCI Table 2Chr02:11278254-13234556UDP-Glycosyltransferase, lignin related AT2G1856010385341.03
    MD03G10592002FBD Supplemental Table S3Chr03:3177994-4910866Peroxidase AT5G053402514.21
    MD03G1143300422FBD Table 1Chr03:14797661-16611554bZIP transcription factor (DPBF2, AtbZIP67) AT3G44460114852-2.80
    MD03G1147700121FBD Table 1Chr03:14797661-16611554Rho GTPase activating protein AT5G22400205891.29
    MD04G1003400331WCI Table 2Chr04:1-1284894Chalcone synthase (CHS, TT4) AT5G1393014433122.34
    MD04G120410063FBD Table 1Chr04:27629536-29612282lipoxygenase 1 (LOX1, ATLOX1) AT1G550205462681.09
    MD06G1160700129FBD Table 1Chr06:29862341-31737341peptide met sulfoxide reductase AT4G251302121254562.04
    MD06G116140014FBD Table 1Chr06:29862341-31737341Pectin lyase-like protein AT5G63180614129530-2.22
    MD07G1240700126FBD Supplemental Table S3Chr07:30357332-31979025Fe superoxide dismutase 2 AT5G511001051826-3.99
    MD07G13069006FBD Supplemental Table S3Chr07:34607570-36531467UDP-glucosyl transferase 78D2 AT5G170506771112.78
    MD08G12491002WCI Supplemental Table S3Chr08:30486569-31607516HSP20-like chaperone (ATHSP22.0) AT4G102503186456.12
    MD09G111400032FBD Table 1Chr09:7999212-11883202fatty acid desaturase 5 (FAD5) AT3G158507608.68
    MD09G11468001FBD Table 1Chr09:7999212-11883202PHYTOENE SYNTHASE (PSY) AT5G1723038456160901.32
    MD10G132810045FBD Supplemental Table S3Chr10:40235258-41736791ethylene-forming enzyme (ACO4) AT1G050108769033910331.21
    MD15G10236001FBD Table 1Chr15:1-1487288jasmonic acid carboxyl methyltransferase (JMT) AT1G19640472111552.07
    MD15G10241008FBD Table 1Chr15:1-1487288dihydroflavonol 4-reductase (DFR, TT3, M318) AT5G428008723091.63
    MD17G11334004WCI Supplemental Table S3Chr17:11422073-12433463PHYTOENE SYNTHASE (PSY) AT5G172306001721.87
    MD17G12606002FBD Supplemental Table S3Chr17:31098955-32776972dehydroascorbate reductase 1 (DHAR3) AT5G167101867−1.78
     | Show Table
    DownLoad: CSV

    Several gene families (e.g. chalcone synthase, UGT, anthocyanin synthase, HSP, PAL, ERF, WRKY proteins, ABA, and bZIP transcription factors) residing in WCI-associated genomic regions have been reported to be associated with RF in apple[7, 12, 28]. Several of these genes are implicated in stress responses, suggesting that flavonoids and anthocyanin biosynthesis could also be associated with stress (e.g., drought, water loss) tolerance of RF apples[7].

    MdMYB73, which may play a role in the cold-stress response[23, 29], resided in the WCI-associated regions. Ethylene is among the various modulators of environmental stresses induced by factors such as drought and cold temperatures[9, 28]. Several ERF proteins (e.g. MdERF1B, MdERF3) interact with the promoters of MYB domain proteins to regulate anthocyanin and proanthocyanidin (PA) accumulation in apple[10, 11, 30]. The WCI-associated genomic regions in our study flanked several ERFs previously reported to have roles in anthocyanin and PA regulation. MdERF4 (MD10G1290400), one of the three ERFs residing in the WCI-associated region on Chr10, has high phylogenetic similarity with MdERF38, which interacts with MdMYB1 to regulate drought-related anthocyanin biosynthesis[31]. Some ERFs (e.g. MdERF2: MD10G1286300; MdERF4: MD10G1290400, and MdERF12: MD10G1290900) and MdNAC73 residing in the WCI-associated regions have been reported to be associated with fruit maturation[20] – suggesting an interaction between ethylene production and RF colour[12].

    The WCI-associated region on Chr15 included a gene MdMYB73 (MD15G1288600) involved in malate acid synthesis. Previous studies have reported that MdMYB1 regulates both anthocyanin and malate accumulation, and perhaps MdBT2 regulates MdMYB73-mediated anthocyanin accumulation[22, 23]. The malate transporter gene MdMa2 and the MdMYB7 gene, involved in the regulation of anthocyanin and flavanols in RF apple[32], resided together in the WCI-associated upper region of LG16. Taken together, these results support the hypothesis that there is interplay between anthocyanin and malate accumulation in the RF apple. There was a cluster of ubiquitin-specific proteases underpinning the WCI-associated regions on Chrs 7 and 15, which is supported by earlier reports suggesting that ubiquitin-specific proteases respond to auxin and might suppress anthocyanin biosynthesis proteins[33]. The auxin response factor 9 (MdARF9: MD06G1111100), which has also been shown to suppress anthocyanin biosynthesis in RF callus samples[33], also resided in the WCI-associated genomic region on LG7.

    Seedlings in both the low- and high-FBD pools carried the MdMYB10 gene, which suggests that MdMYB10 itself is not the causal factor of FBD in RF apples. Long-term cold storage generally results in senescence-related flesh breakdown, and several transcription factor genes (e.g. MYB, WRKY, NAC, ERF, cytochrome P450, and HSP) have been shown to express differentially during long-term cold storage[9]. The FBD-associated genomic regions in our study harboured several ERFs, suggesting that ethylene synthesis proteins may be contributing to cell wall disassembly, allowing PPO enzymes to come into contact with phenolic compounds and potentially leading to FBD symptoms[18].

    Pectin methyl esterase (PME) genes resided in the FBD-associated significant regions on Chrs 3, 13 and 17. Volatile generation and senescence degradation have been suggested to be bio-markers of FBD, and the expression levels of methyl esters were found to be associated with FBD and senescence in 'Fuji' apples after cold storage[34]. The MdPME2 gene has also been reported to be associated with apple flesh firmness and mealiness[21, 35]. The co-location of genes encoding cell wall-degrading enzymes (MdPME) and QTLs for FBD has been reported in apple[18, 36].

    The clusters of cytochrome P450 enzymes and senescence-related genes resided in some of the FBD-associated regions in this study. There are no earlier reports of the involvement of P450 enzymes in apple FBD expression, but some genes related to cytochrome P450 were found to be upregulated during litchi fruit senescence[37]. Pericarp browning in litchi is mainly attributable to the degradation of anthocyanin, and the ABA-initiated oxidation of phenolic compounds by PPO[37]. Flavonoids are among the major polyphenols in RF apples[5], and cytochrome P450 is part of the regulatory mechanism for flavonoid metabolism[38]. Association of FBD with the genomic region harbouring P450 would suggest its role in enhanced polyphenol synthesis causing FBD. The co-occurrence of a senescence-related gene MdNAC90 (MD03G1148500; MD11G11679000) and the PPO regulator germin-like proteins (in the FBD-associated paralog regions on Chrs 3 and 11) lends support to an interplay between senescence and oxidation of phenolics and anthocyanins.

    A significant region on Chr9 encompassed a cluster of UGT proteins, which play a role in the regulation of flavonoids and phenolic compounds, as well as converting phloretin to phloridzin[39]. Cytochrome P450, which resided within several FBD-associated regions, is reportedly involved in flavonoid metabolism, such as chlorogenic acid (CGA) acid and phloridzin, which have also been positively associated with suberin production and cell wall disassembly[40, 41].

    Reactive oxygen species (ROS) play an important role in regulating physiological processes in plants, such as senescence[37]. Legay et al.[42] suggested that MdMYB93 (MD15G1369700), found residing in the FBD-associated regions in this study, plays a critical role in remobilisation of flavonoid/phenolic compounds, which can be utilised for detoxification of ROS in the case of oxidative stress. However, flavonoid biosynthesis has also been linked with suberin production causing cuticle cracks in apples[42, 43], and the development of cuticular cracks could accelerate flesh browning as a result of an enhanced oxidative process[44].

    Several HSP (e.g. HSP70, HSP70-1, HSP60, HSP89.1, and HSP DNAJ) and HSF (e.g. HSF4, HSFB4, HSFA6B) resided in the FBD-associated genomic regions. Ferguson et al.[45] showed that, during summer, apple flesh temperature could reach as high as 43 °C, and that an increase in the expression of HSP in apples was associated with high daily flesh temperatures, suggesting a role of HSP to counter heat stress. HSPs have been reported to interact with AP2/ERFs and to play a role in flavonoid biosynthesis and drought tolerance in apple[46]. Heat stress affects lignin accumulation and its substrate, O-phenols, and has been reported to play role in enzymatic browning[47]. Additionally, HSF that regulate HSP expression have also been reported to be regulated by cold stress to generate heat-induced cold tolerance in banana[48]. HSF1 was shown to transcriptionally regulate the promoters of HSP to enhance chilling tolerance in loquat fruit[49]. Activity of the enzymes (PAL, C4H, 4CL) of the phenylpropanoid pathway was positively correlated with loquat fruit lignification, whilst suppression of their expression by heat shock treatment and low-temperature conditioning significantly reduced fruit lignification[50].

    Wang et al.[7] showed that ascorbate peroxidase (APX) was among the genes that were upregulated in RF apple compared with in white-fleshed apples. Several genes (e.g. MdAPX1, MdAPX3, MdAPX4, and MdDHAR1) involved in ascorbate synthesis resided in the genomic regions associated with FBD. Co-localisation of MdDHAR and ascorbic acid (AsA) synthesis genes in the FBD-linked genomic regions have been reported[51], suggesting that the low AsA content increases fruit susceptibility to FBD[52]. It has been shown that the expression of MdMYB1 and MdDHAR genes was strongly correlated in RF apples, and that AO and APX were upregulated by anthocyanin regulatory genes[31].

    There were several genes associated with CGA biosynthesis residing in the FBD-associated regions on various linkage groups, including the genes MYB19 (MD07G1268000) and MdC3H (MD15G1436500). Higher concentrations of CGA were reported in transgenic apple lines carrying MdMYB10[12], suggesting a role of CGA metabolism in the expression of FBD[53]. Interestingly, some of the FBD-associated regions (e.g. Chrs 9, 11, 13, 14 and 17) reported here in RF apples coincide with those reported earlier for FBD in white-fleshed apples[18, 36, 53], suggesting some common underlying genetic mechanisms.

    As discussed above, ERFs have been reported to be involved in the accumulation of anthocyanin and PA biosynthesis, while ethylene synthesis proteins also contribute to cell membrane breakdown, allowing the PPO enzyme to come into contact with phenolic compounds, potentially leading to FBD symptoms[12, 18]. We observed clusters of anthocyanin biosynthesis proteins (bHLH), ERFs (MdERF2, MdERF4, MdERF12) and PPO genes together in the genomic region associated with WCI on Chr10. The co-occurrence of these gene families perhaps facilitates potential interactions that contribute to the genetic correlation between WCI and FBD. We noted that genes involved in flavonoid regulation and ethylene synthesis occurred together in the FBD-associated regions on several chromosomes (e.g. MD16G1140800 and MdPAE10: MD16G1132100; MdERF1B: MD16G1216900 and MdMYB15: MD16G1218000, MD16G1218900) – suggesting these genes could be in linkage disequilibrium and this would contribute to the expression of WCI and FBD.

    MYB7 (MD16G1029400) resided in the WCI-associated upper region of Chr16, and the expression level of MYB7 was shown to be correlated with that of LAR1 in peach fruit[54]. The MdLAR1 protein (MDP0000376284), which is located about 1.2 Mb upstream of MYB7 (MD16G1029400), was reported to be associated with WCI and FBD in apple[3]. Mellidou et al.[36] reported that 4CL (MD13G1257800 in the FBD-linked region on Chr13), which catalyses the last step of the phenylpropanoid pathway, leading either to lignin or to flavonoids, was upregulated in browning-affected flesh tissues. The gene MdMYB85, involved in the regulation of flavonoid and lignin biosynthesis, resided in the WCI-associated region on Chr6 and FBD-associated paralogous region on Chr4. Metabolic interactions between anthocyanin and lignin biosynthesis have been reported for apple[55] and strawberry[56], while flesh lignification and internal browning during low-temperature storage in a red-fleshed loquat cultivar was shown to be modulated by the interplay between ERF39 and MYB8[57].

    The co-localisation of MdMYB66 and cytochrome P450 proteins, along with the anthocyanin regulatory protein MdMYB86, in paralogous FBD-associated genomic regions on Chr6 and Chr14 suggests that these genes interact as a 'hub' contributing to the WCI-FBD genetic link. The paralogs of some other genes were found to be residing in the regions associated with either WCI or FBD. For example, MdNAC42 and HSP70 co-localised in the FBD-associated region on Chr9, but this same pair of genes also resided in the most prominent region associated with WCI on Chr17. Similarly, paralogs of MdEIN3 resided in the WCI-associated region on Chr7 (MD07G1053500, MD07G1053800) and FBD-associated region on Chr11 (MD11G1022400). Interestingly, the paralogs of MdMYB73 and MdWRKY7 co-localised in the WCI- (24.6–26.8 Mb) and FBD-associated (4.6–6.8 Mb) regions on Chr15. The WCI-associated region at the bottom of Chr11 hosted a cluster of senescence-related genes, along with the anthocyanin biosynthesis gene MdbHLH3 (MD11G1286900), suggesting they might interact in the genetic nexus between FBD and WCI.

    FBD in RF apples can be caused by senescence, injury via extreme temperature exposure (chilling or heat), or enzymatic (cut fruit) reaction. Genes reported to be connected to all three factors were located in various FBD-associated genomic regions in this study. Postharvest strategies that both delay senescence and limit exposure to low temperatures may be needed to manage FBD. We also hypothesise that high ascorbic acid content could help to minimise expression of FBD in Type-1 RF cultivars. The adverse genetic correlation between WCI and FBD appears to arise from dual and/or interactive roles of several transcription factors, which would pose challenges for designing a conventional marker-assisted selection strategy. The use of bivariate genomic BLUP to estimate breeding values to simultaneously improve adversely correlated polygenic traits (e.g. WCI and FBD), could be an alternative approach[58, 59].

    A population of 900 apple seedlings composed of 24 full-sib families was generated in 2011 by selected crossings between six red-leaved pollen parents and six white-fleshed female parents. All six pollen parents inherited their red-leaf phenotype from the same great-grandparent 'Redfield'[1]. Each pollen parent was involved in four crosses, and the female parents were involved in three to six crosses each. Foliage colour of young seedlings is a phenotypic marker for Type 1 RF apple. The main purpose of this trial was to understand the flesh colour variation and FBD in the Type 1 RF seedlings, so only the seedlings with red foliage (i.e. carrying MdMYB10) were kept for this trial. The number of seedlings per family varied from 10 to 95. The seedlings were grafted onto 'M9' rootstock and were planted in duplicate at the Plant & Food Research orchard in Hawke's Bay, New Zealand (39°39′ S, 176°53′ E) in 2015.

    Phenotyping for RF and FBD was conducted over two consecutive fruiting seasons (2017 and 2018). Fruit were harvested once, when judged mature, based on a change in skin background colour from green to yellow, and when the starch pattern index (SPI) was between 1.0 and 2.0 (on a scale of 0 to 7). In each season, six fruit were harvested from each plant and stored for 70 d at 0.5 °C, followed by 7 d at 20 °C before fruit evaluation. Fruit were cut in half across the equator and the proportion of the cortex area (PRA) that was red in colour, and the intensity of the red colour (RI) (= 1 (low) to 9 (high)) was scored. A weighted cortical intensity (WCI) was then calculated (PRA × RI) as an estimation of the amount of red pigment in the fruit. The proportion of the cortex area showing symptoms of FBD was also recorded. WCI and FBD were averaged over all fruit for a particular seedling. Fruit were also assessed for the following eating quality traits on a 1 (lowest) to 9 (highest) scale: firmness, crispness, juiciness, sweetness, sourness and astringency, to understand the genetic correlations of eating-quality traits with WCI and FBD.

    The binary vector pSA277-R6:MYB10 was transferred into Agrobacterium tumefaciens strain LAB4404 by electroporation. Transgenic 'Royal Gala' plants were generated by Agrobacterium-mediated transformation of leaf pieces, using a method previously reported[5]. Wild-type 'Royal Gala' and three independent transgenic lines (A2, A4 and A10) of R6:MdMYB10 were grown under glasshouse conditions in full potting mix with natural light. The resulting fruit were assessed for flesh colour phenotypes at harvest (around 135 d after full bloom). Fruit peel and cortex from three biological replicates were collected and frozen in liquid nitrogen, with each replicate compiled from five pooled mature fruit for each transgenic line or wild-type control.

    Total RNA of 36 samples (3 R6:MYB10 lines and 1 wild type control, 3 time points, 3 biological replicates) was extracted, using Spectrum Plant Total RNA Kit (SIGMA). Removal of genomic DNA contamination and first-strand cDNA synthesis were carried out using the mixture of oligo (dT) and random primers according to the manufacturer's instructions (QuantiTect Reverse Transcription Kit, Qiagen). Real-time qPCR DNA amplification and analysis was carried out using the LightCycler 480 Real-Time PCR System (Roche), with LightCycler 480 software version 1.5. The LightCycler 480 SYBR Green I Master Mix (Roche) was used following the manufacturer's method. The qPCR conditions were 5 min at 95 °C, followed by 45 cycles of 5 s at 95 °C, 5 s at 60°C, and 10 s at 72 °C, followed by 65 °C to 95 °C melting curve detection. The qPCR efficiency of each gene was obtained by analyzing the standard curve of a cDNA serial dilution of that gene. The expression was normalized to Malus × domestica elongation factor 1-alpha MdEF1α (XM_008367439) due to its consistent transcript levels throughout samples, with crossing threshold values changing by less than 2.

    Individual fruit measurements were first averaged for each seedling. As the phenotyping was repeated over two years, we used a mixed linear model (MLM) accounting for this 'permanent environmental effect', as previously described[58]. Pedigree-based additive genetic relationships among seedlings were taken into account for estimation of genetic parameters using ASReml software[60]. Product-moment correlations between best linear unbiased predictions (BLUP) of breeding values of all seedlings for different traits were used as estimates of genetic correlation among traits.

    A selective DNA pooling procedure was adopted to construct DNA pools. A high-pool and a low-pool were constructed separately for the two traits (WCI and FBD). Genomic DNA was extracted from the leaves of selected seedlings, and quantified by fluorimetry using the picogreen reagent (Cat#P11496, Thermo). The low and high pools consisted of 35 seedlings each, and normalised amounts (~300 ng) of DNA from individuals were pooled. The pools were dried down with DNA Stable reagent (Cat#93021001, Biomatrica) in a centrifugal evaporator and shipped for sequencing. Each DNA pool was sequenced using paired-end 125 bp reads on the Illumina HiSeq 2500 platform. The quality of raw sequence reads was checked with FastQC/0.11.2 and MultiQC/1.2. Based on the quality control reports, the reads were aligned to the published apple reference genome GDDH13 v1.1[61] using the program bowtie2/2.3.4.3[62] with trimming from both ends before alignments and aligning in full read length ("-5 6 -3 5 –end-to-end"). The mapping results were marked for duplicate alignments, sorted, compressed and indexed with samtools/1.12[63]. Based on the alignment of binary alignment map (BAM) files of the high and low pools, single nucleotide polymorphism (SNP) identification was performed using samtools/1.12 ('samtools mpileup') and bcftools/1.12 ('bcftools call –mv')[63, 64]. Variant sites with missing genotype in any of the pools, or having the same genotype between the pools, were discarded. To minimise the influence of sequencing quality on association analysis, the identified SNPs were further filtered according to the following criteria: 1) a Phred-scaled quality score > 20; and 2) the read depth in each pool was neither < 35, nor > 500.

    The allele frequencies between each pair of bulk DNAs (low versus high WCI; low versus high FBD) were compared at each SNP locus. Differences in the allele frequencies between the low and high pool were expected to be negligible for unlinked SNP markers, but allele frequency differences would be larger for SNPs closely linked to the underlying quantitative trait loci (QTLs) contributing to the extreme phenotypes. A nonparametric test (G-statistic = 2 × Σni ln(ni/nexp), where ni (i = 1 to 4) represented counts of reference and alternate alleles at a particular SNP generated from sequencing of the low and high pool, and nexp was the expected allele count assuming no allele frequency divergence between the two DNA pools[65].

    We then calculated a modified statistic (G'), which took into account read count variation caused by sampling of segregants as well as variability inherent in short-read sequencing of pooled samples[65]. Using R package QTLseqr[66], firstly a G-statistic was calculated for each SNP marker, and then a weighted average using Nadaraya-Watson kernel was obtained to yield a G' statistic for a sliding genomic window of 2 Mb size. The Nadaraya-Watson method weights neighbouring markers' G-values by their distance from the focal SNP so that closer SNPs receive higher weights. The 95th percentile value of G' was used as a threshold to identify significant hotspots and to identify the putative candidate genes residing within the ±1 Mb region around the G' peak. For comparison purposes, a standard two-sided Z-test[14] was also performed to determine the significance of allele frequency differences at SNP loci between the pools for each trait.

    The GDDH gene models intersecting with the XP-GWA hotspots were pulled out with bedtools/2.30.0 ("bedtools intersect -wo -nonamecheck"). The selected genes were further blasted to TAIR10 ("-evalue 1e-5") and the annotated functions from Arabidopsis genes with the best blast score, the highest % identity, and the longest aligned length, were used. Then the expressions of genes located in the GWA hotspots were extracted from the RNAseq analysis of the R6:MdMYB10 representative transgenic line, and the log 2-fold change between the R6:MdMYB10 and 'Royal Gala' apples were calculated.

    This research was funded in 2017/18 by the Strategic Science Investment Fund of the New Zealand Ministry of Business, Innovation and Employment (MBIE) and from 2019 by the Plant & Food Research Technology Development – Pipfruit programme. We thank our colleague Jason Johnston for providing some pictures of the flesh browning disorder in red-fleshed apples. Richard Volz and Jason Johnston provided constructive comments and suggestions on the manuscript.

  • The authors declare that they have no conflict of interest.

  • Supplemental Table S1 Details of primers used for gene isolation and qPCR analysis.
    Supplemental Table S2 Details of genes present in the VviSOC1a association gene network.
    Supplemental Fig. S1 GO enrichment analysis of genes associated with VviSOC1a.
    Supplemental Fig. S2 VviSOC1a gene expression profile.
    Supplemental Fig. S3 Expression profile of VviSOC1a and associated genes.
    Supplemental Fig. S4 Transgene expression analysis of VviSOC1a in tomato lines.
    Supplemental Fig. S5 Sepal length data for VviSOC1a transgenic tomato lines.
  • [1]

    Srikanth A, Schmid M. 2011. Regulation of flowering time: all roads lead to Rome. Cellular and Molecular Life Sciences 68:2013−37

    doi: 10.1007/s00018-011-0673-y

    CrossRef   Google Scholar

    [2]

    Lee J, Lee I. 2010. Regulation and function of SOC1, a flowering pathway integrator. Journal of Experimental Botany 61:2247−54

    doi: 10.1093/jxb/erq098

    CrossRef   Google Scholar

    [3]

    Moon J, Lee H, Kim M, Lee I. 2005. Analysis of flowering pathway integrators in Arabidopsis. Plant and Cell Physiology 46:292−99

    doi: 10.1093/pcp/pci024

    CrossRef   Google Scholar

    [4]

    Borner R, Kampmann G, Chandler J, Gleißner R, Wisman E, et al. 2000. A MADS domain gene involved in the transition to flowering in Arabidopsis. The Plant Journal 24:591−99

    doi: 10.1046/j.1365-313x.2000.00906.x

    CrossRef   Google Scholar

    [5]

    Ding L, Wang Y, Yu H. 2013. Overexpression of DOSOC1, an ortholog of Arabidopsis SOC1, promotes flowering in the orchid Dendrobium Chao Parya Smile. Plant and Cell Physiology 54:595−608

    doi: 10.1093/pcp/pct026

    CrossRef   Google Scholar

    [6]

    Lei H, Yuan H, Liu Y, Guo X, Liao X, et al. 2013. Identification and characterization of FaSOC1, a homolog of SUPPRESSOR OF OVEREXPRESSION OF CONSTANS1 from strawberry. Gene 531:158−67

    doi: 10.1016/j.gene.2013.09.036

    CrossRef   Google Scholar

    [7]

    Zhang X, Wei J, Fan S, Song M, Pang C, Wei H, et al. 2016. Functional characterization of GhSOC1 and GhMADS42 homologs from upland cotton (Gossypium hirsutum L.). Plant Science 242:178−86

    doi: 10.1016/j.plantsci.2015.05.001

    CrossRef   Google Scholar

    [8]

    Jaudal M, Zhang L, Che C, Li G, Tang Y, et al. 2018. A SOC1-like gene MtSOC1a promotes flowering and primary stem elongation in Medicago. Journal of Experimental Botany 69:4867−80

    doi: 10.1093/jxb/ery284

    CrossRef   Google Scholar

    [9]

    Li D, Liu C, Shen L, Wu Y, Chen H, et al. 2008. A repressor complex governs the integration of flowering signals in Arabidopsis. Developmental Cell 15:110−20

    doi: 10.1016/j.devcel.2008.05.002

    CrossRef   Google Scholar

    [10]

    Yoo SK, Chung KS, Kim J, Lee JH, Hong SM, et al. 2005. CONSTANS activates SUPPRESSOR OF OVEREXPRESSION OF CONSTANS 1 through FLOWERING LOCUS T to promote flowering in Arabidopsis. Plant Physiology 139:770−78

    doi: 10.1104/pp.105.066928

    CrossRef   Google Scholar

    [11]

    Lee J, Oh M, Park H, Lee I. 2008. SOC1 translocated to the nucleus by interaction with AGL24 directly regulates LEAFY. The Plant Journal 55:832−43

    doi: 10.1111/j.1365-313X.2008.03552.x

    CrossRef   Google Scholar

    [12]

    Liu C, Chen H, Er HL, Soo HM, Kumar PP, et al. 2008. Direct interaction of AGL24 and SOC1 integrates flowering signals in Arabidopsis. Development 135:1481−91

    doi: 10.1242/dev.020255

    CrossRef   Google Scholar

    [13]

    Liu C, Xi W, Shen L, Tan C, Yu H. 2009. Regulation of floral patterning by flowering time genes. Developmental Cell 16:711−22

    doi: 10.1016/j.devcel.2009.03.011

    CrossRef   Google Scholar

    [14]

    Coen ES, Meyerowitz EM. 1991. The war of the whorls: genetic interactions controlling flower development. Nature 353:31−37

    doi: 10.1038/353031a0

    CrossRef   Google Scholar

    [15]

    Wellmer F, Graciet E, Riechmann JL. 2014. Specification of floral organs in Arabidopsis. Journal of Experimental Botany 65:1−9

    doi: 10.1093/jxb/ert385

    CrossRef   Google Scholar

    [16]

    Carmona MJ, Chaïb J, Martínez-Zapater JM, Thomas MR. 2008. A molecular genetic perspective of reproductive development in grapevine. Journal of Experimental Botany 59:2579−96

    doi: 10.1093/jxb/ern160

    CrossRef   Google Scholar

    [17]

    Palumbo F, Vannozzi A, Magon G, Lucchin M, Barcaccia G. 2019. Genomics of flower identity in grapevine (Vitis vinifera L.). Frontiers in Plant Science 10:316

    doi: 10.3389/fpls.2019.00316

    CrossRef   Google Scholar

    [18]

    Sreekantan L, Thomas MR. 2006. VvFT and VvMADS8, the grapevine homologues of the floral integrators FT and SOC1, have unique expression patterns in grapevine and hasten flowering in Arabidopsis. Functional Plant Biology 33:1129−39

    doi: 10.1071/FP06144

    CrossRef   Google Scholar

    [19]

    Dong Y, Khalil-Ur-Rehman M, Liu X, Wang X, Yang L, et al. 2022. Functional characterisation of five SVP genes in grape bud dormancy and flowering. Plant Growth Regulation 97:511−22

    doi: 10.1007/s10725-022-00817-w

    CrossRef   Google Scholar

    [20]

    Thompson JD, Higgins DG, Gibson TJ. 1994. CLUSTAL W: improving the sensitivity of progressive multiple sequence alignment through sequence weighting, position-specific gap penalties and weight matrix choice. Nucleic Acids Research 22:4673−80

    doi: 10.1093/nar/22.22.4673

    CrossRef   Google Scholar

    [21]

    Kumar S, Stecher G, Li M, Knyaz C, Tamura K. 2018. MEGA X: molecular evolutionary genetics analysis across computing platforms. Molecular Biology and Evolution 35:1547−49

    doi: 10.1093/molbev/msy096

    CrossRef   Google Scholar

    [22]

    Saitou N, Nei M. 1987. The neighbor-joining method: a new method for reconstructing phylogenetic trees. Molecular Biology and Evolution 4:406−25

    doi: 10.1093/oxfordjournals.molbev.a040454

    CrossRef   Google Scholar

    [23]

    Nei M, Kumar S. 2000. Molecular evolution and phylogenetics. New York: Oxford University Press.

    [24]

    Felsenstein J. 1985. Confidence limits on phylogenies: an approach using the bootstrap. Evolution 39:783−91

    doi: 10.2307/2408678

    CrossRef   Google Scholar

    [25]

    Pilati S, Malacarne G, Navarro-Payá D, Tomè G, Riscica L, et al. 2021. Vitis OneGenE: a causality-based approach to generate gene networks in Vitis vinifera sheds light on the laccase and dirigent gene families. Biomolecules 11:1744

    doi: 10.3390/biom11121744

    CrossRef   Google Scholar

    [26]

    Ge SX, Jung D, Yao R. 2020. ShinyGO: a graphical gene-set enrichment tool for animals and plants. Bioinformatics 36:2628−29

    doi: 10.1093/bioinformatics/btz931

    CrossRef   Google Scholar

    [27]

    Fasoli M, Dal Santo S, Zenoni S, Tornielli GB, Farina L, et al. 2012. The grapevine expression atlas reveals a deep transcriptome shift driving the entire plant into a maturation program. The Plant Cell 24:3489−505

    doi: 10.1105/tpc.112.100230

    CrossRef   Google Scholar

    [28]

    Chen S, Songkumarn P, Liu J, Wang G. 2009. A versatile zero background T-vector system for gene cloning and functional genomics. Plant Physiology 150:1111−21

    doi: 10.1104/pp.109.137125

    CrossRef   Google Scholar

    [29]

    Rai GK, Rai NP, Kumar S, Yadav A, Rathaur S, et al. 2012. Effects of explant age, germination medium, pre-culture parameters, inoculation medium, pH, washing medium, and selection regime on Agrobacterium-mediated transformation of tomato. In Vitro Cellular & Developmental Biology - Plant 48:565−78

    doi: 10.1007/s11627-012-9442-3

    CrossRef   Google Scholar

    [30]

    Vrebalov J, Ruezinsky D, Padmanabhan V, White R, Medrano D, et al. 2002. A MADS-box gene necessary for fruit ripening at the tomato ripening-inhibitor (rin) locus. Science 296:343−46

    doi: 10.1126/science.1068181

    CrossRef   Google Scholar

    [31]

    Untergasser A, Ruijter JM, Benes V, van den Hoff MJB. 2021. Web-based LinRegPCR: application for the visualization and analysis of (RT)-qPCR amplification and melting data. BMC Bioinformatics 22:398

    doi: 10.1186/s12859-021-04306-1

    CrossRef   Google Scholar

    [32]

    Hellemans J, Mortier G, De Paepe A, Speleman F, Vandesompele J. 2007. qBase relative quantification framework and software for management and automated analysis of real-time quantitative PCR data. Genome Biology 8:R19

    doi: 10.1186/gb-2007-8-2-r19

    CrossRef   Google Scholar

    [33]

    Expósito-Rodríguez M, Borges AA, Borges-Pérez A, Pérez JA. 2008. Selection of internal control genes for quantitative real-time RT-PCR studies during tomato development process. BMC Plant Biology 8:131

    doi: 10.1186/1471-2229-8-131

    CrossRef   Google Scholar

    [34]

    Lichtenthaler HK, Buschmann C. 2001. Chlorophylls and carotenoids: measurement and characterization by UV-VIS spectroscopy. Current Protocols in Food Analytical Chemistry Supplement 1:F4.3.1−F4.3.8

    doi: 10.1002/0471142913.faf0403s01

    CrossRef   Google Scholar

    [35]

    Zhang Y, Li Y, Zhang Y, Guan S, Liu C, et al. 2015. Isolation and characterization of a SOC1-Like gene from tree peony (Paeonia suffruticosa). Plant Molecular Biology Reporter 33:855−66

    doi: 10.1007/s11105-014-0800-7

    CrossRef   Google Scholar

    [36]

    Wang X, Liu Z, Sun S, Wu J, Li R, et al. 2021. SISTER OF TM3 activates FRUITFULL1 to regulate inflorescence branching in tomato. Horticulture Research 8:251

    doi: 10.1038/s41438-021-00677-x

    CrossRef   Google Scholar

    [37]

    Wagner D. 2009. Flower morphogenesis: timing is key. Developmental Cell 16:621−22

    doi: 10.1016/j.devcel.2009.05.005

    CrossRef   Google Scholar

    [38]

    Boss PK, Sreekantan L, Thomas MR. 2006. A grapevine TFL1 homologue can delay flowering and alter floral development when overexpressed in heterologous species. Functional Plant Biology 33:31−41

    doi: 10.1071/FP05191

    CrossRef   Google Scholar

    [39]

    Adato A, Mandel T, Mintz-Oron S, Venger I, Levy D, et al. 2009. Fruit-surface flavonoid accumulation in tomato is controlled by a SlMYB12-regulated transcriptional network. PLoS Genetics 5:e1000777

    doi: 10.1371/journal.pgen.1000777

    CrossRef   Google Scholar

    [40]

    Kosma DK, Parsons EP, Isaacson T, Lü S, Rose JKC, Jenks MA. 2010. Fruit cuticle lipid composition during development in tomato ripening mutants. Physiologia Plantarum 139:107−17

    doi: 10.1111/j.1399-3054.2009.01342.x

    CrossRef   Google Scholar

    [41]

    España L, Heredia-Guerrero JA, Reina-Pinto JJ, Fernández-Muñoz R, Heredia A, et al. 2014. Transient silencing of CHALCONE SYNTHASE during fruit ripening modifies tomato epidermal cells and cuticle properties. Plant Physiology 166:1371−86

    doi: 10.1104/pp.114.246405

    CrossRef   Google Scholar

    [42]

    Bemer M, Karlova R, Ballester AR, Tikunov YM, Bovy AG, et al. 2012. The tomato FRUITFULL homologs TDR4/FUL1 and MBP7/FUL2 regulate ethylene-independent aspects of fruit ripening. The Plant Cell 24:4437−51

    doi: 10.1105/tpc.112.103283

    CrossRef   Google Scholar

    [43]

    Jiang X, Lubini G, Hernandes-Lopes J, Rijnsburger K, Veltkamp V, et al. 2022. FRUITFULL-like genes regulate flowering time and inflorescence architecture in tomato. The Plant Cell 34:1002−19

    doi: 10.1093/plcell/koab298

    CrossRef   Google Scholar

    [44]

    Lashbrooke J, Adato A, Lotan O, Alkan N, Tsimbalist T, et al. 2015. The tomato MIXTA-like transcription factor coordinates fruit epidermis conical cell development and cuticular lipid biosynthesis and assembly. Plant Physiology 169:2553−71

    doi: 10.1104/pp.15.01145

    CrossRef   Google Scholar

    [45]

    Szymkowiak EJ, Irish EE. 2006. JOINTLESS suppresses sympodial identity in inflorescence meristems of tomato. Planta 223:646−58

    doi: 10.1007/s00425-005-0115-x

    CrossRef   Google Scholar

    [46]

    Yuste-Lisbona FJ, Quinet M, Fernández-Lozano A, Pineda B, Moreno V, et al. 2016. Characterization of vegetative inflorescence (mc-vin) mutant provides new insight into the role of MACROCALYX in regulating inflorescence development of tomato. Scientific Reports 6:18796

    doi: 10.1038/srep18796

    CrossRef   Google Scholar

    [47]

    Zhang J, Hu Z, Wang Y, Yu X, Liao C, et al. 2018. Suppression of a tomato SEPALLATA MADS-box gene, SlCMB1, generates altered inflorescence architecture and enlarged sepals. Plant Science 272:75−87

    doi: 10.1016/j.plantsci.2018.03.031

    CrossRef   Google Scholar

    [48]

    Shitsukawa N, Ikari C, Mitsuya T, Sakiyama T, Ishikawa A, et al. 2007. Wheat SOC1 functions independently of WAP1/VRN1, an integrator of vernalization and photoperiod flowering promotion pathways. Physiologia Plantarum 130:627−36

    doi: 10.1111/j.1399-3054.2007.00927.x

    CrossRef   Google Scholar

    [49]

    Ryu CH, Lee S, Cho LH, Kim SL, Lee YS, et al. 2009. OsMADS50 and OsMADS56 function antagonistically in regulating long day (LD)-dependent flowering in rice. Plant, Cell & Environment 32:1412−27

    doi: 10.1111/j.1365-3040.2009.02008.x

    CrossRef   Google Scholar

    [50]

    Na X, Jian B, Yao W, Wu C, Hou W, et al. 2013. Cloning and functional analysis of the flowering gene GmSOC1-like, a putative SUPPRESSOR OF OVEREXPRESSION CO1/AGAMOUS-LIKE 20 (SOC1/AGL20) ortholog in soybean. Plant Cell Reports 32:1219−29

    doi: 10.1007/s00299-013-1419-0

    CrossRef   Google Scholar

    [51]

    Zhao S, Luo Y, Zhang Z, Xu M, Wang W, et al. 2014. ZmSOC1, an MADS-box transcription factor from Zea mays, promotes flowering in Arabidopsis. International Journal of Molecular Sciences 15:19987−20003

    doi: 10.3390/ijms151119987

    CrossRef   Google Scholar

    [52]

    Liu X, Pan T, Liang W, Gao L, Wang X, et al. 2016. Overexpression of an orchid (Dendrobium nobile) SOC1/TM3-like ortholog, DnAGL19, in Arabidopsis regulates HOS1-FT expression. Frontiers in Plant Science 7:99

    doi: 10.3389/fpls.2016.00099

    CrossRef   Google Scholar

    [53]

    Liu C, Teo ZWN, Bi Y, Song S, Xi W, et al. 2013. A conserved genetic pathway determines inflorescence architecture in Arabidopsis and rice. Developmental Cell 24:612−22

    doi: 10.1016/j.devcel.2013.02.013

    CrossRef   Google Scholar

    [54]

    Samach A, Onouchi H, Gold SE, Ditta GS, Schwarz-Sommer Z, et al. 2000. Distinct roles of CONSTANS target genes in reproductive development of Arabidopsis. Science 288:1613−16

    doi: 10.1126/science.288.5471.1613

    CrossRef   Google Scholar

    [55]

    Voogd C, Wang T, Varkonyi-Gasic E. 2015. Functional and expression analyses of kiwifruit SOC1-like genes suggest that they may not have a role in the transition to flowering but may affect the duration of dormancy. Journal of Experimental Botany 66:4699−710

    doi: 10.1093/jxb/erv234

    CrossRef   Google Scholar

    [56]

    Liu C, Zhou J, Bracha-Drori K, Yalovsky S, Ito T, et al. 2007. Specification of Arabidopsis floral meristem identity by repression of flowering time genes. Development 134:1901−10

    doi: 10.1242/dev.003103

    CrossRef   Google Scholar

    [57]

    Fornara F, Gregis V, Pelucchi N, Colombo L, Kater M. 2008. The rice StMADS11-like genes OsMADS22 and OsMADS47 cause floral reversions in Arabidopsis without complementing the svp and agl24 mutants. Journal of Experimental Botany 59:2181−90

    doi: 10.1093/jxb/ern083

    CrossRef   Google Scholar

    [58]

    Sun L, Zhang J, Hu C. 2016. Characterization and expression analysis of PtAGL24, a SHORT VEGETATIVE PHASE/AGAMOUS-LIKE 24 (SVP/AGL24)-type MADS-box gene from trifoliate orange (Poncirus trifoliata L. Raf.). Frontiers in Plant Science 7:823

    doi: 10.3389/fpls.2016.00823

    CrossRef   Google Scholar

    [59]

    Li Z, Zeng S, Li Y, Li M, Souer E. 2016. Leaf-like sepals induced by ectopic expression of a SHORT VEGETATIVE PHASE (SVP)-like MADS-box gene from the basal eudicot Epimedium sagittatum. Frontiers in Plant Science 7:1461

    doi: 10.3389/fpls.2016.01461

    CrossRef   Google Scholar

    [60]

    Pelaz S, Gustafson-Brown C, Kohalmi SE, Crosby WL, Yanofsky MF. 2001. APETALA1 and SEPALLATA3 interact to promote flower development. The Plant Journal 26:385−94

    doi: 10.1046/j.1365-313X.2001.2641042.x

    CrossRef   Google Scholar

    [61]

    Nakano T, Kimbara J, Fujisawa M, Kitagawa M, Ihashi N, et al. 2012. MACROCALYX and JOINTLESS interact in the transcriptional regulation of tomato fruit abscission zone development. Plant Physiology 158:439−50

    doi: 10.1104/pp.111.183731

    CrossRef   Google Scholar

    [62]

    Li N, Huang B, Tang N, Jian W, Zou J, et al. 2017. The MADS-box gene SlMBP21 regulates sepal size mediated by ethylene and auxin in tomato. Plant and Cell Physiology 58:2241−56

    doi: 10.1093/pcp/pcx158

    CrossRef   Google Scholar

    [63]

    Zhang J, Hu Z, Yao Q, Guo X, Nguyen V, et al. 2018. A tomato MADS-box protein, SlCMB1, regulates ethylene biosynthesis and carotenoid accumulation during fruit ripening. Scientific Reports 8:3413

    doi: 10.1038/s41598-018-21672-8

    CrossRef   Google Scholar

    [64]

    Girard AL, Mounet F, Lemaire-Chamley M, Gaillard C, Elmorjani K, et al. 2012. Tomato GDSL1 is required for cutin deposition in the fruit cuticle. The Plant Cell 24:3119−34

    doi: 10.1105/tpc.112.101055

    CrossRef   Google Scholar

    [65]

    Shi J, Adato A, Alkan N, He Y, Lashbrooke J, et al. 2013. The tomato SlSHINE3 transcription factor regulates fruit cuticle formation and epidermal patterning. New Phytologist 197:468−80

    doi: 10.1111/nph.12032

    CrossRef   Google Scholar

    [66]

    Londo JP, Johnson LM. 2014. Variation in the chilling requirement and budburst rate of wild Vitis species. Environmental and Experimental Botany 106:138−47

    doi: 10.1016/j.envexpbot.2013.12.012

    CrossRef   Google Scholar

    [67]

    Gómez-Soto D, Ramos-Sánchez JM, Alique D, Conde D, Triozzi PM, et al. 2021. Overexpression of a SOC1-related gene promotes bud break in ecodormant poplars. Frontiers in Plant Science 12:670497

    doi: 10.3389/fpls.2021.670497

    CrossRef   Google Scholar

    [68]

    Melzer S, Lens F, Gennen J, Vanneste S, Rohde A, et al. 2008. Flowering-time genes modulate meristem determinacy and growth form in Arabidopsis thaliana. Nature Genetics 40:1489−92

    doi: 10.1038/ng.253

    CrossRef   Google Scholar

    [69]

    Jolliffe JB, Pilati S, Moser C, Lashbrooke JG. 2023. Beyond skin-deep: targeting the plant surface for crop improvement. Journal of Experimental Botany 74:6468−86

    doi: 10.1093/jxb/erad321

    CrossRef   Google Scholar

  • Cite this article

    Jolliffe JB, Moser C, Pilati S, Lashbrooke JG. 2024. The grapevine SOC1 homolog, VviMADS8/SOC1a, regulates floral organ specification in tomato. Fruit Research 4: e029 doi: 10.48130/frures-0024-0023
    Jolliffe JB, Moser C, Pilati S, Lashbrooke JG. 2024. The grapevine SOC1 homolog, VviMADS8/SOC1a, regulates floral organ specification in tomato. Fruit Research 4: e029 doi: 10.48130/frures-0024-0023

Figures(6)

Article Metrics

Article views(2041) PDF downloads(382)

ARTICLE   Open Access    

The grapevine SOC1 homolog, VviMADS8/SOC1a, regulates floral organ specification in tomato

Fruit Research  4 Article number: e029  (2024)  |  Cite this article

Abstract: The MADS-box protein SUPPRESSOR OF OVEREXPRESSION OF CONSTANS1 (SOC1) is a key floral activator that coordinates external and internal stimuli to ensure timely floral transition. During early development, SOC1 represses floral organ identity to prevent premature differentiation and, thus, is also linked to the successful development of functional flowers. In woody perennials, SOC1 has established a divergent function in the regulation of bud dormancy release. Apart from reducing flowering time in Arabidopsis, little is known about the function of VviSOC1a and its gene regulatory network. In this study, VviSOC1a was functionally characterized through overexpression in tomato, where it was found to promote the development of leaf-like sepals and petals with an increased accumulation of chlorophyll. In severe cases, overexpression of VviSOC1a led to the formation of defective floral organs resulting in plant sterility phenotypes. Gene expression analyses revealed the significant downregulation of important floral organ identity genes in tomato, such as SIMC, SlRIN, SlCMB1, and SlMBP21. Additional downstream impacts on ripening and cuticle-associated gene expression warrant further characterization of VviSOC1a within the context of these crop traits. In silico analysis of the VviSOC1a expression profile revealed patterns distinctive of genes involved in floral induction. This, in combination with an association gene network significantly enriched in flower developmental processes, supports a predicted function for VviSOC1a in floral initiation and floral organ specification.

    • To ensure timely floral transition, plants have acquired an intricate network of genetic pathways driven by various environmental and developmental cues[1]. Flower development takes place over three main phases, including (i) signal integration, (ii) meristem determination, and (iii) organ determination[2]. Key regulators directing each of these phases have been extensively studied in Arabidopsis, including the identification of the floral signal integrator SUPPRESSOR OF OVEREXPRESSION OF CONSTANS1 (SOC1)[3].

      SOC1 has been shown to act as an activator of floral transition in many plant species[48]. In Arabidopsis, SOC1 is directly regulated by an upstream floral repressor complex, involving FLOWERING LOCUS C (FLC) and SHORT VEGETATIVE PHASE (SVP), which acts in response to flowering signals received from the vernalization and autonomous pathways[9]. Contrarily, SOC1 is activated through the photoperiodic pathway using the central floral regulator CONSTANS (CO), via the activity of FLOWERING LOCUS T (FT)[10]. In addition, SOC1 has been shown to interact with AGL24, another floral signal integrator, to induce floral meristem identity through the activation of LEAFY (LFY) which, in turn, drives part of the floral organ determination phase[11,12]. During the early stages of floral initiation and meristem determination, SOC1 acts redundantly with SVP and AGL24 to prevent the precocious differentiation of floral organs by directly repressing SEPALLATA3 (SEP3)[2,13].

      In Arabidopsis, floral organ determination is driven by organ identity genes which are categorised as either A-function (APETALA1 [AP1] and AP2), B-function (AP3 and PISTILLATA [PI]), C-function (AGAMOUS [AG]) or E-function (SEP1-4), according to the ABCE flower model[14,15]. Each of these genes, with one exception (AP2), encode for MADS-box proteins which interact with each other to form different combinations of multimeric complexes that drive the development of each floral organ type, namely sepals (A and E), petals (A, B, and E), stamens (B, C, and E), and carpels (C and E)[15].

      Flower development differs greatly between Arabidopsis and grapevine (Vitis vinifera) with regards to flower anatomy, floral inducive signals, and lifecycle (reviewed in Carmona et al.[16]), and, as such, variations in their flowering gene networks are to be expected. Nevertheless, it has recently been reported that the expression patterns of Arabidopsis and grapevine floral organ identity gene homologs are well conserved[17]. In addition, previous research characterizing grapevine homologs of the FT and SVP genes indicated similar flowering functions to those held in Arabidopsis[18,19], suggesting that key regulators of the general flowering pathway may be partly conserved between these two plant species.

      VviSOC1a, a SOC1 homolog of grapevine, has previously been shown to reduce flowering time in Arabidopsis, thereby identifying as a possible floral activator involved in signal integration[18]. Currently, however, no research efforts have been made in identifying VviSOC1a downstream targets or characterizing its gene regulatory network. In addition, its potential function in floral organ identity has not yet been explored. To better understand the role of VviSOC1a in flowering regulation, this study conducted phenotypic and gene expression analyses in overexpressing (OE) tomato (Solanum lycopersicum) lines. The association gene network and expression profile of VviSOC1a were also investigated.

    • Protein sequence alignments were performed with CLUSTALW[20] on the MEGAX software[21]. A phylogenetic tree was subsequently constructed using the Neighbor-Joining method[22] and p-distance model[23], with bootstrap values calculated for 100 replicates[24]. The list of VviSOC1a associated genes, computed using the Vitis OneGenE method[25], was retrieved by querying the http://ibdm.disi.unitn.it/onegene/vv/onegene-vv.php and http://vitis.onegenexp.eu websites with the V1 gene ID (VIT_15s0048g01250). Genes were selected according to relative frequency values (FreI > 0.5) and used for Gene Ontology (GO) enrichment analysis on the ShinyGO 0.77 database[26], under default settings and false discovery rates (FDR) < 0.05. Developmental and tissue-specific expression data is based on the grapevine expression atlas[27]. Hierarchical clustering of expression data was created using the Expression Atlases application within the Vitis Visualization (Vitviz) platform (www.vitviz.tomsbiolab.com).

    • The coding sequence of VviSOC1a was PCR-isolated from cultivar 'Pinot Noir' complementary DNA (cDNA) and cloned into pCXSN, driven by the constitutive CaMV 35S promoter[28]. Primer sequences used for gene isolation are listed in Supplemental Table S1. Transgenic tomato lines were generated through Agrobacterium-mediated transformation of cultivar 'Ailsa Craig' cotyledons as previously described[29], with the exception of using zeatin (2 μg/mL) and indole-3-acetic acid (IAA) (0.01 μg/mL) as plant hormones for shoot regeneration. Growth chamber conditions for plant regeneration were set at ± 23 °C and a 16-h photoperiod. Transgenic plants were transplanted in potting soil and grown in a greenhouse equipped with supplemental lighting (200−250 μmol/m2/s), for further use in gene expression and phenotypic analysis. As reference plants, ripening inhibitor (rin) mutants were grown up concurrently under the same conditions described above[30].

    • RNA was extracted using the Spectrum™ Plant Total RNA Kit (Sigma-Aldrich, Burlington, MA, USA) and On-Column DNase I Digestion Set (Sigma-Aldrich, Burlington, MA, USA), according to the manual. First-strand cDNA was synthesized with an UltraScript 2.0 cDNA Synthesis Kit (PCR Biosystems, London, England). Real-time qPCR analysis was performed using gene-specific primers and qPCRBIO SyGreen Mix (PCR Biosystems, London, England) on a ViiA 7 instrument (Applied Biosystems, CA, USA) under default parameters. For transgene quantification, three plants were analyzed per independently transformed line, while for downstream target genes, one plant (each) was used for three independently transformed lines. Two technical replicates were performed per sample. Relative expression levels were calculated using the LinRegPCR program for amplification data analysis[31] and the delta-delta Ct method[32]. The qPCR data was normalized against Expressed (Exp) gene expression[33]. Primers used for the qPCR experiments are listed in Supplemental Table S1.

    • At the anthesis stage, flowers were sampled and pooled from three plants per independently transformed line. Photosynthetic pigments were extracted from 50 mg of fresh petal tissue with 600 μL of pre-chilled acetone : water 80:20 (v/v), according to a previously described protocol[34]. Absorbance (A) was measured at 470, 647, 663, and 750 nm, using the Synergy™ 2 Plate Reader (BioTek, Winooski, VT, USA). Total chlorophyll a/b and carotenoids were calculated as suggested[34]:

      Chlorophylla(Ca)(μg/mL)=12.25A6632.79A647
      Chlorophyllb(Cb)(μg/mL)=21.50A6475.10A663
      Carotenoids(μg/mL)=(1,000A4701.82Ca85.02Cb)/198
    • A two-tailed t-test was performed to compare means, where p ≤ 0.1, p ≤ 0.05, and p ≤ 0.01, were considered low, moderate, and high significant differences, respectively.

    • Molecular phylogenetic analysis grouped the VviSOC1a protein with previously characterized SOC1 clade members of the Type II MIKCc MADS-box family (Fig. 1). VviSOC1a shared highest amino acid similarity with SlTM3 (63%), PsSOC1 (58%), GhSOC1 (55%), and FaSOC1 (53%), which have primarily been shown to regulate flowering time, in addition to having roles in meristem branching control[6,7,35,36].
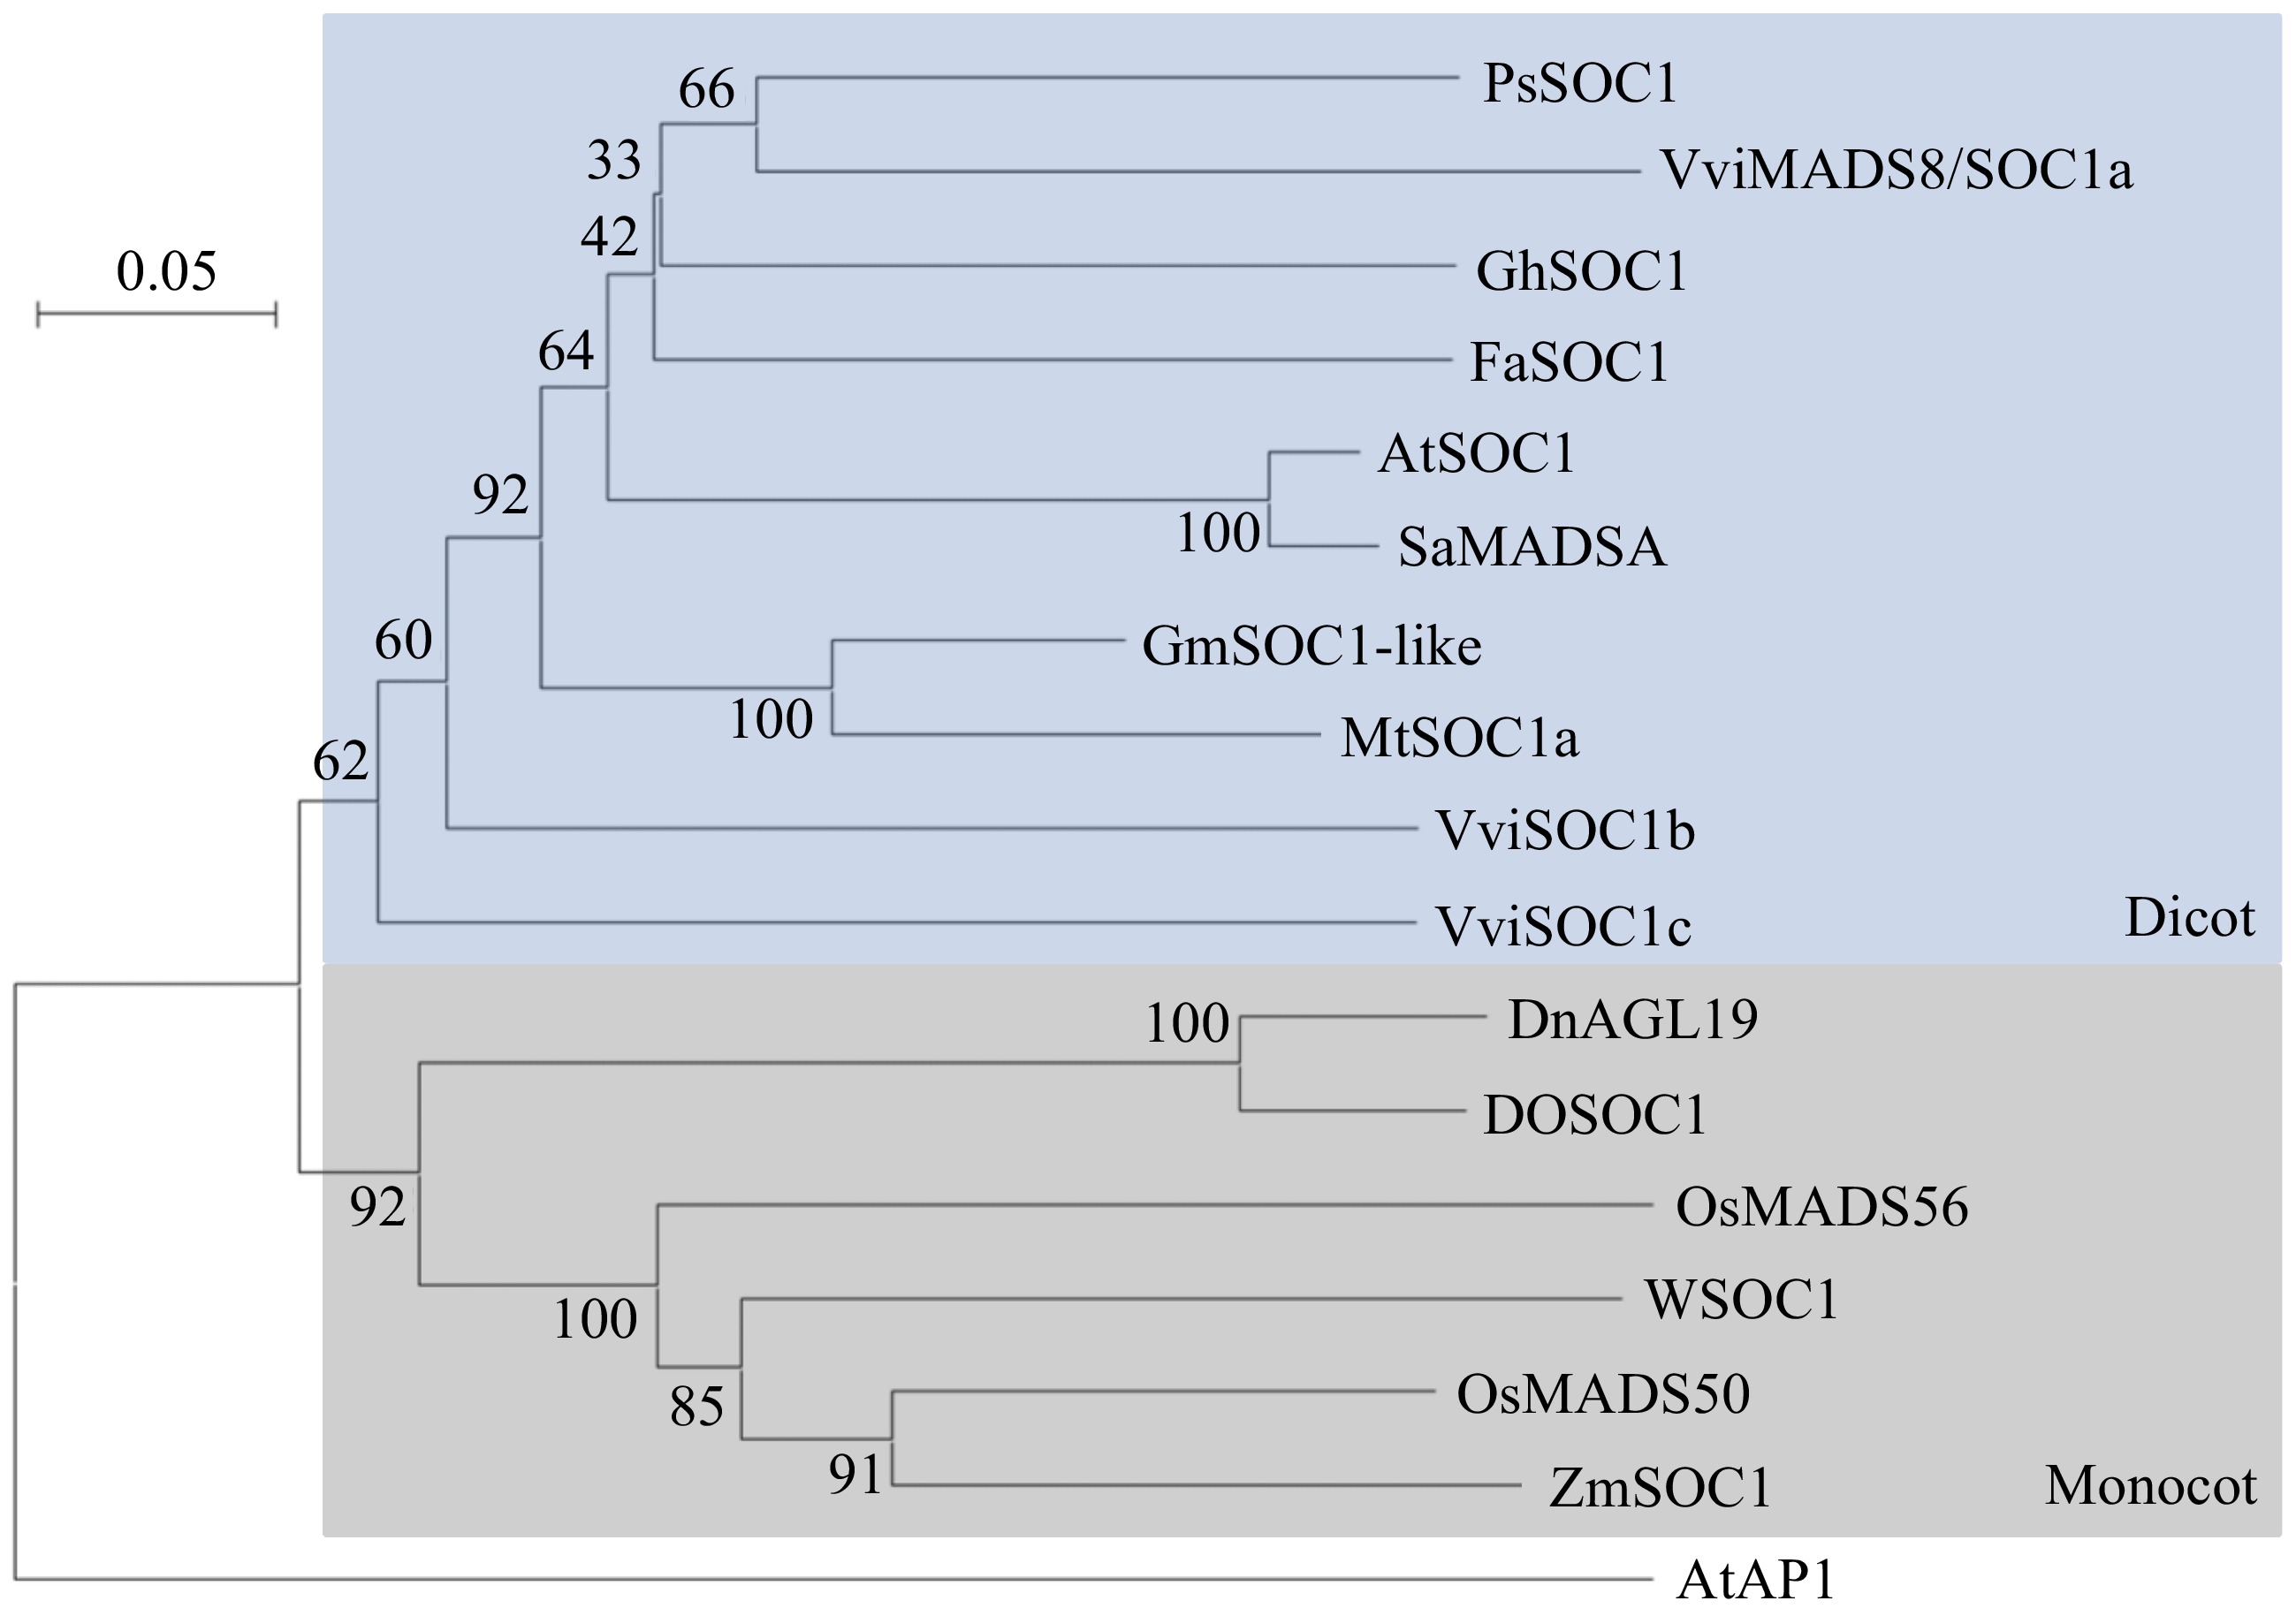
      Figure 1. 

      Phylogenetic analysis of VviMADS8/SOC1a with functionally characterised proteins of the Type II MIKCc MADS-box family SOC1 clade, including SlSISTER OF TOMATO MADS-box gene 3 (SlSTM3, Solyc01g092950), SlTM3 (XP_025887600), PsSOC1 (AHJ60268), GhSOC1 (NP_001314583), FaSOC1 (AFR90178), SaMADSA (U25696), AtSOC1 (NP_182090), GmSOC1-like (NP_001236377), MtSOC1a (XP_003623808), ZmSOC1 (NP_001105152), OsMADS50 (NP_001388955), TaSOC1 (AB281427), OsMADS56 (NP_001390992), DnAGL19 (AMO66151), and DoSOC1 (AGK07583), as well as the closely related VviSOC1b (VIT_16s0022g02400) and VviSOC1c (VIT_02s0025g04650). AtAP1 (NP_177074) was selected as the outgroup. The scale bar represents the number of amino acid differences per site. The tree was generated using the Neighbor-Joining method and p-distance model[22,23]. Numbers at each node indicate bootstrap values calculated from 100 replicates[24]. At, Arabidopsis thaliana; Dn, Dendrobium nobile; Do, Dendrobium orchid; Fa, Fragaria × ananassa; Gh, Gossypium hirsutum; Gm, Glycine max; Mt, Medicago truncatula; Os, Oryza sativa; Ps, Paeonia suffruticosa; Sa, Sinapis alba; Sl, Solanum lycopersicum; Vvi, Vitis vinifera; Ta, Triticum aestivum; Zm, Zea mays.

      To further explore the predicted function of VviSOC1a in floral transition, GO enrichment analysis of the VviSOC1a association gene network, computed using the Vitis OneGenE method[25] (Supplemental Table S2), was performed. From this analysis it was found that genes interacting with VviSOC1a were significantly enriched in biological processes related to flower development and vernalization response (Supplemental Fig. S1). Of particular interest were 14 grapevine genes that were identified as putative homologs of regulators involved in the general flowering pathway of Arabidopsis[2,37], including those related to floral signal integration (VviSOC1b, VviSOC1c, and VviSVP2-7) and floral meristem determination (VviFRUITFULL1 [VviFUL1]), as well as genes predicted to regulate floral organ identity in grapevine (VviAG1, VviAG2, VviAP3b, VviFUL1, VviSEP1, and VviSEP3)[17] (Fig. 2). Another important gene is the TERMINAL FLOWER1 (TFL1) homolog, VviTFL1, which was previously characterized as a repressor of floral development[38].
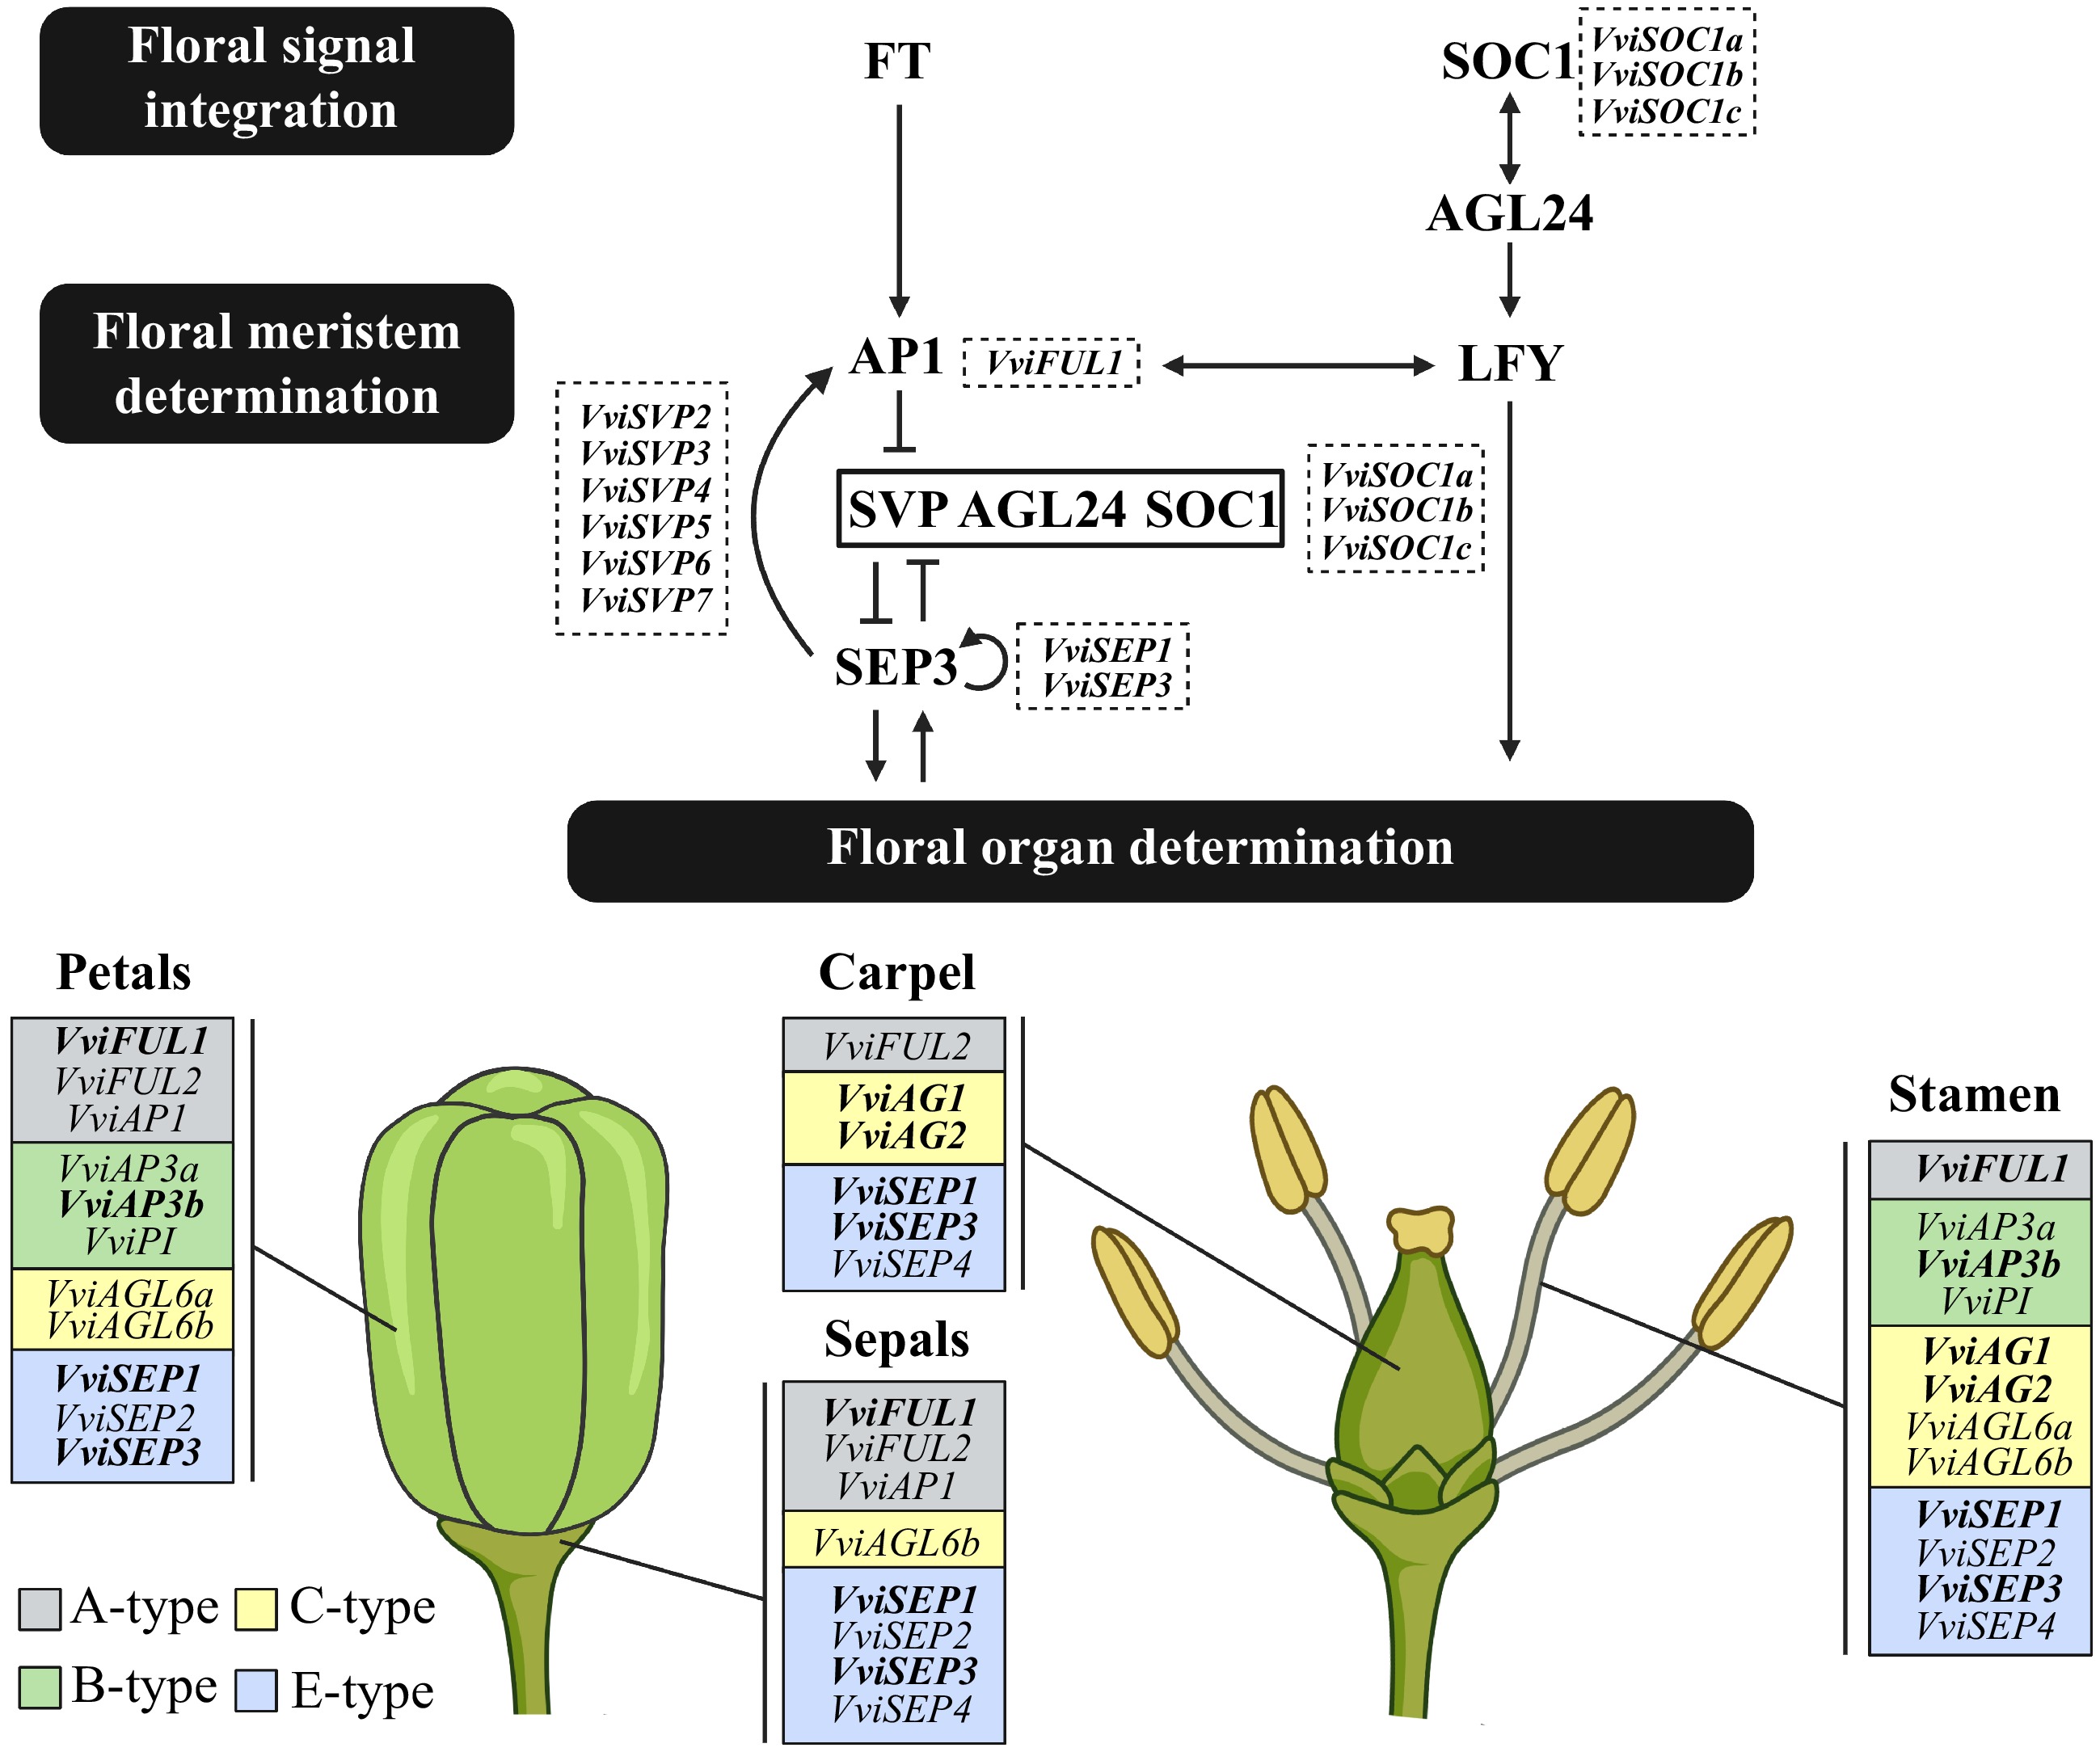
      Figure 2. 

      Schematic diagram highlighting the flowering-related genes (featured in bold) present in the VviSOC1a association network, computed using the Vitis OneGenE method. This general flowering pathway, from floral signal integration to floral organ determination, is adapted from Wagner[37], Lee & Lee[2], and Palumbo et al.[17]. Grapevine homologs of floral signal integration and meristem determination genes are placed in the dotted boxes, while those associated with floral organ determination are categorised as either A-type (grey boxes), B-type (green boxes), C-type (yellow boxes) or E-type (blue boxes), based on the predicted ABCE flower model[15]. Created using BioRender.com.

      Analysis of genome-wide transcriptomic data across 54 grapevine tissues and developmental stages[27] revealed that VviSOC1a is predominantly expressed during vegetative growth, except the seedling stage (Supplemental Fig. S2). In particular, VviSOC1a expression tends to be highest in younger tissue types, for example in younger leaves and stems, as well as in the latent buds and during budburst. VviSOC1a is also strongly expressed during early flowering, and especially in pollen grains, but has little to no expression during berry development or ripening (Supplemental Fig. S2). When comparing expression profiles, VviSOC1a shares similar trends to associated putative grapevine homologs involved in floral signal integration and meristem determination (Fig. 2), where expression mainly occurs in the vegetative and flowering tissues, and is mostly absent at fruit stages (Supplemental Fig. S3). Contrarily, putative grapevine homologs involved in floral organ determination display opposite patterns, in that gene expression occurs almost exclusively in the reproductive tissues, such as during later flowering stages and throughout berry development (Supplemental Fig. S3).

    • Transgenic tomato lines showed significant changes to flower morphology, where the most striking phenotype observed was the formation of leaf-like sepals (Figs 3 & 4). In severe cases, impacts on normal floral development, such as absent, dwarfed, and loosely packed reproductive organs, resulted in plant sterility (Fig. 3ah). Three VviSOC1a-OE tomato lines showing comparable, albeit weaker, floral reversion phenotypes were further assessed (Fig. 3ik & Supplemental Fig. S4). For the two higher expressing lines (Fig. 3i, j), a significant elongation in curly sepal growth was observed compared to the wild type (Fig. 3l & Supplemental Fig. S5), but not in the case of the lowest expresser (Fig. 3k). This was particularly evident when comparing isolated floral organs (Fig. 4ac). In addition, the extensive sepal growth found in the highest expresser (Fig. 4a) resembled the rin mutant flower (Fig. 4d). Apart from alterations to the sepal size, there was a notable development of greener sepaloid petal tissue in the transgenic flowers (Fig. 4ac). To further assess petal color, photosynthetic pigment quantification of all three independently transformed lines (Fig. 4e), as well as the two highest expressing lines (Fig. 4f), confirmed that a significant increase in total petal chlorophyll (a + b) content was observed for the higher expressers (Fig. 4e). Post-anthesis, transgenic lines showed further sepal elongation, however, did not display noticeable changes in length between different mature fruit stages (Fig. 5a, b). As observed with the flowers, the red-ripe fruit sepal phenotype of the highest expresser (line 3) was comparable to the rin mutant (Fig. 5b).
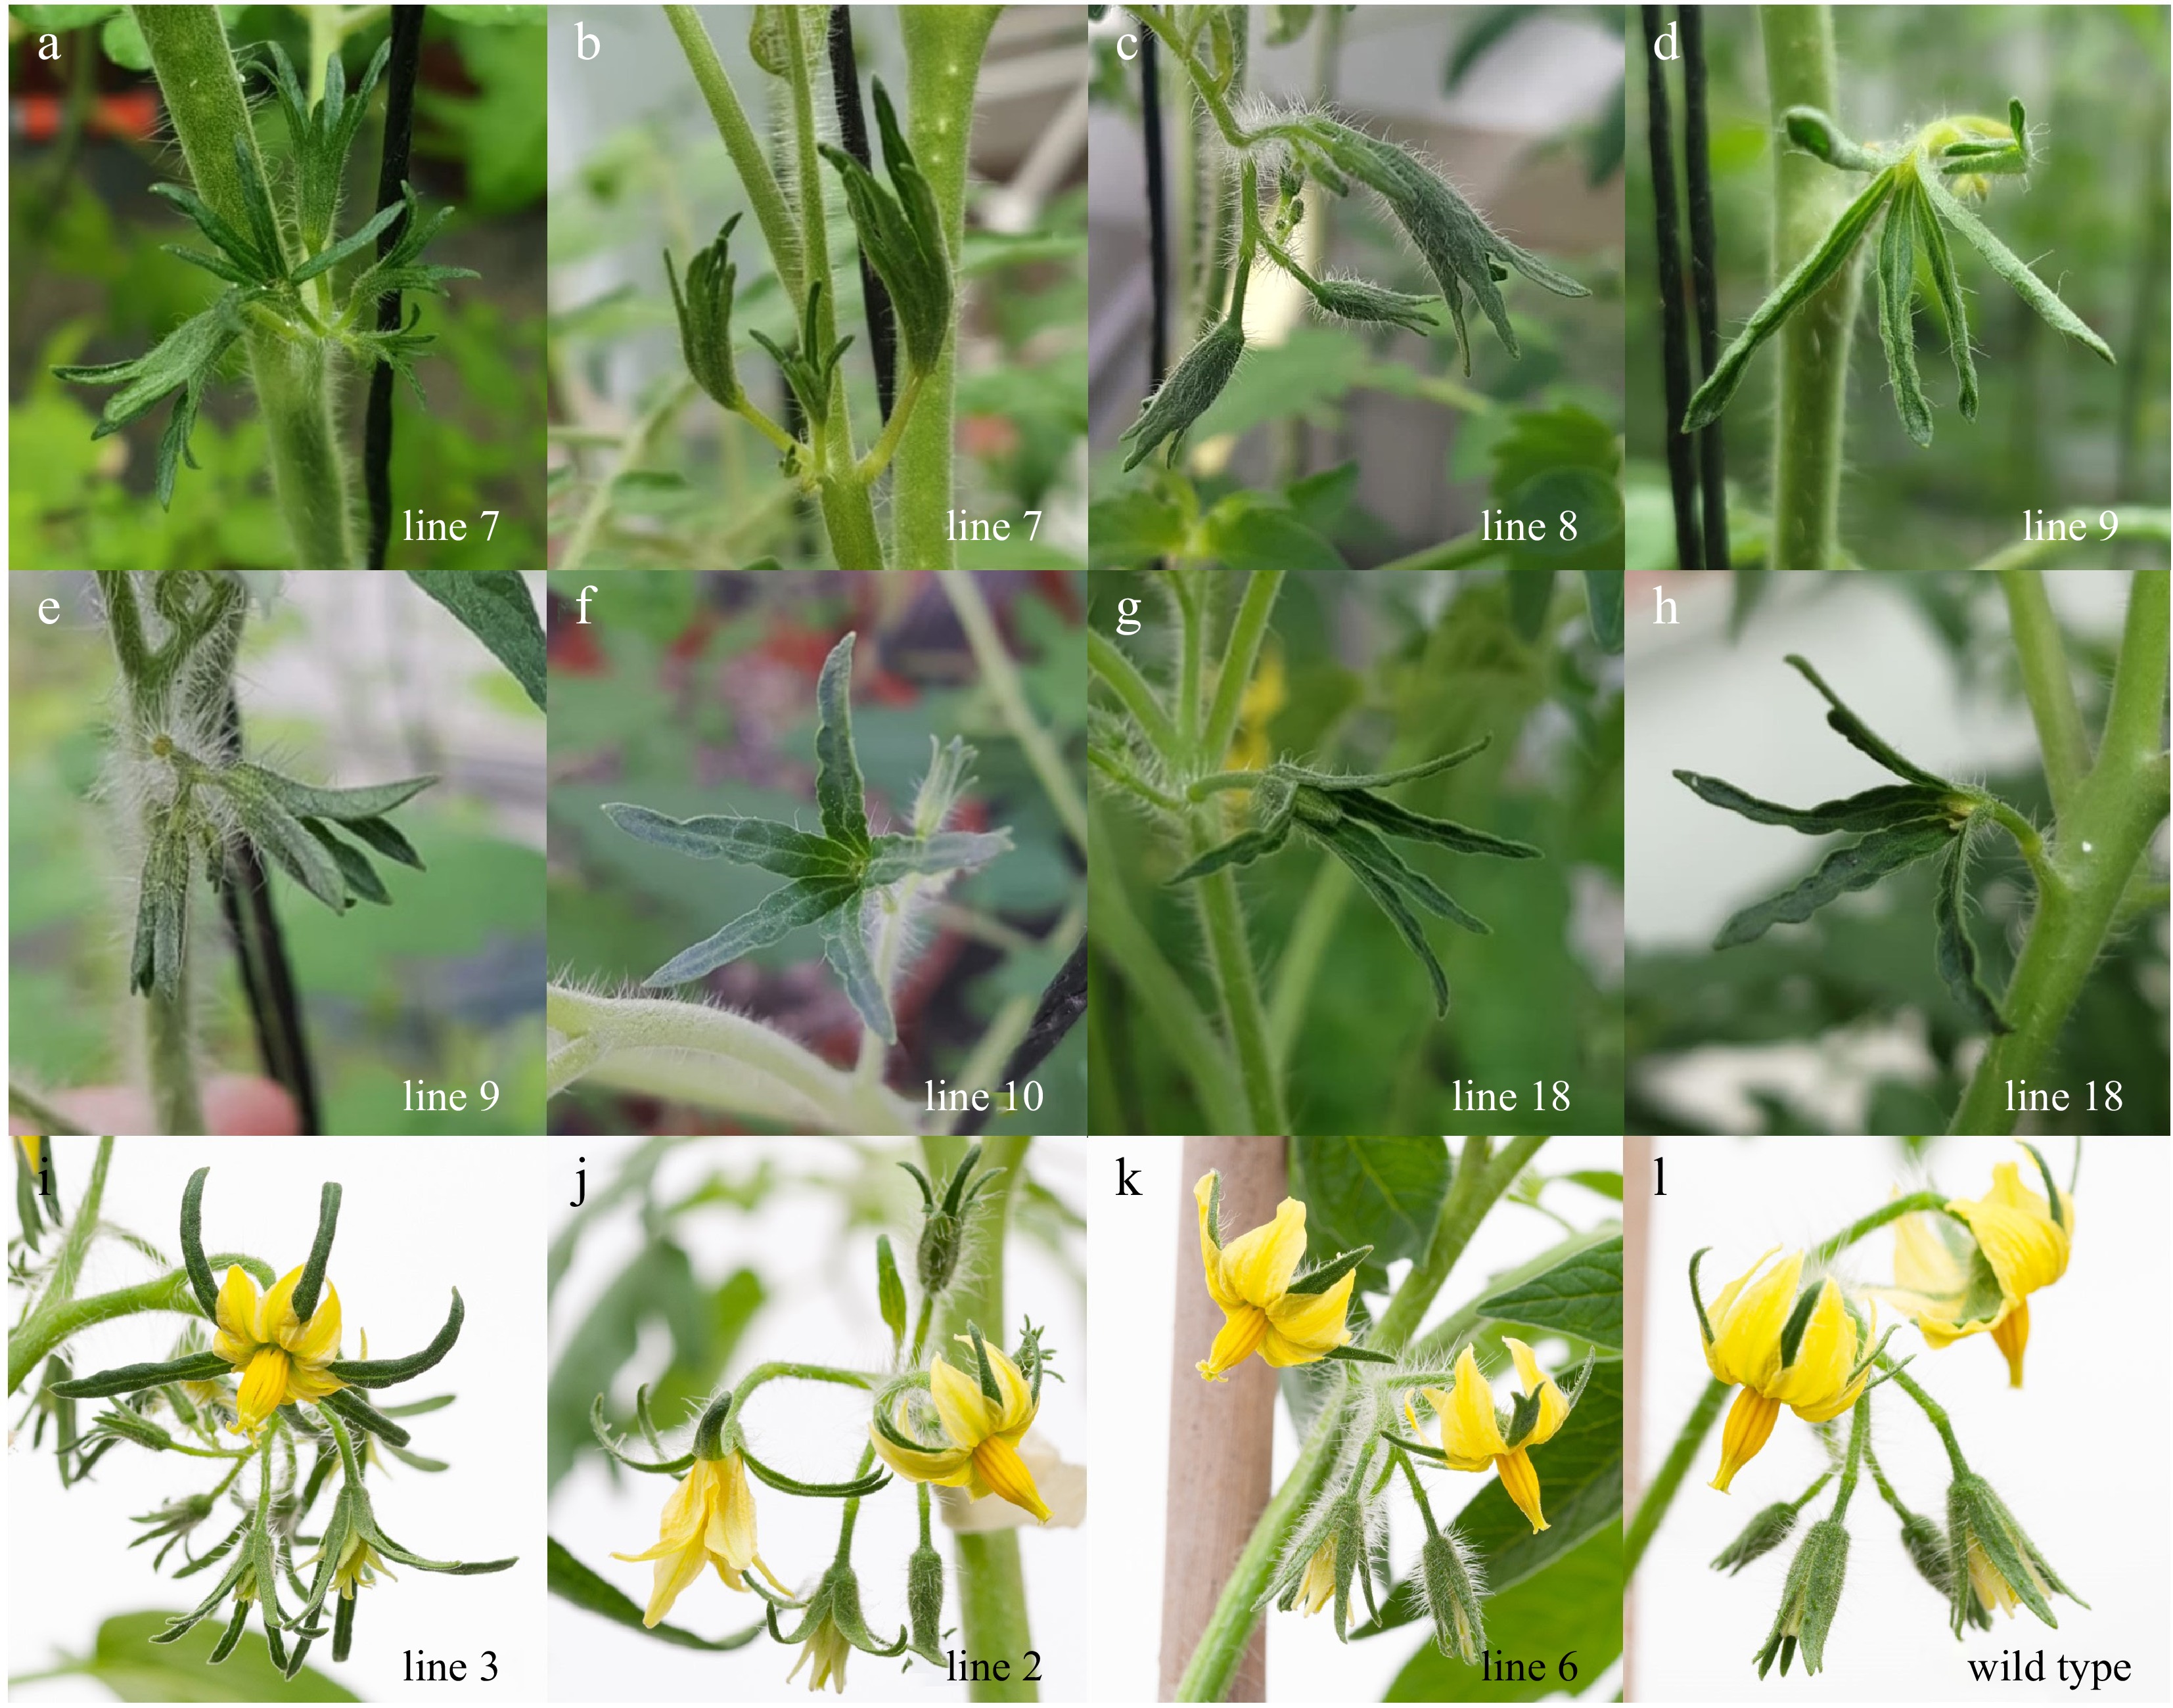
      Figure 3. 

      Whole-flower phenotypes of tomato lines overexpressing VviSOC1a. (a)−(h) Transgenic lines developed leaf-like sepals and displayed severe floral dwarfing phenotypes resulting in plant sterility. Transgenic lines displayed moderate floral phenotypes of (i), (j) sepal extension and curling compared to (k) line 6 and (l) wild type plants.
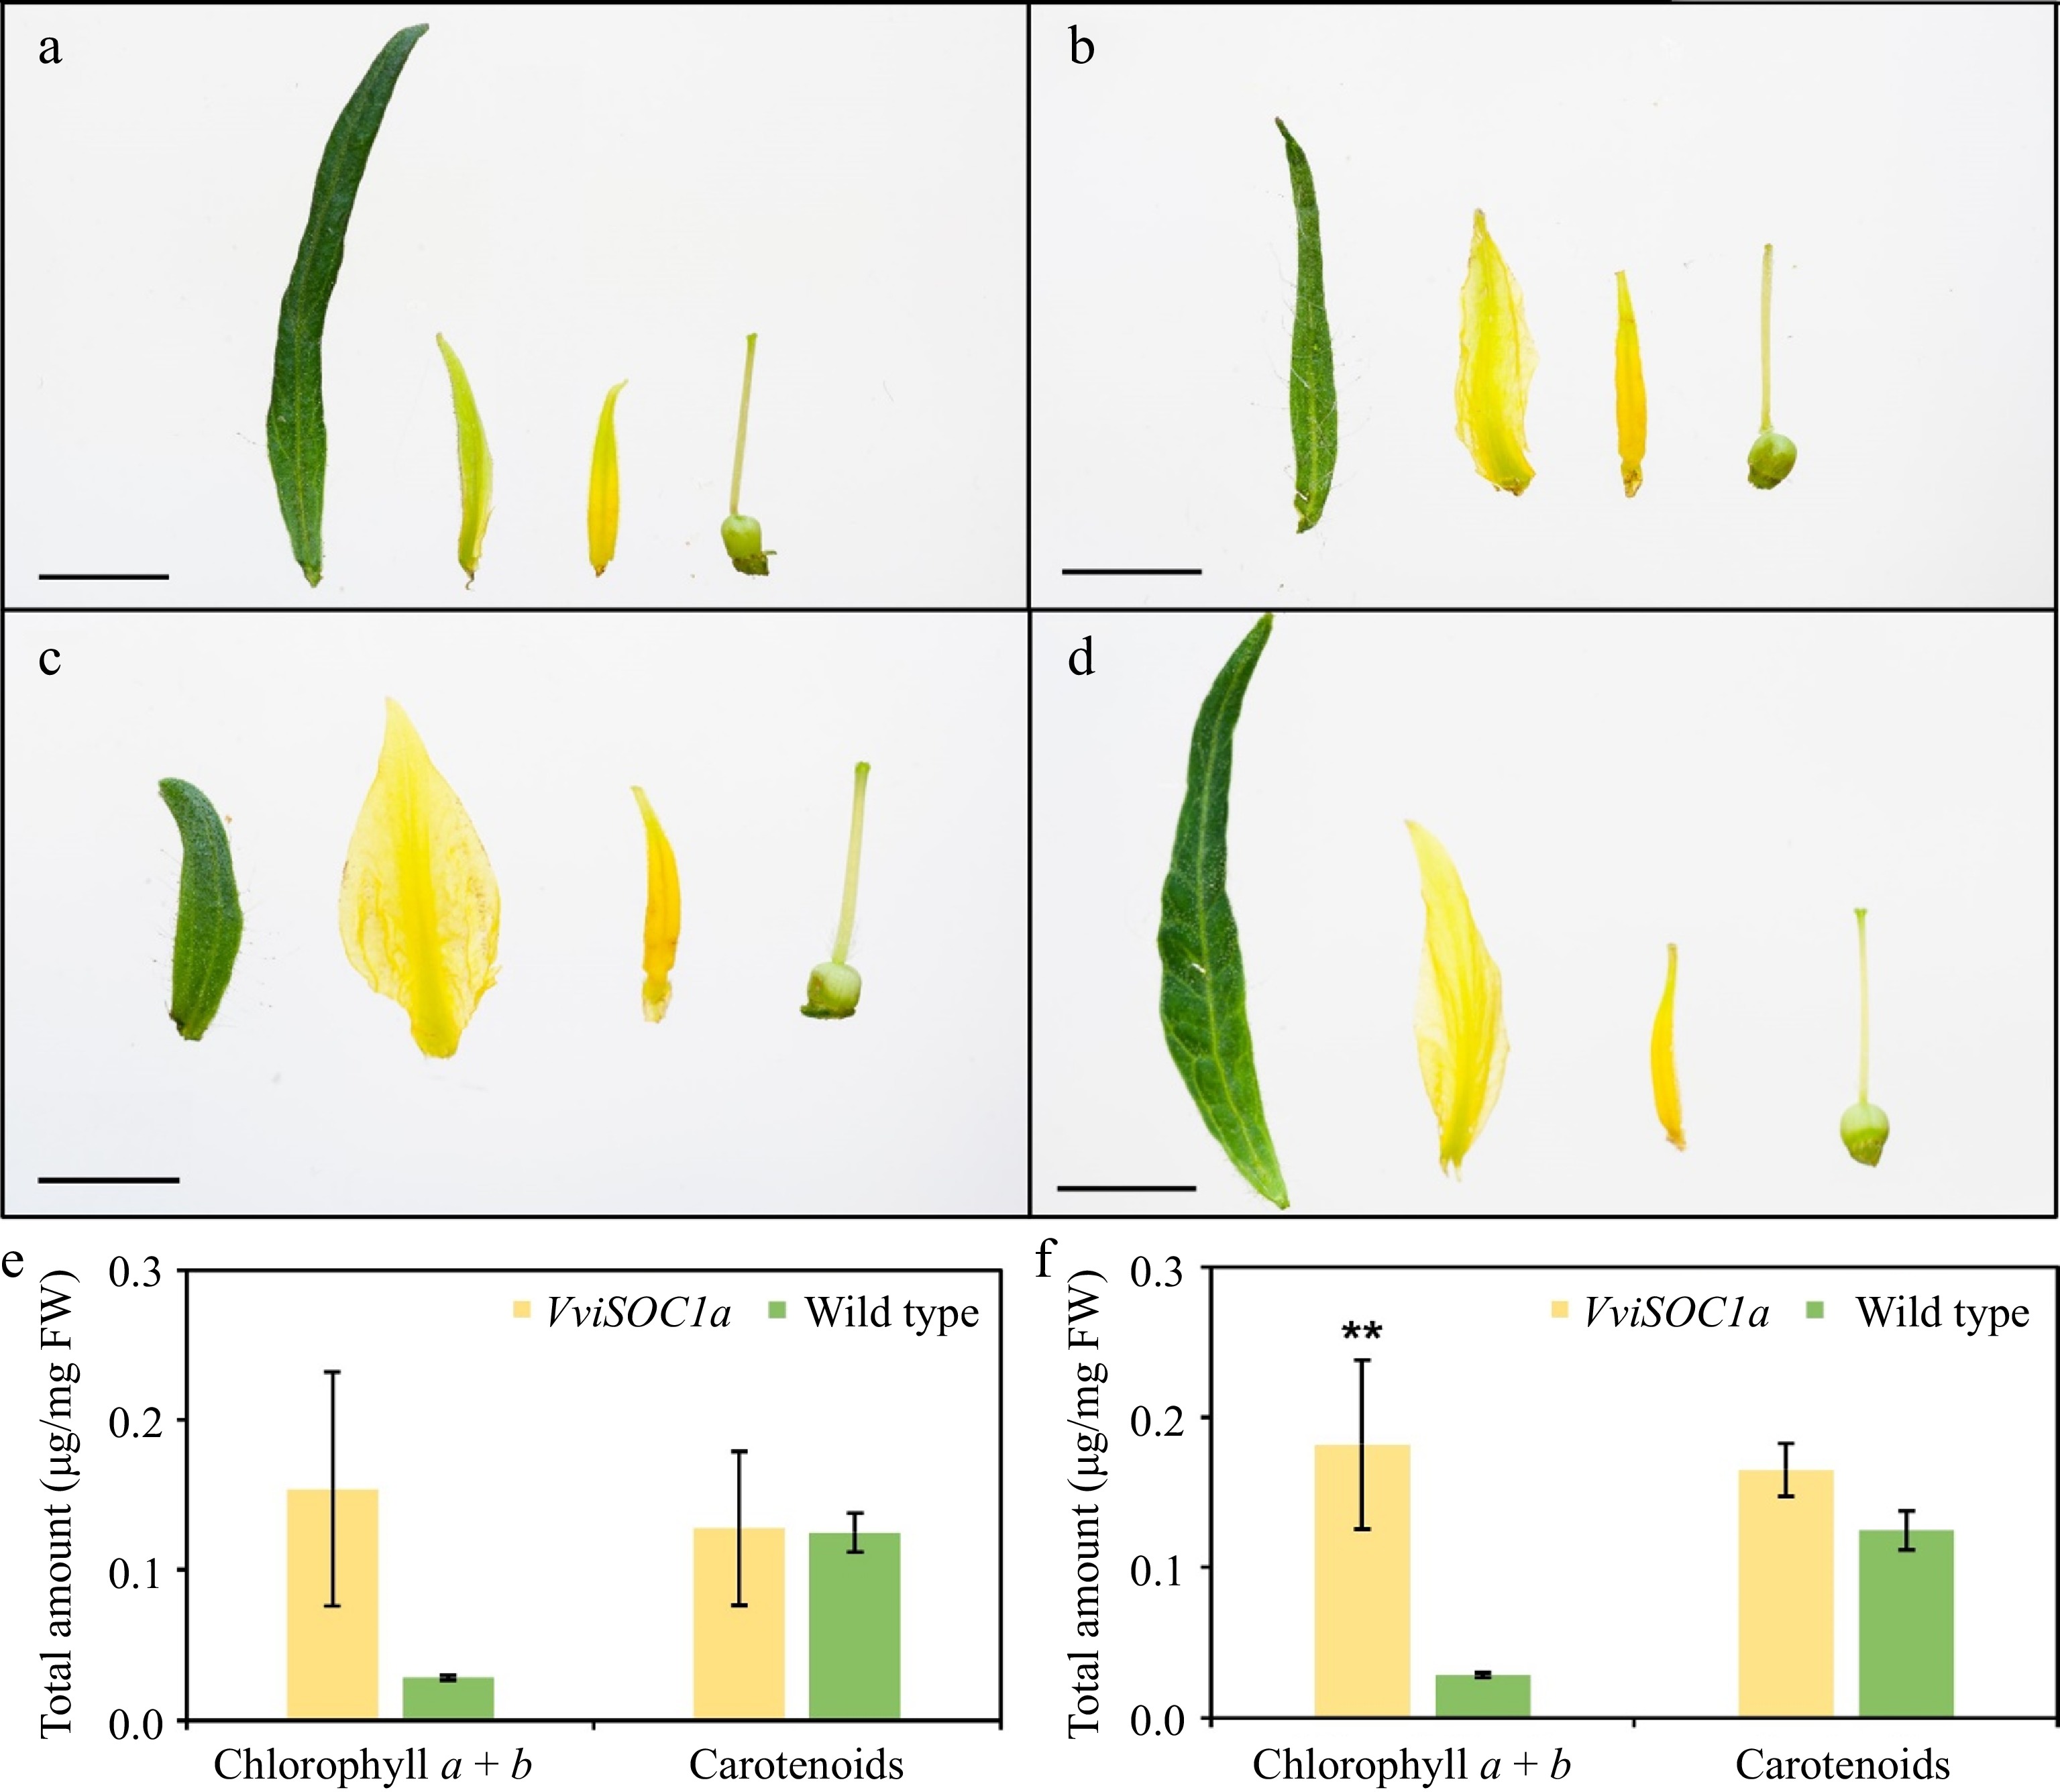
      Figure 4. 

      Floral organ phenotypes of tomato lines overexpressing VviSOC1a. Dissected floral organs (left to right: sepal, petal, stamen, and carpel) of (a) line 3 and (b) line 2 developed greener petals than (c) wild type, as well as (d) longer sepals that resemble the flowers of the rin mutant[30]. Scale bars represent 0.5 cm. Total chlorophyll (a + b) and carotenoid petal content of (e) three independently transformed lines and (f) two high expressing lines. Bars represent the mean and standard error of three biological replicates (n = 3), where (**) indicates moderate (p ≤ 0.05) significant differences compared to wild type.
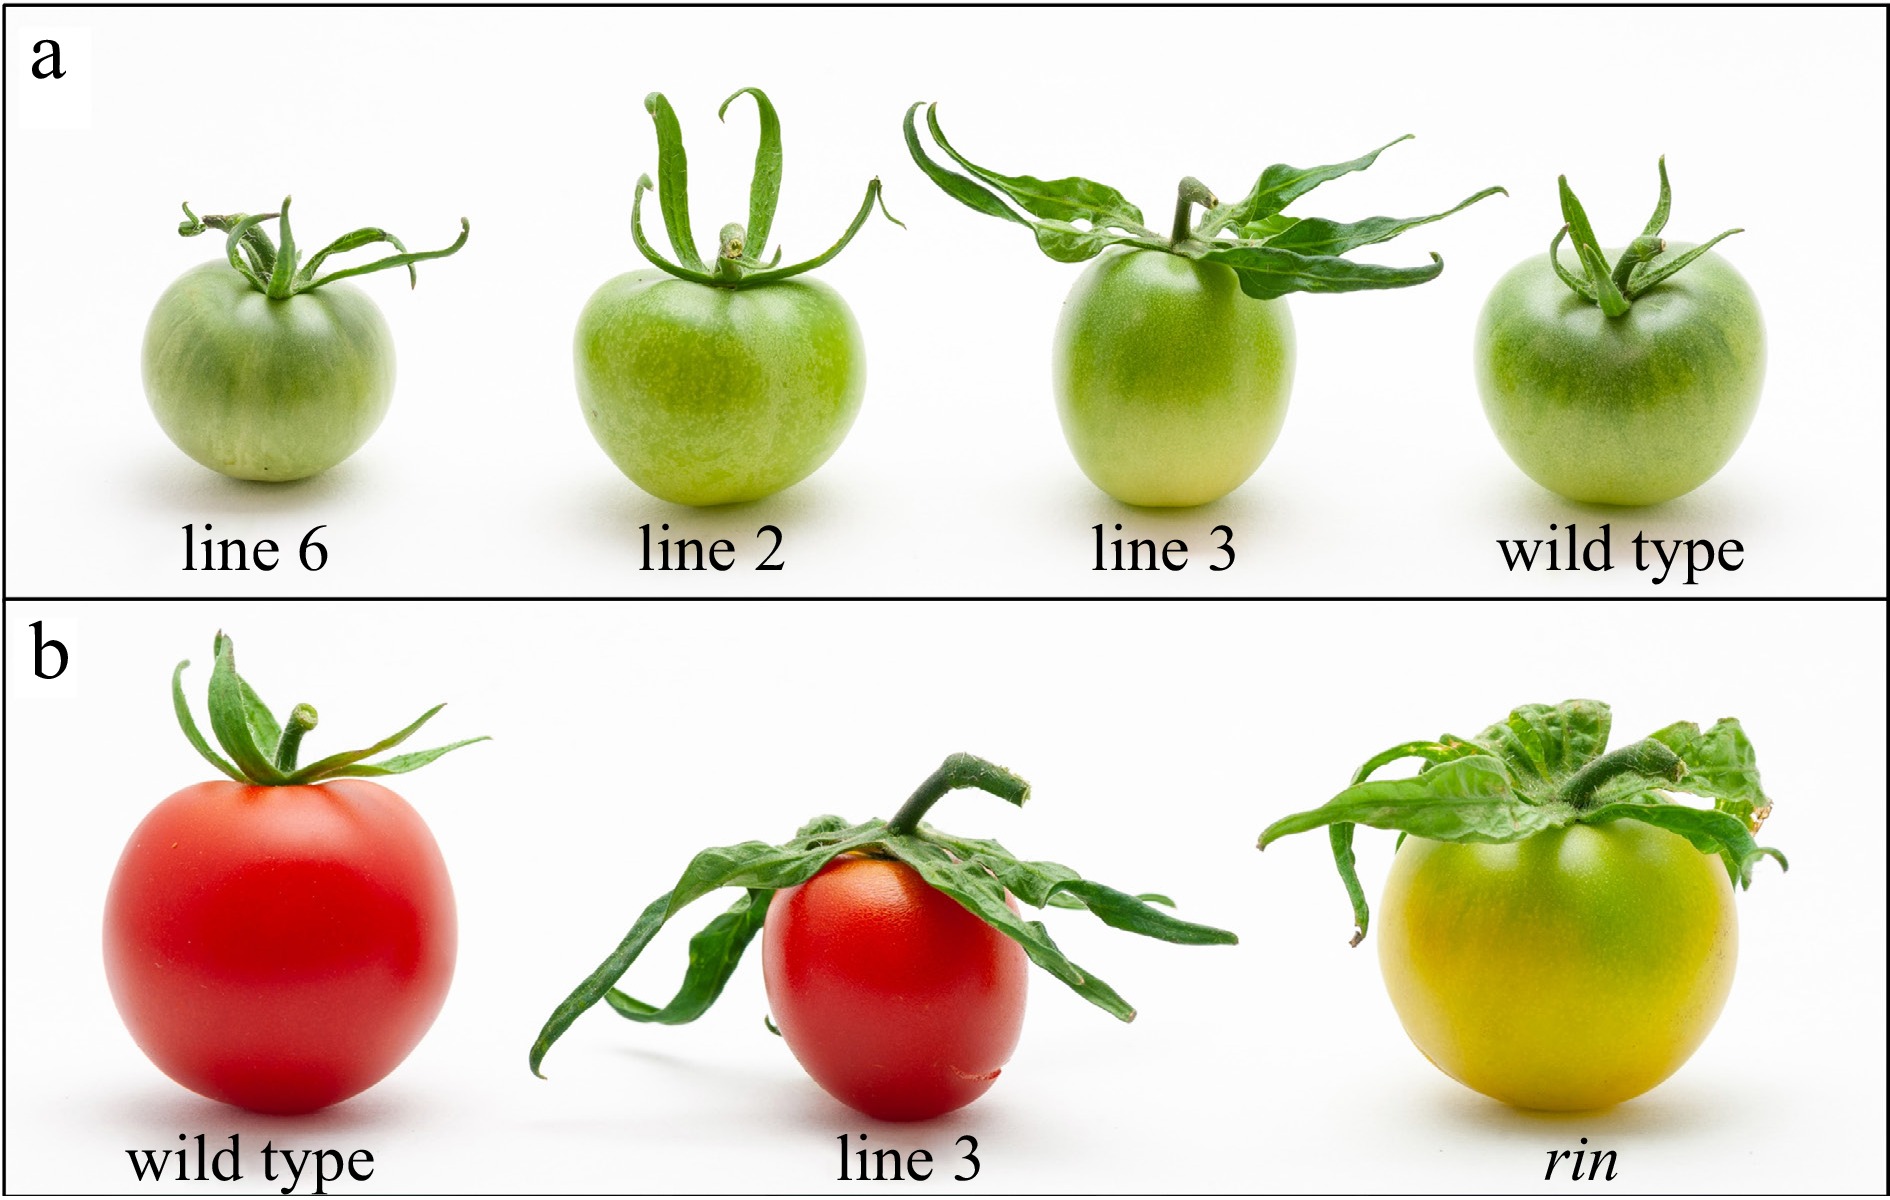
      Figure 5. 

      Fruit sepal phenotypes of tomato lines overexpressing VviSOC1a. Sepal development is displayed at two different fruit developmental stages, including (a) mature green and (b) red ripe. (a) Elongated sepals observed for lines 2 and 3 compared to line 6 and wild type. (b) Comparable sepal extension observed for line 3 and the rin mutant[30] in relation to wild type.

    • Gene expression analysis in young leaf (Fig. 6a) and floral sepal (Fig. 6b) tissues showed that VviSOC1a expression repressed the downstream tomato AP1/FUL (SlFUL2 and SlMACROCALYX [SlMC]), SVP (SlJOINTLESS [SlJ]), and SEP3 (SlCMB1, SlRIN, and SlMBP21) homologs, which are well-characterized flowering genes in Arabidopsis[2], in addition to the SOC1 homolog, SlSOC1-like. However, the down-regulation of these targets was tissue-dependent. It was further observed that the overexpression of VviSOC1a down-regulated genes involved in ripening (Fig. 6a, b), including SlCHALCONE SYNTHASE1 (SlCHS1), SlMYB12, and SlRIN[3941], as well as SlFUL2, which regulates both flowering and ripening[42,43]. Since each of these ripening-related genes has been shown to regulate and/or impact cuticle deposition, the transcript levels of important cuticle regulators and biosynthetic enzymes were also analyzed in the leaf tissue (Fig. 6c). It was found that cuticle regulators, SlMIXTA, and SlSHINE3 (SlSHN3)[44], were significantly repressed in VviSOC1a-OE lines, along with the downstream target gene SlCYP77. Contrarily, VviSOC1a was observed to induce the expression of other cuticle-related genes involved in the biosynthetic pathway, namely SlLACS2 and SlGDSL1 (Fig. 6c). Significantly down-regulated genes that are associated with sepal size regulation in tomato[4547] are highlighted in Fig. 6d. Importantly, these genes are homologous to flowering pathway members that form part of a positive feedback loop that is repressed in the presence of SOC1[2,37].
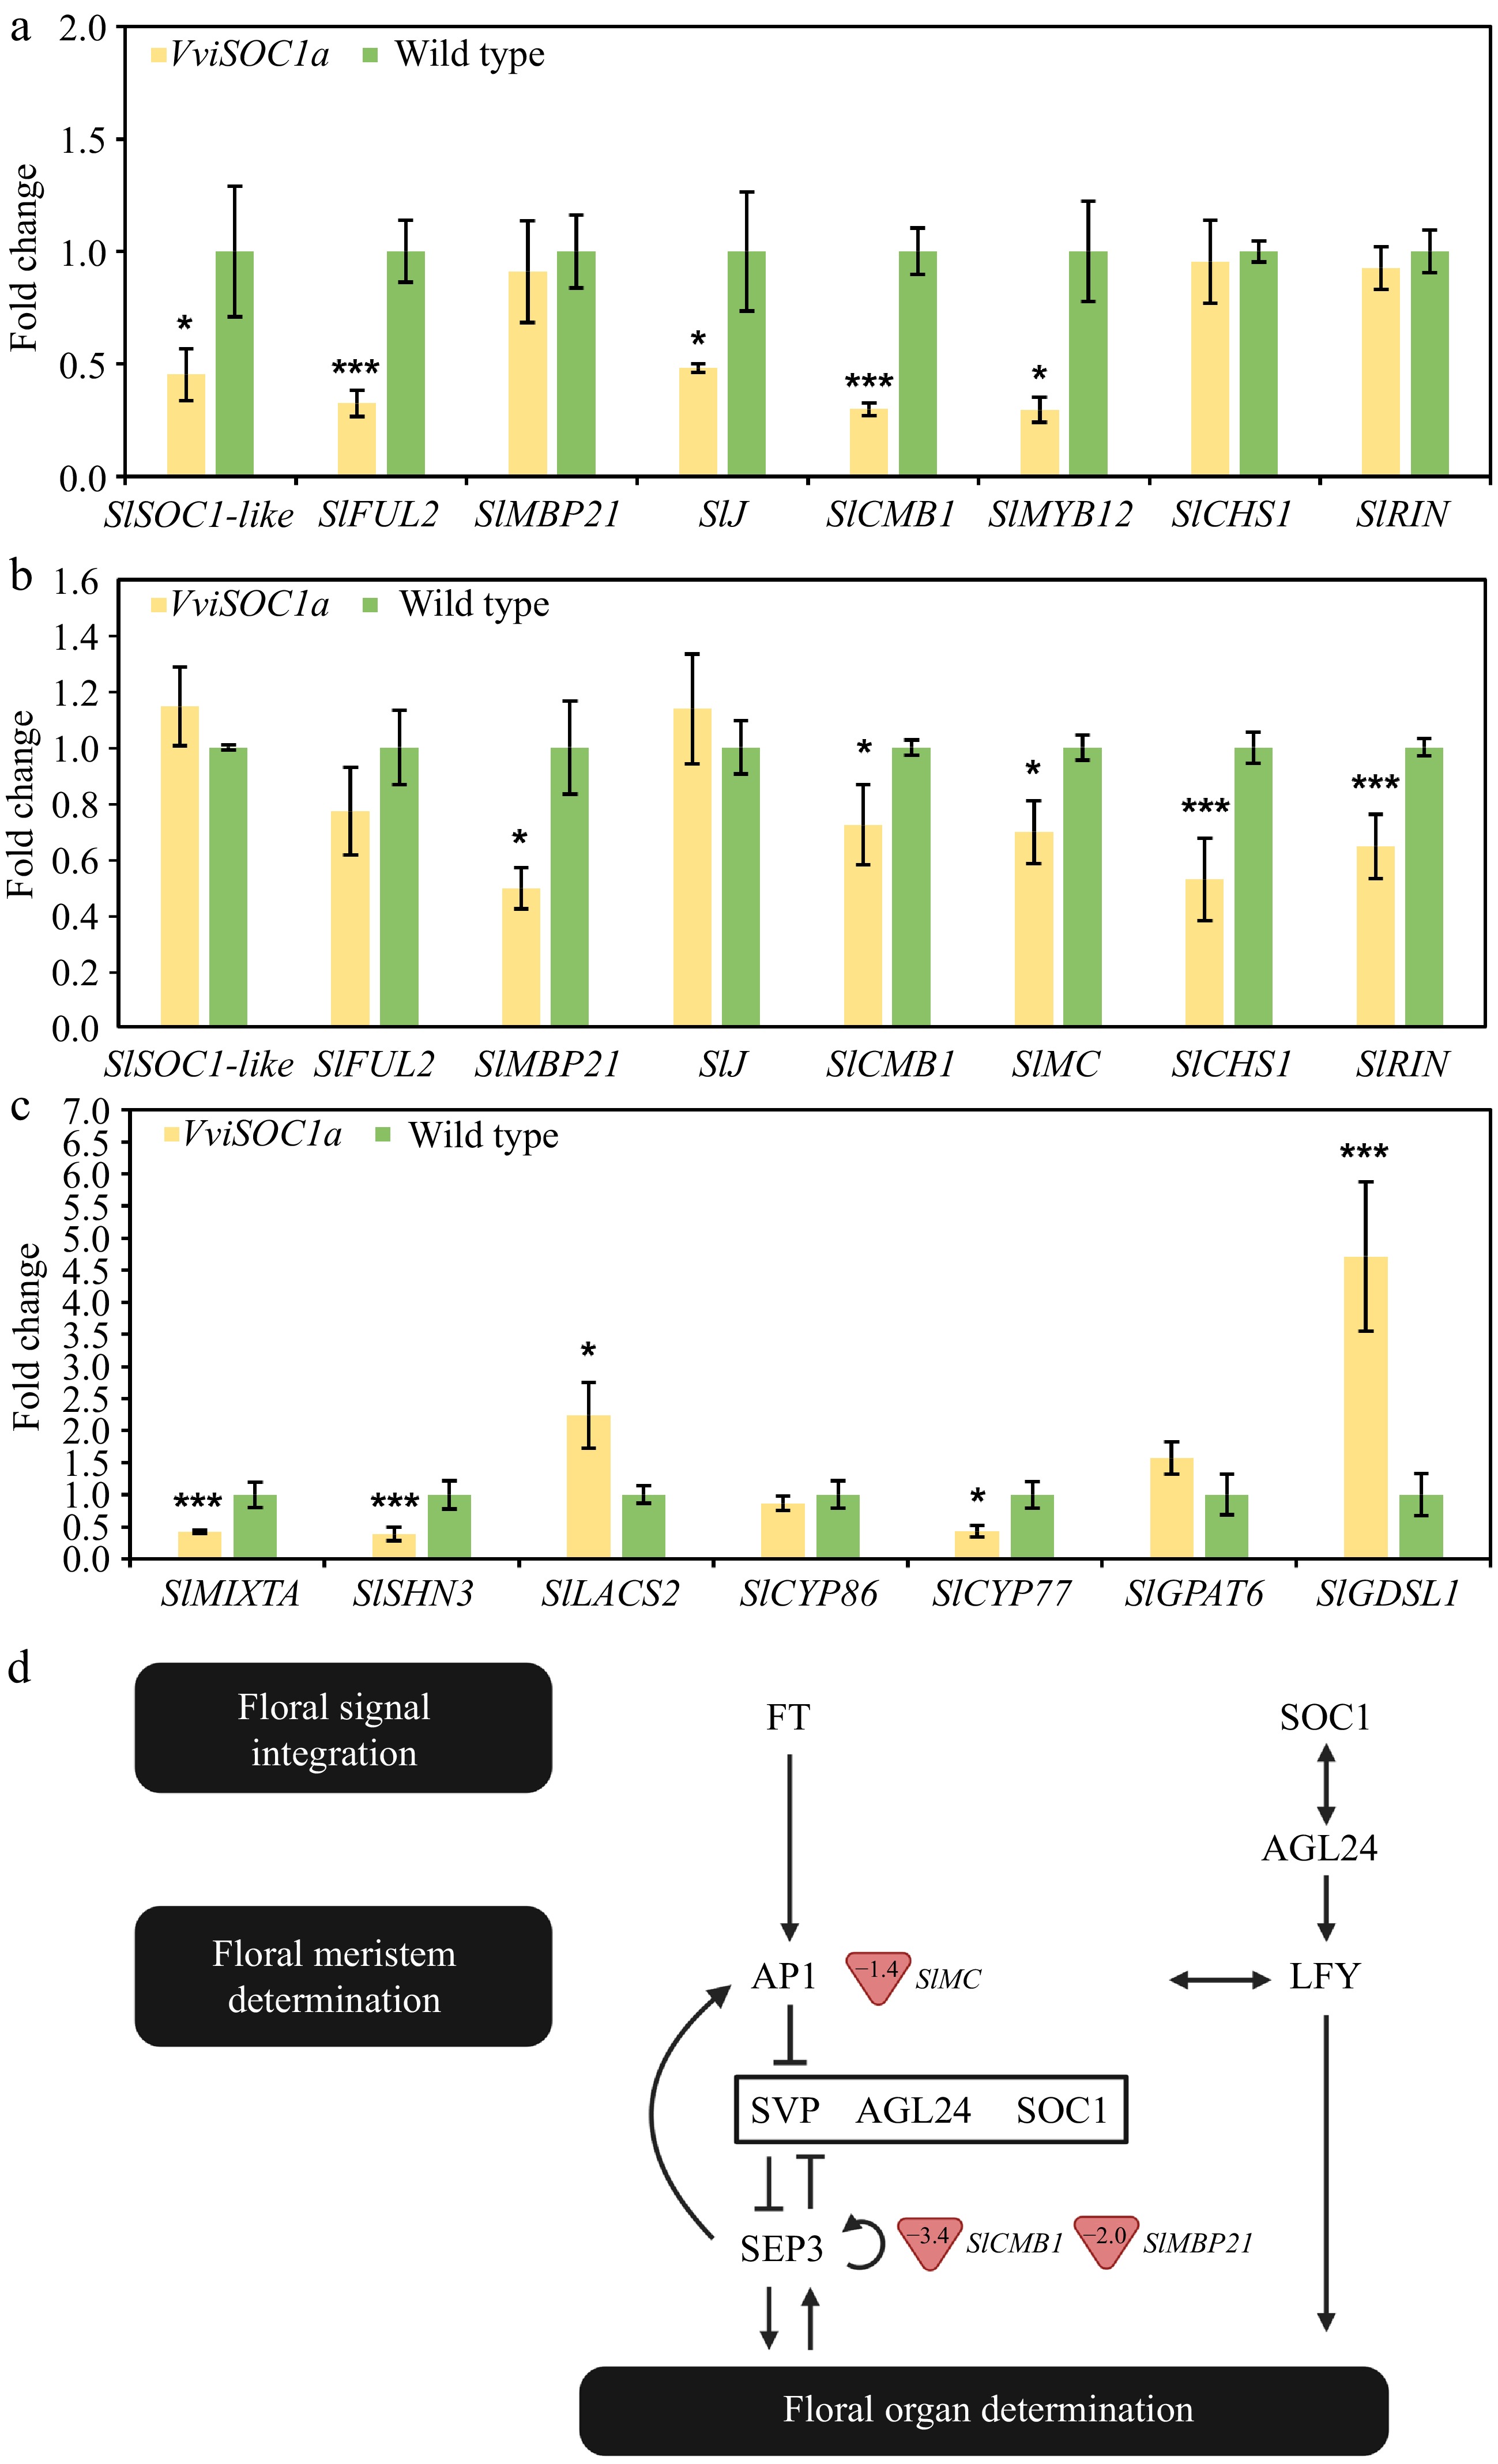
      Figure 6. 

      Expression analysis of putative VviSOC1a downstream target genes in acclimated overexpressing tomato lines using real-time qPCR analysis. Flowering and ripening-related gene expression in (a) young leaves and (b) open-flower sepals. (c) Cuticle-related gene expression in young leaf tissues. Bars represent the mean and standard error of three independently transformed biological replicates (n = 3), where (*) and (***) indicate low (p ≤ 0.1) and high (p ≤ 0.01) significant differences compared to wild type, respectively. (d) Schematic diagram of the general flowering pathway[2,37] showing tomato homologs involved in sepal size regulation with altered expression in the VviSOC1a-OE lines. Values in red triangles represent fold change.

    • The MADS-box SOC1 protein plays a vital function in the integration of external stimuli, such as those derived from temperature, photoperiod, hormone, and age-related pathways, to drive timely floral transition[2]. SOC1 gene homologs, in a multitude of plant species, have been shown to hold conserved functions in positively regulating the flowering time, causing hastened or delayed flowering phenotypes in constitutively expressed or knockout lines, respectively[48,35,36,4852]. These studies include the SOC1 homologs of tree peony (PsSOC1), cotton (GhSOC1), and strawberry (FaSOC1), which were found to share the highest protein homology (53%−58%) with VviSOC1a. While VviSOC1a has previously been reported to cause early bolting in Arabidopsis[18], the current study found no obvious changes to flowering time in VviSOC1a-OE tomato lines. However, SOC1 may hold divergent functions in tomato, since two previously characterized tomato SOC1 gene homologs, SlSTM3 and SlTM3, are involved in the promotion of floral meristem branching[36], as opposed to the repressive role held by SOC1 in Arabidopsis[53]. Further, only SlSTM3 displayed regulatory functions promoting floral transition, with SlTM3 expression (sharing higher sequence similarity with VviSOC1a, Fig. 1) having no effect on flowering time[36]. Nevertheless, VviSOC1a is expected to hold a function in floral signal integration in grapevine due to its increased expression in vegetative tissues, particularly young leaves and stems where floral inducive stimuli are perceived (Supplemental Fig. S2). VviSOC1a expression also persists into early flowering stages, although at a much lower level. This expression profile agrees with those described for SOC1 in Arabidopsis[54], and other crops such as kiwifruit (Actinidia spp.)[55] and cotton[7].

    • SOC1 holds another function during the early stages of floral meristem establishment in Arabidopsis, where it acts redundantly with SVP and AGL24 to negatively regulate organ identity genes[2]. This function is crucial for timely flowering and the prevention of premature organ differentiation. In relation to this, floral reversion phenotypes, including the development of enlarged leaf-like sepals and sepaloid-type petals, have commonly been reported for these three genes across multiple plant species[4,19,5659]. Similarly, the overexpression of VviSOC1a led to sepal elongation and the formation of leaf-like sepals (in severe cases), as well as greener sepaloid petals, in tomato plants (Figs 35). This phenotype may be, in part, explained by the repressive activity of SOC1 on SEP3, an E-function floral gene[13]. SEP3 directly interacts with AP1, an A-function floral identity protein, to drive sepal and petal specification[56]. In tomato, as in Arabidopsis, SEP3 (SlCMB1) and AP1 (SlMC) gene homologs have been characterized as sepal size regulators since their knockdown or knockout has led to elongated sepal phenotypes[47,56,60,61]. This function is further supported by the well-known rin mutant, which is the product of a knockout mutation involving the fusion of SlRIN (an E-function SEP gene) and SlMC[30]. In this mutant, leaf-like sepals are formed that are comparable to those observed in VviSOC1a overexpression lines (Figs 4 & 5). SlCMB1 has also been shown to directly interact with another E-function protein, namely SlMBP21, which holds a similar sepal size regulatory role[47,62]. Since all four genes (SIMC, SlRIN, SlCMB1, and SlMBP21) were shown to be down-regulated in VviSOC1a-OE sepal tissue (Fig. 6), it may be assumed that their combined suppression at later stages of floral organ development is what led to the observed sepal phenotype. Further, it is expected that SlCMB1 acts as a key contributor to the development of sepal-like petals and defective plant organs which, in acute cases, lead to sterile VviSOC1a transgenic lines (Fig. 3). This is because SEP3 is known to activate, in concert with LFY, B-function, and C-function identity genes to specify the petal, stamen, and carpel organs (Fig. 2), with double mutants developing comparable floral organ defects and vegetative petals in Arabidopsis[13]. The repressive activity of VviSOC1a on the SlCMB1 gene in tomato is likely conserved in grapevine, given that VviSOC1a and VviSEP3 display opposite expression profiles across vegetative and reproductive tissues (Supplemental Fig. S3). Despite the redundant functions held by SOC1 and SVP in repressing organ identity (Fig. 2), these two genes play antagonistic roles in Arabidopsis during the early floral transition, as floral activators and repressors, respectively[9]. This may explain the significant down-regulation of the tomato SVP homolog, SlJ, observed in young leaf tissues (where floral induction takes place), but not in the sepals of the VviSOC1a-OE lines (Fig. 6).

    • Since carpel specification precedes fruit development and ripening, it was speculated that VviSOC1a may impact the regulation of genes driving these later reproductive stages, through down-regulation of the SlCMB1 gene. In SlCMB1-silenced tomato lines, ripening-related genes, including SlRIN and SlFUL2 were significantly repressed, leading to delayed ripening phenotypes[63]. Although phenotypic ripening analyses were not conducted in the current study, these genes, in addition to those forming part of the flavonoid pathway (SlMYB12 and SlCHS), were also down-regulated in the VviSOC1a-OE tomato lines, supporting the likely impact of SlCMB1 suppression on ripening regulation (Fig. 6). However, gene expression was only analyzed in young leaves and sepals. Thus, confirmation of the relationship between VviSOC1a and ripening within a fruit background may be necessary to draw a more accurate conclusion. Previous studies have also shown that each of the ripening-related genes modulated in this study impact fruit cuticular properties linked to crop quality traits[3942]. As such, further analyses of the transcript levels of well-known cuticle genes were also performed in young leaf tissues, revealing that VviSOC1a may also affect cuticle formation, though contrasting findings were observed. For example, key cuticle regulators (SlMIXTA and SlSHN3) were significantly down-regulated, while VviSOC1a activated the expression of genes coding for cuticle biosynthetic enzymes (SlLACS2 and SlGDSL1)[44,64,65] (Fig. 6). In conclusion, further characterization is needed to better understand the impact of VviSOC1a function on ripening and fruit cuticle formation.

    • Functional divergence has been reported for SOC1 homologs in woody perennial plants, such as grapevine, which display significantly different growth habits to Arabidopsis. For one, floral induction in grapevine is believed to occur in the latent primary buds during summer, while flower development takes place the following spring after bud burst, a phenological event requiring a vernalization period[16,66]. In the woody perennials kiwifruit and poplar (Populus tremula × alba), SOC1 homologs have been shown to promote early bud break in overexpressing lines[55,67]. Interestingly, SOC1 was also found to hold a function in determining the annual growth habit of Arabidopsis, with soc1 ful double mutants displaying perennial growth characteristics[68]. The heightened expression observed for VviSOC1a in latent buds supports its predicted function in floral induction (Supplemental Fig. S2). The fact that VviSOC1a also displays expression peaks during bud burst stages, suggests that it may hold an additional role in bud dormancy release as well, similar to other woody perennials, however, functional confirmation is required.

    • SOC1 is an important regulator of flowering that has primarily been associated with floral initiation, though, additional functions related to the prevention of precocious floral organ development and the control of bud dormancy release have also been reported. The grapevine gene homolog, VviSOC1a, has previously been shown to reduce flowering time in Arabidopsis. In the current study, a new function involving the repression of floral organ differentiation was identified through heterologous expression in tomato. This role is likely mediated through the suppression of SIMC, SlRIN, SlCMB1, and SlMBP21, gene expression. An additional function for VviSOC1a relating to the regulation of bud dormancy release, based on gene expression data, is further postulated, though, experimental confirmation is still required. Another interesting result is the repressive activity of VviSOC1a on ripening and cuticle-related genes, since these hold important functions related to crop stress tolerance and quality[69]. As such, future research may benefit from the further characterization of VviSOC1a to better understand its influence on these crop traits.

    • The authors confirm their contribution to the paper as follows: study conception and design: Jolliffe JB, Lashbrooke JG; data collection: Jolliffe JB; analysis and interpretation of results: Jolliffe JB, Lashbrooke JG, Moser C, Pilati S; draft manuscript preparation: Jolliffe JB. All authors reviewed the results and approved the final version of the manuscript.

    • All data generated or analyzed during this study are included in this published article and its supplementary information files.

      • The Lashbrooke lab (Stellenbosch University) is funded by Winetech, South Africa. This work was funded by a FIRST grant from Fondazione Edmund Mach, Italy.

      • The authors declare that they have no conflict of interest.

      • Copyright: © 2024 by the author(s). Published by Maximum Academic Press, Fayetteville, GA. This article is an open access article distributed under Creative Commons Attribution License (CC BY 4.0), visit https://creativecommons.org/licenses/by/4.0/.
    Figure (6)  References (69)
  • About this article
    Cite this article
    Jolliffe JB, Moser C, Pilati S, Lashbrooke JG. 2024. The grapevine SOC1 homolog, VviMADS8/SOC1a, regulates floral organ specification in tomato. Fruit Research 4: e029 doi: 10.48130/frures-0024-0023
    Jolliffe JB, Moser C, Pilati S, Lashbrooke JG. 2024. The grapevine SOC1 homolog, VviMADS8/SOC1a, regulates floral organ specification in tomato. Fruit Research 4: e029 doi: 10.48130/frures-0024-0023

Catalog

  • About this article

/

DownLoad:  Full-Size Img  PowerPoint
Return
Return