-
The buffel grasses (Cenchrus ciliaris, Cenchrus pennisetiformis and Cenchrus setiger) have been extensively used as forage grasses in Australia since early in the twentieth century and most likely have middle eastern and African origins[1]. Buffel grasses are also used extensively elsewhere in the world, including the Americas, Africa, the Middle East and Asian regions. As a pasture forage, it has many desirable attributes, including drought and salinity tolerance, high biomass production, and the ability to withstand high grazing pressure, making it suitable for drier sub-tropical and tropical regions such as those found in the northern regions of Australia[2,3]. It has also been used to successfully rehabilitate mine sites and degraded slopes; however, this has led to buffel becoming invasive and unwanted in non-pastoral settings, with encroachment on native habitats, which have led to other consequences such as altered wildfire regimes and environmental damage[1,4].
Its successful use in grazing has meant that buffel research has focused on increasing forage quality by assessing the ruminal digestibility of different accessions grown under various environmental conditions such as drought, and alternative grazing management strategies. A number of studies have investigated digestibility in relation to one or two key cell wall components; however, the scope of these projects has been limited by the number of individual samples able to be screened by traditional wet chemistry methods[5−8]. Cell wall composition and digestibility analysis of forage species, such as bermudagrass and corn silages, has identified that breeding efforts to increase the total amount of cell wall available, measured as NDF, is a more important source of metabolizable energy as compared with reducing lignin content to increase the digestibility of the cell wall[9]. Cell wall polysaccharides are degraded at varying rates in the rumen, and with increasing cell maturity as plants develop, increases in cellulose, hemicellulose and indigestible components such as lignin are observed, leading to an overall decline in digestibility. Hence, forages can have the same total cell wall or NDF content but vary in digestibility[10] The lower digestibility of forages leads to higher retention in the rumen and limits the intake of animals[11]. An important driver of rumen load and therefore intake, is iNDF, which is directly related to the potential digestibility of NDF (pdNDF) and has the greatest impact on energy supply to the ruminant[10].
A knowledge of differences in cell wall composition and subsequent changes in digestibility that may occur within a plant, can be used to devise improved grazing management strategies. The PUP (proportion of uncontaminated, ungrazed pasture) is a grazing system based on the grazing animal's horizontal utilization of different layers in the canopy[12], whereby animals prefer to graze the upper strata where the concentration of nutrients is typically higher[13]. Both horizontal stratification and tissue type influence the digestibility and quality of forage. These studies highlight the importance of being able to quickly analyze different parts of the plant to provide a more accurate nutrient assessment of a pasture; particularly in relation to cell wall digestibility which determines metabolizable energy and intake. More immediate information on pasture quality will allow for more effective pasture management decisions such as stocking rate, stocking time, harvesting time or depth.
Analyzing cell wall material and potential digestibility through the assessment of iNDF via traditional methods is time-consuming and expensive. However, chemometric regression models utilizing spectroscopy have been previously utilized for analyzing forage and cell wall material with high accuracy based on the R2 and RMSE values achieved by these models[14−16]. This study aimed to determine the relationships between cell wall composition, NDF and iNDF values, across different strata levels and between stem and leaf tissues for a large and diverse collection of Cenchrus accessions.
-
This study included 296 different accessions of buffel assembled from different sources, including novel accessions collected from various pastoral zones throughout Australia and accessions with international origins from the Australia Pastures Genebank. The Genebank also provided a source of several Cenchrus species other than those traditionally used for pasture. Accessions propagated either from single vegetative cuttings or seed were first grown in pots in a glasshouse at The University of Queensland St Lucia Campus (Australia), then in 2016 transferred and established in 1.5 m × 1.5 m swards at the University of Queensland Gatton field station (27.5554° S, 152.3372° E). An augmented row-column design was utilized for the experiment, with six latinized Australian commercial cultivars (American, Biloela, Cloncurry, Gayndah, Nunbank and West Australian) used as checks. The experiment consisted of a single replicate of the 296 accessions and six replicates of the commercial checks (Supplemental Fig. S1). The name and origin of each of the accessions was collated and is available in the Supplemental File S1.
Most of the accessions grew well until the first sampling date in 2019. The experimental site was burned on the 20th of March 2019 to stimulate regrowth and delineate plot boundaries, sprayed with post-emergent herbicide Stomp® 440 to control weeds and fertilized with 150 kg/ha of urea. The experimental plot received 110 mm of rainfall shortly after. Buffel plants were sampled on the 20th of June 2019, when the majority of plants in all plots had set seed. Ten tillers were selected randomly from each plot from different individual plants, seed heads removed, and the height measured before being cut in half, with leaves and leaf sheath separated from stem material post drying to generate the four separate tissues to be analyzed; namely lower stem, lower leaf, upper stem and upper leaf (Fig. 1). For the check accessions, 20 tillers were collected rather than 10 to increase the amount of material available for analysis.
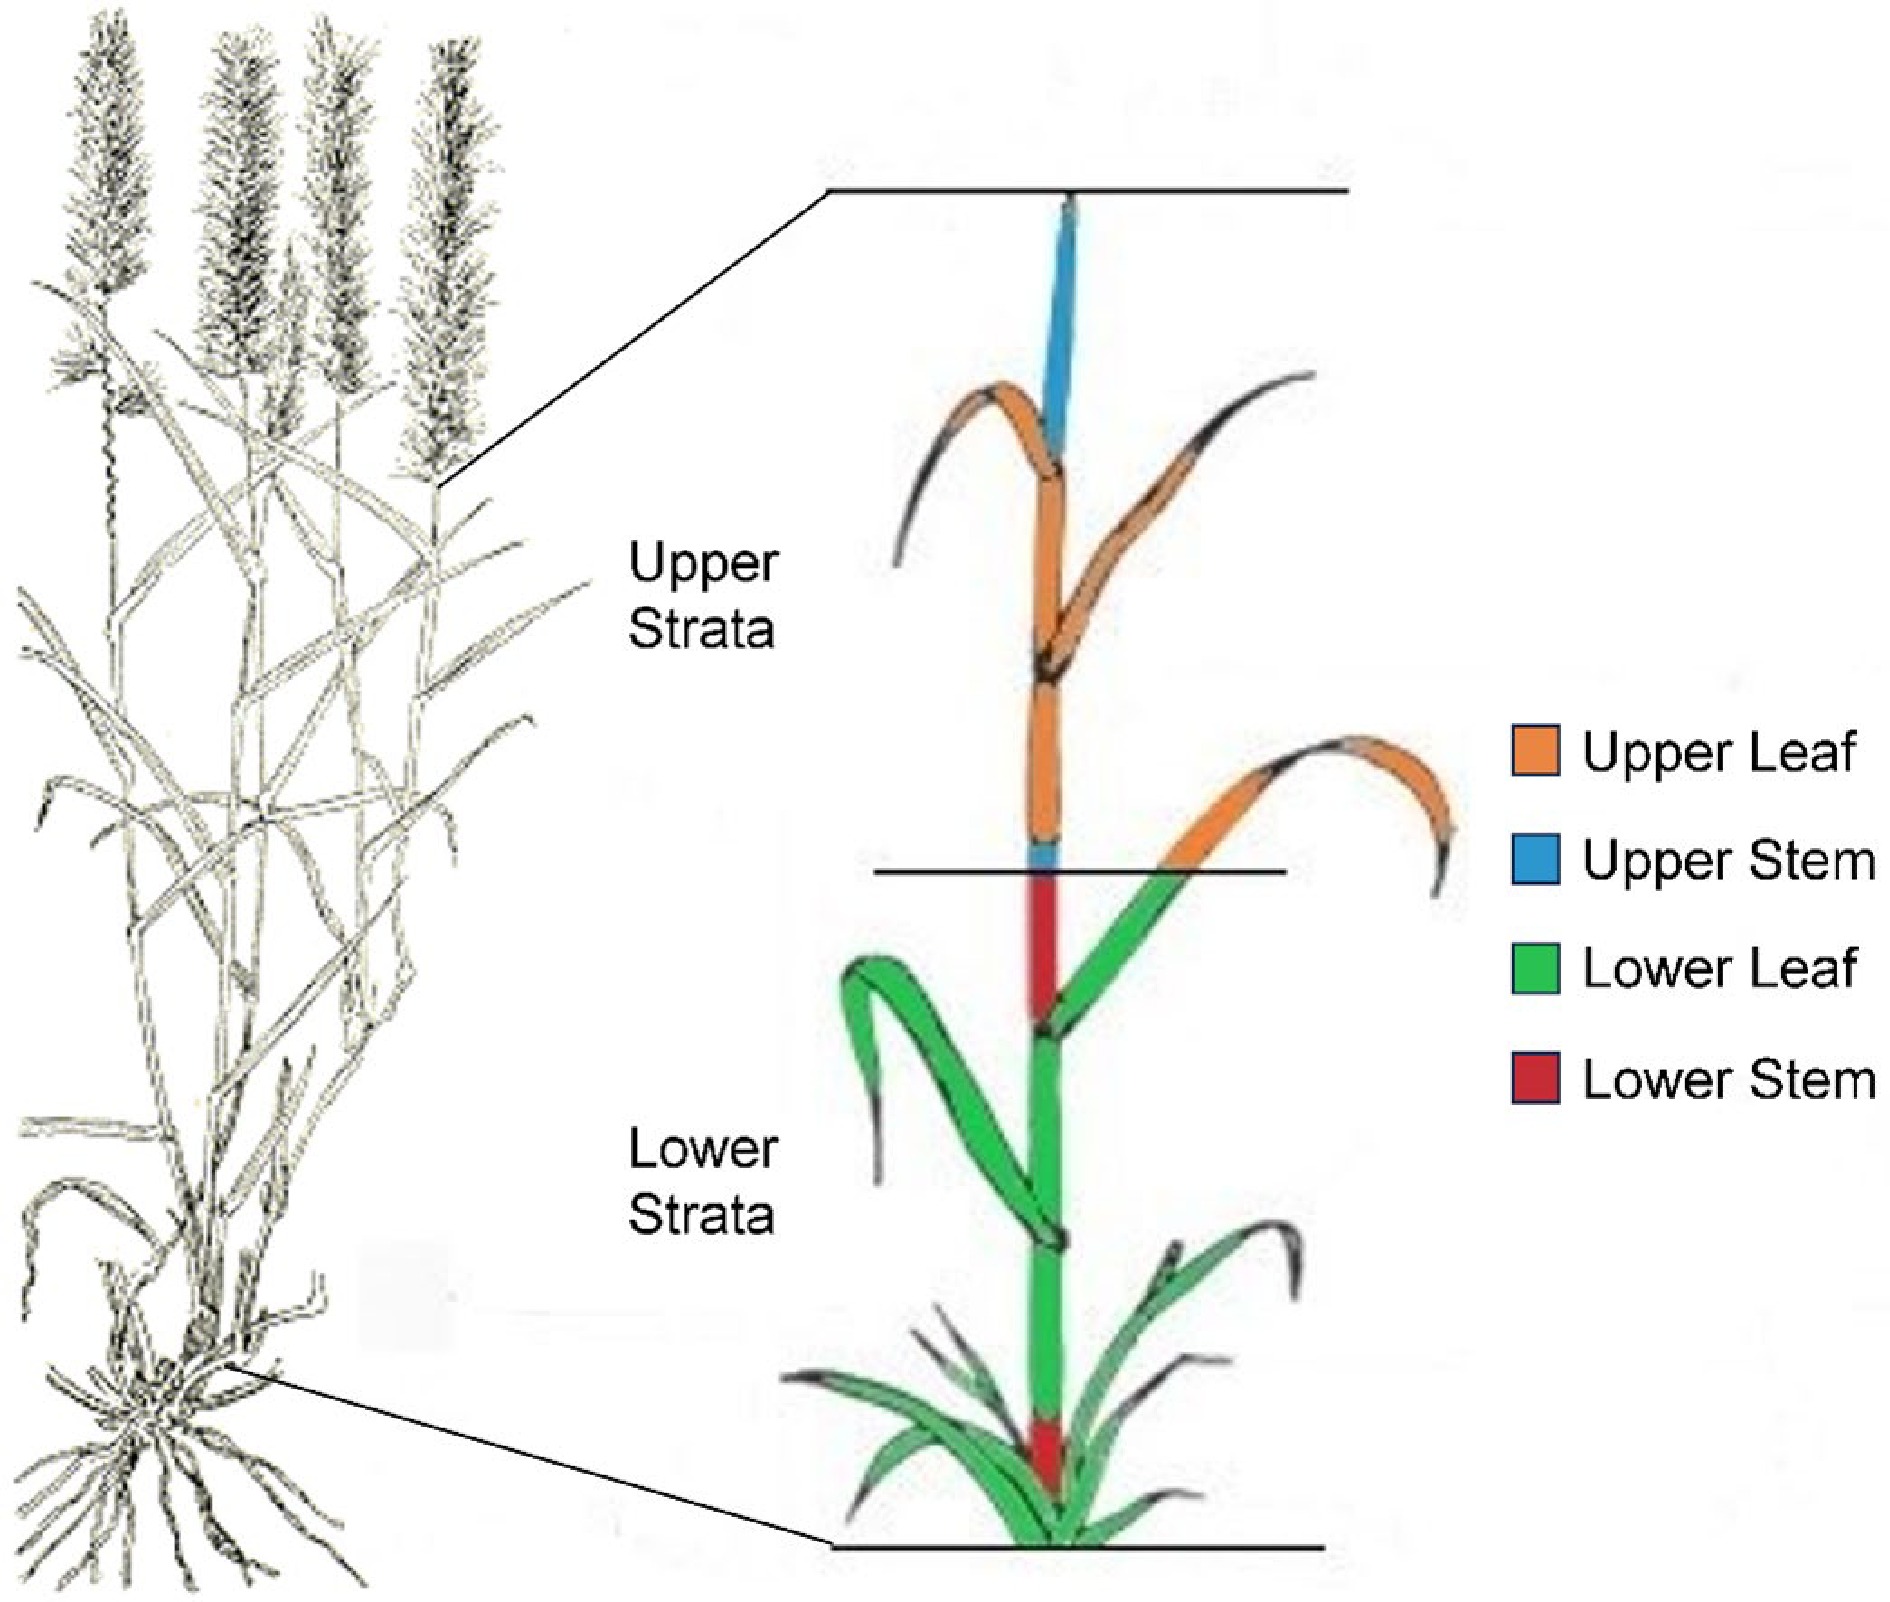
Figure 1.
Buffel accessions were harvested, seed heads removed, divided into upper and lower strata, oven dried and each stratum separated into leaf and stem tissue. The four tissues are indicated by color; lower stem (red), lower leaf including sheath (green), upper stem (blue), and upper leaf including sheath (orange).
The combination of treatments applied in March 2019 promoted excellent growth and on the 30th of December 2019, the plots were slashed to a height of 15 cm, raked to remove all biomass; then on the 7th of January 2020 the experiment was fertilized with 150 kg/ha urea with 50 mm of irrigation applied. A further 50 mm of irrigation was applied a week later, on the 15th of January; however, due to the COVID-19 pandemic leading to Australian state border closures, it was not possible to collect plant material in 2020 and so sampling was delayed until June 2021 with the plots slashed in December 2020 and the same management procedures as described above implemented during the intervening period. The trial was rain fed between the first and second harvests, with the experimental plot receiving a total of 512 mm. By the time of the 2021 sampling, some accessions had perished. Consequently, only samples that were present for both harvests were used in the analyses described in this study.
Preparation of samples for analysis
-
All harvested samples, once dried at 60 °C overnight, were separated into upper leaf (including leaf sheath tissue), upper stem, lower leaf and lower stem (see Fig. 1), weighed and ground to a fine powder using a customized roller mill[15]. Approximately 10−20 mg of each ground sample was placed on a Perkin Elmer Spectrum II FTIR® (Perkin Elmer, USA) fitted with a Universal Attenuated Total Reflectance (UATR) accessory and scanned four times to produce an average spectrum for each sampled tissue. Spectra were then analyzed using PLSR models to determine the cell wall, extractive, water, total cell wall carbohydrates, total lignin, glucan, xylan, galactan, arabinan, mannan, AIL, ASL, ash, NDF and iNDF content for each accession.
Determination of reference data
-
PLSR models were generated to predict individual biomass and cell wall components NDF (% DM) and iNDF (% DM) for each buffel accession in the trial. To generate a PLSR model, a reference set of 120 samples was chosen to provide the greatest variation in cell wall composition. From the 2019 harvest, the 88 of 120 samples were comprised of 22 lower leaf, 25 lower stem, 21 upper leaf and 20 upper stem samples. From the 2021 harvest, the 32 samples were comprised of six lower leaf, six lower stem, 10 upper leaf and 10 upper stem samples. For biomass and cell wall composition, any non-cell wall components were determined by freeze-drying the sample to calculate water content. Then, all extractives were removed by three separate washes of 70% ethanol and three of water at 40°C and freeze-dried again to produce the isolated cell wall. The isolated cell wall material then underwent a two-stage acid hydrolysis with the hydrolysis residue used to determine AIL and ash content, while the hydrolysate was used for measuring glucan, xylan, arabinan, galactan, and mannan by High-Pressure Liquid Chromatography (HPLC; Agilent 1260 series® HPLC equipped with a refractive index detector and Bio-Rad® HPX-87P column)[17]. ASL was determined by measuring absorbance at 280 nm on a UV nanodrop spectrometer (Thermo Scientific nanodrop 1000®)[17]. All results were expressed in terms of mg/g DW from the original sample to more closely reflect the sample scanned by FTIR, an approach that was able to produce higher quality predictive models as opposed to units expressed in terms of mg/g or percentage cell wall produced by the two-stage cell wall analysis.
A different set of 120 reference samples was chosen to generate the NDF and iNDF models, as the amount of material available for each sample was insufficient to complete both types of analysis. Of the 52 samples from the 2019 harvest, 16 were lower leaf, 15 lower stem, 11 upper leaf and 10 upper stem. From the 2021 harvest, the 68 samples were comprised of 21 lower leaf, 17 lower stem, 20 upper leaf and 10 upper stem. Samples were milled with a rotor mill (Retsch, Haan, Germany) using a 2 mm sieve prior to the analysis. The remaining sample was roller milled to a fine powder for FTIR analysis using a customized roller mill[15].
NDF (%DM) content was determined according to the method of Goering and Van Soest (1970)[18] modified by Mertens (2002)[19] using the ANKOM system with filter bags (F57, ANKOM Technology, Macedon, USA). The calculation for this determination was:
Dry weight (g) = Weight (After dry + Bag) – Bag weight
NDF (g) = Weight (After NDF + Bag) – Bag weight
NDF % DM = NDF (g)/Fry sample weight (g) × 100
For iNDF, samples were analyzed using an in vitro procedure (Daisy incubator, ANKOM Technology Corp, Fairport, NY, USA). Briefly, 250–500 mg of ground plant material was weighed into ANKOM filter bags (F57, ANKOM Technology, Macedon) and pre-rinsed in acetone. Each bag was sealed, shaken, and placed into bottles with three replicates for each sample. Each digestion bottle contained 1,520 mL of media and 80 mL of reducing agents in each bottle according to Goering & Van Soest[18] modified by Mertens et al.[19] and warmed to 39°C. Rumen fluid (400 mL) was added, and bottles were purged with CO2. Samples were incubated for a total of 10 d for iNDF determination whereby after 5 d (120 h), incubations were re-inoculated with new medium and rumen fluid and incubated for another 5 d. At the end of the total incubation period, samples were washed continuously with cold water until the water was clear. Incubated samples were then analyzed for NDF as described previously[18,19]. Calculations for iNDF are as follows:
Dry weight (g) = Weight (After dry + bag) – Bag weight
iNDF (g) = Weight (After NDF + bag) – Bag weight
iNDF % DM = iNDF (g)/Dry sample weight (g) × 100
Three rumen-fistulated Holstein steers were used as the inoculum source for the study. The steers were fed tropical pastures and some lucerne for 10 d prior to rumen collection. Rumen contents (approximately 5 L) were collected into a preheated thermos 4 h after feeding and taken to the laboratory and immediately flushed with CO2, blended and squeezed through two layers of cheesecloth.
Generation of cell wall and fiber models for buffel grass
-
PLSR models were generated using the Unscrambler® (Camo analytics, Bedford, MA, USA) software. FTIR spectra from the 120 samples chosen to be the reference set for each respective variable modelled, were used as the prediction input while the reference value measured for that individual variable was the reference input for the model. Combinations of spectral pre-treatments such as area normalization, smoothing, Standard Normal Variate (SNV), Multiplicative Scattering Correction (MSC) and Savitsky-Golay first and second derivatives, were trialed to improve the model performance. MSC followed by the application of a Savitzky-Golay second derivative transformation, resulted in the best outcome for generating models for each variable measured. Validation of models was undertaken using the cross-validation method with a K-fold value of nine to ward against overfitting models. Potential outliers were identified as being a distance of two standard deviations away from the line of best fit, however outliers were only removed if they improved the model, based on the cross-validation metrics. All tissue types were represented in the generation of reference data for training the models to avoid any possible bias towards any one tissue or tissues.
-
An ideal threshold set for models was a cross-validated R2 above 0.80, which is comparable to that reported in other studies, and the lowest possible RMSE for the cross-validated predictions[14,16,20]. Predicted vs reference plots of total carbohydrates (Fig. 2a) and total lignin (Fig. 2b) display both the calibration (all samples) and cross-validated predictions (average prediction from the nine validation folds), with the cross-validated R2 (cvR2) and RMSE (cvRMSE) used to evaluate the quality of models for assessing the collection. The total carbohydrates model had a cvR2 of 0.88 and a cvRMSE of 26 mg/gDW while total lignin had a cvR2 of 0.84 and a cvRMSE of 7.7 mg/gDW, values which met the aims for this project. The range of R2 values were between 0.8 and 0.95, with the predicted versus reference plots for the remaining biomass components (cell wall, extractives, water, glucan, xylan, galactan, arabinan, mannan, AIL, ASL and ash) presented in Supplemental Figs S2−S12. The amount of mannan present in 36 samples used in the training set was insufficient to be measured by HPLC, hence these samples were unable to be used for training the model, resulting in poor predictive performance. Low mannan content was not unexpected as mannans are more prominent in seed cell walls in grasses whereas this study was focused on vegetative tissue where concentrations are lower[21].
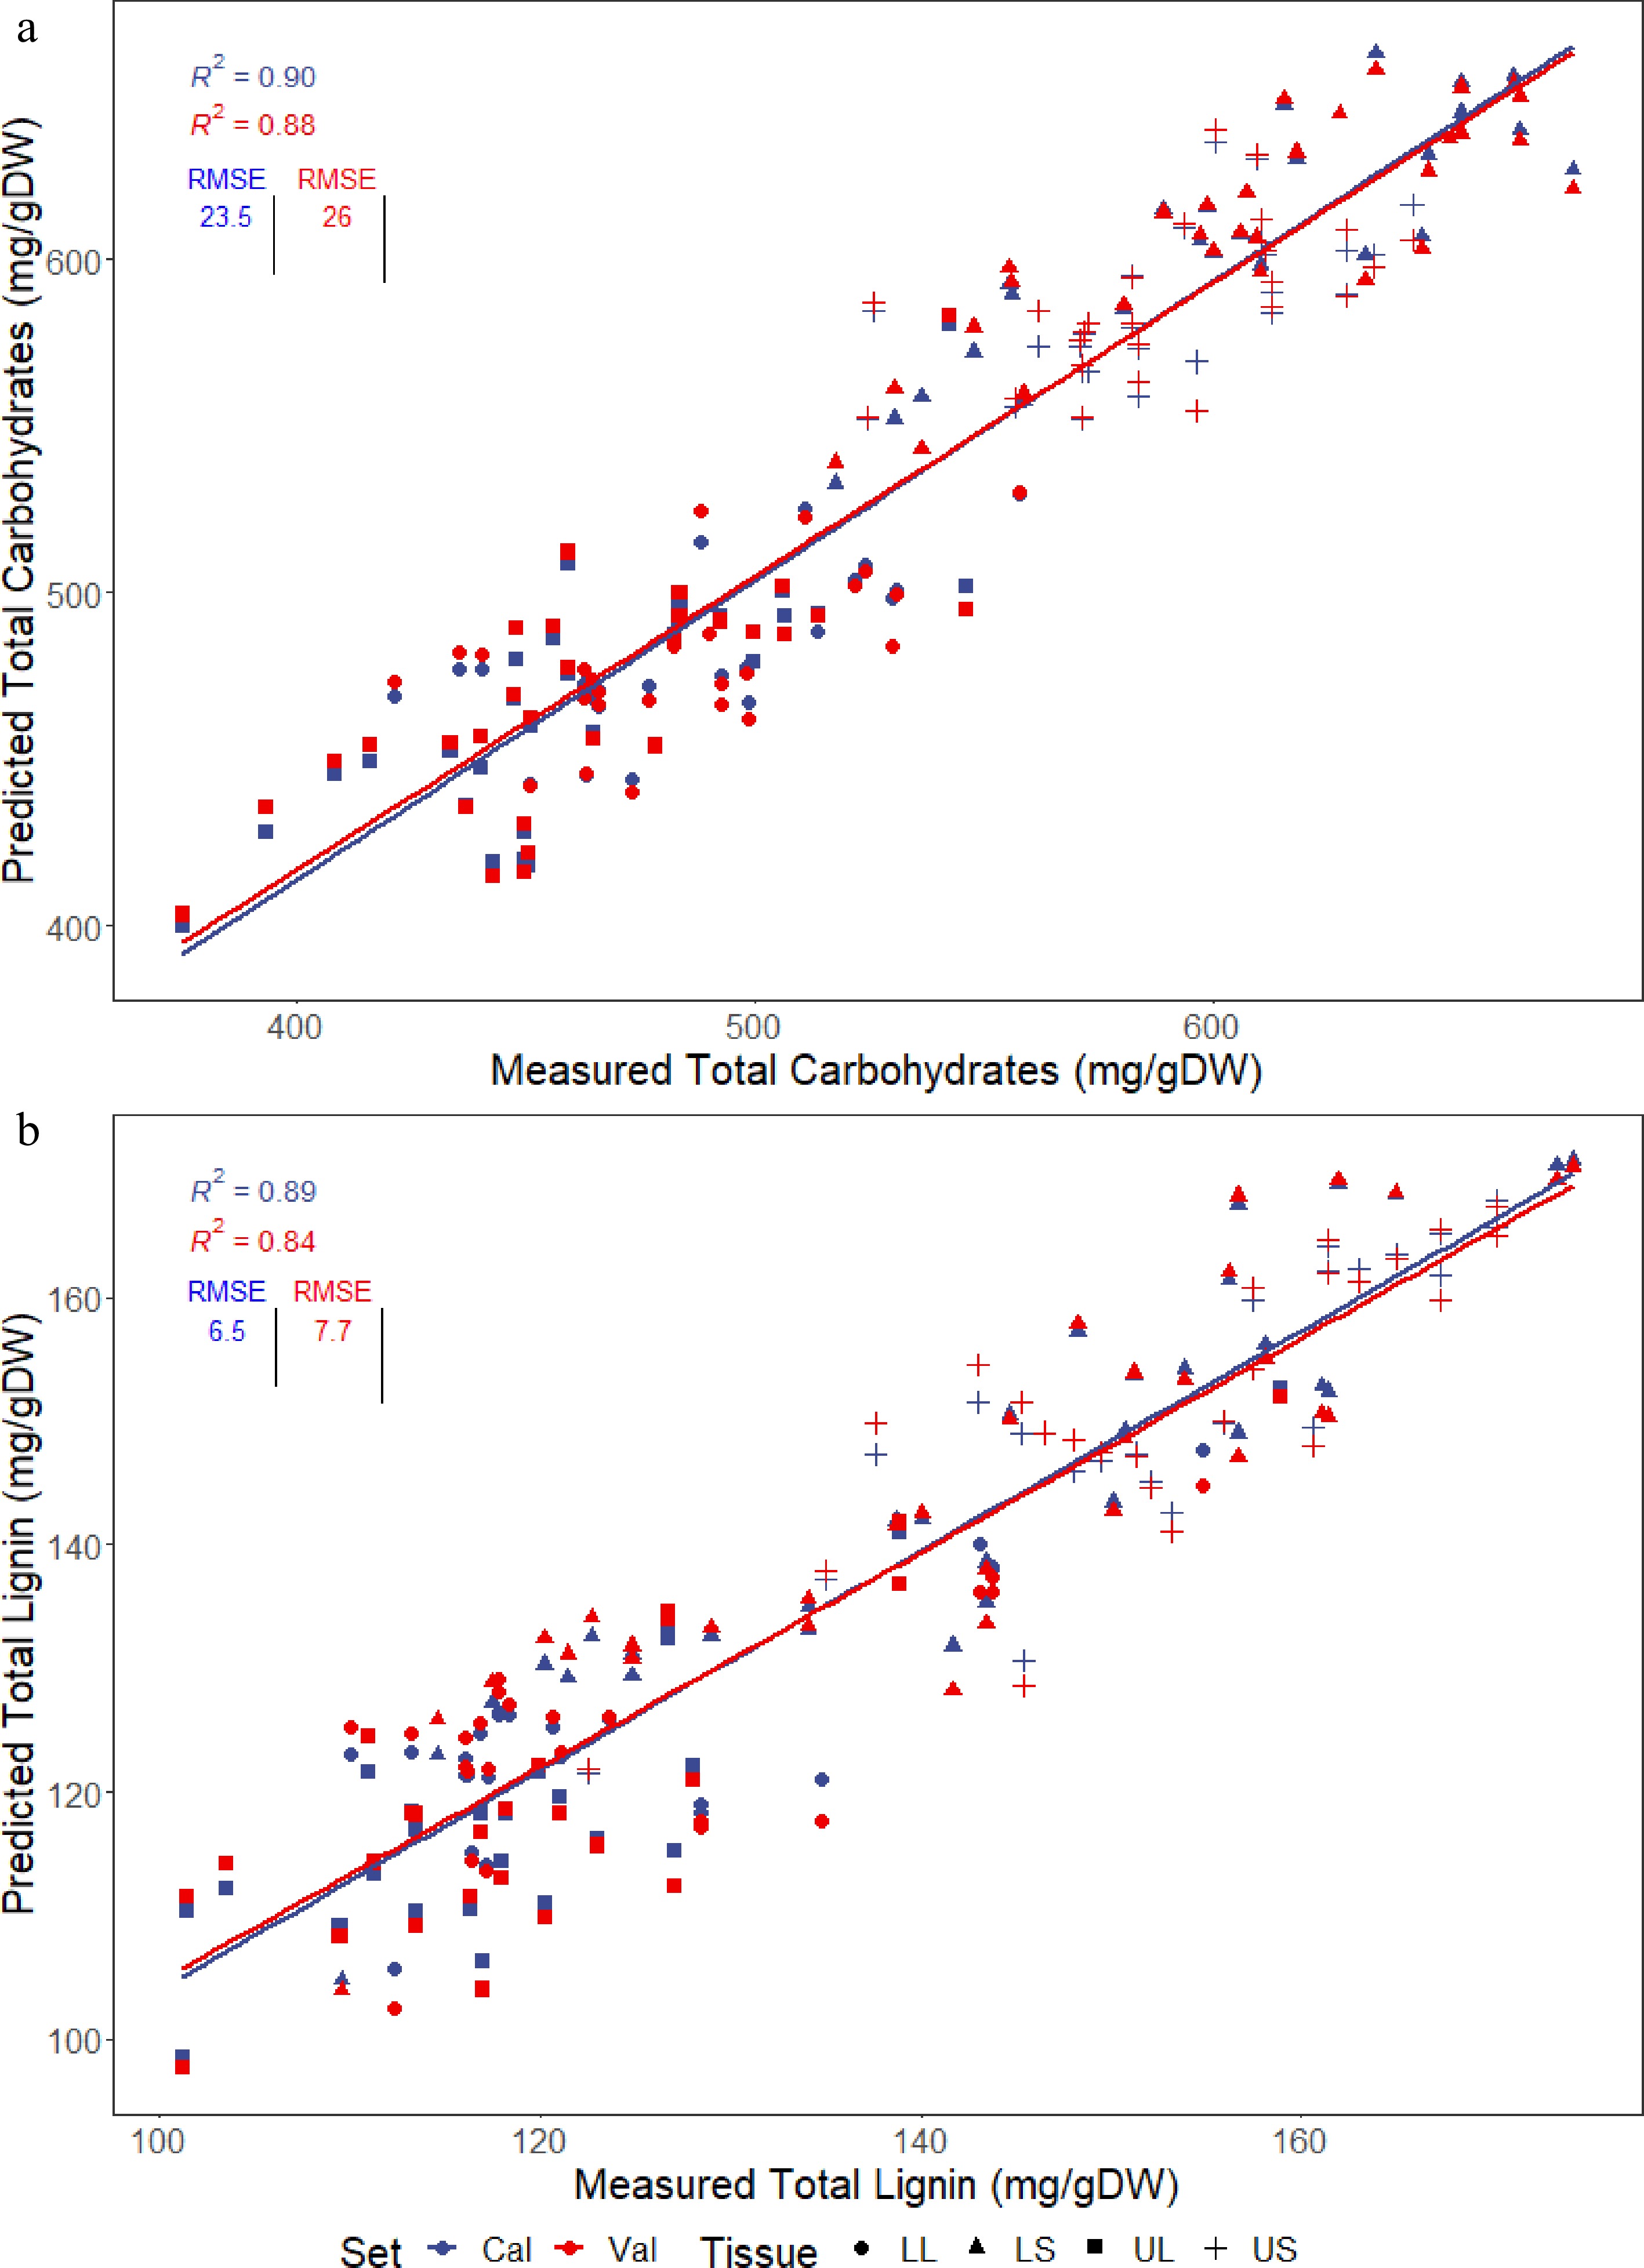
Figure 2.
PLSR models generated for predicting the two major cell wall components, (a) total lignin and (b) total carbohydrates, present in four different tissues of multiple Cenchrus accessions; lower stem (LS), lower leaf (LL), upper stem (US) and upper leaf (UL). Plots show calibration predictions (cal) as well as cross-validated predictions (val) used to evaluate the accuracy of the models, with the R2 and RMSE displayed.
Of the models developed for cell wall components, the best-performing were for ash and xylan. The predictive models for ASL (the smallest lignin component), arabinan, galactan, and mannan, the three carbohydrates present in very low concentrations, all returned cvR2 values below 0.8 cvR2, a value exceeded by models of all other cell wall traits.
NDF and iNDF models
-
The models for predicting NDF and iNDF (Fig. 3a & b) performed well, with cvR2 values above 0.90.
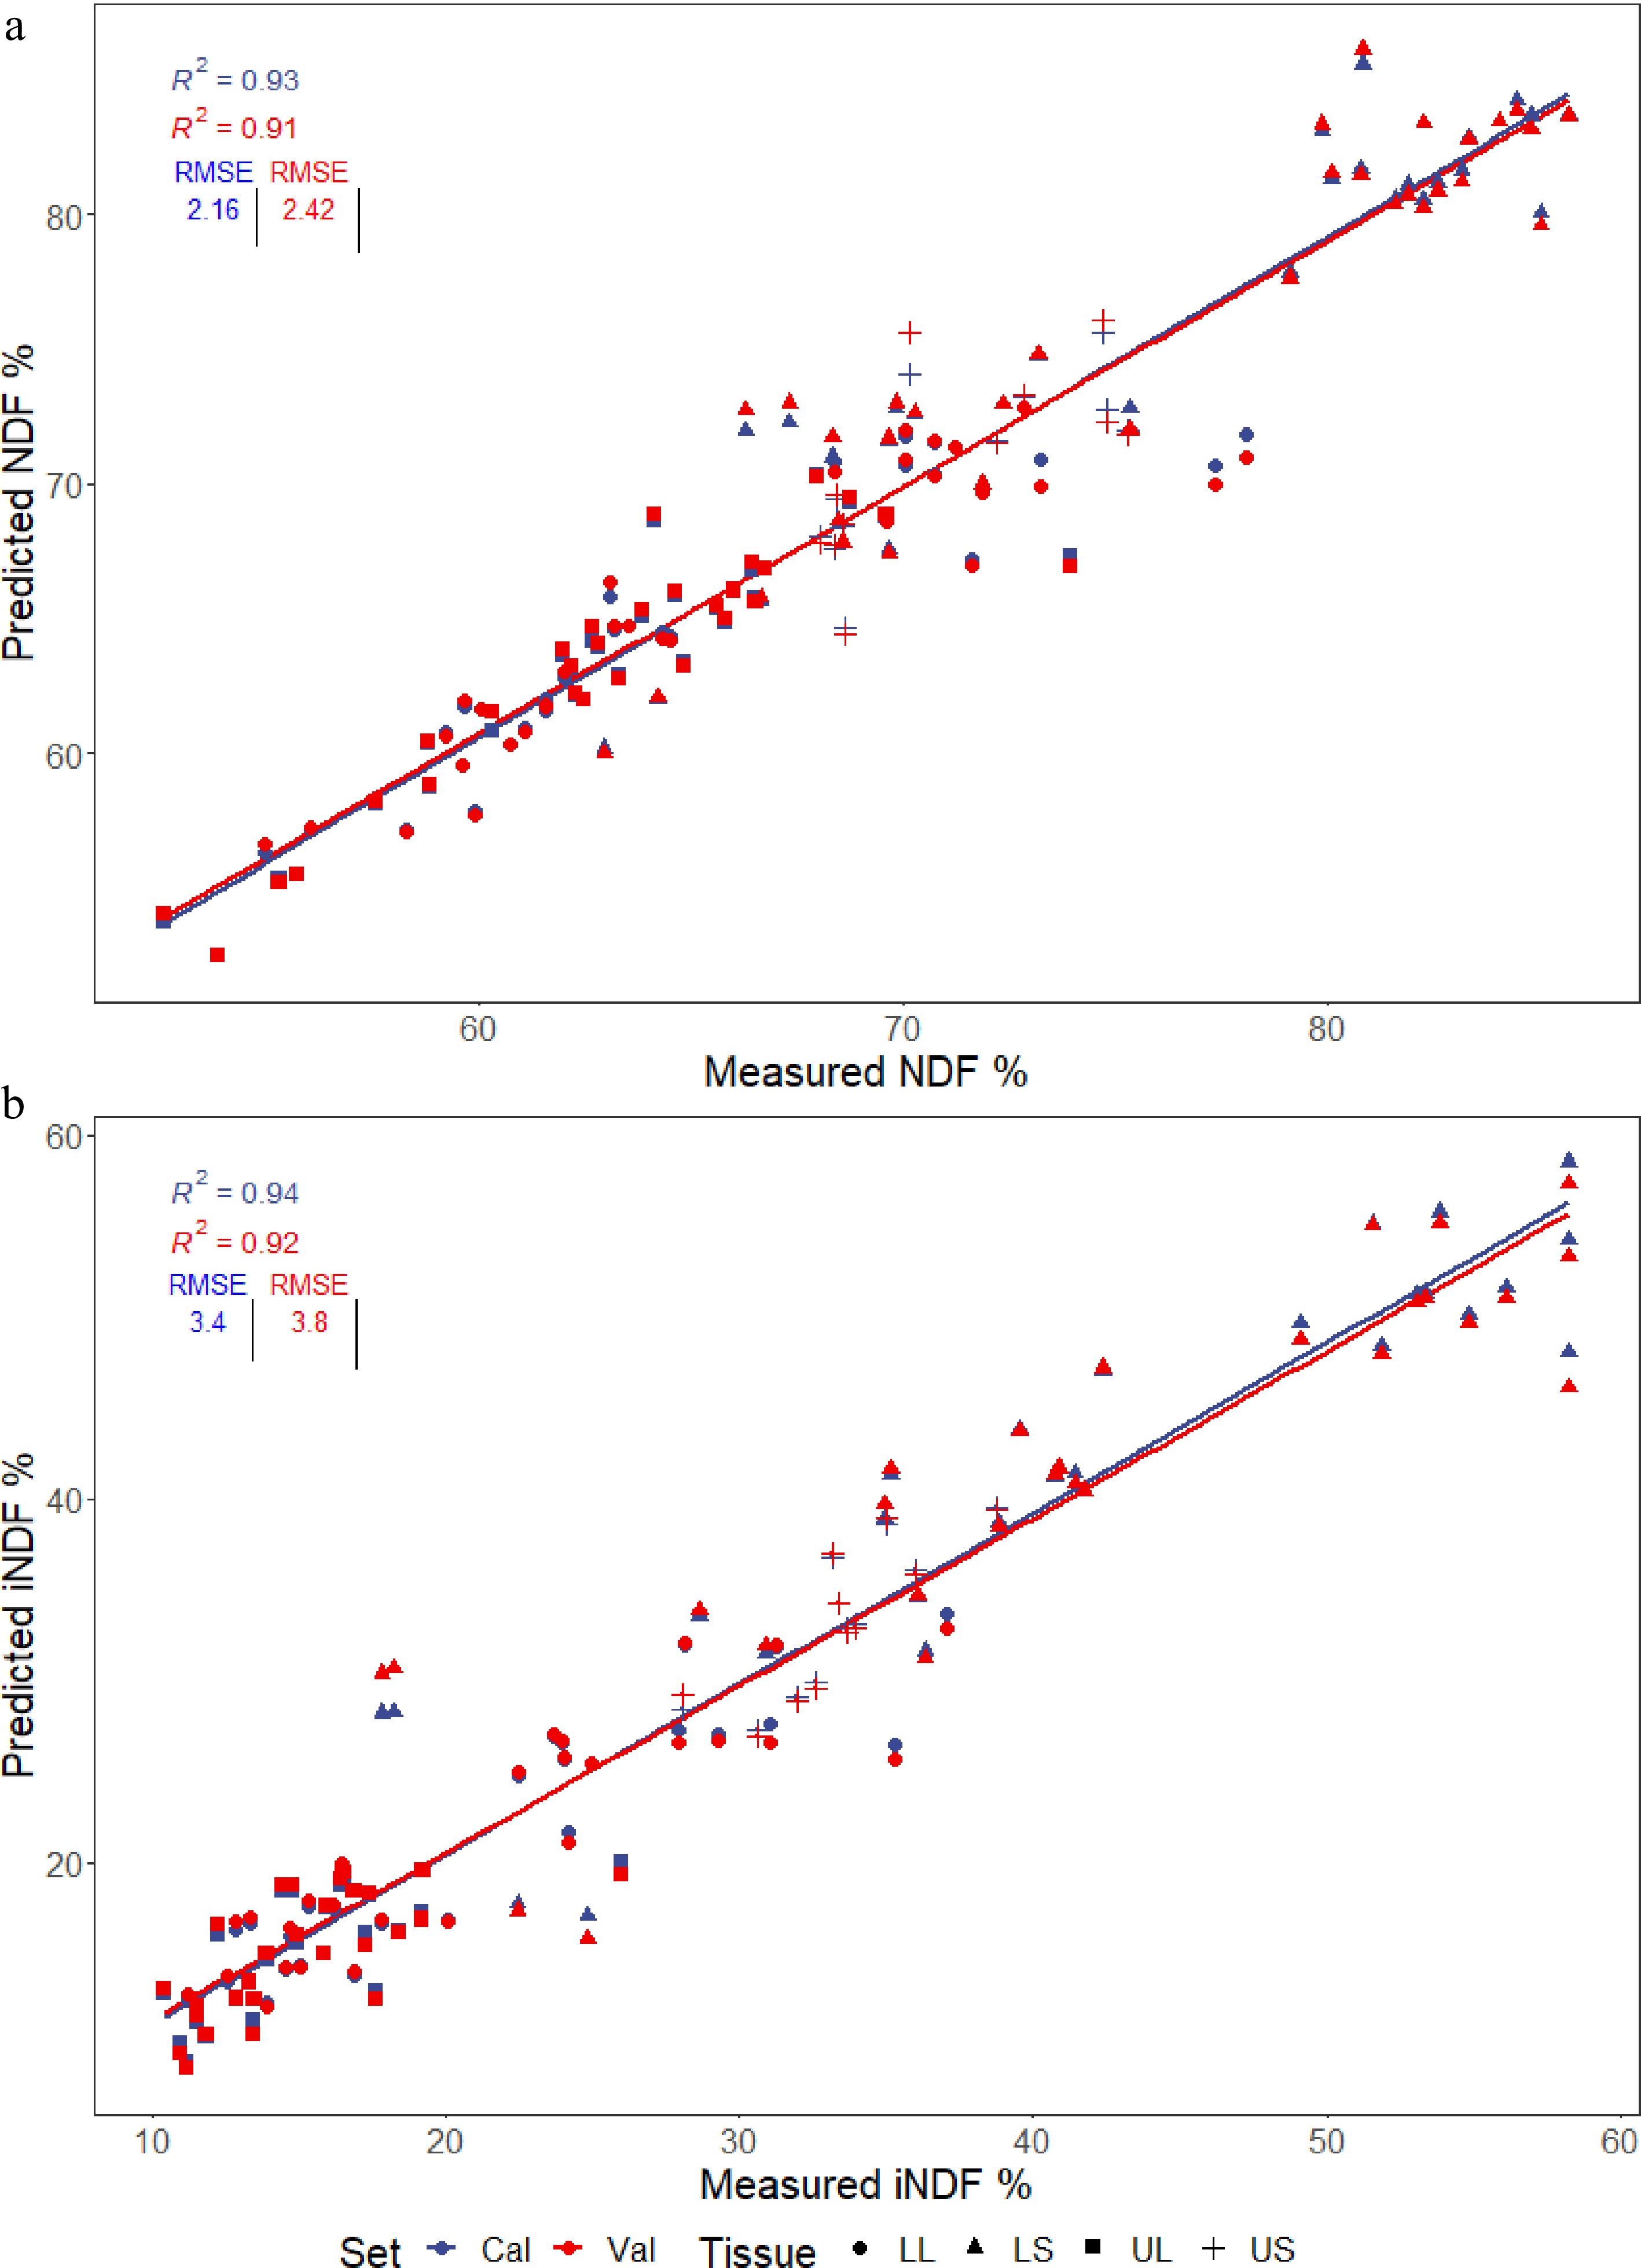
Figure 3.
PLSR models generated for predicting the (a) NDF and (b) iNDF values present in four different tissues of multiple Cenchrus accessions; lower stem (LS), lower leaf (LL), upper stem (US), and upper leaf (UL). Plots show calibration and cross-validated predictions used to evaluate the accuracy of the models, with the R2 and RMSE displayed.
Comparison of 2019 and 2021 harvests
-
A comparison of the data collected from the four different tissues harvested in 2019 and 2021, revealed significant differences between all four for several biomass and cell wall trait predictions as well as NDF and iNDF (Fig. 4).
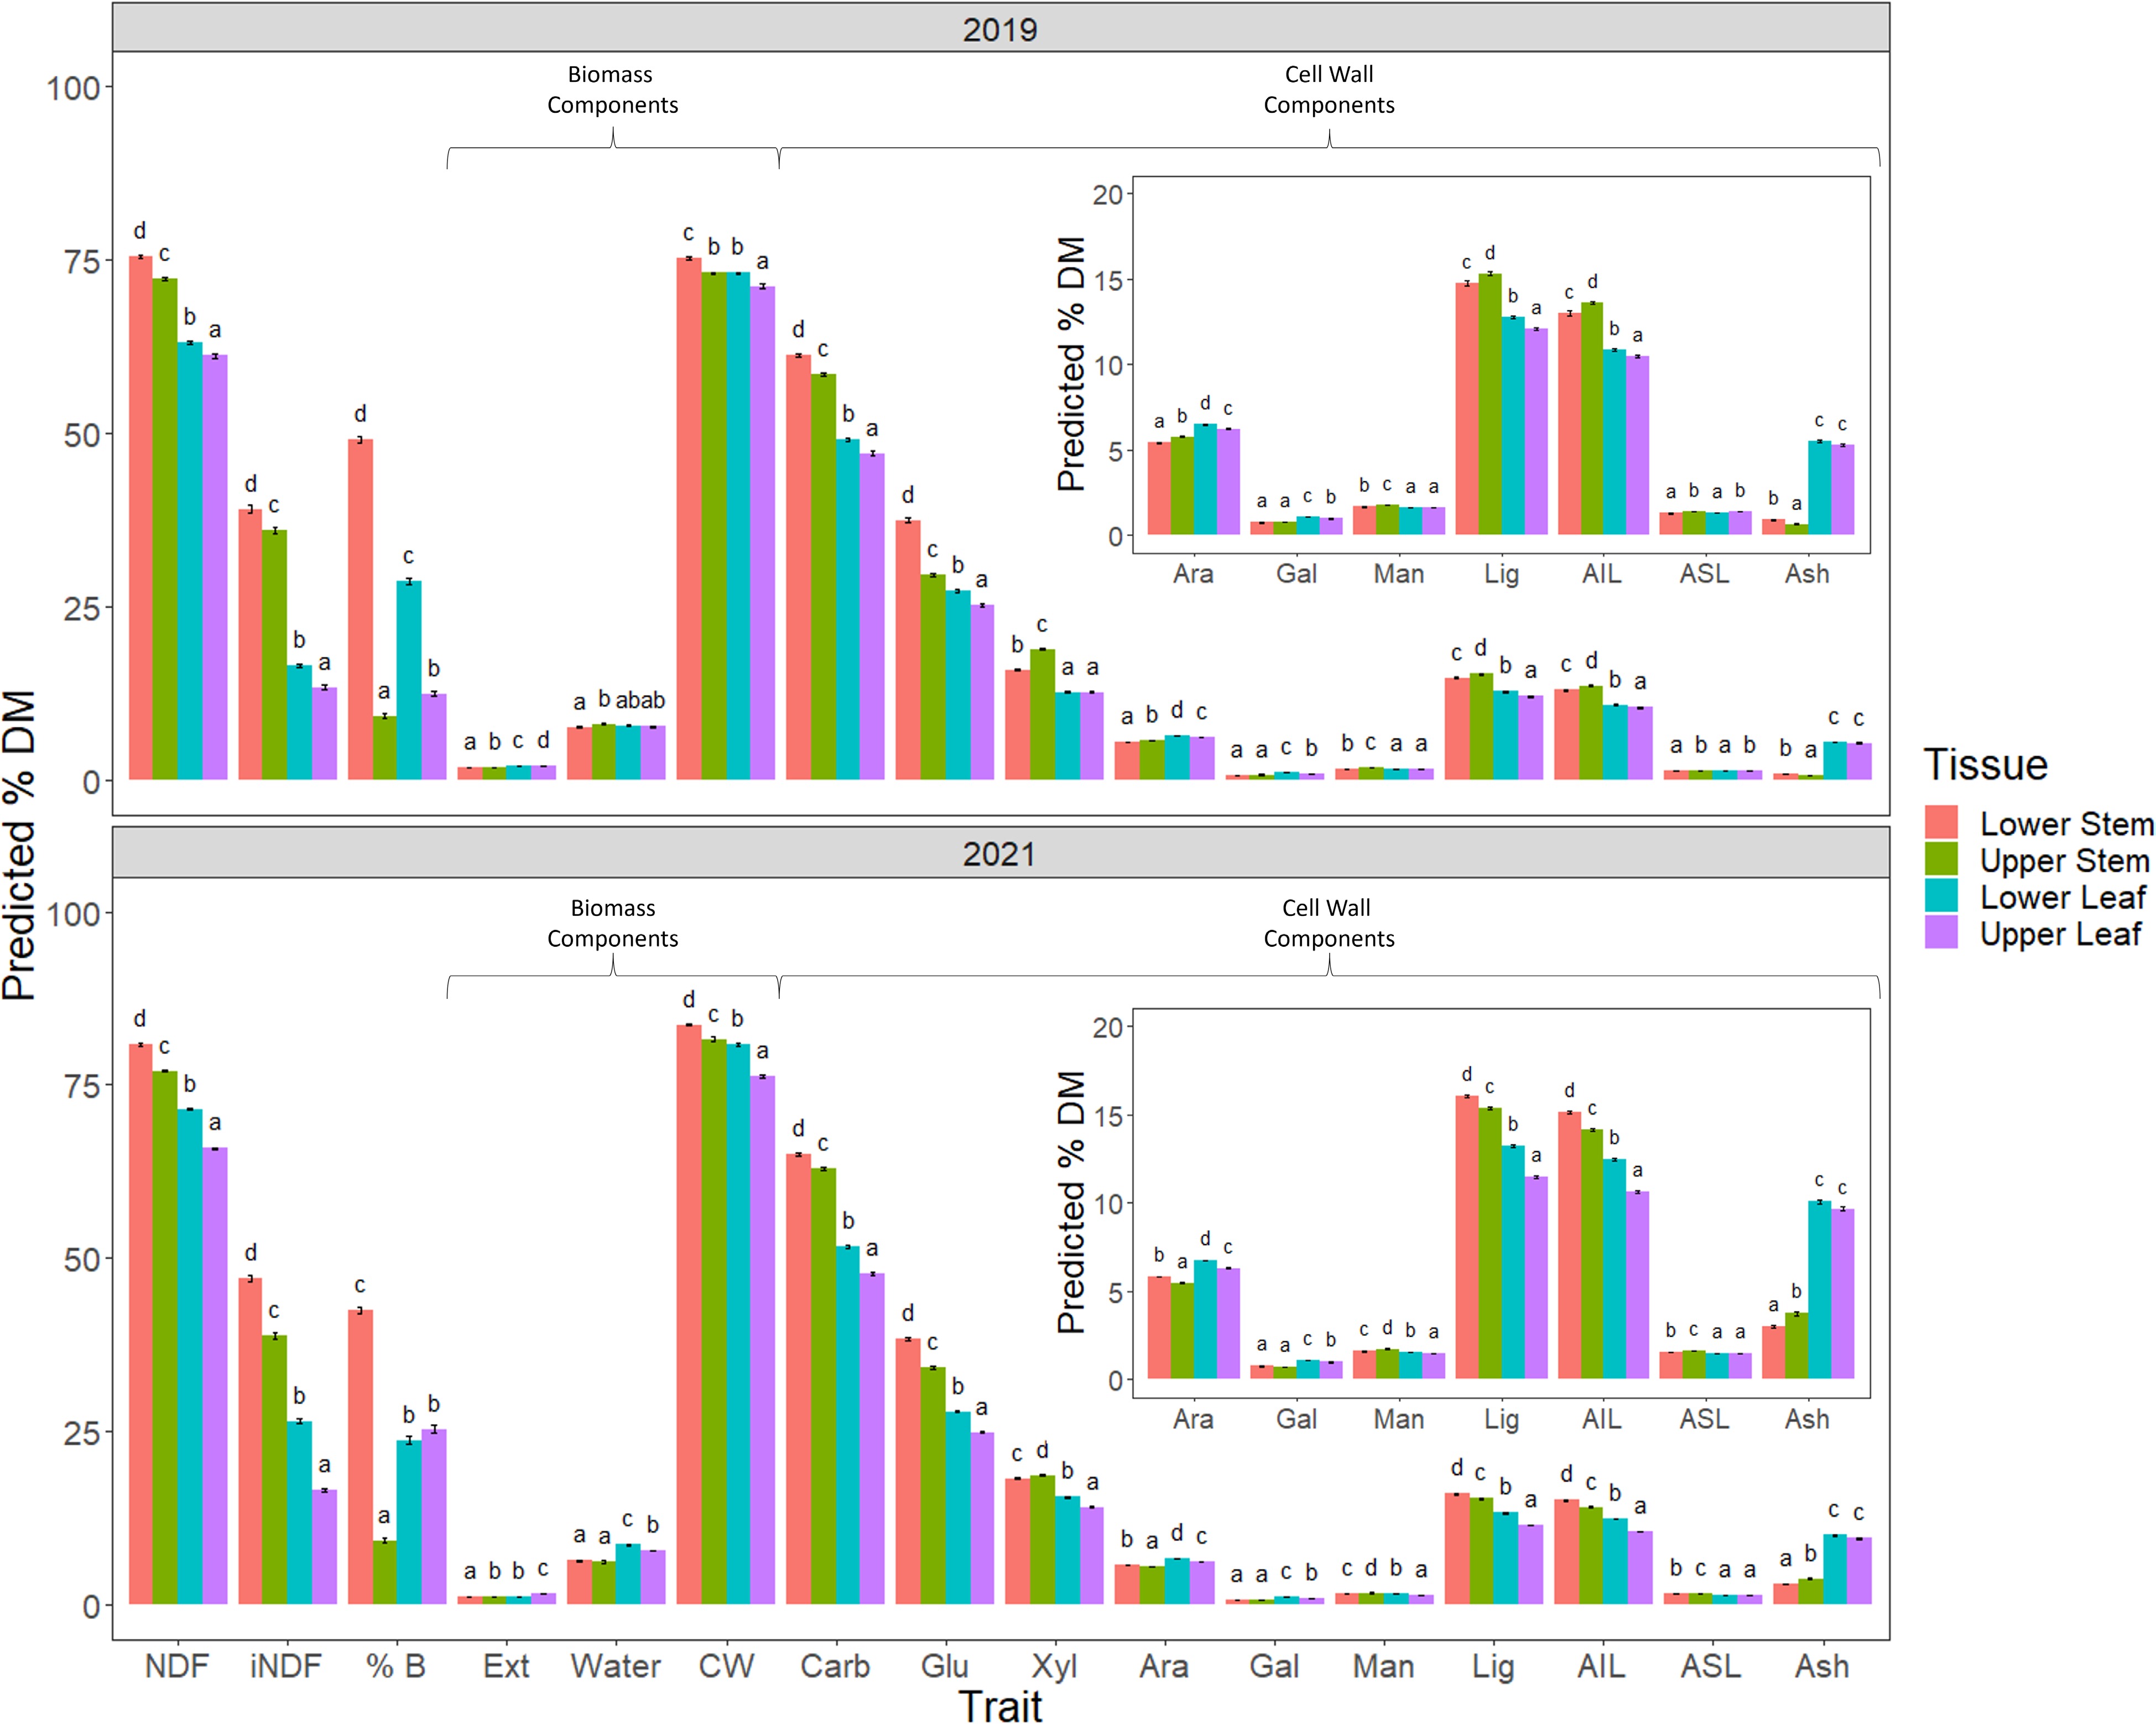
Figure 4.
Comparison of 2019 and 2021 harvests. The following traits were assessed NDF, iNDF, %B - % biomass of individual tissue type, biomass components; Ext - extractive, Water and CW - cell wall and cell wall composition Carb - total cell wall carbohydrates; Glu - glucan, Xyl - xylan, Ara - arabinan, Gal - galactan, Man - mannan, Lig - total lignin, acid insoluble lignin (AIL) and acid soluble lignin, (ASL) and the remaining cell wall component Ash of the measured tissue types. A number of cell wall traits were significantly different for all tissues, with stem having higher concentrations than leaf tissue with the exception of arabinan and ash. These latter two components were significantly higher in leaf than in stem for both years harvested. NDF and iNDF were also significantly different, with lower strata being higher than the upper strata for both stem and leaf tissues. Significance was determined by beta regression analysis and Tukey post hoc analysis of each trait across the four tissues.
NDF and iNDF were significantly higher in the stem than the leaf in both years. Furthermore, both of these fiber measures were higher in the lower as compared with the upper strata for both stem and leaf tissues, a trend observed in 2019 and 2021. It was expected that the percentage of biomass comprised of CW would be similar to NDF as they are measuring the same material using different methods. In 2019 this expected pattern was not precisely mirrored between CW, NDF and iNDF. In 2021 however, the proportions of biomass made up of CW more closely reflected the pattern observed for NDF and iNDF predictions in the same tissues. Like NDF and iNDF, total carbohydrates and glucan were significantly higher in the lower strata than the upper strata for both stem and leaf tissues. Conversely, predicted xylan content, the second most highly represented cell wall carbohydrate, was significantly increased in the upper compared to lower stem tissue, a difference more pronounced in 2019 than in 2021. Leaf tissue had reduced predicted concentrations of xylan compared to stem tissues in both 2019 and 2021. Furthermore, there was a significant increase in xylan in lower leaf tissue compared to upper leaf tissue in 2021 which was not evident in 2019, where the two issues were equivalent.
Predicted total lignin content, like xylan, was elevated in the upper stem tissue compared with the lower stem in 2019; however, in 2021, the upper stem had less total lignin than lower stem. Unsurprisingly, this same pattern was reflected in lignin's main constituent, AIL. The minor lignin component ASL, was significantly elevated in upper stem and leaf tissue as compared with their lower strata counterparts, with no difference between leaf and stem tissue from the same strata in 2019. In 2021, predicted ASL was significantly higher in both stem strata as compared with leaf and in turn, the lower stem had a higher concentration of ASL as compared with the upper stem stratum. Cell wall components, arabinan and particularly ash, were significantly elevated in leaf as compared with stem, irrespective of strata level. One of the notable differences between the 2019 and 2021 harvests was the allocation of biomass, particularly leaf biomass, with upper leaf significantly increased compared with lower leaf in 2019, while in 2021, they were equivalent.
PCA analysis of 2019 and 2021 harvests
-
As many differences were observed between the two harvests, a principal component analysis (PCA) was conducted on each harvest separately to better understand the inter-relationships among traits. Generally, the tissues were separated regardless of season, although their composition changed. In 2019 (Fig. 5a), both upper and lower leaf strata displayed positive associations with galactan, ash, extractives and arabinan, all of which were significantly elevated in leaf as compared with stem tissues (Fig. 4). A negative association with total carbohydrates, CW, NDF, and iNDF was evident in leaf tissue, which was significantly lower than total carbohydrates, CW, NDF, and iNDF in stem tissues. There was a more evident separation between the upper and lower stem tissues, with the lower stem more closely associated with glucan and percentage biomass, while the upper stem was associated with significantly elevated xylan, mannan, and ASL content. The 2021 harvest data (Fig. 5b) showed a difference between leaf and stem tissues, with leaf tissues still positively associated with ash, galactan, arabinan and extractives, while negatively associated with CW and carbohydrates. The lower and upper leaf strata appear to have spread compared to 2019, with the upper leaf exhibiting a closer association with high extractive content and the lower leaf associated with arabinan. Stem tissues were not as well separated in 2021 as in 2019 and the associations had altered. The lower stem tissues were associated with significantly higher glucan, CW, lignin, AIL, NDF, and iNDF values, while the upper stem was only associated with ASL and mannan.
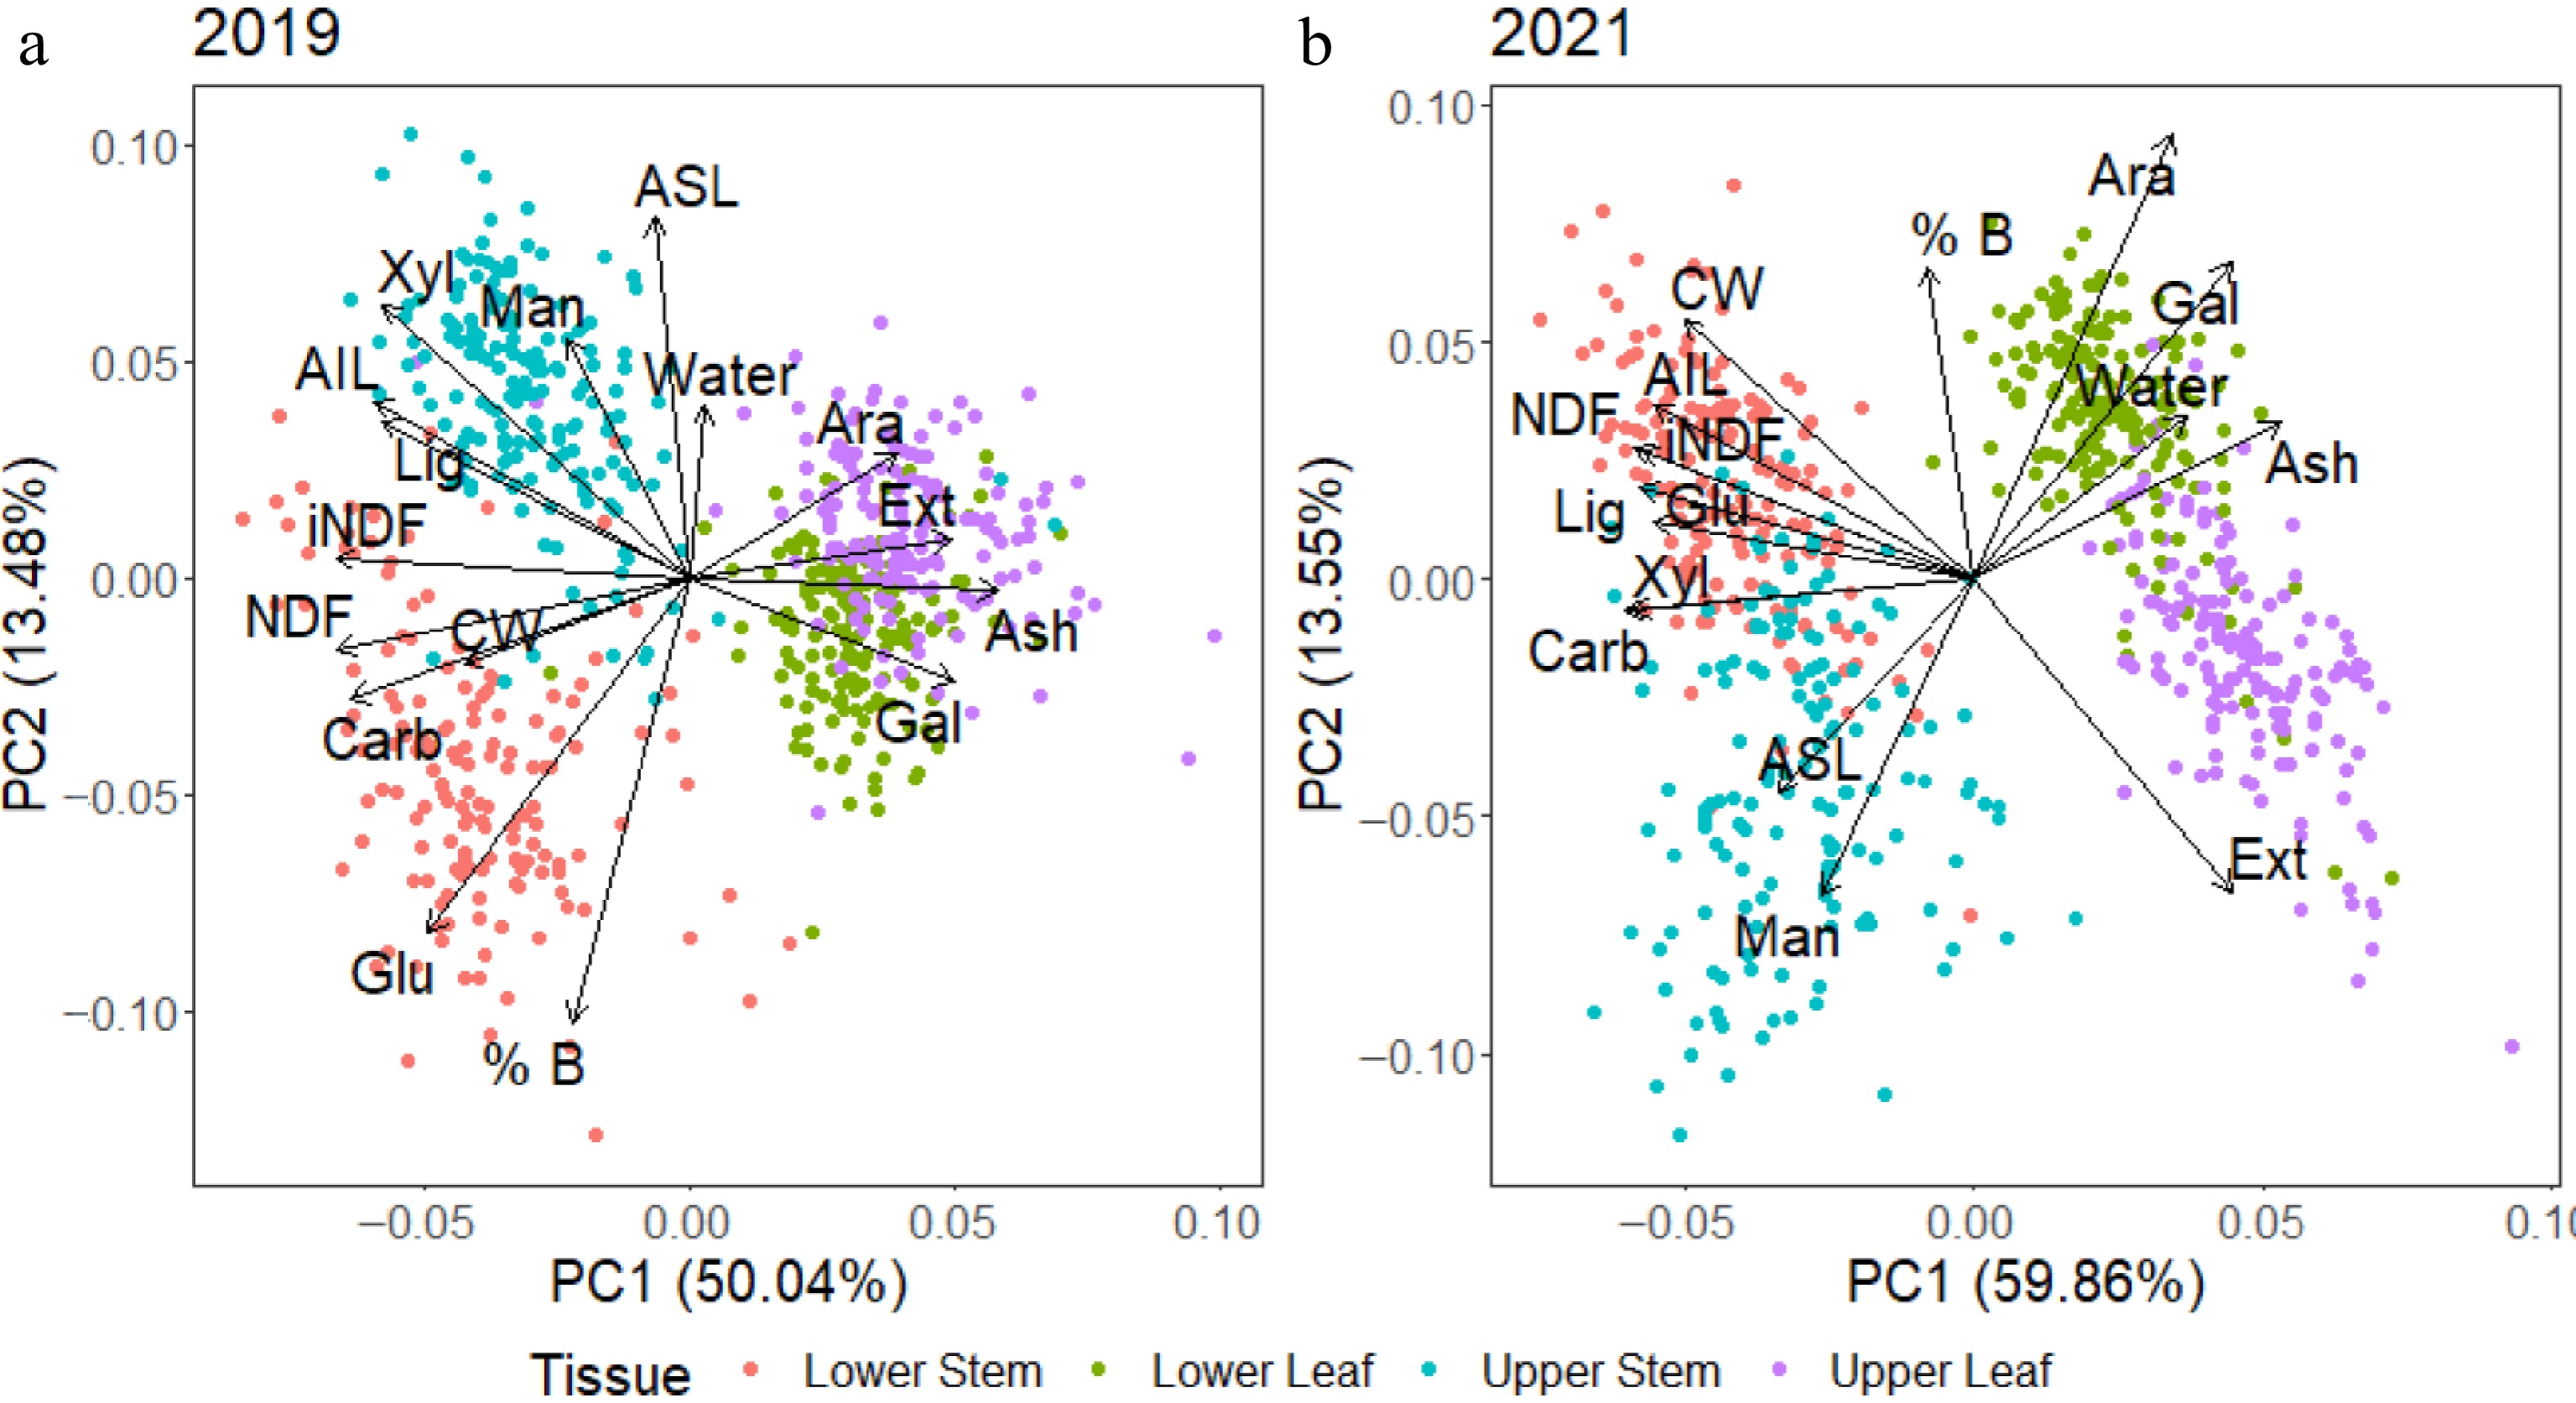
Figure 5.
Principal component analysis (PCA) of data from 2019 and 2021 harvests with both years showing differences between stem and leaf. Stem tissue had higher concentrations of most components than leaf tissue with the exception of arabinan, galactan, ash and extractives which were predicted to be present at higher concentrations in leaf tissue. From the 2019 harvest, there were also differences in the lower and upper stem tissue, with the lower stem tissue associated with higher glucan and % biomass and the upper stem more highly associated with glucan and lignin.
PCA analysis of different tissue types
-
A series of principal component analyses were conducted on each tissue separately, with values from both 2019 and 2021 harvests included to further dissect the seasonal distribution of cell wall components in the different tissue types. These data showed that although separated from each other, the distribution of cell wall components in the leaf and stem changed across the years. In Fig. 6, extractives from all four tissues were higher in the 2019 harvest. For lower stem tissue (Fig. 6a) the NDF and iNDF values correlated with higher CW and lignin values. In the lower leaf tissue (Fig. 6b), NDF and iNDF correlated with higher CW and xylan values, while lignin content did not correlate with either NDF or iNDF.
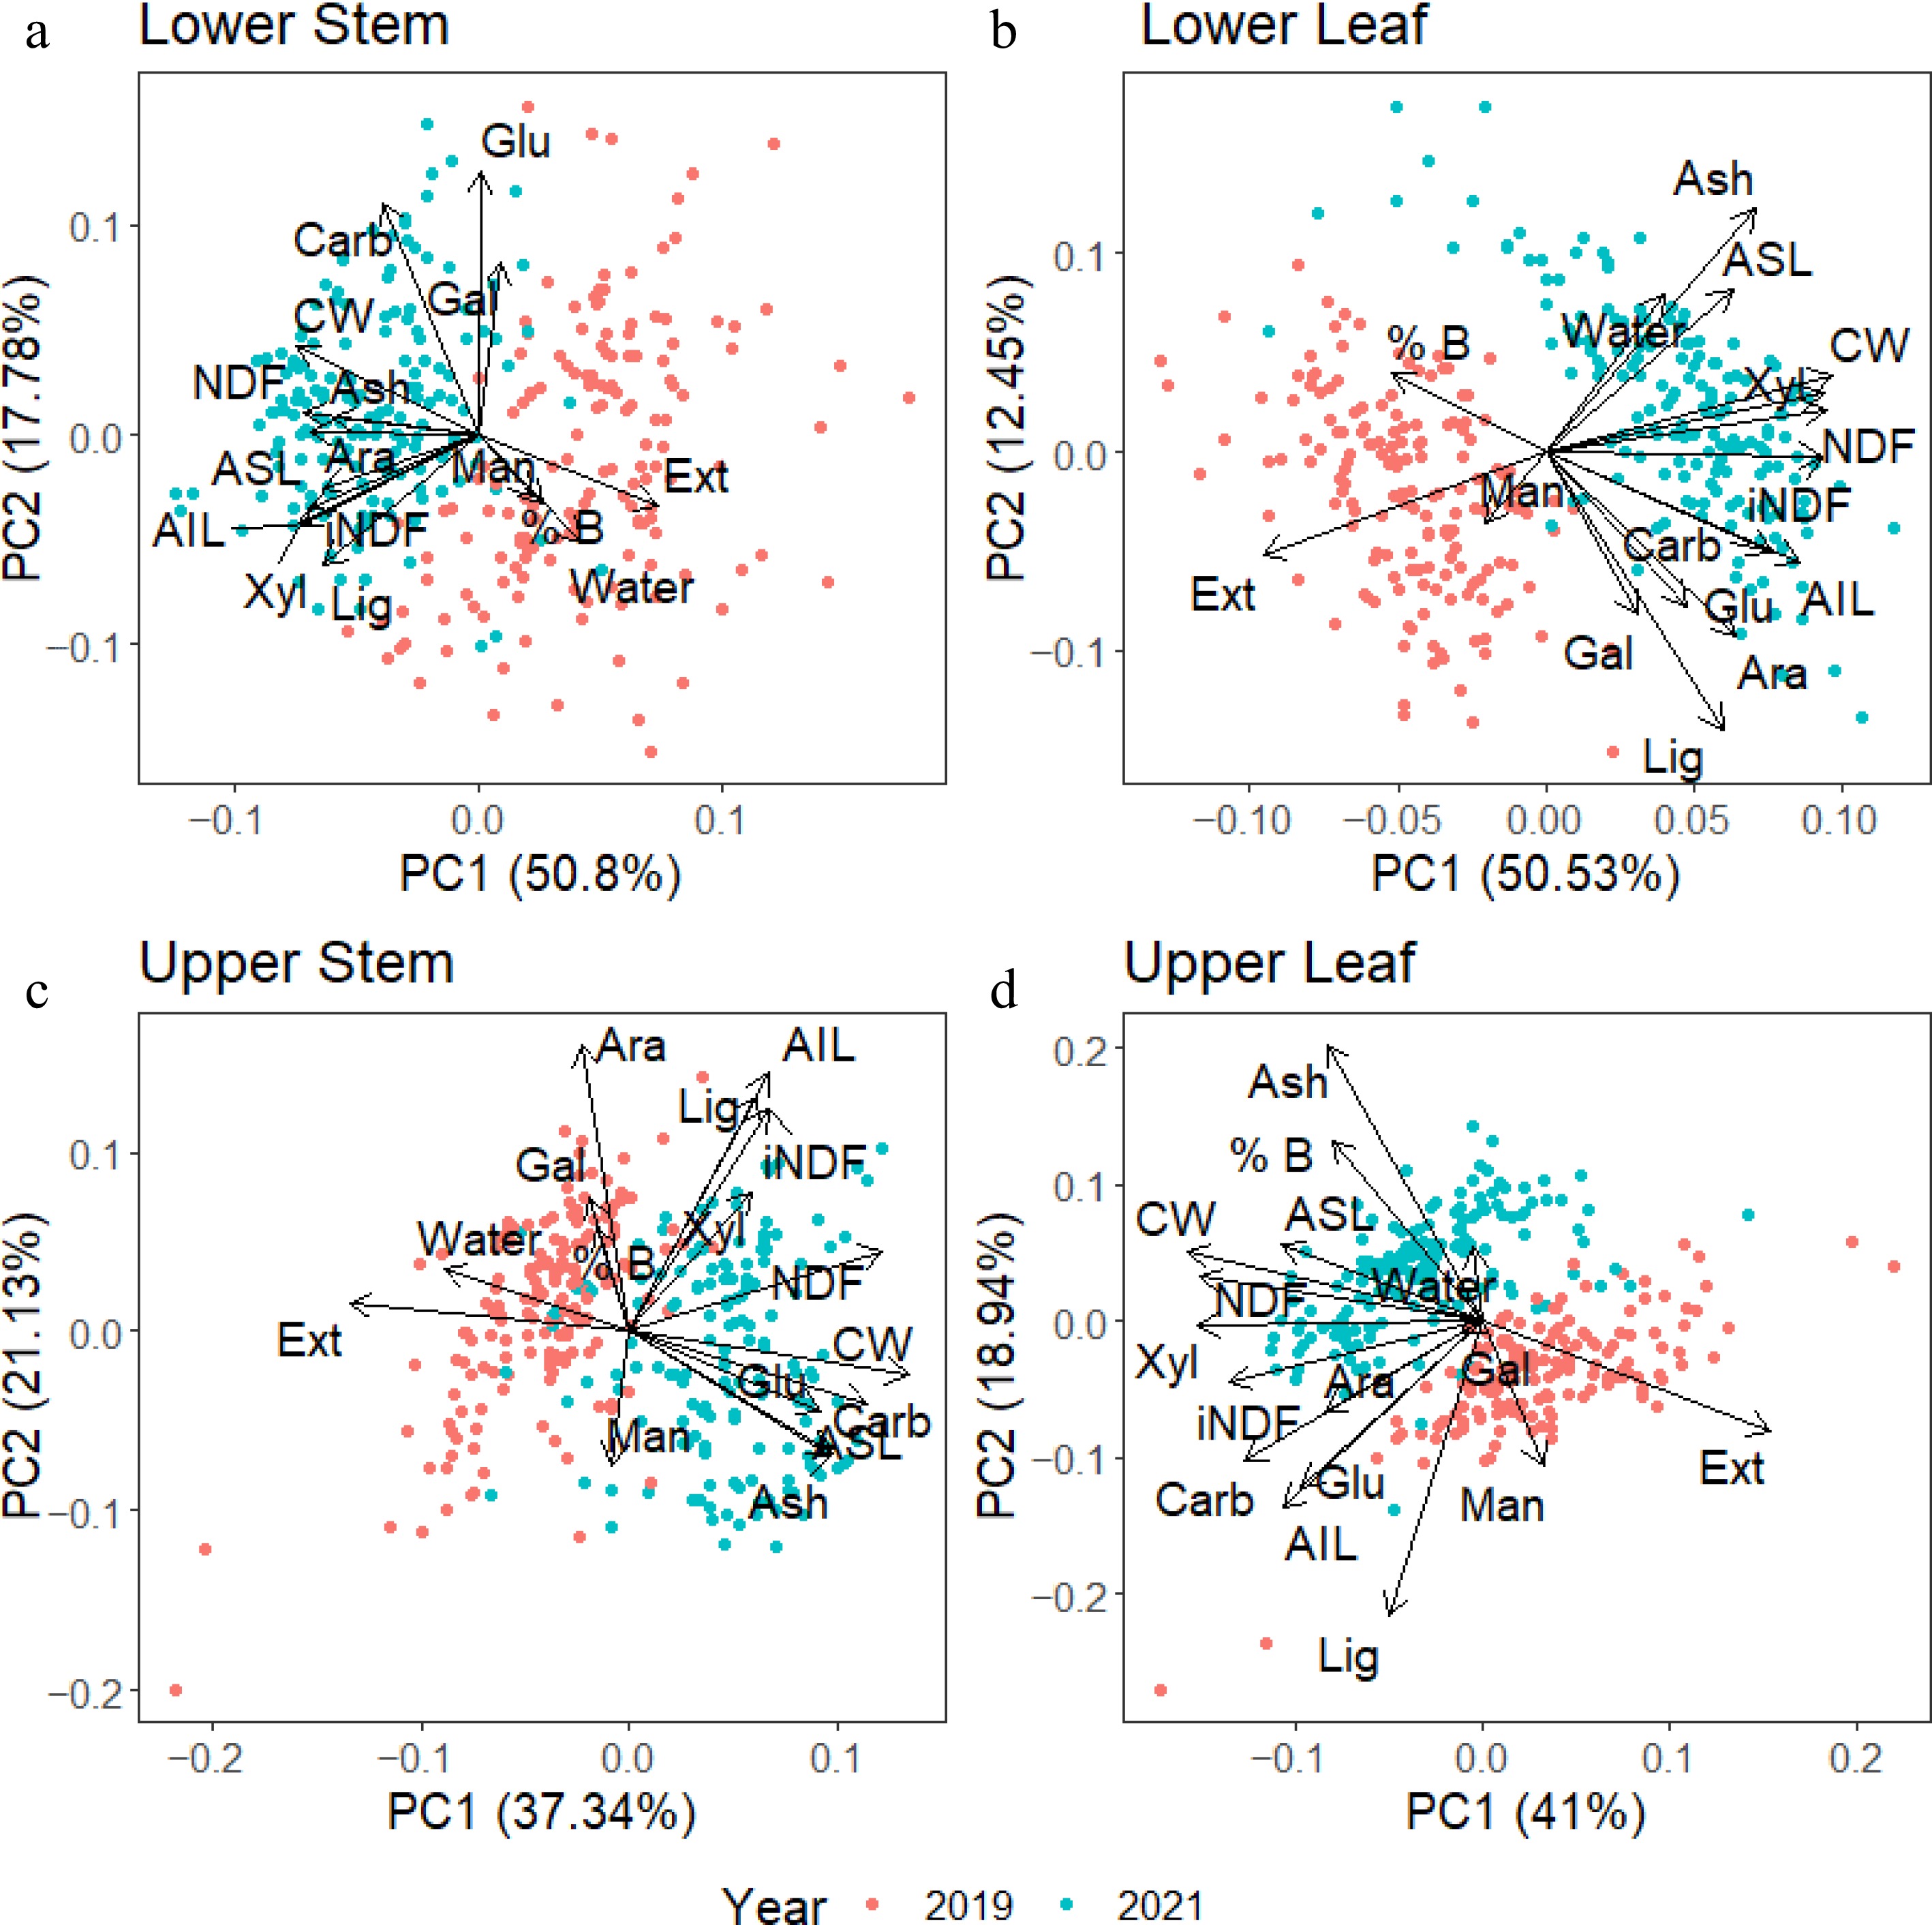
Figure 6.
Principal component analysis (PCA) of individual tissues from samples collected in 2019 (red) and 2021(blue). Overall, the 2019 harvest had higher extractive and lower CW content than the 2021 harvest. Lignin and xylan associated strongly with iNDF in stem tissues. In contrast, only xylan was strongly associated with iNDF in the leaf tissues. NDF was strongly associated with CW concentrations in all tissues, with a weaker correlation in the upper stem.
In the upper stem tissue (Fig. 6c), iNDF values were correlated with lignin, AIL, and xylan, while NDF had a weaker correlation with iNDF and CW. The upper leaf (Fig. 6d) exhibited similar relationships to the lower leaf tissues, with NDF correlating with higher CW, ASL, and xylan. The iNDF showed weak correlations with AIL and total carbohydrates, glucan, and arabinan.
-
The generation of a series of predictive models enabled the successful assessment of a large collection of buffel accessions across years, with significant differences in a range of traits reliably predicted. The NDF and iNDF models were high performing, as were models constructed to predict plant components present in low concentrations (e.g., galactan, arabinan, ASL) and were able to identify significant differences among tissues. That the PLSR models could differentiate between the harvests undertaken in 2019 and 2021 was an interesting observation and demonstrated that they are likely predicting differences attributable to changes in environmental conditions, plot preparation methods resulting in stress and/or changes in the maturity of swards. This is further evidence that the FTIR based PLSR models may be able to measure stress effects on the cell wall, as proposed in a previous study on Cynodon spp where the effects of shade on cell wall composition were able to be detected with such models[16]. It is likely that a significant cause of variation between the two harvests was the approach used to clear and reset the experimental plots prior to the start of a new growing season. NDF, iNDF and lignin were more highly associated with the 2021 harvest, where plots were slashed, whereas in 2019 plots were burned, a preparatory treatment that has been reported to increase the digestibility of pasture characterized by lower NDF, iNDF and total lignin content[22].
The predictive models allowed the four tissues upper/lower stem, and upper/lower leaf to be characterized, with the most prominent differences observed in cell wall composition between the stem and leaf tissues regardless of strata (Fig. 6). It was observed that different tissues were associated with different combinations of cell wall components. The clear distinction between the association of ash, arabinan, galactan, and extractives with leaf tissue and glucan, xylan and lignin, particularly AIL, with stem tissue reflects the substantial difference between the roles of the two tissue types. This observation of stem and leaf associated traits corresponded with other findings for glucan, xylan, arabinan, galactan, ash, lignin, cell wall, NDF and iNDF in the leaf and stem of sorghum and wheat investigated using a combination of enzymatic and spectrometric methods to measure changes in cell wall compositions of the two tissues pre- and post-hydrothermal treatments[23−25].
Models were able to distinguish traits that were associated with different tissues and sward levels but also reflected external influences upon the plant that differed between the two harvests. Analysis of digestibility throughout the sward at different strata levels in Kikuyu reported that NDF and iNDF were higher in lower strata levels, an observation difficult to corroborate in this study as NDF and iNDF correlated strongly with stem tissue irrespective of strata level[26]. Key developmental traits noted at different sward levels were the percentages of biomass allocated to each tissue with an increase observed in the lower tissues, while ASL and mannan concentrations were elevated in upper strata tissue over both years, suggesting these traits are consistent features that distinguish lower and upper levels of buffel swards respectively. Different methods used to clear the experimental plots, burning in 2019 and slashing in 2021 contributed to higher concentrations of AIL, lignin, and xylan associated with upper stem tissue in 2019 and lower stem tissue in 2021. This suggests the cell walls in the upper and lower strata are influenced by abiotic and developmental factors differently. The plasticity of sward structure and composition in response to abiotic factors, stress in particular, is known but this can now be linked with changes in the cell wall[27].
By examining the individual tissues and determining which biomass and cell wall traits were associated with NDF and iNDF, an insight into the relationship of cell wall composition and digestibility was revealed. Generally, NDF is associated with CW and this association is logical as they are both a measure of the main cell wall components; cellulose, hemicellulose, lignin and ash. There were subtle differences noted between NDF and CW, such as the potential for the NDF washing process to remove pectins and some proteins from the cell wall[28]. In this study, the correlation of CW and NDF was not as strong in upper stem tissue as it was in the other tissues. Indigestible NDF, however, has been correlated with lignin in grasses and legumes such as Pennisetum, Brachiaria, Medicago and Leucaena[29]. In this study, lignin and its main component AIL did correlate well with iNDF, as has been reported in both upper and lower stem tissue of Pennisetum, Brachiaria, Medicago and Leucaena whereas iNDF did not correlate strongly with lignin and AIL in either of the leaf strata[29]. However, xylan was strongly associated with iNDF in all four tissues suggesting that it may be a more reliable indicator of iNDF than lignin. Xylan has also been shown to negatively affect digestibility and iNDF of some grasses such as clover and maize, as it is a major component of hemicellulose which is responsible for cross-linking cellulose microfibrils and lignin polymers. The effectiveness of this linkage influences the access to cellulose by hydrolytic enzymes and explains the close association of xylan with iNDF in all the tissues analyzed in this study[30, 31]. There is also, however, evidence that the relationship between lignin and iNDF is dependent on the species and environment, suggesting that iNDF is a function of more than just one cell wall component[32, 33].
This study successfully demonstrated a powerful tool that has been able to proficiently characterize the cell wall composition of buffel in different tissues and along its vertical canopy, providing greater insight into digestibility. Estimation of food intake is critical when making grazing management decisions as sward maturity and removal of plant material from pastures by grazing can happen quickly, therefore having a rapid effective method of assessing food intake would be of great benefit in making decisions when compared to time-consuming wet chemistry methods (e.g., 10 d for iNDF determination)[34]. Development in technologies such as FTIR spectroscopy increases information capture for graziers to better manage their forages by reducing the time delay between taking samples and receiving results required for maximizing precision agriculture approaches[35]. The future of spectral assessment in pasture management is in field scanning technology with aerial and wheeled drone equipment that can monitor fields in real-time, quantifying available biomass, NDF, iNDF and ash content, thereby further enhancing the information available to graziers for the management of their pastures[36].
-
The authors confirm contribution to the paper as follows: study conception and design: Brown CW, Harper K, Dayananda B, Lambrides CJ, Grof CPL; data collection: Brown CW, Gamage H; analysis and interpretation of results: Brown CW, Harper K, Dayananda B, Lambrides CJ, Grof CPL; draft manuscript preparation: Brown CW, Harper K, Dayananda B, Lambrides CJ, Grof CPL. All authors reviewed the results and approved the final version of the manuscript.
-
All data generated or analyzed during this study are included in this published article and its Supplemental File S1.
-
The authors wish to acknowledge the invaluable contribution of staff at the Gatton research facility University of Queensland (Australia), for assistance in maintaining the field trial.
-
The authors declare that they have no conflict of interest. Christopher Lambrides is the Editorial Board member of Grass Research who was blinded from reviewing or making decisions on the manuscript. The article was subject to the journal's standard procedures, with peer-review handled independently of this Editorial Board member and the research groups.
- Supplemental Fig. S1 The experimental design implemented for growing 296 accessions of Cenchrus spp. at the Gatton research station in Queensland, Australia. Six different commercial accessions were placed in an augmented lattice row column pattern throughout the experimental plot.
- Supplemental Fig. S2 PLSR models generated for predicting mg/g of biomass comprised of cell wall present in four different tissues of multiple Cenchrus accessions; lower stem (LS), lower leaf (LL), upper stem (US) and upper leaf (UL). Plots show calibration predictions (cal) as well as cross-validated predictions (val) used to evaluate the accuracy of the model.
- Supplemental Fig. S3 PLSR models generated for predicting mg/g of biomass comprised of extractives present in four different tissues of multiple Cenchrus accessions; lower stem (LS), lower leaf (LL), upper stem (US) and upper leaf (UL). Plots show calibration predictions (cal) as well as cross-validated predictions (val) used to evaluate the accuracy of the model.
- Supplemental Fig. S4 PLSR models generated for predicting mg/g of biomass comprised of water present in four different tissues of multiple Cenchrus accessions; lower stem (LS), lower leaf (LL), upper stem (US) and upper leaf (UL). Plots show calibration predictions (cal) as well as cross-validated predictions (val) used to evaluate the accuracy of the model.
- Supplemental Fig. S5 PLSR models generated for predicting mg/g of biomass comprised of glucan present in four different tissues of multiple Cenchrus accessions; lower stem (LS), lower leaf (LL), upper stem (US) and upper leaf (UL). Plots show calibration predictions (cal) as well as cross-validated predictions (val) used to evaluate the accuracy of the model.
- Supplemental Fig. S6 PLSR models generated for predicting mg/g of biomass comprised of xylan present in four different tissues of multiple Cenchrus accessions; lower stem (LS), lower leaf (LL), upper stem (US) and upper leaf (UL). Plots show calibration predictions (cal) as well as cross-validated predictions (val) used to evaluate the accuracy of the model.
- Supplemental Fig. S7 PLSR models generated for predicting mg/g of biomass comprised of galactan present in four different tissues of multiple Cenchrus accessions; lower stem (LS), lower leaf (LL), upper stem (US) and upper leaf (UL). Plots show calibration predictions (cal) as well as cross-validated predictions (val) used to evaluate the accuracy of the model.
- Supplemental Fig. S8 PLSR models generated for predicting mg/g of biomass comprised of arabinan present in four different tissues of multiple Cenchrus accessions; lower stem (LS), lower leaf (LL), upper stem (US) and upper leaf (UL). Plots show calibration predictions (cal) as well as cross-validated predictions (val) used to evaluate the accuracy of the model.
- Supplemental Fig. S9 PLSR models generated for predicting mg/g of biomass comprised of mannan present in four different tissues of multiple Cenchrus accessions; lower stem (LS), lower leaf (LL), upper stem (US) and upper leaf (UL). Plots show calibration predictions (cal) as well as cross-validated predictions (val) used to evaluate the accuracy of the model.
- Supplemental Fig. S10 PLSR models generated for predicting mg/g of biomass comprised of AIL present in four different tissues of multiple Cenchrus accessions; lower stem (LS), lower leaf (LL), upper stem (US) and upper leaf (UL). Plots show calibration predictions (cal) as well as cross-validated predictions (val) used to evaluate the accuracy of the model.
- Supplemental Fig. S11 PLSR models generated for predicting mg/g of biomass comprised of ASL present in four different tissues of multiple Cenchrus accessions; lower stem (LS), lower leaf (LL), upper stem (US) and upper leaf (UL). Plots show calibration predictions (cal) as well as cross-validated predictions (val) used to evaluate the accuracy of the model.
- Supplemental Fig. S12 PLSR models generated for predicting mg/g of biomass comprised of ash present in four different tissues of multiple Cenchrus accessions; lower stem (LS), lower leaf (LL), upper stem (US) and upper leaf (UL). Plots show calibration predictions (cal) as well as cross-validated predictions (val) used to evaluate the accuracy of the model.
- Supplemental File S1 List of accession and their geographical sources.
- Copyright: © 2024 by the author(s). Published by Maximum Academic Press, Fayetteville, GA. This article is an open access article distributed under Creative Commons Attribution License (CC BY 4.0), visit https://creativecommons.org/licenses/by/4.0/.
-
About this article
Cite this article
Brown CW, Harper K, Dayananda B, Gamage H, Lambrides CJ, et al. 2024. Application of FTIR spectrometry for the assessment of cell wall composition and nutritional quality of Cenchrus spp accessions. Grass Research 4: e002 doi: 10.48130/grares-0023-0029
Application of FTIR spectrometry for the assessment of cell wall composition and nutritional quality of Cenchrus spp accessions
- Received: 28 July 2023
- Revised: 19 December 2023
- Accepted: 27 December 2023
- Published online: 17 January 2024
Abstract: Fourier transform infra-red (FTIR) spectroscopy based partial least squares regression (PLSR) models were developed to assess multiple accessions of Cenchrus spp (buffel grass). The germplasm tested included accessions collected from different pastoral regions of Australia and an international set of germplasm sourced from the Australian Pasture Genebank. Drawing upon this germplasm collection, the field study described herein aimed to determine the relationships between cell wall composition, neutral detergent fiber (NDF) and indigestible NDF (iNDF) values across different strata levels and between stem and leaf tissues. Predictive models were able to identify and distinguish characteristic traits for each tissue and strata; leaf tissue possessed elevated concentrations of extractives, arabinan, galactan and ash, while stem tissue had elevated concentrations of all other variables measured. Upper strata tissue consistently had greater concentrations of acid-soluble lignin (ASL) and mannan. Of the four tissues, lower stem had the highest NDF but was also the least digestible with the highest iNDF. NDF was strongly associated with the concentration of cell wall (CW) in biomass of all tissues except for upper stem tissue, where the correlation was weaker. iNDF correlated well with higher concentrations of acid-insoluble lignin (AIL) and xylan in stem tissue, while in leaf tissue, only xylan remained closely associated with iNDF. Not only were PLSR models able to characterize the tissue types investigated, they also detected differences between the two years sampled, likely attributable to the impact of abiotic factors during the different growing seasons or the two different methods employed to clear the experimental plots.
-
Key words:
- Applications /
- FTIR /
- Spectrometry /
- Assessments /
- Cell /
- Wall /
- iNDF /
- NDF /
- Digestibilty


