


-
Phylogeographic methods provide valuable insights into how genetic patterns among populations relate to geographic environments. These studies highlight how the historical context of geographic adaptive radiation shapes genetic distribution patterns. Genetic variations across vast geographic regions serve as essential indicators for assessing the adaptability of various genotypes[1,2]. By studying the genetic variations and distributions across large geographic scales, scientists can gain a deeper understanding of how evolutionary processes influence population genetic patterns over time. Additionally, phylogeographic studies provide valuable approaches for understanding and interpreting genetic variations in adaptive phenotypic traits, shedding light on the evolutionary mechanisms behind functional adaptations to diverse environments. Viewing this through a phylogeographic lens, it becomes clear that genetic divergence plays a crucial role in regulating phenotypic traits to facilitate adaptation across various geographic sites and environmental conditions[3].
To comprehensively understand the dynamics of phenotypic traits, it is imperative to gather genotypic information from large and diverse geographic locations. This involves conducting population genetics and phylogeographic analyses using gene sequences, genetic markers, and genome sequences, as exemplified in studies by Wiens et al.[4] & Wang et al.[5]. With the rapid advancements in genomic sequencing technology, various innovative analytical methods leveraging genomics have emerged. These include genome-wide association studies (GWAS) and genomic selection (GS). These methods aim to correlate DNA polymorphism data with phenotypic traits, enabling the identification of the genetic basis underlying important phenotypic traits[6].
Spectral variability in optical remote sensing data may reveal genetic diversity at distinct geographical sites characterized by environmental heterogeneity[7−9]. The optical properties of plants, influenced by phenotypic traits such as biochemical content, leaf and canopy structure, and physiological functions, contribute to measurable spectral variability. Spectral information proves to be instrumental in accurately estimating genotype-specific phenotypic features. Consequently, spectral variation has the potential to capture genetic variations, particularly related to plant biochemical, physiological, and structural divergence. Using a combination of tools, including visual inspection, DNA molecular markers, and spectrometry[10,11], it is possible to improve the efficiency for identifying genetic variation in plant materials. As demonstrated by Bush et al.[12], phylogeographic affinities, genetic loci of functional traits, and spectral properties can be leveraged to parameterize process-based neutral and adaptive landscape genetics for biodiversity research.
Manually collecting phenotypic information across large areas is time-consuming and susceptible to data quality issues due to various factors during the data collection stages. Remote sensing offers an efficient alternative for gathering phenotypic data on plant diversity across different genetic groups in a short time frame. This approach helps to reduce both the cost and time required for phenotyping while maintaining a high level of data accuracy and consistency[13].
By using remote sensing, researchers can swiftly collect data and identify key phenotypic traits associated with physiology and biochemistry. This enhances our understanding of plant characteristics and their genetic variations. Studies have demonstrated a notable correlation between phenotypic traits measured using remote sensing data obtained from unmanned aerial vehicles (UAV) and the data obtained in situ[14]. The correlation underscores the reliability and potential of remote sensing in phenotypic data collection and analysis, marking a significant advancement in the study of plant genetics and phenotypes. High-throughput phenotyping technology, including 3D modeling, has played a pivotal role in large-scale quantitative trait loci (QTL) analysis. This technology has been instrumental in uncovering the genetic architecture governing dynamic plant growth in maize[15], the genetic control of leaf elongation in barley (Hordeum vulgare)[16], and the genomic prediction for canopy height in wheat[17]. The integration of genomic information under specific environmental conditions with plant ontogenetical, physiological, and biochemical properties, assessed through image-analysis-based phenotypic information, has enabled the targeted selection of more suitable cultivars for breeding purposes[18].
Remote sensing technology has the potential to bridge the gaps between genotype and phenotype study, by alleviating the challenges in large amounts of data collection across extensive geographic extent. By supplying consistent and reliable spectral and phenotypic measurements, remote sensing proves invaluable in the field of phylogeography, offering insights into the natural dynamics of essential agronomic or ecological traits across evolutionary history. In the review, we described applications of remote sensing technology on phylogeographic studies from two aspects. The initial aspect revolves around assessing genetic variation through analyses of spectral variability, while the second centers on investigating phenotypic dynamics for phylogeographic patterns to identify genetic basis linked to potential phenotypic traits through remote sensing technology.
To consolidate this information, we conducted a thorough review of relevant publications, encompassing diverse platforms, sensors, wavelength ranges, spatial resolutions, model optimization techniques, and analysis methods (Table 1)[19,20]. We also summarized the advantages and disadvantages of remote sensing technologies in phenotypic measurements (Table 2). Finally, the review provides the deficiency and opportunities for future improvements in the cross-cutting research using remote sensing in phylogeography. Existing literatures demonstrate a noteworthy surge in interest regarding the evaluation of genetic variation by leveraging spectral features and identification of the genetic basis of remotely sensed phenotypic data (Figs 1 & 2). These studies play crucial roles in developing an integrated approach to identify, define, and conserve genotypic divergence, thereby enhancing our understanding of adaptive evolution and biodiversity. It aims to identify the genetic foundations of these adaptive traits, thereby contributing to advancements in genetic breeding and germplasm conservation.
Table 1. Approaches adopted to integrating remote sensing and phylogeography.
Spectral data Applications related to phylogeographic relationship Platforms Sensors Spatial resolution Bands Extracted features Methods Accuracy and references Spectral variation related to genetic variation Assessing genetic variation using variation in spectral patterns Satellite Landsat 5 TM USGS/ESPA 30 m Blue
(0.45−0.52 mm);
Green
(0.52−0.60 mm);
Red
(0.63−0.69 mm);
Near Infrared
(NIR)
(0.76−0.90 mm); Shortwave Infrared
(SWIR1)
(1.55−1.75 mm); Thermal (10.40−12.50 mm); Shortwave Infrared (SWIR2)
(2.08−2.3 mm)Normalized difference vegetation index
(NDVI); Normalized difference moisture index (NDMI)Linear mixed effects model with the maximum-likelihood population effects (MLPE) parameterization [21] ER-2 platform NASA airborne visible/infrared imaging spectrometer (AVIRIS) 8 m 414−2,447 nm NDVI; Water band
index (WBI)Partial least-squares discriminant analysis (PLSDA); Canonical correlation analyses (CCAs); Discriminant analyses; Linear-mixed models (GLMMs) Kappa = 0.85−0.89[22] Automated tram Portable field spectrometer (SVC HR-1024i; Spectra Vista); Imaging spectrometer
(E Series; Headwall Photonics)30 cm 340−2,500 nm Leaf spectral
reflectancePartial least squares regression (PLSR); Mantel tests; D(TM) calculates; Linear regression models [11] Airborne Airborne imaging spectrometer (AIS); Field spectroradiometer (ASD FieldSpec 4, Boulder, CO, USA) 2 m 372−2,540 nm Spectral reflectance Partial least squares (PLS) regression; PRESS statistic RMSE = 0.2897[23] Ground USB4000 portable equipment; Bruker FT-NIR MPA II (12,489−3,996 cm−1); Portable thermo fisher MicroPHAZIR 0.2 nm;
16 cm−1;
16 cm−1400−1,037 nm; 12,489−3,996 cm−1;
1,595−2,396 nmSpectral reflectance Principal component analysis and soft independent modeling of class analogy (SIMCA) Classification accuracy of 88%−91%[24] hyperspectral imaging
system (HIS)30 cm 400−1,000 nm Leaf spectral
reflectanceParSketch-PLSDA method Ranging from 81% to 96% for precision[25] ASD 350−2,500 nm Leaf spectral
reflectancePartial least squares-discriminant analysis
(PLS-DA); PCAKappa = 0.34 and 0.61[10] Classifying genotypic differentiation using spectrally derived traits UAV RGB or near-infrared, green and blue (NIR-GB) camera 40 m Near-infrared, green and blue PHUAV for each plot
from the DSM dataGenomic prediction modeling r = 0.448 − 0.634[26] Ground ASD 350−2,500 nm Foliar traits PLSR RMSE = 9.1%
− 19.4%[27]LiDAR Canopy height/
structureFine-scale digital
elevation models (DEMs)Predicted phenotypes
related to genetic
patternEstimating the phenotypic
dynamics under
genetic patternUAV 12-megapixel DJI FC300X camera;24-megapixel Sony a6000 RGB camera Altitude of 25 and 120 m Red-green-blue (RGB) bands Canopy height metrics from the DSM data Mixed linear models utilizing residual maximum likelihood (REML); Three-parameter Weibull sigmoid growth model R2 > 99%; RMSE < 4 cm[28] The compact LIFT instrument Blue light-emitting diode (LED); STS-VIS spectrometer (Ocean Optics, Florida, USA); RGB cameras 0.46 nm 445 nm;
400−800 nmFluorescence Data; NDVI; Alternative NDVI (NDVI_II); Green normalized difference vegetation index (GNDVI); MERIS terrestrial chlorophyll index (MTCI); Photochemical reflectance index (PRI) Least absolute shrinkage and selection operator (Lasso) regression; Linear modeling r = 0.7 − 0.92[29] Identifying the
genetic base of
adaptive phenotypic
traitsUAV high-throughput phenotypic platforms (UAV-HTPPs) RGB or near-infrared, green, and blue (NIR-GB) camera 40−60 m Plant height; Canopy reflectance; Biomass Crop surface model; Ortho mosaics model Accuracy for DSM was 2.31 cm/pixel[30] UAV and tractor Multi-spectral camera; GreenSeeker spectral sensors 40−42 m for UAV; 1.32 m for tractor Green; Red; Red Edge; NIR; Blue NDVI GWAS; QTL R2 = 0.02 − 0.11[31] UAV RGB 18 m RGB bands Canopy cover; Canopy volume; and Excess greenness index. Plant Growth Models; Variance inflation factor (VIF); GWAS R2 = 0.87 − 0.94[32] Table 2. Advantages and disadvantages of remote sensing technologies in measuring plant traits.
Remote sensing platforms Advantages Disadvantages Sensors Measured traits Ground-based platforms High resolution; Not influenced by background for leaf measurement Require long measurement time; Restricted by field conditions and challenging environment Multispectral, hyperspectral sensors Pigment concentrations; Quality traits (eg., oil, amylose, protein content, moisture); Total plant/canopy biomass; Yield Thermal infrared cameras Leaf and canopy temperature UAVs Large spatial scales for canopy measurement Low data resolution VIS imaging systems Morphological traits (eg., shape, structure, color properties); Geometric traits (eg., length, area, canopy cover, canopy volume); Photosynthetic behaviors; Pigment concentrations Near infrared (NIR), short-wave
infrared (SWIR) cameraLeaf water content; Plant/canopy structure; Biomass Hyperspectral sensors Pigment concentrations; Quality traits (eg., oil, amylose, protein content, moisture); Total plant/canopy biomass; Yield LiDAR Plant structure (eg., crown density, structural complexity) Thermal infrared cameras Leaf and canopy temperature Satellites Large spatial scales across
landscapes and regionsCoarser spectral resolution; Lower spatial resolution; Susceptible to
cloud interferenceMultispectral, hyperspectral sensors Vegetation structural properties (eg., species richness) 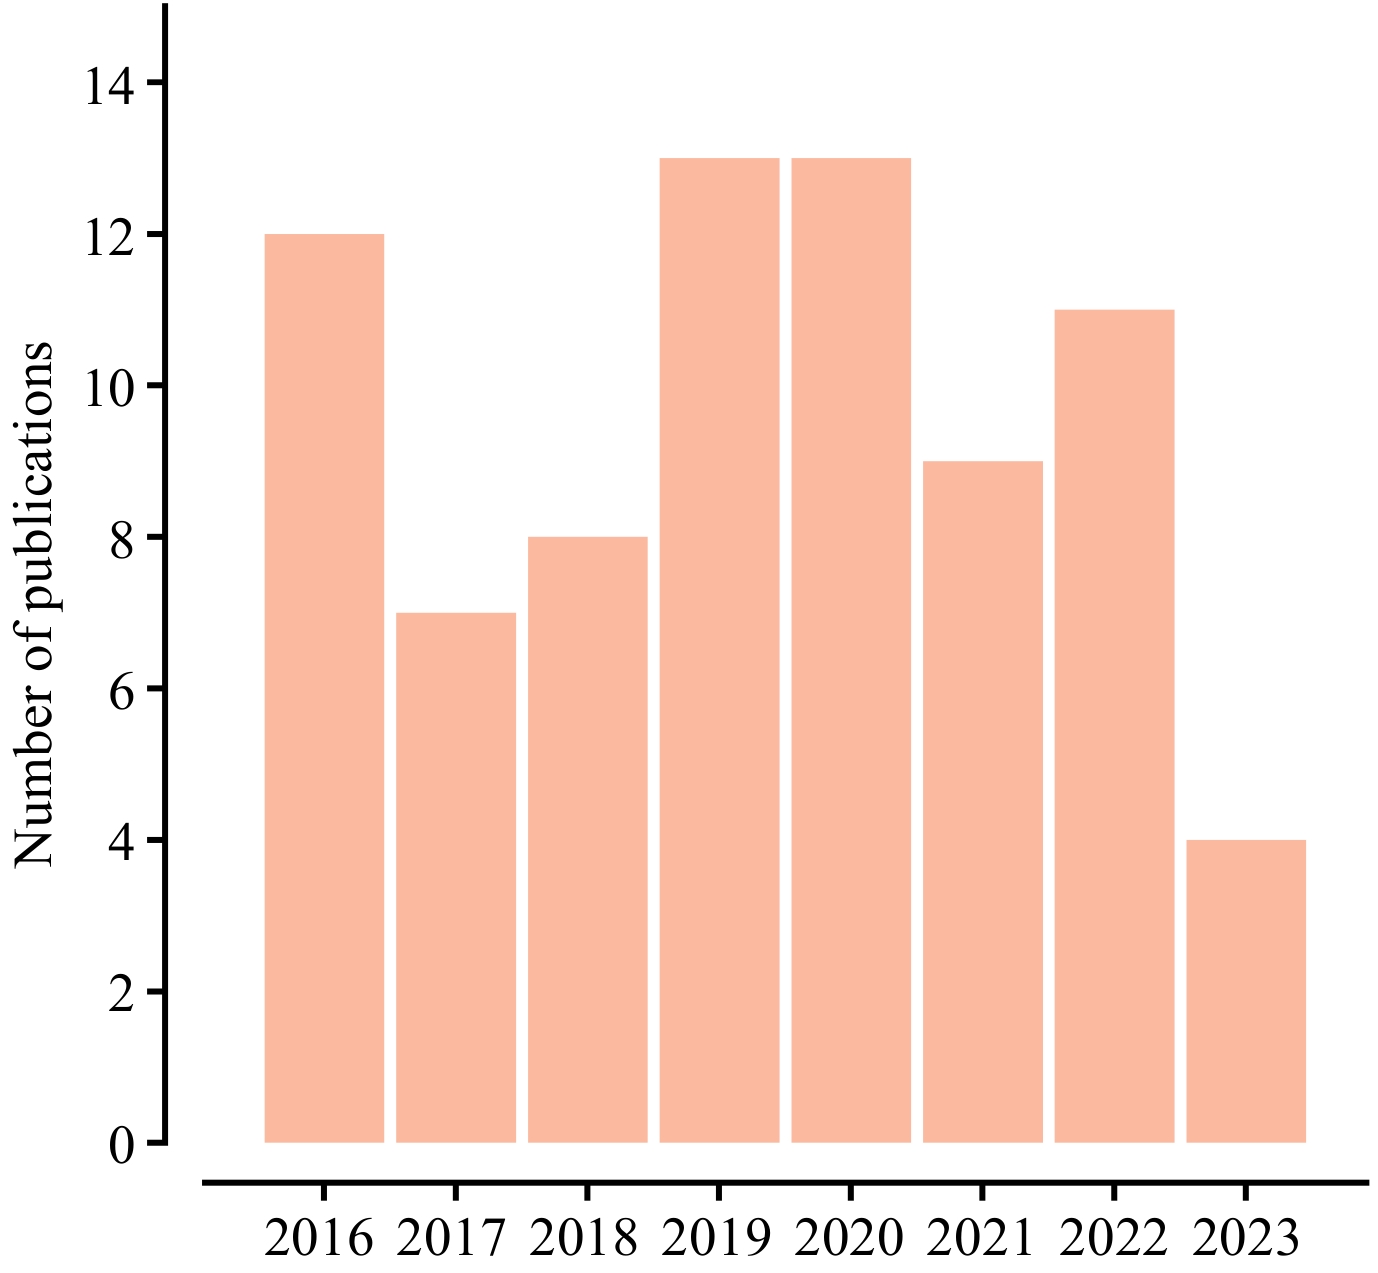
Figure 1.
Annual number of publications related to the use of vegetation spectral data in phylogeography, from 2016 to 2023. These publications were searched using keywords 'vegetation spectral' and 'phylogeography', from the Web of Science.
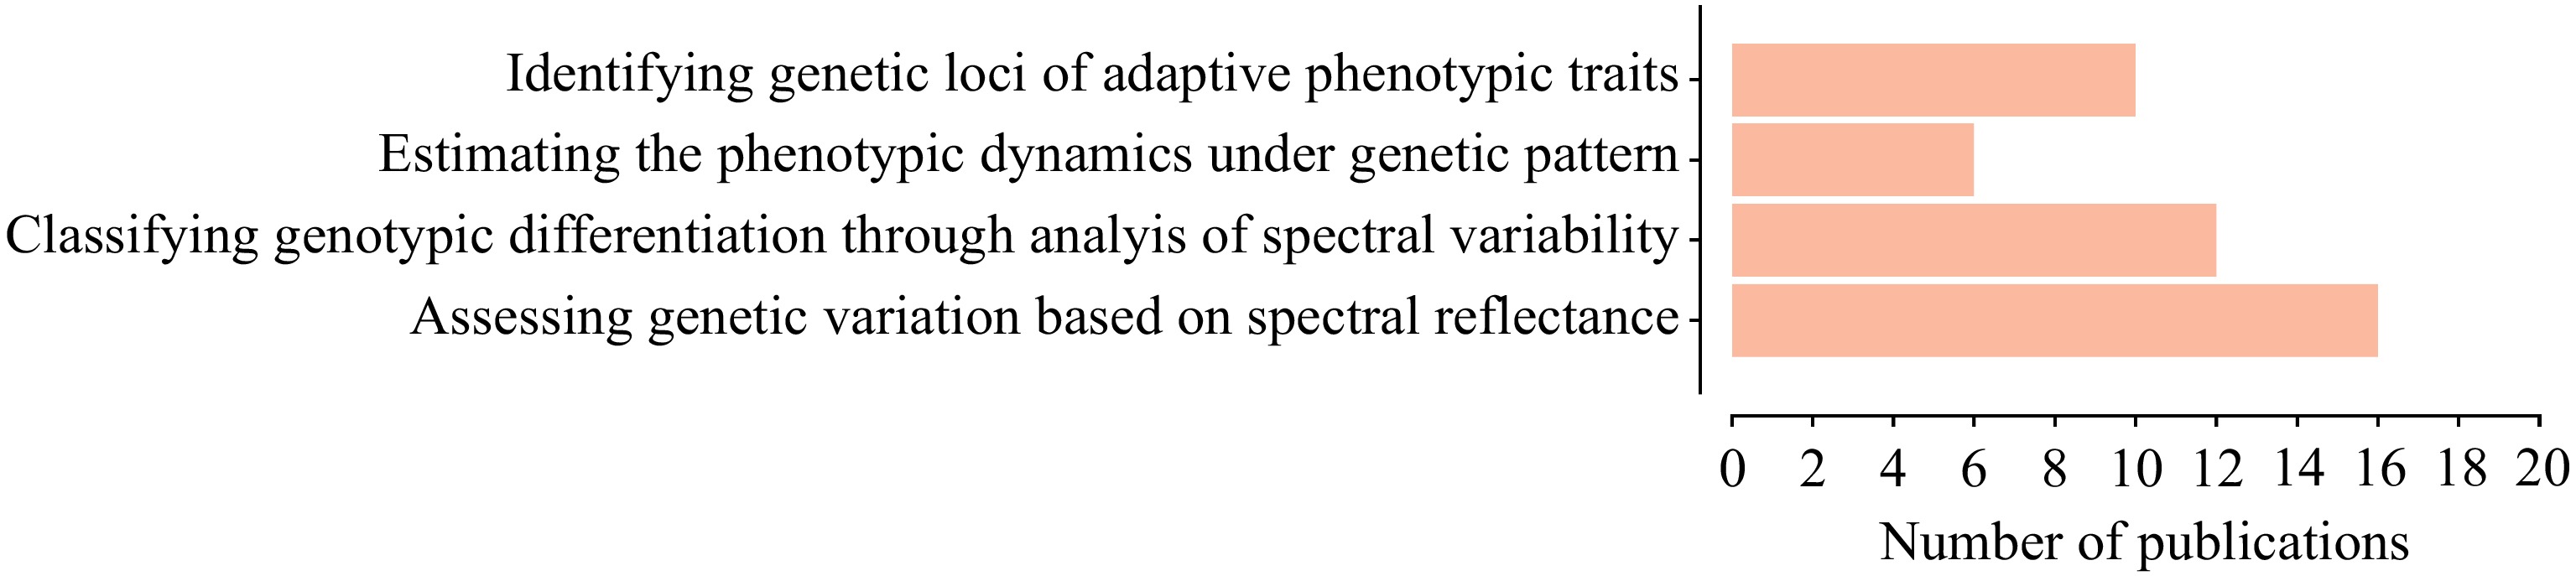
Figure 2.
The number of publications on different types of research relevant to integration of vegetation spectral data and phylogeography, from 2016 to 2023.
In this study, we introduced a flowchart designed to facilitate the application of remote sensing technology on phylogeographic patterns (Fig. 3). The flowchart elucidates the connections between various facets of the dataset, fostering a comprehensive understanding of their relationships.
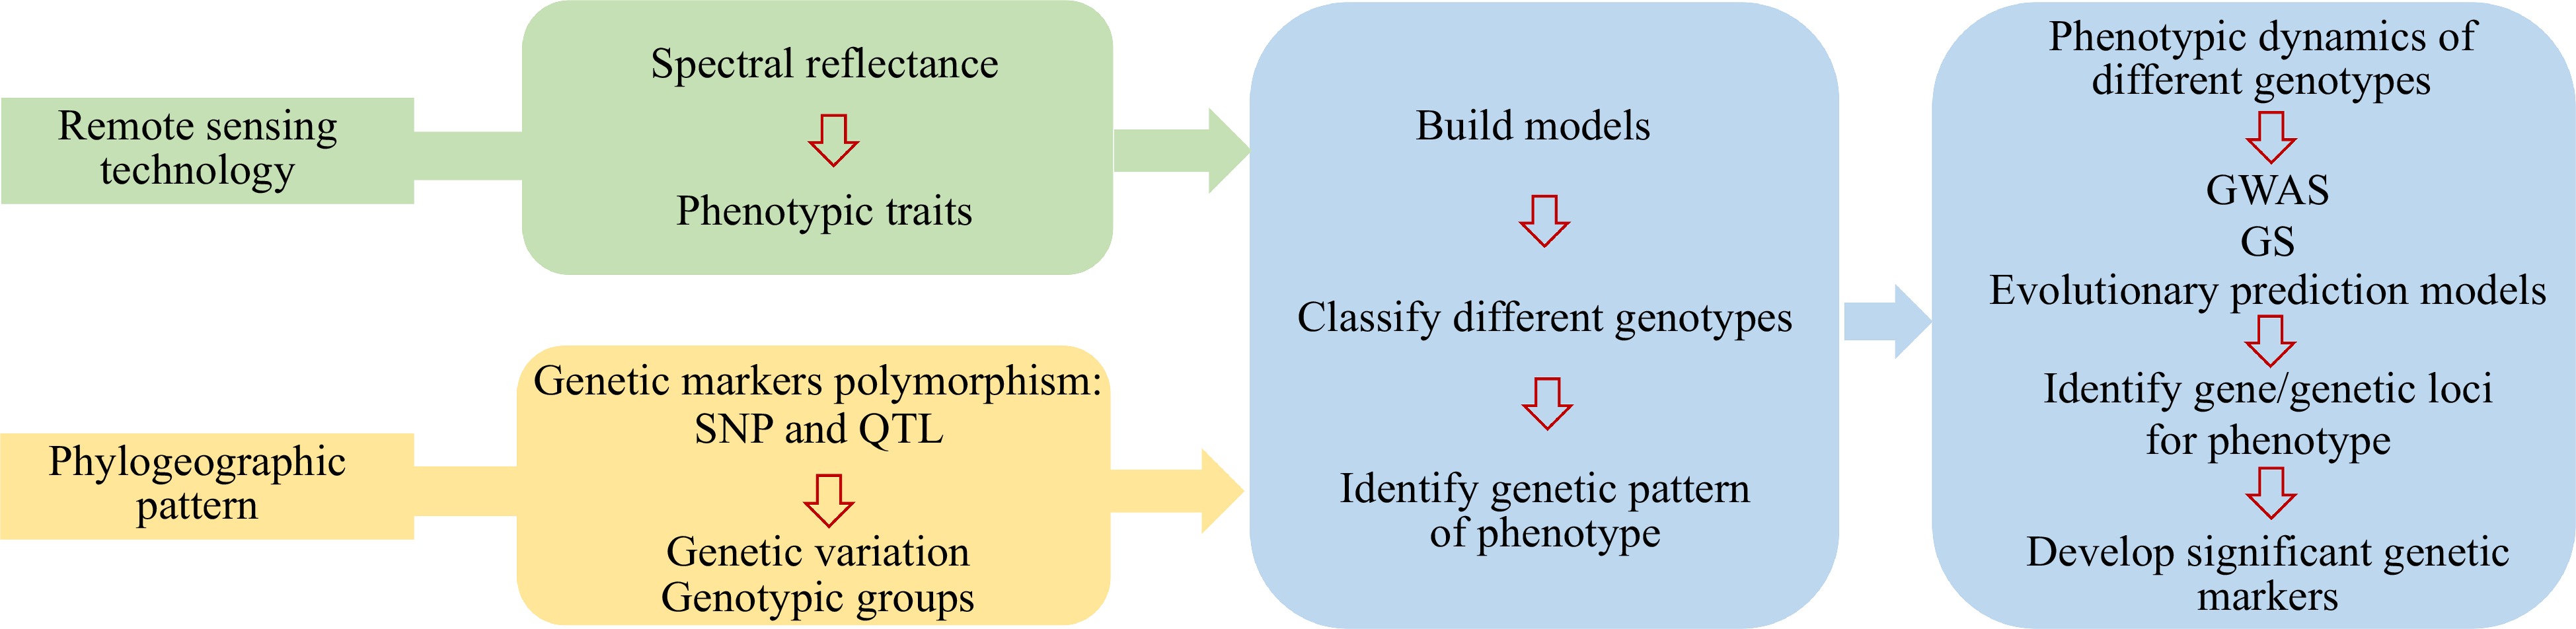
Figure 3.
Flowchart illustrating the combination of remote sensing and phylogeography to study the genetic patterns.
-
Recent research has underscored the role of genetic variation in regulating plant phenotypic traits by influencing the responses of physiological hormones to environmental conditions across diverse geographic locations[33]. Research has been undertaken to explore genetic variations by analyzing spectral variability and deriving phenotypic traits. These publications, along with our recent study on remote sensing in phylogeography[8−9, 23−25, 34, 35], primarily focus on studying genetic divergence. These findings establish a robust foundation for understanding genetic variation revealed by spectral variability and exploring the practical applications of remotely sensed phenotypic traits in molecular breeding.
Remote sensing technology
-
Remote sensing data acquired from satellites, UAVs, and ground-based platforms play a pivotal role in achieving high-throughput field phenotyping[36]. This allows for the characterization of genotypes in phylogeographic patterns across diverse environmental gradients. UAVs are especially useful in collecting remote sensing data for a large size of population and field studies. Ground-based platforms provide increased data resolution due to shorter distances between sensors and plant targets[31]. Various types of remotely sensed data, including those obtained from RGB, near infrared (NIR), short-wave infrared (SWIR) camera[37], multispectral or hyperspectral sensors, light detection and ranging (LiDAR)[38,39], and thermal sensors have been instrumental in assessing additional phenotypic traits indicative of genetic differences. VIS imaging systems such as RGB camera with three color sensors (blue, green and red) have been developed to measure plant growth, development, and responses to the environment[35]. Identified pixels through image processing algorithms are used for measuring the morphological (shape, structure), geometric (length, area), and color properties of each plant. NIR/SWIR cameras have spectral sensitivity in the range of 800–2,500 nm, correlated to plant growth rate, leaf water content, and leaf thickness[40]. The wavelength range of 800–1,700 nm encompasses three out of five water absorption regions. These regions can be future exploited to estimate the leaf water content. Thermal infrared cameras can detect long-wave infrared (LWIR) radiation that is emitted by objects to estimate leaf temperature[41]. Hyperspectral cameras with specific wavelength information can measure hundreds of spectral bands between 350 and 2,500 nm. Hyperspectral imaging has a promising potential for detecting plant traits related to abiotic and biotic stresses. Chlorophyll fluorescence imaging presents the potential capability to measure the quantum efficiency of photosystem II (PSII) in plant stress research[29]. Three-dimensional (3D) traits measured using laser-scanning techniques and depth/time-of-flight sensors can be employed to measure architectural features such as the number of leaves or tillers for analyzing plant growth and movement[42]. Remote sensing technologies allow the collection of high-throughput phenotypic traits that have precision capable of discerning genetic differences and facilitating the identification of genetic basis for adaptive plant traits.
Analysis of spectral variability for revealing genetic diversity
-
Establishing the correlation of remotely sensed data with empirically measured and biologically relevant traits is the greatest challenge in revealing genetic variation through analysis of spectral variability. Spectral wavelengths sensitive to genetic discrimination are closely linked to photosynthetic pigments, proteins, and plant fibers, suggesting that genetic variation in phylogeography is manifested in biochemical characteristics[24]. Infrared spectra in different regions of visible, near IR and mid-IR spectrum could allow capturing the phylogeographic signal in Araucaria araucana that separates Coastal and Andean origins[24]. This capability further reveals unique genetic patterns underlying diverse phenotypic traits. In these studies, biological, chemical, and structural traits were extracted through remote sensing techniques, examining a range of species including crops such as rice, maize, and wheat[36], as well as trees like Oaks and Araucaria Araucana and grass. Spectral variability related to physiological and highly heritable agronomic traits, such as plant height offers the potential to study genetic variation. RGB and near-infrared cameras mounted on UAV platforms facilitate the monitoring of plant height in maize and sorghum over extensive spatial regions and capturing equivalent genetic variation to manual measurements[28, 43]. The UAV imagery technology can be used for estimating variations in plant height across different genotypes and several genetic mapping populations. This has the potential to unveil genetic diversity. Plant height estimates of maize have previously offered evidence of equivalent or greater phenotypic variation partitioned to genetic factors. Genetic variation (s2 G) and repeatability (R) estimates presented the percentage of genetic variation explained by plant height using RGB imagery, which can be used to compare the accuracy of plant height estimates among different UAV platforms and different canopy structures[44]. In a study to understand drought-adaptive traits, Condorelli et al.[31] used multi-spectral cameras mounted on UAV and tractor-based platforms to gather NDVI measurements in a high-throughput manner. NDVI serves as an integrative measure to correlate with chlorophyll content and total plant/canopy biomass, showing sensitivity features to genetic variation and capacities to discriminate genotypes[45]. Important traits for forest structure, such as crown density and structural complexity could reveal genetic-based diversity within and between species through rapid phenotyping using ultra-dense UAV-LiDAR point clouds[36]. Certain spectral indices derived from optical remote sensing data demonstrate the potential to identify genetic variation in plants. The application of remotely sensed phenotypic traits in estimating genetic variation suggests that these traits may exhibit heritable genetic diversity in response to diverse environmental conditions.
Advances in computer vision-assisted analysis methods in high-throughput plant phenotyping data are needed to improve further. The soft independent modeling of class analogy (SIMCA) presented high prediction capability to discriminate phylogeographic origin with a classification accuracy of 88%–91%[24]. The mixed linear model, employing residual maximum likelihood (REML), in conjunction with the Weibull sigmoid growth model, has been used to estimate genetic variation based on predicted plant height and growth parameters[28]. Significant genetic variation was detected at the provenance level in E. pauciflora and E. tenuiramis by calculating genetic parameters including the quantitative inbreeding coefficient (QST) and narrow-sense heritability (h2OP) estimates for remote sensing data derived from individual tree LiDAR point clouds[36].
-
In the realms of biodiversity and plant breeding, researchers have endeavored to elucidate the genetic mechanisms governing essential phenotypic traits, leading to the identification of numerous genetic loci associated with phenotyping across diverse genotypic groups[46]. A thorough exploration of phenotypic information is needed to ascertain its suitability for detecting genetic variations in phylogeographic patterns, spanning from the original geographic sites to extended regions. Phenotypic measurements of samples with phylogeographic patterns provide the dynamic nature of many important agronomical traits to adapt to different environments at large geographic scales. These biochemical traits derived from remote sensing technology have the potential for studying the association of genetic diversity and phenotypic traits. By analyzing spectral data that captures phenotypic changes across diverse genotypic groups and aligns with phylogeographic patterns, it becomes feasible to identify genes and genetic loci influencing the development of specific phenotypic traits. The capability facilitates the rapid discovery of new phenotypes[35]. The genetic architecture of plant traits has been determined to identify some large effect loci likely fixed during domestication and early selection[47]. The acquisition of high-throughput phenotypic data through remote sensing has proven to be pivotal in the development of molecular markers for spinach (Spinacia oleracea L.)[32].
Phenotypic dynamics in phylogeographic pattern detected through remote sensing technology
-
The high-throughput nature of phenotyping facilitates the examination of dynamic mechanisms in plant functional traits of genetically diverse groups. With the decreasing cost of genome-wide genotyping, large-scale phenotyping through remote sensing has become a crucial tool for exploring significant phenotypic variation attributed to genetic factors[43,44,48]. The recent progress in high-throughput phenotyping platforms (HTTPs) based primarily on the use of ground based platforms and/or UAVs provides unprecedented opportunities to accurately measure proxy traits in hundreds of plots[49−52], as required in experiments to identify QTLs. An UAV remote sensing experiment, featuring repeated measurements every month with a flight duration of approximately 10 min, demonstrated a performance in measuring sorghum plant height comparable to manual phenotypic measurements for genomics-assisted breeding[26]. Increased ability of aerial over ground-based platforms has been observed to detect quantitative trait loci (QTLs) for NDVI, particularly under terminal drought stress[28]. Various remote sensing techniques are commonly used to explore the phenotypic dynamics within phylogeographic relationships. NDVI was extracted from georeferenced ortho mosaic GeoTIFFs generated from imagery captured from multi-spectral cameras carried on UAVs and tractor-based platforms. The NDVI data has been employed to ascertain the genetic basis for grain yield using GWAS analysis[53]. Both airborne laser scanning and imaging spectroscopy have proven valuable for mapping phenotypic variation within species, particularly in tree functional traits[54]. Canopy cover, assessed through digital cameras, exhibits correlations with plant density, early vigor, leaf size attributed to genetic variation[55]. Thermal sensors emerge as effective tools for measuring canopy temperature, offering valuable insights into estimating water stress levels[56]. Furthermore, the integration of multispectral and hyperspectral imaging from different sensors is successful in discriminating and mapping long-range spatial phenotypic features[57,58].
As we unravel the underlying genetic loci governing the variability of remotely sensed phenotypic traits, spectral-related proxies such as NDVI play increasingly vital roles in selecting valuable cultivars. These plant traits like plant height, dry biomass, leaf rolling, and phenology score obtained using remote sensing technology, chosen based on genetic information obtained from identified loci, facilitate the optimization of desirable traits in breeding programs[59−62]. Researchers have explored phenotypic dynamics in plants exhibiting phylogeographic patterns using the Normalized Difference Vegetation Index (NDVI)[51,63,64] as well as traits related to drought adaptation[31]. NDVI is proven to be useful in predicting canopy biomass and nitrogen status[55]. Using an optical sensor to detect NDVI values, researches identified a total of 44 genetic loci across different environments linked to traits such as staygreen (Stg) at physiological maturity, yield components, plant height, and yield-related physiological traits in wheat[52,65,66]. In the context of spinach, GWAS was employed to identify SNPs associated with growth parameters such as canopy cover, canopy volume, and excess green index (ExG) measured using RGB sensor mounted on UAVs[32]. The canopy height measurements and their respective growth rates obtained using UAV-RGB and NIR-GB camera identified unique QTLs and candidate genes controlling plant height in the GWAS study[67]. Furthermore, remote sensing techniques have been employed to investigate the adaptive significance of photosynthetic pathways in the grass family (Poaceae) under different light environments. These studies aimed to test ecological theories concerning adaptive evolution[34,68,69]. The integration of spectral data and phylogeography has proven instrumental in systematically examining the genetic architecture of agronomic traits[70,71] and gene-environment interactions[72]. These valuable insights, in turn, contributed significantly to the conservation and breeding of plant germplasm resources.
Association analysis between genetic variation and phenotypic traits
-
To examine the dynamic interplay between phenotypic changes and phylogeographic patterns, it is crucial to employ a variety of analytical methods. These methods are essential to elucidating the relationships between phylogeography and the expression of phenotypic traits derived from remote sensing data. The integration of spectroscopy-based functional traits with phylogeography can be achieved using Mantel tests, allowing for the assessment of correlations between their dissimilarity matrices. Additionally, Partial least squares (PLS) regression can be used to predict the likelihood of populations belonging to a particular genetic cluster based on their similarity in predicted remotely sensed phenotypic traits[9,23]. Notably, genomic prediction models have demonstrated a remarkable resemblance in sorghum between plant height measurements obtained via remote sensing and those obtained through conventional methods[26].
Capitalizing on the rich genetic variation inherent in phylogeographic relationships and the phenotypic diversity extracted from remote sensing data across extensive geographic regions, GWAS presents a remarkable opportunity to pinpoint numerous significant genetic loci under natural phenotypic variation. The genomic study conducted by Huang et al.[73] pinpointed crucial components, including single-nucleotide polymorphisms (SNPs), QTLs, and sequencing-based genotypes, all exhibiting significant associations with phenotypic traits such as plant height and some growth parameters through GWAS[32,53]. This approach facilitates the optimization of marker development, particularly for complex agronomic traits[70,72]. Genomic selection model refers to an accurate prediction model using genomic selection (GS). UAVs-based plant height estimates in sorghum could perform similar results to manual measurements in the genomic prediction model[26]. Identification of QTL hotspots provided insight for marker-assisted and genomic selection analyses in sorghum, rice, and wheat breeding[6]. Advanced models seek to identify the genetic basis responsible for adaptive traits by leveraging extensive datasets of genomes and phenotypes. Uncovering specific genetic loci or candidate genes holds the potential to significantly enhance agriculturally important traits through selective breeding.
-
Remotely sensed spectral data can be obtained at various levels, including leaf, plant, canopy, and landscape, each exhibiting distinct sensitivity to phylogeographic patterns. Variability in biophysical parameters such as leaf area index (LAI), height, plant, and canopy structure, can impact spectral measurements. The biochemical components like pigments, biomass, water, and N contents, as well as functional components like photosynthesis, fluorescence, and stress response, may also influence spectral measurements, thus potentially confounding the study on relationships between remote sensing and phylogeography[8]. To gather diverse information and crucial phenotypic trait-related characteristics from field-grown plants, it is imperative to carefully select appropriate platforms and remote sensing sensors. High-throughput phenotypic measurements, facilitated by hyperspectral and multispectral sensors, often complimented with active LIDAR, have proven effective in measuring canopy reflectance, estimating plant height, and assessing biomass[49,74−76]. For instance, sensors equipped with a NIR band may outperform those limited to the visible range alone in genomic prediction modeling[26]. Hyperspectral imaging has been instrumental in examining pigments, as well as quality traits such as oil, amylose, protein content, and moisture in whole rice grains and other crops. Additionally, it has been applied to assess N content and biomass in plants[77,78].
Spatial scales
-
Considerations for spatial scales are important when using remote sensing methods for targeted vegetation parameters or phenotypic traits. Factors such as plant and canopy structures, their physical and biochemical compositions, background soils and atmospheric conditions, and platforms, all influence spectral signals[79,80]. Therefore, spectral data acquired at different scales will be impacted by different interference factors. For instance, a measurement at the leaf scale may not be influenced by soil properties and canopy structures, so leaf-related traits would be measured with more confidence than plant or canopy-related traits. Canopy or landscape properties can be measured at a larger spatial scale, however, leaf level properties may only be estimated through empirical models or inversion of physical models with large uncertainty. Ground-based phenotyping platforms require a longer time to complete the measurements as compared to UAV-based remote sensing. The advantage of UAV-based phenotyping over a larger area in less time could minimize the effects of daily environmental fluctuations on spectral measurements[31].
Spectral scales
-
Spectral resolution and wavelength ranges play important roles in shaping the connections between spectral variability and phylogeographic patterns. Spectral signatures in visible ranges are sensitive to pigment concentrations and photosynthetic behaviors. Spectral reflectance in near-infrared to shortwave infrared ranges is sensitive to water content, biomass, and plant/canopy structures. Sensors with a high spectral resolution can capture narrow spectral signatures or targets. For instance, estimation of red-edge position and chlorophyll fluorescence requires high to super-high spectral resolution. Accurate estimation of plant water content may also benefit from narrow spectral resolution to eliminate influence from atmospheric water vapor content variation. Sensors with coarser spectral resolution are common and affordable, such as many multi-spectral sensors mounted on satellite platforms, but still be valuable for vegetation structural properties. Current ground- and UAVs-based remote sensing technologies primarily concentrate on NDVI-related bands, such as red and near-infrared, for dissecting genetic factors associated with drought adaptive traits in durum wheat[31]. The study by Hernandez-Stefanoni et al.[81] demonstrated that the Landsat shortwave infrared band had a robust correlation with species richness in tropical forest ecosystems. Therefore, the careful selection of appropriate spectral resolution and spectral ranges is imperative to enhance the integration of spectral variability and genetic diversity.
Temporal scales
-
The spectral data collected from large-scale experiments are significantly influenced by both the stage of plant growth and daily fluctuations in environmental conditions[5]. Consequently, variations in leaf age and seasonal adjustments can introduce spectral variability within individual canopies, potentially complicating the relationship between spectral diversity and phylogeography[82−84]. By examining the seasonal dynamics of phenotypic traits using multi-temporal remote sensing data, we gain valuable insights into how spectral reflectance, genotype, and the environment are interconnected. A comprehensive understanding of the temporal changes in spectral diversity improves our ability to accurately capture genetic variation through spectral variation and remotely sensed phenotypic traits across different growth stages[30,85].
-
In this paper, we present an in-depth investigation of research dedicated to the application of remote sensing in phylogeography. Despite significant advancements, there remain persistent overarching limitations and challenges in this interdisciplinary approach. These challenges stem from a lack of physical models linking spectral measurements with phylogeographic patterns and a deficiency in systematic and consistent data acquisition at large scales and quantities.
One significant constraint associated with remote sensing data is spatial resolution. Satellite imagery and other remote sensing technologies often have limited resolution, making it difficult to capture subtle genetic patterns at fine scales. As phylogeographic studies increasingly delve into population-level analyses, the growing gaps between genetic data and remote sensing data become more apparent.
The lack of temporal congruence between these data sources can introduce uncertainties in deciphering the link between spectral variability and genetic diversification. Remote sensing data offers snapshots of the landscape at specific time points, while phylogeographic processes unfold over evolutionary timescales. Achieving temporal synchronization is crucial but labor-intensive and complex.
The effective integration of remote sensing and phylogeography relies on the availability and accessibility of relevant datasets. Acquiring suitable remote sensing data and genetic information for study areas, especially in remote or politically sensitive regions, can be challenging. Additionally, disparities in data specifications and quality across diverse sources may hinder effective integration.
-
The integration of various data sources, UAVs, satellite imagery, and ground instrumentation, is essential for overcoming limitations in spatial coverage and data quality inherent in individual platforms[6]. UAVs offer high-resolution data but suffer from limited battery life and flight duration, while satellites provide broader coverage but lower spatial resolution and susceptibility to cloud cover. Ground-based instruments excel in accuracy but face challenges in certain environments like tall crops or muddy fields[86].
To address these limitations, an integrated approach leveraging data from multiple platforms can be employed to extract both spectral and phenotypic information across geographical areas. However, ensuring consistency and high standards in imaging processing across different platforms, sensors, and timeframes is crucial for subsequent data analysis[87].
Cloud-based image analysis platforms like Google Earth Engine (GEE)[88], Amazon Web Services[89], Landsat Cloud (USGS), Copernicus Hub (ESA), and EOS Platform have become common for processing extensive datasets from various sensors[90]. These platforms facilitate the accurate remote sensing images processing and enable the selection of suitable imagery based on study parameters.
The adoption of cloud-based platforms, particularly GEE, has gained traction in biological studies[91]. Researchers have used these platforms for various applications, such as mapping forest changes and monitoring wildlife populations[92−94]. For instance, Millary[95] efficiently used the EOS Platform to analyze changes in vegetation greenness in the Cirebon Regency using the NDVI algorithm obtained from Landsat series images.
Furthermore, advancement in equipment accuracy and image processing techniques, along with rigorous plant measurements and outlier removal, are essential for enhancing the effectiveness of plant breeding initiatives. A deeper investigation into the connection between plant phylogeography, functional traits, and spectral attributes is needed for a comprehensive understanding of evolutional dynamics and genetic diversity identification.
While remote sensing data provides valuable insights into environmental factors influencing phylogeographic processes, it captures only a fraction of these variables. Integrating analyses with additional environmental data sources and employing ecological modeling approaches become imperative to enrich the explanatory capacity of such studies[96]. However, careful interpretation and validation are required when connecting genetic patterns with remotely sensed environmental variables, considering potential confounding factors and the need for additional experimental validation.
-
The use of remote sensing in phylogeography offers a valuable interdisciplinary approach to comprehending adaptive evolution processes and landscape genetics. This integration enables these researchers to pursue two primary objectives: 1) modeling and assessing temporal and spatial patterns of genetic variation through diverse spectral features obtained using remote sensing technology; and 2) identifying the genetic basis of specific phenotypic traits predicted from spectral data. We illustrate the estimation of genotypic divergence through the analysis of vegetation spectral variability. Additionally, we elucidate that the functional dynamics inherent in evolutionary processes can be studied by combining remote sensing technology with phylogeographic patterns. Furthermore, we demonstrate the identification of genetic loci associated with phenotypes derived from remote sensing data.
For the effective and meaningful application of remote sensing and phylogeography in biodiversity and plant breeding, amalgamating diverse data, methods, and theories is imperative. However, researchers must remain cognizant of inherent limitations and challenges. Overcoming spatial and temporal discrepancies, enhancing data availability and quality, addressing scale-related issues, and accounting for complex environmental interactions are pivotal steps in maximizing the potential of this integration. By overcoming these challenges, researchers can uncover profound insights into the intricate relationships between landscapes, environmental changes, and genetic variation.
-
The authors confirm contribution to the paper as follows: study conception and design: Zhang J, Shang J, Yan X; draft manuscript preparation: Zhang J; manuscript editing and refining: He Y, Liu J, Shang J, Yan X, Fan J. All authors reviewed the results and approved the final version of the manuscript.
-
Data sharing not applicable to this article as no datasets were generated or analyzed during the current study.
The authors would like to acknowledge National Natural Science Foundation of China (32171672) and Excellent Doctoral Thesis Project in Yangzhou University for partial funding of this effort.
-
The authors declare that they have no conflict of interest.
- Copyright: © 2024 by the author(s). Published by Maximum Academic Press, Fayetteville, GA. This article is an open access article distributed under Creative Commons Attribution License (CC BY 4.0), visit https://creativecommons.org/licenses/by/4.0/.
-
About this article
Cite this article
Zhang J, He Y, Liu J, Fan J, Shang J, et al. 2024. Integrating spectral data and phylogeographic patterns to study plant genetic variation: a review. Grass Research 4: e011 doi: 10.48130/grares-0024-0009 

Integrating spectral data and phylogeographic patterns to study plant genetic variation: a review
- Received: 02 February 2024
- Revised: 23 March 2024
- Accepted: 03 April 2024
- Published online: 06 May 2024
Abstract: The study of genetic variation is pivotal for understanding plant diversity and evolution. In recent years, remote sensing has played a significant role in phylogeography, facilitating the exploration of intricate relationships among genetics, spectral behavior, and evolution. This review article aims to present a comprehensive compilation of literature in two main areas: 1) investigating the potential of spectral data collected using remote sensing to study genetic diversity, and 2) using spectral characteristics to investigate functional dynamics associated with various phylogeographic patterns and identify genetic bases of important agronomic traits. Remote sensing has proven effective in detecting genetic variations across different geographical regions. Additionally, this review examines the limitations, challenges, and prospects associated with integrating remote sensing and phylogeography. In essence, phylogeographic studies offer theoretical insights into understanding the genetic mechanisms underlying functional variability observed in remotely sensed spectral data. Leveraging rapid technological advancements in remote sensing and data fusion approaches will lead to new understanding of plant genetic diversity and the functional significance of plant traits. This knowledge is invaluable for informing strategies for the management and conservation of natural resources.