ARTICLE   Open Access    

Differential metabolic responses to heat stress associated with interspecific variations in stress tolerance for annual bluegrass and creeping bentgrass

More Information
  • Received: 12 March 2024
    Revised: 10 April 2024
    Accepted: 10 April 2024
    Published online: 03 June 2024
    Grass Research  4 Article number: e013 (2024)  |  Cite this article
  • Annual bluegrass (Poa annua) typically exhibits early or more severe turf quality decline than creeping bentgrass (Agrostis stolonifera) during summer months when they are co-present on golf course putting greens. The mechanisms underlying the difference in heat tolerance between the two species are largely unknown. This study was conducted to compare physiological responses between P. annua and A. stolonifera and to identify metabolites and associated metabolic pathways underlying the differential heat tolerance. Plants were grown in controlled growth chambers at 22/17 °C (day/night, non-stress control) and 35/30 °C (heat stress) for 42 d. Visual turf quality, percent green canopy cover, and leaf electrolyte leakage were measured weekly. Metabolomic analysis was performed with leaf tissues collected at 42 d of heat stress. Relative to control plants, heat-stressed P. annua exhibited more severe declines in health across physiological parameters than A. stolonifera. Comparative metabolomic analysis of heat-stressed plants relative to the respective control identified metabolites that were upregulated uniquely or to a greater extent in A. stolonifera (sucrose, stachyose, raffinose, and glucose, glucuronic acid, and malonic acid) or P. annua (proline, tryptophan, lysine, phenylalanine, tyrosine, valine, isoleucine, and leucine) and those uniquely downregulated (malate, fumarate, pyruvate, aconitic acid, malonic acid, lactate, and glucose-1-phosphate and glucose-6-phosphate) in P. annua. Those distinct metabolites are mainly in photosynthesis, respiration, secondary metabolism, and stress protection. They were associated with the difference in heat tolerance for A. stolonifera vs P. annua and could be used as biomarkers or incorporated into biofertilizers to improve P. annua heat tolerance.
  • The competition for consumer preference for fresh apples (Malus domestica) from exotic and tropical fruits is intense. Red-fleshed (RF) apple may not only provide a novel point of differentiation and enhanced visual quality, but also a source of increased concentration of potentially health-benefiting compounds within both the fresh fruit and snack/juice markets[1]. Two different types of RF apples have been characterised: Type 1 RF apple has red colouration not only in the fruit core and cortex, but also in vegetative tissues, including stems and leaves; Type 2 RF apples display red pigment only in the fruit cortex[1, 2]. To facilitate trade and lengthen the supply-window, harvested fruit are usually cold stored, which can induce a series of disorders, including physiological breakdown manifesting as a flesh browning disorder (FBD) in RF apples[3, 4]. FBD in RF apples can be caused by senescence, and there is also some evidence to suggest that a large proportion of RF apples are chilling-sensitive (Jason Johnston, Plant & Food Research Hawke's Bay, personal communication).

    Earlier studies suggested that Type 1 RF colour was determined by a promoter mutation of MdMYB10 that has a tandem replication of a myeloblastosis (MYB) binding cis-element (R6) within the promoter, resulting in autoregulation of MdMYB10[5]. However, van Nocker et al.[6] observed a large variation in the degree and pattern of red pigmentation within the cortex among the accessions carrying MdMYB10, and concluded that the presence of this gene alone was not sufficient to ensure the RF colour. A genome-wide association study (GWAS)[3], reported that, in addition to the MdMYB10 gene, other genetic factors (e.g. MdLAR1, a key enzyme in the flavonoid biosynthetic pathway) were associated with RF colour, too. Wang et al.[7] reported that many of the up-regulated genes in RF apples were associated with flavonoid biosynthesis (e.g., chalcone synthase (CHS), chalcone isomerase (CHI), dihydroflavonol 4-reductase (DFR), anthocyanin synthase (ANS), UDP-glucosyltransferase (UGT) and MYB transcription factors). Recently, MdNAC42 was shown to share similar expression patterns in RF fruit with MdMYB10 and MdTTG1, and it interacts with MdMYB10 to participate in the regulation of anthocyanin synthesis in the RF apple Redlove®[8].

    Several transcription factor genes (e.g., MYB, WRKY, bHLH, NAC, ERF, bZIP and HSF) were reported to be differentially expressed during cold-induced morphological and physiological changes in 'Golden Delicious' apples[9]. A study by Zhang et al.[10] showed that ERF1B was capable of interacting with the promotors of anthocyanin and proanthocyanidin (PA) MYB transcription factors, and suggested that ethylene regulation and anthocyanin regulation might be linked in either direction. It was reported that ethylene signal transduction pathway genes or response genes, such as ERS (ethylene response sensor), EIN3 (ethylene-insensitive3) and ERFs (ethylene response factors), may play an important role in the regulatory network of PA biosynthesis[11].

    Espley et al.[12] observed no incidence of FBD in cold-stored fruit of 'Royal Gala', but over-expression of MdMYB10 in 'Royal Gala' resulted in a high rate of FBD in RF fruit, which was hypothesised to be caused by elevated fruit ethylene concentrations before harvest and more anthocyanin, chlorogenic acid (CGA) and pro-cyanidins in RF fruit. In addition, the MYB10 transcription factor was shown to elevate the expression levels of MdACS, MdACO, and MdERF106 ethylene-regulating genes[12]. To elucidate the mechanism regulating the FBD of RF apples, Zuo et al.[13] analysed the transcriptome of tree-ripe apples at 0, 0.5 and 4 h after cutting, and reported that the differentially expressed genes at different sampling points were mainly related to plant–pathogen interactions.

    GWAS is a powerful technique for mining novel functional variants. One of the limitations of GWAS, using SNP arrays, is that they require genotyping of large numbers of individuals, which may be expensive for large populations. DNA pooling-based designs (i.e., bulk segregant analysis) test differential allele distributions in pools of individuals that exhibit extreme phenotypes (XP) in bi-parental populations, large germplasm collections or random mating populations[1416]. In addition to reducing the number of samples to be genotyped, the use of whole genome sequencing (WGS)-based XP-GWAS has the potential to identify small-effect loci and rare alleles via extreme phenotypic selection.

    In this WGS-based XP-GWAS, we investigated the genetic basis of RF and FBD by sequencing the pools of individuals that exhibited extreme phenotypes for these two traits, and analysed the differences in allele frequencies between phenotypic classes. This method combines the simplicity of genotyping pools with superior mapping resolution. We also examined the transcriptome from transgenic apple fruit harbouring the R6:MYB10 promoter as a model for red flesh in apple. Differences in gene expression of a highly pigmented line were compared with expression in control fruit and these genes were then used for comparison with the seedling population. Understanding the genetic basis of the link between RF and FBD will help in design of strategies for selection against FBD in high-quality Type 1 RF apple cultivars.

    A snapshot of visual variation in FBD and WCI is presented in Fig. 1. The average WCI and FBD across all ~900 seedlings ranged from 0 to 7, and from 0% to 58%, respectively. Based on the MLM analysis, the estimated narrow-sense heritability (h2) of WCI and FBD was 0.57 (standard error = 0.18) and 0.09 (standard error = 0.05), respectively. The estimated genetic correlation between WCI and FBD was 0.58, and several fruit quality traits displayed unfavourable correlations with WCI (Supplemental Fig. S1). Seedlings with higher WCI scores were generally characterised by poor firmness and crispness, plus higher astringency and sourness. Estimated phenotypic and genetic correlations between all pairs of traits are listed in Supplemental Table S1.

    Figure 1.  Transverse cross-sections of apple slices showing range in (a) flesh colouration, and (b) flesh browning disorder for Type 1 red-fleshed apple. The weighted cortical intensity (WCI) scores (0−9 scale) and the proportion of the cortex area showing symptoms of flesh browning disorder are also displayed.

    A few seedlings had no red pigment in the cortex, but the average WCI score across all seedlings was 2.25. About two-thirds of the seedlings did not display any FBD symptoms, but among the remaining seedlings, FBD ranged between 1% and 58% (Fig. 2). The average WCI score for the 'low' and 'high' WCI pool was 0.45 and 5.2, respectively, while the average FBD was 0% and 20.6% for the 'low' and 'high' FBD pool, respectively (Supplemental Table S2). The average WCI score of the seedlings in the FBD pools was similar (Low: 5.5; High: 4.6), while the average FBD of the high- and low-WCI pools was 4.5% and 0.1%, respectively.

    Figure 2.  The distribution of weighted cortex intensity (WCI) scores (a) and the internal flesh browning disorder IFBD%; (b) in the population of ~900 apple seedlings. The green and red circles highlight the individuals used to form the 'low' and 'high' pools of samples.

    After filtering, about 204,000 SNPs were used and the average sequencing depth of SNP loci was similar for the two pools (42 vs 44). There was a near-perfect correlation between the Z-test statistics and G-statistics, so only the latter are discussed hereafter. A plot of the G' values, smoothed over 2 Mb windows, is shown for all 17 chromosomes (Chrs) in Supplemental Fig. S2. XP-GWAS identified genomic regions significantly associated with FBD on 12 out of the 17 Chrs (Fig. 3), and putative candidate genes within ±1.0 Mb distanceof the significant G' peaks were identified (Table 1). Additional genomic regions, which did not meet the significance threshold but displayed distinguished G' peaks, were also identified across all chromosomes (Supplemental Table S3).

    Figure 3.  G'-statistics across the linkage groups (LG) showing significant association with the flesh browning disorder (FBD) in apple The horizontal red lines indicate the significance threshold. The putative candidate genes (refer to Table 1) underpinning various G' peaks are also shown.
    Table 1.  A list of the genomic regions associated with internal flesh browning disorder (FBD) in apples. Putative candidate genes residing within these regions are also listed using GDDH13v1.1 reference genome assembly.
    ChrGenomic region (Mb)Putative genes functions
    221.9–23.5Ethylene-responsive element binding factor 13 (MdERF13: MD02G1213600);
    33.1–4.9cinnamate 4-hydroxylase (C4H) enzyme (MD03G1051100, MD03G1050900 and MD03G1051000); MdWRKY2: MD03G1044400; MdWRKY33 (MD03G1057400)
    38.2–9.6ascorbate peroxidase 1 (MdAPX1: MD03G1108200, MD03G1108300)
    314.7–16.6senescence-related MdNAC90 (MD03G1148500)
    336.5–37.5Ethylene response sensor 1 (MdERS1: MD03G1292200); flavonoid biosynthesis protein MdMYB12 (MD03G1297100); Heat shock protein DnaJ (MD03G1296600, MD03G1297000); pectin methylesterase (MdPME) inhibitor protein (MD03G1290800, MD03G1290900, MD03G1291000).
    411.0–13.0phenylalanine and lignin biosynthesis protein MdMYB85 (MD04G1080600)
    422.1–24.4MYB domain protein 1 (MD04G1142200); HSP20-like protein (MD04G1140600); UDP-glucosyltransferase (UGT) proteins UGT85A7 (MD04G1140700, MD04G1140900); UGT85A3 (MD04G1140800); UGT (MD04G1141000, MD04G1141300); UGT85A2 (MD04G1141400); UGT85A4 (MD04G1141500); DNAJ heat shock protein (MD04G1153800, MD04G1153900, MD04G1154100)
    427.6–29.6HCT/HQT regulatory genes MD04G1188000 and MD04G1188400
    629.8–31.7Volz et al. (2013) QTL for IFBD; anthocyanin regulatory proteins MdMYB86 (MD06G1167200); triterpene biosynthesis transcription factor MdMYB66 (MD06G1174200); Cytochrome P450 (MD06G1162600; MD06G1162700, MD06G1162800, MD06G1163100, MD06G1163300, MD06G1163400, MD06G1163500, MD06G1163600, MD06G1163800, MD06G1164000, MD06G1164100, MD06G1164300, MD06G1164400, MD06G1164500, MD06G1164700)
    713.9–15.9heat shock protein 70B (MD07G1116300)
    717.4–19.0Drought-stress WRKY DNA-binding proteins (MdWRKY56: MD07G1131000, MD07G1131400)
    723.6–25.2MdPAL2 (MD07G1172700); drought-stress gene NGA1 (MD07G1162400); DNAJ heat shock family protein (MD07G1162300, MD07G1162200), stress-response protein (MdNAC69: MD07G1163700, MD07G1164000)
    97.9–11.8MD09G1110500 involved in ascorbate oxidase (AO); MdUGT proteins (MD09G1141200, MD09G1141300, MD09G1141500, MD09G1141600, MD09G1141700, MD09G1141800, MD09G1142000, MD09G1142500, MD09G1142600, MD09G1142800, MD09G1142900, MD09G1143000, MD09G1143200, MD09G1143400) involved in flavonoids biosynthesis; heat shock proteins 89.1 (MD09G1122200) and HSP70 (MD09G1137300); Ethylene-forming enzyme MD09G1114800; Anthocyanin regulatory protein MdNAC42 (MD09G1147500, MD09G1147600)
    914.9–16.5triterpene biosynthesis transcription factor protein MdMYB66 (MD09G1183800);
    111.7–3.0ethylene response factor proteins (MdEIN-like 3: MD11G1022400)
    1138.6–40.6Senescence-related gene 1 (MD11G1271400, MD11G1272300, MD11G1272000, MD11G1272100, MD11G1272300, MD11G1272400, and MD11G1272500); Chalcone-flavanone isomerase (CHI) protein (MD11G1273600) and MdbHLH3 (MD11G1286900, MDP0000225680); cytochrome P450 enzyme (MD11G1274000, MD11G1274100, MD11G1274200, MD11G1274300, MD11G1274500, and MD11G1274600); heat shock transcription factor A6B (MdHSFA6B: MD11G1278900) – involved in ABA-mediated heat response and flavonoid biosynthesis.
    122.2–3.5heat shock protein 70-1 ((MD12G1025600, MD12G1025700 and MD12G1026300) and heat shock protein 70 (MD12G1025800 and MD12G1025900 and MD12G1026000); ethylene (MD12G1032000) and auxin-responsive (MD12G1027600) proteins.
    127.2–8.4DNAJ heat shock domain-containing protein (MD12G1065200 and MD12G1067400)
    1327.5–30.5MD13G1257800 involved in polyphenol 4-coumarate:CoA ligase (4CL)
    1337.5–39.5pectin methyl esterase inhibitor superfamily protein MdPMEI (MD13G1278600)
    1425.4–27.5Drought-stress response gene MdWRKY45 (MD14G1154500); chalcone synthase (CHS) family proteins (MD14G1160800 and MD14G1160900); triterpene biosynthesis transcription factor MdMYB66 (MD14G1180700, MD14G1181000, MD14G1180900); anthocyanin biosynthesis protein (MdMYB86: MD14G1172900); cytochrome P450 proteins (MD14G1169000, MD14G1169200, MD14G1169600, MD14G1169700)
    150–1.5Ethylene synthesis proteins (MD15G1020100, MD15G1020300 and MD15G1020500); dihydroflavonol reductase (DFR) gene (MD15G1024100)
    154.6–6.8MdMYB73 (MD15G1076600, MD15G1088000) modulates malate transportation/accumulation via interaction with MdMYB1/10; MdNAC52: MD15G1079400) regulates anthocyanin/PA; heat shock transcription factor B4 (MD15G1080700); stress-response protein MdWRKY7 (MD15G1078200)
    1553.5–54.9MdC3H (MD15G1436500) involved in chlorogenic acid biosynthesis; MdEIN3 (MD15G1441000) involved in regulating ethylene synthesis and anthocyanin accumulation
    168.9–10.9SAUR-like auxin-responsive protein (MD16G1124300) and MdNAC83: (MD16G1125800) associated with fruit ripening; MD16G1140800 regulates proanthocyanidin; MdPAE genes (MD16G1132100, MD16G1140500) regulates ethylene production.
     | Show Table
    DownLoad: CSV

    The ethylene-responsive factor 13 (MdERF13: MD02G1213600) resided within the significant region (21.9–23.5 Mb) on Chr2, while the ascorbate peroxidase 3 (MdAPX3: MD02G1127800, MD02G1132200) resided in the prominent region between 9.45 and 11.28 Mb) (Fig. 3, Table 1). There were several genomic regions showing association with FBD on Chr3. The first region (8.2–9.5 Mb) flanked MdAPX1 (MD03G1108200, MD03G1108300), while MdERF3 (MD03G1194300) and heat shock protein 70 (HSP70: MD03G1201800, D03G1201700) resided within the prominent peak region (25.5–27.5 Mb). Another significant region (36.5–37.5 Mb) at the bottom on Chr3 harboured ethylene response sensor 1 (MdERS1: MD03G1292200), a flavonoid-biosynthesis related protein MdMYB12 (MD03G1297100), HSP DnaJ and pectin methyl esterase (PME) inhibitor proteins (Fig. 3, Table 1).

    The significant G' region (27.6–29.6 Mb) on Chr4 flanked the genes MD04G1188000 and MD04G1188400 involved in the biosynthesis of hydroxycinnamoyl CoA shikimate/quinate hydroxycinnamoyl transferase (HCT/HQT), while the adjacent region (22.1–24.3 Mb) harboured a cluster of UDP-glucosyltransferase (UGT) proteins and HSP (Table 1). Another region between 11.0 and 13.0 Mb encompassed phenylalanine and lignin biosynthesis gene MYB85 (MD04G1080600)[17]. The only significant region associated with FBD on Chr6 spanned between 29.8 and 31.7 Mb, which included a SNP earlier reported associated with FBD[4]. This region also harboured several MYB proteins (MdMYB86: MD06G1167200; MdMYB98: MD06G1172900; MdMYB66: MD06G1174200) and a large cluster of cytochrome P450 proteins (Table 1).

    A significant FBD-associated region (13.9–15.9 Mb) on Chr7 encompassed the HSP 70B (MD07G1116300), while another significant region between 23.6 Mb and 25.2 Mb flanked the gene coding for phenylalanine ammonia lyase 2 (MdPAL2: MD07G1172700), a drought stress gene NGA1 (MD07G1162400), DNAJ HSP, and stress-response protein (MdNAC69: MD07G1163700, MD07G1164000) (Fig. 3, Table 1). A large significant region spanning between 7.9 and 11.8 Mb on Chr9 encompassed the gene MD09G1110500 putatively involved in ascorbate oxidase (AO), HSP (HSP70: MD09G1137300; HSP89.1: MD09G1122200), an ethylene-forming enzyme (MD09G1114800), and MdNAC42 (MD09G1147500, MD09G1147600). Another significant genomic region on Chr9 was between 14.9 and 16.5 Mb, which harbours the MYB domain protein MdMYB66 (MD09G1183800) (Table 1).

    A sharp G' peak region (1.7–3.0 Mb) on Chr11 associated with FBD encompassed ethylene insensitive 3 (MdEIN3: MD11G1022400) along with a cluster of UGT proteins, WD-40, and bHLHL proteins (Table 1). A significant region between 38.6 and 40.6 Mb at the bottom of Chr11 was dominated by clusters of senescence-related genes and cytochrome P450 enzymes. This genomic region also flanked a chalcone-flavanone isomerase (CHI) family protein (MD11G1273600) and a bHLH protein (MdbHLH3: MD11G1286900, MDP0000225680), along with the heat shock transcription factor A6B (HSFA6B: MD11G1278900) (Table 1, Supplemental Table S3).

    The region (2.2–3.3 Mb) associated with FBD on Chr12 flanked genes for the HSP 70 and 70-1, NAC proteins, ethylene and auxin-responsive proteins (Table 1). An adjacent significant region (7.2–8.4 Mb) flanked DNAJ HSP, along with bZIP, bHLH and WD-40 repeat-like proteins (Table 1; Supplemental Table S3). There was a large genomic region on Chr13 showing a significant association with FBD. In this region, the first G' peak (27.5–30.5 Mb) harboured MD13G1257800, which regulates polyphenol 4-coumarate: CoA ligase (4CL) synthesis. The second G' peak region (32.6–34.7 Mb) corresponded to an earlier mapped QTL for flesh browning in white-fleshed apples[18].

    The significant region (25.4–27.5 Mb) on Chr14 harboured various genes for proteins with different putative functions, such as AP2 proteins, WD-40 repeat family proteins, bHLH proteins, MdNAC83 (MD14G1150900), MdWRKY45 (MD14G1154500), chalcone synthase (CHS) family proteins (MD14G1160800 and MD14G1160900), cytochrome P450 proteins, and several MYB domain proteins (MdMYB86: MD14G1172900; MdMYB98: MD14G1179000; MdMYB66: MD14G1180700, MD14G1181000, MD14G1180900) (Fig. 3, Table 1, Supplemental Table S3). A sharp G' peak (15.2–17.2 Mb) on Chr14 did not meet the significance threshold corresponding to the FBD QTL in white-fleshed apples[18].

    The upper 1.5 Mb region on Chr15 associated with FBD encompassed several transcription factor families, including WD-40 repeats, bHLH, bZIP, ethylene synthesis proteins, and dihydroflavonol reductase (DFR) protein (MD15G1024100) (Fig. 3, Table 1; Supplemental Table S3). Another significant region on Chr15 (4.6−6.8 Mb) harboured HSF B4, MdMYB73 (which interacts with MdMYB1/10 to modulate malate transportation) and MdNAC52 (MD15G1079400), which regulates anthocyanin and PA synthesis by directly regulating MdLAR[19]. A significantly associated region at the bottom of Chr15 (53.5–54.9 Mb) harboured MdNAC35 (MD15G1444700), MdC3H (MD15G1436500) involved in the production of p-coumarate 3-hydroxylase (C3H) enzyme, which plays a role in chlorogenic acid biosynthesis, and MdEIN3 (MD15G1441000).

    The significant region between 8.9 and 10.9 Mb on Chr16 harboured a gene for SAUR-like auxin-responsive protein (MD16G1124300) and MdNAC83 (MD16G1125800), both of which have been reportedly associated with apple fruit ripening[20]. This region also encompassed MD16G1140800, which regulates PA[11], and a gene for the pectin acetyl esterase protein MdPAE10 (MD16G1132100) involved in ethylene production and shelf-life[21]. A sharp G' peak region (20.4–22.4 Mb) in the middle of Chr16 flanked MdERF1B (MD16G1216900) and MdMYB15 (MD16G1218000 and MD16G1218900), involved in altering anthocyanin and PA concentrations[10] (Fig. 3, Table 1, Supplemental Table S3).

    The average sequencing depth of the SNP loci (~160,000) retained for marker-trait association was similar for the two WCI pools (41 vs 44). The significant regions were located on Chrs 2, 4, 6, 7, 10, 15 and 16 (Fig. 4). The genomic intervals within ±1.0 Mb of the significant G' peaks, and the putative candidate genes within those intervals, are listed in Table 2. Additional genomic regions, which did not meet the significance threshold but displayed distinct G' peaks, were also identified across most chromosomes ( Supplemental Fig. S2, Supplemental Table S3). A significant region on Chr4 encompassed chalcone synthase (CHS) genes, along with an ERF (MD04G1009000) involved in regulating PA biosynthesis[11].

    Figure 4.  G’-statistics across the linkage groups (LG) showing significant association with the weighted cortex intensity (WCI) in apple. The horizontal red lines indicate the significance threshold. The putative candidate genes (refer to Table 2) underpinning various G' peaks are also shown.
    Table 2.  A list of the genomic regions significantly associated with the weighted cortex intensity (WCI) in apples. Putative candidate genes residing within these regions are also listed using GDDH13v1.1 reference genome assembly.
    ChrGenomic region (Mb)Putative genes functions
    211.2–13.2UDP-glucosyltransferase (UGT) proteins (MD02G1153000, MD02G1153100, MD02G1153200, MD02G1153300; MD02G1153400; MD02G1153500; MD02G1153700; MD02G1153800; MD02G1153900);
    40–1.2Chalcone synthase (CHS) genes (MD04G1003000; MD04G1003300 and MD04G1003400); DNAJ heat shock protein (MD04G1003500); MdERF (MD04G1009000) involved in regulating PA biosynthesis.
    69.5–11.0Ubiquitin protein (MD06G1061100); stress-response WRKY protein MdWRKY21 (MD06G1062800);
    612.1–13.6pectin methylesterase inhibitor superfamily protein (MdPME: MD06G1064700); phenylalanine and lignin biosynthesis gene (MdMYB85)
    616.0–17.6MD06G1071600 (MDP0000360447) involved in leucoanthocyanidin dioxygenase (LDOX) synthesis
    624.0–26.0UDP-glycosyltransferase proteins (MD06G1103300, MD06G1103400, MD06G1103500 and MD06G1103600); auxin response factor 9 (MdARF9: MD06G1111100) and heat shock protein 70 (Hsp 70; MD06G1113000).
    74.1–5.6Ethylene insensitive 3 protein (MdEIN3: MD07G1053500 and MD07G1053800) involved in proanthocyanidins (PA) biosynthesis; ubiquitin-specific protease (MD07G1051000, MD07G1051100, MD07G1051200, MD07G1051500, MD07G1051300, MD07G1051700 and MD07G1051800).
    1015.9–18.3bHLH proteins (MD10G1098900, MD10G1104300, and MD10G1104600); UGT protein (MD10G1101200); UGT 74D1 (MD10G1110800), UGT 74F1 (MD10G1111100), UGT 74F2 (MD10G1111000).
    1035.6–38.6Stress-response WRKY proteins (MdWRKY28: MD10G1266400; MdWRKY65: MD10G1275800). ethylene responsive factors (MdERF2: MD10G1286300; MdERF4: MD10G1290400, and MdERF12: MD10G1290900) and a NAC domain protein (MdNAC73: MD10G1288300); polyphenol oxidase (PPO) genes ((MD10G1298200; MD10G1298300; MD10G1298400; MD10G1298500; MD10G1298700; MD10G1299100; MD10G1299300; MD10G1299400).
    1524.8–26.8heat shock factor 4 (MD15G1283700), drought-stress response WRKY protein 7 (MdWRKY7: MD15G1287300), MdMYB73 (MD15G1288600) involved in ubiquitination and malate synthesis
    1531.7–34.2MYB domain protein 93 (MdMYB93: MD15G1323500) regulates flavonoids and suberin accumulation (Legay et al. 2016); ubiquitin -specific protease 3 (MD15G1318500),
    161.5–3.4MYB domain proteins (MD16G1029400) regulates anthocyanin; senescence-associated gene 12 (MD16G1031600); ethylene response factor proteins (MdERF118: MD16G1043500, and MD16G1047700 (MdRAV1); MdMYB62 ( MD16G1040800) flavonol regulation; malate transporter MdMa2 (MD16G1045000: MDP0000244249), Ubiquitin-like superfamily protein (MD16G1036000),
    165.4–7.4MdMYB88 (MD16G1076100) regulates phenylpropanoid synthesis and ABA-mediated anthocyanin biosynthesis; MdMYB66 (MD16G1093200) regulates triterpene biosynthesis, MdWRKY72 (MD16G1077700) mediates ultraviolet B-induced anthocyanin synthesis.
     | Show Table
    DownLoad: CSV

    There were distinct G' peaks within a large genomic region (spanning between 9.0 and 18.0 Mb) significantly associated with WCI on Chr6 (Fig. 4). The G' peak region 12.1–13.6 Mb encompassed MdMYB85 (MD06G1064300), and a gene for a pectin methyl esterase

    (PME) inhibitor protein (MD06G1064700); while the region between 16.0 and 17.6 Mb flanked the genes involved in leucoanthocyanidin dioxygenase (LDOX) synthesis (Table 2). The auxin response factor 9 (MdARF9: MD06G1111100) and the HSP70 (MD06G1113000) resided in the significant region between 24.0 and 26.0 Mb on Chr6 (Table 2).

    The genomic region (4.1–5.6 Mb) with significant association with WCI on Chr7 flanked MdEIN3 (MD07G1053500, MD07G1053800), which plays an important role in the regulatory network of PA biosynthesis[11]. A significant region (35.6–38.7 Mb) on Chr10 encompassed gene clusters for bHLH and WRKY proteins along with an ethylene repressor factor (MdERF2: MD10G1286300) (Fig. 4, Table 2; Supplemental Table S3). This region also harboured MdERF4 (MD10G1290400), MdERF12 (MD10G1290900) and NAC domain genes (MdNAC73: MD10G1288300), which have been reported to be associated with fruit ripening[20]. In addition, there was a cluster of polyphenol oxidase (PPO) genes residing in this region (Table 2).

    On Chr15, the significant WCI-associated region spanning between 31.7 Mb and 34.2 Mb encompassed several TF families, including MdMYB93 (MD15G1323500) (Fig. 4, Table 2, Supplemental Table S3). A distinguished G' peak region (24.9–26.9 Mb) on Chr15 harboured genes for WD-40 repeat-like proteins, bHLH proteins, redox responsive transcription factor 1 (MD15G1283200), cytochrome P450 proteins, HSF4 (MD15G1283700), and MdWRKY7 (MD15G1287300). The MdMYB73 (MD15G1288600) residing in this region has been shown to interact with MdMYB1/10 and regulates several functions, including cold-stress response, ubiquitination and malate synthesis[22, 23].

    The significant 1.5–3.4 Mb region on Chr16 flanked an anthocyanin repressor MYB protein (MD16G1029400), senescence-associated gene 12 (MD16G1031600), malate transporter MdMa2 (MD16G1045000: MDP0000244249), and two ethylene response factor genes (MdERF118: MD16G1043500; MdRAV1: MD16G1047700), which interact in retaining flesh firmness[24]. The MdMYB62 (MD16G1040800) gene residing in this region is phylogenetically linked to MdMYB8 (MD06G1217200), which plays a major role in flavonoid biosynthesis[25]. Another significant region (5.4–7.4 Mb) on Chr16 harboured several bHLH genes, including MdMYB88 (MD16G1076100) involved in phenylpropanoid synthesis resulting in drought resistance[26] and ABA-mediated anthocyanin production[27]. The MdMYB66 (MD16G1093200) gene, which is involved in triterpene biosynthesis, and the MdWRKY72 (MD16G1077700) gene involved in anthocyanin synthesis, were also present in this region (Table 2, Fig. 4).

    The genomic regions tagged by XP-GWAS were enriched for regulatory functions, and several of these have a paralog (Table 3). For example, paralogues for a trio of genes (MdMYB86, MdMYB98 and Cytochrome 450) resided in the FBD-associated genomic regions on Chr6 and Chr14. Several pairs of genes resided together in the FBD-associated paralog regions; for example, MdNAC90 and germin-like protein 10 on Chr3 and Chr11; WRKY55 and WRKY70 on Chr1 and Chr7; and ERF1 and ERF5 on Chr4 and Chr6. The ethylene response factor MdERF1B had a paralog in the FBD-associated region on Chr13 and Chr16. Interestingly, three copies of MdNAC83 (Chrs 14, 16 17) and four copies of MdMYB66 (Chrs 4, 6, 9 and 14) resided in the FBD-associated regions. A pair of genes (RAV1 and MYB62) resided together in the WCI-associated paralog regions on Chrs13 and 16 (Table 3).

    Table 3.  A list of homologues genes/genomic regions associated with the internal flesh browning disorder (IFBD) and red flesh (WCI) in apples. Putative candidate genes residing within these regions are also listed using GDDH13v1.1 reference genome assembly.
    TraitChr (genomic region: Mb)Gene namePredicted gene IDPutative function
    IFBDChr6 (29.8–31.7 Mb)MdMYB66MD06G1174200Suberin/triterpene deposition
    IFBDChr14 (25.4–27.5 Mb)MdMYB66MD14G1180700, MD14G1181000, MD14G1180900Suberin/triterpene deposition
    IFBDChr4 (7.0–8.1 Mb)MdMYB66MD04G1060200Suberin/triterpene deposition
    IFBDChr9 (14.9–16.5 Mb)MdMYB66MD09G1183800Suberin/triterpene deposition
    IFBDChr6 (29.8–31.7 Mb)MdMYB86MD06G1167200Anthocyanin regulation
    IFBDChr14 (25.4–27.5 Mb)MdMYB86MD14G1172900Anthocyanin regulation
    IFBDChr6 (29.8–31.7 Mb)MdMYB98MD06G1172900Drought stress response
    IFBDChr14 (25.4–27.5 Mb)MdMYB98MD14G1179000Drought stress response
    IFBDChr6 (29.8–31.7 Mb)Cytochrome P450MD06G1162600, MD06G1162700, MD06G1162800, MD06G1163100, MD06G1163300, MD06G1163400, MD06G1163500, MD06G1163600, MD06G1163800, MD06G1164000, MD06G1164100, MD06G1164300, MD06G1164400, MD06G1164500, MD06G1164700Flavonoid and triterpenic metabolism
    IFBDChr14 (25.4–27.5 Mb)Cytochrome P450MD14G1169000, MD14G1169200, MD14G1169600, MD14G1169700Flavonoid and triterpenic metabolism
    IFBDChr3 (14.7–16.6 Mb)MdNAC90MD03G1148500Senescence-related
    IFBDChr11 (16.5–18.5 Mb)MdNAC90MD11G11679000Senescence-related
    IFBDChr14 (25.4–27.5 Mb)MdNAC83MD14G1150900Senescence/ripening-related
    IFBDChr16 (8.9–10.9 Mb)MdNAC83MD16G1125800Senescence/ripening-related
    IFBDChr17 (0–0. 7 Mb)MdNAC83MD17G1010300Senescence/ripening-related
    IFBDChr3 (14.7–16.6 Mb)Germin-like protein 10MD03G1148000Polyphenol oxidase
    IFBDChr11 (16.5–18.5 Mb)Germin-like protein 10MD11G1167000, MD11G1167100, MD11G1167400, MD11G1169200Polyphenol oxidase
    IFBDChr1 (26.9–28.5 Mb)MdWRKY55MD01G1168500Drought stress response
    IFBDChr7 (30.3–31.9 Mb)MdWRKY55MD07G1234600Drought stress response
    IFBDChr1 (26.9–28.5 Mb)MdWRKY70MD01G1168600Drought stress response
    IFBDChr7 (30.3–31.9 Mb)MdWRKY70MD07G1234700Drought stress response
    IFBDChr4 (7.0–8.1 Mb)MdERF1MD04G1058000Ethylene responsive factor
    IFBDChr6 (5.5–7.3 Mb)MdERF1MD06G1051800Ethylene responsive factor
    IFBDChr4 (7.0–8.1 Mb)MdERF5MD04G1058200Ethylene responsive factor
    IFBDChr6 (5.5–7.3 Mb)MdERF5MD06G1051900Ethylene responsive factor
    IFBDChr13 (18.0–20.0 Mb)MdERF1BMD13G1213100Ethylene response factor 1
    IFBDChr16 (20.4–22.4 Mb)MdERF1BMD16G1216900Ethylene response factor 1
    WCIChr13 (2.6–4.4 Mb)MdRAV1MD13G1046100Ethylene responsive factor
    WCIChr16 (1.5–3.4 Mb)MdRAV1MD16G1047700Ethylene responsive factor
    WCIChr13 (2.6–4.4 Mb)MdMYB62MD13G1039900Flavonol biosynthesis
    WCIChr16 (1.5–3.4 Mb)MdMYB62MD16G1040800Flavonol biosynthesis
    IFBDChr9 (7.9–11.8 Mb)MdNAC42MD09G1147500, MD09G1147600Anthocyanin accumulation
    WCIChr17 (11.4–12.4 Mb)MdNAC42MD17G1134400Anthocyanin accumulation
    IFBDChr9 (7.9–11.8 Mb)HSP 70MD09G1137300Heat stress response
    WCIChr17 (11.4–12.4 Mb)HSP 70MD17G1127600Heat stress response
    IFBDChr4 (11.0–13.0 Mb)MdMYB85MD04G1080600Phenylalanine and lignin biosynthesis
    WCIChr6 (12.1–13.6 Mb)MdMYB85MD06G1064300Phenylalanine and lignin biosynthesis
    IFBDChr15 (13.2–14.2 Mb)MdEBF1MD15G1171800Ethylene inhibition
    WCIChr8 (15.2–17.2 Mb)MdEBF1MD08G1150200Ethylene inhibition
    IFBDChr15 (53.5–54.9 Mb)MdEIN3MD15G1441000Ethylene insensitive 3 protein
    WCIChr8 (30.3–31.6 Mb)MdEIN3MD08G1245800Ethylene insensitive 3 protein
    IFBDChr11 (1.7–3.0 Mb)MdEIN3MD11G1022400Ethylene insensitive 3 protein
    WCIChr7 (4.1–5.6 Mb)MdEIN3MD07G1053500, MD07G1053800Ethylene insensitive 3 protein
    IFBDChr15 (4.6–6.8 Mb)MdMYB73MD15G1076600, MD15G1088000Cold-stress response & malate accumulation
    WCIChr15 (24.8–26.8 Mb)MdMYB73MD15G1288600Cold-stress response & malate accumulation
    IFBDChr15 (4.6–6.8M b)MdWRKY7MD15G1078200Anthocyanin accumulation
    WCIChr15 (24.8–26.8 Mb)MdWRKY7MD15G1287300Anthocyanin accumulation
    IFBDChr15 (43.5–45.5 Mb)MdMYB93MD15G1369700Flavonoid & suberin accumulation
    WCIChr15 (31.7–34.2 Mb)MdMYB93MD15G1323500Flavonoid & suberin accumulation
     | Show Table
    DownLoad: CSV

    Paralogs of several regulatory functions were also found in the regions associated with either FBD or WCI; for example, a significant region (7.9–11.8 Mb) harbouring a gene trio (MdNAC42, HSP70 and HSP89.1) on Chr9 was associated with FBD, but the paralogs of this trio also resided in a distinct G' region associated with WCI on Chr17 (Table 3, Supplemental Table S3). Some other examples included MdMYB85 (Chr4 for FBD, and Chr6 for WCI), MdEBF1 (Chr8 for WCI, and Chr15 for FBD), MdEIN3 (Chr8 for WCI, and Chr15 for FBD), and EIN3 (Chr7 for WCI, and Chr11 for FBD). A pair of genes (MdMYB73 and MdWRKY7) resided together in the separate regions associated with FBD (4.6–6.8 Mb) and WCI (24.8–26.8 Mb) within Chr15 (Table 3).

    The red pigmentation in fruit flesh differed amongst transgenic lines, with fruit from line A10 presenting the most deeply pigmented tissues (Supplemental Fig. S3), while those from lines A2 and A4 were similar in having a lower intensity of pigmentation. No pigmentation was observed in the flesh of control 'Royal Gala' (RG) fruit. RNAseq analysis of a representative transgenic line (A2) compared with RG revealed that a total of 1,379 genes were differentially expressed (log 2-fold), with 658 genes upregulated and 721 genes downregulated. This list was then assessed for commonality with the genomic regions and candidate genes from the XP-GWAS.

    Genes that contained mis-sense SNPs (which would result in a change in predicted protein) and that were also differentially expressed between A2 red-fleshed transgenic line and white-fleshed 'Royal Gala' (control) apples included anthocyanin-related flavanone 3-hydroxylase, chalcone synthase and dihydroflavonol 4-reductase (Table 2 & 4). Many more upstream DNA variants (e.g. in potential promoter-controlling elements) were seen in this group of differentially expressed genes (DEGs) that were also in regions underlying WCI or FBD. Genes encoding enzymes that may be involved in FBD, such as a Rho GTPase activating protein, peroxidase, lipoxygenase 1, and ethylene-forming enzyme (ACO4), were DEGs and showed mis-sense SNPs, including a potential stop codon in the Rho GTPase-activating protein (Table 4). This intersection between DNA change and differential expression warrants further research to evaluate the functions of these genes.

    Table 4.  List of candidate genes associated with WCI or FBD in the XP-GWA and R6:MdMYB10 apple datasets.
    Mutations in GWAS apple populationPredicted gene functionExpression in R6 and ‘Royal Gala’ apples
    GeneMissense
    SNPs
    SNP
    Stop
    Upstream
    variants
    DatasetLocusAnnotation and TAIR IDAverage
    RPKM
    R6 flesh
    Average RPKM
    WT flesh
    log2Fold
    Change
    MD02G11322001FBD Supplemental Table S3Chr02:9450615-11289014flavanone 3-hydroxylase
    (F3H, TT6, F3'H) AT3G51240
    387752.47
    MD02G11336003FBD Supplemental Table S3Chr02:9450615-11289014fatty acid desaturase 5
    (FAD5) AT3G15850
    18109.98
    MD02G11537001WCI Table 2Chr02:11278254-13234556UDP-Glycosyltransferase, lignin related AT2G1856010385341.03
    MD03G10592002FBD Supplemental Table S3Chr03:3177994-4910866Peroxidase AT5G053402514.21
    MD03G1143300422FBD Table 1Chr03:14797661-16611554bZIP transcription factor (DPBF2, AtbZIP67) AT3G44460114852-2.80
    MD03G1147700121FBD Table 1Chr03:14797661-16611554Rho GTPase activating protein AT5G22400205891.29
    MD04G1003400331WCI Table 2Chr04:1-1284894Chalcone synthase (CHS, TT4) AT5G1393014433122.34
    MD04G120410063FBD Table 1Chr04:27629536-29612282lipoxygenase 1 (LOX1, ATLOX1) AT1G550205462681.09
    MD06G1160700129FBD Table 1Chr06:29862341-31737341peptide met sulfoxide reductase AT4G251302121254562.04
    MD06G116140014FBD Table 1Chr06:29862341-31737341Pectin lyase-like protein AT5G63180614129530-2.22
    MD07G1240700126FBD Supplemental Table S3Chr07:30357332-31979025Fe superoxide dismutase 2 AT5G511001051826-3.99
    MD07G13069006FBD Supplemental Table S3Chr07:34607570-36531467UDP-glucosyl transferase 78D2 AT5G170506771112.78
    MD08G12491002WCI Supplemental Table S3Chr08:30486569-31607516HSP20-like chaperone (ATHSP22.0) AT4G102503186456.12
    MD09G111400032FBD Table 1Chr09:7999212-11883202fatty acid desaturase 5 (FAD5) AT3G158507608.68
    MD09G11468001FBD Table 1Chr09:7999212-11883202PHYTOENE SYNTHASE (PSY) AT5G1723038456160901.32
    MD10G132810045FBD Supplemental Table S3Chr10:40235258-41736791ethylene-forming enzyme (ACO4) AT1G050108769033910331.21
    MD15G10236001FBD Table 1Chr15:1-1487288jasmonic acid carboxyl methyltransferase (JMT) AT1G19640472111552.07
    MD15G10241008FBD Table 1Chr15:1-1487288dihydroflavonol 4-reductase (DFR, TT3, M318) AT5G428008723091.63
    MD17G11334004WCI Supplemental Table S3Chr17:11422073-12433463PHYTOENE SYNTHASE (PSY) AT5G172306001721.87
    MD17G12606002FBD Supplemental Table S3Chr17:31098955-32776972dehydroascorbate reductase 1 (DHAR3) AT5G167101867−1.78
     | Show Table
    DownLoad: CSV

    Several gene families (e.g. chalcone synthase, UGT, anthocyanin synthase, HSP, PAL, ERF, WRKY proteins, ABA, and bZIP transcription factors) residing in WCI-associated genomic regions have been reported to be associated with RF in apple[7, 12, 28]. Several of these genes are implicated in stress responses, suggesting that flavonoids and anthocyanin biosynthesis could also be associated with stress (e.g., drought, water loss) tolerance of RF apples[7].

    MdMYB73, which may play a role in the cold-stress response[23, 29], resided in the WCI-associated regions. Ethylene is among the various modulators of environmental stresses induced by factors such as drought and cold temperatures[9, 28]. Several ERF proteins (e.g. MdERF1B, MdERF3) interact with the promoters of MYB domain proteins to regulate anthocyanin and proanthocyanidin (PA) accumulation in apple[10, 11, 30]. The WCI-associated genomic regions in our study flanked several ERFs previously reported to have roles in anthocyanin and PA regulation. MdERF4 (MD10G1290400), one of the three ERFs residing in the WCI-associated region on Chr10, has high phylogenetic similarity with MdERF38, which interacts with MdMYB1 to regulate drought-related anthocyanin biosynthesis[31]. Some ERFs (e.g. MdERF2: MD10G1286300; MdERF4: MD10G1290400, and MdERF12: MD10G1290900) and MdNAC73 residing in the WCI-associated regions have been reported to be associated with fruit maturation[20] – suggesting an interaction between ethylene production and RF colour[12].

    The WCI-associated region on Chr15 included a gene MdMYB73 (MD15G1288600) involved in malate acid synthesis. Previous studies have reported that MdMYB1 regulates both anthocyanin and malate accumulation, and perhaps MdBT2 regulates MdMYB73-mediated anthocyanin accumulation[22, 23]. The malate transporter gene MdMa2 and the MdMYB7 gene, involved in the regulation of anthocyanin and flavanols in RF apple[32], resided together in the WCI-associated upper region of LG16. Taken together, these results support the hypothesis that there is interplay between anthocyanin and malate accumulation in the RF apple. There was a cluster of ubiquitin-specific proteases underpinning the WCI-associated regions on Chrs 7 and 15, which is supported by earlier reports suggesting that ubiquitin-specific proteases respond to auxin and might suppress anthocyanin biosynthesis proteins[33]. The auxin response factor 9 (MdARF9: MD06G1111100), which has also been shown to suppress anthocyanin biosynthesis in RF callus samples[33], also resided in the WCI-associated genomic region on LG7.

    Seedlings in both the low- and high-FBD pools carried the MdMYB10 gene, which suggests that MdMYB10 itself is not the causal factor of FBD in RF apples. Long-term cold storage generally results in senescence-related flesh breakdown, and several transcription factor genes (e.g. MYB, WRKY, NAC, ERF, cytochrome P450, and HSP) have been shown to express differentially during long-term cold storage[9]. The FBD-associated genomic regions in our study harboured several ERFs, suggesting that ethylene synthesis proteins may be contributing to cell wall disassembly, allowing PPO enzymes to come into contact with phenolic compounds and potentially leading to FBD symptoms[18].

    Pectin methyl esterase (PME) genes resided in the FBD-associated significant regions on Chrs 3, 13 and 17. Volatile generation and senescence degradation have been suggested to be bio-markers of FBD, and the expression levels of methyl esters were found to be associated with FBD and senescence in 'Fuji' apples after cold storage[34]. The MdPME2 gene has also been reported to be associated with apple flesh firmness and mealiness[21, 35]. The co-location of genes encoding cell wall-degrading enzymes (MdPME) and QTLs for FBD has been reported in apple[18, 36].

    The clusters of cytochrome P450 enzymes and senescence-related genes resided in some of the FBD-associated regions in this study. There are no earlier reports of the involvement of P450 enzymes in apple FBD expression, but some genes related to cytochrome P450 were found to be upregulated during litchi fruit senescence[37]. Pericarp browning in litchi is mainly attributable to the degradation of anthocyanin, and the ABA-initiated oxidation of phenolic compounds by PPO[37]. Flavonoids are among the major polyphenols in RF apples[5], and cytochrome P450 is part of the regulatory mechanism for flavonoid metabolism[38]. Association of FBD with the genomic region harbouring P450 would suggest its role in enhanced polyphenol synthesis causing FBD. The co-occurrence of a senescence-related gene MdNAC90 (MD03G1148500; MD11G11679000) and the PPO regulator germin-like proteins (in the FBD-associated paralog regions on Chrs 3 and 11) lends support to an interplay between senescence and oxidation of phenolics and anthocyanins.

    A significant region on Chr9 encompassed a cluster of UGT proteins, which play a role in the regulation of flavonoids and phenolic compounds, as well as converting phloretin to phloridzin[39]. Cytochrome P450, which resided within several FBD-associated regions, is reportedly involved in flavonoid metabolism, such as chlorogenic acid (CGA) acid and phloridzin, which have also been positively associated with suberin production and cell wall disassembly[40, 41].

    Reactive oxygen species (ROS) play an important role in regulating physiological processes in plants, such as senescence[37]. Legay et al.[42] suggested that MdMYB93 (MD15G1369700), found residing in the FBD-associated regions in this study, plays a critical role in remobilisation of flavonoid/phenolic compounds, which can be utilised for detoxification of ROS in the case of oxidative stress. However, flavonoid biosynthesis has also been linked with suberin production causing cuticle cracks in apples[42, 43], and the development of cuticular cracks could accelerate flesh browning as a result of an enhanced oxidative process[44].

    Several HSP (e.g. HSP70, HSP70-1, HSP60, HSP89.1, and HSP DNAJ) and HSF (e.g. HSF4, HSFB4, HSFA6B) resided in the FBD-associated genomic regions. Ferguson et al.[45] showed that, during summer, apple flesh temperature could reach as high as 43 °C, and that an increase in the expression of HSP in apples was associated with high daily flesh temperatures, suggesting a role of HSP to counter heat stress. HSPs have been reported to interact with AP2/ERFs and to play a role in flavonoid biosynthesis and drought tolerance in apple[46]. Heat stress affects lignin accumulation and its substrate, O-phenols, and has been reported to play role in enzymatic browning[47]. Additionally, HSF that regulate HSP expression have also been reported to be regulated by cold stress to generate heat-induced cold tolerance in banana[48]. HSF1 was shown to transcriptionally regulate the promoters of HSP to enhance chilling tolerance in loquat fruit[49]. Activity of the enzymes (PAL, C4H, 4CL) of the phenylpropanoid pathway was positively correlated with loquat fruit lignification, whilst suppression of their expression by heat shock treatment and low-temperature conditioning significantly reduced fruit lignification[50].

    Wang et al.[7] showed that ascorbate peroxidase (APX) was among the genes that were upregulated in RF apple compared with in white-fleshed apples. Several genes (e.g. MdAPX1, MdAPX3, MdAPX4, and MdDHAR1) involved in ascorbate synthesis resided in the genomic regions associated with FBD. Co-localisation of MdDHAR and ascorbic acid (AsA) synthesis genes in the FBD-linked genomic regions have been reported[51], suggesting that the low AsA content increases fruit susceptibility to FBD[52]. It has been shown that the expression of MdMYB1 and MdDHAR genes was strongly correlated in RF apples, and that AO and APX were upregulated by anthocyanin regulatory genes[31].

    There were several genes associated with CGA biosynthesis residing in the FBD-associated regions on various linkage groups, including the genes MYB19 (MD07G1268000) and MdC3H (MD15G1436500). Higher concentrations of CGA were reported in transgenic apple lines carrying MdMYB10[12], suggesting a role of CGA metabolism in the expression of FBD[53]. Interestingly, some of the FBD-associated regions (e.g. Chrs 9, 11, 13, 14 and 17) reported here in RF apples coincide with those reported earlier for FBD in white-fleshed apples[18, 36, 53], suggesting some common underlying genetic mechanisms.

    As discussed above, ERFs have been reported to be involved in the accumulation of anthocyanin and PA biosynthesis, while ethylene synthesis proteins also contribute to cell membrane breakdown, allowing the PPO enzyme to come into contact with phenolic compounds, potentially leading to FBD symptoms[12, 18]. We observed clusters of anthocyanin biosynthesis proteins (bHLH), ERFs (MdERF2, MdERF4, MdERF12) and PPO genes together in the genomic region associated with WCI on Chr10. The co-occurrence of these gene families perhaps facilitates potential interactions that contribute to the genetic correlation between WCI and FBD. We noted that genes involved in flavonoid regulation and ethylene synthesis occurred together in the FBD-associated regions on several chromosomes (e.g. MD16G1140800 and MdPAE10: MD16G1132100; MdERF1B: MD16G1216900 and MdMYB15: MD16G1218000, MD16G1218900) – suggesting these genes could be in linkage disequilibrium and this would contribute to the expression of WCI and FBD.

    MYB7 (MD16G1029400) resided in the WCI-associated upper region of Chr16, and the expression level of MYB7 was shown to be correlated with that of LAR1 in peach fruit[54]. The MdLAR1 protein (MDP0000376284), which is located about 1.2 Mb upstream of MYB7 (MD16G1029400), was reported to be associated with WCI and FBD in apple[3]. Mellidou et al.[36] reported that 4CL (MD13G1257800 in the FBD-linked region on Chr13), which catalyses the last step of the phenylpropanoid pathway, leading either to lignin or to flavonoids, was upregulated in browning-affected flesh tissues. The gene MdMYB85, involved in the regulation of flavonoid and lignin biosynthesis, resided in the WCI-associated region on Chr6 and FBD-associated paralogous region on Chr4. Metabolic interactions between anthocyanin and lignin biosynthesis have been reported for apple[55] and strawberry[56], while flesh lignification and internal browning during low-temperature storage in a red-fleshed loquat cultivar was shown to be modulated by the interplay between ERF39 and MYB8[57].

    The co-localisation of MdMYB66 and cytochrome P450 proteins, along with the anthocyanin regulatory protein MdMYB86, in paralogous FBD-associated genomic regions on Chr6 and Chr14 suggests that these genes interact as a 'hub' contributing to the WCI-FBD genetic link. The paralogs of some other genes were found to be residing in the regions associated with either WCI or FBD. For example, MdNAC42 and HSP70 co-localised in the FBD-associated region on Chr9, but this same pair of genes also resided in the most prominent region associated with WCI on Chr17. Similarly, paralogs of MdEIN3 resided in the WCI-associated region on Chr7 (MD07G1053500, MD07G1053800) and FBD-associated region on Chr11 (MD11G1022400). Interestingly, the paralogs of MdMYB73 and MdWRKY7 co-localised in the WCI- (24.6–26.8 Mb) and FBD-associated (4.6–6.8 Mb) regions on Chr15. The WCI-associated region at the bottom of Chr11 hosted a cluster of senescence-related genes, along with the anthocyanin biosynthesis gene MdbHLH3 (MD11G1286900), suggesting they might interact in the genetic nexus between FBD and WCI.

    FBD in RF apples can be caused by senescence, injury via extreme temperature exposure (chilling or heat), or enzymatic (cut fruit) reaction. Genes reported to be connected to all three factors were located in various FBD-associated genomic regions in this study. Postharvest strategies that both delay senescence and limit exposure to low temperatures may be needed to manage FBD. We also hypothesise that high ascorbic acid content could help to minimise expression of FBD in Type-1 RF cultivars. The adverse genetic correlation between WCI and FBD appears to arise from dual and/or interactive roles of several transcription factors, which would pose challenges for designing a conventional marker-assisted selection strategy. The use of bivariate genomic BLUP to estimate breeding values to simultaneously improve adversely correlated polygenic traits (e.g. WCI and FBD), could be an alternative approach[58, 59].

    A population of 900 apple seedlings composed of 24 full-sib families was generated in 2011 by selected crossings between six red-leaved pollen parents and six white-fleshed female parents. All six pollen parents inherited their red-leaf phenotype from the same great-grandparent 'Redfield'[1]. Each pollen parent was involved in four crosses, and the female parents were involved in three to six crosses each. Foliage colour of young seedlings is a phenotypic marker for Type 1 RF apple. The main purpose of this trial was to understand the flesh colour variation and FBD in the Type 1 RF seedlings, so only the seedlings with red foliage (i.e. carrying MdMYB10) were kept for this trial. The number of seedlings per family varied from 10 to 95. The seedlings were grafted onto 'M9' rootstock and were planted in duplicate at the Plant & Food Research orchard in Hawke's Bay, New Zealand (39°39′ S, 176°53′ E) in 2015.

    Phenotyping for RF and FBD was conducted over two consecutive fruiting seasons (2017 and 2018). Fruit were harvested once, when judged mature, based on a change in skin background colour from green to yellow, and when the starch pattern index (SPI) was between 1.0 and 2.0 (on a scale of 0 to 7). In each season, six fruit were harvested from each plant and stored for 70 d at 0.5 °C, followed by 7 d at 20 °C before fruit evaluation. Fruit were cut in half across the equator and the proportion of the cortex area (PRA) that was red in colour, and the intensity of the red colour (RI) (= 1 (low) to 9 (high)) was scored. A weighted cortical intensity (WCI) was then calculated (PRA × RI) as an estimation of the amount of red pigment in the fruit. The proportion of the cortex area showing symptoms of FBD was also recorded. WCI and FBD were averaged over all fruit for a particular seedling. Fruit were also assessed for the following eating quality traits on a 1 (lowest) to 9 (highest) scale: firmness, crispness, juiciness, sweetness, sourness and astringency, to understand the genetic correlations of eating-quality traits with WCI and FBD.

    The binary vector pSA277-R6:MYB10 was transferred into Agrobacterium tumefaciens strain LAB4404 by electroporation. Transgenic 'Royal Gala' plants were generated by Agrobacterium-mediated transformation of leaf pieces, using a method previously reported[5]. Wild-type 'Royal Gala' and three independent transgenic lines (A2, A4 and A10) of R6:MdMYB10 were grown under glasshouse conditions in full potting mix with natural light. The resulting fruit were assessed for flesh colour phenotypes at harvest (around 135 d after full bloom). Fruit peel and cortex from three biological replicates were collected and frozen in liquid nitrogen, with each replicate compiled from five pooled mature fruit for each transgenic line or wild-type control.

    Total RNA of 36 samples (3 R6:MYB10 lines and 1 wild type control, 3 time points, 3 biological replicates) was extracted, using Spectrum Plant Total RNA Kit (SIGMA). Removal of genomic DNA contamination and first-strand cDNA synthesis were carried out using the mixture of oligo (dT) and random primers according to the manufacturer's instructions (QuantiTect Reverse Transcription Kit, Qiagen). Real-time qPCR DNA amplification and analysis was carried out using the LightCycler 480 Real-Time PCR System (Roche), with LightCycler 480 software version 1.5. The LightCycler 480 SYBR Green I Master Mix (Roche) was used following the manufacturer's method. The qPCR conditions were 5 min at 95 °C, followed by 45 cycles of 5 s at 95 °C, 5 s at 60°C, and 10 s at 72 °C, followed by 65 °C to 95 °C melting curve detection. The qPCR efficiency of each gene was obtained by analyzing the standard curve of a cDNA serial dilution of that gene. The expression was normalized to Malus × domestica elongation factor 1-alpha MdEF1α (XM_008367439) due to its consistent transcript levels throughout samples, with crossing threshold values changing by less than 2.

    Individual fruit measurements were first averaged for each seedling. As the phenotyping was repeated over two years, we used a mixed linear model (MLM) accounting for this 'permanent environmental effect', as previously described[58]. Pedigree-based additive genetic relationships among seedlings were taken into account for estimation of genetic parameters using ASReml software[60]. Product-moment correlations between best linear unbiased predictions (BLUP) of breeding values of all seedlings for different traits were used as estimates of genetic correlation among traits.

    A selective DNA pooling procedure was adopted to construct DNA pools. A high-pool and a low-pool were constructed separately for the two traits (WCI and FBD). Genomic DNA was extracted from the leaves of selected seedlings, and quantified by fluorimetry using the picogreen reagent (Cat#P11496, Thermo). The low and high pools consisted of 35 seedlings each, and normalised amounts (~300 ng) of DNA from individuals were pooled. The pools were dried down with DNA Stable reagent (Cat#93021001, Biomatrica) in a centrifugal evaporator and shipped for sequencing. Each DNA pool was sequenced using paired-end 125 bp reads on the Illumina HiSeq 2500 platform. The quality of raw sequence reads was checked with FastQC/0.11.2 and MultiQC/1.2. Based on the quality control reports, the reads were aligned to the published apple reference genome GDDH13 v1.1[61] using the program bowtie2/2.3.4.3[62] with trimming from both ends before alignments and aligning in full read length ("-5 6 -3 5 –end-to-end"). The mapping results were marked for duplicate alignments, sorted, compressed and indexed with samtools/1.12[63]. Based on the alignment of binary alignment map (BAM) files of the high and low pools, single nucleotide polymorphism (SNP) identification was performed using samtools/1.12 ('samtools mpileup') and bcftools/1.12 ('bcftools call –mv')[63, 64]. Variant sites with missing genotype in any of the pools, or having the same genotype between the pools, were discarded. To minimise the influence of sequencing quality on association analysis, the identified SNPs were further filtered according to the following criteria: 1) a Phred-scaled quality score > 20; and 2) the read depth in each pool was neither < 35, nor > 500.

    The allele frequencies between each pair of bulk DNAs (low versus high WCI; low versus high FBD) were compared at each SNP locus. Differences in the allele frequencies between the low and high pool were expected to be negligible for unlinked SNP markers, but allele frequency differences would be larger for SNPs closely linked to the underlying quantitative trait loci (QTLs) contributing to the extreme phenotypes. A nonparametric test (G-statistic = 2 × Σni ln(ni/nexp), where ni (i = 1 to 4) represented counts of reference and alternate alleles at a particular SNP generated from sequencing of the low and high pool, and nexp was the expected allele count assuming no allele frequency divergence between the two DNA pools[65].

    We then calculated a modified statistic (G'), which took into account read count variation caused by sampling of segregants as well as variability inherent in short-read sequencing of pooled samples[65]. Using R package QTLseqr[66], firstly a G-statistic was calculated for each SNP marker, and then a weighted average using Nadaraya-Watson kernel was obtained to yield a G' statistic for a sliding genomic window of 2 Mb size. The Nadaraya-Watson method weights neighbouring markers' G-values by their distance from the focal SNP so that closer SNPs receive higher weights. The 95th percentile value of G' was used as a threshold to identify significant hotspots and to identify the putative candidate genes residing within the ±1 Mb region around the G' peak. For comparison purposes, a standard two-sided Z-test[14] was also performed to determine the significance of allele frequency differences at SNP loci between the pools for each trait.

    The GDDH gene models intersecting with the XP-GWA hotspots were pulled out with bedtools/2.30.0 ("bedtools intersect -wo -nonamecheck"). The selected genes were further blasted to TAIR10 ("-evalue 1e-5") and the annotated functions from Arabidopsis genes with the best blast score, the highest % identity, and the longest aligned length, were used. Then the expressions of genes located in the GWA hotspots were extracted from the RNAseq analysis of the R6:MdMYB10 representative transgenic line, and the log 2-fold change between the R6:MdMYB10 and 'Royal Gala' apples were calculated.

    This research was funded in 2017/18 by the Strategic Science Investment Fund of the New Zealand Ministry of Business, Innovation and Employment (MBIE) and from 2019 by the Plant & Food Research Technology Development – Pipfruit programme. We thank our colleague Jason Johnston for providing some pictures of the flesh browning disorder in red-fleshed apples. Richard Volz and Jason Johnston provided constructive comments and suggestions on the manuscript.

  • The authors declare that they have no conflict of interest.

  • [1]

    Vargas JM, Turgeon AJ. 2004. Poa annua: physiology, culture, and control of annual bluegrass. USA: John Wiley & Sons. pp. 2−3.

    [2]

    Yelverton FH. 2015. Poa annua management on golf course putting greens. USGA Green Section 53:252982

    Google Scholar

    [3]

    Beard JB, Rieke PE, Turgeon AJ, Vargas JJ. 1978. Annual bluegrass (Poa annua L.): description, adaptation, culture and control. Research Report. East Lansing: Michigan State University, Agricultural Experiment Station.

    [4]

    Black J. 2011. Poa: wanted dead or alive? Golf Course Industry Magazine. www.golfcourseindustry.com/article/gie-2711-poa-dead-or-alive

    [5]

    Lush WM. 1988. Biology of Poa annua in a temperature zone golf putting green (Agrostis stolonifera/Poa annua). I. The above-ground population. Journal of Applied Ecology 25:977−88

    doi: 10.2307/2403759

    CrossRef   Google Scholar

    [6]

    Jiang Y, Huang B. 2001. Physiological responses to heat stress alone or in combination with drought: a comparison between tall fescue and perennial ryegrass. HortScience 36:682−86

    doi: 10.21273/HORTSCI.36.4.682

    CrossRef   Google Scholar

    [7]

    Yang Z, Miao Y, Yu J, Liu J, Huang B. 2014. Differential growth and physiological responses to heat stress between two annual and two perennial cool-season turfgrasses. Scientia Horticulturae 170:75−81

    doi: 10.1016/j.scienta.2014.02.005

    CrossRef   Google Scholar

    [8]

    Jiang Y, Huang B. 2001. Drought and heat stress injury to two cool-season turfgrasses in relation to antioxidant metabolism and lipid peroxidation. Crop Science 41:436−42

    doi: 10.2135/cropsci2001.412436x

    CrossRef   Google Scholar

    [9]

    Liu X, Huang B. 2000. Carbohydrate accumulation in relation to heat stress tolerance in two creeping bentgrass cultivars. Journal of the American Society for Horticultural Science 125:442−47

    doi: 10.21273/JASHS.125.4.442

    CrossRef   Google Scholar

    [10]

    Soliman WS, Fujimori M, Tase K, Sugiyama SI. 2012. Heat tolerance and suppression of oxidative stress: comparative analysis of 25 cultivars of the C3 grass Lolium perenne. Environmental and Experimental Botany 78:10−17

    doi: 10.1016/j.envexpbot.2011.12.013

    CrossRef   Google Scholar

    [11]

    Wang Q, Chen J, He N, Guo F. 2018. Metabolic reprogramming in chloroplasts under heat stress in plants. International Journal of Molecular Sciences 19:849

    doi: 10.3390/ijms19030849

    CrossRef   Google Scholar

    [12]

    Jiang J, Guo Z, Sun X, Jiang Y, Xie F, et al. 2023. Role of proline in regulating turfgrass tolerance to abiotic stress. Grass Research 3:2

    doi: 10.48130/GR-2023-0002

    CrossRef   Google Scholar

    [13]

    Rossi S, Chapman C, Yuan B, Huang B. 2021. Glutamate acts as a repressor for heat-induced leaf senescence involving chlorophyll degradation and amino acid metabolism in creeping bentgrass. Grass Research 1:4

    doi: 10.48130/GR-2021-0004

    CrossRef   Google Scholar

    [14]

    Duff DT, Beard JB. 1974. Supraoptimal temperature effects upon Agrostis palustris: Part II. influence on carbohydrate levels, photosynthetic rate, and respiration rate. Physiologia Plantarum 32:18−22

    doi: 10.1111/j.1399-3054.1974.tb03720.x

    CrossRef   Google Scholar

    [15]

    Larkindale J, Huang B. 2004. Changes of lipid composition and saturation level in leaves and roots for heat-stressed and heat-acclimated creeping bentgrass (Agrostis stolonifera). Environmental and Experimental Botany 51:57−67

    doi: 10.1016/S0098-8472(03)00060-1

    CrossRef   Google Scholar

    [16]

    Xu Q, Huang B. 2004. Antioxidant metabolism associated with summer leaf senescence and turf quality decline for creeping bentgrass. Crop Science 44:553−560

    doi: 10.2135/cropsci2004.5530

    CrossRef   Google Scholar

    [17]

    Beard JB. 1973. Turfgrass: science and culture. Engle-wood Cliffs, NJ: Prentice Hall. x, 658 pp.

    [18]

    Karcher DE, Richardson MD. 2003. Quantifying turfgrass color using digital image analysis. Crop Science 43:943−51

    doi: 10.2135/cropsci2003.9430

    CrossRef   Google Scholar

    [19]

    Karcher DE, Richardson MD. 2005. Batch analysis of digital images to evaluate turfgrass characteristics. Crop Science 45:1536−1539

    doi: 10.2135/cropsci2004.0562

    CrossRef   Google Scholar

    [20]

    Blum A, Ebercon A. 1981. Cell membrane stability as a measure of drought and heat tolerance in wheat. Crop Science 21:43−47

    doi: 10.2135/cropsci1981.0011183X002100010013x

    CrossRef   Google Scholar

    [21]

    Errickson W, Huang B. 2023. Rhizobacteria-enhanced drought tolerance and post-drought recovery of creeping bentgrass involving differential modulation of leaf and root metabolism. Physiologia Plantarum 175:e14004

    doi: 10.1111/ppl.14004

    CrossRef   Google Scholar

    [22]

    Melamud E, Vastag L, Rabinowitz JD. 2010. Metabolomic analysis and visualization engine for LC-MS data. Analytical Chemistry 82:9818−26

    doi: 10.1021/ac1021166

    CrossRef   Google Scholar

    [23]

    Fry J, Huang B. 2004. Applied turfgrass science and physiology. USA: John Wiley & Sons. 320 pp.

    [24]

    Sicher RC. 2015. Temperature shift experiments suggest that metabolic impairment and enhanced rates of photorespiration decrease organic acid levels in soybean leaflets exposed to supra-optimal growth temperatures. Metabolites 5:443−54

    doi: 10.3390/metabo5030443

    CrossRef   Google Scholar

    [25]

    Lei S, Rossi S, Huang B. 2022. Metabolic and physiological regulation of aspartic acid-mediated enhancement of heat stress tolerance in perennial ryegrass. Plants 11:199

    doi: 10.3390/plants11020199

    CrossRef   Google Scholar

    [26]

    Kim YM, Kim HJ, Song EJ, Lee KJ. 2004. Glucuronic acid is a novel inducer of heat shock response. Molecular and Cellular Biochemistry 259:23−33

    doi: 10.1023/B:MCBI.0000021341.38630.52

    CrossRef   Google Scholar

    [27]

    Yildirim E, Ekinci M, Turan M, Ors S, Yüce M. 2022. Drought and biostimulant treatments affected organic acid content of tomato seedlings. Proceedings of the International Conference on Agriculture 7:21−28

    doi: 10.17501/26827018.2022.7103

    CrossRef   Google Scholar

    [28]

    Rossi S, Chapman C, Yuan B, Huang B. 2021. Improved heat tolerance in creeping bentgrass by γ-aminobutyric acid, proline, and inorganic nitrogen associated with differential regulation of amino acid metabolism. Plant Growth Regulation 93:231−42

    doi: 10.1007/s10725-020-00681-6

    CrossRef   Google Scholar

    [29]

    Batista-Silva W, Heinemann B, Rugen N, Nunes-Nesi A, Araújo WL, et al. 2019. The role of amino acid metabolism during abiotic stress release. Plant, Cell & Environment 42:1630−44

    doi: 10.1111/pce.13518

    CrossRef   Google Scholar

    [30]

    Le XH, Millar AH. 2023. The diversity of substrates for plant respiration and how to optimize their use. Plant Physiology 191:2133−49

    doi: 10.1093/plphys/kiac599

    CrossRef   Google Scholar

    [31]

    Pires MV, Pereira Júnior AA, Medeiros DB, Daloso DM, Pham PA, et al. 2016. The influence of alternative pathways of respiration that utilize branched-chain amino acids following water shortage in Arabidopsis. Plant, Cell & Environment 39:1304−19

    doi: 10.1111/pce.12682

    CrossRef   Google Scholar

  • Cite this article

    McBride S, Rossi S, Huang B. 2024. Differential metabolic responses to heat stress associated with interspecific variations in stress tolerance for annual bluegrass and creeping bentgrass. Grass Research 4: e013 doi: 10.48130/grares-0024-0011
    McBride S, Rossi S, Huang B. 2024. Differential metabolic responses to heat stress associated with interspecific variations in stress tolerance for annual bluegrass and creeping bentgrass. Grass Research 4: e013 doi: 10.48130/grares-0024-0011

Figures(6)  /  Tables(2)

Article Metrics

Article views(3549) PDF downloads(424)

Other Articles By Authors

ARTICLE   Open Access    

Differential metabolic responses to heat stress associated with interspecific variations in stress tolerance for annual bluegrass and creeping bentgrass

Grass Research  4 Article number: e013  (2024)  |  Cite this article

Abstract: Annual bluegrass (Poa annua) typically exhibits early or more severe turf quality decline than creeping bentgrass (Agrostis stolonifera) during summer months when they are co-present on golf course putting greens. The mechanisms underlying the difference in heat tolerance between the two species are largely unknown. This study was conducted to compare physiological responses between P. annua and A. stolonifera and to identify metabolites and associated metabolic pathways underlying the differential heat tolerance. Plants were grown in controlled growth chambers at 22/17 °C (day/night, non-stress control) and 35/30 °C (heat stress) for 42 d. Visual turf quality, percent green canopy cover, and leaf electrolyte leakage were measured weekly. Metabolomic analysis was performed with leaf tissues collected at 42 d of heat stress. Relative to control plants, heat-stressed P. annua exhibited more severe declines in health across physiological parameters than A. stolonifera. Comparative metabolomic analysis of heat-stressed plants relative to the respective control identified metabolites that were upregulated uniquely or to a greater extent in A. stolonifera (sucrose, stachyose, raffinose, and glucose, glucuronic acid, and malonic acid) or P. annua (proline, tryptophan, lysine, phenylalanine, tyrosine, valine, isoleucine, and leucine) and those uniquely downregulated (malate, fumarate, pyruvate, aconitic acid, malonic acid, lactate, and glucose-1-phosphate and glucose-6-phosphate) in P. annua. Those distinct metabolites are mainly in photosynthesis, respiration, secondary metabolism, and stress protection. They were associated with the difference in heat tolerance for A. stolonifera vs P. annua and could be used as biomarkers or incorporated into biofertilizers to improve P. annua heat tolerance.

    • Annual bluegrass (P. annua L.) is a cool-season turfgrass species present on golf courses around the world. Past US Open championships have been played on courses where putting greens are primarily composed of P. annua, indicating its ability to perform as a quality turf[1]. Mild climates are most favorable to cultivating P. annua, such as that of the Pacific Northwest, where it can be grown as a desirable turfgrass[2]; however, its low tolerance to abiotic stress, such as heat stress, diminishes P. annua performance in transitional zones where temperatures in the summer exceed 30 °C. Due to these limitations, P. annua has historically been considered a weed in transitional zones. Its high genetic diversity and prolific seed head production allow P. annua to effectively colonize courses and become the dominant stand if left unimpeded[3]. In the past, efforts have been heavily focused on controlling P. annua. Recently a shift has begun in transitional zones where golf course superintendents are moving away from eradicating P. annua and are instead trying to cultivate it[4]. In such cases, it is common to see mixed greens consisting of P. annua and creeping bentgrass (Agrostis stolonifera), another commonly cultivated cool-season turf grass species. The dynamic between these two species depends on factors such as age and the season. As A. stolonifera greens age, P. annua infestations tend to increase. Fluctuations in dominance occur annually with P. annua being the dominant competitor during spring and fall, and A. stolonifera becoming more dominant in the summer[5].

      Rising temperatures in summer months make maintaining putting greens with A. stolonifera and P. annua more challenging due to heat stress, one of the major factors limiting the growth of cool-season turfgrass species. Different species of cool-season turfgrass vary in their tolerance and response to heat stress[6,7]. This is seen in mixed putting greens where heat induced summer decline often occurs earlier in populations of P. annua than those of A. stolonifera. The uneven decline in mixed stands results in an unattractive putting green. Heat stress is detrimental to cool-season turfgrass growth, causing oxidative stress, reduction in cell water content, damage to photosynthetic machinery, and decline of carbohydrate availability[810]. To defend against heat stress, damaged plants will undergo adjustments in molecular and physiological processes to regain homeostasis. This includes the regulation of key metabolites, such as amino acids, organic acids, and sugars that could function directly as protectants or indirectly as precursors for stress defense[1113]. Heat tolerance of creeping bentgrass has been associated with changes in various physiological and metabolic processes, including active carbohydrate and antioxidant metabolism[1416]; however, little is known of the mechanism governing the response of P. annua to heat stress.

      The objectives of this study were to compare physiological responses between P. annua and A. stolonifera and identify differential metabolites regulated by heat stress for A. stolonifera and P. annua to unravel the metabolic mechanisms associated with heat tolerance in these two cool-season grass species. As climate change threatens to increase the intensity and frequency of heat waves, the challenges associated with maintaining cool-season grasses will increase. Understanding the mechanisms for the differential responses of P. annua and A. stolonifera is of great importance for developing strategies to improve turfgrass performance of cool-season grass species in areas with chronic heat stress and anticipated global warming.

    • Mature turf sod was collected from Rutgers Horticulture Research Farm in North Brunswick, NJ, USA for two species: creeping bentgrass (Agrostis stolonifera L.) 'Declaration' and annual bluegrass (Poa annua). A. stolonifera was taken from a well-established field, and P. annua was taken from fields that were established using mixed biotypes originally collected from Rutgers University Golf Course (Piscataway, NJ, USA) and Plainfield Country Club (Edison, NJ, USA) for over four years. Sods with roots had the thatch layer removed and were planted in plastic containers (20 cm in width, 30 cm in length, and 20 cm in depth) filled with fritted clay (Profile Products, Buffalo Grove, IL, USA). Six sod pieces (three A. stolonifera and three P. annua) were placed randomly within each container and replicated within 16 containers. Plants were maintained for 30 d in a greenhouse to allow sods to establish and subsequently relocated to two controlled growth chambers (Environmental Growth Chambers, Chagrin Falls, OH, USA) with eight containers in one chamber and eight containers in the second. Growth chambers were set to the following optimal growing conditions, controlled at 22/18 °C (day/night) average temperatures, and 750 μmol·m−2·s−1 photosynthetically active radiation at the canopy level with a 14-h photoperiod. Plants were maintained in this growth chamber for 7 d before imposing temperature treatments.

    • After 7 d of acclimation in the growth chambers, plants were exposed to the ambient temperature (22/18 °C, day/night) as non-stress control or 35/30 °C (day/night) for heat stress. Plants in each temperature treatment were randomly placed in four growth chambers with four replicated containers in each chamber for each species. Every container had three subsamples for each grass species (container). Plants were subjected to temperature treatments for 42 d. Plants were kept well-irrigated, watering twice daily to maintain soil saturation, indicated by drainage from the bottom of containers. Fertilization using half-strength Hoagland's solution was applied weekly.

      The experiment design was a split-plot design with two temperature treatments as the main plots and two grass species as sub-plots. Each treatment had four replicates and three subsamples for each species.

    • Turf quality and physiological traits were evaluated every 7 d for both control and heat stress groups throughout the 42-d temperature treatment period. Visual turf quality (TQ) was rated on a 1−9 scale, considering uniformity, color, and density, where a rating of nine indicates healthy turf, six is the minimum quality accepted, and one indicates nearly dead turf[17]. Images were taken on a Galaxy Note9 smartphone HDR dual aperture camera (Samsung Electronics Co., South Korea) and analyzed using SigmaScan Pro 5 software (Systat Software Inc., San Jose, CA, USA) to quantify turf canopy cover (percent green canopy cover) based on Karcher & Richardson[18,19].

      Cell membrane stability of leaves was analyzed through the measurement of leaf electrolyte leakage (EL). Approximately 0.2 g of fresh leaf tissue was harvested from each plant and cut into 1 cm long pieces. The tissue was then submerged in 30 mL of deionized water and left on a shaker for 8−12 h at room temperature until turgid, and electrolyte content was measured using a conductance meter (YSI Incorporated, Yellow Springs, OH, USA) to get an initial reading (Ci). Tubes were autoclaved to kill plant tissue and kept on the shaker to for an additional 8 h, and the solution was measured for conductance again to determine the maximum conductance (Cmax). Percent EL was calculated with the following formula by Blum & Ebercon: EL (%) = Ci/Cmax × 100%[20].

    • Leaf tissue was collected from both species in the control and heat stress groups 42 d after heat stress was initiated. Leaf samples were freeze-dried and ground with a mortar and pestle. Then 20.0 mg of ground tissue was pooled from the three sub-plants of each container to get one metabolite sample for each species per container. Samples were stored at −80 °C until ready for metabolite analysis. Metabolite content was analyzed by LC-MS using the methods described in Errickson & Huang[21]. The 20 mg samples were resuspended in 1 mL 40:40:20 methanol:acetonitrile:water solution and left at ambient temperatures for a 10-min period. To neutralize sample mixtures, 50 μL of 15% (m/v) NH4HCO3 was added before diluting them four times in the methanol:acetonitrile:water solution. The diluted samples were centrifuged at 4 °C at 16,000 g for 10 min, and supernatant was subsequently moved into a fresh tube.

      Metabolite identification and concentration were completed using a Vanquish Horizon UHPLC system (Thermo Fisher Scientific, USA) with an XBridge Amide column (150 mm × 2.1 mm, 2.5 μm particle size, Waters), using a gradient of solvent A (95%:5% H2O:acetonitrile with 20 mM acetic acid, 40 mM ammonium hydroxide, pH 9.4) and solvent B (20%:80% H2O:acetonitrile with 20 mM acetic acid, 40 mM ammonium hydroxide, pH 9.4). The gradient was 0 min, 100% B; 3 min, 100% B; 3.2 min, 90% B; 6.2 min, 90% B; 6.5 min, 80% B; 10.5 min, 80% B; 10.7 min, 70% B; 13.5 min, 70% B; 13.7 min, 45% B; 16 min, 45% B; 16.5 min, 100% B; and 22 min, 100% B. Separation was carried out at the following settings: flow rate at 300 μL·min−1, column temperature at 25 °C, autosampler temperature at 4 °C, and an injection volume of 5 μL. Mass spectrometry scans were obtained in both negative and positive ion modes with a revolution of 70,000 at m/z 200, and there was an automatic gain control target of 3 × 10⁶ and m/z scan range of 72−1,000. Metabolite data was obtained using the MAVEN software package (mass accuracy windows: 5 ppm)[22].

    • Treatment differences for TQ, physiological traits, and metabolite content between the heat stress and control groups were compared for each species by the analysis of variance test (SAS v9.2). Significant differences between treatments were tested using Fisher's protected LSD at α = 0.05. Metabolite content from LC-MS was analyzed using a t-test to compare the heat stress of each species to the corresponding control at 42 d, where the fold-change (FC) threshold = 1.0 and p-value = 0.05. From this, the relative changes seen within each species were used to identify any differential responses between A. stolonifera and P. annua. Volcano plots, partial least squares discriminant analysis, heat maps, and metabolic pathway enrichment analysis were generated using the MetaboAnalyst 5.0 website with R statistical programs (www.metaboanalyst.ca/MetaboAnalyst/ModuleView.xhtml).

    • Turf quality (TQ) of heat-stressed plants relative to that of control plants for each species (% of control) was compared between the two species to better elucidate their differential responses to heat stress due to the intrinsic and genetic variations in TQ for A. stolonifera and P. annua under normal or non-stress conditions (Fig. 1). Heat-stressed A. stolonifera had significantly higher TQ relative to its control plants, compared to that of P. annua during 21–42 d of heat stress. The decline in TQ during heat stress was more severe for P. annua than for A. stolonifera.
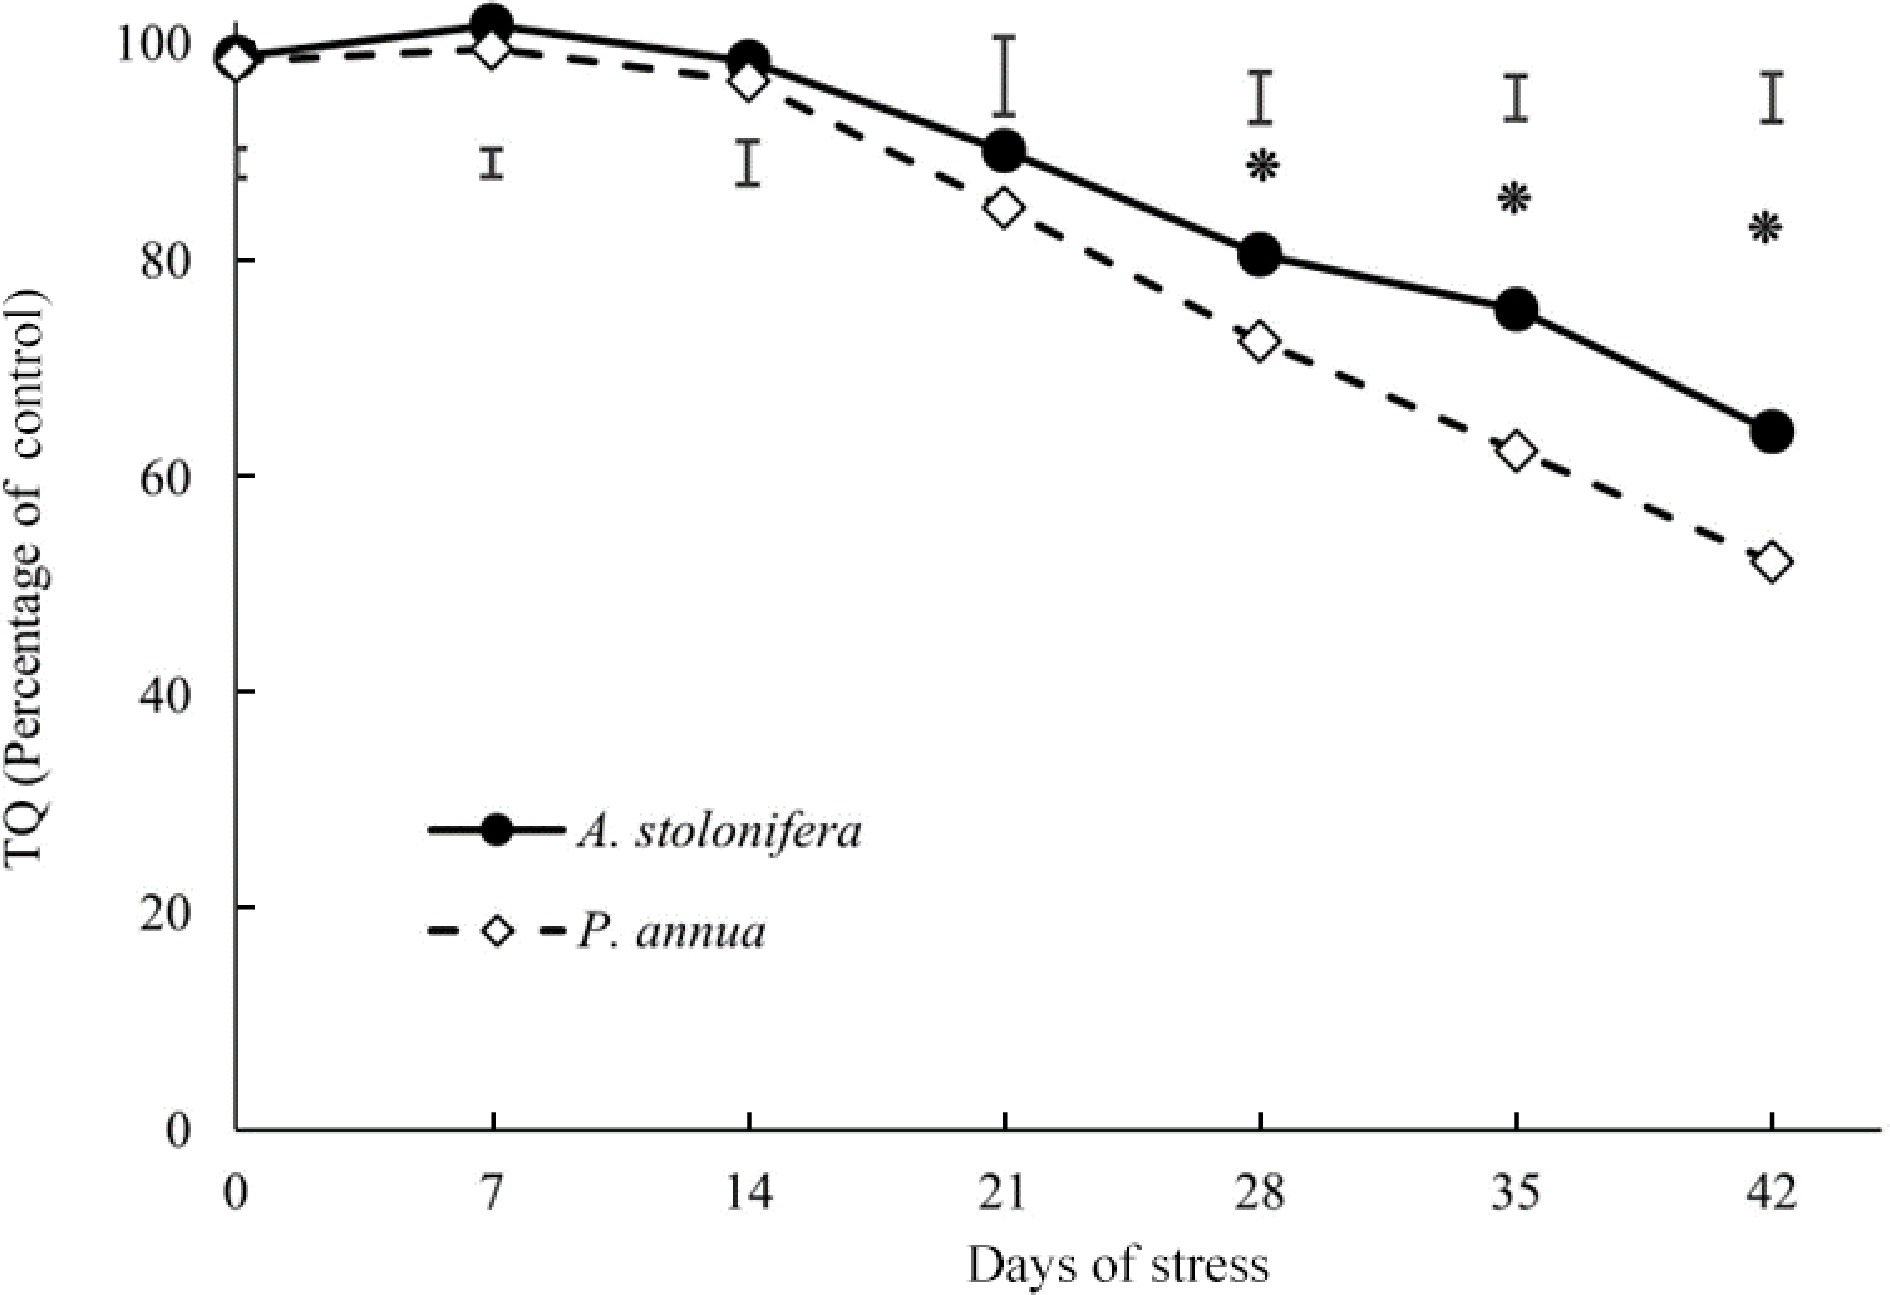
      Figure 1. 

      Relative changes (% of control) in turf quality (TQ) of heat-stressed plants compared to the respective control plants in A. stolonifera and P. annua during 42 d of heat stress. Vertical bars indicate least significant difference (LSD) values demonstrating significant differences (*) between the two grass species (p < 0.05) at a given day of heat stress.

      Percent green canopy cover of heat-stressed plants declined significantly below the non-stress control level for both P. annua and A. stolonifera during 28−42 d of heat stress. The decline in percent green canopy cover was more pronounced in P. annua than A. stolonifera during heat stress (Fig. 2).
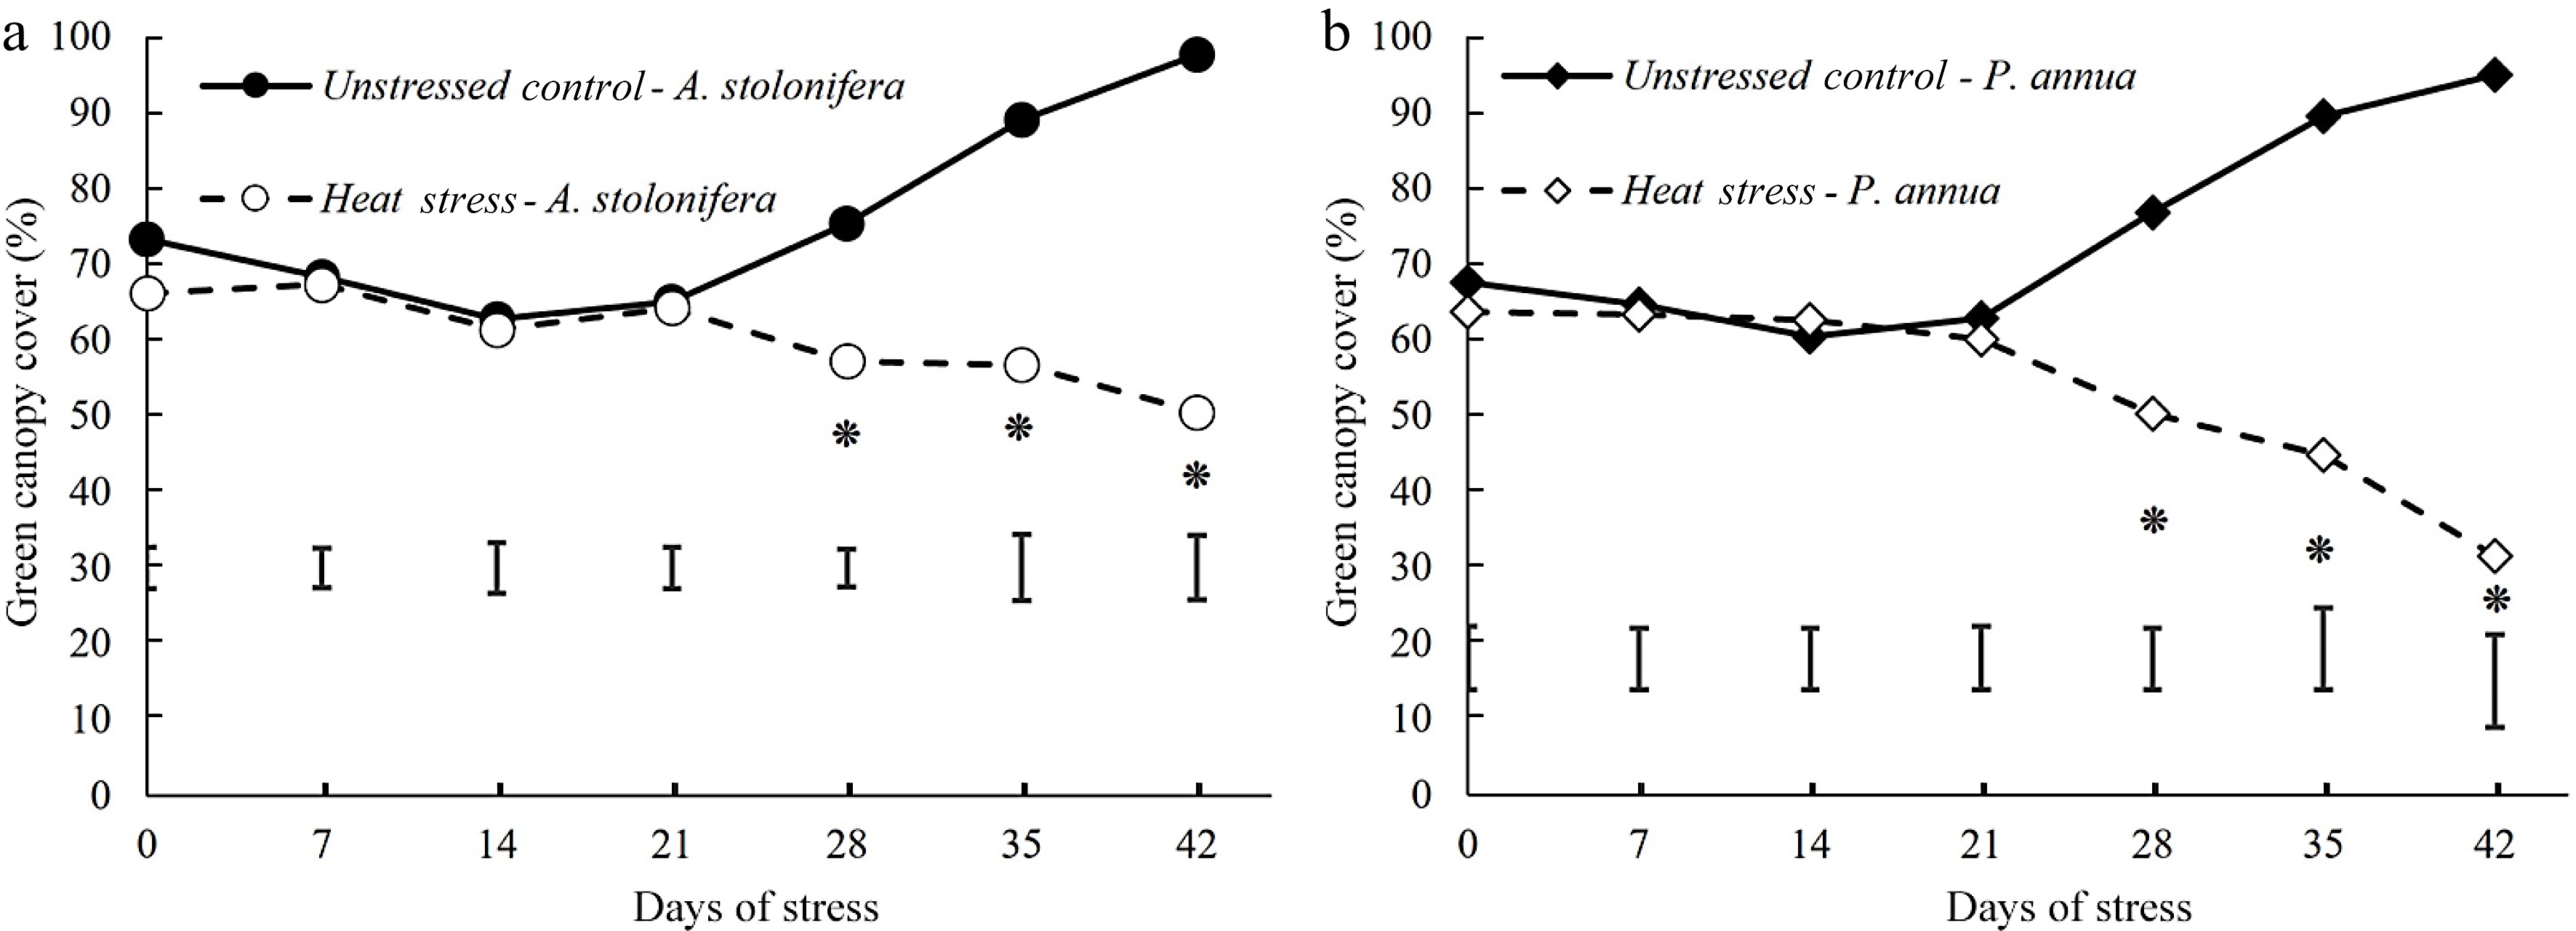
      Figure 2. 

      Changes (%) of green canopy cover during 42 d of heat stress relative to their respective control plants for (a) A. stolonifera and (b) P. annua. Vertical bars indicate least significant difference (LSD) values demonstrating significant differences (*) between the two grass species (p < 0.05) at a given day of heat stress.

      Leaf electrolyte leakage (EL) increased to a significantly higher level in heat-stressed plants from 21 to 42 d in P. annua. The increases in EL induced by heat stress in P. annua were more severe than those of A. stolonifera, as the significantly higher EL in heat-stressed plants relative to the control plants did not occur until 42 d in A. stolonifera. The present increases in EL due to heat stress were greater in P. annua than those in A. stolonifera (Fig. 3).
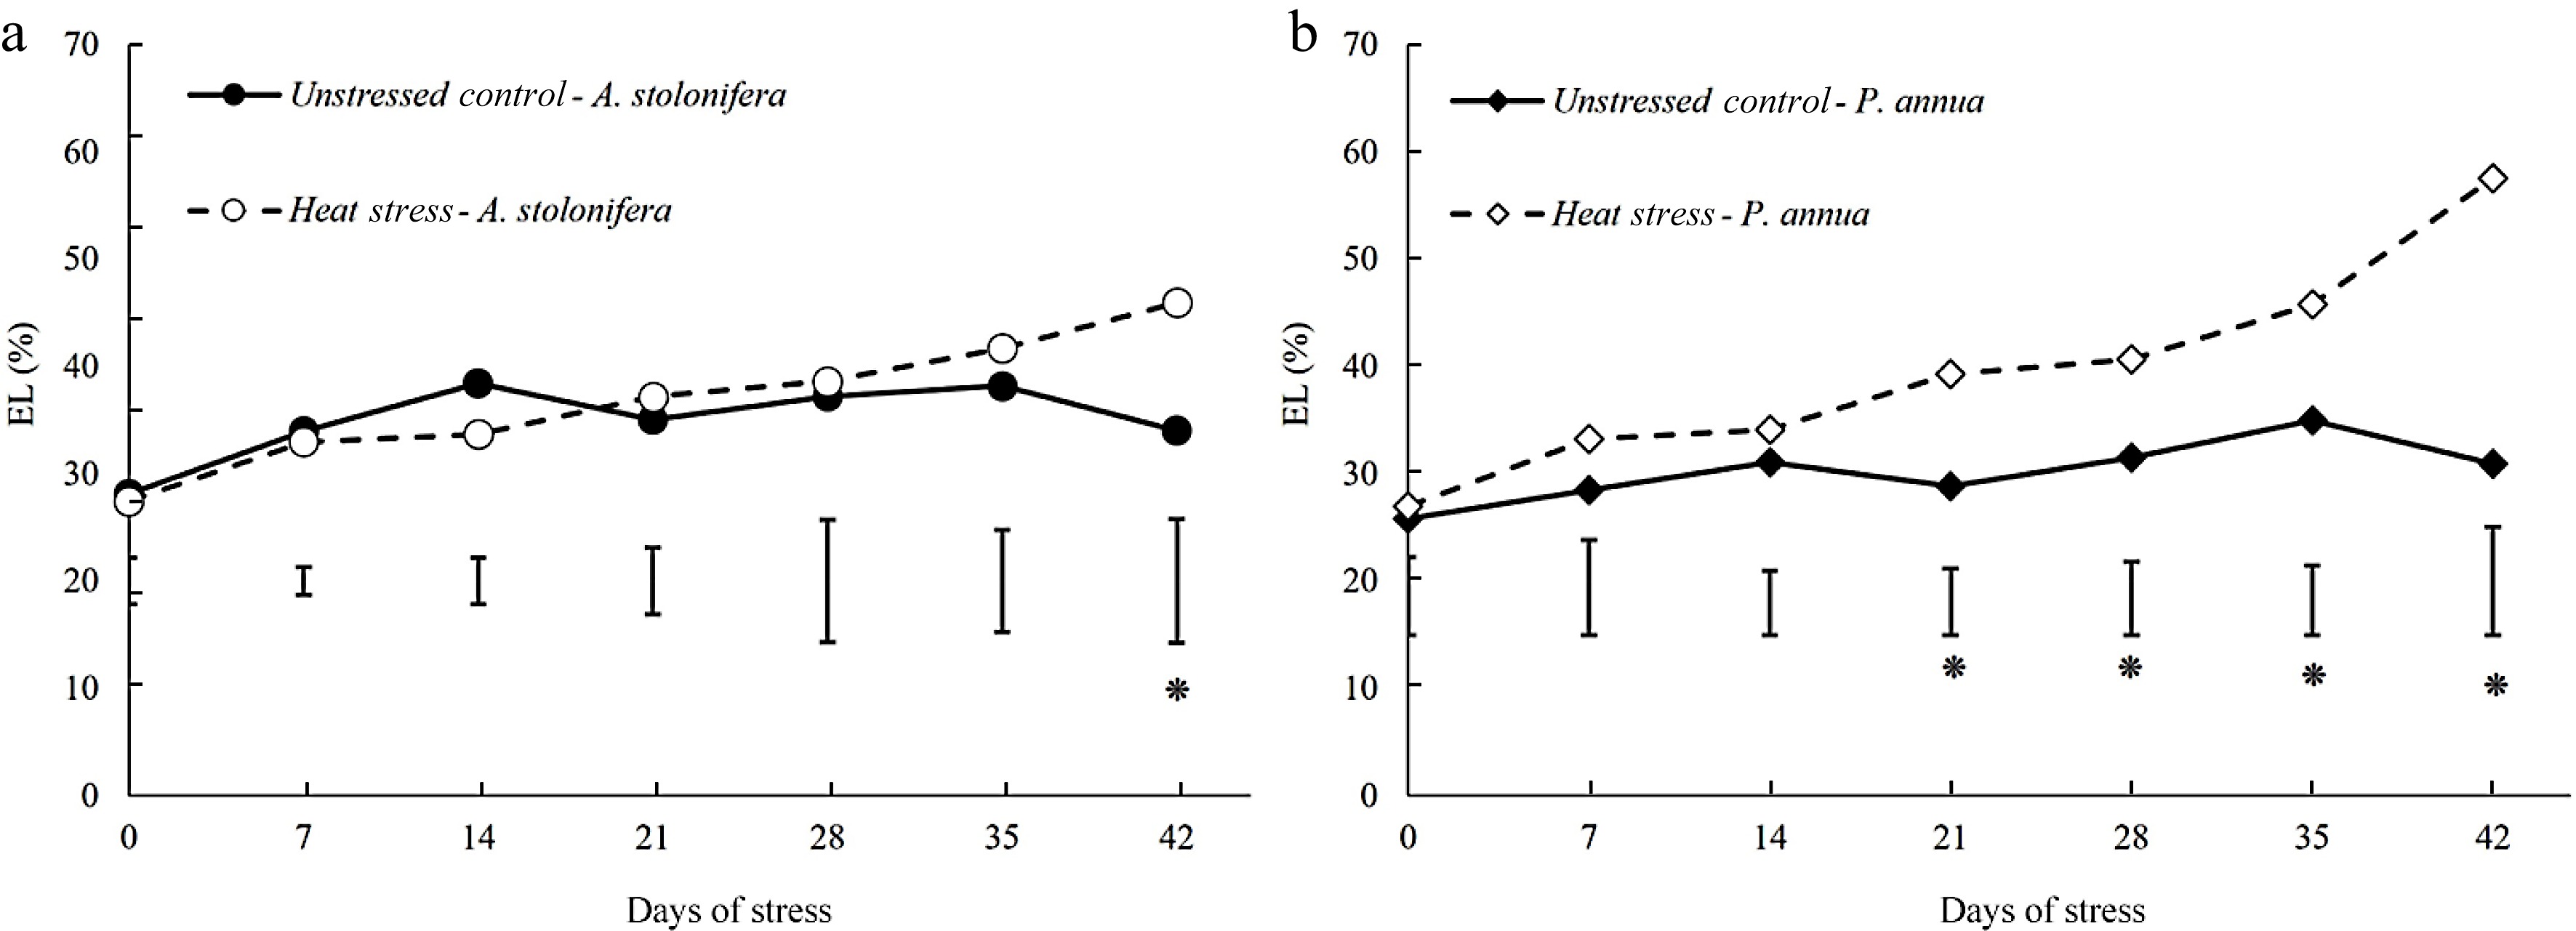
      Figure 3. 

      Changes in electrolyte leakage (EL) during 42 d of heat stress relative to their respective control plants for (a) A. stolonifera and (b) P. annua. Vertical bars indicate least significant difference (LSD) values demonstrating significant differences (*) between the two grass species (p < 0.05) at a given day of heat stress.

    • A total of 55 metabolites relevant to plant processes were identified using LC-MS (Table 1).

      Table 1.  Mass spectrometry properties of differentially regulated metabolites by heat stress (42 d) in A. stolonifera and P. annua.

      No.RT (min)MetaboliteMzNo.RT (min)MetaboliteMz
      14.93γ-Acetamidobutyrate144.07294.42Lactate89.02
      27.47GABA102.06304.03Leucine130.09
      310.79Aconitate173.013111.04Lysine145.10
      42.60Adenine134.05329.24Malate133.01
      52.72Adenosine266.09338.82Malonic acid103.00
      66.63Alanine88.04344.66Methionine148.04
      78.32Alpha-Ketoglutarate145.01353.43Mevalonate147.07
      84.75Arabitol151.06369.88Dinucleotide662.10
      97.81Asparagine131.05373.69Phenylalanine164.07
      109.05Aspartate132.033812.14Phosphocholine242.08
      1111.33Citrate191.02395.77Proline114.06
      124.04Cytidine242.08402.82Pyruvate87.01
      135.15Fructose179.06419.62Raffinose503.16
      149.23Fumarate115.00422.66Riboflavin375.13
      155.88Glucose179.06437.70Serine104.04
      1611.78Glucose 6-phosphate259.02445.83Sorbitol181.07
      1710.81Glucose 1-phosphate259.024511.94Stachyose665.21
      188.80Glucuronic acid193.04468.81Succinic acid117.02
      198.48Glutamate146.05477.36Sucrose341.11
      208.90Glutamine145.06485.76Thiamine263.10
      216.03Glycerate105.02496.94Threonine118.05
      227.11Glycine74.02502.06Thymidine241.08
      233.44Guanine150.04513.47Tryptophan203.08
      244.28Guanosine282.08525.17Tyrosine180.07
      259.17Histidine154.065310.56UDP-Glucose565.05
      268.41Inositol179.06542.81Uridine243.06
      279.95Isocitrate191.02555.47Valine116.07
      284.45Isoleucine130.09

      The partial least-squares discriminant analysis (PLS-DA) detected a difference in metabolic composition between the control and heat stress groups in both A. stolonifera and P. annua leaf tissue samples collected at 42 d of heat stress (Fig. 4).
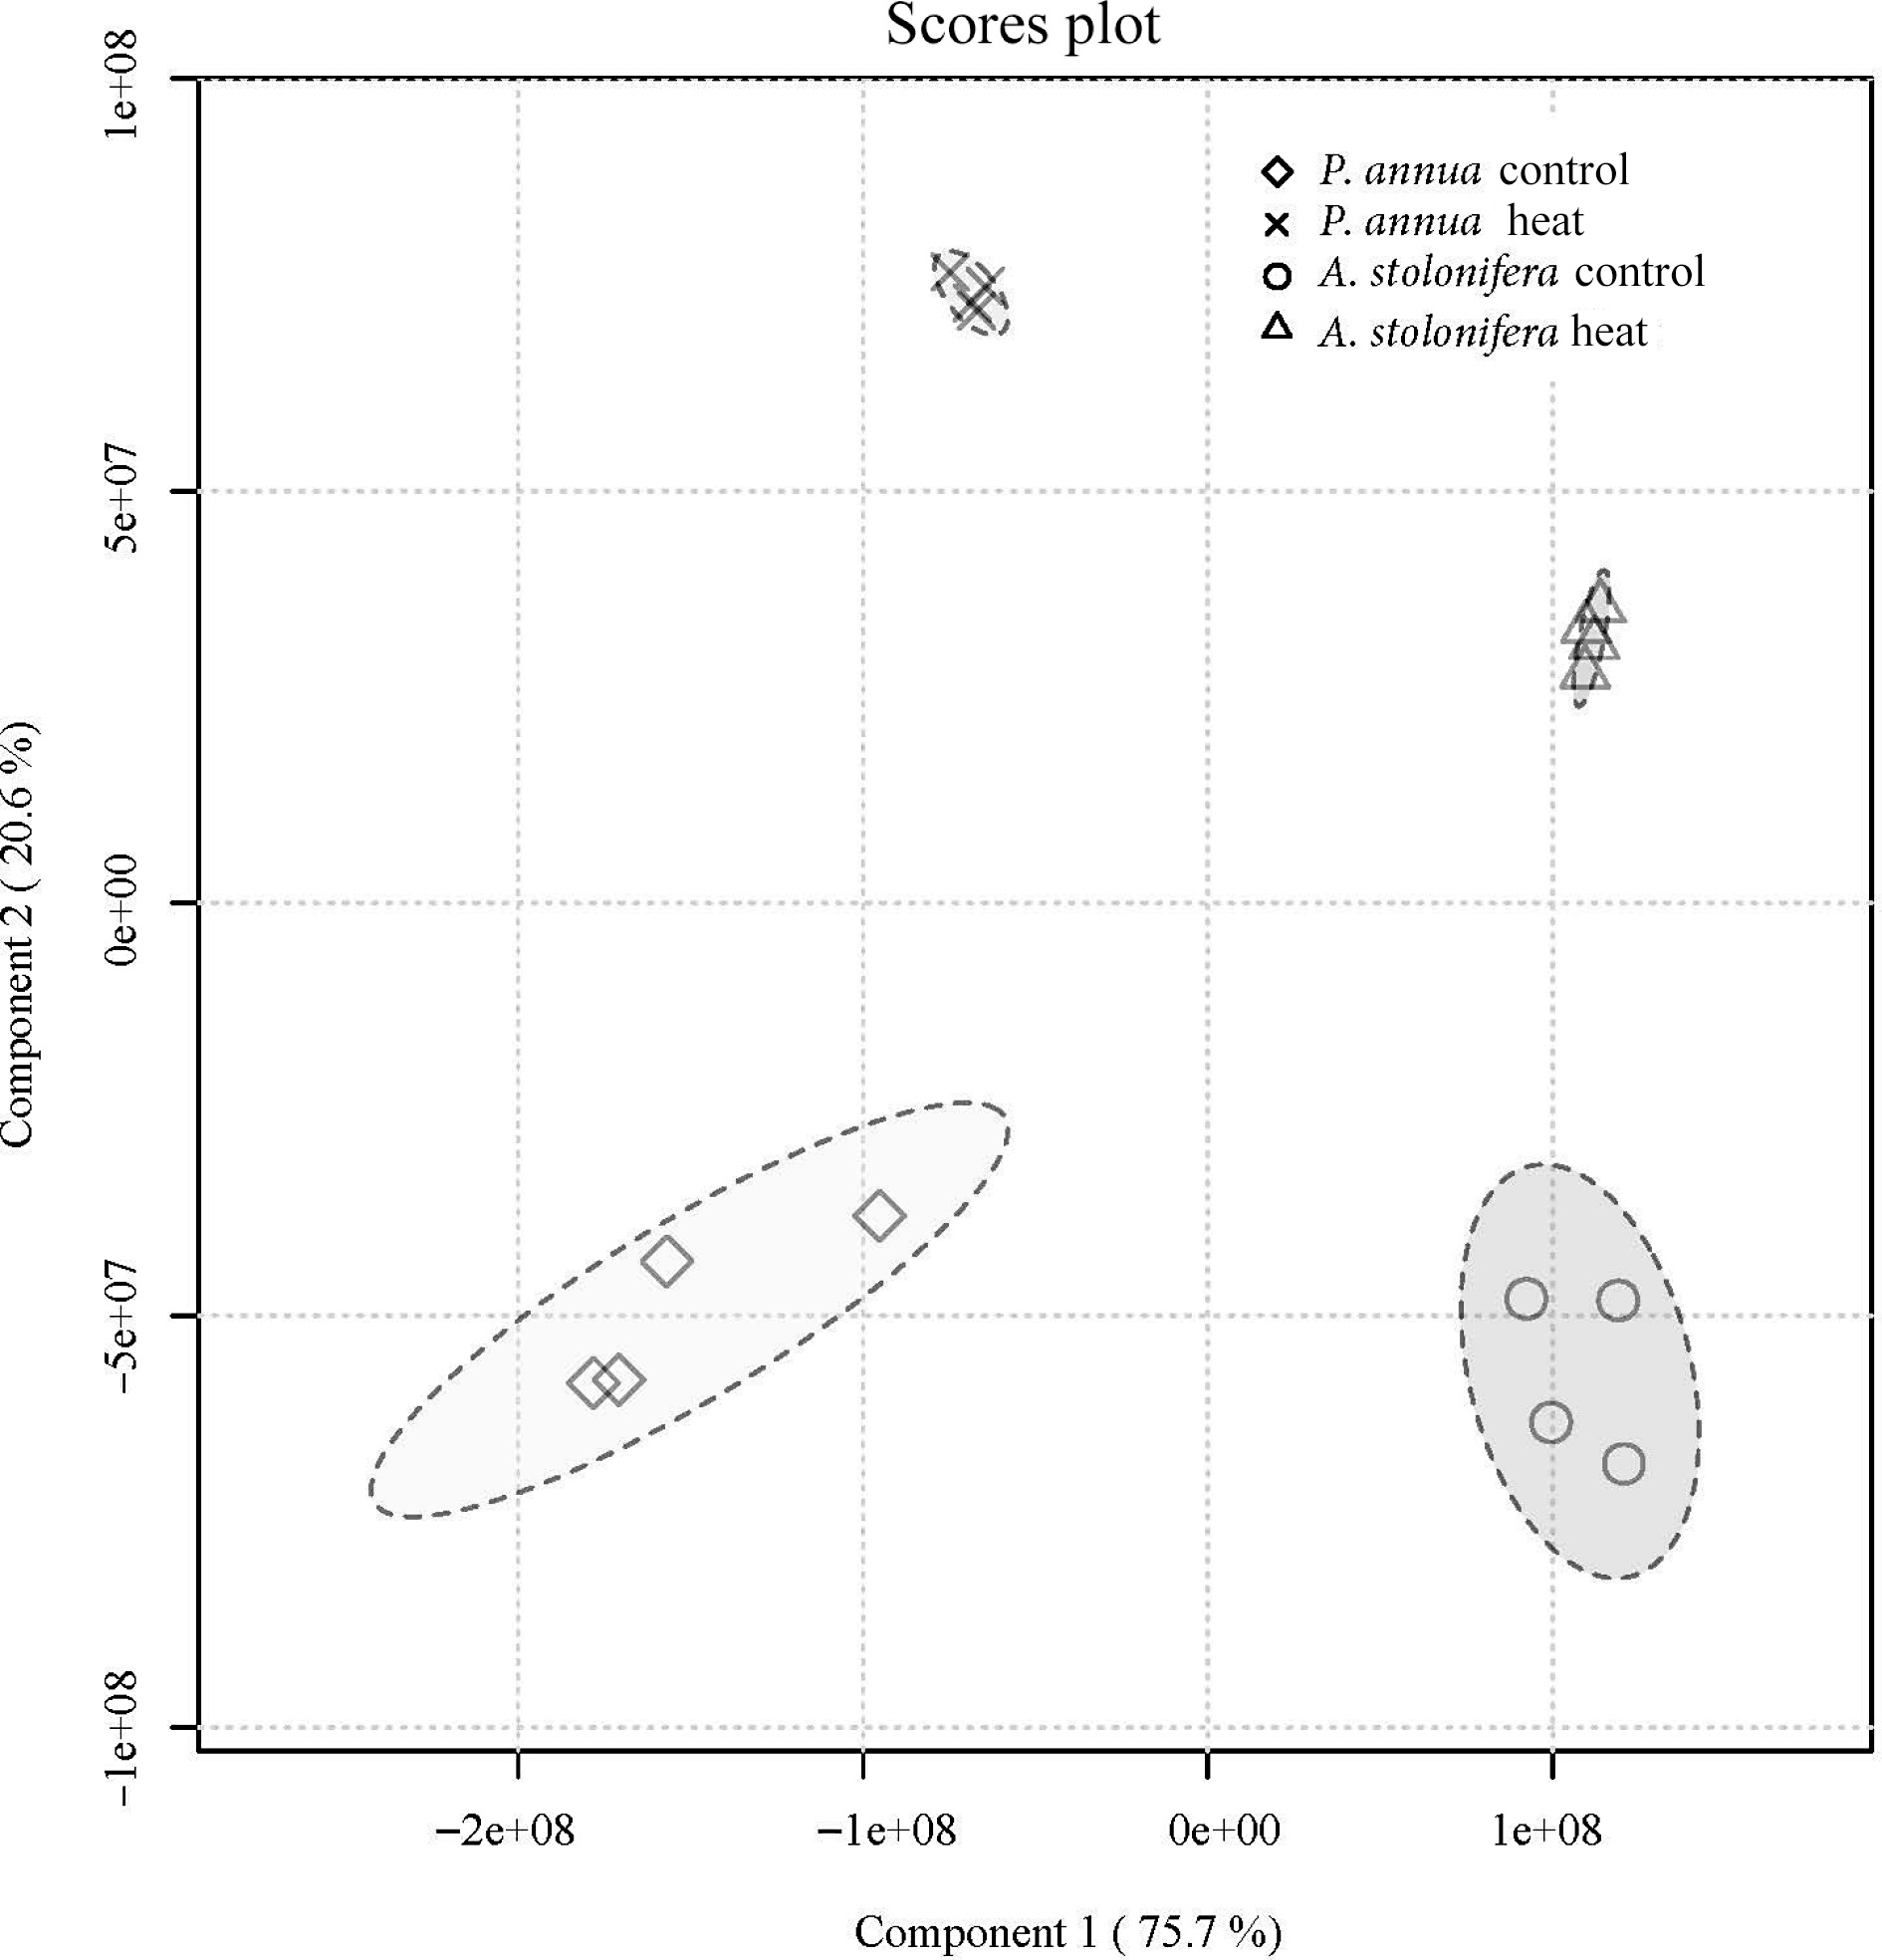
      Figure 4. 

      Partial least-squares discriminant analysis of metabolic composition for A. stolonifera under heat stress compared to control conditions at 42 d of heat stress for P. annua.

      A total of 17 metabolites were upregulated and 22 were downregulated in A. stolonifera, while P. annua had 21 significantly upregulated and 26 significantly downregulated metabolites due to heat stress (Fig. 5a & b). Many metabolites were regulated differentially between P. annua and A. stolonifera under heat stress relative to their respective control plants, including organic acids, amino acids, nucleic acids, and carbohydrates. In both A. stolonifera and P. annua, 12 of the same metabolites were upregulated, with five unique metabolites in A. stolonifera and nine unique metabolites in P. annua. There were 17 of the same metabolites downregulated in both species, with five uniquely downregulated in A. stolonifera and nine uniquely downregulated in P. annua.
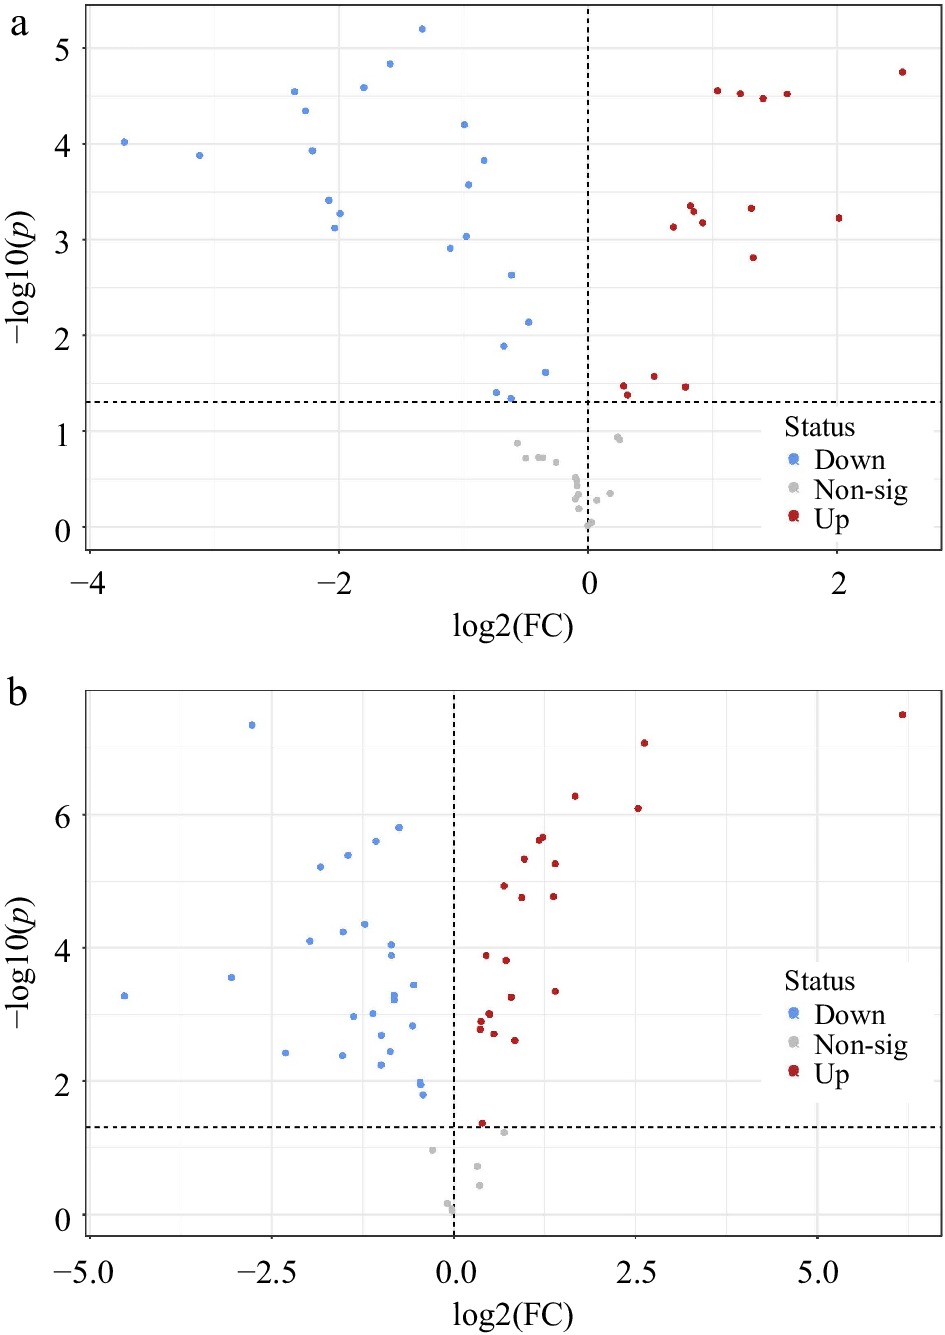
      Figure 5. 

      Volcano plots indicating significantly different metabolites in leaf tissue at 42 d of heat stress compared to unstressed control plants of (a) A. stolonifera and (b) P. annua (p < 0.05).

      Metabolites with the most notable differences in their responses to 42 d of heat stress between the two species were organic acids (Table 2). Most organic acids exhibited decreases in their content or were downregulated in both grass species, except for two organic acids. Various organic acids and intermediates involved in respiration in glycolysis and the tricarboxylic acid (TCA) cycle were downregulated only in P. annua, including glucose-1-phosphate, glucose-6-phosphate, pyruvate, lactate, fumarate, and malate, but these remained unchanged in A. stolonifera in response to heat stress. Glycerate was downregulated to a greater degree in P. annua (−1.83) than in A. stolonifera (−1.11). Glucuronic acid was upregulated in both species but to a greater extent in A. stolonifera.

      Table 2.  Relative content of notable metabolites in heat-stressed plants (42 d) compared to control levels expressed as log2(fold-change (FC)) in A. stolonifera and P. annua (p < 0.05).

      Metabolite classSignificant metabolitesA. stoloniferaP. annua
      log2(FC)p-valuelog2(FC)p-value
      SugarSucrose2.01160.0005940.496990.00099707
      Stachyose1.59473E-051.39620.00045046
      Raffinose1.0372.78E-050.841520.0024677
      Glucose0.84650.0005090.550680.0019506
      Fructose0.314110.041860.375040.0012791
      UDP-Glucose−0.617140.002339−0.564540.0014869
      Organic acid/carbon intermediatesGlycerate−1.10960.00123−1.82916.1183E-06
      Glucose 1-phosphateNSNS−0.420470.015974
      Glucose 6-phosphateNSNS−0.857210.000090569
      LactateNSNS−1.52610.0041586
      PyruvateNSNS−0.870070.0036087
      FumarateNSNS−0.819810.00051454
      MalateNSNS−0.817850.000603
      AconitateNSNS−2.3170.003775
      Citrate−0.739720.039597−0.450580.011317
      Succinic acid−0.837890.000149−1.10860.00096848
      Glucuronic acid0.819410.0004410.446830.00013123
      Malonic acid0.683360.000738−1.52080.000057636
      NAD1.32160.001537NSNS
      Amino acidsPhenylalanine−2.03840.0007551.1752.4601E-06
      Tryptophan0.91630.0006641.37050.000017093
      Tyrosine−0.478940.0072850.486750.00097056
      Serine−1.80342.56E-05−1.21940.000044349
      Threonine−2.08370.000386−1.97350.000079449
      Asparagine−3.72629.53E-05−4.52430.00052899
      Glutamine−1.99350.000535−0.99210.0020488
      Aspartate−3.12220.000131−3.05420.00027844
      Glutamate−2.27054.5E-05−1.45024.1223E-06
      Lysine0.282210.033750.366160.0016675
      HistidineNSNS0.394980.042833
      Alanine−0.962310.000266−0.853540.00013055
      Valine−0.344390.0243680.691880.000011814
      IsoleucineNSNS1.22720.000002184
      LeucineNSNS0.973814.6598E-06
      Glycine−0.981930.000923−0.997360.0056936
      Proline0.780090.0345692.62248.5101E-08
      Nucleic acidsThymidine2.52311.77E-056.16983.1863E-08
      Guanine1.21962.98E-050.719810.00015414
      Adenosine−0.622740.0456920.934810.000017701
      Guanosine−1.33376.29E-06−1.37620.0010679
      Uridine−1.59161.45E-05−1.06592.5287E-06
      Adenine−2.35842.82E-05−2.76944.5431E-08
      Cytidine−0.995726.27E-05−0.547680.00036086
      'NS' denotes metabolites that had no significant change in concentration between heat-stressed and non-stressed control plants.

      Most carbohydrates or sugars, including sucrose, stachyose, raffinose, and glucose exhibited increases in their content in both species exposed to 42 d of heat stress but were elevated to a greater extent in A. stolonifera than in P. annua, with the exception of fructose, which was upregulated to a similar extent in both grass species (Table 2). The UDP-glucose was downregulated in both grass species.

      Most amino acids exhibited a decline in their content or were downregulated under heat stress in both grass species, including serine, threonine, asparagine, glutamine, aspartate, glutamate, alanine, and glycine, which were downregulated to a similar extent in the two species (Table 2). Tryptophan, lysine, and proline were upregulated in both species with a greater fold-change (FC) in P. annua. Phenylalanine, tyrosine, and valine were downregulated in A. stolonifera but upregulated in P. annua. Histidine, isoleucine, and leucine were all exclusively upregulated in P. annua in response to heat stress.

      Nucleic acid changes were similar between species. Guanosine, uridine, adenine, and cytidine were downregulated by heat stress to a similar extent in both grass species (Table 2). Thymidine and guanine were upregulated in both species, but to a greater level for thymidine in P. annua. Adenosine exhibited upregulation in P. annua but downregulation in A. stolonifera at 42 d of heat stress.

    • The superior heat tolerance of A. stolonifera relative to P. annua was characterized by the lesser extent of declines in TQ and green canopy cover and lower EL in heat-stressed plants compared to the respective control for each species. Metabolomic analysis in this study identified some metabolites and their relevant metabolic pathways that could explain some of the differences in heat tolerance between the two grass species, as presented above. To better elucidate metabolic pathways affected by heat stress in the two grass species that could be associated with the differences in heat tolerance, only the metabolites that exhibited differential responses to heat stress in each species relative to their respective non-stress controls are discussed in detail below (Fig. 6).
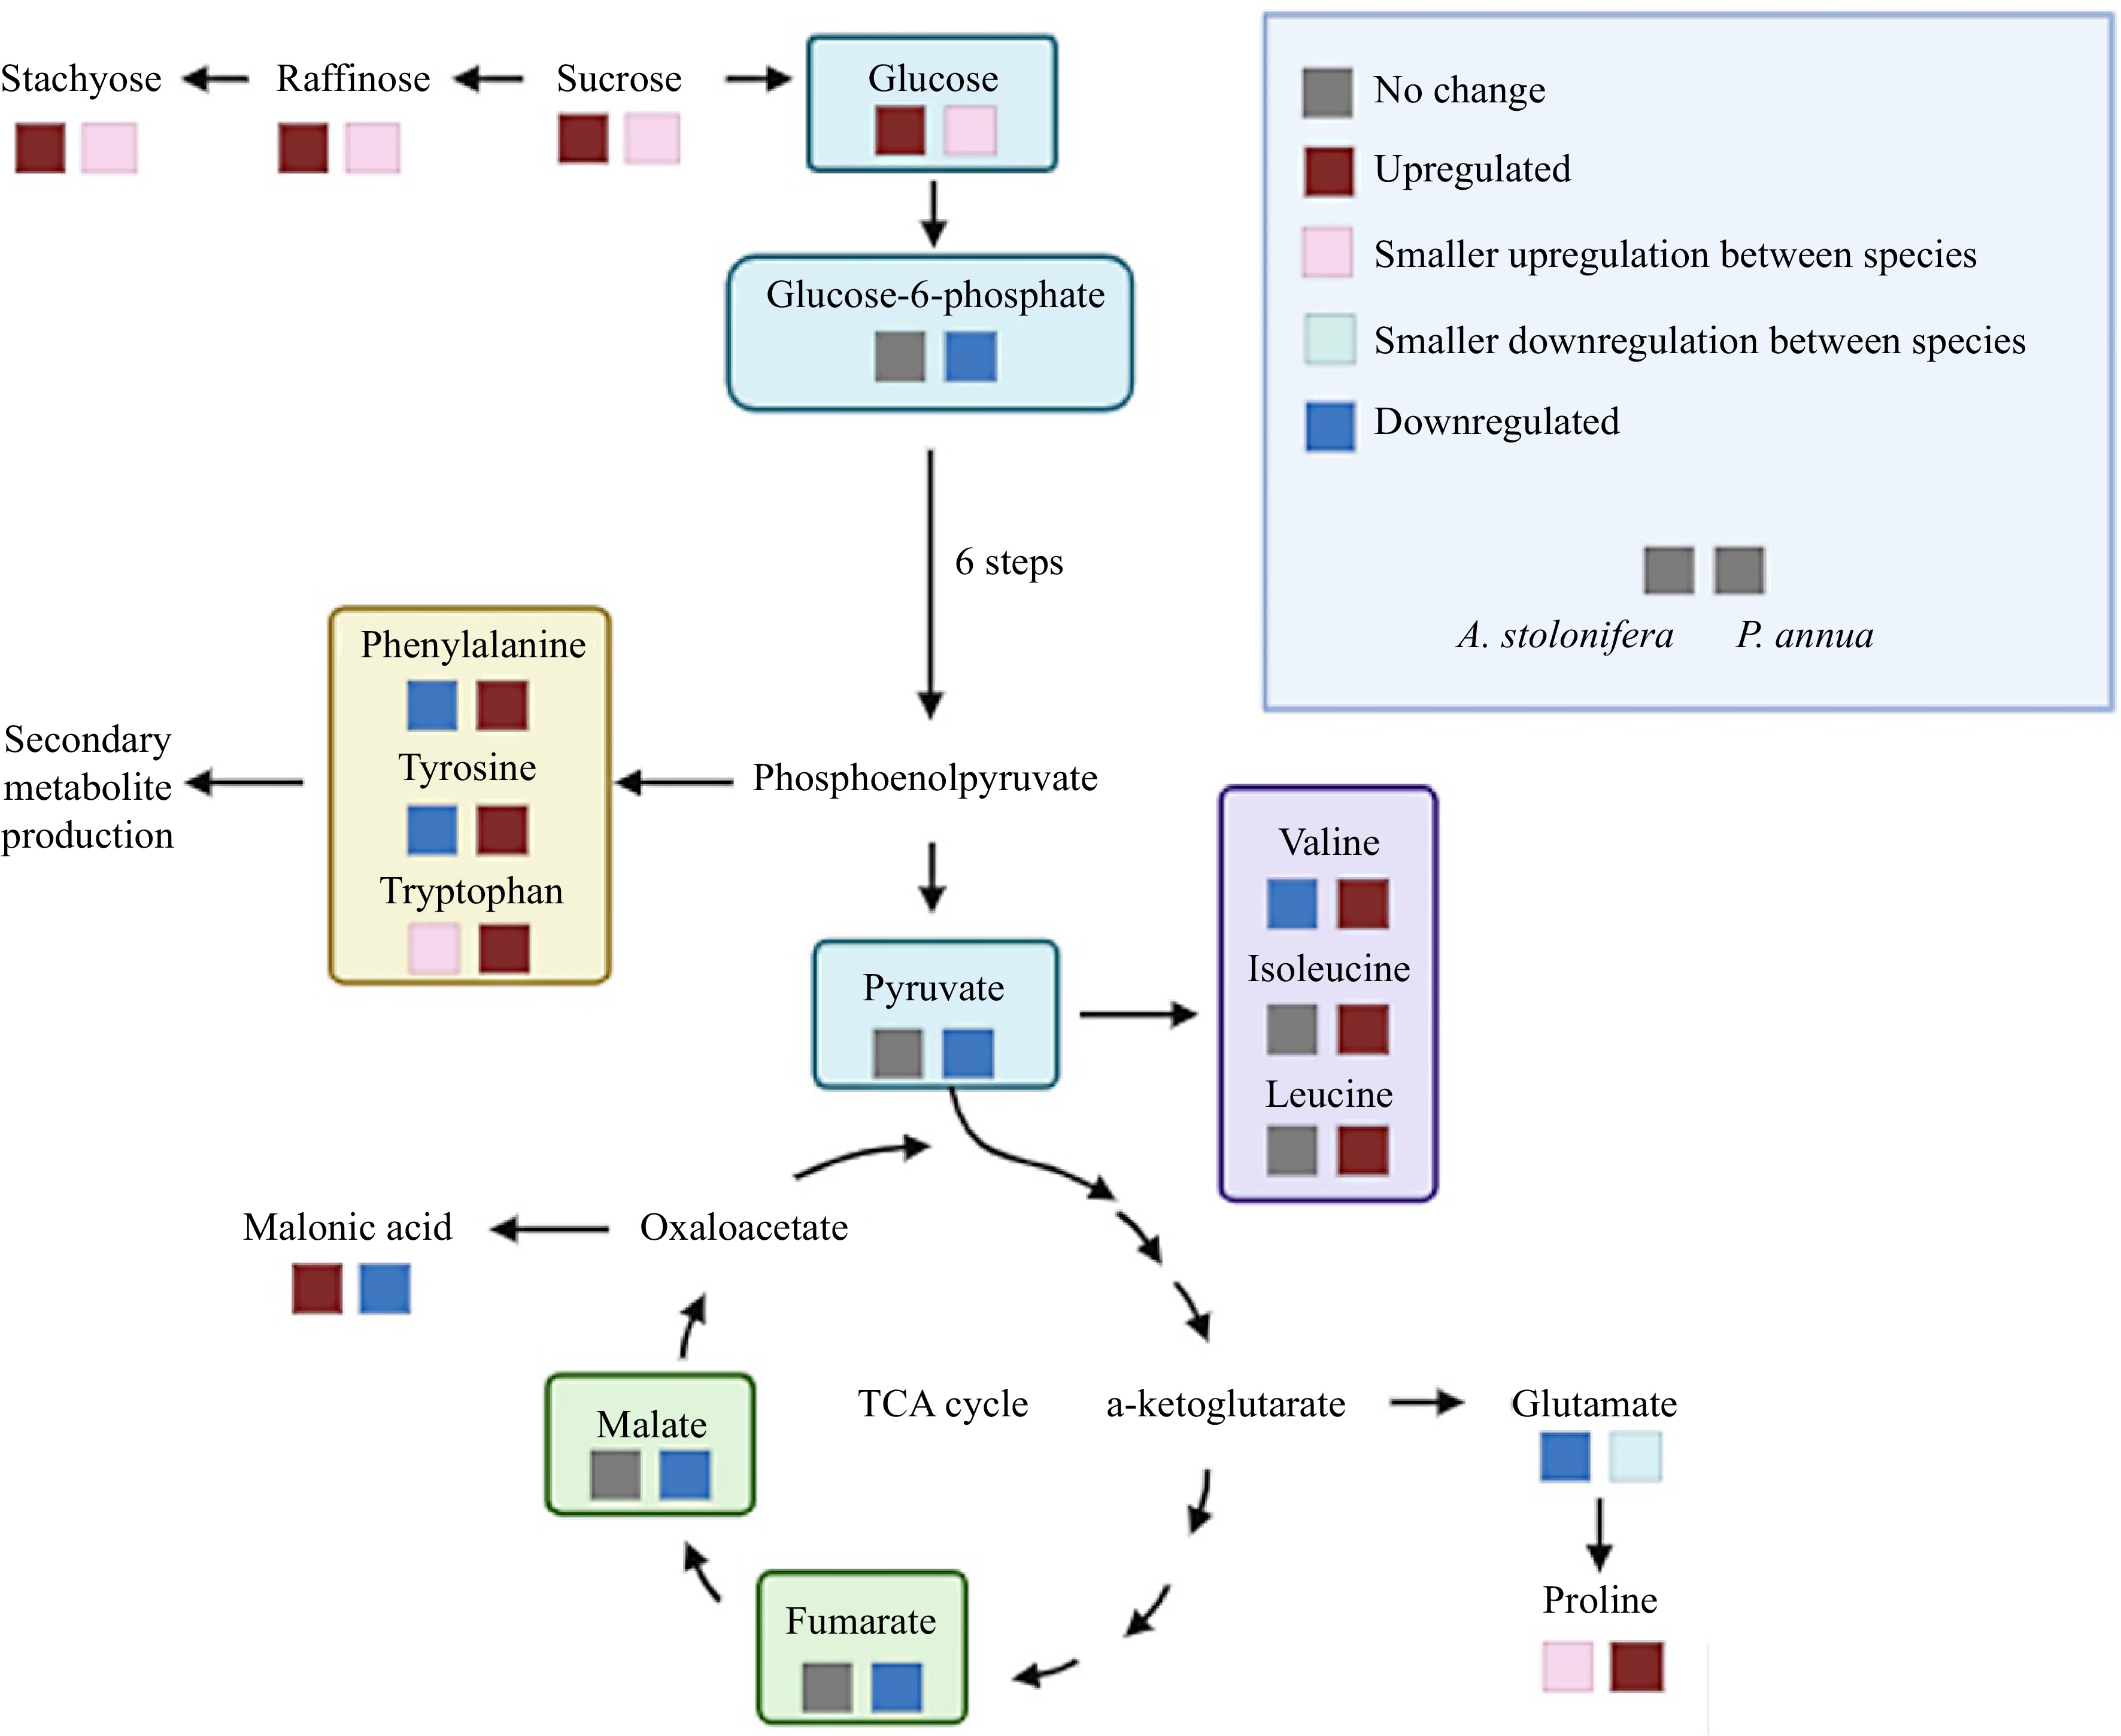
      Figure 6. 

      Metabolic pathways illustrating metabolites differentially up-regulated (increase in content) or down-regulated (decrease in content) by heat stress in P. annua and A. stolonifera.

      Carbon metabolism, in the processes of photosynthesis and respiration, plays essential roles in regulating plant tolerance to abiotic stress, including heat stress[23]. In this study, several carbohydrates or sugars, including sucrose, stachyose, raffinose, and glucose exhibited a greater extent of increases in their content in A. stolonifera than those in P. annua in response to heat stress compared to their respective non-stress controls; however, in response to heat stress, the significant downregulation of organic acids, including malate, fumarate, pyruvate, aconitate, malonic acid, lactate, glucose-1-phosphate, and glucose-6-phosphate, was observed only in P. annua or was more severe in P. annua than in A. stolonifera. Those organic acids and carbon intermediates are key metabolites in glycolysis and the tricarboxylic acid (TCA) cycle of respiration and support energy production, affecting plant responses to high temperatures[24,25]. It is particularly interesting to find that glucuronic acid and malonic acid, which are not directly involved in energy production, exhibited different response patterns to heat stress from those organic acids involved in respiration. Glucuronic acid was upregulated in response to heat stress, but to a greater extent in A. stolonifera than in P. annua. It has been found to play roles in stress protection by acting as an inducer for the synthesis of heat shock proteins (HSP) in mammalian cells[26]. Kim et al. reported that glucuronic acid induced the synthesis of HSP70 and that exogenous treatment of cells significantly enhanced tolerance to heat shock. Malonic acid was upregulated in response to heat stress in A. stolonifera, while it was downregulated in P. annua[26]. The increases in malonic acid content during drought stress have been associated with enhancement of drought tolerance through modulation of osmotic potential[27]; however, the roles of either glucuronic acid or malonic acid in plant tolerance to heat stress are unclear and deserve further investigation. The differential metabolic changes to heat stress between the two grass species suggested the maintenance of active carbohydrate and organic acid metabolism for energy production in respiration, and increased metabolites for stress protection could contribute to the superior heat tolerance of A. stolonifera relative to P. annua.

      The difference in heat tolerance for P. annua and A. stolonifera was also associated with differential changes in amino acid metabolism, which plays critical roles in plant tolerance to heat stress[28]. Proline, tryptophan, and lysine were upregulated to a greater extent in P. annua than in A. stolonifera in response to heat stress, while phenylalanine, tyrosine, valine, isoleucine, and leucine were upregulated only in heat-stressed P. annua, although most amino acids exhibited a decline in their content in both grass species exposed to heat stress. Proline accumulation has been widely reported in various plant species exposed to abiotic stresses and is considered a metabolic stress indicator[12,29]. Tryptophan, phenylalanine, and tyrosine belong to the aromatic amino acid family (AAA) and act as precursors or intermediates in the synthesis pathway of secondary metabolites and signaling molecules in response to abiotic stresses[29,30]. The upregulation of AAA in P. annua could reflect heat injury and/or the inefficient use of AAA to produce secondary metabolites involved in stress defense; however, the roles of secondary metabolites in the differential heat response between P. annua and A. stolonifera are yet to be investigated. The degradation of lysine and some branched-chain amino acids (BCAAs), including valine, isoleucine, and leucine has been positively associated with dehydration tolerance in arabidopsis (Arabidopsis thaliana)[31], although in this study, the accumulation of lysine, valine, isoleucine, and leucine observed in P. annua following prolonged periods of heat stress could be the result of metabolic impairment or inefficient use of those amino acids in the downstream metabolism in P. annua.

      In summary, physiological analysis demonstrated the superior heat tolerance of A. stolonifera relative to P. annua. The comparative metabolic profiling analysis identified some metabolites that were upregulated uniquely or to a greater extent in heat-tolerant A. stolonifera (sucrose, stachyose, raffinose, glucose, glucuronic acid, and malonic acid) and some that were up-regulated uniquely or to a greater extent (proline, tryptophan, histidine, phenylalanine, tyrosine, valine, isoleucine, and leucine) or downregulated (malate, fumarate, pyruvate, aconitic acid, malonic acid, lactate, glucose-1-phosphate, and glucose-6-phosphate) in heat-sensitive P. annua in response to heat stress. Those differential metabolites are mainly in carbohydrate and organic acid metabolism, as well as amino acid metabolism, and are involved in photosynthesis, respiration, secondary metabolism, and stress protection. Those distinct metabolites present in the two grass species were associated with the difference in heat tolerance for A. stolonifera vs P. annua and could be used as biomarkers or incorporated into biofertilizers to improve the heat tolerance of P. annua. Furthermore, future research to identify molecular factors involved in the synthesis of the differential heat-responsive metabolites between the two grass species differing in heat tolerance may provide further insight into mechanisms for improving heat tolerance in P. annua and other cool-season turfgrasses.

    • The authors confirm contribution to the paper as follows: data collection: McBride S, Rossi S; data analysis and draft manuscript preparation: McBride S; developed research ideas, experimental design, acquired funding, and revised manuscript: Huang B. All authors reviewed the results and approved the final version of the manuscript.

    • All data generated or analyzed during this study are included in this published article.

      • Thanks go to the Tri-State Turfgrass Research Foundation and New Jersey Agricultural Experiment Station for funding support.

      • The authors declare no conflict of interest. Bingru Huang is the Editorial Board member of Grass Research who was blinded from reviewing or making decisions on the manuscript. The article was subject to the journal's standard procedures, with peer-review handled independently of this Editorial Board member and the research groups.

      • Copyright: © 2024 by the author(s). Published by Maximum Academic Press, Fayetteville, GA. This article is an open access article distributed under Creative Commons Attribution License (CC BY 4.0), visit https://creativecommons.org/licenses/by/4.0/.
    Figure (6)  Table (2) References (31)
  • About this article
    Cite this article
    McBride S, Rossi S, Huang B. 2024. Differential metabolic responses to heat stress associated with interspecific variations in stress tolerance for annual bluegrass and creeping bentgrass. Grass Research 4: e013 doi: 10.48130/grares-0024-0011
    McBride S, Rossi S, Huang B. 2024. Differential metabolic responses to heat stress associated with interspecific variations in stress tolerance for annual bluegrass and creeping bentgrass. Grass Research 4: e013 doi: 10.48130/grares-0024-0011

Catalog

  • About this article

/

DownLoad:  Full-Size Img  PowerPoint
Return
Return