ARTICLE   Open Access    

Exogenous spraying of Naphthaleneacetic acid (NAA) and Sodium diethyldithiocarbamate trihydrate (DIECA) increased the female to male ratio and seed production of buffalo grass

More Information
  • Received: 21 January 2024
    Revised: 15 April 2024
    Accepted: 18 April 2024
    Published online: 03 June 2024
    Grass Research  4 Article number: e014 (2024)  |  Cite this article
  • Buffalograss has been extensively used in recent years as a low-maintenance lawn grass. The artificial manipulation of sex differentiation in buffalograss to enhance seed production is important for both cultivation and practical applications. In this study, we applied a specific concentration of synthetic auxin (Naphthaleneacetic acid, NAA) and inhibitors of jasmonic acid synthesis (Sodium diethyldithiocarbamate trihydrate, DIECA) solution on buffalograss under field conditions. The majority of treatments significantly improved the number of female fertile tillers, female florets, the female-to-male ratio, and ultimately, seed yield (p < 0.05). Among all treatments, 100 mg/L DIECA + 100 mg/L NAA, and 100 mg/L DIECA + 150 mg/L NAA, demonstrated the most effective results. Under these two treatments, the number of female fertile tillers increased by 161% and 145% respectively, the number of female florets increased by 8.56% and 7.82% respectively, the female-to-male ratio increased by 130% and 118% respectively, the potential seed yield increased by 136% and 121% respectively, and the actual seed yield increased by 69% and 77% respectively.
  • The competition for consumer preference for fresh apples (Malus domestica) from exotic and tropical fruits is intense. Red-fleshed (RF) apple may not only provide a novel point of differentiation and enhanced visual quality, but also a source of increased concentration of potentially health-benefiting compounds within both the fresh fruit and snack/juice markets[1]. Two different types of RF apples have been characterised: Type 1 RF apple has red colouration not only in the fruit core and cortex, but also in vegetative tissues, including stems and leaves; Type 2 RF apples display red pigment only in the fruit cortex[1, 2]. To facilitate trade and lengthen the supply-window, harvested fruit are usually cold stored, which can induce a series of disorders, including physiological breakdown manifesting as a flesh browning disorder (FBD) in RF apples[3, 4]. FBD in RF apples can be caused by senescence, and there is also some evidence to suggest that a large proportion of RF apples are chilling-sensitive (Jason Johnston, Plant & Food Research Hawke's Bay, personal communication).

    Earlier studies suggested that Type 1 RF colour was determined by a promoter mutation of MdMYB10 that has a tandem replication of a myeloblastosis (MYB) binding cis-element (R6) within the promoter, resulting in autoregulation of MdMYB10[5]. However, van Nocker et al.[6] observed a large variation in the degree and pattern of red pigmentation within the cortex among the accessions carrying MdMYB10, and concluded that the presence of this gene alone was not sufficient to ensure the RF colour. A genome-wide association study (GWAS)[3], reported that, in addition to the MdMYB10 gene, other genetic factors (e.g. MdLAR1, a key enzyme in the flavonoid biosynthetic pathway) were associated with RF colour, too. Wang et al.[7] reported that many of the up-regulated genes in RF apples were associated with flavonoid biosynthesis (e.g., chalcone synthase (CHS), chalcone isomerase (CHI), dihydroflavonol 4-reductase (DFR), anthocyanin synthase (ANS), UDP-glucosyltransferase (UGT) and MYB transcription factors). Recently, MdNAC42 was shown to share similar expression patterns in RF fruit with MdMYB10 and MdTTG1, and it interacts with MdMYB10 to participate in the regulation of anthocyanin synthesis in the RF apple Redlove®[8].

    Several transcription factor genes (e.g., MYB, WRKY, bHLH, NAC, ERF, bZIP and HSF) were reported to be differentially expressed during cold-induced morphological and physiological changes in 'Golden Delicious' apples[9]. A study by Zhang et al.[10] showed that ERF1B was capable of interacting with the promotors of anthocyanin and proanthocyanidin (PA) MYB transcription factors, and suggested that ethylene regulation and anthocyanin regulation might be linked in either direction. It was reported that ethylene signal transduction pathway genes or response genes, such as ERS (ethylene response sensor), EIN3 (ethylene-insensitive3) and ERFs (ethylene response factors), may play an important role in the regulatory network of PA biosynthesis[11].

    Espley et al.[12] observed no incidence of FBD in cold-stored fruit of 'Royal Gala', but over-expression of MdMYB10 in 'Royal Gala' resulted in a high rate of FBD in RF fruit, which was hypothesised to be caused by elevated fruit ethylene concentrations before harvest and more anthocyanin, chlorogenic acid (CGA) and pro-cyanidins in RF fruit. In addition, the MYB10 transcription factor was shown to elevate the expression levels of MdACS, MdACO, and MdERF106 ethylene-regulating genes[12]. To elucidate the mechanism regulating the FBD of RF apples, Zuo et al.[13] analysed the transcriptome of tree-ripe apples at 0, 0.5 and 4 h after cutting, and reported that the differentially expressed genes at different sampling points were mainly related to plant–pathogen interactions.

    GWAS is a powerful technique for mining novel functional variants. One of the limitations of GWAS, using SNP arrays, is that they require genotyping of large numbers of individuals, which may be expensive for large populations. DNA pooling-based designs (i.e., bulk segregant analysis) test differential allele distributions in pools of individuals that exhibit extreme phenotypes (XP) in bi-parental populations, large germplasm collections or random mating populations[1416]. In addition to reducing the number of samples to be genotyped, the use of whole genome sequencing (WGS)-based XP-GWAS has the potential to identify small-effect loci and rare alleles via extreme phenotypic selection.

    In this WGS-based XP-GWAS, we investigated the genetic basis of RF and FBD by sequencing the pools of individuals that exhibited extreme phenotypes for these two traits, and analysed the differences in allele frequencies between phenotypic classes. This method combines the simplicity of genotyping pools with superior mapping resolution. We also examined the transcriptome from transgenic apple fruit harbouring the R6:MYB10 promoter as a model for red flesh in apple. Differences in gene expression of a highly pigmented line were compared with expression in control fruit and these genes were then used for comparison with the seedling population. Understanding the genetic basis of the link between RF and FBD will help in design of strategies for selection against FBD in high-quality Type 1 RF apple cultivars.

    A snapshot of visual variation in FBD and WCI is presented in Fig. 1. The average WCI and FBD across all ~900 seedlings ranged from 0 to 7, and from 0% to 58%, respectively. Based on the MLM analysis, the estimated narrow-sense heritability (h2) of WCI and FBD was 0.57 (standard error = 0.18) and 0.09 (standard error = 0.05), respectively. The estimated genetic correlation between WCI and FBD was 0.58, and several fruit quality traits displayed unfavourable correlations with WCI (Supplemental Fig. S1). Seedlings with higher WCI scores were generally characterised by poor firmness and crispness, plus higher astringency and sourness. Estimated phenotypic and genetic correlations between all pairs of traits are listed in Supplemental Table S1.

    Figure 1.  Transverse cross-sections of apple slices showing range in (a) flesh colouration, and (b) flesh browning disorder for Type 1 red-fleshed apple. The weighted cortical intensity (WCI) scores (0−9 scale) and the proportion of the cortex area showing symptoms of flesh browning disorder are also displayed.

    A few seedlings had no red pigment in the cortex, but the average WCI score across all seedlings was 2.25. About two-thirds of the seedlings did not display any FBD symptoms, but among the remaining seedlings, FBD ranged between 1% and 58% (Fig. 2). The average WCI score for the 'low' and 'high' WCI pool was 0.45 and 5.2, respectively, while the average FBD was 0% and 20.6% for the 'low' and 'high' FBD pool, respectively (Supplemental Table S2). The average WCI score of the seedlings in the FBD pools was similar (Low: 5.5; High: 4.6), while the average FBD of the high- and low-WCI pools was 4.5% and 0.1%, respectively.

    Figure 2.  The distribution of weighted cortex intensity (WCI) scores (a) and the internal flesh browning disorder IFBD%; (b) in the population of ~900 apple seedlings. The green and red circles highlight the individuals used to form the 'low' and 'high' pools of samples.

    After filtering, about 204,000 SNPs were used and the average sequencing depth of SNP loci was similar for the two pools (42 vs 44). There was a near-perfect correlation between the Z-test statistics and G-statistics, so only the latter are discussed hereafter. A plot of the G' values, smoothed over 2 Mb windows, is shown for all 17 chromosomes (Chrs) in Supplemental Fig. S2. XP-GWAS identified genomic regions significantly associated with FBD on 12 out of the 17 Chrs (Fig. 3), and putative candidate genes within ±1.0 Mb distanceof the significant G' peaks were identified (Table 1). Additional genomic regions, which did not meet the significance threshold but displayed distinguished G' peaks, were also identified across all chromosomes (Supplemental Table S3).

    Figure 3.  G'-statistics across the linkage groups (LG) showing significant association with the flesh browning disorder (FBD) in apple The horizontal red lines indicate the significance threshold. The putative candidate genes (refer to Table 1) underpinning various G' peaks are also shown.
    Table 1.  A list of the genomic regions associated with internal flesh browning disorder (FBD) in apples. Putative candidate genes residing within these regions are also listed using GDDH13v1.1 reference genome assembly.
    ChrGenomic region (Mb)Putative genes functions
    221.9–23.5Ethylene-responsive element binding factor 13 (MdERF13: MD02G1213600);
    33.1–4.9cinnamate 4-hydroxylase (C4H) enzyme (MD03G1051100, MD03G1050900 and MD03G1051000); MdWRKY2: MD03G1044400; MdWRKY33 (MD03G1057400)
    38.2–9.6ascorbate peroxidase 1 (MdAPX1: MD03G1108200, MD03G1108300)
    314.7–16.6senescence-related MdNAC90 (MD03G1148500)
    336.5–37.5Ethylene response sensor 1 (MdERS1: MD03G1292200); flavonoid biosynthesis protein MdMYB12 (MD03G1297100); Heat shock protein DnaJ (MD03G1296600, MD03G1297000); pectin methylesterase (MdPME) inhibitor protein (MD03G1290800, MD03G1290900, MD03G1291000).
    411.0–13.0phenylalanine and lignin biosynthesis protein MdMYB85 (MD04G1080600)
    422.1–24.4MYB domain protein 1 (MD04G1142200); HSP20-like protein (MD04G1140600); UDP-glucosyltransferase (UGT) proteins UGT85A7 (MD04G1140700, MD04G1140900); UGT85A3 (MD04G1140800); UGT (MD04G1141000, MD04G1141300); UGT85A2 (MD04G1141400); UGT85A4 (MD04G1141500); DNAJ heat shock protein (MD04G1153800, MD04G1153900, MD04G1154100)
    427.6–29.6HCT/HQT regulatory genes MD04G1188000 and MD04G1188400
    629.8–31.7Volz et al. (2013) QTL for IFBD; anthocyanin regulatory proteins MdMYB86 (MD06G1167200); triterpene biosynthesis transcription factor MdMYB66 (MD06G1174200); Cytochrome P450 (MD06G1162600; MD06G1162700, MD06G1162800, MD06G1163100, MD06G1163300, MD06G1163400, MD06G1163500, MD06G1163600, MD06G1163800, MD06G1164000, MD06G1164100, MD06G1164300, MD06G1164400, MD06G1164500, MD06G1164700)
    713.9–15.9heat shock protein 70B (MD07G1116300)
    717.4–19.0Drought-stress WRKY DNA-binding proteins (MdWRKY56: MD07G1131000, MD07G1131400)
    723.6–25.2MdPAL2 (MD07G1172700); drought-stress gene NGA1 (MD07G1162400); DNAJ heat shock family protein (MD07G1162300, MD07G1162200), stress-response protein (MdNAC69: MD07G1163700, MD07G1164000)
    97.9–11.8MD09G1110500 involved in ascorbate oxidase (AO); MdUGT proteins (MD09G1141200, MD09G1141300, MD09G1141500, MD09G1141600, MD09G1141700, MD09G1141800, MD09G1142000, MD09G1142500, MD09G1142600, MD09G1142800, MD09G1142900, MD09G1143000, MD09G1143200, MD09G1143400) involved in flavonoids biosynthesis; heat shock proteins 89.1 (MD09G1122200) and HSP70 (MD09G1137300); Ethylene-forming enzyme MD09G1114800; Anthocyanin regulatory protein MdNAC42 (MD09G1147500, MD09G1147600)
    914.9–16.5triterpene biosynthesis transcription factor protein MdMYB66 (MD09G1183800);
    111.7–3.0ethylene response factor proteins (MdEIN-like 3: MD11G1022400)
    1138.6–40.6Senescence-related gene 1 (MD11G1271400, MD11G1272300, MD11G1272000, MD11G1272100, MD11G1272300, MD11G1272400, and MD11G1272500); Chalcone-flavanone isomerase (CHI) protein (MD11G1273600) and MdbHLH3 (MD11G1286900, MDP0000225680); cytochrome P450 enzyme (MD11G1274000, MD11G1274100, MD11G1274200, MD11G1274300, MD11G1274500, and MD11G1274600); heat shock transcription factor A6B (MdHSFA6B: MD11G1278900) – involved in ABA-mediated heat response and flavonoid biosynthesis.
    122.2–3.5heat shock protein 70-1 ((MD12G1025600, MD12G1025700 and MD12G1026300) and heat shock protein 70 (MD12G1025800 and MD12G1025900 and MD12G1026000); ethylene (MD12G1032000) and auxin-responsive (MD12G1027600) proteins.
    127.2–8.4DNAJ heat shock domain-containing protein (MD12G1065200 and MD12G1067400)
    1327.5–30.5MD13G1257800 involved in polyphenol 4-coumarate:CoA ligase (4CL)
    1337.5–39.5pectin methyl esterase inhibitor superfamily protein MdPMEI (MD13G1278600)
    1425.4–27.5Drought-stress response gene MdWRKY45 (MD14G1154500); chalcone synthase (CHS) family proteins (MD14G1160800 and MD14G1160900); triterpene biosynthesis transcription factor MdMYB66 (MD14G1180700, MD14G1181000, MD14G1180900); anthocyanin biosynthesis protein (MdMYB86: MD14G1172900); cytochrome P450 proteins (MD14G1169000, MD14G1169200, MD14G1169600, MD14G1169700)
    150–1.5Ethylene synthesis proteins (MD15G1020100, MD15G1020300 and MD15G1020500); dihydroflavonol reductase (DFR) gene (MD15G1024100)
    154.6–6.8MdMYB73 (MD15G1076600, MD15G1088000) modulates malate transportation/accumulation via interaction with MdMYB1/10; MdNAC52: MD15G1079400) regulates anthocyanin/PA; heat shock transcription factor B4 (MD15G1080700); stress-response protein MdWRKY7 (MD15G1078200)
    1553.5–54.9MdC3H (MD15G1436500) involved in chlorogenic acid biosynthesis; MdEIN3 (MD15G1441000) involved in regulating ethylene synthesis and anthocyanin accumulation
    168.9–10.9SAUR-like auxin-responsive protein (MD16G1124300) and MdNAC83: (MD16G1125800) associated with fruit ripening; MD16G1140800 regulates proanthocyanidin; MdPAE genes (MD16G1132100, MD16G1140500) regulates ethylene production.
     | Show Table
    DownLoad: CSV

    The ethylene-responsive factor 13 (MdERF13: MD02G1213600) resided within the significant region (21.9–23.5 Mb) on Chr2, while the ascorbate peroxidase 3 (MdAPX3: MD02G1127800, MD02G1132200) resided in the prominent region between 9.45 and 11.28 Mb) (Fig. 3, Table 1). There were several genomic regions showing association with FBD on Chr3. The first region (8.2–9.5 Mb) flanked MdAPX1 (MD03G1108200, MD03G1108300), while MdERF3 (MD03G1194300) and heat shock protein 70 (HSP70: MD03G1201800, D03G1201700) resided within the prominent peak region (25.5–27.5 Mb). Another significant region (36.5–37.5 Mb) at the bottom on Chr3 harboured ethylene response sensor 1 (MdERS1: MD03G1292200), a flavonoid-biosynthesis related protein MdMYB12 (MD03G1297100), HSP DnaJ and pectin methyl esterase (PME) inhibitor proteins (Fig. 3, Table 1).

    The significant G' region (27.6–29.6 Mb) on Chr4 flanked the genes MD04G1188000 and MD04G1188400 involved in the biosynthesis of hydroxycinnamoyl CoA shikimate/quinate hydroxycinnamoyl transferase (HCT/HQT), while the adjacent region (22.1–24.3 Mb) harboured a cluster of UDP-glucosyltransferase (UGT) proteins and HSP (Table 1). Another region between 11.0 and 13.0 Mb encompassed phenylalanine and lignin biosynthesis gene MYB85 (MD04G1080600)[17]. The only significant region associated with FBD on Chr6 spanned between 29.8 and 31.7 Mb, which included a SNP earlier reported associated with FBD[4]. This region also harboured several MYB proteins (MdMYB86: MD06G1167200; MdMYB98: MD06G1172900; MdMYB66: MD06G1174200) and a large cluster of cytochrome P450 proteins (Table 1).

    A significant FBD-associated region (13.9–15.9 Mb) on Chr7 encompassed the HSP 70B (MD07G1116300), while another significant region between 23.6 Mb and 25.2 Mb flanked the gene coding for phenylalanine ammonia lyase 2 (MdPAL2: MD07G1172700), a drought stress gene NGA1 (MD07G1162400), DNAJ HSP, and stress-response protein (MdNAC69: MD07G1163700, MD07G1164000) (Fig. 3, Table 1). A large significant region spanning between 7.9 and 11.8 Mb on Chr9 encompassed the gene MD09G1110500 putatively involved in ascorbate oxidase (AO), HSP (HSP70: MD09G1137300; HSP89.1: MD09G1122200), an ethylene-forming enzyme (MD09G1114800), and MdNAC42 (MD09G1147500, MD09G1147600). Another significant genomic region on Chr9 was between 14.9 and 16.5 Mb, which harbours the MYB domain protein MdMYB66 (MD09G1183800) (Table 1).

    A sharp G' peak region (1.7–3.0 Mb) on Chr11 associated with FBD encompassed ethylene insensitive 3 (MdEIN3: MD11G1022400) along with a cluster of UGT proteins, WD-40, and bHLHL proteins (Table 1). A significant region between 38.6 and 40.6 Mb at the bottom of Chr11 was dominated by clusters of senescence-related genes and cytochrome P450 enzymes. This genomic region also flanked a chalcone-flavanone isomerase (CHI) family protein (MD11G1273600) and a bHLH protein (MdbHLH3: MD11G1286900, MDP0000225680), along with the heat shock transcription factor A6B (HSFA6B: MD11G1278900) (Table 1, Supplemental Table S3).

    The region (2.2–3.3 Mb) associated with FBD on Chr12 flanked genes for the HSP 70 and 70-1, NAC proteins, ethylene and auxin-responsive proteins (Table 1). An adjacent significant region (7.2–8.4 Mb) flanked DNAJ HSP, along with bZIP, bHLH and WD-40 repeat-like proteins (Table 1; Supplemental Table S3). There was a large genomic region on Chr13 showing a significant association with FBD. In this region, the first G' peak (27.5–30.5 Mb) harboured MD13G1257800, which regulates polyphenol 4-coumarate: CoA ligase (4CL) synthesis. The second G' peak region (32.6–34.7 Mb) corresponded to an earlier mapped QTL for flesh browning in white-fleshed apples[18].

    The significant region (25.4–27.5 Mb) on Chr14 harboured various genes for proteins with different putative functions, such as AP2 proteins, WD-40 repeat family proteins, bHLH proteins, MdNAC83 (MD14G1150900), MdWRKY45 (MD14G1154500), chalcone synthase (CHS) family proteins (MD14G1160800 and MD14G1160900), cytochrome P450 proteins, and several MYB domain proteins (MdMYB86: MD14G1172900; MdMYB98: MD14G1179000; MdMYB66: MD14G1180700, MD14G1181000, MD14G1180900) (Fig. 3, Table 1, Supplemental Table S3). A sharp G' peak (15.2–17.2 Mb) on Chr14 did not meet the significance threshold corresponding to the FBD QTL in white-fleshed apples[18].

    The upper 1.5 Mb region on Chr15 associated with FBD encompassed several transcription factor families, including WD-40 repeats, bHLH, bZIP, ethylene synthesis proteins, and dihydroflavonol reductase (DFR) protein (MD15G1024100) (Fig. 3, Table 1; Supplemental Table S3). Another significant region on Chr15 (4.6−6.8 Mb) harboured HSF B4, MdMYB73 (which interacts with MdMYB1/10 to modulate malate transportation) and MdNAC52 (MD15G1079400), which regulates anthocyanin and PA synthesis by directly regulating MdLAR[19]. A significantly associated region at the bottom of Chr15 (53.5–54.9 Mb) harboured MdNAC35 (MD15G1444700), MdC3H (MD15G1436500) involved in the production of p-coumarate 3-hydroxylase (C3H) enzyme, which plays a role in chlorogenic acid biosynthesis, and MdEIN3 (MD15G1441000).

    The significant region between 8.9 and 10.9 Mb on Chr16 harboured a gene for SAUR-like auxin-responsive protein (MD16G1124300) and MdNAC83 (MD16G1125800), both of which have been reportedly associated with apple fruit ripening[20]. This region also encompassed MD16G1140800, which regulates PA[11], and a gene for the pectin acetyl esterase protein MdPAE10 (MD16G1132100) involved in ethylene production and shelf-life[21]. A sharp G' peak region (20.4–22.4 Mb) in the middle of Chr16 flanked MdERF1B (MD16G1216900) and MdMYB15 (MD16G1218000 and MD16G1218900), involved in altering anthocyanin and PA concentrations[10] (Fig. 3, Table 1, Supplemental Table S3).

    The average sequencing depth of the SNP loci (~160,000) retained for marker-trait association was similar for the two WCI pools (41 vs 44). The significant regions were located on Chrs 2, 4, 6, 7, 10, 15 and 16 (Fig. 4). The genomic intervals within ±1.0 Mb of the significant G' peaks, and the putative candidate genes within those intervals, are listed in Table 2. Additional genomic regions, which did not meet the significance threshold but displayed distinct G' peaks, were also identified across most chromosomes ( Supplemental Fig. S2, Supplemental Table S3). A significant region on Chr4 encompassed chalcone synthase (CHS) genes, along with an ERF (MD04G1009000) involved in regulating PA biosynthesis[11].

    Figure 4.  G’-statistics across the linkage groups (LG) showing significant association with the weighted cortex intensity (WCI) in apple. The horizontal red lines indicate the significance threshold. The putative candidate genes (refer to Table 2) underpinning various G' peaks are also shown.
    Table 2.  A list of the genomic regions significantly associated with the weighted cortex intensity (WCI) in apples. Putative candidate genes residing within these regions are also listed using GDDH13v1.1 reference genome assembly.
    ChrGenomic region (Mb)Putative genes functions
    211.2–13.2UDP-glucosyltransferase (UGT) proteins (MD02G1153000, MD02G1153100, MD02G1153200, MD02G1153300; MD02G1153400; MD02G1153500; MD02G1153700; MD02G1153800; MD02G1153900);
    40–1.2Chalcone synthase (CHS) genes (MD04G1003000; MD04G1003300 and MD04G1003400); DNAJ heat shock protein (MD04G1003500); MdERF (MD04G1009000) involved in regulating PA biosynthesis.
    69.5–11.0Ubiquitin protein (MD06G1061100); stress-response WRKY protein MdWRKY21 (MD06G1062800);
    612.1–13.6pectin methylesterase inhibitor superfamily protein (MdPME: MD06G1064700); phenylalanine and lignin biosynthesis gene (MdMYB85)
    616.0–17.6MD06G1071600 (MDP0000360447) involved in leucoanthocyanidin dioxygenase (LDOX) synthesis
    624.0–26.0UDP-glycosyltransferase proteins (MD06G1103300, MD06G1103400, MD06G1103500 and MD06G1103600); auxin response factor 9 (MdARF9: MD06G1111100) and heat shock protein 70 (Hsp 70; MD06G1113000).
    74.1–5.6Ethylene insensitive 3 protein (MdEIN3: MD07G1053500 and MD07G1053800) involved in proanthocyanidins (PA) biosynthesis; ubiquitin-specific protease (MD07G1051000, MD07G1051100, MD07G1051200, MD07G1051500, MD07G1051300, MD07G1051700 and MD07G1051800).
    1015.9–18.3bHLH proteins (MD10G1098900, MD10G1104300, and MD10G1104600); UGT protein (MD10G1101200); UGT 74D1 (MD10G1110800), UGT 74F1 (MD10G1111100), UGT 74F2 (MD10G1111000).
    1035.6–38.6Stress-response WRKY proteins (MdWRKY28: MD10G1266400; MdWRKY65: MD10G1275800). ethylene responsive factors (MdERF2: MD10G1286300; MdERF4: MD10G1290400, and MdERF12: MD10G1290900) and a NAC domain protein (MdNAC73: MD10G1288300); polyphenol oxidase (PPO) genes ((MD10G1298200; MD10G1298300; MD10G1298400; MD10G1298500; MD10G1298700; MD10G1299100; MD10G1299300; MD10G1299400).
    1524.8–26.8heat shock factor 4 (MD15G1283700), drought-stress response WRKY protein 7 (MdWRKY7: MD15G1287300), MdMYB73 (MD15G1288600) involved in ubiquitination and malate synthesis
    1531.7–34.2MYB domain protein 93 (MdMYB93: MD15G1323500) regulates flavonoids and suberin accumulation (Legay et al. 2016); ubiquitin -specific protease 3 (MD15G1318500),
    161.5–3.4MYB domain proteins (MD16G1029400) regulates anthocyanin; senescence-associated gene 12 (MD16G1031600); ethylene response factor proteins (MdERF118: MD16G1043500, and MD16G1047700 (MdRAV1); MdMYB62 ( MD16G1040800) flavonol regulation; malate transporter MdMa2 (MD16G1045000: MDP0000244249), Ubiquitin-like superfamily protein (MD16G1036000),
    165.4–7.4MdMYB88 (MD16G1076100) regulates phenylpropanoid synthesis and ABA-mediated anthocyanin biosynthesis; MdMYB66 (MD16G1093200) regulates triterpene biosynthesis, MdWRKY72 (MD16G1077700) mediates ultraviolet B-induced anthocyanin synthesis.
     | Show Table
    DownLoad: CSV

    There were distinct G' peaks within a large genomic region (spanning between 9.0 and 18.0 Mb) significantly associated with WCI on Chr6 (Fig. 4). The G' peak region 12.1–13.6 Mb encompassed MdMYB85 (MD06G1064300), and a gene for a pectin methyl esterase

    (PME) inhibitor protein (MD06G1064700); while the region between 16.0 and 17.6 Mb flanked the genes involved in leucoanthocyanidin dioxygenase (LDOX) synthesis (Table 2). The auxin response factor 9 (MdARF9: MD06G1111100) and the HSP70 (MD06G1113000) resided in the significant region between 24.0 and 26.0 Mb on Chr6 (Table 2).

    The genomic region (4.1–5.6 Mb) with significant association with WCI on Chr7 flanked MdEIN3 (MD07G1053500, MD07G1053800), which plays an important role in the regulatory network of PA biosynthesis[11]. A significant region (35.6–38.7 Mb) on Chr10 encompassed gene clusters for bHLH and WRKY proteins along with an ethylene repressor factor (MdERF2: MD10G1286300) (Fig. 4, Table 2; Supplemental Table S3). This region also harboured MdERF4 (MD10G1290400), MdERF12 (MD10G1290900) and NAC domain genes (MdNAC73: MD10G1288300), which have been reported to be associated with fruit ripening[20]. In addition, there was a cluster of polyphenol oxidase (PPO) genes residing in this region (Table 2).

    On Chr15, the significant WCI-associated region spanning between 31.7 Mb and 34.2 Mb encompassed several TF families, including MdMYB93 (MD15G1323500) (Fig. 4, Table 2, Supplemental Table S3). A distinguished G' peak region (24.9–26.9 Mb) on Chr15 harboured genes for WD-40 repeat-like proteins, bHLH proteins, redox responsive transcription factor 1 (MD15G1283200), cytochrome P450 proteins, HSF4 (MD15G1283700), and MdWRKY7 (MD15G1287300). The MdMYB73 (MD15G1288600) residing in this region has been shown to interact with MdMYB1/10 and regulates several functions, including cold-stress response, ubiquitination and malate synthesis[22, 23].

    The significant 1.5–3.4 Mb region on Chr16 flanked an anthocyanin repressor MYB protein (MD16G1029400), senescence-associated gene 12 (MD16G1031600), malate transporter MdMa2 (MD16G1045000: MDP0000244249), and two ethylene response factor genes (MdERF118: MD16G1043500; MdRAV1: MD16G1047700), which interact in retaining flesh firmness[24]. The MdMYB62 (MD16G1040800) gene residing in this region is phylogenetically linked to MdMYB8 (MD06G1217200), which plays a major role in flavonoid biosynthesis[25]. Another significant region (5.4–7.4 Mb) on Chr16 harboured several bHLH genes, including MdMYB88 (MD16G1076100) involved in phenylpropanoid synthesis resulting in drought resistance[26] and ABA-mediated anthocyanin production[27]. The MdMYB66 (MD16G1093200) gene, which is involved in triterpene biosynthesis, and the MdWRKY72 (MD16G1077700) gene involved in anthocyanin synthesis, were also present in this region (Table 2, Fig. 4).

    The genomic regions tagged by XP-GWAS were enriched for regulatory functions, and several of these have a paralog (Table 3). For example, paralogues for a trio of genes (MdMYB86, MdMYB98 and Cytochrome 450) resided in the FBD-associated genomic regions on Chr6 and Chr14. Several pairs of genes resided together in the FBD-associated paralog regions; for example, MdNAC90 and germin-like protein 10 on Chr3 and Chr11; WRKY55 and WRKY70 on Chr1 and Chr7; and ERF1 and ERF5 on Chr4 and Chr6. The ethylene response factor MdERF1B had a paralog in the FBD-associated region on Chr13 and Chr16. Interestingly, three copies of MdNAC83 (Chrs 14, 16 17) and four copies of MdMYB66 (Chrs 4, 6, 9 and 14) resided in the FBD-associated regions. A pair of genes (RAV1 and MYB62) resided together in the WCI-associated paralog regions on Chrs13 and 16 (Table 3).

    Table 3.  A list of homologues genes/genomic regions associated with the internal flesh browning disorder (IFBD) and red flesh (WCI) in apples. Putative candidate genes residing within these regions are also listed using GDDH13v1.1 reference genome assembly.
    TraitChr (genomic region: Mb)Gene namePredicted gene IDPutative function
    IFBDChr6 (29.8–31.7 Mb)MdMYB66MD06G1174200Suberin/triterpene deposition
    IFBDChr14 (25.4–27.5 Mb)MdMYB66MD14G1180700, MD14G1181000, MD14G1180900Suberin/triterpene deposition
    IFBDChr4 (7.0–8.1 Mb)MdMYB66MD04G1060200Suberin/triterpene deposition
    IFBDChr9 (14.9–16.5 Mb)MdMYB66MD09G1183800Suberin/triterpene deposition
    IFBDChr6 (29.8–31.7 Mb)MdMYB86MD06G1167200Anthocyanin regulation
    IFBDChr14 (25.4–27.5 Mb)MdMYB86MD14G1172900Anthocyanin regulation
    IFBDChr6 (29.8–31.7 Mb)MdMYB98MD06G1172900Drought stress response
    IFBDChr14 (25.4–27.5 Mb)MdMYB98MD14G1179000Drought stress response
    IFBDChr6 (29.8–31.7 Mb)Cytochrome P450MD06G1162600, MD06G1162700, MD06G1162800, MD06G1163100, MD06G1163300, MD06G1163400, MD06G1163500, MD06G1163600, MD06G1163800, MD06G1164000, MD06G1164100, MD06G1164300, MD06G1164400, MD06G1164500, MD06G1164700Flavonoid and triterpenic metabolism
    IFBDChr14 (25.4–27.5 Mb)Cytochrome P450MD14G1169000, MD14G1169200, MD14G1169600, MD14G1169700Flavonoid and triterpenic metabolism
    IFBDChr3 (14.7–16.6 Mb)MdNAC90MD03G1148500Senescence-related
    IFBDChr11 (16.5–18.5 Mb)MdNAC90MD11G11679000Senescence-related
    IFBDChr14 (25.4–27.5 Mb)MdNAC83MD14G1150900Senescence/ripening-related
    IFBDChr16 (8.9–10.9 Mb)MdNAC83MD16G1125800Senescence/ripening-related
    IFBDChr17 (0–0. 7 Mb)MdNAC83MD17G1010300Senescence/ripening-related
    IFBDChr3 (14.7–16.6 Mb)Germin-like protein 10MD03G1148000Polyphenol oxidase
    IFBDChr11 (16.5–18.5 Mb)Germin-like protein 10MD11G1167000, MD11G1167100, MD11G1167400, MD11G1169200Polyphenol oxidase
    IFBDChr1 (26.9–28.5 Mb)MdWRKY55MD01G1168500Drought stress response
    IFBDChr7 (30.3–31.9 Mb)MdWRKY55MD07G1234600Drought stress response
    IFBDChr1 (26.9–28.5 Mb)MdWRKY70MD01G1168600Drought stress response
    IFBDChr7 (30.3–31.9 Mb)MdWRKY70MD07G1234700Drought stress response
    IFBDChr4 (7.0–8.1 Mb)MdERF1MD04G1058000Ethylene responsive factor
    IFBDChr6 (5.5–7.3 Mb)MdERF1MD06G1051800Ethylene responsive factor
    IFBDChr4 (7.0–8.1 Mb)MdERF5MD04G1058200Ethylene responsive factor
    IFBDChr6 (5.5–7.3 Mb)MdERF5MD06G1051900Ethylene responsive factor
    IFBDChr13 (18.0–20.0 Mb)MdERF1BMD13G1213100Ethylene response factor 1
    IFBDChr16 (20.4–22.4 Mb)MdERF1BMD16G1216900Ethylene response factor 1
    WCIChr13 (2.6–4.4 Mb)MdRAV1MD13G1046100Ethylene responsive factor
    WCIChr16 (1.5–3.4 Mb)MdRAV1MD16G1047700Ethylene responsive factor
    WCIChr13 (2.6–4.4 Mb)MdMYB62MD13G1039900Flavonol biosynthesis
    WCIChr16 (1.5–3.4 Mb)MdMYB62MD16G1040800Flavonol biosynthesis
    IFBDChr9 (7.9–11.8 Mb)MdNAC42MD09G1147500, MD09G1147600Anthocyanin accumulation
    WCIChr17 (11.4–12.4 Mb)MdNAC42MD17G1134400Anthocyanin accumulation
    IFBDChr9 (7.9–11.8 Mb)HSP 70MD09G1137300Heat stress response
    WCIChr17 (11.4–12.4 Mb)HSP 70MD17G1127600Heat stress response
    IFBDChr4 (11.0–13.0 Mb)MdMYB85MD04G1080600Phenylalanine and lignin biosynthesis
    WCIChr6 (12.1–13.6 Mb)MdMYB85MD06G1064300Phenylalanine and lignin biosynthesis
    IFBDChr15 (13.2–14.2 Mb)MdEBF1MD15G1171800Ethylene inhibition
    WCIChr8 (15.2–17.2 Mb)MdEBF1MD08G1150200Ethylene inhibition
    IFBDChr15 (53.5–54.9 Mb)MdEIN3MD15G1441000Ethylene insensitive 3 protein
    WCIChr8 (30.3–31.6 Mb)MdEIN3MD08G1245800Ethylene insensitive 3 protein
    IFBDChr11 (1.7–3.0 Mb)MdEIN3MD11G1022400Ethylene insensitive 3 protein
    WCIChr7 (4.1–5.6 Mb)MdEIN3MD07G1053500, MD07G1053800Ethylene insensitive 3 protein
    IFBDChr15 (4.6–6.8 Mb)MdMYB73MD15G1076600, MD15G1088000Cold-stress response & malate accumulation
    WCIChr15 (24.8–26.8 Mb)MdMYB73MD15G1288600Cold-stress response & malate accumulation
    IFBDChr15 (4.6–6.8M b)MdWRKY7MD15G1078200Anthocyanin accumulation
    WCIChr15 (24.8–26.8 Mb)MdWRKY7MD15G1287300Anthocyanin accumulation
    IFBDChr15 (43.5–45.5 Mb)MdMYB93MD15G1369700Flavonoid & suberin accumulation
    WCIChr15 (31.7–34.2 Mb)MdMYB93MD15G1323500Flavonoid & suberin accumulation
     | Show Table
    DownLoad: CSV

    Paralogs of several regulatory functions were also found in the regions associated with either FBD or WCI; for example, a significant region (7.9–11.8 Mb) harbouring a gene trio (MdNAC42, HSP70 and HSP89.1) on Chr9 was associated with FBD, but the paralogs of this trio also resided in a distinct G' region associated with WCI on Chr17 (Table 3, Supplemental Table S3). Some other examples included MdMYB85 (Chr4 for FBD, and Chr6 for WCI), MdEBF1 (Chr8 for WCI, and Chr15 for FBD), MdEIN3 (Chr8 for WCI, and Chr15 for FBD), and EIN3 (Chr7 for WCI, and Chr11 for FBD). A pair of genes (MdMYB73 and MdWRKY7) resided together in the separate regions associated with FBD (4.6–6.8 Mb) and WCI (24.8–26.8 Mb) within Chr15 (Table 3).

    The red pigmentation in fruit flesh differed amongst transgenic lines, with fruit from line A10 presenting the most deeply pigmented tissues (Supplemental Fig. S3), while those from lines A2 and A4 were similar in having a lower intensity of pigmentation. No pigmentation was observed in the flesh of control 'Royal Gala' (RG) fruit. RNAseq analysis of a representative transgenic line (A2) compared with RG revealed that a total of 1,379 genes were differentially expressed (log 2-fold), with 658 genes upregulated and 721 genes downregulated. This list was then assessed for commonality with the genomic regions and candidate genes from the XP-GWAS.

    Genes that contained mis-sense SNPs (which would result in a change in predicted protein) and that were also differentially expressed between A2 red-fleshed transgenic line and white-fleshed 'Royal Gala' (control) apples included anthocyanin-related flavanone 3-hydroxylase, chalcone synthase and dihydroflavonol 4-reductase (Table 2 & 4). Many more upstream DNA variants (e.g. in potential promoter-controlling elements) were seen in this group of differentially expressed genes (DEGs) that were also in regions underlying WCI or FBD. Genes encoding enzymes that may be involved in FBD, such as a Rho GTPase activating protein, peroxidase, lipoxygenase 1, and ethylene-forming enzyme (ACO4), were DEGs and showed mis-sense SNPs, including a potential stop codon in the Rho GTPase-activating protein (Table 4). This intersection between DNA change and differential expression warrants further research to evaluate the functions of these genes.

    Table 4.  List of candidate genes associated with WCI or FBD in the XP-GWA and R6:MdMYB10 apple datasets.
    Mutations in GWAS apple populationPredicted gene functionExpression in R6 and ‘Royal Gala’ apples
    GeneMissense
    SNPs
    SNP
    Stop
    Upstream
    variants
    DatasetLocusAnnotation and TAIR IDAverage
    RPKM
    R6 flesh
    Average RPKM
    WT flesh
    log2Fold
    Change
    MD02G11322001FBD Supplemental Table S3Chr02:9450615-11289014flavanone 3-hydroxylase
    (F3H, TT6, F3'H) AT3G51240
    387752.47
    MD02G11336003FBD Supplemental Table S3Chr02:9450615-11289014fatty acid desaturase 5
    (FAD5) AT3G15850
    18109.98
    MD02G11537001WCI Table 2Chr02:11278254-13234556UDP-Glycosyltransferase, lignin related AT2G1856010385341.03
    MD03G10592002FBD Supplemental Table S3Chr03:3177994-4910866Peroxidase AT5G053402514.21
    MD03G1143300422FBD Table 1Chr03:14797661-16611554bZIP transcription factor (DPBF2, AtbZIP67) AT3G44460114852-2.80
    MD03G1147700121FBD Table 1Chr03:14797661-16611554Rho GTPase activating protein AT5G22400205891.29
    MD04G1003400331WCI Table 2Chr04:1-1284894Chalcone synthase (CHS, TT4) AT5G1393014433122.34
    MD04G120410063FBD Table 1Chr04:27629536-29612282lipoxygenase 1 (LOX1, ATLOX1) AT1G550205462681.09
    MD06G1160700129FBD Table 1Chr06:29862341-31737341peptide met sulfoxide reductase AT4G251302121254562.04
    MD06G116140014FBD Table 1Chr06:29862341-31737341Pectin lyase-like protein AT5G63180614129530-2.22
    MD07G1240700126FBD Supplemental Table S3Chr07:30357332-31979025Fe superoxide dismutase 2 AT5G511001051826-3.99
    MD07G13069006FBD Supplemental Table S3Chr07:34607570-36531467UDP-glucosyl transferase 78D2 AT5G170506771112.78
    MD08G12491002WCI Supplemental Table S3Chr08:30486569-31607516HSP20-like chaperone (ATHSP22.0) AT4G102503186456.12
    MD09G111400032FBD Table 1Chr09:7999212-11883202fatty acid desaturase 5 (FAD5) AT3G158507608.68
    MD09G11468001FBD Table 1Chr09:7999212-11883202PHYTOENE SYNTHASE (PSY) AT5G1723038456160901.32
    MD10G132810045FBD Supplemental Table S3Chr10:40235258-41736791ethylene-forming enzyme (ACO4) AT1G050108769033910331.21
    MD15G10236001FBD Table 1Chr15:1-1487288jasmonic acid carboxyl methyltransferase (JMT) AT1G19640472111552.07
    MD15G10241008FBD Table 1Chr15:1-1487288dihydroflavonol 4-reductase (DFR, TT3, M318) AT5G428008723091.63
    MD17G11334004WCI Supplemental Table S3Chr17:11422073-12433463PHYTOENE SYNTHASE (PSY) AT5G172306001721.87
    MD17G12606002FBD Supplemental Table S3Chr17:31098955-32776972dehydroascorbate reductase 1 (DHAR3) AT5G167101867−1.78
     | Show Table
    DownLoad: CSV

    Several gene families (e.g. chalcone synthase, UGT, anthocyanin synthase, HSP, PAL, ERF, WRKY proteins, ABA, and bZIP transcription factors) residing in WCI-associated genomic regions have been reported to be associated with RF in apple[7, 12, 28]. Several of these genes are implicated in stress responses, suggesting that flavonoids and anthocyanin biosynthesis could also be associated with stress (e.g., drought, water loss) tolerance of RF apples[7].

    MdMYB73, which may play a role in the cold-stress response[23, 29], resided in the WCI-associated regions. Ethylene is among the various modulators of environmental stresses induced by factors such as drought and cold temperatures[9, 28]. Several ERF proteins (e.g. MdERF1B, MdERF3) interact with the promoters of MYB domain proteins to regulate anthocyanin and proanthocyanidin (PA) accumulation in apple[10, 11, 30]. The WCI-associated genomic regions in our study flanked several ERFs previously reported to have roles in anthocyanin and PA regulation. MdERF4 (MD10G1290400), one of the three ERFs residing in the WCI-associated region on Chr10, has high phylogenetic similarity with MdERF38, which interacts with MdMYB1 to regulate drought-related anthocyanin biosynthesis[31]. Some ERFs (e.g. MdERF2: MD10G1286300; MdERF4: MD10G1290400, and MdERF12: MD10G1290900) and MdNAC73 residing in the WCI-associated regions have been reported to be associated with fruit maturation[20] – suggesting an interaction between ethylene production and RF colour[12].

    The WCI-associated region on Chr15 included a gene MdMYB73 (MD15G1288600) involved in malate acid synthesis. Previous studies have reported that MdMYB1 regulates both anthocyanin and malate accumulation, and perhaps MdBT2 regulates MdMYB73-mediated anthocyanin accumulation[22, 23]. The malate transporter gene MdMa2 and the MdMYB7 gene, involved in the regulation of anthocyanin and flavanols in RF apple[32], resided together in the WCI-associated upper region of LG16. Taken together, these results support the hypothesis that there is interplay between anthocyanin and malate accumulation in the RF apple. There was a cluster of ubiquitin-specific proteases underpinning the WCI-associated regions on Chrs 7 and 15, which is supported by earlier reports suggesting that ubiquitin-specific proteases respond to auxin and might suppress anthocyanin biosynthesis proteins[33]. The auxin response factor 9 (MdARF9: MD06G1111100), which has also been shown to suppress anthocyanin biosynthesis in RF callus samples[33], also resided in the WCI-associated genomic region on LG7.

    Seedlings in both the low- and high-FBD pools carried the MdMYB10 gene, which suggests that MdMYB10 itself is not the causal factor of FBD in RF apples. Long-term cold storage generally results in senescence-related flesh breakdown, and several transcription factor genes (e.g. MYB, WRKY, NAC, ERF, cytochrome P450, and HSP) have been shown to express differentially during long-term cold storage[9]. The FBD-associated genomic regions in our study harboured several ERFs, suggesting that ethylene synthesis proteins may be contributing to cell wall disassembly, allowing PPO enzymes to come into contact with phenolic compounds and potentially leading to FBD symptoms[18].

    Pectin methyl esterase (PME) genes resided in the FBD-associated significant regions on Chrs 3, 13 and 17. Volatile generation and senescence degradation have been suggested to be bio-markers of FBD, and the expression levels of methyl esters were found to be associated with FBD and senescence in 'Fuji' apples after cold storage[34]. The MdPME2 gene has also been reported to be associated with apple flesh firmness and mealiness[21, 35]. The co-location of genes encoding cell wall-degrading enzymes (MdPME) and QTLs for FBD has been reported in apple[18, 36].

    The clusters of cytochrome P450 enzymes and senescence-related genes resided in some of the FBD-associated regions in this study. There are no earlier reports of the involvement of P450 enzymes in apple FBD expression, but some genes related to cytochrome P450 were found to be upregulated during litchi fruit senescence[37]. Pericarp browning in litchi is mainly attributable to the degradation of anthocyanin, and the ABA-initiated oxidation of phenolic compounds by PPO[37]. Flavonoids are among the major polyphenols in RF apples[5], and cytochrome P450 is part of the regulatory mechanism for flavonoid metabolism[38]. Association of FBD with the genomic region harbouring P450 would suggest its role in enhanced polyphenol synthesis causing FBD. The co-occurrence of a senescence-related gene MdNAC90 (MD03G1148500; MD11G11679000) and the PPO regulator germin-like proteins (in the FBD-associated paralog regions on Chrs 3 and 11) lends support to an interplay between senescence and oxidation of phenolics and anthocyanins.

    A significant region on Chr9 encompassed a cluster of UGT proteins, which play a role in the regulation of flavonoids and phenolic compounds, as well as converting phloretin to phloridzin[39]. Cytochrome P450, which resided within several FBD-associated regions, is reportedly involved in flavonoid metabolism, such as chlorogenic acid (CGA) acid and phloridzin, which have also been positively associated with suberin production and cell wall disassembly[40, 41].

    Reactive oxygen species (ROS) play an important role in regulating physiological processes in plants, such as senescence[37]. Legay et al.[42] suggested that MdMYB93 (MD15G1369700), found residing in the FBD-associated regions in this study, plays a critical role in remobilisation of flavonoid/phenolic compounds, which can be utilised for detoxification of ROS in the case of oxidative stress. However, flavonoid biosynthesis has also been linked with suberin production causing cuticle cracks in apples[42, 43], and the development of cuticular cracks could accelerate flesh browning as a result of an enhanced oxidative process[44].

    Several HSP (e.g. HSP70, HSP70-1, HSP60, HSP89.1, and HSP DNAJ) and HSF (e.g. HSF4, HSFB4, HSFA6B) resided in the FBD-associated genomic regions. Ferguson et al.[45] showed that, during summer, apple flesh temperature could reach as high as 43 °C, and that an increase in the expression of HSP in apples was associated with high daily flesh temperatures, suggesting a role of HSP to counter heat stress. HSPs have been reported to interact with AP2/ERFs and to play a role in flavonoid biosynthesis and drought tolerance in apple[46]. Heat stress affects lignin accumulation and its substrate, O-phenols, and has been reported to play role in enzymatic browning[47]. Additionally, HSF that regulate HSP expression have also been reported to be regulated by cold stress to generate heat-induced cold tolerance in banana[48]. HSF1 was shown to transcriptionally regulate the promoters of HSP to enhance chilling tolerance in loquat fruit[49]. Activity of the enzymes (PAL, C4H, 4CL) of the phenylpropanoid pathway was positively correlated with loquat fruit lignification, whilst suppression of their expression by heat shock treatment and low-temperature conditioning significantly reduced fruit lignification[50].

    Wang et al.[7] showed that ascorbate peroxidase (APX) was among the genes that were upregulated in RF apple compared with in white-fleshed apples. Several genes (e.g. MdAPX1, MdAPX3, MdAPX4, and MdDHAR1) involved in ascorbate synthesis resided in the genomic regions associated with FBD. Co-localisation of MdDHAR and ascorbic acid (AsA) synthesis genes in the FBD-linked genomic regions have been reported[51], suggesting that the low AsA content increases fruit susceptibility to FBD[52]. It has been shown that the expression of MdMYB1 and MdDHAR genes was strongly correlated in RF apples, and that AO and APX were upregulated by anthocyanin regulatory genes[31].

    There were several genes associated with CGA biosynthesis residing in the FBD-associated regions on various linkage groups, including the genes MYB19 (MD07G1268000) and MdC3H (MD15G1436500). Higher concentrations of CGA were reported in transgenic apple lines carrying MdMYB10[12], suggesting a role of CGA metabolism in the expression of FBD[53]. Interestingly, some of the FBD-associated regions (e.g. Chrs 9, 11, 13, 14 and 17) reported here in RF apples coincide with those reported earlier for FBD in white-fleshed apples[18, 36, 53], suggesting some common underlying genetic mechanisms.

    As discussed above, ERFs have been reported to be involved in the accumulation of anthocyanin and PA biosynthesis, while ethylene synthesis proteins also contribute to cell membrane breakdown, allowing the PPO enzyme to come into contact with phenolic compounds, potentially leading to FBD symptoms[12, 18]. We observed clusters of anthocyanin biosynthesis proteins (bHLH), ERFs (MdERF2, MdERF4, MdERF12) and PPO genes together in the genomic region associated with WCI on Chr10. The co-occurrence of these gene families perhaps facilitates potential interactions that contribute to the genetic correlation between WCI and FBD. We noted that genes involved in flavonoid regulation and ethylene synthesis occurred together in the FBD-associated regions on several chromosomes (e.g. MD16G1140800 and MdPAE10: MD16G1132100; MdERF1B: MD16G1216900 and MdMYB15: MD16G1218000, MD16G1218900) – suggesting these genes could be in linkage disequilibrium and this would contribute to the expression of WCI and FBD.

    MYB7 (MD16G1029400) resided in the WCI-associated upper region of Chr16, and the expression level of MYB7 was shown to be correlated with that of LAR1 in peach fruit[54]. The MdLAR1 protein (MDP0000376284), which is located about 1.2 Mb upstream of MYB7 (MD16G1029400), was reported to be associated with WCI and FBD in apple[3]. Mellidou et al.[36] reported that 4CL (MD13G1257800 in the FBD-linked region on Chr13), which catalyses the last step of the phenylpropanoid pathway, leading either to lignin or to flavonoids, was upregulated in browning-affected flesh tissues. The gene MdMYB85, involved in the regulation of flavonoid and lignin biosynthesis, resided in the WCI-associated region on Chr6 and FBD-associated paralogous region on Chr4. Metabolic interactions between anthocyanin and lignin biosynthesis have been reported for apple[55] and strawberry[56], while flesh lignification and internal browning during low-temperature storage in a red-fleshed loquat cultivar was shown to be modulated by the interplay between ERF39 and MYB8[57].

    The co-localisation of MdMYB66 and cytochrome P450 proteins, along with the anthocyanin regulatory protein MdMYB86, in paralogous FBD-associated genomic regions on Chr6 and Chr14 suggests that these genes interact as a 'hub' contributing to the WCI-FBD genetic link. The paralogs of some other genes were found to be residing in the regions associated with either WCI or FBD. For example, MdNAC42 and HSP70 co-localised in the FBD-associated region on Chr9, but this same pair of genes also resided in the most prominent region associated with WCI on Chr17. Similarly, paralogs of MdEIN3 resided in the WCI-associated region on Chr7 (MD07G1053500, MD07G1053800) and FBD-associated region on Chr11 (MD11G1022400). Interestingly, the paralogs of MdMYB73 and MdWRKY7 co-localised in the WCI- (24.6–26.8 Mb) and FBD-associated (4.6–6.8 Mb) regions on Chr15. The WCI-associated region at the bottom of Chr11 hosted a cluster of senescence-related genes, along with the anthocyanin biosynthesis gene MdbHLH3 (MD11G1286900), suggesting they might interact in the genetic nexus between FBD and WCI.

    FBD in RF apples can be caused by senescence, injury via extreme temperature exposure (chilling or heat), or enzymatic (cut fruit) reaction. Genes reported to be connected to all three factors were located in various FBD-associated genomic regions in this study. Postharvest strategies that both delay senescence and limit exposure to low temperatures may be needed to manage FBD. We also hypothesise that high ascorbic acid content could help to minimise expression of FBD in Type-1 RF cultivars. The adverse genetic correlation between WCI and FBD appears to arise from dual and/or interactive roles of several transcription factors, which would pose challenges for designing a conventional marker-assisted selection strategy. The use of bivariate genomic BLUP to estimate breeding values to simultaneously improve adversely correlated polygenic traits (e.g. WCI and FBD), could be an alternative approach[58, 59].

    A population of 900 apple seedlings composed of 24 full-sib families was generated in 2011 by selected crossings between six red-leaved pollen parents and six white-fleshed female parents. All six pollen parents inherited their red-leaf phenotype from the same great-grandparent 'Redfield'[1]. Each pollen parent was involved in four crosses, and the female parents were involved in three to six crosses each. Foliage colour of young seedlings is a phenotypic marker for Type 1 RF apple. The main purpose of this trial was to understand the flesh colour variation and FBD in the Type 1 RF seedlings, so only the seedlings with red foliage (i.e. carrying MdMYB10) were kept for this trial. The number of seedlings per family varied from 10 to 95. The seedlings were grafted onto 'M9' rootstock and were planted in duplicate at the Plant & Food Research orchard in Hawke's Bay, New Zealand (39°39′ S, 176°53′ E) in 2015.

    Phenotyping for RF and FBD was conducted over two consecutive fruiting seasons (2017 and 2018). Fruit were harvested once, when judged mature, based on a change in skin background colour from green to yellow, and when the starch pattern index (SPI) was between 1.0 and 2.0 (on a scale of 0 to 7). In each season, six fruit were harvested from each plant and stored for 70 d at 0.5 °C, followed by 7 d at 20 °C before fruit evaluation. Fruit were cut in half across the equator and the proportion of the cortex area (PRA) that was red in colour, and the intensity of the red colour (RI) (= 1 (low) to 9 (high)) was scored. A weighted cortical intensity (WCI) was then calculated (PRA × RI) as an estimation of the amount of red pigment in the fruit. The proportion of the cortex area showing symptoms of FBD was also recorded. WCI and FBD were averaged over all fruit for a particular seedling. Fruit were also assessed for the following eating quality traits on a 1 (lowest) to 9 (highest) scale: firmness, crispness, juiciness, sweetness, sourness and astringency, to understand the genetic correlations of eating-quality traits with WCI and FBD.

    The binary vector pSA277-R6:MYB10 was transferred into Agrobacterium tumefaciens strain LAB4404 by electroporation. Transgenic 'Royal Gala' plants were generated by Agrobacterium-mediated transformation of leaf pieces, using a method previously reported[5]. Wild-type 'Royal Gala' and three independent transgenic lines (A2, A4 and A10) of R6:MdMYB10 were grown under glasshouse conditions in full potting mix with natural light. The resulting fruit were assessed for flesh colour phenotypes at harvest (around 135 d after full bloom). Fruit peel and cortex from three biological replicates were collected and frozen in liquid nitrogen, with each replicate compiled from five pooled mature fruit for each transgenic line or wild-type control.

    Total RNA of 36 samples (3 R6:MYB10 lines and 1 wild type control, 3 time points, 3 biological replicates) was extracted, using Spectrum Plant Total RNA Kit (SIGMA). Removal of genomic DNA contamination and first-strand cDNA synthesis were carried out using the mixture of oligo (dT) and random primers according to the manufacturer's instructions (QuantiTect Reverse Transcription Kit, Qiagen). Real-time qPCR DNA amplification and analysis was carried out using the LightCycler 480 Real-Time PCR System (Roche), with LightCycler 480 software version 1.5. The LightCycler 480 SYBR Green I Master Mix (Roche) was used following the manufacturer's method. The qPCR conditions were 5 min at 95 °C, followed by 45 cycles of 5 s at 95 °C, 5 s at 60°C, and 10 s at 72 °C, followed by 65 °C to 95 °C melting curve detection. The qPCR efficiency of each gene was obtained by analyzing the standard curve of a cDNA serial dilution of that gene. The expression was normalized to Malus × domestica elongation factor 1-alpha MdEF1α (XM_008367439) due to its consistent transcript levels throughout samples, with crossing threshold values changing by less than 2.

    Individual fruit measurements were first averaged for each seedling. As the phenotyping was repeated over two years, we used a mixed linear model (MLM) accounting for this 'permanent environmental effect', as previously described[58]. Pedigree-based additive genetic relationships among seedlings were taken into account for estimation of genetic parameters using ASReml software[60]. Product-moment correlations between best linear unbiased predictions (BLUP) of breeding values of all seedlings for different traits were used as estimates of genetic correlation among traits.

    A selective DNA pooling procedure was adopted to construct DNA pools. A high-pool and a low-pool were constructed separately for the two traits (WCI and FBD). Genomic DNA was extracted from the leaves of selected seedlings, and quantified by fluorimetry using the picogreen reagent (Cat#P11496, Thermo). The low and high pools consisted of 35 seedlings each, and normalised amounts (~300 ng) of DNA from individuals were pooled. The pools were dried down with DNA Stable reagent (Cat#93021001, Biomatrica) in a centrifugal evaporator and shipped for sequencing. Each DNA pool was sequenced using paired-end 125 bp reads on the Illumina HiSeq 2500 platform. The quality of raw sequence reads was checked with FastQC/0.11.2 and MultiQC/1.2. Based on the quality control reports, the reads were aligned to the published apple reference genome GDDH13 v1.1[61] using the program bowtie2/2.3.4.3[62] with trimming from both ends before alignments and aligning in full read length ("-5 6 -3 5 –end-to-end"). The mapping results were marked for duplicate alignments, sorted, compressed and indexed with samtools/1.12[63]. Based on the alignment of binary alignment map (BAM) files of the high and low pools, single nucleotide polymorphism (SNP) identification was performed using samtools/1.12 ('samtools mpileup') and bcftools/1.12 ('bcftools call –mv')[63, 64]. Variant sites with missing genotype in any of the pools, or having the same genotype between the pools, were discarded. To minimise the influence of sequencing quality on association analysis, the identified SNPs were further filtered according to the following criteria: 1) a Phred-scaled quality score > 20; and 2) the read depth in each pool was neither < 35, nor > 500.

    The allele frequencies between each pair of bulk DNAs (low versus high WCI; low versus high FBD) were compared at each SNP locus. Differences in the allele frequencies between the low and high pool were expected to be negligible for unlinked SNP markers, but allele frequency differences would be larger for SNPs closely linked to the underlying quantitative trait loci (QTLs) contributing to the extreme phenotypes. A nonparametric test (G-statistic = 2 × Σni ln(ni/nexp), where ni (i = 1 to 4) represented counts of reference and alternate alleles at a particular SNP generated from sequencing of the low and high pool, and nexp was the expected allele count assuming no allele frequency divergence between the two DNA pools[65].

    We then calculated a modified statistic (G'), which took into account read count variation caused by sampling of segregants as well as variability inherent in short-read sequencing of pooled samples[65]. Using R package QTLseqr[66], firstly a G-statistic was calculated for each SNP marker, and then a weighted average using Nadaraya-Watson kernel was obtained to yield a G' statistic for a sliding genomic window of 2 Mb size. The Nadaraya-Watson method weights neighbouring markers' G-values by their distance from the focal SNP so that closer SNPs receive higher weights. The 95th percentile value of G' was used as a threshold to identify significant hotspots and to identify the putative candidate genes residing within the ±1 Mb region around the G' peak. For comparison purposes, a standard two-sided Z-test[14] was also performed to determine the significance of allele frequency differences at SNP loci between the pools for each trait.

    The GDDH gene models intersecting with the XP-GWA hotspots were pulled out with bedtools/2.30.0 ("bedtools intersect -wo -nonamecheck"). The selected genes were further blasted to TAIR10 ("-evalue 1e-5") and the annotated functions from Arabidopsis genes with the best blast score, the highest % identity, and the longest aligned length, were used. Then the expressions of genes located in the GWA hotspots were extracted from the RNAseq analysis of the R6:MdMYB10 representative transgenic line, and the log 2-fold change between the R6:MdMYB10 and 'Royal Gala' apples were calculated.

    This research was funded in 2017/18 by the Strategic Science Investment Fund of the New Zealand Ministry of Business, Innovation and Employment (MBIE) and from 2019 by the Plant & Food Research Technology Development – Pipfruit programme. We thank our colleague Jason Johnston for providing some pictures of the flesh browning disorder in red-fleshed apples. Richard Volz and Jason Johnston provided constructive comments and suggestions on the manuscript.

  • The authors declare that they have no conflict of interest.

  • Supplemental Table S1 Effects of exogenous DIECA on potential seed yield, actual seed yield and female to male ratios of buffalograss in 2022.
  • [1]

    Hitchcock AS, Chase A. 1951. Manual of the grasses of the United States. Washington, DC: United States Department of Agriculture. https://doi.org/10.5962/bhl.title.65332

    [2]

    Engelke MC, Hickey VG. 1983. Buffalograss germplasm diversity and development for semi-arid turf. Texas Turfgrass Proc. PR 4150. pp. 21-22.

    [3]

    Kneebone WR. 1984. The potential for native grasses as turf. Proceedings of the1984 Arizona Turf, Landscape, and Irrigation Conference, Phoenix, Arizona, 1984, pp. 29−30. Tuscon, AZ: University of Arizona. https://tic.msu.edu/tgif/flink?recno=89696

    [4]

    Webb JJ Jr. 1941. The life history of buffalo grass. Transactions of the Kansas Academy of Science 44:58−75

    doi: 10.2307/3624868

    CrossRef   Google Scholar

    [5]

    Sun Y. 2017. Turfgrass Management. Beijing: China Forestry Publishing House. 179 pp.

    [6]

    Huff DR, Wu L. 1987. Sex expression in buffalograss under different environments. Crop Science 27:623−26

    doi: 10.2135/cropsci1987.0011183x002700040002x

    CrossRef   Google Scholar

    [7]

    Budak H, Shearman RC, Parmaksiz I, Dweikat I. 2004. Comparative analysis of seeded and vegetative biotype buffalograsses based on phylogenetic relationship using ISSRs, SSRs, RAPDs, and SRAPs. Theoretical and Applied Genetics 109:280−88

    doi: 10.1007/s00122-004-1630-z

    CrossRef   Google Scholar

    [8]

    Budak H, Shearman RC, Gulsen O, Dweikat I. 2005. Understanding ploidy complex and geographic origin of the Buchloe dactyloides genome using cytoplasmic and nuclear marker systems. Theoretical and Applied Genetics 111:1545−52

    doi: 10.1007/s00122-005-0083-3

    CrossRef   Google Scholar

    [9]

    Han X, Wang L, Shu Q, Liu Z, Xu S, et al. 2008. Molecular characterization of tree peony germplasm using sequence-related amplified polymorphism markers. Biochemical Genetics 46:162−79

    doi: 10.1007/s10528-007-9140-8

    CrossRef   Google Scholar

    [10]

    Yin T, Quinn JA. 1995. Tests of a mechanistic model of one hormone regulating both sexes in Buchloe dactyloides (Poaceae). American Journal of Botany 82:745−51

    doi: 10.2307/2445614

    CrossRef   Google Scholar

    [11]

    Quinn JA. 1987. Relationship between synaptospermy and dioecy in the life history strategies of Buchloe dactyloides (Gramineae). American Journal of Botany 74:1167−72

    doi: 10.2307/2444153

    CrossRef   Google Scholar

    [12]

    Henry IM, Akagi T, Tao R, Comai L. 2018. One hundred ways to invent the sexes: theoretical and observed paths to dioecy in plants. Annual Review of Plant Biology 69:553−75

    doi: 10.1146/annurev-arplant-042817-040615

    CrossRef   Google Scholar

    [13]

    Donze T, Amaradasa BS, Caha C, Heng-Moss T, Amundsen K. 2015. Molecular differentiation of gender in buffalograss. Crop Science 55:1827−33

    doi: 10.2135/cropsci2014.07.0478

    CrossRef   Google Scholar

    [14]

    Yamaguchi N, Wu MF, Winter CM, Berns MC, Nole-Wilson S, et al. 2013. A molecular framework for auxin-mediated initiation of flower primordia. Developmental Cell 24:271−82

    doi: 10.1016/j.devcel.2012.12.017

    CrossRef   Google Scholar

    [15]

    Yu S, Galvão VC, Zhang YC, Horrer D, Zhang TQ, et al. 2012. Gibberellin regulates the Arabidopsis floral transition through mir156-targeted SQUAMOSA PROMOTER BINDING–LIKE transcription factors. The Plant Cell 24:3320−32

    doi: 10.1105/tpc.112.101014

    CrossRef   Google Scholar

    [16]

    Wahl V, Ponnu J, Schlereth A, Arrivault S, Langenecker T, et al. 2013. Regulation of flowering by trehalose-6-phosphate signaling in Arabidopsis thaliana. Science 339:704−7

    doi: 10.1126/science.1230406

    CrossRef   Google Scholar

    [17]

    Suetsugu N, Wada M. 2003. Cryptogam blue-light photoreceptors. Current Opinion in Plant Biology 6:91−96

    doi: 10.1016/s1369526602000067

    CrossRef   Google Scholar

    [18]

    Shao H, Jiang E. 1992. Sexual expression and its regulation in higher plants—The influence of external factors on sexual expression of plants. Journal of China West Normal University (Natural Sciences) 13:275−79

    Google Scholar

    [19]

    Parvathy ST, Prabakaran AJ, Jayakrishna T. 2021. Probing the floral developmental stages, bisexuality and sex reversions in castor (Ricinus communis L.). Scientific Reports 11:4246

    doi: 10.1038/s41598-021-81781-9

    CrossRef   Google Scholar

    [20]

    Folke SH, Delph LF. 1997. Environmental and physiological effects on pistillate flower production in Silene noctiflora L. (Caryophyllaceae). International Journal of Plant Sciences 158:501−9

    doi: 10.1086/297460

    CrossRef   Google Scholar

    [21]

    Buide ML, del Valle JC, Castilla AR, Narbona E. 2018. Sex expression variation in response to shade in gynodioecious-gynomonoecious species: Silene littorea decreases flower production and increases female flower proportion. Environmental and Experimental Botany 146:54−61

    doi: 10.1016/j.envexpbot.2017.10.016

    CrossRef   Google Scholar

    [22]

    Bertin RI. 2007. Sex allocation in Carex (Cyperaceae): effects of light, water, and nutrients. Canadian Journal of Botany 85:377−84

    doi: 10.1139/b07-034

    CrossRef   Google Scholar

    [23]

    Geber MA, Dawson TE, Delph LF. 1999. Gender and sexual dimorphism in flowering plants. Heidelberg: Springer Berlin. xx, 305 pp. https://doi.org/10.1007/978-3-662-03908-3

    [24]

    Bisang I, Ehrlén J, Hedenäs L. 2020. Sex expression and genotypic sex ratio vary with region and environment in the wetland moss Drepanocladus lycopodioides. Botanical Journal of the Linnean Society 192:421−34

    doi: 10.1093/botlinnean/boz063

    CrossRef   Google Scholar

    [25]

    Castetter RC, McLetchie DN, Eppley SM, Stark LR. 2019. Sex ratio and sex expression in an urban population of the silver moss, Bryum argenteum Hedw. Journal of Bryology 41:227−35

    doi: 10.1080/03736687.2019.1610617

    CrossRef   Google Scholar

    [26]

    Andrés F, Coupland G. 2012. The genetic basis of flowering responses to seasonal cues. Nature Reviews Genetics 13:627−39

    doi: 10.1038/nrg3291

    CrossRef   Google Scholar

    [27]

    Simancas B, Cotado A, Müller M, Munné-Bosch S. 2018. Phosphate starvation during the transition phase increases the sex ratio and 12-oxo-phytodienoic acid contents in females of Urtica dioica. Environmental and Experimental Botany 145:39−46

    doi: 10.1016/j.envexpbot.2017.10.013

    CrossRef   Google Scholar

    [28]

    Li H, Wang L, Mai Y, Han W, Suo Y, et al. 2021. Phytohormone and integrated mRNA and miRNA transcriptome analyses and differentiation of male between hermaphroditic floral buds of andromonoecious Diospyros kaki Thunb. BMC Genomics 22:203

    doi: 10.1186/s12864-021-07514-4

    CrossRef   Google Scholar

    [29]

    Golenberg EM, West NW. 2013. Hormonal interactions and gene regulation can link monoecy and environmental plasticity to the evolution of dioecy in plants. American Journal of Botany 100:1022−37

    doi: 10.3732/ajb.1200544

    CrossRef   Google Scholar

    [30]

    Laibach F, Kribben FJ. 1950. Der Einfluß von Wuchsstoff auf die Blütenbildung der Gurke. Naturwissenschaften 37:114−15

    doi: 10.1007/BF00623721

    CrossRef   Google Scholar

    [31]

    Rudich J, Halevy AH, Kedar N. 1969. Increase in femaleness of three cucurbits by treatment with Ethrel, an ethylene releasing compound. Planta 86:69−76

    doi: 10.1007/BF00385305

    CrossRef   Google Scholar

    [32]

    Mahida SV, Valia RZ, Sitapara HH. 2015. Growth, yield and sex-expression as influenced by plant growth regulators in sponge gourd cv. PUSA CHIKNI. The Asian Journal of Horticulture 10:122−25

    doi: 10.15740/has/tajh/10.1/122-125

    CrossRef   Google Scholar

    [33]

    Chandra A, Huff DR. 2014. Pistil smut infection increases ovary production, seed yield components, and pseudosexual reproductive allocation in buffalograss. Plants 3:594−612

    doi: 10.3390/plants3040594

    CrossRef   Google Scholar

    [34]

    Cheng M, Wang X, Zhang Y, Xue J, Niu J. 2010. Effects of external hormones on traits of vegetative growth and sexual reproduction in buffalograss. Journal of Inner Mongolia Minzu University (Natural Sciences) 25:171−74

    doi: 10.3969/j.issn.1671-0185.2010.02.019

    CrossRef   Google Scholar

    [35]

    Birkemeyer C, Kolasa A, Kopka J. 2003. Comprehensive chemical derivatization for gas chromatography-mass spectrometry-based multi-targeted profiling of the major phytohormones. Journal of Chromatography A 993:89−102

    doi: 10.1016/s0021-9673(03)00356-x

    CrossRef   Google Scholar

    [36]

    Dalai S, Singh MK, Kumar M, Singh KV, Kumar V. 2016. Growth, flowering and yield of cucumber (Cucumis sativus L.) as influenced by different levels of NAA and GA3. Journal of Plant Development Sciences 8:445−50

    Google Scholar

    [37]

    Khatoon R, Moniruzzaman M, Moniruzzaman M. 2019. Effect of foliar spray of GA3 and NAA on sex expression and yield of bitter gourd. Bangladesh Journal of Agricultural Research 44:281−90

    doi: 10.3329/bjar.v44i2.41818

    CrossRef   Google Scholar

    [38]

    Yuan R, Li J. 2008. Effect of sprayable 1-MCP, AVG, and NAA on ethylene biosynthesis, preharvest fruit drop, fruit maturity, and quality of 'delicious' apples. HortScience 43:1454−60

    doi: 10.21273/hortsci.43.5.1454

    CrossRef   Google Scholar

    [39]

    Abd El-Gleel Mosa WF, Abd EL-Megeed NA, AMAly M, Sas Paszt L. 2015. The influence of NAA, GA3 and calcium nitrate on growth, yield and fruit quality of "le conte" pear trees. Journal of Experimental Agriculture International 9:1−9

    doi: 10.9734/ajea/2015/18737

    CrossRef   Google Scholar

    [40]

    Baque MA, Hahn EJ, Paek KY. 2010. Growth, secondary metabolite production and antioxidant enzyme response of Morinda citrifolia adventitious root as affected by auxin and cytokinin. Plant Biotechnology Reports 4:109−16

    doi: 10.1007/s11816-009-0121-8

    CrossRef   Google Scholar

    [41]

    Subhashini Devi P, Satyanarayana B, Arundhati A, Raghava Rao T. 2013. Activity of antioxidant enzymes and secondary metabolites during in vitro regeneration of Sterculia urens. Biologia Plantarum 57:778−82

    doi: 10.1007/s10535-013-0337-x

    CrossRef   Google Scholar

    [42]

    Stojakowska A, Malarz J, Kisiel W. 2011. Terpenoids from a multiple shoot culture of Telekia speciosa. Acta Societatis Botanicorum Poloniae 80:253−56

    doi: 10.5586/asbp.2011.019

    CrossRef   Google Scholar

    [43]

    Grobbelaar MC, Makunga NP, Stander MA, Kossmann J, Hills PN. 2014. Effect of strigolactones and auxins on growth and metabolite content of Sutherlandia frutescens (L.) R. Br. microplants in vitro. Plant Cell, Tissue and Organ Culture (PCTOC) 117:401−9

    doi: 10.1007/s11240-014-0449-9

    CrossRef   Google Scholar

    [44]

    Fazal H, Abbasi BH, Ahmad N. 2014. Optimization of adventitious root culture for production of biomass and secondary metabolites in Prunella vulgaris L. Applied Biochemistry and Biotechnology 174:2086−95

    doi: 10.1007/s12010-014-1190-x

    CrossRef   Google Scholar

    [45]

    Guo X, Wang L, Chang X, Li Q, Abbasi AM. 2019. Influence of plant growth regulators on key-coding genes expression associated with phytochemicals biosynthesis and antioxidant activity in soybean (Glycine max (L.) Merr) sprouts. International Journal of Food Science & Technology 54:771−79

    doi: 10.1111/ijfs.13992

    CrossRef   Google Scholar

    [46]

    Wasternack C. 2007. Jasmonates: an update on biosynthesis, signal transduction and action in plant stress response, growth and development. Annals of Botany 100:681−97

    doi: 10.1093/aob/mcm079

    CrossRef   Google Scholar

    [47]

    Yamasaki S, Fujii N, Takahashi H. 2005. Hormonal regulation of sex expression in plants. Vitamins & Hormones 72:79−110

    doi: 10.1016/S0083-6729(05)72003-3

    CrossRef   Google Scholar

    [48]

    Acosta IF, Laparra H, Romero SP, Schmelz E, Hamberg M, et al. 2009. tasselseed1 is a lipoxygenase affecting jasmonic acid signaling in sex determination of maize. Science 323:262−65

    doi: 10.1126/science.1164645

    CrossRef   Google Scholar

    [49]

    Browse J. 2009. Jasmonate: preventing the maize tassel from getting in touch with his feminine side. Science Signaling 2:pe9

    doi: 10.1126/scisignal.259pe9

    CrossRef   Google Scholar

    [50]

    Yang S, An L, Yan Y. 2017. The gene expression analysis of tasselseed2 in maize organs/tissues. Journal of Nanjing Agricultural University 40:936−40

    Google Scholar

    [51]

    Chandra A, Huff DR. 2010. A fungal parasite regulates a putative female-suppressor gene homologous to maize tasselseed2 and causes induced hermaphroditism in male buffalograss. Molecular Plant-Microbe Interactions 23:239−50

    doi: 10.1094/MPMI-23-3-0239

    CrossRef   Google Scholar

    [52]

    Farmer EE, Caldelari D, Pearce G, Walker-Simmons MK, Ryan CA. 1994. Diethyldithiocarbamic acid inhibits the octadecanoid signaling pathway for the wound induction of proteinase inhibitors in tomato leaves. Plant Physiology 106:337−42

    doi: 10.1104/pp.106.1.337

    CrossRef   Google Scholar

  • Cite this article

    Zhu K, Wang C, Li Y, Hu QN, Ren XF, et al. 2024. Exogenous spraying of Naphthaleneacetic acid (NAA) and Sodium diethyldithiocarbamate trihydrate (DIECA) increased the female to male ratio and seed production of buffalo grass. Grass Research 4: e014 doi: 10.48130/grares-0024-0012
    Zhu K, Wang C, Li Y, Hu QN, Ren XF, et al. 2024. Exogenous spraying of Naphthaleneacetic acid (NAA) and Sodium diethyldithiocarbamate trihydrate (DIECA) increased the female to male ratio and seed production of buffalo grass. Grass Research 4: e014 doi: 10.48130/grares-0024-0012

Figures(5)  /  Tables(6)

Article Metrics

Article views(2883) PDF downloads(451)

Other Articles By Authors

ARTICLE   Open Access    

Exogenous spraying of Naphthaleneacetic acid (NAA) and Sodium diethyldithiocarbamate trihydrate (DIECA) increased the female to male ratio and seed production of buffalo grass

Grass Research  4 Article number: e014  (2024)  |  Cite this article

Abstract: Buffalograss has been extensively used in recent years as a low-maintenance lawn grass. The artificial manipulation of sex differentiation in buffalograss to enhance seed production is important for both cultivation and practical applications. In this study, we applied a specific concentration of synthetic auxin (Naphthaleneacetic acid, NAA) and inhibitors of jasmonic acid synthesis (Sodium diethyldithiocarbamate trihydrate, DIECA) solution on buffalograss under field conditions. The majority of treatments significantly improved the number of female fertile tillers, female florets, the female-to-male ratio, and ultimately, seed yield (p < 0.05). Among all treatments, 100 mg/L DIECA + 100 mg/L NAA, and 100 mg/L DIECA + 150 mg/L NAA, demonstrated the most effective results. Under these two treatments, the number of female fertile tillers increased by 161% and 145% respectively, the number of female florets increased by 8.56% and 7.82% respectively, the female-to-male ratio increased by 130% and 118% respectively, the potential seed yield increased by 136% and 121% respectively, and the actual seed yield increased by 69% and 77% respectively.

    • Buffalograss (Bouteloua dactyloides) is a member of Chloridoideae subfamily and originates from the semi-arid temperate Great Plains region of the Western United States[1]. Historically buffalograss was used for pastures in the Western United States[2,3]. Due to its strong drought tolerance, heat resistance, disease resistance, low soil nutrient requirements, low height and strong ability for vegetative reproduction, it has received more attention as a low-maintenance lawn grass[4]. As a perennial warm-season turfgrass, it is commonly utilized for urban greening and ecological slope protection, as well as for turf in airports[5].

      Buffalograss is a wind-pollinated, highly heterogeneous, and dioecious species with rare occurrences of monoecy. The difference in male and female inflorescence structures of buffalograss is significant enough that plants of different sexes were initially classified into separate genera. It is known that the sex expression of dioecious buffalograss remains stable in natural environments, with a roughly equal sex ratio between males and females[69]. Furthermore, when buffalograss is germinated from seeds, it will segregate into female and male plants. In the case of buffalograss that is transplanted or vegetatively propagated, they are typically of the same sex as the mother plant, although on rare occasions, certain plants may alter their sex expression[10]. Buffalograss is dioecious, having an approximate 1:1 female-to-male ratio that is stable[11]. Some cultivars such as 'Sharps Improved' will also exhibit a monoecious phenotype at frequencies up to 13%.

      Both female and male plants play distinct roles in the survival and reproduction of the population. The male plants usually allocate all their resources for the effective spread of high-viability pollen, thereby achieving a higher fertilization rate. Conversely, female plants channel more energy into seed production, providing increased resources for their offspring and thereby enhancing the survival rate of seedlings[12]. Generally, the female and male plants have great differences in morphology when flowering. In production, the application and economic value of different sex types varied significantly even within the same species. For example, to harvest seeds, the number of female plants should be maximized under the premise of ensuring pollination. Female plants are also preferred in lawns because its inflorescences are hidden beneath the lawn canopy, while male inflorescences protrude above the lawn canopy, reducing uniformity and overall aesthetics[13]. Therefore, regulating the sex ratio of buffalograss is very meaningful in terms of production and application.

      Sex differentiation is a natural phenomenon in the biological world, which is an important process for plants to shift from vegetative growth to reproductive growth. The sex differentiation of plants occurs simultaneously during the process of flower bud differentiation, which is not only regulated by sex determining genes, sex chromosomes, and endogenous signals such as auxin[14], gibberellins[15], carbohydrates[16], but also influenced by environmental factors[17,18] such as temperature[19,20], photoperiod[21,22], water[2325], and nutrition[2628]. The complexity of sex-determining mechanisms leads to different genders in plants[29].

      There are various methods to control the sex differentiation of plants artificially, among which by spraying exogenous plant hormones and plant growth regulators is undoubtedly the most simple and low-cost method. As early as 1950, some scholars treated cucumbers (Cucumis sativus L.) with 3-Indoleacetic acid (IAA), and the results showed that the proportion of female and male flowers increased significantly[30]. In a study conducted by Rudich et al.[31], three species of Momordica charantia L were treated with ethephon, resulting in the formation of more female flowers. The application of ethylene treatment at an appropriate concentration was found to increase the number of female flowers on each vine of Luffa cylindrica L. Furthermore, it advanced the timing of when female flowers first appeared, increased the female-to-male flower ratio, and significantly reduced plant height, making internodes shorter, and plants more compact[32].

      Preliminary research has been conducted on the sex differentiation of buffalograss. Trends of sex expression for buffalograss, showed that conditions of warm temperature, high light, and low N were favorable for female sex expression, whereas conditions of cool temperature, low light, and high N were favorable for male sex expression[6]. Chandra & Huff[33] showed that infection by the pistil smut fungus shifts sex ratios of buffalograss to be nearly 100% phenotypically hermaphroditic by increasing inflorescences, spikes, spikelets, and florets. In addition, increased most seed yield components, and increased pseudosexual reproductive allocation in both sex forms compared to uninfected clones. Unfortunately, plants infected with pistil smut fungus produce smut balls, instead of seed. Exogenous application of IAA, Gibberellin A3 (GA3) and cytokinin (CTK) could significantly increase the number of female flowers and fertile tillers of buffalograss[34]. In this study, a series of experiments were performed on buffalograss in which we manipulated concentrations of NAA, DIECA and measured subsequent female-to-male ratio and seed yield.

    • A field trial was carried out at the China Agricultural University Zhuozhou Experimental Station (39.27'N, 115.51'E), which is located in Zhuozhou, Hebei Province, China. The site has an altitude of 42 m and belongs to the warm temperate continental monsoon climate zone with sufficient sunlight, high temperatures, and rainy summers, but cold and dry winters. The average annual rainfall is 563 mm, the annual average temperature is 11.6 °C, and the cumulative frost-free period is 178 d on average. The experimental site is dominated by sandy loam soil. The physical and chemical properties of the soil are shown in Table 1.

      Table 1.  Soil physical and chemical properties.

      Depth (cm)Bulk density (g/cm3)Field moisture capacity (cm3/cm3)Soil pHAvailable phosphorous (mg/kg)Available potassium
      (mg/kg)
      Soil organic matter
      (g/kg)
      Alkali-hydrolyzable nitrogen (mg/kg)
      0−201.670.247.731.7681.387.88129.24
      0−401.690.208.1313.1624.362.30128.50
    • Seeds of 'Zhongye No. 1' buffalograss which was bred by China Agricultural University (Beijing, China) were selected as the experimental species. Seeds were harvested on July 10, 2021.

      NAA and DIECA were ordered from Rhawn company (Shanghai, China), analytical pure. HP-5890II gas chromatograph (The USA, HP Company) and G2-XS Q-TOF mass spectrometer (The USA, Waters Company) were used to measure endogenous JA content.

    • The experimental arrangement was a randomized complete block design, there were 11 treatments and 1 control. Three replicates were set for each treatment which led to 36 experimental plots, including 33 treatment plots and three control plots (CK). The size of each experimental plot was 2 m × 2 m. Three rows were planted with a row spacing of 60 cm in each plot, and the seeding rate was 20 g per plot.

      Our previous experiments showed that 100 mg/L and 150 mg/L of DIECA significantly increased potential seed yield, actual seed yield and female-to-male ratios of buffalograss (Supplemental Table S1). To further investigate DIECA and its interaction with NAA, 2 L of solution were used to spray on the leaves of the test materials in each plot using a manual sprayer in this study. An equal amount of clean water was sprayed in the control group. The reagent concentrations used in different treatments are shown in Table 2.

      Table 2.  Reagent concentrations in treatment.

      TreatmentReagent concentration
      NAA (mg/L)DIECA (mg/L)
      A-b-1100
      A-c-1150
      A-a-250
      A-b-2100
      A-c-2150
      B-a-150150
      B-b-1100150
      B-c-1150150
      B-a-250100
      B-b-2100100
      B-c-2150100
      CK
      If a certain reagent was not used in the treatment, it is marked as '–'.

      Reagents were sprayed at 10 am after dew dissipated from the buffalograss canopy. Two litters of the corresponding reagents or clean water was sprayed in the plot until the leaves were moist. Spraying operations were carried out every two days for a total of seven times. All test treatments were completed before the materials in the test field reached the initial flowering stage to ensure the test effect.

    • Before sowing, compound fertilizers ((N-P-K, 1-0.44-0.91), ET) were uniformly applied to the experimental plots, including 20 kg/hm² of phosphorus, 38 kg/hm² of potassium, and 45 kg/hm² of nitrogen. Before sowing, the seeds were treated at low temperature (−20 °C) for 7 d to break dormancy. Seeds were sowed on May 1st, 2022, and irrigated with punched thin-soft spray tape immediately after sowing. The plots were irrigated every 48 h before emerging, irrigation amount was 24 L per square meter. After emerging, 30 L per square meter of water was irrigated every 48 h to ensure normal growth of the seedlings which facilitated the control of weeds.

      Forty-five days after sowing, the natural height of the seedlings reached 5 cm. At this time, the herbicide Prodiamine with a concentration of 800 g/hm² was sprayed to prevent weed seed germination. In the local hot and rainy months of July and August, a mixture of Quinclorac and Amflunolin at a concentration of 500 g/hm² was sprayed every 30 d to control weeds. A gasoline-powered weeder was used to clear weeds in the aisles of the experimental fields. At the end of October of the same year, 30 L per square meter of water was irrigated to ensure that the test materials overwintered successfully.

      The next year, after the test materials turned green, they were mowed to a uniform height of 8 cm. An equal amount of compound fertilizer was applied in each plot to ensure normal growth of the test materials. Weed control measures remain consistent with the previous year. Treatments were initialed on May 1st, 2023.

    • During the peak flowering period, a 20 cm × 20 cm quadrat was used and three samples were taken from each plot, with a total of nine samples for each treatment (the same as below) in which the number of female and male fertile tillers in plots were counted. The number of females and spikes in plots were also counted at the same time. The ratio of female-to-male was represented by the ratio of female and male fertile tillers in each treatment plot.

      Seed yield was divided into three parts. First, potential seed yield = (female fertile tillers/m2) × (female florets/female fertile tillers) × average weight of a seed. Second, seed yield in experimental plots—Three 50 cm × 50 cm quadrats were placed randomly in each plot, and all mature seeds in the quadrat were harvested manually. Seed that fall to the ground were also collected. Then the harvested mature seeds were dried, cleaned, and weighed. Lastly, actual seed yield—Convert the seed yield per unit area (1 m2) based on the seed yield in experimental plots.

      The endogenous JA content in roots and leaves was also measured. Leaf and root samples were obtained from each plot at 6, 12, and 24 h after spraying the reagents. The sampling tool was a root sampler with 10 cm diameter and 30 cm depth. After obtaining fresh plant samples, immediately washed away the soil attached to the roots. After wiping away the water, cut out the roots and the first main-stem leaf from the end, wrapped them separately in aluminum foil, and immediately frozen in liquid nitrogen then stored at −80 °C. Endogenous JA content was analyzed through gas chromatography + mass. The method of Birkemeyer et al.[35] was used with slight modification.

      The samples were lyophilized and then ground into a fine powder using a mortar and pestle. The powder (0.1 g) was suspended in a solution of acetone and 50 mM citric acid (70:30, v/v), and 9,10-dihydro-JA (20 ng) was added as an internal standard. To prevent the loss of volatile fatty acids, the extracts were allowed to evaporate overnight at room temperature. The resulting aqueous solutions were filtered and extracted with 3 × 10 mL of diethyl ether. The pooled extracts were loaded onto a solid-phase extraction cartridge (500 mg of aminopropyl sorbent). Once loaded, the cartridges were washed with 7.0 mL of trichloromethane and 2-propanol (2:1, v/v). The bound JA and the relevant standard were eluted with 10 mL of diethyl ether and acetic acid (98:2, v/v). After the solvents were evaporated and the residue was esterified with excess diazomethane, the sample was adjusted to 50 µL with dichloromethane. The extracts were then analyzed by GC-MS (6890N network GC system and 5973 network mass selective detector; Agilent Technologies, Palo Alto, CA, USA). The amounts of endogenous JA were determined by comparing the peak areas of JA with the corresponding standards. Three replicates per treatment were used for JA determination.

    • Experimental data were summarized in Excel. The data were subjected to analysis of one-way ANOVA and Duncan's multiple range test (DMRT) by SPSS 26. GraphPadPrism 5 was used to draw graphs.

    • Compared with the control, all treatments reduced the number of male fertile tillers of the experimental plants (Fig. 1a). Among them, the most significant effects were achieved under the treatments of 150 mg/L DIECA + 150 mg/L NAA, 100 mg/L DIECA + 100 mg/L NAA, and 100 mg/L DIECA + 150 mg/L NAA. The number of male fertile tillers decreased by 44%, 42%, and 42% respectively compared with the control group (Fig. 1a). Except for the treatment of 150 mg/L DIECA + 50 mg/L NAA, there were also significant differences between the above three treatment groups and the remaining treatment groups (p < 0.05).
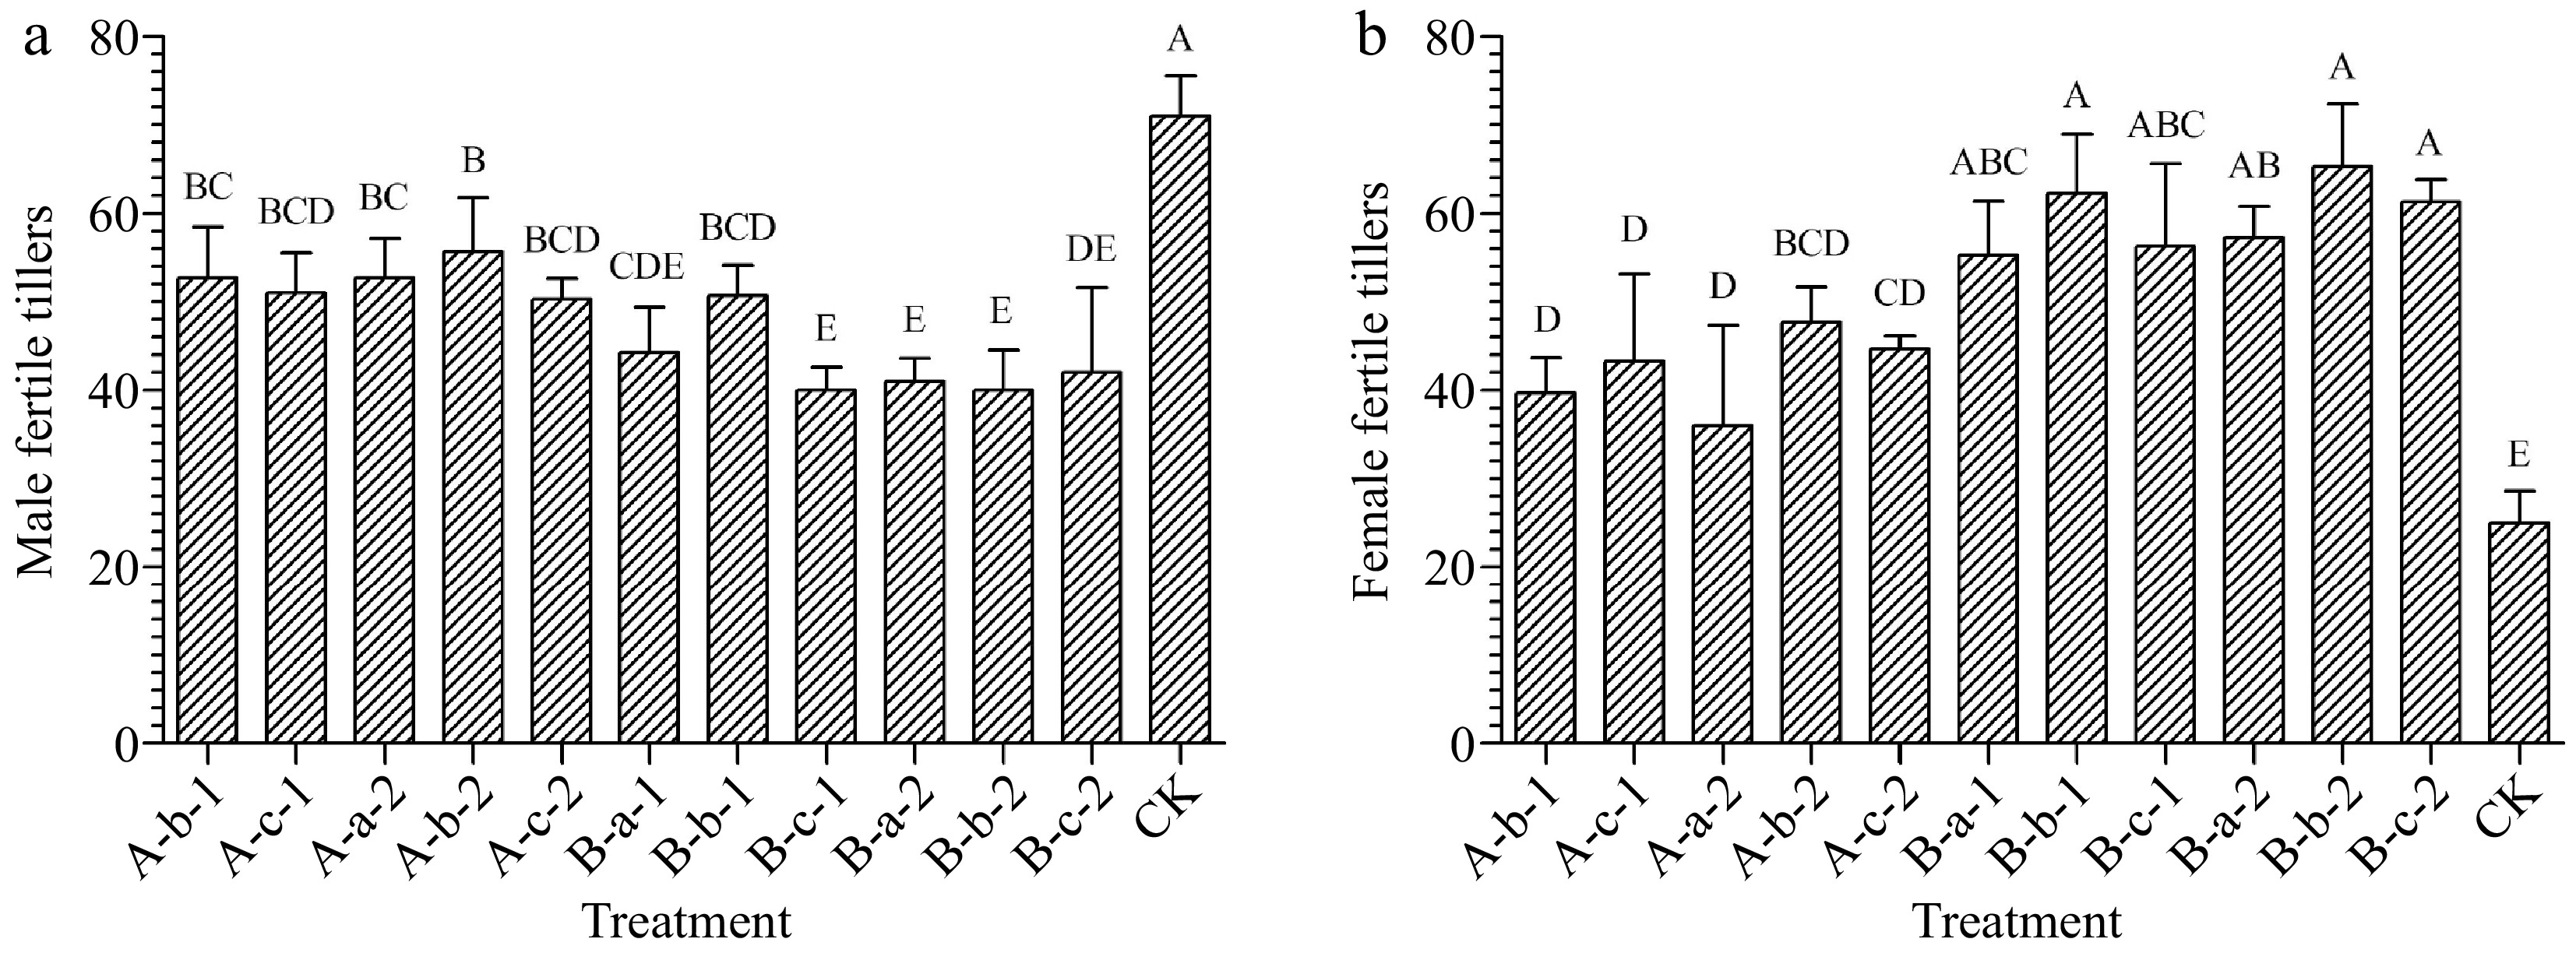
      Figure 1. 

      Effects of spraying reagents on the number of (a) male, and (b) female fertile tillers. The content on the abscissa represents the concentration of reagents used in the corresponding treatment. A-b-1: 100 mg/L DIECA; A-c-1: 150 mg/L DIECA; A-a-2: 50 mg/L NAA; A-b-2: 100 mg/L NAA A-c-2: 150 mg/L NAA; B-a-1: 50 mg/L NAA + 150 mg/L DIECA; B-b-1: 100 mg/L NAA + 150 mg/L DIECA; B-c-1: 150 mg/L NAA + 150 mg/L DIECA; B-a-2: 50 mg/L NAA + 100 mg/L DIECA; B-b-2: 100 mg/L NAA + 100 mg/L DIECA; B-c-2: 150 mg/L NAA + 100 mg/L DIECA; CK: Water.

      Compared with the control, all treatments increased the number of female fertile tillers of the experimental plants (Fig. 1b). Among them, the effect was most significant under the treatments of 150 mg/L DIECA + 100 mg/L NAA, 100 mg/L DIECA + 100 mg/L NAA, and 100 mg/L DIECA + 150 mg/L NAA. The average number of female fertile tillers was 249%, 261%, and 245% of the control group respectively (Fig. 1b).

    • Compared with the control, the four treatments of 100 mg/L DIECA, 150 mg/L NAA, 100 mg/L DIECA + 100 mg/L NAA, and 100 mg/L DIECA + 150 mg/L NAA increased the number of spikes (p < 0.05). Among them, the most significant effect was achieved under the treatment of 100 mg/L DIECA + 150 mg/L NAA (Fig. 2a).
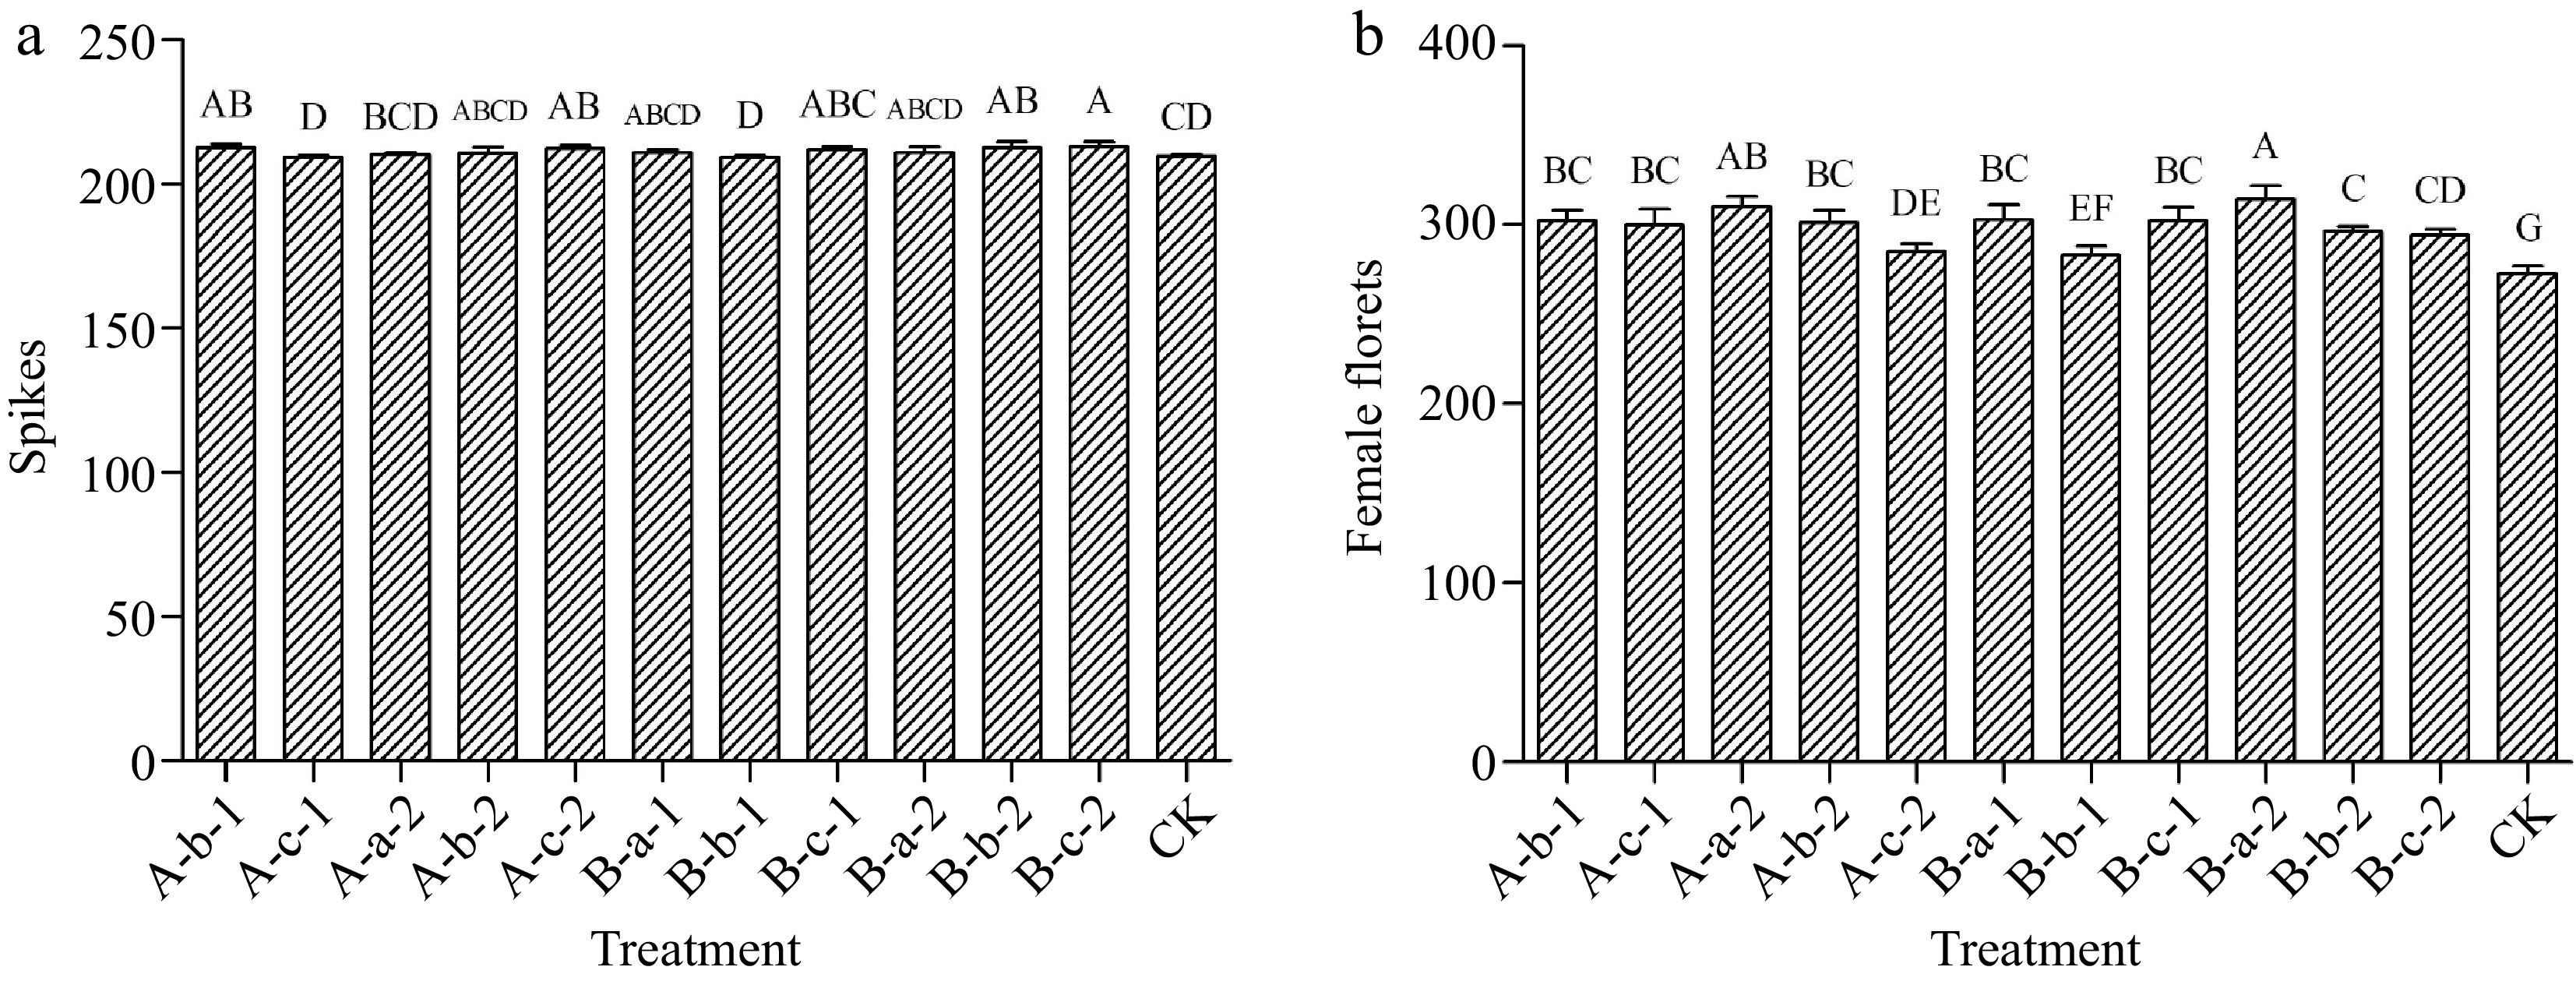
      Figure 2. 

      Effects of spraying reagents on (a) the number of spikes and (b) female florets. The content in the abscissa is the same as Fig. 1.

      Compared with the control, all treatments increased the number of female florets in the experimental plants (Fig. 2b). Among them, the most significant effect was achieved under the treatment of 100 mg/L DIECA + 50 mg/L NAA.

    • Compared with the control group treatments of 100 mg/L NAA, 150 mg/L DIECA + 100 mg/L NAA, 150 mg/L DIECA + 150 mg/L NAA, 150 mg/L DIECA + 150 mg/L NAA, 100 mg/L DIECA + 50 mg/L NAA, 100 mg/L DIECA + 100 mg/L NAA and 100 mg/L DIECA + 150 mg/L NAA increased seed yield (p < 0.05) (Fig. 3). The seed yield in experimental plots of treatments mentioned above increased by an average of 57%, 68%, 55%, 57%, 69%, and 77% compared with the control group.
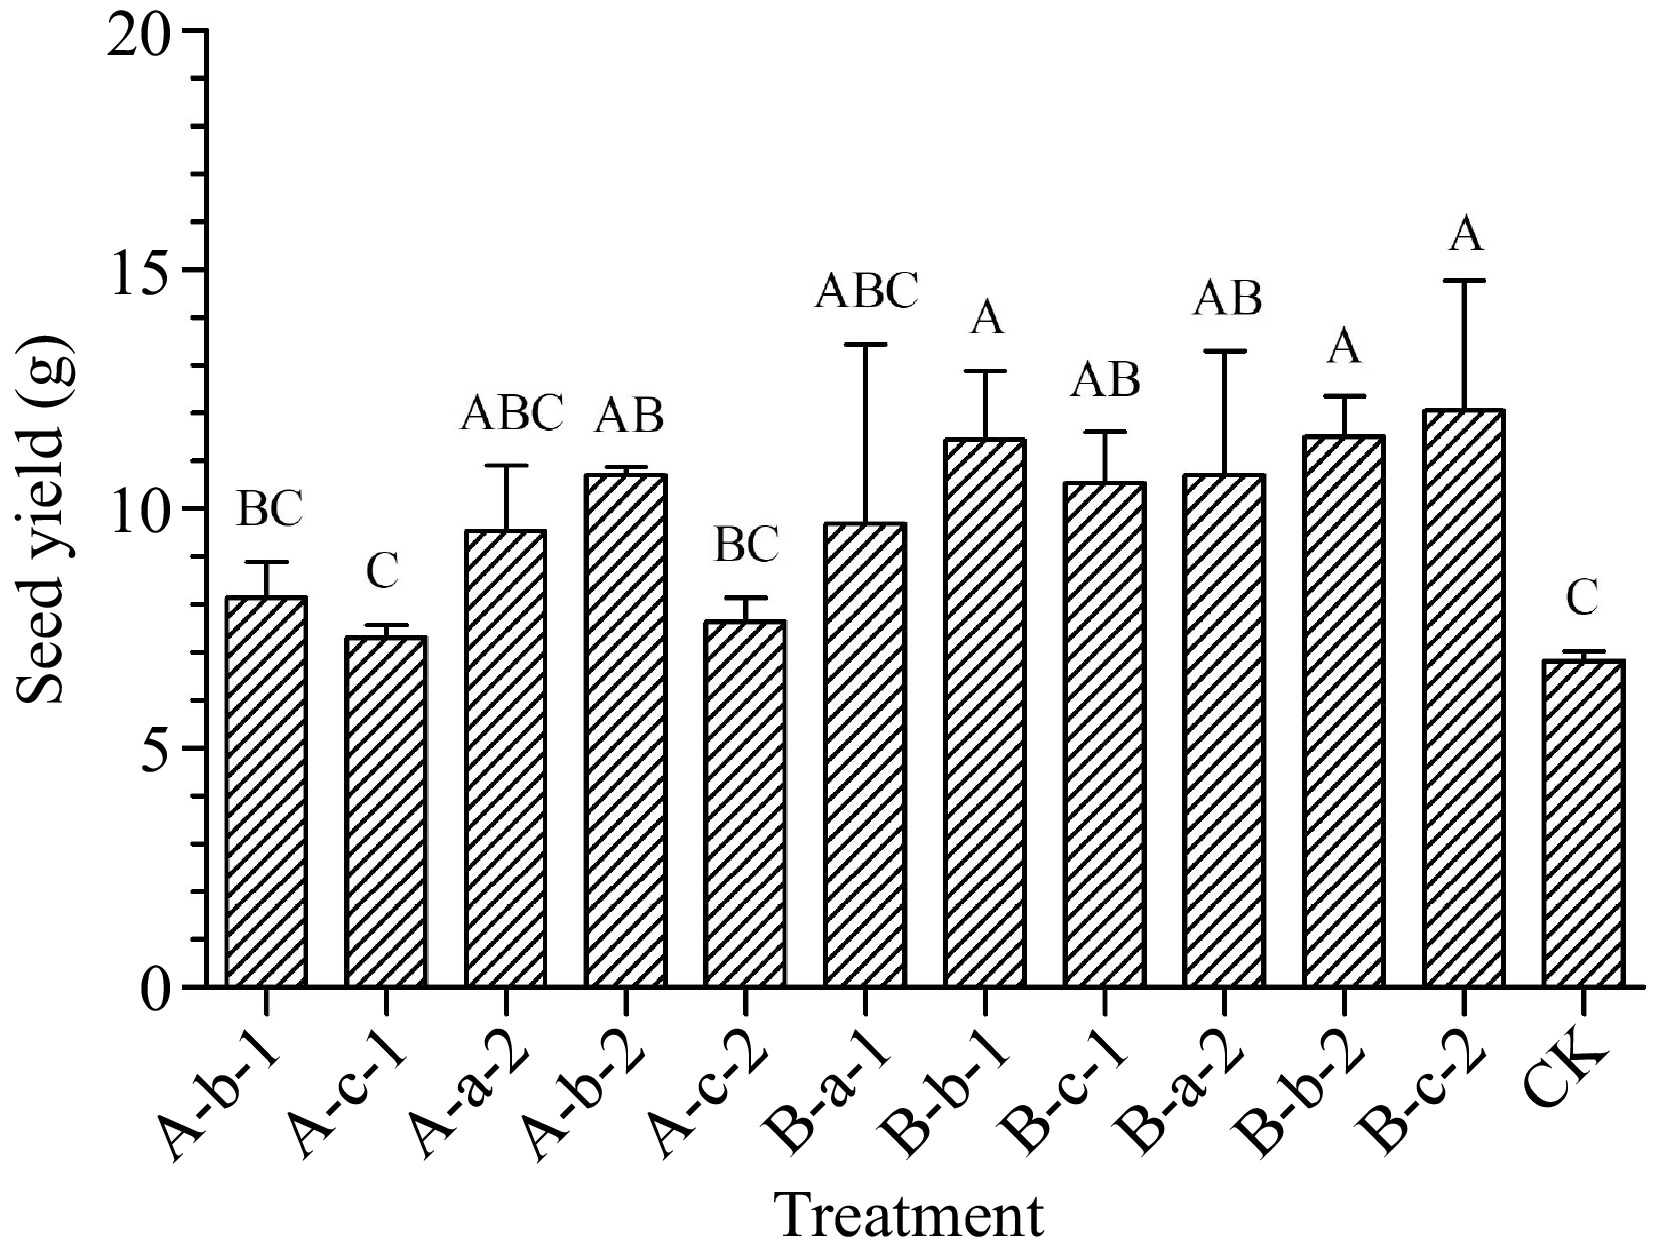
      Figure 3. 

      Effects of spraying reagents on seed yield in experimental plots. The content in the abscissa is the same as Fig. 1.

    • All treatments increased potential seed yield compared to the control group (p < 0.05) (Table 3). Among them, 100 mg/L DIECA + 50 mg/L NAA, 100 mg/L DIECA + 100 mg/L NAA, and 100 mg/L DIECA + 150 mg/L NAA have the most significant treatment effects. Potential seed yields of the three treatments increased by an average of 122%, 136%, and 121% respectively. Potential seed yield, actual seed yield, and seed yield coefficient is shown in Table 3.

      Table 3.  Seed yield in each group.

      TreatmentPotential seed yield (g/m2)Actual seed yield
      (g/m2)
      Seed yield coefficient
      A-b-144.97c32.58bc72%
      A-c-148.70c22.04c60%
      A-a-242.15c38.13abc90%
      A-b-253.74bc42.84ab80%
      A-c-247.44c30.53bc64%
      B-a-162.93ab38.80abc62%
      B-b-165.96ab45.78a69%
      B-c-163.67ab42.18ab66%
      B-a-267.71a42.82ab63%
      B-b-272.40a46.00a64%
      B-c-267.62a48.22a71%
      CK30.56d27.29d89%
      Values with superscript letters a, b, c and d are significantly different within columns (p < 0.05).
    • All treatments increased actual seed yield compared with the control group (p < 0.05) (Fig. 4). Among them, three treatments showed the best results. The actual seed yield showed 68% increase under 150 mg/L DIECA + 100 mg/L NAA treatment, 69% increase under 100 mg/L DIECA + 100 mg/L NAA treatment, and 77% increase under 100 mg/L DIECA + 150 mg/L NAA treatment.
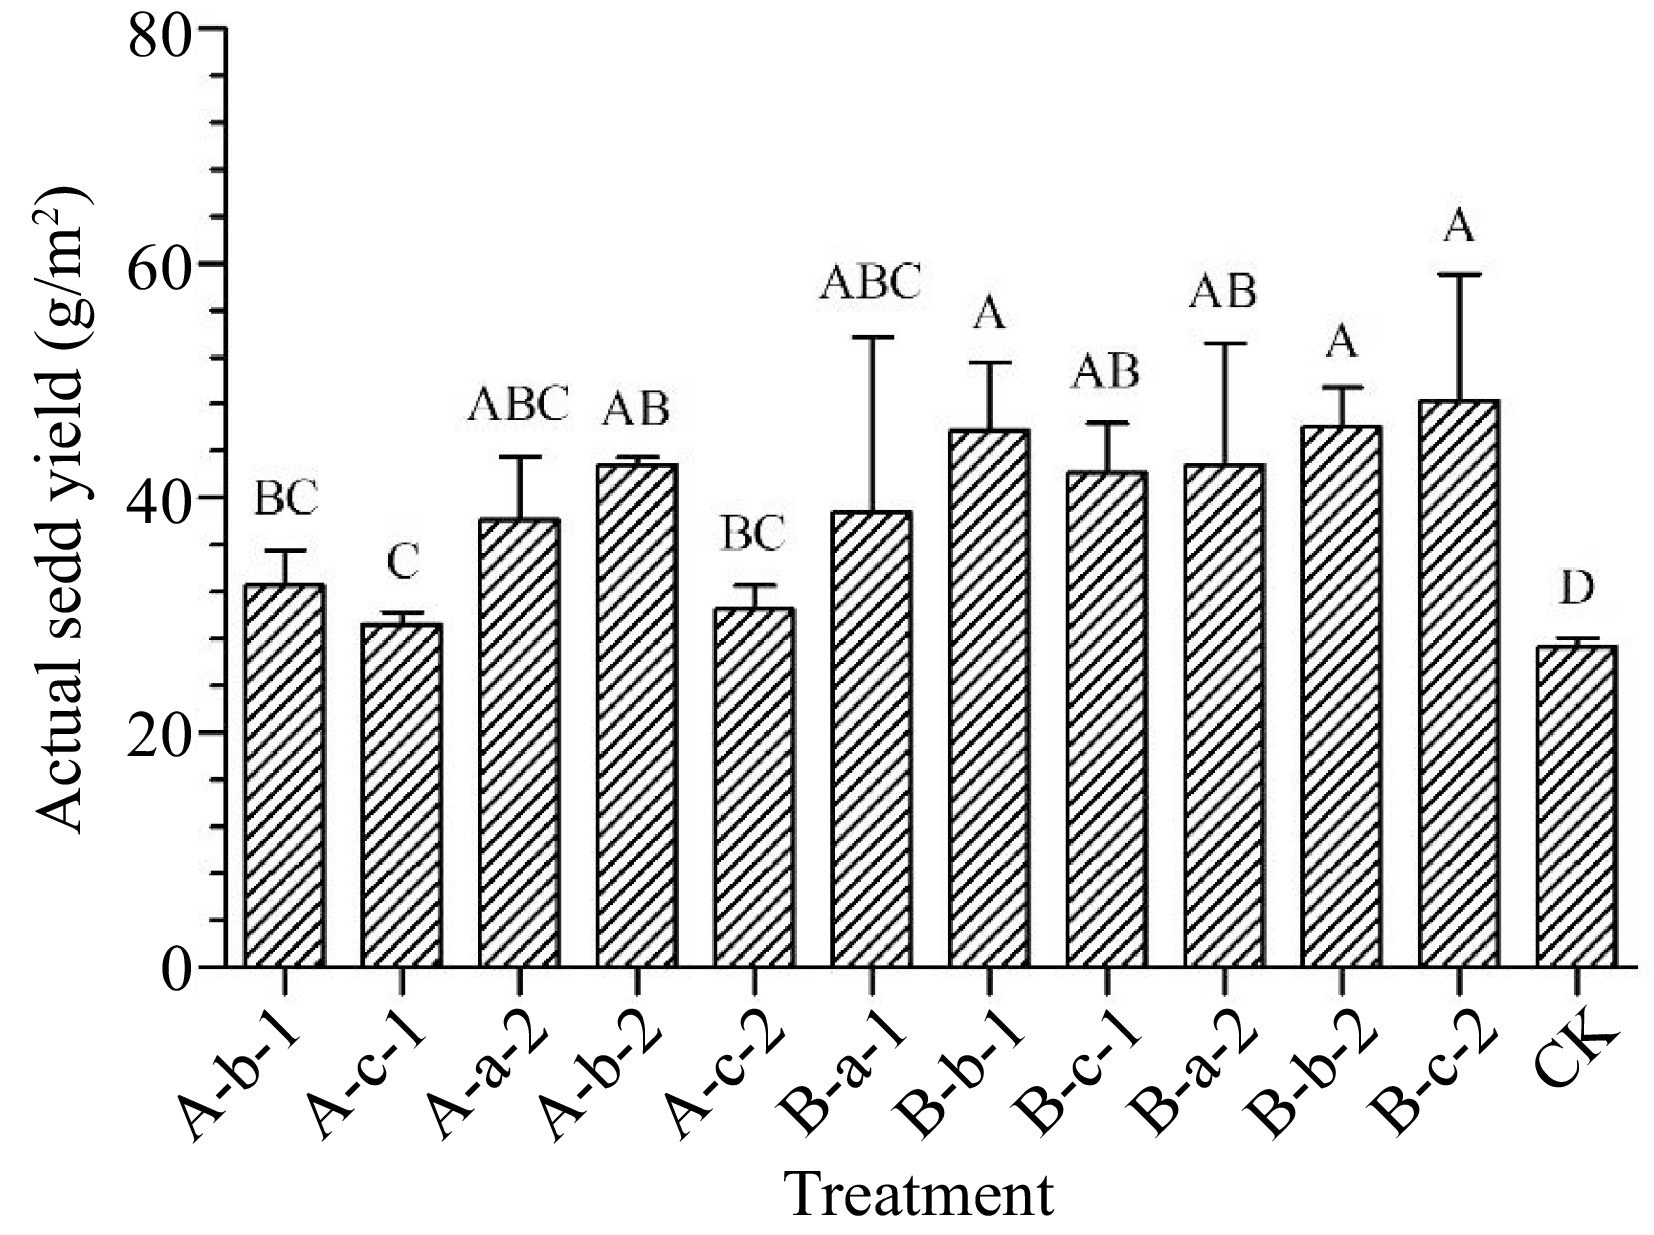
      Figure 4. 

      Effects of spraying reagents on actual seed yield. Note: The content in the abscissa is the same as Fig. 1.

      To comprehensively compare the changes in the female to male ratio and seed yield under various treatments and select the treatment with the best effect, Table 4 was created. Under the treatments of 100 mg/L DIECA + 100 mg/L NAA and 100 mg/L DIECA + 150 mg/L NAA, the number of female fertile tillers, male-to-female ratio, potential seed yield, and the actual seed yield of the treatment groups are significantly higher than control groups, even higher than several treatment groups (Table 4). It can therefore be concluded that these two treatments are effective methods to increase the female-to-male ratio and seed yield of buffalograss under field conditions.

      Table 4.  Sex differentiation and seed yield of each treatment group.

      TreatmentFFTFFRFMPSYASYSum
      A-b-10
      A-c-10
      A-a-20
      A-b-20
      A-c-20
      B-a-1A1
      B-b-1AA2
      B-c-1A1
      B-a-2AAA3
      B-b-2AAAA4
      B-c-2AAAA4
      If the significance of the treatment was marked as 'A' in Duncan's multiple range test, it is marked as 'A' in the table, otherwise it is marked as a '–'. The abbreviations in the column headings represent the following content. FFT: Female fertile tillers; FF: Female florets; RFM: Ratio of female to male; PSY: Potential seed yield; ASY: Actual seed yield; Sum: Total number of 'A'.
    • Compared with the control group, except for the two treatments of 100 mg/L DIECA and 100 mg/L NAA, all other treatments significantly increased the female-to-male ratio of the test materials (p < 0.05) (Fig. 5). Among them, the 150 mg/L DIECA + 150 mg/L NAA, 100 mg/L DIECA + 50 mg/L NAA, 100 mg/L DIECA + 100 mg/L NAA, and 100 mg/L DIECA + 150 mg/L NAA treatments had the most significant effect on increasing the male-female ratio (Fig. 5). Compared with the control group, the female to male ratio of the four treatments increased by an average of 107%, 105%, 130%, and 118% respectively.
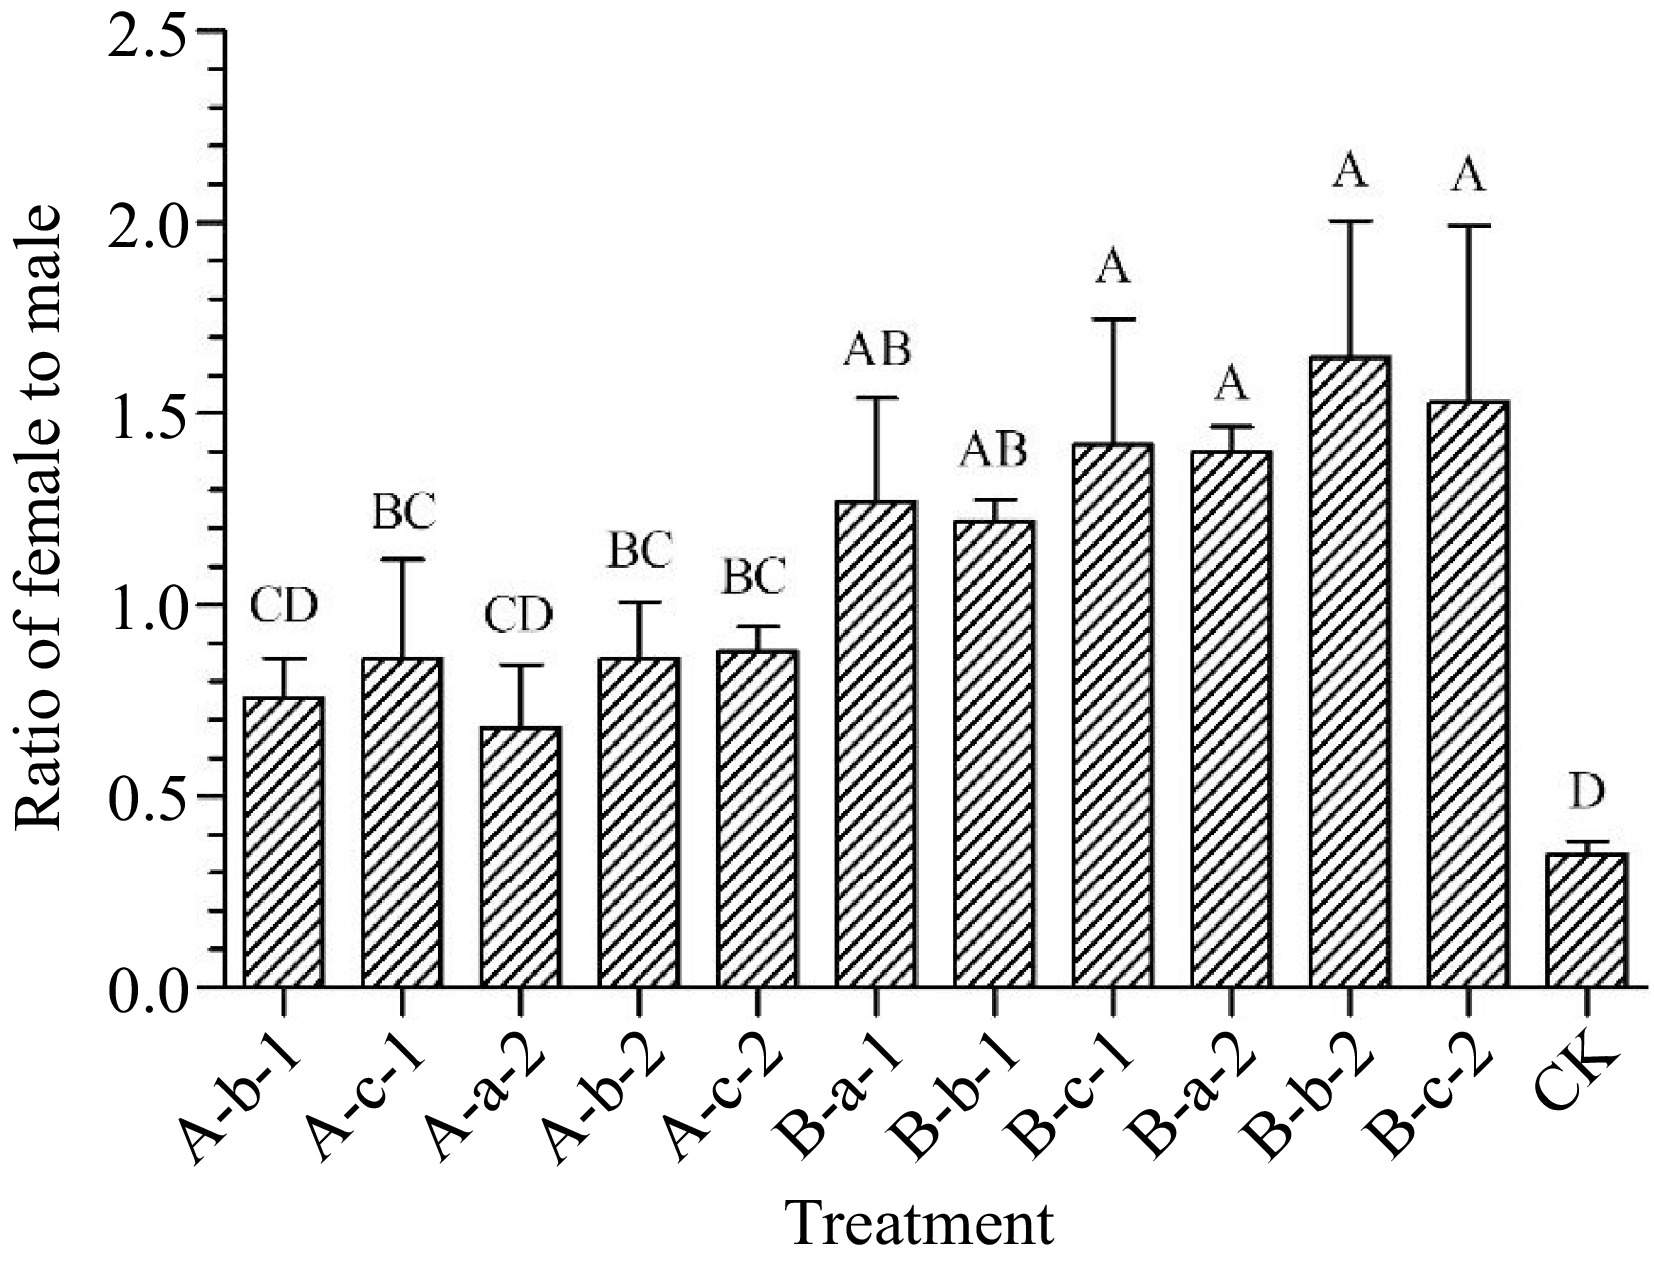
      Figure 5. 

      Effects of spraying reagents on ratio of female to male. Note: The content in the abscissa is the same as Fig. 1.

    • At 6, 12, and 24 h after spraying the reagents, the endogenous JA content in the leaves under all treatments was significantly lower than that of the control (p < 0.05) (Table 5). Six hours after spraying the reagents, the effect was most significant under the treatment of 150 mg/L DIECA and 150 mg/L NAA. The endogenous JA content in plant leaves of treatments mentioned above decreased by 60% and 58% compared with the control. The effect was most significant under the treatment of 150 mg/L DIECA + 50 mg/L NAA 12 h after spraying the reagents. The endogenous JA content in plant leaves decreased by 65% compared with the control. The effect was most significant under 150 mg/L NAA treatment 24 h after spraying the reagents. The endogenous JA content in plant leaves decreased by 57% compared to the control.

      Table 5.  Endogenous JA content in leaves, 6, 12, 24 h after treatment.

      TreatmentsJA content (ng/g FW)
      6 h12 h24 h
      A-b-119.0219.7026.97
      A-c-111.1516.3121.51
      A-a-218.8720.4125.04
      A-b-212.8613.5412.95
      A-c-211.6714.7612.11
      B-a-115.749.6720.12
      B-b-118.1318.9814.80
      B-c-114.4617.4020.79
      B-a-219.9615.7719.94
      B-b-214.4414.5118.43
      B-c-213.5019.5317.14
      CK27.90*27.90*27.90*
      '*' indicates that the treatment is significantly different from other groups within column.

      At 6, 12, and 24 h after spraying the reagents, the endogenous JA content of the plant roots under all treatments was significantly lower than the control (p < 0.05) (Table 6). Six hours after spraying the reagents, the effect was most significant under the treatment of 150 mg/L DIECA + 150 mg/L NAA. The endogenous JA content in plant roots was reduced by 54% compared to the control. The effect was most significant under the treatment of 100 mg/L DIECA + 50 mg/L NAA 12 h after spraying the reagents. The endogenous JA content in plant roots decreased by 44% compared to the control. Twenty four hours after spraying the reagents, the most significant effect was achieved under the treatment of 100 mg/L DIECA + 150 mg/L NAA. The endogenous JA content in the plant roots was reduced by 57% compared to the control.

      Table 6.  Endogenous JA content in roots, 6, 12, 24 h after treatment.

      TreatmentsJA content (ng/g FW)
      6 h12 h24 h
      A-b-16.426.856.78
      A-c-16.408.456.40
      A-a-28.268.088.22
      A-b-27.597.306.18
      A-c-25.388.775.75
      B-a-16.095.976.64
      B-b-15.566.126.40
      B-c-14.547.628.16
      B-a-28.435.445.14
      B-b-26.315.704.22
      B-c-25.699.257.30
      CK9.80*9.80*9.80*
      '*' indicates that the treatment is significantly different from other groups within column.
    • NAA is a synthetic plant growth regulator that promotes early flowering[36], increases female flowers[37], delays maturity[38] and increases yield[39]. At present, most research on NAA focuses on its effects on plant secondary metabolites using plant tissue culture. The basic research method involves adding NAA and other plant growth regulators to Murashige and Skoog (MS) medium[40,41].

      Appropriate concentrations of NAA treatments have been shown to increase the content of monoterpene glycosides in Telekia speciose multi-branch buds[42], terpenoid content in the buds of the South African medicinal plant Sutherlandia Frutescens[43], callus formation in Prunella vulgaris L[44], and flavonoid content in non-regenerating callus of Sterculia urens[41]. NAA enhanced the antioxidant activity of plants, by increasing the activities of peroxidase (POD), catalase (CAT), and superoxide dismutase (SOD) in plants after treatments[44]. Studies have demonstrated that the oxygen free radical antioxidant capacity (ORAC) of soybean sprouts (Glycine max (Linn.) Merr.) is higher in the first three days after NAA treatment compared to the control[45], providing evidence of NAA' s positive effects on plant antioxidant activity. The present study found that spraying 100 mg/L and 150 mg/L NAA significantly increased the female-to-male ratio of buffalograss and significantly increased seed yield. Fifty mg/L and 100 mg/L NAA treatments did not significantly increase the number of spikes but significantly increased the number of female florets. Therefore, it can be inferred that exogenous NAA may have a promoting effect on the reproductive growth of buffalograss plants, but it may have an inhibitory effect on the development of male flowers.

    • JA and its derivatives are widely distributed in various organs of plants[46]. Some studies suggest that JA may play a role in the sex determination process in corn. TS1 and TS2 are key genes for tassel development in maize (Zea mays L.). The loss of any one of them will lead to failure of tassel sex determination, resulting in tassel seeding ts1 (tasselseed1) and ts2 (tasselseed2) mutants[47]. Acosta et al.[48] found that the activity of 13-lipoxygenase (13-LO) disappeared in the developing inflorescences of the ts1 mutant, and the endogenous JA concentration was reduced to one-tenth that of wild-type maize. External application of JA to the developing inflorescences of ts1 and ts2 mutants restored the development of stamens, indicating that the lack of JA is the cause of the mutant phenotype and is closely related to maize stamen development[49]. Furthermore, studies have demonstrated that the expression of the TS2 gene in maize reproductive organs is significantly higher than in vegetative organs. NAA significantly inhibited the expression of TS2 gene. Therefore, the authors propose that the TS2 gene is a plant sex-determining gene that is mediated by JA signaling[50]. A homologous gene, BdTs2, of the maize TS2 gene, is also present in buffalograss. Higher expression of BdTs2 in male inflorescences leads to the abortion of pistils and the development of unisexual male flowers. BdTs2 is specifically expressed in the reduced pistil group of male flowers, but not in other floral organs of the inflorescence[51]. Based on the above results, it is inferred that the expression pattern of the TS2 gene in buffalograss is consistent with that in corn, and its high expression promotes male-oriented sex expression of buffalograss. Additionally, the expression level of the TS2 gene may be influenced by the content of endogenous or exogenous JA.

      DIECA likely inhibits the JA pathway by shunting 13 (S)-hydroperoxylinolenic acid to 13-hydroxylinolenic, thereby sharply reducing the precursor pool leading to cyclization and eventual synthesis of JA[52]. In this study, DIECA solution was sprayed on buffalograss plants. The treatment groups showed significantly higher numbers of female fertile tillers, female florets, and seed yield compared to the control group. These results align with previous research and inferences, suggesting that DIECA reduces the endogenous JA content in buffalograss and inhibits the expression of the TS2 gene by inhibiting endogenous JA biosynthesis. This inhibition allows for the development of some female flowers without hindrance, thereby increasing the female ratio and seed yield. The combined use of NAA and DIECA also promotes a higher female-to-male ratio and increases seed yield, with a stronger effect observed when the two are used together.

      Taking the treatment with the most significant effect as an example. Two liters of 100 mg/L DIECA + 100 mg/L NAA solution was sprayed in a 4 m2 plot and it was sprayed seven times. The total cost of reagents per hectare equals USD$280. Prices for commercially purchased reagents might be lower. In this study, the actual seed yield under 100 mg/L DIECA + 100 mg/L NAA treatment was 180 kg per hectare more than that of the control. Since sex expression in buffalograss is stable across various environmental conditions, the sex of buffalograss plants might be fixed after the finish of sex determination process. It would be commercially acceptable to apply treatment just in the first year after sowing.

      This study represents the first application of the reagents NAA and DIECA on buffalograss. The effects of these reagents on the number of male and female fertile tillers, the number of male and female florets, and seed yield were statistically analyzed. Additionally, a preliminary investigation was conducted on the effects of NAA and DIECA on the endogenous JA concentration in buffalograss leaves and roots. These findings provide an innovative, simple, and effective method for artificially regulating the female-to-male ratio of buffalograss in field production to increase seed yield.

    • The present results show that spraying NAA, DIECA or a mixture of the two on buffalograss plants under field conditions significantly increased the number of female fertile tillers, the number of female florets, and significantly increased the female-to-male ratio, and seed yield. At the same time, it significantly reduced the number of male fertile tillers and the number of spikes. The results of endogenous JA content showed that spraying these two reagents reduced the endogenous JA content of buffalograss plants. Different reagents have different effects on regulating the endogenous JA content of buffalograss plants at different concentrations and proportions. In addition, the changes in endogenous JA content of buffalograss were also different at 6, 12, and 24 h after spraying the reagents.

    • The authors confirm contribution to the paper as follows: study conception: Zhu K, Wang C; writing – review & editing, writing – original draft, resources, project administration, formal analysis: Zhu K; data curation: Zhu K, Li Y; methodology: Hu QN; data collection: Ren XF; supervision, resources, funding acquisition: Sun Y. All authors reviewed the results and approved the final version of the manuscript.

    • The datasets generated during and/or analyzed during the current study are not publicly available due the fact that the results of this study are the basic data for subsequent studies but are available from the corresponding author on reasonable request.

      • This research was funded by the China Agriculture Research System (CARS-34-03).

      • The authors declare that they have no conflict of interest.

      • Supplemental Table S1 Effects of exogenous DIECA on potential seed yield, actual seed yield and female to male ratios of buffalograss in 2022.
      • Copyright: © 2024 by the author(s). Published by Maximum Academic Press, Fayetteville, GA. This article is an open access article distributed under Creative Commons Attribution License (CC BY 4.0), visit https://creativecommons.org/licenses/by/4.0/.
    Figure (5)  Table (6) References (52)
  • About this article
    Cite this article
    Zhu K, Wang C, Li Y, Hu QN, Ren XF, et al. 2024. Exogenous spraying of Naphthaleneacetic acid (NAA) and Sodium diethyldithiocarbamate trihydrate (DIECA) increased the female to male ratio and seed production of buffalo grass. Grass Research 4: e014 doi: 10.48130/grares-0024-0012
    Zhu K, Wang C, Li Y, Hu QN, Ren XF, et al. 2024. Exogenous spraying of Naphthaleneacetic acid (NAA) and Sodium diethyldithiocarbamate trihydrate (DIECA) increased the female to male ratio and seed production of buffalo grass. Grass Research 4: e014 doi: 10.48130/grares-0024-0012

Catalog

  • About this article

/

DownLoad:  Full-Size Img  PowerPoint
Return
Return