ARTICLE   Open Access    

Identification and content analysis of volatile components in 100 cultivars of Chinese herbaceous peony

  • # Authors contributed equally: Aixin Wang, Yasang Luo

More Information
  • Herbaceous peony (Paeonia lactiflora Pall.) is a well-known and traditional flower in China, occupying a significant position in Chinese traditional culture. The floral scent of the herbaceous peony however remains relatively understudied. The objective of this study was to investigate the floral composition of herbaceous peony by collecting and identifying floral volatiles from 100 cultivars, including P. lactiflora 'Hangbaishao', P. lactiflora 'Hongrongqiu', P. lactiflora 'Biandihong', P. lactiflora 'Zijin Daipao', P. lactiflora 'Zixia Yingxue', and P. lactiflora 'Fenchi Dicui'. The volatile compounds were collected using the dynamic headspace technique and identified through gas chromatography-mass spectrometry (GC-MS). The results demonstrated qualitative and quantitative variations in the floral fragrances emitted by the 100 cultivars, with a total of 16 volatiles belonging to six categories (six alkanes, three alcohols and esters, two terpenes, as well as one each of ether and phenol) being identified. However, it is notable that not all volatile categories were emitted by every cultivar. Moreover, while some compounds were present in all 100 herbaceous peony cultivars, others were exclusive to specific cultivars. The screening revealed that ten of the 16 identified flower volatile compounds exhibited unique floral components. It is noteworthy that benzene,1,4-dimethoxy-, was identified as the most prominent compound in several cultivars, including P. lactiflora 'Taohua Huancai', P. lactiflora 'Xishifen', P. lactiflora 'Dabanhong', P. lactiflora 'Fumantang', and P. lactiflora 'Zhushapan'. Furthermore, the clustering classification results demonstrated that benzene,1,4-dimethoxy-, exhibited the highest variable importance in projection (VIP) value of 3.153, as determined by partial least squares discriminant analysis (PLS-DA).
  • Agricultural management practices impact soil physicochemical properties to a remarkable extent. Degradation of soil health has led to a contraction in agricultural production and soil biodiversity particularly due to conventional farming practices, indiscriminate use of inorganic fertilizers (INF) and inadequate input of residues[1]. Organic or inorganic fertilizers have been regarded as a critical component of agriculture to accomplish global food security goals[2]. The exogenous supply of fertilizers could easily alter soil properties by restoring the nutrients that have been absorbed by the plants[2]. Thus, implementing adequate nutrient management strategies could boost plant yield and sustain plant health. Tillage affects the soil, especially for crop production and consequently affects the agro-ecosystem functions. This involves the mechanical manipulation of the soil to modify soil attributes like soil water retention, evapotranspiration, and infiltration processes for better crop production. Thus, tillage practices coupled with fertilizer inputs may prove a viable strategy to improve soil health components such as nutrient status, biodiversity, and organic carbon.

    Soil serves as a major reservoir of nutrients for sustainable crop production. Intensive cultivation due to growing population burden has led to the decline of soil nutrient status that has adversely affected agricultural production. Various researchers have assessed the soil nutrient budget and the reasons behind decline of nutrient content in soil[3]. Soil management strategies have assisted in overcoming this problem to a greater extent. Tillage practices redistribute soil fertility and improve plant available nutrient content due to soil perturbations[4]. Different tillage and fertilization practices alter soil nutrient cycling over time[5]. Fertilization is an important agricultural practice which is known to increase nutrient availability in soil as well as plants[6]. A report has been compiled by Srivastava et al.[7], which assessed the effectiveness of different fertilizers on soil nutrient status in Indian soils.

    Soil biota has a vital role in the self-regulating functions of the soil to maintain soil quality which might reduce the reliance on anthropogenic activities. Soil microbial activities are sensitive to slight modifications in soil properties and could be used as an index of soil health[8]. Maintenance of microbial activity is essential for soil resilience as they influence a diverse range of parameters and activities including soil structure formation, soil SOM degradation, bio-geochemical cycling of nutrients etc.[9]. Various researchers have identified microbial parameters like microbial biomass carbon (MBC), potentially mineralizable nitrogen (PMN), soil respiration, microbial biomass nitrogen (MBN), and earthworm population as potential predictors of soil quality. Geisseler & Scow[10] have compiled a review on the affirmative influence of long-term mineral fertilization on the soil microbial community.

    Being the largest terrestrial carbon (C) reservoir, soil organic carbon (SOC) plays a significant role in agricultural productivity, soil quality, and climate change mitigation[11]. Manure addition, either solely or along with INF augments SOC content which helps in the maintenance and restoration of SOM more effectively as compared to the addition of INF alone[12]. Enhancement of recalcitrant and labile pools of SOC could be obtained through long-term manure application accentuating the necessity of continuous organic amendments for building up C and maintaining its stability[13]. Generally, compared with manure addition, INF application is relatively less capable of raising SOC and its labile fractions[14]. Alteration in SOC content because of management strategies and/or degradation or restoring processes is more prominent in the labile fraction of soil C[15]. Several fractions of soil C play vital roles in food web and nutrient cycles in soils besides influencing many biological properties of soil[16]. Thus, monitoring the response of SOC and its fractions to various management practices is of utmost importance.

    A positive impact on SOC under manure application coupled with INF in rice-wheat systems has been reported, as compared to sole applications of INFs[17]. Although ploughing and other mechanical disturbances in intensive farming cause rapid OM breakdown and SOC loss[18], additional carbon input into the soil through manure addition and rational fertilization increases carbon content[13]. Wei et al.[19] in light sandy loam soil of China found that the inclusion of crop straw together with inorganic N, P and K fertilizers showed better results for improving soil fertility over sole use of inorganic fertilizers. Zhu et al.[20] studied the influence of soil C through wheat straw, farmyard manure (FYM), green manure, and rice straw on plant growth, yield, and various soil properties and found that the recycling of SOM under intensive cultivation is completely reliant on net OM input and biomass inclusion. However, most of the studies on residue management and organically managed systems could not provide clear views regarding the relations between the quality of OM inputs and biological responses towards it. The disintegration of soil aggregates due to ploughing, use of heavy machinery, and residue removal has been reported widely under conventional tillage (CT) practices[21]. On the contrary, improvement in SOC stabilization has also been observed by some scientists[22]. Under CT, the disintegration of macro-aggregates into micro-aggregates is a prominent phenomenon, while conservation tillage has been identified as a useful practice for increasing macro-aggregates as well as carbon sequestration in agricultural soils[23]. By and large, the ploughing depth (0–20 cm) is taken into consideration for evaluating the impact of tillage and straw retention on soil aggregation[24], while degradation in deeper layers of soil is becoming a major constraint towards soil quality together with crop yield[25].

    Hence, the present review would be useful in determining how tillage practices and inorganic and organic fertilization impact nutrient availability in the soil, microbial composition and SOC fractions besides stocks under different land uses.

    Agricultural production is greatly influenced by nutrient availability and thus nutrient management is required for sustaining higher yields of crop. The term 'nutrient availability' refers to the quantity of nutrients in chemical forms accessible to plant roots or compounds likely to be converted to such forms throughout the growing season in lieu of the total amount of nutrients in the soil. For optimum growth, different crops require specifically designed nutrient ratios. Plants need macronutrients [nitrogen (N), phosphorus (P), potassium (K) in higher concentrations], secondary nutrients [calcium (Ca), magnesium (Mg), sulphur (S) in moderate amounts as compared to macronutrients] and Micronutrients [Zn (zinc), Fe (iron), Cu (copper), B (boron), Mn (manganese), Mo (molybdenum) in smaller amounts] for sustainable growth and production[26]. Fertilizers assist the monitoring of soil nutrient levels by direct addition of required nutrients into the soil through different sources and tillage practices may alter the concentration of available plant nutrients through soil perturbations. Various studies on the influence of fertilization and tillage practices on available plant nutrients have been discussed below.

    Yue et al.[27] reported that long-term fertilization through manure/INF improved the macronutrient content of Ultisol soil in China. Two doses of NPK (2NPK) considerably improved soil properties over a single dose (NPK). Combined application (NPK + OM) resulted in higher hydrolysable N and available P over the sole OM application. The total K content was higher under the treatments NPK, 2NPK and NPK + OM than sole OM treatment, whereas available K was higher in treatments NPK + OM and 2NPK over the sole OM and NPK. Likewise, OM, INF, and OM + INF were evaluated for their potential to regulate the soil macronutrient dynamics. Organic manure significantly improved the soil N content, whereas INF showed comparable results to that of the control treatment. Besides, all the treatments improved available P and exchangeable K concentration[28].

    Hasnain et al.[29] performed comparative studies of different ratios of INF + compost and different application times for the chemical N fertilizer on silty loamy soils of China. The available nitrogen and phosphorous content were greater in conjoint OM + INF application over the bare INF and control application irrespective of N application time. Soil quality substantially improved with increasing ratio of compost and 70:30 (INF to compost ratio) was found to be most suitable to maintain soil fertility and nutrient status. Another study by Liu et al.[30] reported the superior effects of NPK + pig manure and NPK + straw to improve soil available P and K over the control and sole NPK treatments. However, total N concentration did not exhibit any significant variation under any treatment.

    Shang et al.[31] accounted the positive impact of vermicompost and mushroom residue application on grassland soil fertility in China. The addition of organic manures improved available P and K content to a considerable extent. Under moisture-deficit winter wheat-fallow rotation, another study quantified the influence of residue management approaches and fertilizer rate on nutrient accrual. Residue burning resulted in no decline in soil macronutrient content, whereas the perpetual addition of FYM for 84 years significantly improved total N and extractable K and P concentration. Thus, residue incorporation along with FYM application may prove beneficial in reducing the temporal macronutrient decline[32].

    Ge et al.[33] examined the effects of NPK and NPK along with manure (NPKM) addition on the macronutrient status of Hapli-Udic Cambisol soil. The NPKM application resulted in the highest increase in total N, available-P and K concentration as compared to NPK and control. Likewise, mineral fertilization reduction and partial substitution with organic amendments have posed a significant influence on soil macronutrient status. Soil available P and K decreased after INF reduction[34]. Chen et al.[35] evinced that integrated application of manure and mineral fertilizers to red clay soil (typical Ultisols) improved hydrolyzed nitrogen and available P due to an increase in the decomposition of organic matter (OM) and N bio-fixation than sole mineral fertilizers and control.

    A long-term experiment was carried out out by Shiwakoti et al.[36] to ascertain the influence of N fertilization and tillage on macronutrient dynamics in soil. Nitrogen fertilization produced higher crop biomass which might have improved total N and P concentration in soil. Moreover, the reduced interaction between soil colloids and residue or greater cation exchange sites due to tillage practices could have augmented K concentration in 0−10 cm soil depth. Likewise, among tillage systems combined organic (poultry manure) and inorganic (lime and fertilizers) fertilization, no-tillage, and reduced tillage with organic fertilization resulted in higher availability of P owing to minimal disturbance of soil which decreases contact surface between phosphate ions and adsorption sites. Greater losses of K in runoff water under NT resulted in lower K availability under NT than CT[37].

    The influence of tillage systems on soil nutrient dynamics showed that minimal soil disturbances under zero tillage prohibited redistribution of soil nutrients and resulted in the highest available N, P, and K in the surface soil[38]. The influence of tillage timing on soil macronutrient status has also been assessed under tillage treatments that are fall tillage (FT), spring tillage (ST), no tillage (NT), and disk/chisel tillage (DT/CT) on mixed mesic Typic Haploxerolls soil. All the tillage systems differed in the quantity of residues generated. Thus, variation in the decomposition of crop residue and mineralization of SOM resulted in variable rates of nutrient release. The FT and ST had the highest N content over DT/CT and NT systems at corresponding depth. The N content also decreased with soil depth irrespective of tillage treatment. The available P and extractable K were highest under NT at the top 10 cm soil depth and increased over time[39]. Residue management in combination with tillage treatments (ST and CT) has been reported to affect the soil macronutrient status in Bangladesh. Tillage treatments enhanced the total N content to a considerable extent. Moreover, 3 years of residue retention led to a higher concentration of total N, available P and K in the soil.

    The combinations of N, P, and K in different ratios together with two rates of organic fertilizer (OF) applied on the aquic Inceptisol having sandy loam texture influenced the micronutrient status of the soil[40]. Soil Zn content decreased with time when no fertilizer was applied as compared to organic fertilizer (OF) application. The mineral fertilizer treatments led to a substantial increase in DTPA-extractable micronutrients in the soil. The higher micronutrient concentration due to higher OM highlights the importance of maintaining OM for soil fertility and higher crop production. Further studies revealed that long-term application of sole N fertilizers led to a significant decline in total Zn and Cu, whereas Mn and Fe status improved through atmospheric deposition. Phosphorus and OF addition along with straw incorporation markedly increased total Zn, Cu, Fe, and Mn. The DTPA-extractable Mn, Zn, Fe, and Cu were also higher in OF treatment, thus demonstrating the beneficial effects of constant OM application for maintaining the nutrient status of soil[41].

    López-Fando & Pardo[42] quantified the impact of various tillage practices including NT, CT, minimum tillage (MT), and zone-tillage (ZT) on soil micronutrient stocks. Tillage systems did exhibit a significant influence on plant available Fe stocks in the topsoil; however, diminished with depth under ZT, NT and MT. Manganese was higher in NT and ZT at all depths and increased with soil depth. Zinc was highest under NT and other results did not vary significantly as in the case of Cu. The SOC levels were also found to be responsible to affect micronutrients due to tillage practices. Likewise, in Calciortidic Haploxeralf soil the distribution of soil micronutrients (Zn, Mn, Fe, Cu) was ascertained under different tillage practices (CT, MT, and NT). The micronutrient status was highest under NT in the upper layers due to the higher SOC level[43].

    Sharma & Dhaliwal[44] determined that the combined application of nitrogen and rice residues facilitated the transformation of micronutrients (Zn, Mn, Fe, Cu). Among different fractions, the predominant fractions were crystalline Fe bound in Zn, Mn, and Cu and amorphous Fe oxide in Fe with 120 kg N ha˗1 and 7.5-ton rice residue incorporation. The higher content of occluded fractions adduced the increment in cationic micronutrient availability in soil with residue incorporation together with N fertilization due to increased biomass. Rice straw compost along with sewage sludge (SS) and INF also affected the micronutrient availability under the RW cropping system. Nitrogen fertilization through inorganic fertilizers and rice straw compost and sewage sludge (50% + 50%) improved soil micronutrient status due to an increase in SOM over sole NPK fertilizers[45]. Earlier, Dhaliwal et al.[46] in a long-term experiment determined that different combinations of NPK along with biogas slurry as an organic source modified the extractable micronutrient status of the soil.

    A comparative study was carried out by Dhaliwal et al.[47] to ascertain the long-term impact of agro-forestry and rice–wheat systems on the distribution of soil micronutrients. The DTPA-extractable and total Cu, Zn, Fe, and Mn were greater in the RW system due to the reduced conditions because of rice cultivation. Under the RW system Zn removal was higher which was balanced by continuous Zn application. The higher availability of Fe under the RW system was due to reduced conditions. Contrarily, Mn was greater under the agro-forestry system owing to nutrient recycling from leaf litter.

    The long-term impact of integrated application of FYM, GM, WCS (wheat-cut straw) and INF on the soil micronutrients (Zn, Mn, Cu, and Fe) have been studied by Dhaliwal et al.[48]. The FYM application substantially improved DTPA-extractable Zn status followed by GM and WCS, whereas Cu content was maximum in the plots with OM application. The highest Fe concentration was recorded in treatment in which 50% recommended N supplied through FYM. This could be ascribed to the release of micronutrients from OM at low soil pH.

    Shiwakoti et al.[49] studied the dual effects of tillage methods (MP, DP, SW) and variable rates of N (0, 45, 90, 135 and 180 kg ha−1) on the distribution of micronutrients under a moisture-deficit winter wheat-fallow system. The soil Mn content was highest under the DP regime. Inorganic N application reduced Cu content in the soil. Comparative studies with adjacent undisturbed grass pasture indicated the loss of Zn and Cu to a significant extent. Thus, DP along with nitrogen added through inorganic fertilizers could improve micronutrient concentration in the soil. Moreover, the results implied that long-term cultivation with nitrogen fertilization and tillage results in the decline of essential plant nutrients in the soil. Thus, organic amendments along with INF may prove an effective approach to increase soil micronutrient content. In another study conducted by Lozano-García & Parras-Alcántara[50] tillage practices such as NT under apple orchard, CT with the wheat-soybean system and puddling (PD) in the rice-rice cropping system were found to affect nutrient status. Under CT, Cu content was lowest and Zn content was highest. On the contrary, puddling caused an increase in Fe and Mn concentration owing to the dispersion of soil aggregates which reduced the percolation of water and created an anaerobic environment thereby enhancing the availability of Fe and Mn.

    Tillage practices along with gypsum fertilization have been known to affect secondary nutrient concentrations in soil. In a long-term experiment, FYM application showed maximum response to increased S concentration due to the maximum addition of OM through FYM over other treatments as S is an essential component of OM and FYM[32]. Higher Mg content was recorded in FYM and pea vine treatments because the application of organic matter through organic manure or pea vines outright led to Mg accrual. The lower Mg concentration in topsoil than the lower layers was due to the competition between Mg and K for adsorbing sites and thus displacement of Mg by K. Han et al.[28] while ascertaining the impact of organic manures and mineral fertilizers (NPK) on soil chemical attributes determined that INF application reduced exchangeable calcium, whereas no significant changes were exhibited in the magnesium concentrations. The OM application significantly increased both the calcium and magnesium concentrations in the soil.

    While ascertaining the effect of different tillage treatments such as CT, NT, and MT on exchangeable and water-soluble cations, Lozano-García & Parras-Alcántara[50] recorded that NT had greater content of exchangeable Ca2+ and Mg2+ than MT and CT. The exchangeable Ca2+ decreased with depth, however, opposite results were observed for Mg2+ which might be due to the higher uptake of Mg2+ by the crop. On another note, there might be the existence of Mg2+-deficient minerals on the surface horizon. Alam et al.[51] studied the temporal effect of tillage systems on S distribution in the soil and observed that available S was 19%, 31%, and 34% higher in zero tillage than in minimum tillage, conventional tillage, and deep tillage, respectively.

    Kumar et al.[38] appraised the impact of tillage systems on surface soil nutrient dynamics under the following conditions: conventional tillage, zero till seeding with bullock drawn, conventional tillage with bullock drawn seeding, utera cropping and conservation tillage seeding with country plough and observed that tillage had a significant impact on the available S content. Compared with conventional tillage, zero and minimum tillage had higher S content as there was none or limited tillage operations which led to the accumulation of root stubble in the soil that decomposed over time and increased S concentration.

    Soil is considered a hotspot for microbial biodiversity which plays an important role in building a complex link between plants and soil. The microbial components exhibit dynamic nature and, therefore, are characterized as good indicators of soil quality[52]. These components include MBC, MBN, PMN and microbial respiration which not only assist in biological transformations like OM conversion, and biological nitrogen fixation but also increase nutrient availability for crop uptake. Management strategies such as fertilizer inputs and tillage practices may exert beneficial effects on soil biota as discussed below.

    Soil is an abode to a considerable portion of global biodiversity. This biodiversity not only plays a pivotal role in regulating soil functions but also provides a fertile ground for advancing global sustainability, especially agricultural ventures. Thus, the maintenance of soil biodiversity is of paramount importance for sustaining ecosystem services. Soil biodiversity is the diverse community of living creatures in the soil that interact not only with one another but also with plants and small animals to regulate various biological activities[53]. Additionally, it increases the fertility of soil by converting organic litter to SOM thereby enhancing SOC content. Thus, the SOM measures the number and activity of soil biota. Furthermore, the quality and amount of SOC, as well as plant diversity have a considerable impact on the soil microbial community structure[54].

    Dangi et al.[55] ascertained the impact of integrated nutrient management and biochar on soil microbial characteristics and observed that soil amended with biochar or the addition of organic manures influenced microbial community composition and biomass and crop yield. After two years, the higher rates of biochar significantly enhanced the levels of gram-positive and gram-negative bacterial phospholipid fatty acid (PLFA), total arbuscular mycorrhizal fungal (AMF) than lower rates, unfertilized and non-amended soil. Luan et al.[56] conducted a comparison study in a greenhouse to assess the effects of various rates of N fertilizer and kinds (inorganic and organic) on enzyme activities and soil microbial characteristics. Microbial growth (greater total PLFAs and microbial biomass carbon) and activity were promoted by manure substitution of mineral fertilizer, particularly at a higher replacement rate. On account of lower response in bacterial over fungal growth, manure addition led to a greater fungi/bacteria ratio. Furthermore, manure application significantly enhanced microbial communities, bacterial stress indicators and functional diversity. Lazcano et al.[57] determined the influence of different fertilization strategies on microbial community structure and function, soil biochemical properties and crop yield three months after addition of fertilizer. The integrated fertilizer regimes augmented microbial growth with improved enzyme activity as compared to sole inorganic amendments. Bacterial growth showed variable response with variation in fertilizer regime used whereas fungal growth varied with the amount of fertilizer added. Compared to mineral fertilizers, manure application led to a rapid increase in PLFA biomarkers for gram-negative bacteria. The organic amendments exhibited significant effects even at small concentration of the total quantity of nutrients applied through them; thus, confirming the viability of integrated fertilizer strategies in the short term.

    Kamaa et al.[58] assessed the long-term effect of crop manure and INF on the composition of microbial communities. The organic treatments comprised of maize (Zea mays) stover (MS) at 10 t ha−1 and FYM @ 10 t ha−1, INF treatments (120 kg N, 52.8 kg P-N2P2), integrated treatments (N2P2 + MS, N2P2 + FYM), fallow plot and control. The treatment N2P2 exhibited unfavourable effects on bacterial community structure and diversity that were more closely connected to the bacterial structure in control soils than integrated treatments or sole INF. In N2P2, fungal diversity varied differently than bacterial diversity but fungal diversity was similar in the N2P2 + FYM and N2P2 + MS-treated plots. Thus, the total diversity of fungal and bacterial communities was linked to agroecosystem management approaches which could explain some of the yield variations observed between the treatments. Furthermore, a long-term experiment was performed by Liu et al.[59] to study the efficiency of pig manure and compost as a source for N fertilization and found unique prokaryotic communities with variable abundance of Proteobacteria under compost and pig manure treatments.

    Recently, Li et al.[60] assessed the influence of different tillage practices (no-tillage, shallow tillage, deep tillage, no-tillage with straw retention, shallow tillage with straw retention and deep tillage with straw retention) on microbial communities and observed that tillage practices improved the bacterial Shannon index to a greater extent over the no-tillage plots in which the least value was recorded. Another research study by He et al.[61] reported the effect of tillage practices on enzyme activities at various growth stages. Across all the growth stages, enzyme activities of cellobiohydrolase (CBH), β-xylosidase (BXYL), alkaline phosphatase (AP), β-glucosidase (BG), β-N-acetylglucosamines (NAG) were 17%−169%, 7%−97%, 0.12%−29%, 3%−66%, 23%−137% greater after NT/ST, NT, ST, ST/PT, and PT/NT treatments as compared to plow tillage. The NT/ST treatment resulted in highest soil enzyme activities and yield, and thus was an effective and sustainable method to enhance soil quality and crop production.

    Microbes play a crucial role in controlling different soil functions and soil ecology and microbial community show significant variation across as well as within the landscape. On average, the total biomass of microbes exceeds 500 mg C kg soil−1[62]. Microbial biomass carbon is an active constituent of SOM which constitutes a fundamental soil quality parameter because SOM serves as a source of energy for microbial processes and is a measure of potential microbial activity[48,63]. Soil systems that have higher amounts of OM indicate higher levels of MBC. Microbial biomass carbon is influenced by many parameters like OM content in the soil, land use, and management strategies[64]. The MBC and soil aggregate stability are strongly related because MBC integrates soil physical and chemical properties responds to anthropogenic activities.

    Microbial biomass is regarded as a determinative criterion to assess the functional state of soil. Soils having high functional diversity of microbes which, by and large, occurs under organic agricultural practices, acquire disease and insect-suppressive characteristics that could assist in inducing resistance in plants[65]. Dou et al.[66] determined that soil microbial biomass C (SMBC) was 5% to 8% under wheat-based cropping systems and zero tillage significantly enhanced SMBC in the 0−30 cm depth, particularly in the upper 0 to 5 cm. According to Liang et al.[67], SMBC and soil microbial biomass N (SMBN) in the 0−10 cm surface layer were greater in the fertilized plots in comparison to the unfertilized plots on all sampling dates whereas microbial biomass C and N were highest at the grain filling stage. Mandal et al.[68] demonstrated that MBC also varied significantly with soil depth. Surface soil possessed a maximum MBC value than lower soil layers due to addition of crop residues and root biomass on the surface soil. The MBC content was highest with combined application of INF along with farmyard manure and GM, whereas untreated plots showed minimum MBC values. The incorporation of CR slows down the rate of mineralization processes; therefore, microbes require more time to decompose the residues and utilize the nutrients released[69]. On the other hand, incorporation of GR having a narrow C:N ratio enhances microbial activity and consequently accelerates mineralization in the soil. Malviya[70] also recorded that the SMBC contents were significantly greater under RT than CT, regardless of soil depth which was also assigned to residue incorporation which increases microbial biomass on account of higher carbon substrate in RT.

    Naresh et al.[71] studied the vertical distribution of MBC under no-tillage (NT), shallow (reduced) tillage and normal cultivated fields. A shallow tillage system significantly altered the tillage induced distribution of MBC. In a field experiment, Nakhro & Dkhar[72] examined the microbial populations and MBC in paddy fields under organic and inorganic farming approaches. The organic source used was a combination of rock phosphate, FYM and neem cake, whereas a mixture of urea, muriate of potash and single super phosphate was used as an inorganic source. The organically treated plots exhibited the highest MBC compared to inorganically treated plots and control. Organic carbon exhibited a direct and significant correlation with bacterial and fungal populations. The addition of organic fertilizers enhanced the content of SOC and consequently resulted in higher microbial count and MBC. Ramdas et al.[73] investigated the influence of inorganic and organic sources of nutrients (as minerals or INF) applied over a five-year period on SOC, MBC and other variables. It was observed that the addition of FYM and conjoint application of paddy straw (dry) and water hyacinth (PsWh) (fresh) significantly increased the SOC content than vermicompost, Chromolaena adenophorum (fresh) and Glyricidia aculeate (fresh), and Sesbania rostrata (fresh).

    Xu et al.[74] evaluated the influence of long-term fertilization strategies on the SOC content, soil MBN, soil MBC, and soil microbial quotient (SMQ) in a continuous rice system and observed that MBC at the main growth stages of early and late rice under 30% organic matter and 70% mineral fertilizer and 60% organic matter and 40% mineral fertilizer treatments was greater as compared to mineral fertilizer alone (MF), rice straw residues and mineral fertilizer (RF), and no fertilizer (CK) treatments. However, SMBC levels at late growth stages were greater in comparison to early growth stages. A recent study by Xiao et al.[75] demonstrated that increasing tillage frequency (no-tillage, semi-annual tillage, and tillage after every four months, two months, and one month) decreased soil MBC. Microbial biomass carbon content was significantly greater in no-till treatment (597 g kg−1) than in tillage every four months (421 g kg−1), two months (342 g kg−1) and one month (222 g kg−1). The decrease in the content of MBC in association with tillage practices is due to soil perturbations which enhanced soil temperature, diminished soil moisture content, and resulted in the destruction of microbial habitat and fungal hyphae. Therefore, the MBC content eventually affected the N cycle.

    Li et al.[76] reported that in comparison to CT, NT and RT resulted in increased MBC content and NT significantly increased MBC by 33.1% over CT. Furthermore, MBC concentration was 34.1% greater in NT than RT. The increase in MBC concentration was correlated with the results of increase in SOC concentration. Site-specific factors including soil depth and mean annual temperature significantly affected the response ratio of MBC under NT as compared to the duration of NT.

    Microbial biomass nitrogen (MBN) is a prominent indicator of soil fertility as it quantifies the biological status of soil. Soil MBN is strongly associated with organic matter of the soil. The nitrogen in MBN has a rapid turnover rate thereby reflecting the changes in management strategies way before the transformations in total N are discernable[77].

    In an experiment on continuous silage maize cultivation with crop rotation, Cerny et al.[78] observed that organic fertilizers exerted an affirmative influence on the soil MBN. During the application of organic manure MBN decreased, but there was higher MBN content as compared to control. However, addition of mineral nitrogenous fertilizers exerted an adverse effect on MBN content in experiments with maize. El-Sharkawi[79] recorded that organic matter-treated pots resulted in maximum MBN content than urea-treated pots. The sludge application enhanced total MBN and, therefore, could implicitly benefit crop production particularly in poor soils[18]. Sugihara et al.[80] observed that during the grain-filling stage in maize, residue and/or fertilizer addition exerted a pronounced influence on soil microbial dynamics; however, a clear effect of residue and ⁄or fertilizer addition was not observed. Microbial biomass nitrogen reduced dramatically from 63–71 to 18–33 kg N ha˗1 and C:N ratio at the same time increased more than ten-fold in all plots.

    Malik et al.[81] apprised that the organic amendments significantly enhanced MBN concentrations up to 50% more than the unamended soil. Wang et al.[82] evaluated the influence of organic materials on MBN content in an incubation and pot experiment with acidic and calcareous soils. The results revealed that MBN content which was affected by the different forms of organic amendments, increased by 23.37%−150.08% and 35.02%−160.02% in acidic and calcareous soils, respectively. The MBN content of both soils decreased with the increase in the C/N ratio of the organic materials, though a higher C/N ratio was effective for sustaining a greater MBN content for a very long time.

    Dhaliwal & Bijay-Singh[52] observed higher MBN levels in NT soils (116 kg ha−1) than in cultivated soils (80 kg ha−1). Kumar et al.[83] ascertained that in surface layer, MBN content was 11.8 mg kg−1 in CT which increased to 14.1 and 14.4 mg kg−1 in ZT and RT without residue retention and 20.2, 19.1 and 18.2 mg kg−1 in ZT, RT and CT with residue incorporation, respectively (Table 1). In the subsurface layer, the increased tendency on account of tillage and crop residue retention was identical to those of 0−15 cm layer but the magnitude was comparatively meagre (Table 1). In comparison to control, the persistent retention of crop residues led to significant accrual of MBN in the surface layer.

    Table 1.  Effect of different treatments on contents of various fractions of soil organic carbon[38].
    TreatmentsPMN (mg kg−1)MBC (mg kg−1)MBN (mg kg−1)DOC (mg kg−1)
    Depths (cm)
    0−1515−300−1515−300−1515−300−1515−30
    Tillage practices
    ZTR12.411.2562.5471.120.218.9198.6183.6
    ZTWR8.57.6350.4302.114.112.6167.1159.2
    RTR10.69.9490.2399.319.117.2186.4171.6
    RTWR7.66.6318.1299.814.413.7159.5148.7
    CTR9.38.5402.9354.418.216.6175.9168.9
    CT6.75.6307.9289.511.89.7142.5134.6
    Nitrogen management
    Control3.62.8218.3202.910.810.4103.792.3
    80 kg N ha−15.34.4241.1199.414.912.2128.3116.9
    120 kg N ha−18.97.6282.7220.916.516.1136.8123.6
    160 kg N ha−19.88.4343.9262.919.418.1164.8148.9
    200 kg N ha−110.49.7346.3269.622.721.7155.7136.4
    ZTR = Zero tillage with residue retention, ZTWR = Zero tillage without residue retention; RTR = Reduced tillage with residue retention, RTWR = Reduced tillage without residue retention, CTR = Conventional tillage with residue incorporation; CT = Conventional tillage without residue incorporation.
     | Show Table
    DownLoad: CSV

    Xiao et al.[75] determined that the MBN content decreased with tillage treatment having highest value in no tillage treatment, however, the difference among the treatments was negligible. Soil perturbations decreased the aggregate size and thus lower the soil aeration and exposure of fresh organic matter which restricted the growth of microorganisms. The results also concluded that MBN content is highly sensitive to tillage. Ginakes et al.[84] assessed the impact of zone tillage intensity on MBN in a corn-kura clover cropping sequence. Microbial biomass nitrogen was influenced by time and type of tillage treatment. Temporal studies revealed that MBN was higher after tillage treatment than the values possessed before tillage. Under different tillage treatments, higher values were recorded in ST (shank-till) and DT (double-till) over NT and RZT (zone-till) treatments.

    Another biological parameter, PMN, is a crucial parameter of soil fertility due to its association with soil N supply for crop growth. Also, PMN indicates the status of soil microbial community associated with PMN, whether it is improving or degrading. Forest soils are characterized by greater levels of PMN than CT receiving conventional chemical fertilizers which could be assignable to improved microbial activity in the former soils than the latter[48,77]. Aulakh et al.[85] assessed the effect of various combinations of fertilizer N, P, FYM and wheat residue (WR) applied to soybean and soybean residues added to wheat under CT and CA. The added fertilizers of N and P, FYM, and crop residue enhanced the mean weight diameter and water-stable aggregates thus favoured the development of macro-aggregates. The treatment INF + FYM + crop residue performed better among all the treatments. The net flux of mineral nitrogen from the mineralizable fraction is used to measure potentially mineralizable N which indicates the balance between mineralization and immobilization by soil microbes[77]. Nitrogen mineralization is widely used to assess the ability of SOM to supply inorganic nitrogen in the form of nitrate which is the most common form of plant-available nitrogen. Kumar et al.[83] observed an increase in PMN which was higher in surface soil than sub-surface soil thereby implying that high OC accumulation on account of crop residue retention was the most probable cause.

    Verma & Goyal[86] assessed the effect of INM and organic manuring on PMN and observed that PMN was substantially affected by different organic amendments. Potentially mineralizable nitrogen varied between 19.6−41.5 mg kg−1 soil with greater quantity (2.5%) in vermicompost applied plots than FYM treated plots. The INF treatments resulted in lower PMN content which could be due to nutrient immobilization by microbes. Mahal et al.[87] reported that no-till resulted in higher PMN content than conventional tillage treatments. This trend was due to the maintenance of SOM due to the residue cover and reduction of soil erosion under no-tillage system[88]. On the contrary, tillage practices led to the loss of SOC owing to loosened surface soil and higher mineralization of SOM.

    Soil respiration is referred as the sum of CO2 evolution from intact soils because of the respiration by soil organisms, mycorrhizae and roots[89]. Various researchers have proposed soil respiration as a potential indicator of soil microbial activity[52,77]. Gilani & Bahmanyar[90] observed that addition of organic amendments enhanced soil respiration more than the control and synthetic fertilizer treatments. Moreover, among organic amendment treatments, highest soil respiration was observed in sewage-sludge treated soils. Under controlled conditions in saline-sodic soil, Celis et al.[91] reported that sewage sludge resulted in a higher soil respiration rate than mined gypsum and synthetic gypsum. The application of gypsum because of minimal organic matter intake had little effect on soil respiration. The addition of organic matter especially during early spring led to higher microbial biomass and soil respiration albeit diminished levels of nitrate-N. Moreover, SOM hinders the leaching of nitrate ions thereby resulting in a better soil chemical environment[71].

    Faust et al.[92] observed that microbial respiration was associated with volumetric water content. The respiration declined with less availability of water, thus the lesser the tillage intensity, the more the volumetric water content which consequently resulted in higher microbial respiration. Another study by Bongiorno et al.[93] reflected the influence of soil management intensity on soil respiration. Reduced tillage practices resulted in 51% higher basal respiration than CT. Furthermore, this investigation suggested that microbial catabolic profile could be used as a useful biological soil quality indicator. Recently, Kalkhajeh et al.[94] ascertained the impact of simultaneous addition of N fertilizer and straw-decomposing microbial inoculant (SDMI) on soil respiration. The SDMI application boosted the soil microbial respiration which accelerated the decomposition of straw due to N fertilization. The C/N ratio did not affect the microbial respiration at elongation and heading stages, whereas N fertilization enhanced the microbial respiration to a greater extent than the unfertilized control. Additionally, the interaction between sampling time and basal N application significantly affected microbial respiration.

    Gong et al.[95] apprised the effect of conventional rotary tillage and deep ploughing on soil respiration in winter wheat and observed that deep ploughing resulted in a higher soil respiration rate than conventional rotary tillage. Soil moisture content and temperature are the dominating agents influencing soil respiration which is restricted by the soil porosity.

    Soil organic carbon plays a vital role in regulating various soil functions and ecosystem services. It is influenced by numerous factors like tillage practices and fertilization. Moreover, modified management practices may prove beneficial to avoid SOC loss by increasing its content. An exogenous supply of fertilizers may alter the chemical conditions of soil and thus result in transformation of SOC. Tillage practices lead to frequent soil disturbances which reduce the size of soil aggregates and accelerate the oxidation of SOC thereby reducing its content. The literature on the influence of fertilization and tillage practices on the transformation of SOC is discussed below.

    Soil organic carbon is a major part of the global carbon cycle which is associated not only with the soil but also takes part in the C cycling through vegetation, oceans and the atmosphere (Figs 1 & 2). Soil acts as a sink of approximately 1,500 Pg of C up to 1 m depth, which is greater than its storage in the atmosphere (approximately 800 Pg C) and terrestrial vegetation (500 Pg C) combined[96]. This dynamic carbon reservoir is continuously cycling in diverse molecular forms between the different carbon pools[97]. Fertilization (both organic and mineral) is one of the crucial factors that impart a notable influence on OC accretion in the soil. Many researchers have studied the soil C dynamics under different fertilizer treatments. Though inorganic fertilizers possess the advantage of easy handling, application and storage, they do not contribute to soil organic carbon. On the contrary, regardless of management method, plant residues are known to increase organic carbon content.

    Figure 1.  Impact of different fertilization regimes on abundance of the microbial biomarker groups . Error bars represent the standard error of the means and different letters indicate significant differences at p < 0.05 among treatments. Source: Li et al.[60].
    Figure 2.  Soil organic carbon (SOC) dynamics in the global carbon cycle.

    Katkar et al.[98] reported a higher soil quality index under conjunctive nutrient management strategies comprising addition of compost and green leaves along with mineral nutrients. Mazumdar et al.[99] investigated the impact of crop residue (CR), FYM, and leguminous green manure (GM) on SOC in continuous rice-wheat cropping sequence over a 25-year period. At the surface layer, the maximum SOC content was recorded under NPK + FYM than NPK + CR and NPK + GM treatments. SOC was significantly lower under sole application of INFs (NPK) than the mixed application of organic and inorganic treatments. A higher range of SOC content was recorded at a depth of 0.6 m in the rice-wheat system (1.8–6.2 g kg−1) in farmyard manure (FYM)-treated plots than 1.7–5.3 g kg−1 under NPK, and 0.9–3.0 g kg−1 in case of unfertilized plots[100]. In a research study Dutta et al.[101] reported that rice residue had a higher decomposition rate (k¼ 0.121 and 0.076 day−1) followed by wheat (0.073 and 0.042 day−1) and maize residues (0.041 day−1) when their respective residues placed on soil surface than incorporated in the soils. Naresh et al.[102] found FYM and dhaincha as GM/ sulphitation press mud (SPM) treatments are potent enough to enhance the SOC. Maximum SOC content was noted in 0–5 cm depth that reduced gradually along the profile. In surface soil, the total organic content (TOC) under different treatments varied with source used to supply a recommended dose of nitrogen (RDN) along with conventional fertilizer (CF).

    Cai et al.[103] ascertained that long-term manure application significantly improved SOC content in different size fractions which followed the sequence: 2,000–250 μm > 250–53 μm > 53 μm fraction. Naresh et al.[22] determined that mean SOC content increased from 0.54% in control to 0.65% in RDF and 0.82% in RDF + FYM treatment and improved enzyme activity; thus, ultimately influenced nutrient dynamics under field conditions. The treatments RDF + FYM and NPK resulted in 0.28 Mg C ha−1 yr−1 and 0.13 Mg C ha−1 yr−1, respectively and thus higher sequestration than control. Zhao et al.[104] determined that in the surface layer, significant increase in SOC content in each soil aggregate was noticed under straw incorporation treatments over no straw incorporated treatments (Fig. 3). Moreover, the aggregate associated OC was significantly higher in the surface layer than the sub-surface layer. The highest increment in aggregate-associated OC was noted in both maize and wheat straw (MR-WR) added plots followed by MR and least in WR. Besides, all of the three straw-incorporated treatments exhibited notable increase in SOC stock in each aggregate fraction in the surface layer of the soil. In the subsurface (20−40 cm) layer under MR-WR, significant rise in SOC stock of small macro-aggregates was observed, whereas there was a reduction in SOC stock in the silt + clay fraction than other treatments. The straw-incorporated treatments increased the quantity of mineral-associated organic matter (mSOM) and intra-aggregate particulate organic matter, (iPOM) within small macro-aggregates and micro-aggregates especially in the topmost layer of the soil.

    Figure 3.  Distribution of OC in coarse iPOM (intra-aggregate particulate organic matter) fine iPOM, mSOM (mineral-associated matter), and free LF (free light fraction) of small macro-aggregates and micro-aggregates in the 0–20 cm and 20–40 cm soil layers under MR-WR (return of both maize and wheat straw), MR (maize straw return), WR (wheat straw return). Different lowercase and uppercase letters indicate significant differences at p < 0.05 among treatments and depths respectively[104].

    Srinivasarao et al.[105] reported that SOC content was reduced with the addition of INFs (100% RDN) alone as compared to the conjunctive application of inorganic and organic or sole FYM treatments. Earlier, Srinivasarao et al.[106] reported that FYM treated plots exhibited greater per cent increase in SOC stock than mineral fertilized plots and control. Tong et al.[107] ascertained that the application of NP and NPK significantly improved SOC stocks. On the contrary, fertilized soils could also exhibit decrease in carbon content than control. Naresh et al.[108] determined that higher biomass C input significantly resulted in greater particulate organic carbon (POC) content. Zhang et al.[109] ascertained that long-term addition of NPK and animal manures significantly improved SOC stocks by a magnitude of 32%−87% whereas NPK and wheat/ and or maize straw incorporation enhanced the C stocks by 26%−38% than control. Kamp et al.[110] determined that continuous cultivation without fertilization decreased SOC content by 14% than uncultivated soil. However, super optimum dose of NPK, balanced NPK fertilization and integration of NPK with FYM not only improved SOC content but also SOC stocks over the first year. In conventionally tilled cotton-growing soils of southern USA, Franzluebbers et al.[111] estimated that carbon sequestration averaged 0.31 ± 0.19 Mg C ha−1 yr−1. Mandal et al.[112] reported maximum SOC stock in the surface layer of the soil (0–15 cm) which progressively diminished with depth in each land use system. A significant decrease in SOC stock along the profile depth was also observed by Dhaliwal et al.[47] in both croplands and agroforestry. In the topmost soil layer, highest SOC stock was recorded in rice–fallow system while the lowest was in the guava orchard[112].

    Nath et al.[113] determined that there was accrual of higher TOC in surface layers as compared to lower layers of soil under paddy cultivation. This accrual could be adduced to left-over crop residues and remnant root biomass which exhibited a decreasing trend with soil depth. Das et al.[114] determined that integrated use of fertilizers and organic sources resulted in greater TOC as compared to control or sole fertilizer application. Fang et al.[115] observed that the cumulative carbon mineralization differed with aggregate size in top soils of broad-leaved forests (BF) and coniferous forests (CF). However, in deep soil it was greater in macro-aggregates as compared to micro-aggregates in BF but not in CF (Fig. 4). By and large, the percent SOC mineralized was greater in macro-aggregates as compared to micro-aggregates. Dhaliwal et al.[100] ascertained that SOC accrual was considerably influenced by residue levels and tillage in surface soil (0−20 cm); albeit no variation was observed at lower depth (20−40 cm). The SOC content was greater in zero-tilled and permanently raised beds incorporated with residues as compared to puddled transplanted rice and conventionally planted wheat. Pandey et al.[116] reported that no-tillage prior to sowing of rice and wheat increased soil organic carbon by 0.6 Mg C ha–1 yr–1. The carbon sequestration rate on account of no-tillage or reduced tillage ranged between 0−2,114 kg ha–1 yr–1 in the predominant cropping system of South Asia, Xue et al.[117] observed that the long-term conventional tillage, by and large, exhibited a significant decline in SOC owing to degradation of soil structure, exposing protected soil organic matter (intra-soil aggregates) to microbes. Therefore, the adoption of no-tillage could hamper the loss of SOC thereby resulting in a greater or equivalent quantity of carbon in comparison to CT (Fig. 5).

    Figure 4.  (a) Soil aggregate fractions of two depths in two restored plantations of subtropical China, (b) organic carbon and (c) its mineralization from various soil aggregates within 71 d at various soil depths in two restored plantations of subtropical China. Error bars show the standard error of the mean. The different letters represent significant differences among the different soil aggregate fractions within a depth at p < 0.05[115].
    Figure 5.  The concentrations of (a) SOC, (b) total nitrogen (TN), and (c) soil C:N ratio for 0–50 cm profile under different tillage treatments in 2012 and 2013. NT = no-till with residue retention; RT = rotary tillage with residue incorporation; PT = plow tillage with residue incorporation; and PT0 = plow tillage with residue removed. The lowercase letters indicate statistical difference among treatments at p < 0.05[117].

    Singh et al.[118] determined that carbon stock in the 0-40 cm layer increased by 39, 35 and 19% in zero-tilled clay loam, loam, and sandy loam soils, respectively as compared to conventional tilled soils over a period of 15 years. Kuhn et al.[119] also apprised about the advantages of NT over CT vis-a-vis SOC stocks across soil depths. In the surface layer (0−20 cm) NT, by and large, resulted in higher SOC stocks as compared to CT; however, SOC stocks exhibited a declining trend with soil depth, in fact, became negative at depths lower than 20 cm. Sapkota et al.[120] observed that over a period of seven years, direct dry-seeded rice proceeded by wheat cultivation with residue retention enhanced SOC at 0-60 cm depth by a magnitude of 4.7 and 3.0 t C ha−1 in zero-tillage (ZTDSR-ZTW + R) and without tillage (PBDSR-PBW + R), respectively. On the contrary, the conventional tillage rice-wheat cropping system (CTR-CTW) decreased the SOC up to 0.9 t C ha−1 (Table 2).

    Table 2.  Influence of tillage and crop establishment methods on SOC stock and its temporal variation under rice–wheat system[120].
    Tillage and crop establishment methodsDepths (m)
    0–0.050.05–0.150.15–0.30.3–0.60–0.6
    Total SOC (t/ha)
    CTR-CTW3.5e7.1c8.77.026.2c
    CTR-ZTW3.9d7.6bc8.86.526.7c
    ZTDSR-CTW4.2d7.5bc9.26.327.3c
    ZTDSR-ZTW4.9c8.9ab8.26.228.2bc
    ZTDSR-ZTW+R6.1a9.0ab9.86.831.8a
    PBDSR-PBW+R5.5b9.3a9.36.030.1ab
    MSD0.41.72.01.42.49
    Treatment effect
    (p value)
    < 0.0010.040.1580.267< 0.001
    Initial SOC content3.6 ±
    0.15
    8.1 ±
    1.39
    8.78 ±
    1.07
    6.7 ±
    0.73
    27.1 ±
    1.21
    Change in SOC over seven years (t/ha)
    CTR-CTW−0.16−0.99−0.040.28−0.90
    CTR-ZTW0.28−0.500.01−0.20−0.41
    ZTDSR-CTW0.62−0.570.45−0.340.16
    ZTDSR-ZTW1.340.84−0.62−0.461.09
    ZTDSR-ZTW+R2.490.961.040.164.66
    PBDSR-PBW+R1.891.220.51−0.642.98
    CTR-CTW = Conventionally tilled puddled transplanted rice followed by conventionally tilled wheat, CTR-ZTW = Conventionally tilled puddled transplanted rice followed by zero-tilled wheat, ZTDSR-CTW = Zero-tilled direct dry-seeded rice followed by conventionally tilled wheat, ZTDSR-ZTW = Zero-tilled direct dry-seeded rice followed by zero-tilled wheat, ZTDSR-ZTW+R = Zero-tilled direct dry-seeded rice followed by zero-tilled wheat with residue retention, PBDSR-PBW+R = Direct dry-seeded rice followed by direct drilling of wheat both on permanent beds with residue retention, MSD, minimum significant difference. Significant different letters indicate significant differences at p < 0.05.
     | Show Table
    DownLoad: CSV

    Labile organic carbon (LC) is that fraction of SOC that is rapidly degraded by soil microbes, therefore, having the highest turnover rate. This fraction can turn over quickly on account of the change in land use and management strategies. From the crop production perspective, this fraction is crucial as it sustains the soil food cycle and, hence, considerably impacts nutrient cycling thereby altering soil quality and productivity. Short-term management could influence the labile fraction of carbon[121]. However, some site-specific problems and regional factors may influence their distribution in soil layers[102].

    Banger et al.[122] observed significant alteration in labile pools of C, for instance, particulate organic matter (POM), water-soluble C (WSC) and light fraction of C (LFC) because of the addition of fertilizers and/or FYM over a 16-year period. Particulate organic matter, LFC and WSC contributed 24%–35%, 12%–14% and 0.6%–0.8%, respectively, towards SOC. The increase in concentration of SOC including its pools like POC and the sequestration rate due to integrated nutrient management was also reported by Nayak et al.[123]. Gu et al.[124] observed that mulch-treated soils (straw and grass mulch) had significantly greater levels of LOC, POC, DOC and EOC as compared to no mulch-treated soils which could be adduced to the addition of straw, root and its sections into the soil. The content of labile C fractions across all treatments exhibited a decreasing trend with soil depth[23, 102, 125].

    In a long-term experiment, Anantha et al.[126] observed that the total organic carbon apportioned into labile carbon, non-labile, less labile, and very labile carbon constituted around 18.7%, 19.3%, 20.6% and 41.4% of the TOC, respectively (Table 3). Zhu et al.[20] determined that straw incorporation had a substantial impact on TOC and labile C fractions of the soil which were greater in straw incorporated treatments as compared to non-straw treatments across all the depths. Wang et al.[127] reported that the light fraction organic carbon (LFOC) and DOC were significantly greater in the straw-applied treatments than the control by a magnitude of 7%–129% for both the early and late season rice. The treatments NPK + FYM or NPK + GR + FYM resulted in greater content of very labile and labile C fractions whereas non-labile and less labile fractions were greater in control and NPK + CR treatment. There was 40.5% and 16.2% higher C build-up in sole FYM treated plots and 100% NPK + FYM, respectively over control. On the other hand, a net depletion of 1.2 and 1.8 Mg ha−1 in carbon stock was recorded under 50% NPK and control treatments, respectively. Out of the total C added through FYM, only 28.9% was stabilized as SOC, though an external supply of OM is a significant source of soil organic carbon[69]. Hence, to sustain the optimum SOC level at least an input of 2.3 Mg C ha−1 y−1 is required. A comparatively greater quantity of soil C in passive pools was observed in 100% NPK + FYM treatment. The increase in allocation of C into the passive pool was about 33%, 35%, 41% and 39% of TOC in control, suboptimal dose, optimal dose and super optimal dose of NPK which indicates that the concentration of passive pools increased with an increase in fertilization doses. Water-soluble carbon (WSC) was 5.48% greater in the upper soil layer as compared to lower layer of soil. In surface soil (0−15 cm), the values of light fraction carbon (LFC) were 81.3, 107.8, 155.2, 95.7, 128.8, 177.8 and 52.7 mg kg−1 in ZT without residue retention, ZT with 4 t ha−1 residue retention, ZT with 6 t ha−1 residue retention, FIRB without residue addition and FIRB with 4 and 6 t ha−1 residue addition and CT, respectively (Table 4). Tiwari et al.[128] determined that the decrease in POC was due to reduction in fine particulate organic matter in topsoil whereas decrement in dissolved organic carbon was observed largely in subsoil. Therefore, in surface soils fine POC and LFOC might be regarded as preliminary evidence of organic C alteration more precisely, while DOC could be considered as a useful indicator for subsoil. Reduction in allocations of fine POC, LFOC and DOC to SOC caused by tillage and straw management strategies indicated the decline in quality of SOC. A higher SOC concentration was recorded in the conjoint application of INF + FYM (0.82%) and sole application of INF (0.65%) than control (0.54%). Kumar et al.[83] reported that the CT without residue retention had significantly lower labile carbon fractions (27%–48%) than zero-tillage with 6-ton residue retention. Moreover, residue-retained fertilized treatments had significantly greater labile fractions of C than sole fertilized treatments[125]. Kumar et al.[83] reported highest change in DOC in zero-till with residue retention (28.2%) in comparison to conventional tillage practices. In ZT, absence of soil perturbations resulted in sustained supply of organic substrata for soil microbes which increases their activity. On the contrary, CT practices resulted in higher losses of C as CO2 due to frequent disturbances.

    Table 3.  Oxidisable organic carbon fractions in soils (g kg−1) at different layers[126].
    TreatmentDepths (cm)
    0−1515−3030−45Total
    Very Labile C
    Control3.6 ± 0.5c1.4 ± 0.3b1.3 ± 0.2a6.3 ± 0.4b
    50% NPK4.6 ± 0.3bc2.1 ± 0.7ab1.5 ± 0.1a8.1 ± 0.9a
    100% NPK4.4 ± 0.3bc2.3 ± 0.2a1.4 ± 0.5a8.0 ± 0.7a
    150% NPK5.0 ± 0.2ab2.6 ± 0.2a1.5 ± 0.1a9.0 ± 0.3a
    100% NPK + FYM4.8 ± 0.2ab2.0 ± 0.2ab1.3 ± 0.3a8.1 ± 0.2a
    FYM5.9 ± 1.3a2.2 ± 0.2a1.4 ± 0.3a9.5 ± 1.6a
    Fallow4.2 ± 0.7bc1.5 ± 0.5b0.7 ± 0.3b6.3 ± 0.8b
    Lbile C
    Control2.4 ± 0.3a1.0 ± 0.2a0.8 ± 0.4a4.2 ± 0.6a
    50% NPK1.7 ± 0.4ab0.9 ± 0.5a0.7 ± 0.2a3.3 ± 0.7a
    100% NPK1.8 ± 0.4ab0.8 ± 0.5a0.6 ± 0.3a3.2 ± 0.8a
    150% NPK1.2 ± 0.3b0.7 ± 0.2a0.9 ± 0.2a2.8 ± 0.4a
    100% NPK + FYM1.9 ± 0.3ab0.7 ± 0.2a0.7 ± 0.3a3.4 ± 0.2a
    FYM2.5 ± 0.9a0.7 ± 0.3a0.7 ± 0.2a3.9 ± 0.9a
    Fallow2.2 ± 1.0ab1.0 ± 0.3a1.0 ± 0.4a4.1 ± 1.1a
    Less labile C
    Control1.5 ± 0.3c0.6 ± 0.4c0.4 ± 0.0c2.6 ± 0.7d
    50% NPK1.8 ± 0.1c0.4 ± 0.1c0.5 ± 0.2c2.7 ± 0.1cd
    100% NPK2.5 ± 0.3ab0.8 ± 0.1bc1.1 ± 0.2ab4.4 ± 0.1b
    150% NPK2.6 ± 0.2a0.9 ± 0.1bc0.4 ± 0.2c3.9 ± 0.1b
    100% NPK + FYM2.7 ± 0.6a1.5 ± 0.2a1.4 ± 0.1a5.6 ± 0.7a
    FYM1.9 ± 0.7bc1.7 ± 0.2a1.0 ± 0.2b4.5 ± 0.7ab
    Fallow1.5 ± 0.3c1.3 ± 0.7ab0.9 ± 0.4b3.8 ± 1.2bc
    Non labile C
    Control1.2 ± 0.5b1.2 ± 0.3a0.2 ± 0.2b2.6 ± 0.5b
    50% NPK1.2 ± 0.9b1.7 ± 0.8a0.7 ± 0.4ab3.5 ± 1.8ab
    100% NPK1.3 ± 0.6b1.5 ± 0.6a0.5 ± 0.2ab3.3 ± 1.0ab
    150% NPK1.4 ± 0.3b1.5 ± 0.2a0.8 ± 0.1a3.7 ± 0.3ab
    100% NPK + FYM2.0 ± 0.8b1.3 ± 0.1a0.3 ± 0.3ab3.5 ± 0.7ab
    FYM3.7 ± 1.3a1.0 ± 0.2a0.5 ± 0.5ab5.1 ± 1.9a
    Fallow2.1 ± 0.2b1.4 ± 0.7a0.4 ± 0.2ab3.9 ± 0.9ab
    Values in the same column followed by different letters are significantly different at p < 0.001, ± indicates the standard deviation values of the means.
     | Show Table
    DownLoad: CSV
    Table 4.  Influence of tillage and nitrogen management on distribution of carbon fractions in soil[83].
    TreatmentsWSOC
    (g kg−1)
    SOC
    (g kg−1)
    OC
    (g kg−1)
    BC
    (g kg−1)
    POC
    (mg kg)
    PON
    (mg kg−1)
    LFOC
    (mg kg−1)
    LFON
    (mg kg−1)
    Depths (cm)
    0−1515−300−1515−300−1515−300−1515−300−1515−300−1515−300−1515−300−1515−30
    Tillage practices
    ZTR28.826.223.119.39.619.134.694.281342.8967.9119.5108.1194.7154.814.812.3
    ZTWR25.324.618.414.87.877.213.763.19981.1667.494.686.5120.5104.711.810.3
    RTR27.025.922.418.28.688.174.133.871230.2836.9109.797.8170.9144.913.711.6
    RTWR23.721.818.114.27.667.073.122.96869.4604.482.676.6107.197.39.78.6
    CTR26.124.421.817.48.497.963.823.481099.1779.498.489.3143.8115.912.810.9
    CT21.820.916.113.16.215.642.892.63617.5481.869.257.690.873.69.67.9
    Nitrogen management
    Control21.114.916.113.16.135.481.581.07709.7658.631.726.3123.9104.36.45.8
    80 kg N ha−128.321.217.814.76.466.162.461.75860.7785.668.456.2132.8116.17.66.9
    120 kg N ha−129.522.119.116.17.256.713.262.18952.2808.989.578.5150.6127.69.78.6
    160 kg N ha−130.223.120.818.27.757.283.822.661099.5823.896.883.4168.5145.710.29.8
    200 kg N ha−131.125.421.318.77.937.484.153.421153.1898.4103.997.3176.2152.911.710.6
    WSOC = Water soluble organic carbon, SOC = Total soil organic carbon, OC = Oxidizable organic carbon, BC =Black carbon, POC = particulate organic carbon, PON = particulate organic nitrogen, LFOC = labile fraction organic carbon, and LFON = labile fraction organic nitrogen. ZTR = Zero tillage with residue retention, ZTWR = Zero tillage without residue retention; RTR = Reduced tillage with residue retention, RTWR = Reduced tillage without residue retention, CTR = Conventional tillage with residue incorporation; CT = Conventional tillage without residue incorporation.
     | Show Table
    DownLoad: CSV

    The soil characteristics such as plant available nutrients, microbial diversity and soil organic carbon transformation are dwindling on account of intensive cultivation under conventional tillage practices, therefore, demand relevant management approaches for soil and crop sustainability. Long-term application of organic amendments significantly increases soil properties by increasing plant available macro, micro, secondary nutrients and soil organic C, whereas the increase in organic C by INF application is, by and large, due to increment in organic C content within macro-aggregates and in the silt + clay compartments. The soil organic carbon and other plant available nutrients were significantly greater in conservation tillage systems as compared to conventional tillage (CT) that conservation approaches could be an exemplary promoter of soil productivity by modifying soil structure thereby protecting SOM and maintaining higher nutrient content. The mean concentration of different fractions of carbon MBN, PMN and soil respiration under integrated nutrient management treatments was higher as compared with to control. Therefore, the conjoint use of organic manures or retention of crop residues with inorganic fertilizers is imperative to reduce the depletion of SOC while sustaining crop production as a realistic alternative. Future research should focus mainly on the usage of organic and mineral fertilizers in conjunction with conservation tillage approaches to sustain the soil environment.

    The authors confirm contribution to the paper as follows: study conception and design: Dhaliwal SS, Shukla AK, Randhawa MK, Behera SK; data collection: Sanddep S, Dhaliwal SS, Behera SK; analysis and interpretation of results: Dhaliwal SS, Gagandeep Kaur, Behera SK; draft manuscript preparation: Dhaliwal SS, walia, Shukla AK, Toor AS, Behera SK, Randhawa MK. All authors reviewed the results and approved the final version of the manuscript.

    Data sharing not applicable to this article as no datasets were generated or analyzed during the current study.

    The support rendered by the Departemnt of Soil Science, PAU, Ludhiana, RVSKVV, Gwailor, CSSRI, Karnal, IISS, Bhopal, School of Organic Farming, PAU Ludhiana and Washington State University, USA is fully acknowledged .

  • The authors declare that they have no conflict of interest.

  • [1]

    Sun J, Chen T, Wu Y, Tao J. 2021. Identification and functional verification of PLFT gene associated with flowering in herbaceous peony based on transcriptome analysis. Ornamental Plant Research 1(1):7

    doi: 10.48130/OPR-2021-0007

    CrossRef   Google Scholar

    [2]

    Zhang D, Xie A, Yang X, Shi Y, Yang L, et al. 2022. Study of 15 varieties of herbaceous peony pollen submicroscopic morphology and phylogenetic relationships. Horticulturae 8(12):1161

    doi: 10.3390/horticulturae8121161

    CrossRef   Google Scholar

    [3]

    Wang X, Shi X, Zhang R, Zhang K, Shao L, et al. 2022. Impact of summer heat stress inducing physiological and biochemical responses in herbaceous peony cultivars (P. lactiflora Pall.) from different latitudes. Industrial Crops and Products 184:115000

    doi: 10.1016/j.indcrop.2022.115000

    CrossRef   Google Scholar

    [4]

    Song C, Wang Q, Teixeira da Silva JA, Yu X. 2018. Identification of floral fragrances and analysis of fragrance patterns in herbaceous peony cultivars. Journal of the American Society for Horticultural Science 143(4):248−58

    doi: 10.21273/JASHS04420-18

    CrossRef   Google Scholar

    [5]

    Sun Y, Wang W, Zhao L, Zheng C, Ma F. 2019. Changes in volatile organic compounds and differential expression of aroma-related genes during flowering of Rosa rugosa 'Shanxian'. Horticulture, Environment, and Biotechnology 60:741−51

    doi: 10.1007/s13580-019-00166-0

    CrossRef   Google Scholar

    [6]

    Du F, Wang T, Fan JM, Liu ZZ, Zong JX, et al. 2019. Volatile composition and classification of Lilium flower aroma types and identification, polymorphisms, and alternative splicing of their monoterpene synthase genes. Horticulture Research 6:110

    doi: 10.1038/s41438-019-0192-9

    CrossRef   Google Scholar

    [7]

    Jin F, Xu J, Liu XR, Regenstein JM, Wang FJ. 2019. Roasted tree peony (Paeonia ostii) seed oil: benzoic acid levels and physicochemical characteristics. International Journal of Food Properties 22(1):499−510

    doi: 10.1080/10942912.2019.1588902

    CrossRef   Google Scholar

    [8]

    El-Hawary SS, El-Tantawi ME, Kirollos FN, Hammam WE. 2018. Chemical composition, in vitro cytotoxic and antimicrobial activities of volatile constituents from Pyrus communis L. and Malus domestica Borkh. fruits cultivated in Egypt. Journal of Essential Oil Bearing Plants 21(6):1642−51

    doi: 10.1080/0972060X.2018.1553637

    CrossRef   Google Scholar

    [9]

    Hu J, Huang W, Zhang F, Luo X, Chen Y, et al. 2020. Variability of volatile compounds in the medicinal plant Dendrobium officinale from different regions. Molecules 25(21):5046

    doi: 10.3390/molecules25215046

    CrossRef   Google Scholar

    [10]

    Liu G, Fu J, Wang L, Fang M, Zhang W, et al. 2023. Diverse O-methyltransferases catalyze the biosynthesis of floral benzenoids that repel aphids from the flowers of waterlily Nymphaea prolifera. Horticulture Research 10(12):uhad237

    doi: 10.1093/hr/uhad237

    CrossRef   Google Scholar

    [11]

    Pan Y, Quan W, Li C, Hao J, Gao Y. 2021. Analysis of allelochemicals in the leaves of four alpine rhododendrons by gas chromatography-mass spectrometry. BioResources 16(2):3096−102

    doi: 10.15376/biores.16.2.3096-3102

    CrossRef   Google Scholar

    [12]

    Bera P, Mukherjee C, Mitra A. 2017. Enzymatic production and emission of floral scent volatiles in Jasminum sambac. Plant Science 256:25−38

    doi: 10.1016/j.plantsci.2016.11.013

    CrossRef   Google Scholar

    [13]

    Yang L, Aobulikasimu·Nuerbiye, Cheng P, Wang JH, Li H. 2017. Analysis of floral volatile components and antioxidant activity of different varieties of Chrysanthemum morifolium. Molecules 22:1790

    doi: 10.3390/molecules22101790

    CrossRef   Google Scholar

    [14]

    Xin H, Wu B, Zhang H, Wang C, Li J, et al. 2013. Characterization of volatile compounds in flowers from four groups of sweet osmanthus (Osmanthus fragrans) cultivars. Canadian Journal of Plant Science 93(5):923−31

    doi: 10.4141/cjps2012-333

    CrossRef   Google Scholar

    [15]

    Pereira AG, Cassani L, Liu C, Li N, Chamorro F, et al. 2023. Camellia japonica flowers as a source of nutritional and bioactive compounds. Foods 12(15):2825

    doi: 10.3390/foods12152825

    CrossRef   Google Scholar

    [16]

    Yang S, Meng Z, Li Y, Chen R, Yang Y, et al. 2021. Evaluation of physiological characteristics, soluble sugars, organic acids and volatile compounds in 'Orin' apples (Malus domestica) at different ripening stages. Molecules 26(4):807

    doi: 10.3390/molecules26040807

    CrossRef   Google Scholar

    [17]

    Xiong H, Yang Y, Guo W, Yuan J, Yang W, et al. 2024. Study on quality difference between Belamcanda chinensis (L.) DC and Iris tectorum Maxim. based on chemical chromatogram analysis, biological activity evaluation and in vivo distribution rule. Journal of Ethnopharmacology 319:117091

    doi: 10.1016/j.jep.2023.117091

    CrossRef   Google Scholar

    [18]

    Wang Z, Zhao X, Tang X, Yuan Y, Xiang M, et al. 2023. Analysis of fragrance compounds in flowers of Chrysanthemum genus. Ornamental Plant Research 3:12

    doi: 10.48130/OPR-2023-0012

    CrossRef   Google Scholar

    [19]

    Li Z, Zhang X, Li K, Wang P, Li C, et al. 2022. Integrative analysis of transcriptomic and volatile compound profiles sheds new insights into the terpenoid biosynthesis in tree peony. Industrial Crops and Products 188:115672

    doi: 10.1016/j.indcrop.2022.115672

    CrossRef   Google Scholar

    [20]

    Knudsen JT, Gershenzon J. 2020. The chemical diversity of floral scent. In Biology of Plant Volatiles, 2nd edition, eds Pichersky E, Dudareva N. Boca Raton: CRC Press. pp. 57−78. doi: 10.1201/9780429455612-5

    [21]

    Stamm JD. 2023. The language of flowers in the time of COVID: finding solace in zen, nature and ikebana. US: John Hunt Publishing. pp. 152−53.

    [22]

    Nadeem MA, Dubey R, Singh A, Pandey R, Bundela KS. 2017. Processing and quality evaluation of menthol mint oil. International Journal Of Mathematics And Statistics Invention 5(2):68−70

    Google Scholar

    [23]

    Zhang Y, Li C, Wang S, Yuan M, Li B, et al. 2021. Transcriptome and volatile compounds profiling analyses provide insights into the molecular mechanism underlying the floral fragrance of tree peony. Industrial Crops and Products 162:113286

    doi: 10.1016/j.indcrop.2021.113286

    CrossRef   Google Scholar

    [24]

    Qiao Z, Hu H, Shi S, Yuan X, Yan B, et al. 2021. An update on the function, biosynthesis and regulation of floral volatile terpenoids. Horticulturae 7(11):451

    doi: 10.3390/horticulturae7110451

    CrossRef   Google Scholar

    [25]

    Li R, Song C, Niu T, Wei Z, Guo L, et al. 2023. The emitted pattern analysis of flower volatiles and cloning of PsGDS gene in tree peony cultivar 'High Noon'. Acta Horticulturae Sinica 50(2):331−44

    doi: 10.16420/j.issn.0513-353x.2021-0870

    CrossRef   Google Scholar

    [26]

    Zhao Q, Gu L, Li Y, Zhi H, Luo J, et al. 2023. Volatile composition and classification of Paeonia lactiflora flower aroma types and identification of the fragrance-related genes. International Journal of Molecular Sciences 24(11):9410

    doi: 10.3390/ijms24119410

    CrossRef   Google Scholar

    [27]

    Li S, Zhang L, Sun M, Lv M, Yang Y, et al. 2023. Biogenesis of flavor-related linalool is diverged and genetically conserved in tree peony (Paeonia × suffruticosa). Horticulture Research 10(2):uhac253

    doi: 10.1093/hr/uhac253

    CrossRef   Google Scholar

    [28]

    Wang S, Luo Y, Niu T, Prijic Z, Markovic T, et al. 2024. Comparative analysis of the volatile components of six herbaceous peony cultivars under ground-planted and vase-inserted conditions. Scientia Horticulturae 334:113320

    doi: 10.1016/j.scienta.2024.113320

    CrossRef   Google Scholar

    [29]

    Wu Y, Li L, Yuan W, Hu J , Lv Z. 2021. Application of GC × GC coupled with TOF–MS for the trace analysis of chemical components and exploration the characteristic aroma profile of essential oils obtained from two tree peony species (Paeonia rockii and Paeonia ostii). European Food Research and Technology 247:2591−608

    doi: 10.1007/s00217-021-03823-w

    CrossRef   Google Scholar

    [30]

    Li X, Wu J, Wang H, Zhang K, Song F. 2022. Evaluation and comparison of pear flower aroma characteristics of seven cultivars. Horticulturae 8(5):352

    doi: 10.3390/horticulturae8050352

    CrossRef   Google Scholar

    [31]

    Yang YH, Zhao J, Du ZZ. 2022. Unravelling the key aroma compounds in the characteristic fragrance of Dendrobium officinale flowers for potential industrial application. Phytochemistry 200:113223

    doi: 10.1016/j.phytochem.2022.113223

    CrossRef   Google Scholar

    [32]

    Kimani SK, Wang S, Xie J, Bao T, Shan X, et al. 2024. Integration of RNA-Seq and metabolite analysis reveals the key floral scent biosynthetic genes in herbaceous peony. Horticulturae 10(6):617

    doi: 10.3390/horticulturae10060617

    CrossRef   Google Scholar

    [33]

    Pott DM, Osorio S, Vallarino JG. 2019. From central to specialized metabolism: an overview of some secondary compounds derived from the primary metabolism for their role in conferring nutritional and organoleptic characteristics to fruit. Frontiers in Plant Science 10:835

    doi: 10.3389/fpls.2019.00835

    CrossRef   Google Scholar

    [34]

    Hirata H, Ohnishi T, Watanabe N. 2016. Biosynthesis of floral scent 2-phenylethanol in rose flowers. Bioscience, Biotechnology, and Biochemistry 80(10):1865−73

    doi: 10.1080/09168451.2016.1191333

    CrossRef   Google Scholar

    [35]

    Yetisen M, Guclu G, Kelebek H, Selli S. 2022. Elucidation of key aroma enhancement in cloudy lemon juices by the addition of peel oil using GC–MS-Olfactometry. International Journal of Food Science & Technology 57(8):5280−88

    doi: 10.1111/ijfs.15857

    CrossRef   Google Scholar

    [36]

    Abbas F, Zhou Y, O'Neill Rothenberg D, Alam I, Ke Y, et al. 2023. Aroma components in horticultural crops: chemical diversity and usage of metabolic engineering for industrial applications. Plants 12(9):1748

    doi: 10.3390/plants12091748

    CrossRef   Google Scholar

    [37]

    Farré-Armengol G, Filella I, Llusià J, Peñuelas J. 2017. β-Ocimene, a key floral and foliar volatile involved in multiple interactions between plants and other organisms. Molecules 22(7):1148

    doi: 10.3390/molecules22071148

    CrossRef   Google Scholar

    [38]

    Niu TF, Xue X, Guo LL, Yu M, Zhang CJ, et al. 2023. Effects of exogenous methyl jasmonate on volatile components and content of Paeonia suffruticosa 'Luoyanghong' in greenhouse. Scientia Silvae Sinicae 59(5):53−60

    doi: 10.11707/j.1001-7488.LYKX20210977

    CrossRef   Google Scholar

    [39]

    Saad AM, Mohamed AS, Ramadan MF. 2021. Storage and heat processing affect flavors of cucumber juice enriched with plant extracts. International Journal of Vegetable Science 27(3):277−87

    doi: 10.1080/19315260.2020.1779895

    CrossRef   Google Scholar

    [40]

    Wang T, Xie A, Zhang D, Liu Z, Li X, et al. 2021. Analysis of the volatile components in flowers of Paeonia lactiflora Pall. var. Trichocarpa. American Journal of Plant Sciences 12(01):146−62

    doi: 10.4236/ajps.2021.121009

    CrossRef   Google Scholar

    [41]

    Hosseini H, Zahedi B, Jowkar A, Kermani MJ, Karami A. 2021. Investigation of floral scent and essential oil of Rosa iberica petals. Journal of Ornamental Plants 11(2):89−97

    Google Scholar

    [42]

    Zhao G, Ding LL, Hadiatullah H, Li S, Wang X, et al. 2020. Characterization of the typical fragrant compounds in traditional Chinese-type soy sauce. Food Chemistry 312:126054

    doi: 10.1016/j.foodchem.2019.126054

    CrossRef   Google Scholar

    [43]

    Chinyere I, Julius IU. 2020. Determination of aroma components in Vitex doniana fruit syrup following hydrodistillation extraction. Journal of American Science 16(9):84−93

    doi: 10.7537/marsjas160920.07

    CrossRef   Google Scholar

    [44]

    Wang X, Xiong H, Wang S, Zhang Y, Song Z, et al. 2023. Physicochemical analysis, sensorial evaluation, astringent component identification and aroma-active compounds of herbaceous peony (Paeonia lactiflora Pall.) black tea. Industrial Crops and Products 193:116159

    doi: 10.1016/j.indcrop.2022.116159

    CrossRef   Google Scholar

    [45]

    Xiao Y, Huang Y, Chen Y, Xiao L, Zhang X, et al. 2022. Discrimination and characterization of the volatile profiles of five Fu brick teas from different manufacturing regions by using HS–SPME/GC–MS and HS–GC–IMS. Current Research in Food Science 5:1788−807

    doi: 10.1016/j.crfs.2022.09.024

    CrossRef   Google Scholar

    [46]

    Orodu VE. 2021. Migration and degradation by volatile compounds from scent leaf (Ocimum gratissimum) on polyethylene terephthalate packaged water. Chemistry and Physics of Polymers 1(1):1−11

    Google Scholar

    [47]

    Hoepflinger MC, Barman M, Dötterl S, Tenhaken R. 2024. A novel O-methyltransferase Cp4MP-OMT catalyses the final step in the biosynthesis of the volatile 1,4-dimethoxybenzene in pumpkin (Cucurbita pepo) flowers. BMC Plant Biology 24:294

    doi: 10.1186/s12870-024-04955-3

    CrossRef   Google Scholar

    [48]

    Zhang HX, Hu ZH, Leng PS, Wang WH, Xu F, et al. 2013. Qualitative and quantitative analysis of floral volatile components from different varieties of Lilium spp. Scientia Agricultura Sinica 46:790−99

    doi: 10.3864/j.issn.0578-1752.2013.04.013

    CrossRef   Google Scholar

    [49]

    Luo X, Yuan M, Li B, Li C, Zhang Y, et al. 2020. Variation of floral volatiles and fragrance reveals the phylogenetic relationship among nine wild tree peony species. Flavour and Fragrance Journal 35(2):227−41

    doi: 10.1002/ffj.3558

    CrossRef   Google Scholar

    [50]

    Mostafa S, Wang Y, Zeng W, Jin B. 2022. Floral scents and fruit aromas: functions, compositions, biosynthesis, and regulation. Frontiers in Plant Science 13:860157

    doi: 10.3389/fpls.2022.860157

    CrossRef   Google Scholar

    [51]

    Zhao Q, Zhang M, Gu L, Yang Z, Li Y, et al. 2024. Transcriptome and volatile compounds analyses of floral development provide insight into floral scent formation in Paeonia lactiflora 'Wu Hua Long Yu'. Frontiers in Plant Science 15:1303156

    doi: 10.3389/fpls.2024.1303156

    CrossRef   Google Scholar

    [52]

    Ma H, Zhang C, Niu T, Chen M, Guo L, et al. 2023. Identification of floral volatile components and expression analysis of controlling gene in Paeonia ostii 'Fengdan' under different cultivation conditions. Plants 12(13):2453

    doi: 10.3390/plants12132453

    CrossRef   Google Scholar

    [53]

    Middleton R, Tunstad SA, Knapp A, Winters S, McCallum S, et al. 2024. Self-assembled, disordered structural color from fruit wax bloom. Science Advances 10(6):eadk4219

    doi: 10.1126/sciadv.adk4219

    CrossRef   Google Scholar

    [54]

    Su X. 2010. Alcohols compound: the basic material of aromatic chemicals. Value Engineering 29(3):39

    doi: 10.14018/j.cnki.cn13-1085/n.2010.03.102

    CrossRef   Google Scholar

    [55]

    Englezos V, Torchio F, Cravero F, Marengo F, Giacosa S, et al. 2016. Aroma profile and composition of Barbera wines obtained by mixed fermentations of Starmerella bacillaris (synonym Candida zemplinina) and Saccharomyces cerevisiae. LWT 73:567−75

    doi: 10.1016/j.lwt.2016.06.063

    CrossRef   Google Scholar

    [56]

    Wang W, Ge J, Zhang Y, Zhang J. 2024. The male's scent triggered a neural response in females despite ambiguous behavioral response in Asian house rats. Integrative Zoology 19(4):694−709

    doi: 10.1111/1749-4877.12768

    CrossRef   Google Scholar

    [57]

    Song C, Ma H, Li R, Zhao G, Niu T, et al. 2024. Analysis of the emitted pattern of floral volatiles and cloning and functional analysis of the PsuLIS gene in tree peony cultivar 'High Noon'. Scientia Horticulturae 326:112750

    doi: 10.1016/j.scienta.2023.112750

    CrossRef   Google Scholar

  • Cite this article

    Wang A, Luo Y, Niu T, Gao K, Wang S, et al. 2024. Identification and content analysis of volatile components in 100 cultivars of Chinese herbaceous peony. Ornamental Plant Research 4: e032 doi: 10.48130/opr-0024-0029
    Wang A, Luo Y, Niu T, Gao K, Wang S, et al. 2024. Identification and content analysis of volatile components in 100 cultivars of Chinese herbaceous peony. Ornamental Plant Research 4: e032 doi: 10.48130/opr-0024-0029

Figures(5)  /  Tables(4)

Article Metrics

Article views(1180) PDF downloads(266)

ARTICLE   Open Access    

Identification and content analysis of volatile components in 100 cultivars of Chinese herbaceous peony

Ornamental Plant Research  4 Article number: e032  (2024)  |  Cite this article

Abstract: Herbaceous peony (Paeonia lactiflora Pall.) is a well-known and traditional flower in China, occupying a significant position in Chinese traditional culture. The floral scent of the herbaceous peony however remains relatively understudied. The objective of this study was to investigate the floral composition of herbaceous peony by collecting and identifying floral volatiles from 100 cultivars, including P. lactiflora 'Hangbaishao', P. lactiflora 'Hongrongqiu', P. lactiflora 'Biandihong', P. lactiflora 'Zijin Daipao', P. lactiflora 'Zixia Yingxue', and P. lactiflora 'Fenchi Dicui'. The volatile compounds were collected using the dynamic headspace technique and identified through gas chromatography-mass spectrometry (GC-MS). The results demonstrated qualitative and quantitative variations in the floral fragrances emitted by the 100 cultivars, with a total of 16 volatiles belonging to six categories (six alkanes, three alcohols and esters, two terpenes, as well as one each of ether and phenol) being identified. However, it is notable that not all volatile categories were emitted by every cultivar. Moreover, while some compounds were present in all 100 herbaceous peony cultivars, others were exclusive to specific cultivars. The screening revealed that ten of the 16 identified flower volatile compounds exhibited unique floral components. It is noteworthy that benzene,1,4-dimethoxy-, was identified as the most prominent compound in several cultivars, including P. lactiflora 'Taohua Huancai', P. lactiflora 'Xishifen', P. lactiflora 'Dabanhong', P. lactiflora 'Fumantang', and P. lactiflora 'Zhushapan'. Furthermore, the clustering classification results demonstrated that benzene,1,4-dimethoxy-, exhibited the highest variable importance in projection (VIP) value of 3.153, as determined by partial least squares discriminant analysis (PLS-DA).

    • The herbaceous peony, a well-known traditional flower in China[1], is characterized by its large and aesthetically pleasing flowers. The herbaceous peony is a member of the family Paeoniaceae[2], displaying notable adaptability, and significant ornamental value[3]. Studies on aromatic ornamental plants involve an examination of aromatic components, and genetic mechanisms[4], including Rosa rugosa Thunb.[5], Lilium brownii var. viridulum Baker[6], and Paeonia suffruticosa Andr.[7], Pyrus communis L.[8], Dendrobium officinale [9], Nymphaea tetragona[10], Rhododendron simsii[11], Jasminum sambac[12], studies were conducted on Chrysanthemum morifolium[13], Osmanthus fragrans[14], Camellia japonica[15], Malus[16], and Iris tectorum Maxim.[17] Historically, research has focused on factors such as flower shape, color, blooming season, and resilience, with less attention given to the floral scent[18].

      The floral scent has been identified as a significant ornamental attribute of herbaceous peony[3,19], and is also a prominent feature in numerous plant species[20]. It is frequently described as the 'essence of flowers'[21] and is derived from a range of volatile compounds that are synthesized within the plant and subsequently released into the atmosphere[22]. To date, over 1,700 volatile compounds have been identified in a variety of plants, with a multitude of applications in the manufacture of perfumes, cosmetics, culinary seasonings, and pharmaceuticals[23,24]. The composition and concentration of these volatile compounds exhibit considerable variation across different species, genus, and cultivars. Nevertheless, there is a paucity of research dedicated to the analysis of fragrance constituents and their respective concentrations in herbaceous peony and tree peony[25]. Song et al.[4] identified a total of 130 volatile compounds across 30 cultivars of herbaceous peony, encompassing 72 aromatic constituents. The 24 cultivars exhibiting heightened fragrance were categorized into five distinct aroma profiles: woody scent, fruity scent, lily scent, rose scent, and an orange blossom scent. Zhao et al.[26] conducted a study in which 68 volatile compounds and 26 significant aroma constituents were identified from a sample of 87 herbaceous peony cultivars. The researchers determined that herbaceous peony contain characteristic aromatic substances, including linalool (resembling lily of the valley), geraniol (exhibiting a pleasant geranium-like scent), citronellol (evoking a fresh and light rose and leaf fragrance), and phenylethyl alcohol (noted for its distinctive rose aroma), based on the content and odor threshold of these main aroma components. In a separate study, Li et al.[27] identified 128 volatile compounds from 24 tree peony cultivars, with the predominant classes being terpenes, alcohols, and esters. The distribution pattern of these primary fragrance constituents led to the categorization of 24 tree peony cultivars into four types: grass scent (ocimene), woody scent (longifolene), lily of the valley scent (linalool), and fruity scent (2-ethyl hexanol). It has been demonstrated that the distinctive fragrances of different plant species are the result of the presence of specific volatile compounds in varying quantities and ratios. Furthermore, the quantity of fragrance emitted by flowers is contingent upon their developmental stage[28].

      Floral substances derived from plants are classified as secondary metabolites, which are released by flowering plants and predominantly comprise a range of volatile compounds characterized by relatively low molecular weights. In a comprehensive analysis of the aromatic compounds present in P. rockii and P. ostii 'Fengdan', Wu et al.[29] employed two-dimensional gas chromatography coupled with time-of-flight mass spectrometry (GC × GC-TOF/MS). The results indicated that the aroma profile of P. rockii was primarily characterized by the presence of alcohols, alkanes, and acids, while the aroma profile of P. ostii 'Fengdan' was predominantly defined by aldehydes, alcohols, and terpenes. In a separate investigation, Li et al.[30] sought to identify and analyze the volatile compounds present in the flowers of seven pear cultivars (Anli, Bayuesu, Golden, Brown Peel, KorlaXiangli, Lyubaoshi, and Xizilü). The findings indicated that certain aldehydes constitute significant characteristics of these cultivars and are recognized as essential active odorants, which emit pronounced citrus and floral fragrances. Yang et al.[31] successfully identified and characterized 34 volatile compounds in the Dendrobium officinale flowers. Of these, 18 compounds were identified as principal odorants, including 1-octen-3-ol, hexanal, nonanal, phenylacetaldehyde, linalool, 4-oxoisophorone, theaspirane, and methyl salicylate. Furthermore, Kimani et al.[32] identified geraniol, β-caryophyllene, 2-phenylethanol, citronellol, and 1,8-cineole as the primary aromatic constituents in 24 cultivars of herbaceous peony, including P. lactiflora 'LianTai' and P. lactiflora 'Hongyan Feishuang'. Aromatic compounds are recognized as the primary chemical constituents of aromatic plants, playing a crucial role in the synthesis of secondary metabolites[33], and fragrance development. These compounds exhibit a diverse range of forms. For example, phenethyl alcohol is found in rose, mint contains menthol, and lemon includes citric acid[22,34,35].

      This study employed a combination of dynamic headspace sampling technology[36] and GC-MS to analyze the volatile components and concentrations in 100 international herbaceous peony cultivars during the half-opening stage. The objective was to elucidate the aromatic profile of the herbaceous peony. The findings of this study establish a fundamental framework for further investigation and exploitation of the fragrances of herbaceous peony flowers and provide a valuable resource for enhancing the economic value of herbaceous peony.

    • The experimental materials used in this study were obtained from the Luoyang Academy of Agriculture and Forestry Sciences (Luoyang City, Henan Province, China) between 20 April and 8 May 2022. The majority of the materials were collected between 10 and 12 am. The subjects of the experiment were herbaceous peony plants sourced from the herbaceous peony resource garden affiliated with the Henan University of Science and Technology. As outlined in Table 1 and Fig. 1, herbaceous peony cultivars demonstrating consistent growth patterns and flowering stages were identified, and the methodology entailed the repetition of each sample on three occasions.

      Table 1.  Names and numbers of 100 herbaceous peony cultivars.

      100 herbaceous peony cultivars
      'Hangbaishao' 'Hongrongqiu' 'Biandihong' 'Zijin Daipao' 'Zixia Yingxue' 'Fenchi Dicui' 'Xishifen' 'Yinlong Hanzhu' 'Yinxian Xiuhongpao' 'Jindaiwei'
      'Luhong' 'Xueyuan Hongxing' 'Mozijin' 'Yahong' 'Wulong Tanhai' 'Hongyan Zhengshuang' 'Xingguang Chanlan' 'Yanlihong' 'Hongling Chijin' 'Fenzhuangyuan'
      'Taohua Huancai' 'Zhongshenghong' 'Ziling' 'Luxihong' 'Zifurong' 'Hongling Chijin' 'Huguang Shise' 'Hongyuqiu' 'Yanzhi Dianyu' 'Lantian Piaoxiang'
      'Zhushapan' 'Hongyun Yingri' 'Yanzi Xiangyang' 'Yanzhihong' 'Zaoyuanhong' 'ChilongCaifeng' 'Chaoshihong' 'Qingwen' 'Shaifugui' 'Ziyanshuang'
      'Gaoganfen' 'Qundiehui' 'Meirenmian' 'Meiju' 'Dafugui' 'Zhifeng Zhaoyang' 'Xueyuan Hongxing' 'Dahongpao' 'Zixiuqiu' 'Canglong'
      'Gaoganhong' 'Hongyan Feishuang' 'Dabanhong' 'Zifengyu' 'Hongpan Jinqiu' 'Hushui Dangxia' 'Yinlong Huihai' 'Baihuazi' 'Taohuafen' 'Wawamian'
      'Fenpanjinxing' 'Heixiuqiu' 'Shuanghonglou' 'Changshouhong' 'Hongyan Lushuang' 'Tuopan Jinhua' 'Hongling Chijin' 'Linglongyu' 'Jinzan Ciyu' 'Xiangyang Qihua'
      'Jinbian Hongge' 'Duoyezi' 'Fenzilou' 'Furong Jinhua' 'Fenkui' 'Guifei Chacui' 'Huolian Jingang' 'Hongguanfang' 'Fenmian Taohua' 'Taoranzui'
      'Zhaoyanghong' 'Hongfengyu' 'Fumantang' 'Shaonvfen' 'Danfeng' 'Liantaizi' 'Meiguihong' 'Fenfurong' 'Fenling Hongzhu' 'Fenqiu'
      'Fencuiqiu' 'FengChao Chuyu' 'Lanju' 'Jinsanhong' 'Zhaoyuanfen' 'Hongfeng' 'Qiaoling' 'Tuanye Jinqiu' 'Guohong' 'Tongquechun'
      The numbers 1−100 are listed from top to bottom, left to right respectively.
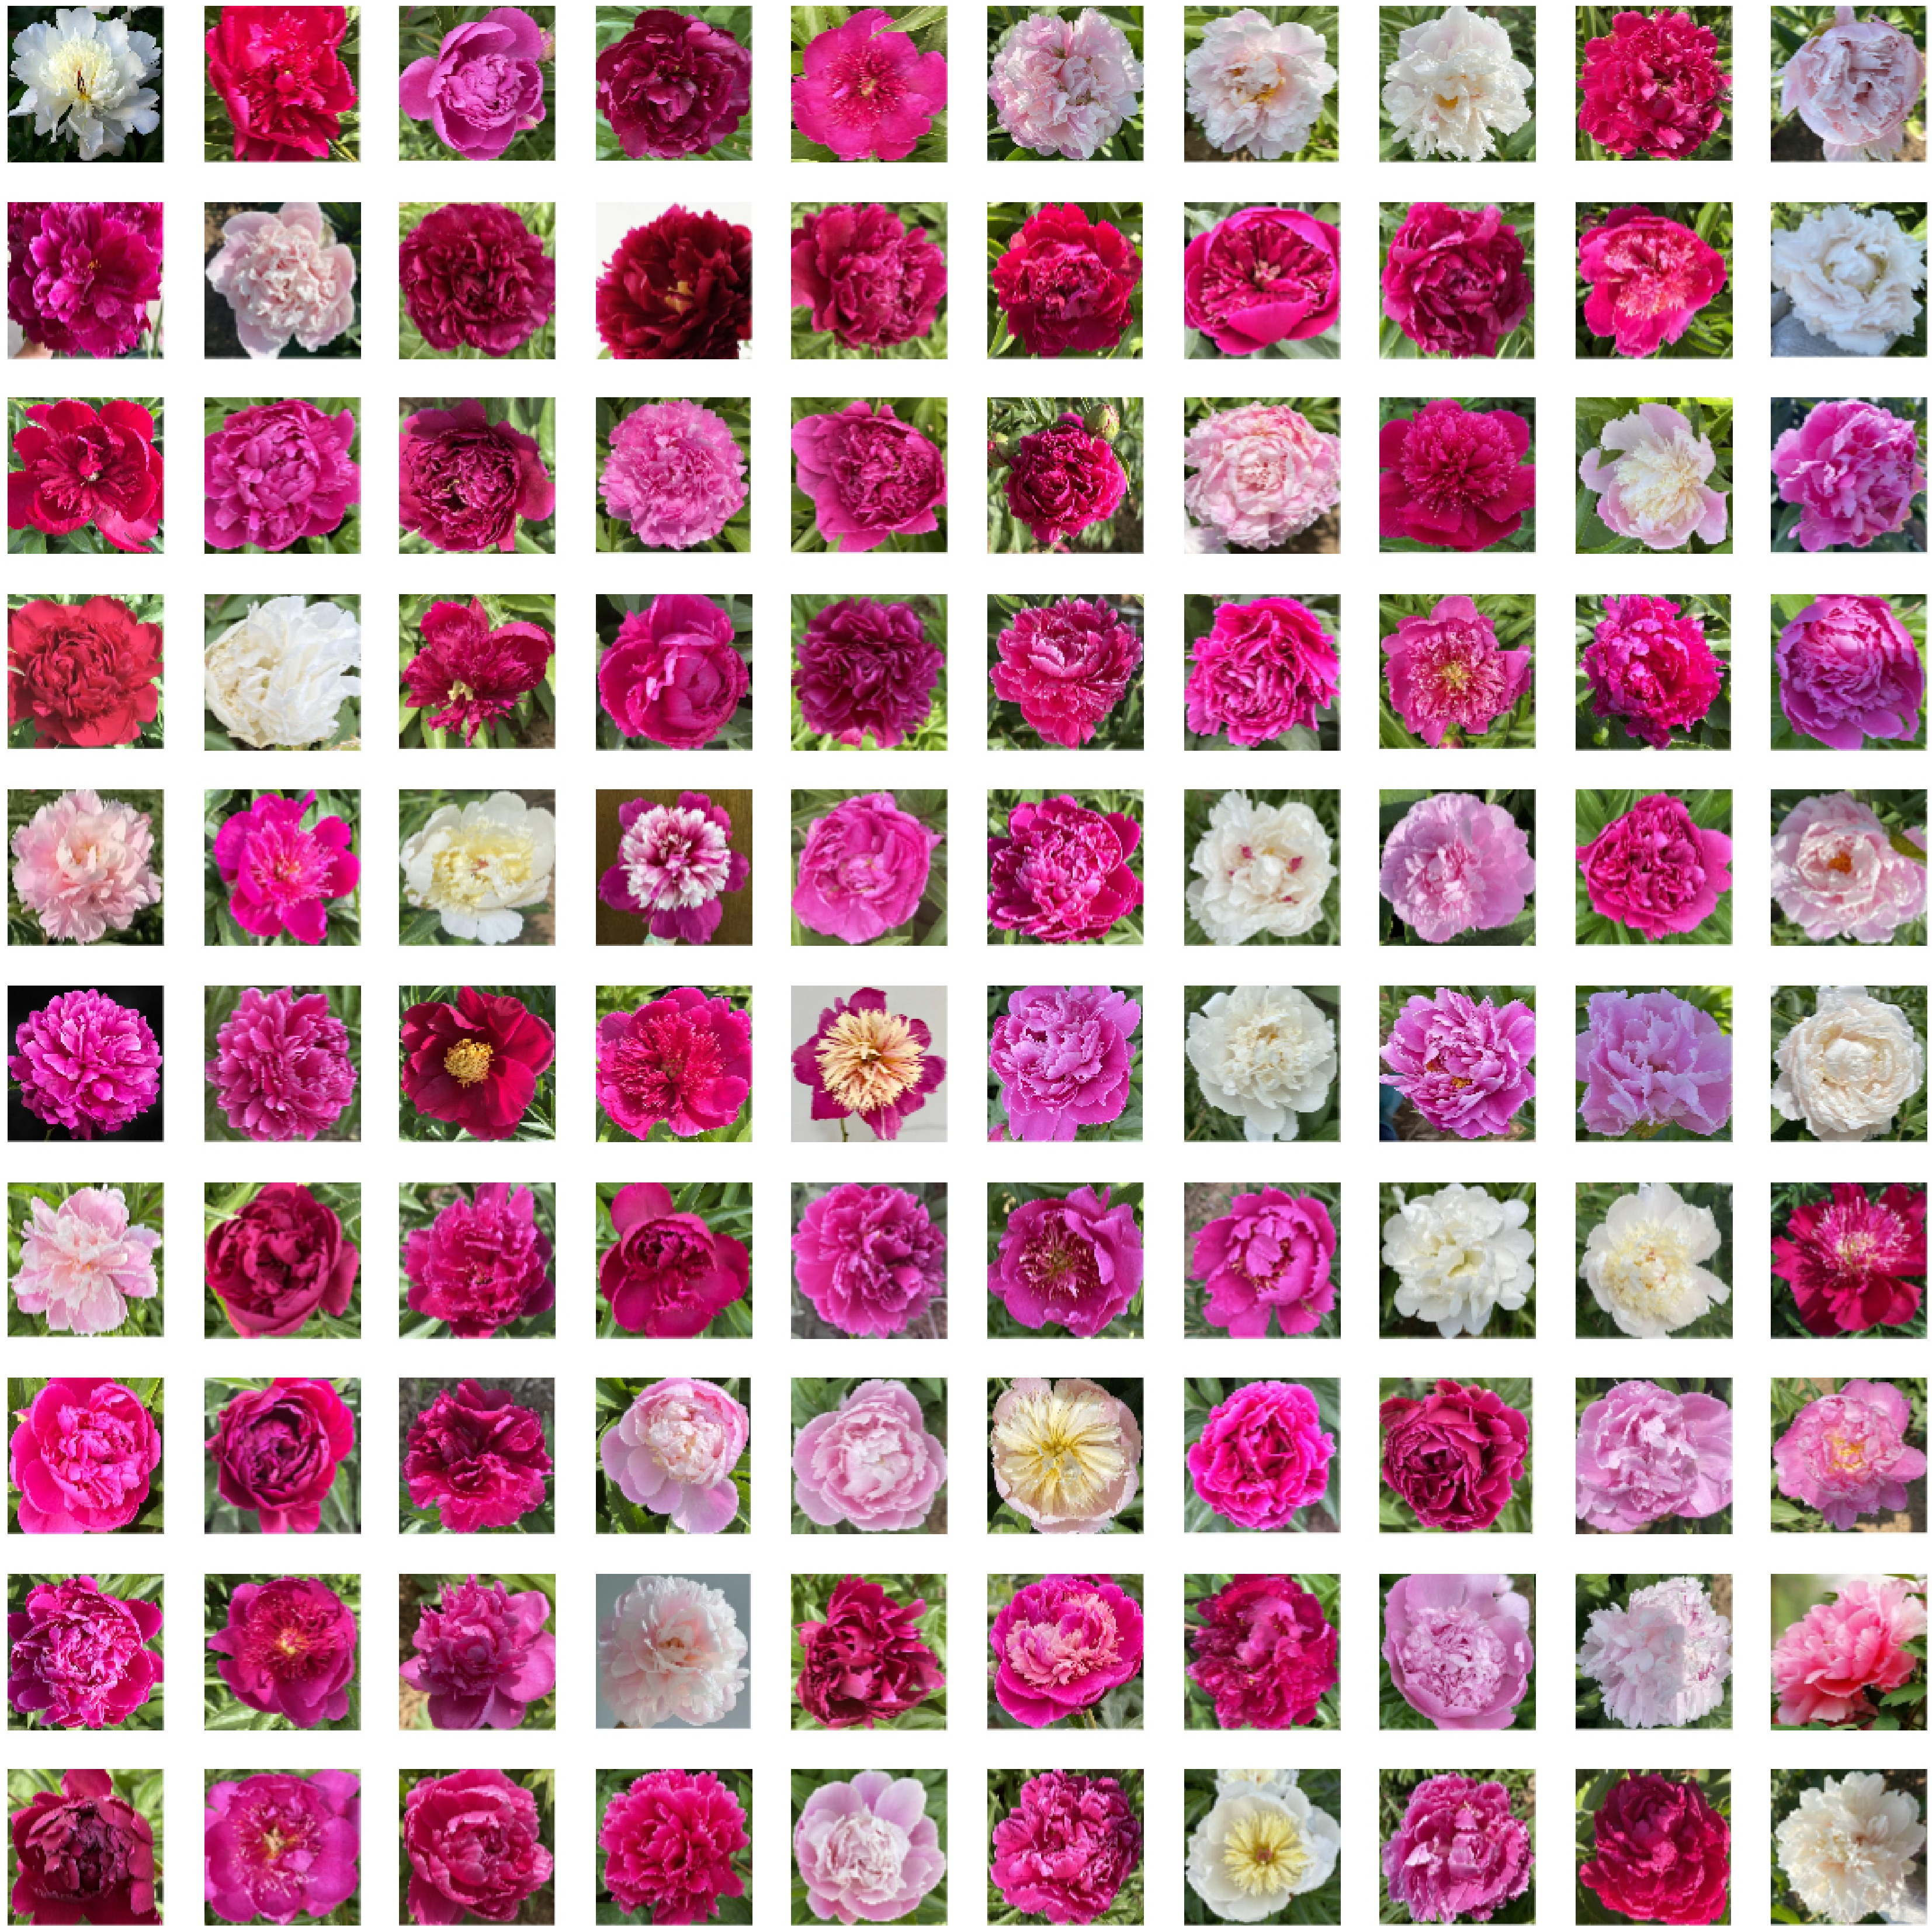
      Figure 1. 

      Morphological characteristics of 100 herbaceous peony cultivars at the half-opening stage. The order of the above pictures is relative to the order of cultivars in Table 1.

    • The Gas Chromatography-Mass Spectrometry System (GC8890-MS5977B) from Agilent Technologies, USA, and the Atmospheric Sampler QC-1S from the Beijing Institute of Labor Protection were utilized in the study.

    • The reagents used included Tenax TA as the adsorbent, ethyl caprate, dichloromethane, pentane, n-hexane of chromatography grade, ethyl decanoate, ethyl acetate, and a standard solution of n-alkane mixture (ranging from C8 to C40) obtained from Sigma-Aldrich, USA.

    • The dynamic headspace adsorption technique employed in this study was a sampling bag (355 mm × 508 mm, Reynolds, USA) hermetically sealed at one end with an activated carbon filter tube. The bag was meticulously wrapped around a live peony flower to minimize contact and prevent damage to the bag. The bag's opposite end was connected to a Tenax TA adsorption tube (6 mm outer diameter, 100 mm length, filled with adsorbent) and an atmospheric sampler via tasteless silicone tubing. The flow rate of the atmospheric sampler was set at 400 mL·min−1 and the sampling duration was 3 h. Following the sampling period, the adsorption tube was sealed with cling film and aluminum foil, then placed in a self-sealing bag and stored in an ultra-low temperature cooler for transport to the laboratory. The sample was then eluted with n-hexane during sample processing, and the eluate was transferred to a brown sample bottle for subsequent analysis.

      The following conditions were observed in the gas chromatography (GC) analysis: the chromatographic column employed is a flexible quartz capillary column, with a length of 30 mm, an internal diameter of 0.25 mm, and a pore size of 0.25 μm. The flow rate of the column is set at 1.2 mL·min−1. The temperature of the column is maintained according to a specific protocol. It is initially set at 70 °C and held for 1 min, then increased to 136 °C at a rate of 6 °C·min−1, followed by further increases to 138 °C at a rate of 1 °C·min−1, then to 142 °C at a rate of 2 °C·min−1, and finally to 143 °C at a rate of 0.5 °C∙min−1. The temperature is increased by 5 °C·min−1 and subsequently to 160 °C at a rate of 2 °C·min−1, before reaching 250 °C at a rate of 10 °C·min−1. The injector temperature is set at 250 °C, with a carrier gas of high-purity helium at a flow rate of 1 mL·min−1. The injection mode is a split injection, with a split ratio of 9:1, and the injection volume is 2 μL.

      The following conditions were employed for the mass spectrometry (MS) analysis: The electron impact (EI) source is operated at 70 eV, with the interface temperature set to 250 °C and the ion source temperature maintained at 230 °C. The quadrupole temperature is controlled at 150 °C, and the scan range is from 25 to 400 amu.

    • Before the analysis of the sample using gas chromatography, the 500 mg∙L−1 n-alkane mixed standard solution should be diluted with n-hexane at a ratio of 1:50, in accordance with the specified conditions for the chromatography. It is essential to record the retention time for each n-alkane and to compare the resulting Retention Index (RI) values with those documented in the literature to facilitate the identification of the compounds in question. The following formula is used to calculate the RI:

      RI=100×n+100×(txtn)/(tn+1tn)

      The location of the aforementioned item is as follows: The retention index (RI) represents the retention time of the volatile substances under examination. The number of carbon atoms in the straight-chain alkane preceding the analyte is represented by n. The retention time of the analyte is represented by tx. The retention time of the straight-chain alkane before the analyte is represented by tn. The retention time of the straight-chain alkane following the analyte is represented by tn+1. The retention time of the analyte falls between the retention times of tn and tn+1. Qualitative analysis of volatile components is conducted through consultation with the NIST 17 spectral library, with cross-referencing of RI values, literature sources, and other pertinent resources, including books.

    • An internal standard solution, comprising 69.32 mg∙L−1 of ethyl decanoate in ethyl acetate, is employed. A volume of 0.4 μL of the internal standard solution is added to each 80 μL sample. Subsequently, quantitative calculations are performed in accordance with the following formula:

      Contentofeacharomasubstance(μgg1)=PeakareaofeacharomasubstancePeakareaoftheinternalstandard×Concentrationoftheinternalstandard(mgL1)×Volumeoftheinternalstandard(μL)Volumeofthesample(g)×f

      where, f is the correction factor of each component to the internal standard, f = 1.

    • The analysis of variance can be conducted using the statistical software package SPSS, while graph plotting can be accomplished with the Origin 2022 software. The software Metaboanalyst and the Microbiome Analysis Platform are capable of performing data normalization, partial least squares discriminant analysis (PLS-DA), and cluster analysis.

    • An analysis was conducted to determine the main volatile compounds present in 100 herbaceous peony cultivars during the half-opening stage. This was achieved through the utilization of database retrieval and manual identification methods. The results are outlined in Table 2. A total of 16 volatile components were identified and classified into six distinct groups. The data revealed that alkanes constituted six types, representing 37.5% of the total volatile components. This was followed by four types of esters at 25%, three types of alcohols at 18.75%, and one type each of terpenes, ethers, and phenols, each accounting for 6.25% of the total volatile components. The results of this analysis indicate that the predominant categories of volatile compounds found in herbaceous peony cultivars are alkanes, esters, and alcohols.

      Table 2.  The volatile components of 100 herbaceous peony cultivars.

      Compound number RT (min) CAS number Compounds Compound classification Chemical formula Retention index
      Calculated value Reference value
      1 3.273 111-84-2 Nonane Alkanes C9H20 900 900
      2 4.805 124-18-5 Decane Alkanes C10H22 1,000 1,000
      3 5.727 13877-91-3 (Z)-β-ocimene Terpenes C10H16 1,038 1,037
      4 7.063 60-12-8 Phenylethyl alcohol Alcohols C8H10O 1,115 1,109
      5 8.133 150-78-7 Benzene,1,4-dimethoxy- Ethers C8H10O2 1,165 1,168
      6 9.502 106-22-9 Citronellol Alcohols C10H20O 1,228 1,228
      7 10.084 106-25-2 Nerol Alcohols C10H18O 1,220 1,219
      8 10.187 103-45-7 Methyl cinnamate Esters C10H12O2 1,260 1,258
      9 12.976 103-26-4 2-Propenoic acid,3-phenyl-,methyl ester Esters C10H10O2 1,389 1,380
      10 14.88 131-11-3 Dimethyl phthalate Esters C10H10O4 1,456 1,466
      11 16.174 629-62-9 Pentadecane Alkanes C15H32 1,500 1,500
      12 16.664 128-37-0 Butylated hydroxytoluene Phenols C15H24O 1,513 1,513
      13 19.877 544-76-3 Hexadecane Alkanes C16H34 1,600 1,601
      14 24.137 629-78-7 Heptadecane Alkanes C17H36 1,699 1,700
      15 31.517 84-74-2 Dibutyl phthalate Esters C16H22O4 1,964 1,907
      16 33.398 646-31-1 Tetracosane Alkanes C24H50 2,400 2,400
    • As illustrated in Fig. 2, alkane compounds were undetected in 30 cultivars, including P. lactiflora 'Hushui Dangxia', P. lactiflora 'Tuopan Jinhua', P. lactiflora 'Qiaoling', P. lactiflora 'Yinlong Hanzhu', and P. lactiflora 'Yanlihong'. Among the 100 herbaceous peony cultivars, the highest concentration of alkane compounds was observed in P. lactiflora 'Heizijin' (10.66 ± 2.01 μg·g−1), with the range of alkane compounds concentration spanning from 0.00 to 10.66 μg·g−1.
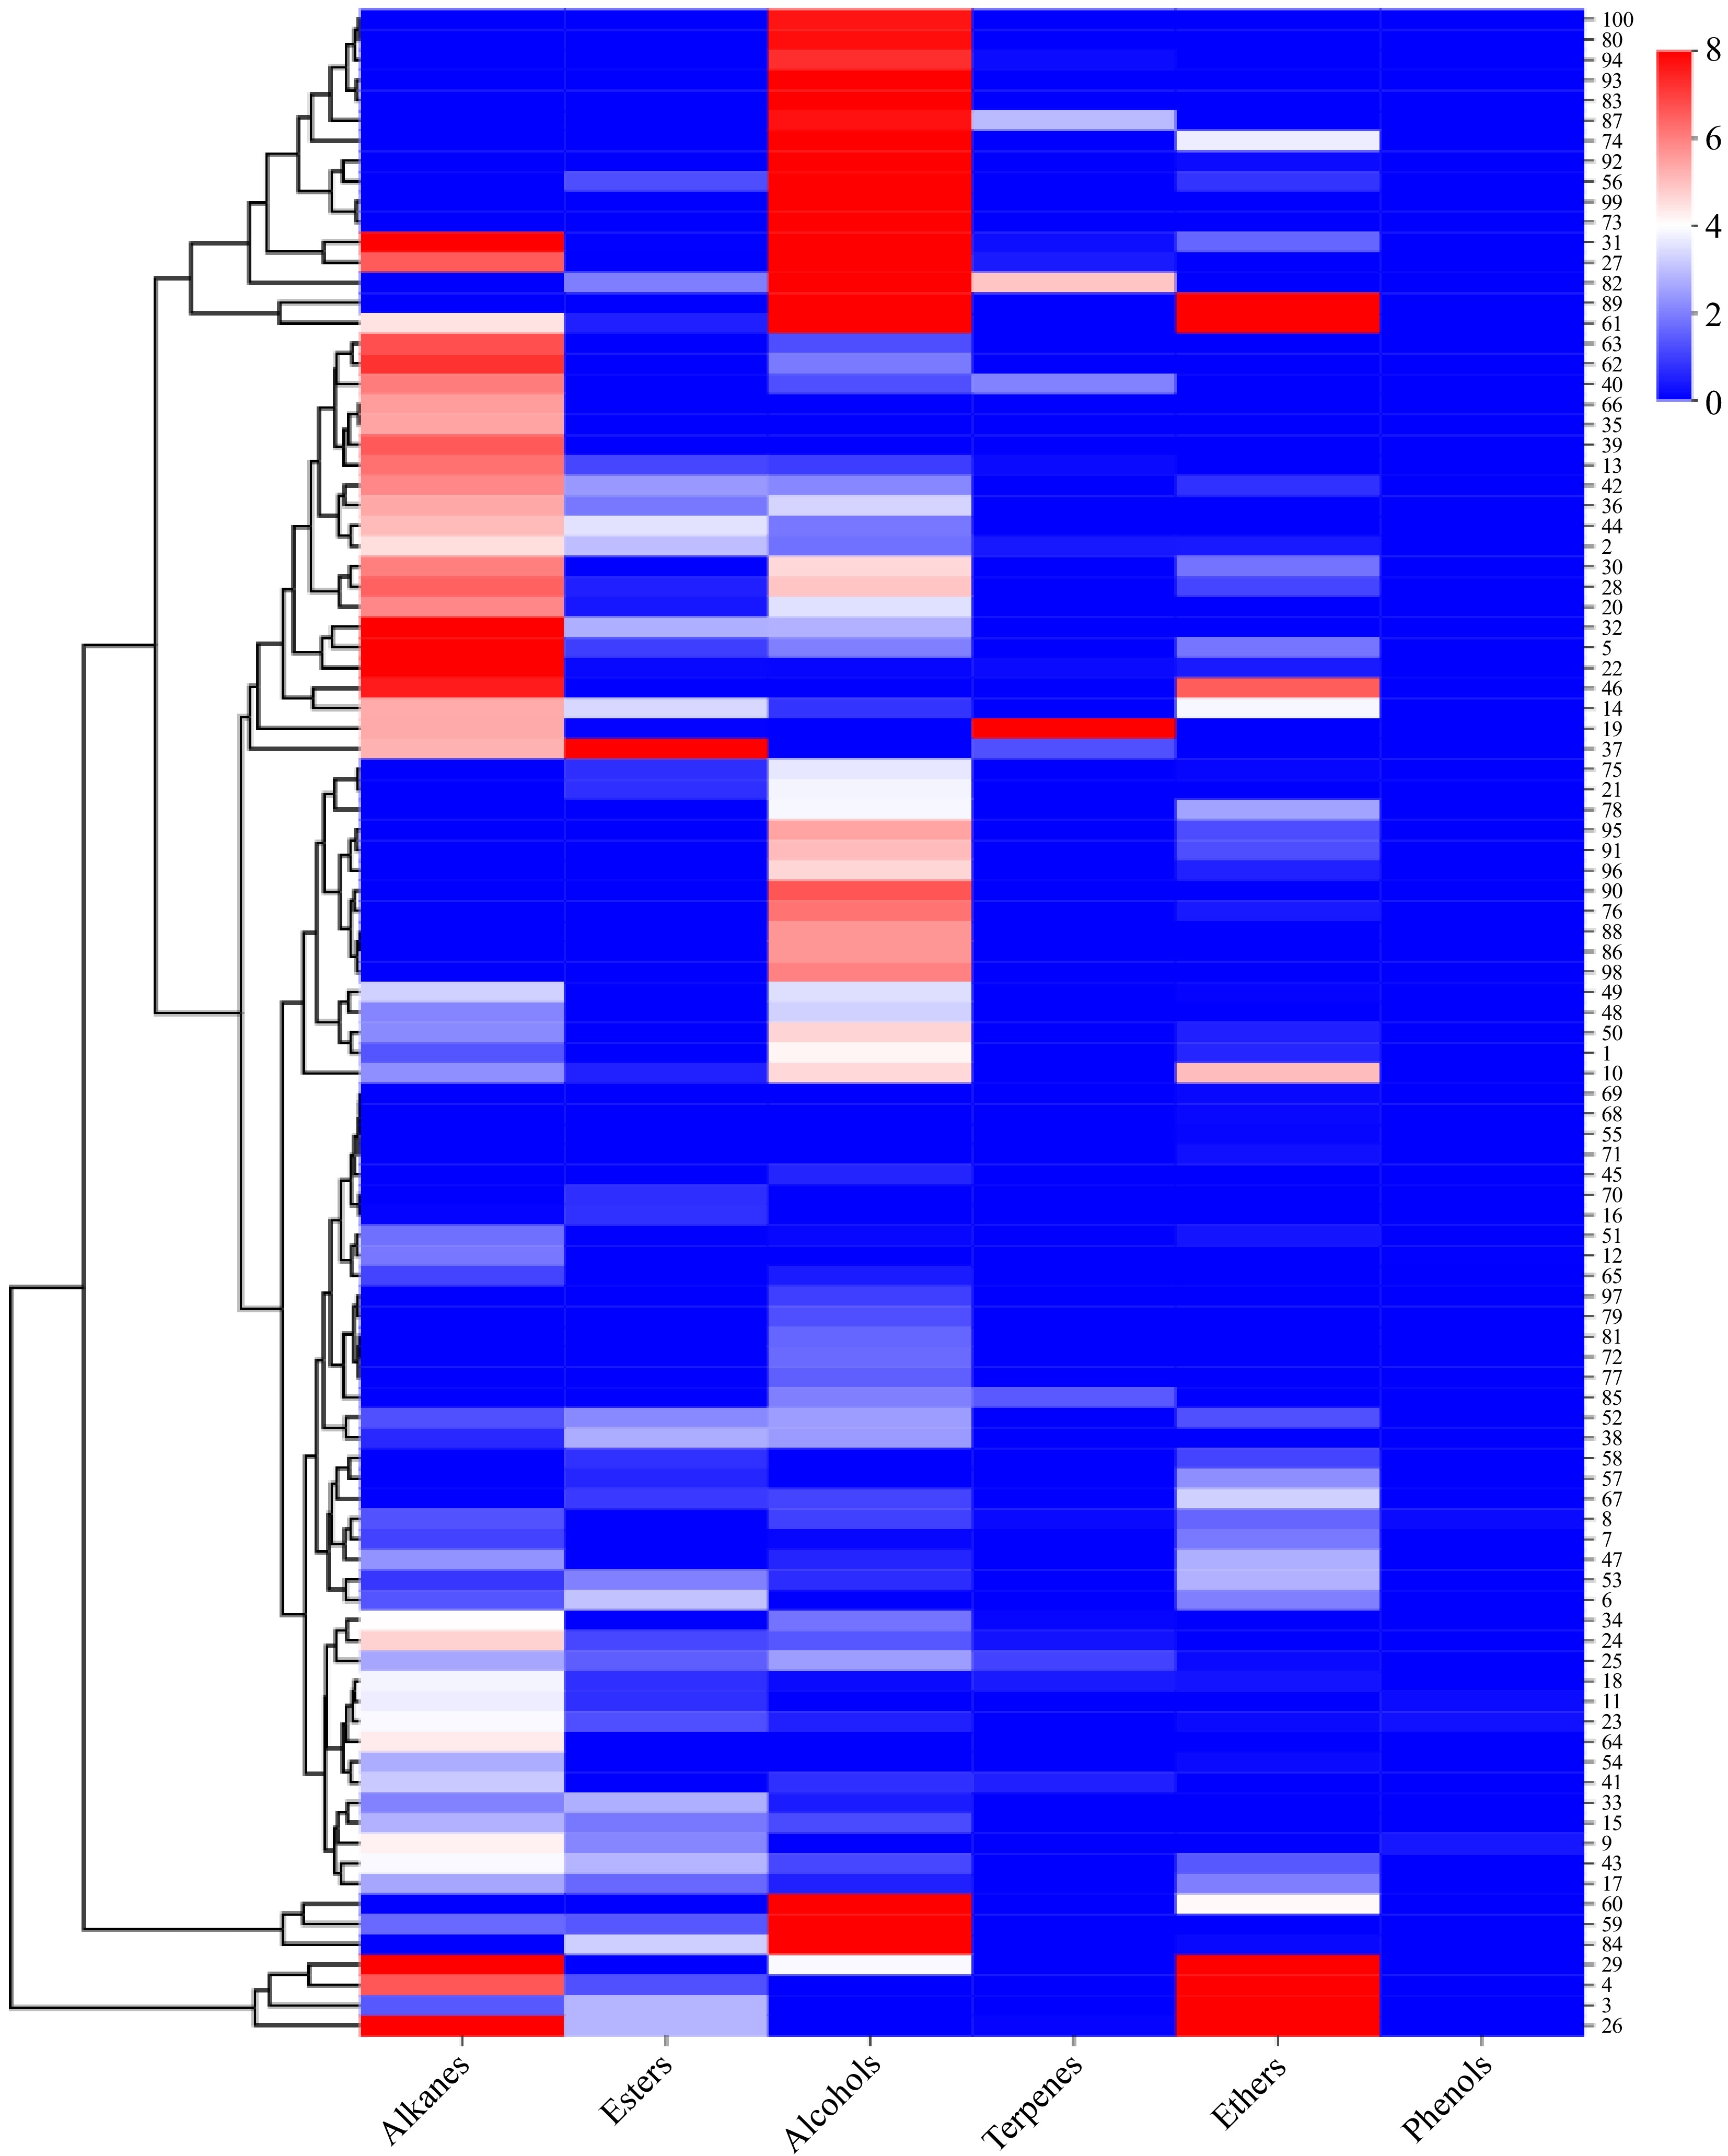
      Figure 2. 

      Comparative heat map depicting the release of six types of volatile compounds from various herbaceous peony cultivars.

    • As shown in Fig. 2, ester compounds were discernible in all 44 cultivars of herbaceous peony at the half-opening stage. However, the content of ester compounds was generally not notably high in most cultivars. The highest ester compounds content was observed in P. lactiflora 'Changshouhong' (9.15 ± 0.03 μg·g−1), followed by P. lactiflora 'Zaoyuanhong' (3.55 ± 0.40 μg·g−1), P. lactiflora 'Hongyun Yingri' (3.37 ± 0.11 μg·g−1), and P. lactiflora 'Saifugui' (3.25 ± 0.67 μg·g−1). The ester compounds content among these three cultivars was found to be similar, with a range of 0.00 to 9.15 μg·g−1.

    • As depicted in Fig. 2, the majority of the 100 cultivars of herbaceous peony at the half-opening stage exhibited the presence of alcohol compounds. Only 23 cultivars, including P. lactiflora 'Taohua Huancai', P. lactiflora 'Zhushapan', and P. lactiflora 'Gaoganhong' exhibited no detection. The highest alcohol compounds content was observed in P. lactiflora 'Hongfeng' (22.98 ± 3.86 μg·g−1), which was significantly higher than that of other herbaceous peony cultivars. Subsequently, P. lactiflora 'Wandai Shengse' (16.23 ± 2.28 μg·g−1) exhibited the second-highest alcohol compounds content, with a range of 0.00 to 22.98 μg·g−1.

    • As illustrated in Fig. 2, only 19 of the herbaceous peony cultivars exhibited detectable levels of terpene compounds, with significant differences in content (p < 0.05). The highest content was observed in P. lactiflora 'Hongfengyu' (8.19 ± 1.02 μg·g−1), followed by P. lactiflora 'Wandai Shengse' (4.93 ± 0.09 μg·g−1), P. lactiflora 'Jinzan Ciyu' (2.92 ± 1.75 μg·g−1), P. lactiflora 'Dabanhong' (0.07 ± 0.13 μg·g−1), P. lactiflora 'Jinbian Hongge' (0.14 ± 0.23 μg·g−1), and P. lactiflora 'Mozi Hanjin' (0.16 ± 0.28 μg·g−1), among others. The range of terpene compounds content was found to vary from 0.00 to 8.19 μg·g−1.

    • The analysis of 50 herbaceous peony cultivars revealed the presence of ether compounds in all samples, with notable variations in their content (p < 0.05). The highest content of ether compounds was observed in P. lactiflora 'Dabanhong' (22.84 ± 2.15 μg·g−1), followed by P. lactiflora 'Taohua Yingcai' (19.53 ± 2.44 μg·g−1). The lowest levels were observed in P. lactiflora 'Danfeng' (0.06 ± 0.11μg·g−1), P. lactiflora 'Ziling' (0.15 ± 0.26 μg·g−1), and P. lactiflora 'Huolian Jingang' (0.12 ± 0.21 μg·g−1). The range of ether compounds content was observed to vary from 0.00 to 22.84 μg·g−1.

    • The analysis revealed that only five herbaceous peony cultivars exhibited discernible levels of phenol compounds, namely P. lactiflora 'Jinbian Hongge' (0.15 ± 0.05 μg·g−1), P. lactiflora 'Zhaoyanghong' (0.34 ± 0.02 μg·g−1). The remaining cultivars exhibited lower levels of phenol compounds, with the lowest concentration observed in P. lactiflora 'Hongrongqiu' (0.17 ± 0.03 μg·g−1), followed by P. lactiflora 'Xueyuan Honghua' (0.01 ± 0.02 μg·g−1), and P. lactiflora 'Ziling' (0.27 ± 0.05 μg·g−1). The five cultivars exhibited notably lower levels of phenol compounds, with values consistently below 1 μg·g−1. The remaining cultivars were found to be devoid of phenol compounds.

    • The analysis of the 16 volatile compounds detected revealed that, aside from alkanes such as nonane, the remaining 10 compounds from five classes all exhibited characteristic aromas, as detailed in Table 3. These aromatic compounds were present in the majority of samples, with concentrations exceeding 0.01 μg·g−1. Of particular note is the detection of benzene,1,4-dimethoxy-, in the majority of samples, with relatively high concentrations observed (Fig. 3).

      Table 3.  Characteristics of aroma compounds.

      No. Compound name Odor characteristics
      1 (Z)-β-ocimene The scent of grass and flowers is accompanied by the aroma of orange blossom oil[37]
      2 Phenylethyl alcohol Sweet rose-like fragrance[38]
      3 Benzene,1,4-dimethoxy- The fragrance of cloves[39]
      4 Citronellol Has a sweet rose aroma[40]
      5 Nerol There is a sweet rose fragrance[41]
      6 Acetic acid, 2-phenylethyl ester There is a reminiscent of honey-like floral fragrance[42]
      7 Methyl cinnamate Sweet smelling fragrance[43]
      8 Dimethyl phthalate The substance emits a delicate fragrance[44]
      9 Butylated hydroxytoluene The presence of a carbonic acid taste can
      influence the aroma of wine[45]
      10 Dibutyl phthalate The substance emits a delicate fragrance[46]
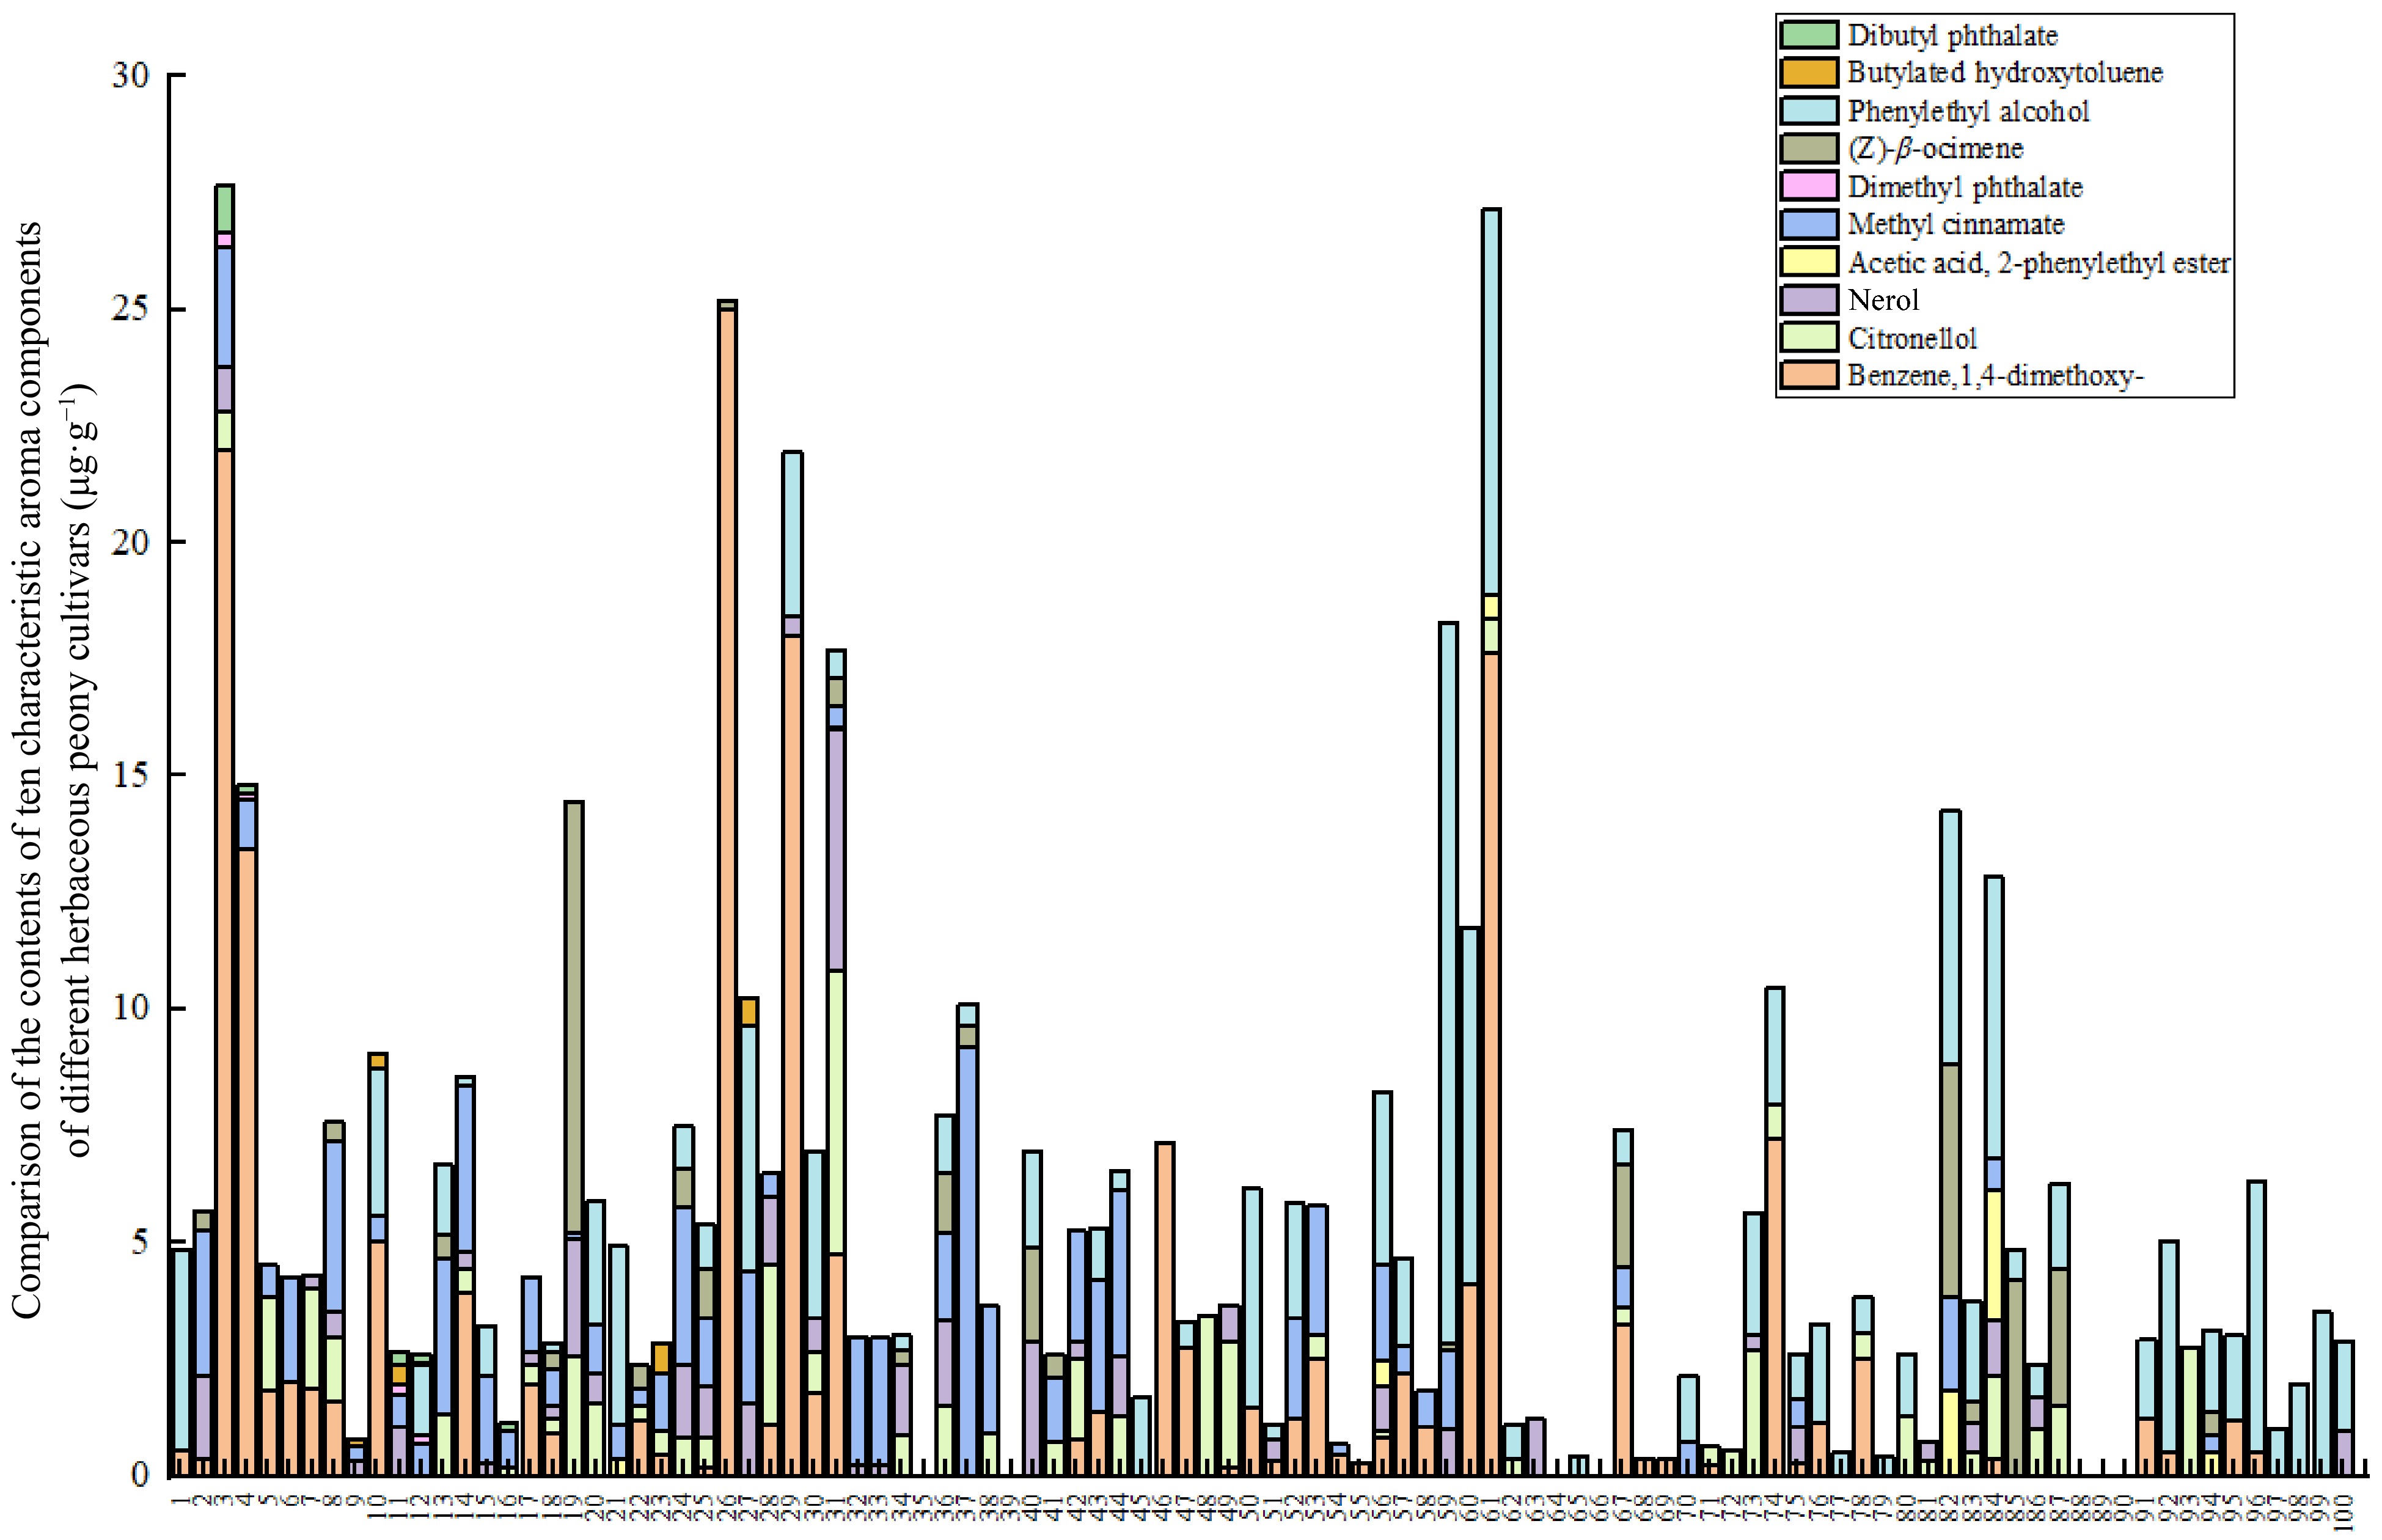
      Figure 3. 

      Content of characteristic aroma compounds in herbaceous peony cultivars.

    • A data matrix of dimensions 100 × 10 was constructed, representing the content of 10 aromatic compounds in 100 herbaceous peony cultivars as variables. A cluster heatmap was generated using the microbiome analysis platform, as illustrated in Fig. 4. In light of the clustering results and a comprehensive consideration of the major aromatic components, the 100 herbaceous peony cultivars are ultimately classified into two groups (Table 4). The first group of herbaceous peony cultivars is distinguished by a marked prevalence of benzene,1,4-dimethoxy-, with markedly elevated levels in comparison to other cultivars. This gives rise to a pronounced clove scent, indicative of a clove floral type. This initial classification is based on the presence of specific compounds and is therefore applicable to only five cultivars. The cultivars in question are P. lactiflora 'Taohua Huancai', P. lactiflora 'Xishifen', P. lactiflora 'Dabanhong', P. lactiflora 'Fumantang', and P. lactiflora 'Zhushapan'. The second group generally exhibits lower levels of aromatic compounds, resulting in milder scents that may be characterized as a light floral type. The second group comprises 95 cultivars, including representative cultivars such as P. lactiflora 'Meiju', P. lactiflora 'Shaonvfen', P. lactiflora 'Fenmian Taohua', P. lactiflora 'Fenling Hongzhu', and P. lactiflora 'Guohuo', among others.
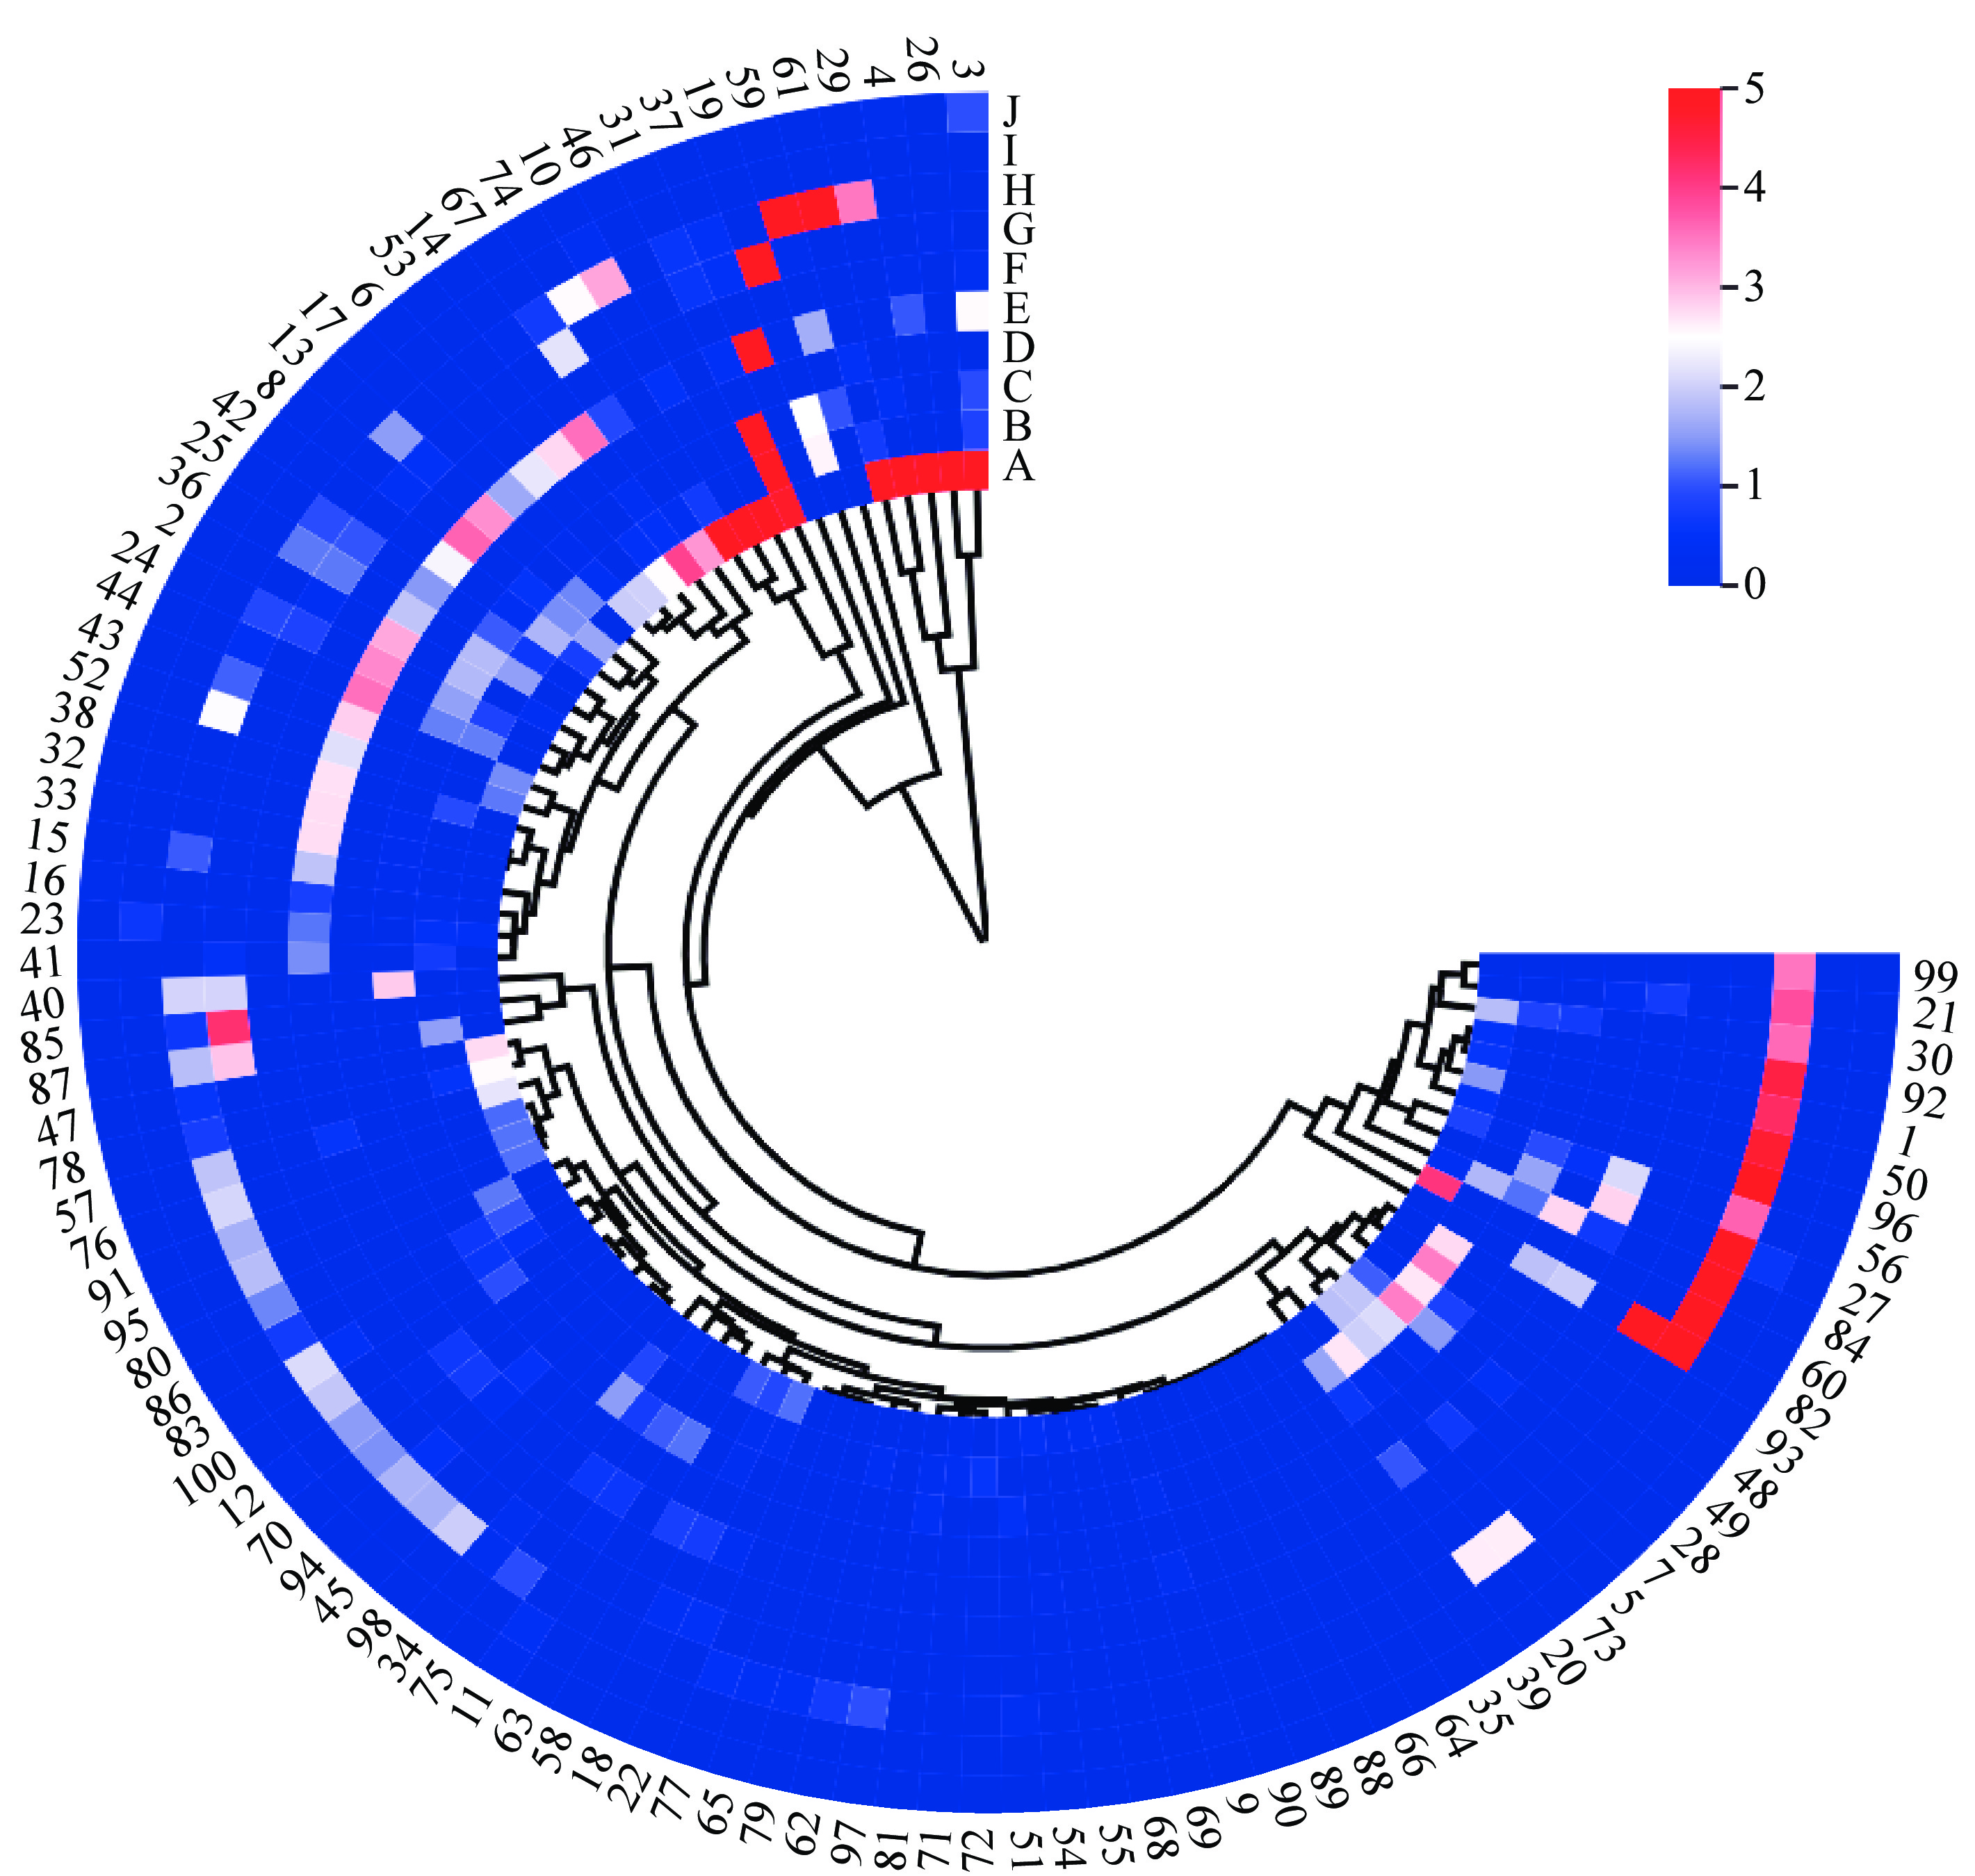
      Figure 4. 

      Heat map showing the clustering analysis of 100 herbaceous peony cultivars. A-Benzene,1,4-dimethoxy-, B-Citronellol, C-Nerol, D-Acetic acid, 2-phenylethyl ester, E-Methyl cinnamate, F-Dimethyl phthalate, G-(Z)-β-ocimene, H-Phenylethyl alcohol, I-Butylated hydroxytoluene, J-Dibutyl phthalate. The numbers 1−100 correspond to the cultivar names listed in Table 1.

      Table 4.  Cluster analysis of characteristic aroma components in different herbaceous peony cultivars.

      Groups Herbaceous peony cultivars
      1 'Taohua Huancai', 'Xishifen', 'Dabanhong', 'Fumantang', and 'Zhushapan'
      2 'Liantaizi', 'Hushui Dangxia', 'Shaifugui', 'Hongfeng', 'Wandai Shengse', 'Zhaoyuanfen', 'Wawamian', 'Lanju', 'Shuanghonglou', 'Fenling Hongzhu', 'Guohuo', 'Fenmian Taohua', 'Yinlong Tanhai', 'Chaoshihong', 'Shaonvfen', 'Meiju', 'Huolian Jingang', 'Meiguihong', 'Chilong Huancai', 'Yinlong Hanzhu', 'Yanlihong', 'Zhaoyanghong', 'Yinxian Xiuhongpao', 'Fenchi Dicui', 'Xueyuan Hongxing', 'Fenfurong', 'Linglongyu', 'Xiangyang Qihua', 'Hongrongqiu', 'Huguang Shise', 'Yanzhihong', 'Duoyezi', 'Mozijin', 'Guifei Chacui', 'Ziling', 'Zixia Yingxue', 'Zixiuqiu', 'Jinzan Ciyu', 'Meirenmian', 'Zifengyu', 'Jinshanhong', 'Hongyan Lushuang', 'Hongguanfang', 'Jindaiwei', 'Canglong', 'Tuopan Jinhua', 'Huolian Chijin', 'Fengchao Chuyu', 'Hongyuqiu', 'Xueyuan Hongxing', 'Qiaoling', 'Dahongpao', 'Qundiehui', 'Tuanye Jinqiu', 'Dafugui', 'Taoranzui', 'Yanzhi Dianyu', 'Tongquechun', 'Ziyanshuang', 'Gaoganfen', 'Fenpan Jinxing', 'Fenkui', 'Lantian Piaoxiang', 'Zifeng Zhaoyang', 'Xingguang Canlan', 'Hongyan Feishuang', 'Biahuazi', 'Taohuafen', 'Danfeng', 'Hongfengyu', 'Fenzilou', 'Yanzi Xiangyang', 'Zaoyuanhong', 'Luhong', 'Yahong', 'Luxihong', 'Furong Jinhua', 'Jinbian Hongge', 'Wulong Tanhai', 'Zhongshenghua', 'Zifurong', 'Hongyan Zhengshuang', 'Gaoganhong', 'Heixiuqiu', 'Hongling Chijin', 'Hongyun Yingri', 'Changshouhong', 'Fencuiqiu', 'Qingwen', 'Hongpan Jinqiu', 'Zijin Daipao', 'Biandihong', 'Fenqiu', 'Hangbaishao' and 'Fenzhuangyuan'
    • Following the clustering of 100 cultivars into two groups, a partial least squares discriminant analysis (PLS-DA) was conducted on the content of 10 aroma compounds in the 100 cultivars using Metaboanalyst software. The results of the analysis are presented in Fig. 5. The PLS model for aroma compounds demonstrated satisfactory reliability, as evidenced by R2 and Q2 values of 0.702 and 0.598, respectively. Moreover, the PLS-DA results demonstrated variations in the profile of aroma compounds between the two groups of cultivars (Fig. 5a). The application of a VIP criterion greater than 1 identified a differentiating component (Fig. 5b). The VIP values in the PLS-DA model provided further insight into the contribution of each component to the model, with components having a value of VIP > 1 being considered significant. For instance, benzene,1,4-dimethoxy-, exhibited a VIP value of 3.153 and was identified as a principal component accountable for the discrepancies among herbaceous peony cultivars (Fig. 5b), corroborating the findings of the clustering analysis. It can therefore be posited that benzene,1,4-dimethoxy- is a characteristic aroma component of these herbaceous peony cultivars.
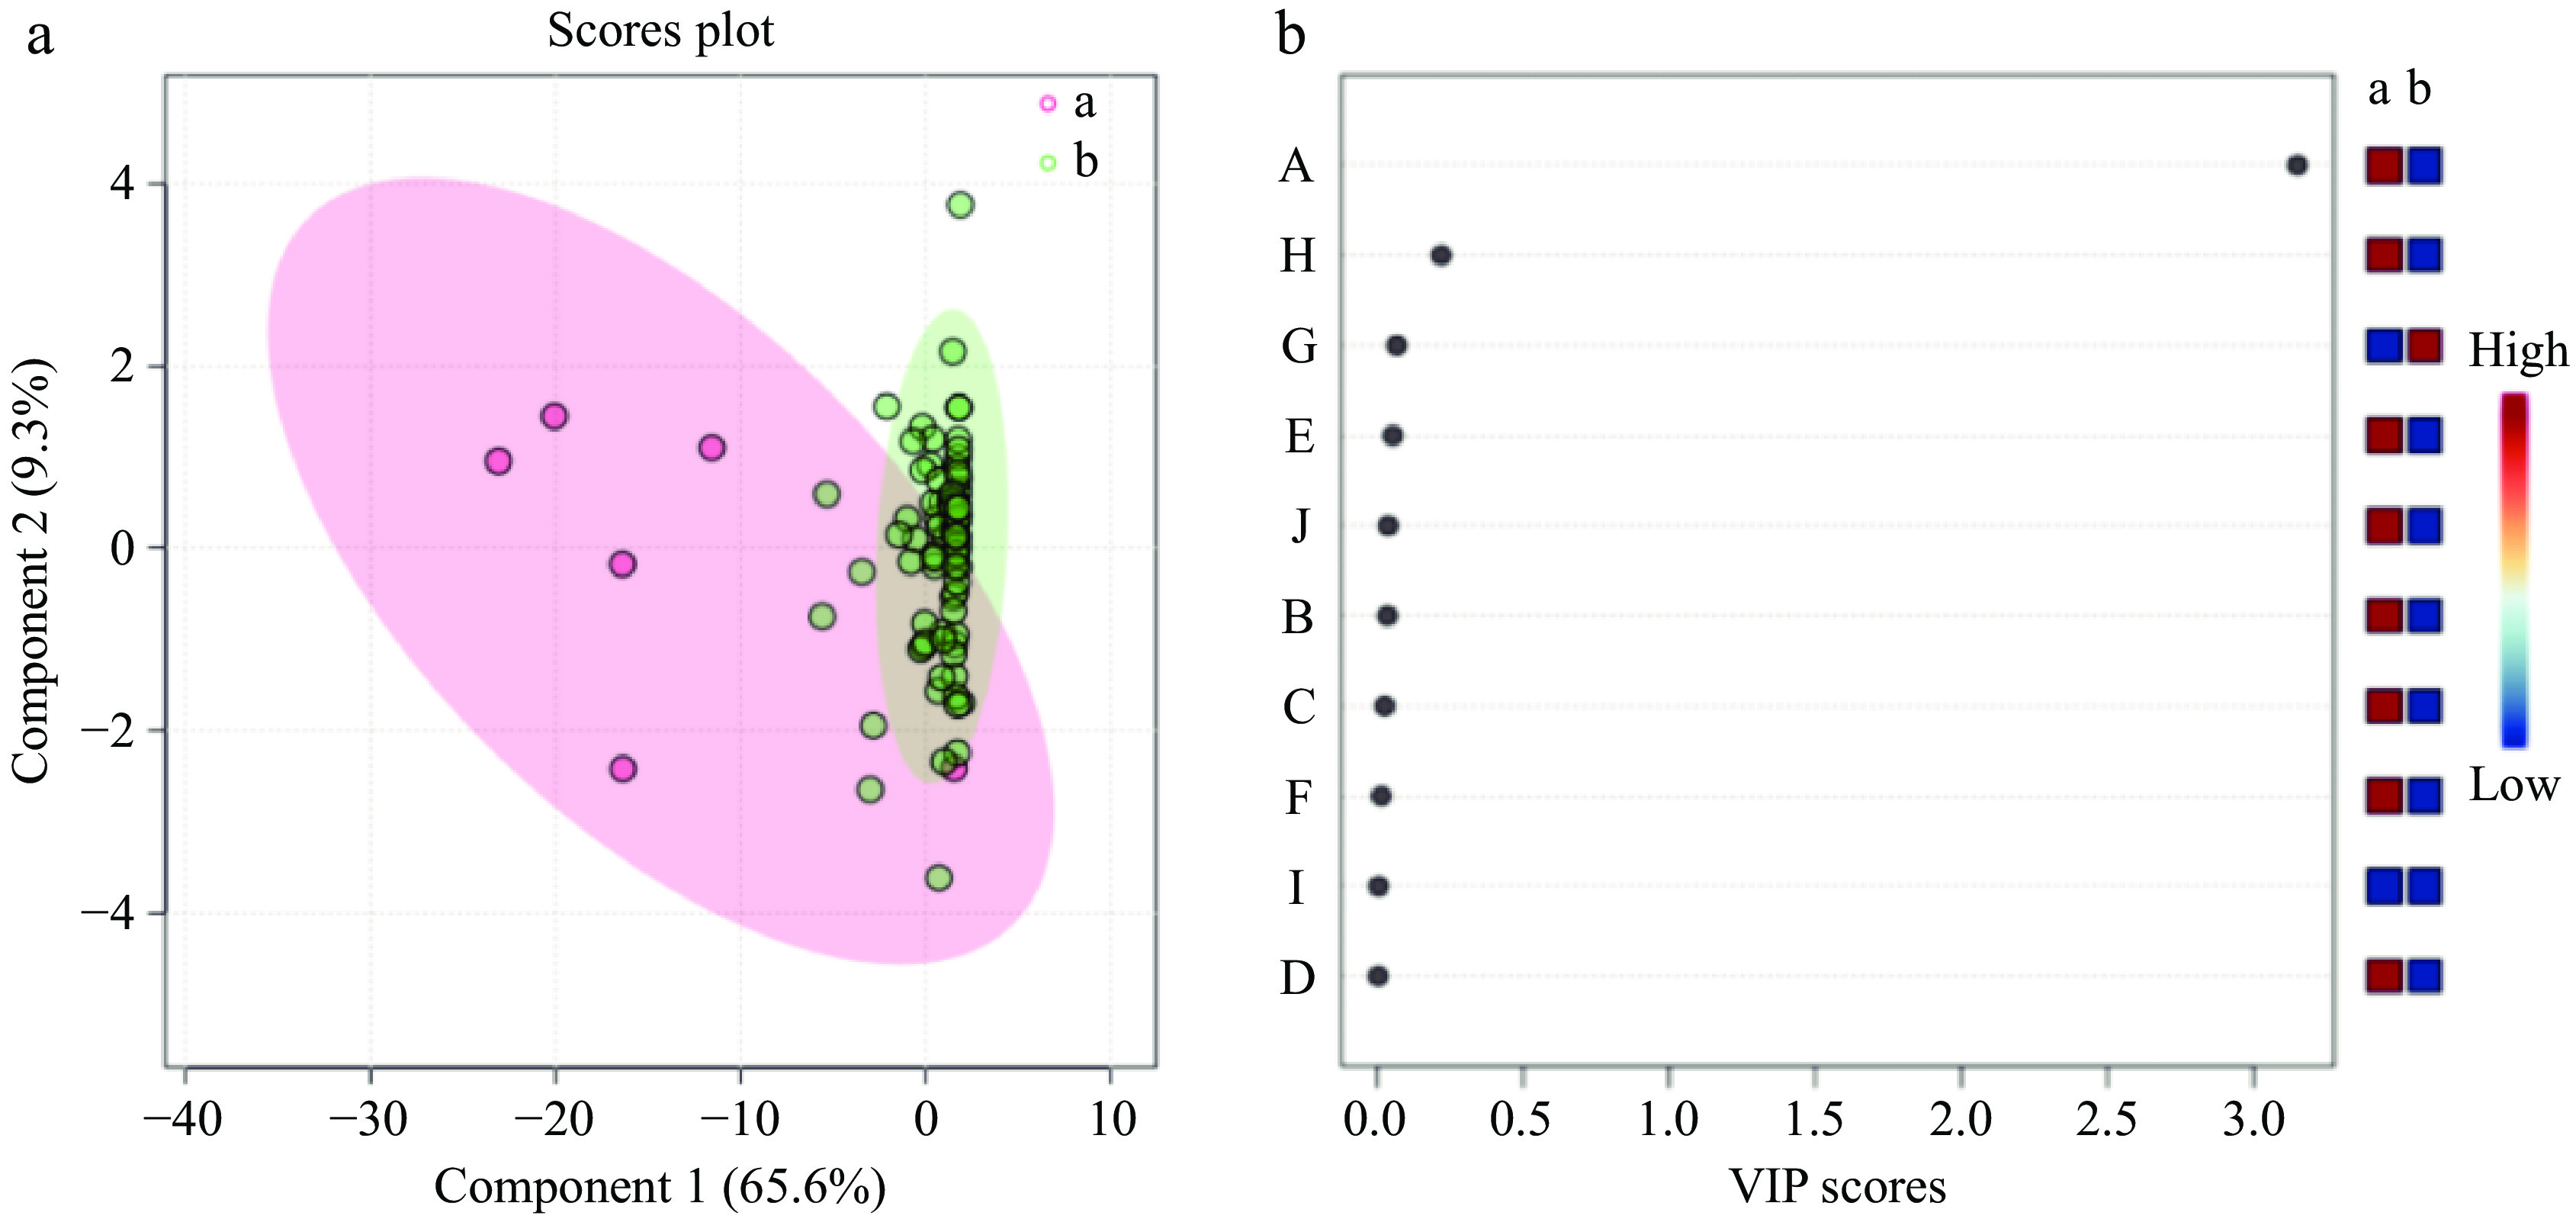
      Figure 5. 

      PLS-DA scores of 100 herbaceous peony cultivars under two cluster groups.

      Variables A and B represent the first and second categories, respectively. The specific variables include A-Benzene,1,4-dimethoxy-, B-Citronellol, C-Nerol, D-Acetic acid, 2-phenylethyl ester, E-Methyl cinnamate, F-Dimethyl phthalate, G-(Z)-β-ocimene, H-Phenylethyl alcohol, I-Butylated hydroxytoluene, J-Dibutyl phthalate.

    • The present study comprises a comprehensive identification and analysis of the volatile constituents present in 100 herbaceous peony cultivars during the half-opening stage. The findings indicated that alkanes, alcohols, and ethers were the most prevalent volatile compounds, with benzene,1,4-dimethoxy- was identified as the distinctive aromatic components.

      One such molecule is benzene,1,4-dimethoxy-, a methoxylated aromatic volatile compound that is known to elicit physiological and behavioral responses in a diverse range of insect pollinators. It serves as a principal floral volatile in a number of plant species belonging to diverse genera, including Salix, Lithophragma, Nelumbo, Catasetum, Allium, and Fragaria[47]. Wang et al.[40] identified the common floral component, benzene,1,4-dimethoxy-, in all eight herbaceous peony cultivars. Furthermore, Kimani et al.[32] identified 95 volatile organic compounds in 24 herbaceous peony cultivars, including benzene,1,4-dimethoxy-, which is a phenolic methyl ether containing a benzene skeleton but not derived from aromatic amino acids. Rather, it is a member of a particular chemical class that is responsible for the olfactory characteristics of specific plant varieties. The types and contents of volatile components of herbaceous peonies may be associated with the sampling method, sampling location and time. Additionally, the types and contents of volatile compounds in plants may be influenced by different planting environmental conditions[48].

      In recent years, there has been a growing emphasis on the natural floral volatiles present in herbaceous peonies, with the fragrance components demonstrating a diverse range of applications in the fields of healthcare, perfumes, and cosmetics[49]. Floral scent represents a significant component of plant volatiles, which are primarily composed of terpenes, aromatic hydrocarbons, fatty acids, and their derivatives, as well as sulfur and nitrogen-containing compounds[27,50]. These compounds are taxonomically categorized into three primary classes, contingent upon their biogenic origins, namely fatty acid derivatives, phenylpropanoids/benzenoids, and terpenoids[51]. In the present study, the volatile components of the 100 cultivars of herbaceous peony were predominantly identified as alkanes, esters, and alcohols. The most abundant type of compound was identified as alkanes. The available evidence suggests that straight-chain alkanes represent the primary constituents of plant leaf wax[52]. These waxes are not exclusive to leaves but may also be found on other plant organs, including flowers and fruit surfaces[53]. This indicates that wax layers may cover the surfaces of the majority of herbaceous peony cultivars. Alcohols play a significant role in the fragrance industry, serving as essential raw materials for synthetic fragrances and as an indispensable component in perfumery[54]. The presence of abundant ether compounds results in the production of pleasant floral and fruity aromas, while simultaneously enhancing the richness, typicality, and complexity of plant fragrances[55].

      However, due to the constraints of the existing literature, some volatile components, such as specific alkanes, have not yet been conclusively identified as fragrance components. Further research is required to ascertain whether these components contribute to the fragrance of herbaceous species. Alkane compounds have relatively high thresholds[56] and make minimal contributions to the overall scent[28]. Accordingly, the analysis of fragrance compounds excludes the contributions made by nonane, decane, pentadecane, hexadecane, heptadecane, and tetracosane.

    • This study employed dynamic headspace bag adsorption of live plant materials and gas chromatography-mass spectrometry (GC-MS) analysis techniques to identify a total of 16 volatile components in 100 herbaceous peony cultivars at the half-opening stage[57]. The components were primarily categorized into six major groups: alkanes, esters, alcohols, terpenes, ethers, and phenols. The predominant volatile compounds were alkanes, alcohols, and ethers, while benzene,1,4-dimethoxy- was identified as the main aromatic component. Significant variations in the total content of the main aromatic components were observed among the different herbaceous peony cultivars at the half-opening stage. In particular, P. lactiflora 'Taohua Huancai', P. lactiflora 'Xishifen', P. lactiflora 'Dabanhong', P. lactiflora 'Fumantang', and P. lactiflora 'Zhushapan' exhibited the highest content of aromatic components, resulting in a more intense floral fragrance. The intensity and characteristics of the aroma exhibited notable variation among different herbaceous peony cultivars, attributable to differences in the quantity and composition of the aromatic components. This is a crucial indicator for evaluating the quality of herbaceous peony. This study provides a theoretical foundation for understanding the formation and regulation mechanisms of herbaceous peony aroma characteristics, while also offering technical support for accelerating industrial development and utilization of herbaceous peony aromas.

      • This research was funded by the Science and Technology Innovation Talents in Universities of Henan Province (Grant No. 22HASTIT036) and the Project of Henan Province Traditional Chinese Medicine Industry Technology System (Grant No. 2024-24).

      • The authors confirm contribution to the paper as follows: study conceptualization, reviewing, editing and funding acquisition: Guo L; material preparation: Wang A, Luo Y, Niu T, Zhao X, Gao K; data curation: Wang A, Luo Y, Niu T, Wang S; draft manuscript preparation: Wang A, Luo Y; manuscript reviewing and editing: Hou X. All authors reviewed the results and approved the final version of the manuscript.

      • All data generated or analyzed during this study are included in this published article.

      • The authors declare that they have no conflict of interest.

      • # Authors contributed equally: Aixin Wang, Yasang Luo

      • Copyright: © 2024 by the author(s). Published by Maximum Academic Press, Fayetteville, GA. This article is an open access article distributed under Creative Commons Attribution License (CC BY 4.0), visit https://creativecommons.org/licenses/by/4.0/.
    Figure (5)  Table (4) References (57)
  • About this article
    Cite this article
    Wang A, Luo Y, Niu T, Gao K, Wang S, et al. 2024. Identification and content analysis of volatile components in 100 cultivars of Chinese herbaceous peony. Ornamental Plant Research 4: e032 doi: 10.48130/opr-0024-0029
    Wang A, Luo Y, Niu T, Gao K, Wang S, et al. 2024. Identification and content analysis of volatile components in 100 cultivars of Chinese herbaceous peony. Ornamental Plant Research 4: e032 doi: 10.48130/opr-0024-0029

Catalog

  • About this article

/

DownLoad:  Full-Size Img  PowerPoint
Return
Return