


-
Pomegranate (Punica granatum L.) has long been cultivated throughout central and southeast Asia, the Indian subcontinent, Iran, the Caucasus region, the Middle East, the Mediterranean Basin, and north and tropical Africa[1]. It is also suited to grow in the United States Department of Agriculture (USDA) cold hardiness zones 8−11, but performs best in regions with long, hot, dry summers[1,2] and with well-drained alkaline, loamy soils[3]. In the United States, pomegranate has been successfully grown in arid and semiarid regions such as Arizona, California, Nevada, New Mexico, Texas, and Utah[4]. It has recently gained increased popularity due to its nutritious fruits with unique flavor, taste, and medicinal properties[2,5]. Between 2002 and 2017, the production acreage of pomegranates in the United States doubled or tripled[4,6]. California is the leading producer, accounting for more than 98% of pomegranate production in the country[4,6]. In the crop year 2020−2021, California harvested a total of 18,885 acres of pomegranates, with an average yield of 6.72 tons per acre and a total production of 46,938 tons valued at
${\$} $ Pomegranate cultivation is often hindered by various abiotic stresses, such as drought and salinity[2,5]. Salinity is a major environmental factor that limits crop growth and productivity in many parts of the world. The presence of high salt concentrations in the soil can result in water stress, ion toxicity, and nutrient imbalances, ultimately leading to reduced plant growth and yield[10−12]. Therefore, it is crucial to understand the salinity tolerance of pomegranate and identify suitable cultivars for salt-affected soils. Salinity tolerance varies among different cultivars of pomegranate. For example, 'Malas-Saveh' is more sensitive to salinity than 'Shishe-Kab'[13]. In a pot experiment, 10 commercial Iranian cultivars exhibited varying degrees of salinity tolerance when irrigated at different salinity levels (4, 7, or 10 dS·m−1)[14]. Similarly, seven-year-old 'Manfalouty', 'Wonderful', and 'Nab-Elgamal' pomegranate trees showed different responses when irrigated with saline groundwater at a salinity level of 6.0 dS·m−1[15]. Identifying salt-tolerant cultivars is critically important for sustainable pomegranate production, especially in regions where low-quality water is used for irrigation and salt-prone conditions are prevalent.
Pomegranate has been found to exhibit a relatively high tolerance to salinity stress[14−17]. For example, 'Malas Shirin' pomegranate, grown in a 1:1 sand-perlite medium, showed tolerance up to 40 mM NaCl (approximately 3.65 dS·m−1) when irrigated with a complete Hoagland's solution[18]. However, in another study, irrigation with saline groundwater with an EC of 6.0 dS·m−1 resulted in reduced growth, flowering, and yield of seven-year-old 'Manfalouty', 'Wonderful', and 'Nab-Elgamal' pomegranate trees[15]. It also increased the incidence of fruit cracking, although the total sugar and acidity percentages of the fruit remained unchanged. Furthermore, pomegranate trees showed minimal foliar salt damage and only slight growth reduction when irrigated with a saline solution up to an EC of 15.0 dS·m–1[17]. Similarly, Liu et al.[19] observed minimal leaf burn, necrosis, or discoloration in all pomegranate cultivars irrigated with a saline solution at an EC of 20.8 dS·m–1 for 35 d. These findings indicate that pomegranate exhibits a remarkable ability to tolerate high levels of salt stress.
Although the USDA National Clonal Germplasm Repository for Tree Fruit and Nut Crops houses nearly 200 pomegranate accessions[20], the 'Wonderful' cultivar is widely recognized as the standard in commercial pomegranate production, with more than 90% of all commercial trees being this variety in the US[5]. However, there is still a need for further research to investigate the salt tolerance of this prevalent pomegranate cultivar. The purpose of this study was to determine the growth and physiological responses of 'Wonderful' pomegranate plants to saline water in a greenhouse.
-
On 4 Jan 2016, 'Wonderful' pomegranate plants were obtained from Marcelino's Nursery (Tornillo, TX, USA) in 3.8-L containers. On 18 Feb 2016, all plants were pruned to a height of 30 cm and then transplanted into 5.8-L black Poly-tainer pots (22.5 cm × 19.5 cm) containing a soilless growing substrate. The substrate consisted of 45% to 55% Canadian sphagnum peat moss, vermiculite, composed bark, dolomite limestone (used as a pH adjuster), and 0.0001% silicon dioxide (SiO2) from calcium silicate to promote root growth (Metro-Mix 360 RSI; SunGro® Horticulture, Agawam, MA, USA). The plants were grown in a greenhouse located in El Paso, TX, USA (lat. 31°41'45" N, long. 106°16'54" W, elev. 1,139 m) and irrigated using an injector (Dosatron International, Clearwater, FL, USA) with a water-soluble fertilizer solution (15N-2.2P-12.5K, Peters 15-5-15 Cal-Mag Special; Scotts, Marysville, OH, USA) at a nitrogen (N) concentration of 105 mg·L−1 and an electrical conductivity (EC) of 1.2 ± 0.1 dS·m−1 (mean ± SD). To control aphids, abamectin (AVID® 0.15 EC, 2% Abamectin, Syngenta Crop Protection, Greensboro, NC, USA) was sprayed at a rate of 0.1 mL/gal a.i. on all plants as needed.
Treatments
-
On 12 Apr 2016, all plants were pruned again to a height of 30 cm due to their rapid growth. Two weeks later (i.e., 25 Apr), uniform plants were selected and divided into three groups to initiate the treatments. The first group of plants was irrigated with a nutrient solution at an EC of 1.2 dS·m−1, serving as the control. The other two groups of plants were irrigated with one of the saline solutions at ECs of 5.0 dS·m−1 (EC 5) or 10.0 dS·m−1 (EC 10). All plants across groups were irrigated weekly with 1.5 L of treatment solution, resulting in a leaching fraction of approximately 21% ± 4.1%. The nutrient solution was prepared by adding 15N-2.2P-12.5K (Peters 15-5-15 Ca-Mg Special; Scotts, Marysville, OH, USA) to reverse osmosis water, resulting in a nitrogen concentration of 150 mg·L−1 and an EC of 1.2 ± 0.1 dS·m−1. The saline solutions at EC of 5.0 ± 0.2 dS·m−1 (EC 5) were prepared by adding 20.6 mM sodium chloride (NaCl) and 10.4 mM calcium chloride (CaCl2) to the nutrient solution. Similarly, the saline solutions at EC of 9.8 ± 0.3 dS·m−1 (EC 10) were prepared by adding 47.8 mM NaCl and 24.0 mM CaCl2 to the nutrient solution. This combination was used because NaCl represents the common salt found in reclaimed water[21], and CaCl2 mitigates potential calcium (Ca) deficiencies caused by high levels of Na[22]. The nutrient and saline solutions were prepared in 100-L tanks, and the EC was verified using an EC meter (Model B173; Horiba, Kyoto, Japan) prior to irrigation. Between treatment solution irrigations, plants were irrigated with the control nutrient solution whenever the substrate surface became dry. The frequency of irrigation varied based on environmental conditions and treatment solutions. Plants subjected to higher salinity levels required less irrigation compared to those in the control group due to reduced water use resulting from decreased transpiration and leaf area.
Leachate EC
-
To determine the EC of the leachate solution, the pour-through technique described by Cavins et al.[23] and Wright[24] was employed. After the treatment solution was applied and the container had drained for a minimum of 30 min, 100 mL distilled water was poured onto the substrate. A saucer was placed under the container to collect the leachate solution. The EC of the leachate was then measured using the EC meter. For each treatment, six plants were selected to measure the EC after each application of the treatment solutions.
Greenhouse environmental conditions
-
Throughout the experimental period, the greenhouse was maintained at an average air temperature of 27.1 ± 2.7 °C during the day and 22.3 ± 4.2 °C at night. Daily light integral (DLI) averaged 10.4 ± 1.7 mol·m−2·d−1 and relative humidity (RH) averaged 45.6% ± 13.0%.
Plant growth
-
Irrigation treatments were applied eight times weekly from 25 Apr to 28 Jun 2016. On 7 Jul, after 73 d of growth, the new pomegranate shoots, which were identifiable visually, were harvested (first harvest). At harvest, plant height (cm) was measured from the rim of the pot to the top growing point. The leaves were separated from the stems, and both were dried in an oven at 70 °C for 6 d. The dry weights of the leaves and stems were recorded. Since pomegranate trees grew rapidly, we harvested the new shoots 73 d after initiation of the first-round treatments to make the plant size manageable. To examine the response to salinity for a longer period, we imposed the second round of saline solution treatments on the same trees. Between Jul 7 and Jul 22, which is the break between the two rounds of treatments, the trees were irrigated with the control nutrient solution. On 22 Jul, the second-round treatments were initiated by irrigating the trees with the nutrient solution or one of the saline solutions (EC 5 or EC 10) weekly for eight weeks. On 16 Sep, the new shoots, developed during the second-round treatment and visually identifiable, were harvested (second harvest). Plant height was recorded as previously described. The length of new shoots (> 5 cm) was measured, and the total length of new shoots was recorded as shoot length. Roots were also harvested, cleaned, dried, and weighed. The dry weights of the leaf, stem, and root were recorded. The dried leaf, stem, and root samples were ground into powder and used for mineral nutrient analysis (see below).
Foliar salt damage evaluation
-
Before each harvest date, the extent of foliar salt damage was assessed visually using a reference scale ranging from 0 to 5. The rating scale was as follows: 0 indicated that the plant was dead; 1 represented over 90% foliar damage, characterized by salt-induced leaf burn, necrosis, or discoloration; 2 indicated moderate foliar damage ranging from 50% to 90%; 3 indicated slight foliar damage, encompassing less than 50%; 4 indicated good quality with minimal foliar damage; and 5 represented excellent condition without any foliar damage[17]. It is important to note that the foliar salt damage rating was independent of plant size and solely focused on assessing the extent of damage caused by salt stress.
SPAD readings of leaves
-
Prior to each harvest date, the leaf SPAD readings were recorded using a handheld meter (Minolta Camera Co., Osaka, Japan), which quantified the optical density [Soil-Plant Analysis Development (SPAD) reading]. Healthy and fully expanded leaves located in the middle of the shoots were selected for measurement. Twenty measurements per treatment were taken to ensure the accuracy and reliability of the readings.
Chlorophyll fluorescence
-
The maximal photochemical efficiency (Fv/Fm) of photosystem II (PS II) was measured before both harvest dates using a Hansatech Pocket PEA chlorophyll fluorimeter (Hansatech Instruments, Norfolk, UK), following the methodology described by Strasser et al.[25, 26]. For the measurements, healthy and fully expanded leaves were selected, and a total of 20 measurements per treatment were taken. The measurements were conducted on a sunny day between 10:00 and 14:00 HR, and plants were well watered to avoid any potential drought stress. Before taking the Fv/Fm measurements, the selected leaves were acclimated in darkness for at least 30 min. Minimal fluorescence values in the dark-adapted state (F0) were obtained by applying a low-intensity red LED (light emitting diode) light source (627 nm) for 50 µs. Subsequently, maximal fluorescence values (Fm) were measured after applying a saturating light pulse of 3,500 μmol·m−2·s−1. The Fv/Fm, which represents the maximum photochemical quantum use efficiency of PS II in the dark-adapted state, was calculated using the formula: Fv/Fm = (Fm − F0)/Fm.
Gas exchange
-
Leaf net photosynthesis (Pn), stomatal conductance (gs), and transpiration (E) were recorded before both harvest dates using a CIRAS-2 portable photosynthesis system (PP Systems, Amesbury, MA, USA) with an automatic universal PLC6 broadleaf cuvette. For each treatment, measurements were taken for 10 plants. A fully expanded leaf at the top of each plant was chosen for the measurement. The environmental conditions within the cuvette were maintained at a leaf temperature of 25 °C, a photosynthetic photon flux density (PPFD) of 1,000 μmol m−2·s−1, and a CO2 concentration of 375 μmol·mol−1. Data recording took place once the environmental conditions and gas exchange parameters within the cuvette reached a stable state. These measurements were carried out on a sunny day between 10:00 and 14:00 HR to ensure consistent light conditions. The plants were adequately watered to prevent water stress and maintain optimal physiological conditions during the measurements.
Mineral analysis
-
To analyze the concentration of shoot mineral elements Na, Cl, Ca, potassium (K), iron (Fe), sulfur (S), zinc (Zn), copper (Cu), manganese (Mn), and boron (B), eight plants per treatment were randomly selected at the second harvest. All dried leaves, stems, and roots of each plant were ground using a stainless Wiley mill (Thomas Scientific, Swedesboro, NJ, USA) to pass a 40-mesh screen. To determine Cl concentration, the ground samples were extracted using 2% acetic acid (Fisher Scientific, Fair Lawn, NJ, USA), following the method described in Gavlak et al.[27] and determined using an M926 Chloride Analyzer (Cole Parmer Instrument Company, Vernon Hills, IL, USA). To determine the concentrations of other elements, the ground samples were sent to the Soil, Water and Forage Testing Laboratory at Texas A&M University (College Station, TX, USA). The samples were digested in nitric acid according to the protocol described by Havlin & Soltanpour[28] and analyzed for mineral elements using Inductively Coupled Plasma-Optical Emission Spectrometry (SPECTRO Analytical Instruments Inc., Mahwah, NJ, USA). The concentration of mineral elements was reported on a dry weight basis, as described by Isaac & Johnson[29].
Experimental design and statistical analysis
-
Treatments were a completely randomized design with 20 plants/treatment. Data were analyzed by analysis of variance (ANOVA) using JMP (Version 12, SAS Institute Inc., Cary, NC, USA) and means were separately using Tukey's honest significant difference (HSD).
-
From 25 Apr to 28 Jun, EC of the leachate solution increased from 3.1 to 5.8 dS·m−1 in the control, 5.5 to 12.4 dS·m–1 in EC 5, and 9.7 to 21.5 dS·m–1 in EC 10, and during the second- round treatment ranged from 4.9 to 5.8 dS·m−1, 12.5 to 15.7 dS·m–1, and 18.1 to 20.1 dS·m–1 in control, EC 5, and EC 10, respectively (Fig. 1). Similar results were observed in our previous reports[17, 30]. Monitoring EC of leachate solution is essential for growing high-quality container plants and in woody plants and provides clues about responses to salinity before deficiency or toxicity symptoms appear in plants[23].
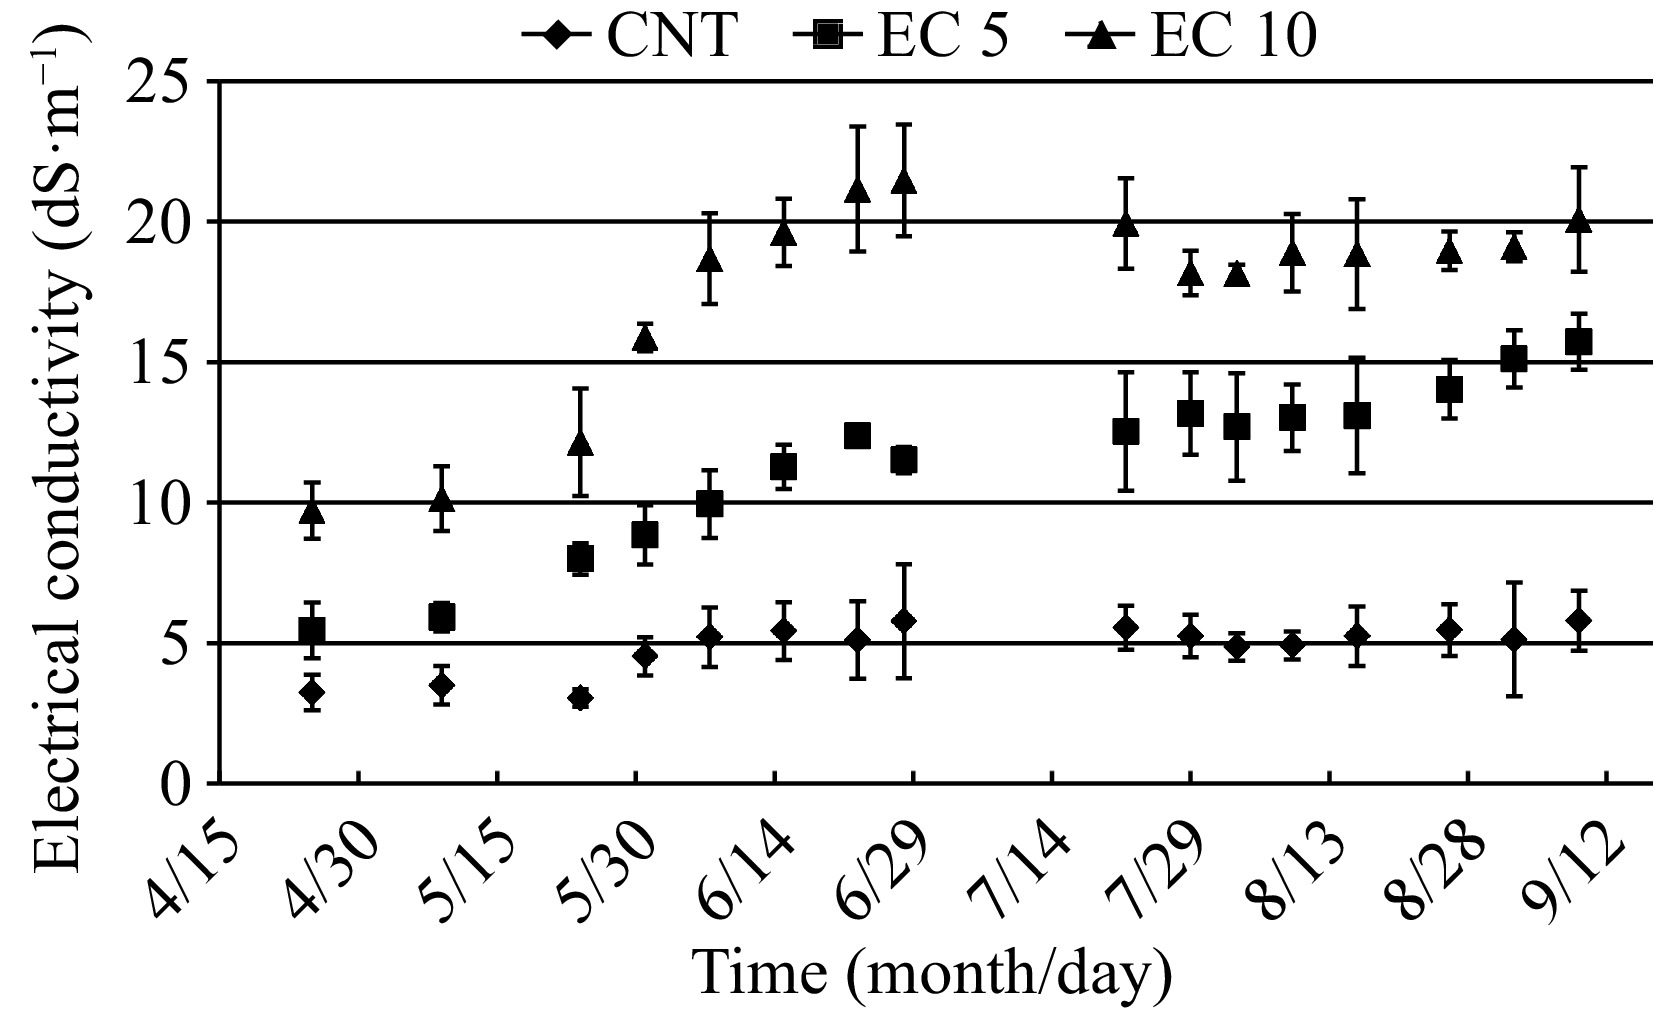
Figure 1.
The electrical conductivity (EC) of the leachate collected from potted plants of 'Wonderful' pomegranate grown in a greenhouse and irrigated with a control nutrient solution (electrical conductivity (EC) = 1.2 dS·m−1, CNT) or one of two saline solutions (EC = 5.0 (EC 5) or 10.0 dS·m−1 (EC 10)). Vertical bars represent standard deviations of six samples per treatment.
Foliar salt damage and growth parameters
-
Leaf burn, necrosis, discoloration, and reduced plant growth are common symptoms that plants experience under salinity stress[10]. On the first harvest date, the plants had no foliar salt damage (Table 1). However, salt treatment impacted plant height (p = 0.006), leaf DW (p = 0.02), and shoot DW (p = 0.002). Compared to the control, EC 10 decreased plant height, leaf DW, and shoot DW by 9%, 18%, and 15%, respectively. By the second harvest date, salt treatment affected the visual score (p = 0.04), leaf DW (p = 0.01), stem DW (p < 0.0001), and shoot DW (p < 0.0001), but root DW was not affected by salt treatment (Table 1). Plants in EC 5 and EC 10 had minimal foliar salt damage with average visual scores of 4.7 and 4.9, respectively. Leaf DW was 24% less in EC 10 than in the control. Compared to the control, EC 5 and EC 10 reduced the stem DW by 20% and 38%, respectively, and shoot DW by 13% and 31%, respectively. In addition, salt treatment affected the shoot length (P = 0.001; data not shown). The shoot length was 25% less in EC 10 than in the control. These results are similar to previous work carried out by Naeini et al.[18], Okhovatian-Ardakani et al.[14], El-Khawaga et al.[15], and Sun et al.[17]. These researchers observed that increasing salinity levels inhibit pomegranate growth in terms of shoot length, leaf area, or shoot biomass and therefore, would likely also reduce fruit yield.
Table 1. Foliar damage, plant height, and leaf, stem, and shoot dry weight (DW) of 'Wonderful' pomegranate grown in a greenhouse and irrigated with a control nutrient solution (electrical conductivity (EC) = 1.2 dS·m−1) or one of two saline solutions (EC = 5.0 (EC 5) or 10.0 dS·m−1 (EC 10)).
Treatment Foliar damage* Height (cm) Leaf DW (g) Stem DW (g) Shoot DW (g) Root DW (g) First harvest Control 5.0 a** 84.7 a 40.3 a 32.3 a 72.6 a −*** EC 5 4.8 a 84.3 a 38.5 ab 31.6 a 70.1 a − EC 10 5.0 a 77.1 b 33.1 b 28.7 a 61.8 b − Second harvest Control 5.0 a 68.3 a 25.6 a 26.5 a 52.1 a 25.3 a EC 5 4.7 b 69.6 a 24.1 ab 21.3 b 45.4 b 24.6 a EC 10 4.9 ab 65.2 a 19.4 b 16.5 c 35.9 c 20.3 a * Visual damage was rated using a reference scale from 0 to 5, where 0 = dead; 1 = over 90% foliar damage (salt damage: leaf burn, necrosis, or discoloration); 2 = moderate (50% to 90%) foliar damage; 3 = slight (less than 50%) foliar damage; 4 = good quality with minimal foliar damage; and 5 = excellent without foliar damage[17]. ** Means with the same letters within the column and harvest date are not significantly different among treatments by Tukey's honest significant difference (HSD) multiple comparisons at α = 0.05. *** Data for the first harvest was not collected in the first harvest because the plants continued to grow for the second round of treatments. Chlorophyll content, chlorophyll fluorescence, and gas exchange
-
It is well known that salinity stress usually impacts plant chlorophyll content, photosynthesis, and stomatal conductance[12]. Salt treatment did not affect Fv/Fm, E, and gs of 'Wonderful' pomegranate on either harvest date (Table 2). Pn and SPAD readings were similar among treatments at the first harvest date; however, by the second harvest date, Pn and SPAD readings were reduced by 13% and 10%, respectively, in EC 10. These results indicated that elevated salinity slightly impacted the photosynthetic apparatus of the pomegranate plants. Khayyat et al.[31] reported that salinity reduced the chlorophyll content and photosynthetic efficiency of 'Malas-e-Saveh' and 'Shishe-Kab' pomegranate. Hasanpour et al.[32] also observed that salinity reduced the chlorophyll index and chlorophyll fluorescence. In a previous study, we found that salt treatment did not affect the SPAD readings but decreased the Pn, E, and gs by an average of 18%, 24%, and 33%, respectively, across 22 cultivars[17].
Table 2. SPAD meter readings, maximum photochemical efficiency (Fv/Fm) of photosystem II, net photosynthesis (Pn), transpiration (E), and stomatal conductance (gs) of 'Wonderful' pomegranate grown in a greenhouse and irrigated with a control nutrient solution (electrical conductivity (EC) = 1.2 dS·m−1) or one of two saline solutions (EC = 5.0 (EC 5) or 10.0 dS·m−1 (EC 10)).
Treatment SPAD Fv/Fm Pn (µmol·m−2·s−1) E (mmol·m−2·s−1) gs (mmol·m−2·s−1) First harvest Control 54.3 a* 0.79 a 10.6 a 4.1 a 250 a EC 5 52.9 a 0.80 a 12.8 a 4.3 a 277 a EC 10 54.4 a 0.80 a 12.1 a 4.1 a 273 a Second harvest Control 44.3 a 0.79 a 15.6 ab 4.8 a 421 a EC 5 42.2 ab 0.79 a 16.3 a 4.8 a 403 a EC 10 39.9 b 0.80 a 13.6 b 4.2 a 321 a * Means with the same lowercase letters within the column and harvest date are not significantly different among treatments by Tukey's honest significant difference (HSD) multiple comparison at α = 0.05. Mineral nutrition
-
Plants adapt to salinity stress through osmotic adjustment, Na or Cl exclusion, or tolerance to high Na or Cl concentrations in the shoots[11]. The amount of Na in plant tissue usually increases with increasing NaCl concentration in irrigation water[13, 14, 17, 18, 31, 33−35]. In our study, the Na concentration in the leaf and stem tissue of 'Wonderful' pomegranate was similar among treatments (Fig. 2); however, more Na accumulated in the root tissue when the plants were irrigated with EC 5 and EC 10. The concentration of Na in leaves and stems was less than that in roots (p < 0.0001). Surprisingly, the leaf and stem Na concentration was less than 1 mg·g−1 on a dry weight basis. We also observed similar results in another experiment on 22 pomegranate cultivars[17]. Moreover, Na concentrations in the roots in this study averaged 0.8, 3.7, and 4.5 mg·g−1 in the control, EC 5 and EC 10 treatments, respectively. These results indicate that pomegranate avoids foliar salt damage by limiting the transport of Na to the shoots[34, 35].
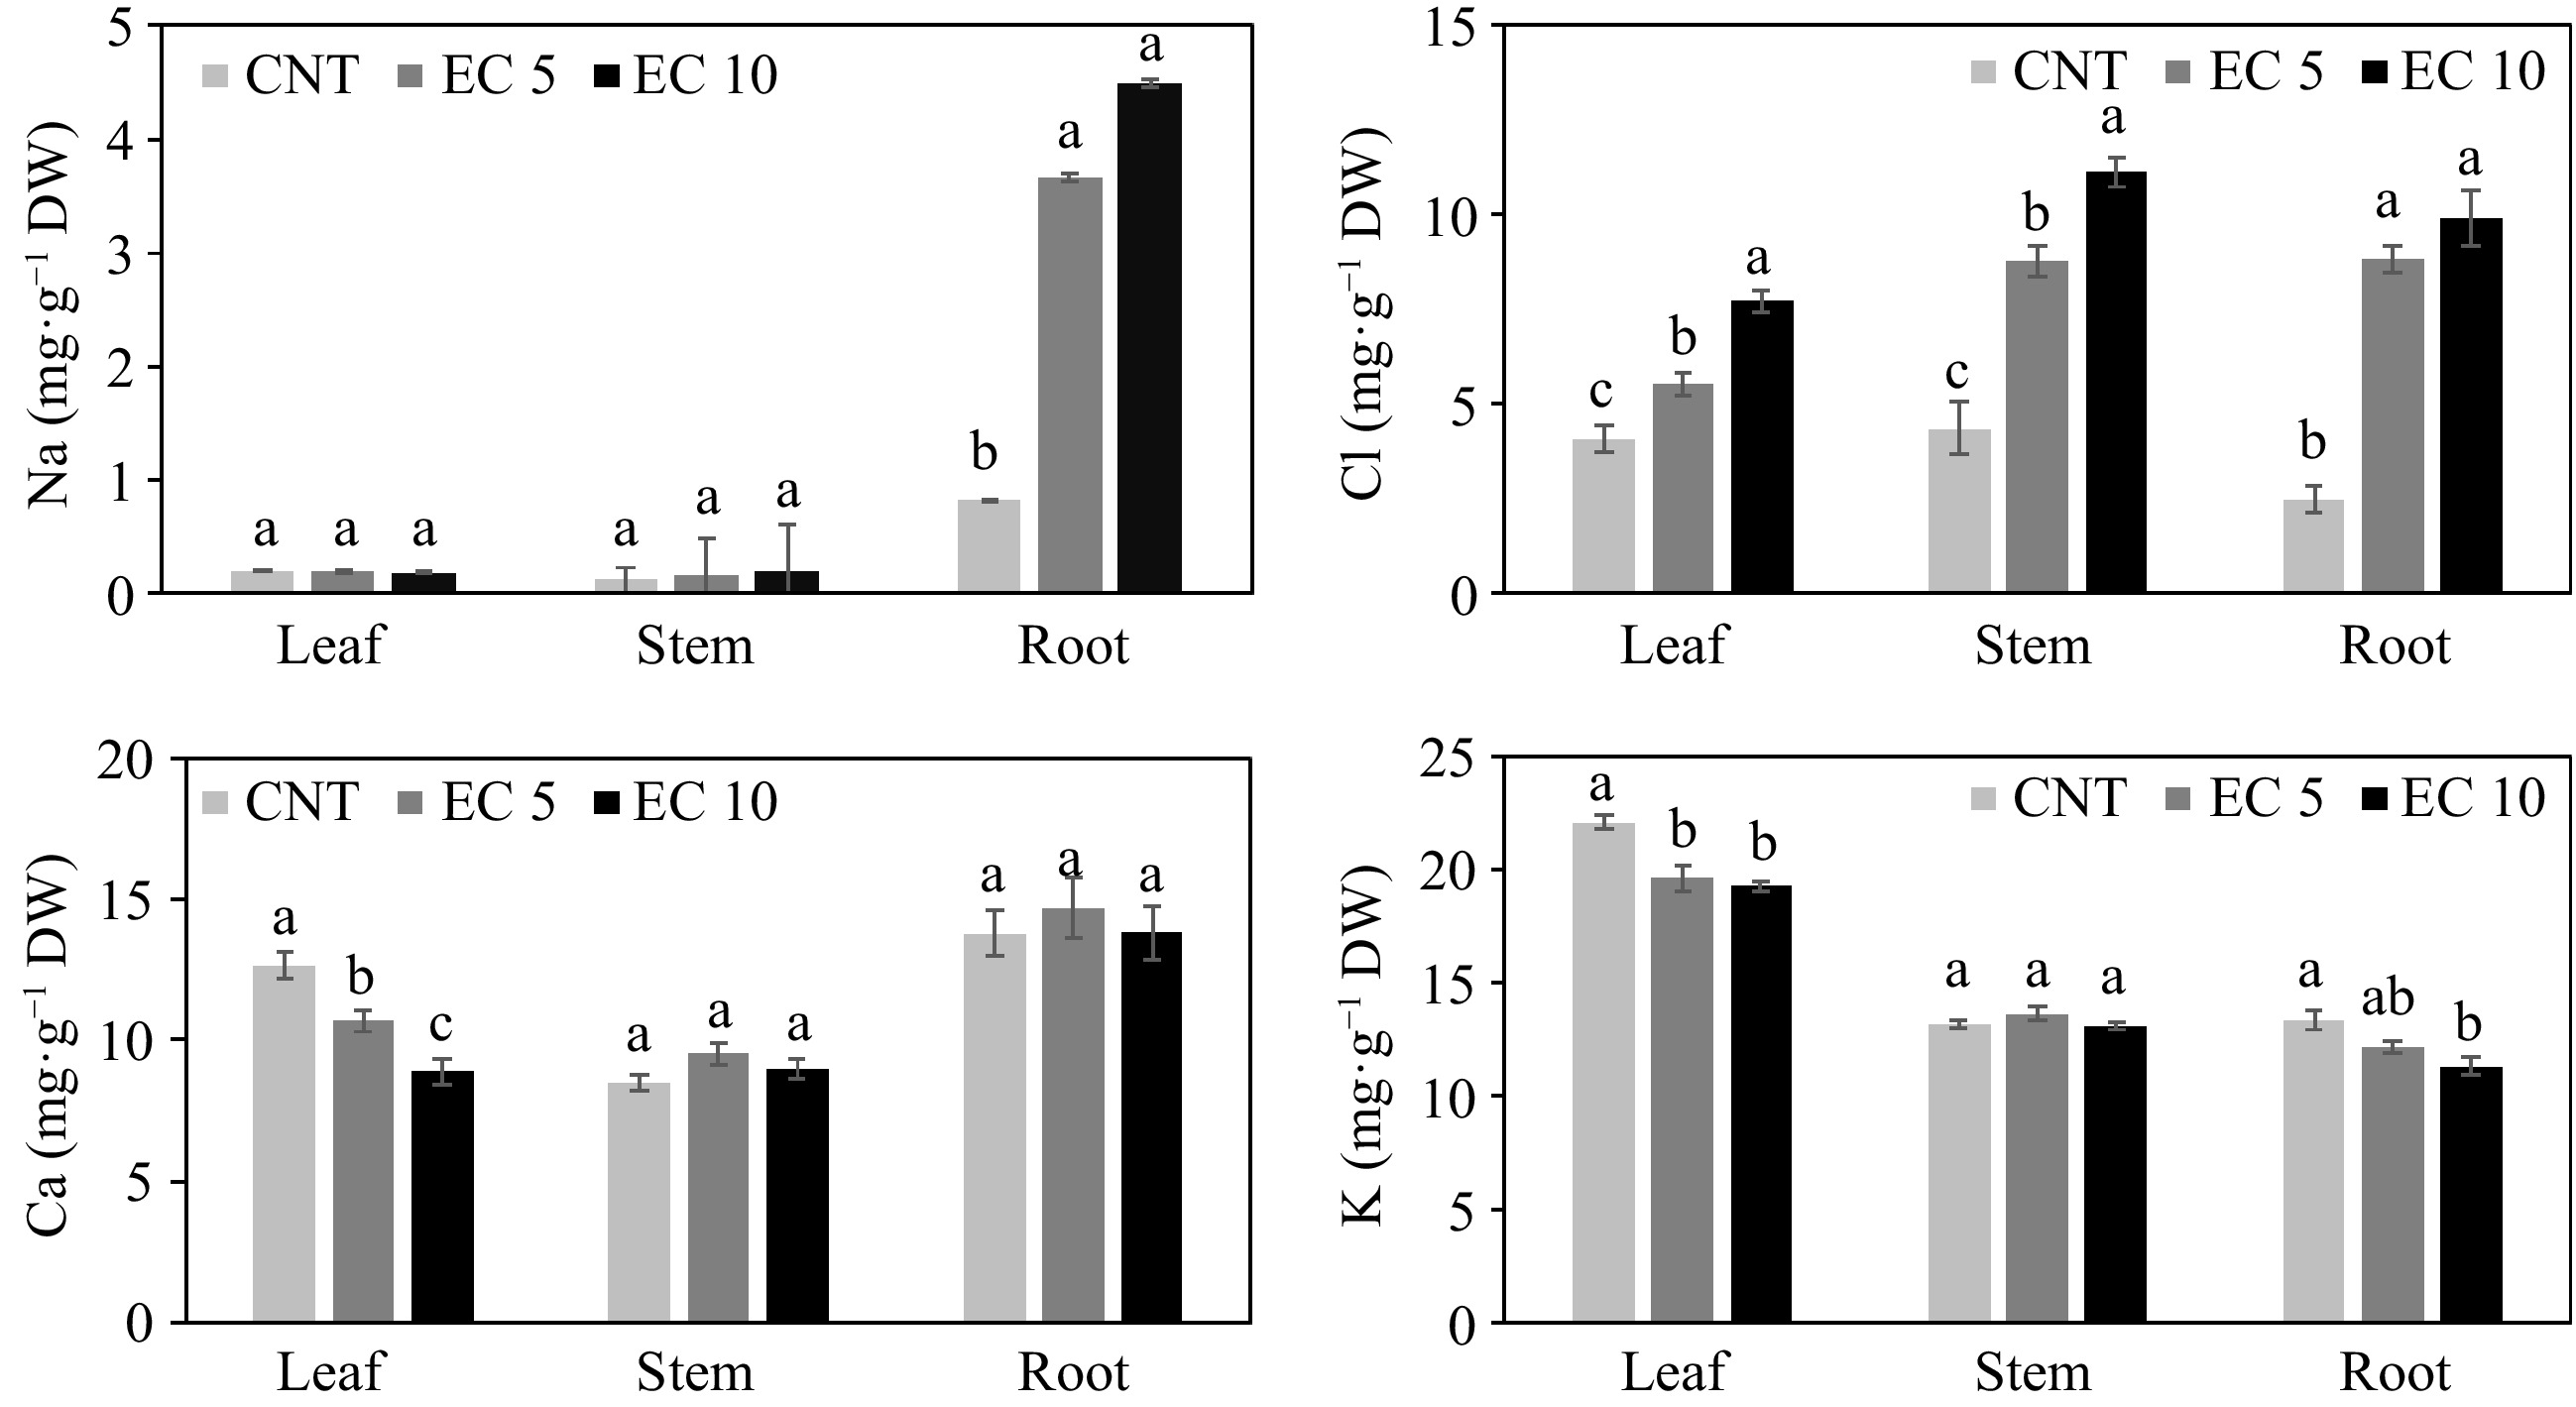
Figure 2.
Concentration of Na, Cl, Ca, and K in the leaves, stems, and roots of 'Wonderful' pomegranate grown in a greenhouse and irrigated with a control nutrient solution (electrical conductivity (EC) = 1.2 dS·m−1, CNT) or one of two saline solutions (EC = 5.0 (EC 5) or 10.0 dS·m−1 (EC 10)). The same lowercase letters above the error bars indicate the treatments are not significantly different based on Tukey's honest significant difference (HSD) test at α = 0.05.
Increased Cl concentration was observed in all three plant parts in EC 5 and EC 10 (Fig. 2). The Cl concentration in leaves was less than that in stems and roots (p < 0.0001), but the difference in Cl concentration between leaves and roots was smaller than that of Na. Compared to the control, Cl concentration in leaves, stems, and roots increased by 36%−90%, 101%−156%, and 254%−299%, respectively. Higher concentrations of Cl in plant tissues with increasing salinity are well documented[13, 14, 18, 31, 33−35]. Sun et al.[17] reported that the average leaf Cl concentration averaged 10.03 mg·g−1 DW in 22 pomegranate cultivars and 17% higher than in the control. Thus, pomegranate plants are capable of restricting either the uptake or transport of Cl[34, 35]. It seems that Na and Cl in pomegranate leaves are relatively low under saline conditions and, therefore, only have a slight effect on photosynthesis and other related parameters in 'Wonderful' pomegranate. Otherwise, high concentrations of Na or Cl in the leaves would have damaged the chloroplast, thus inhibiting photosynthesis[12].
Salinity dominated by Na salts reduces Ca availability, transport, and mobility to growing regions of the plant, which subsequently affects the quality of both vegetative and reproductive organs[36]. In our study, leaf Ca concentration declined as EC of the saline solution increased, but this was not the case for Ca in stems and roots (Fig. 2). This result agrees with a previous report indicating that leaf Ca concentration declined with increasing salinity in pomegranate[31]. In another experiment, 64% of pomegranate cultivars receiving salt treatment had a significant or slight decrease in Ca concentration[17].
Salinity dominated by Na salts also reduces K acquisition[36, 37]. In the present study, salinity reduced K concentration in leaves and roots, but not in the stems (Fig. 2). In another experiment, salt treatment reduced leaf K in 13 out of 22 pomegranate cultivars[17]. This is probably a strategy of the plants to reduce salt stress as K plays an important role in adjusting the osmotic potential of plant cells, as well as activating enzymes related to respiration and photosynthesis[12].
Excessive Na and Cl uptake competes with the uptake of other nutrients, such as N, P, Mg, S, and B, resulting in nutritional disorders and reducing plant quality[36]. Elevated salinity reduced P (p < 0.02), Mg (p < 0.03), and B (p < 0.0005) concentrations in all plant parts in this study (Figs 3 & 4). Salinity also reduced the concentration of Zn (p = 0.005) and S (p < 0.0001) but increased Fe (p = 0.02), Cu (p = 0.008), and Mn (p < 0.0001) in the leaves. Salinity reduced the concentration of Fe (p < 0.0001) and S (p = 0.0003) but increased Zn (p = 0.01), Cu (p = 0.05), and Mn (p = 0.02) in the stems. However, salinity had no effect on the concentration of Zn, Fe, Cu, Mn, and S in the roots.
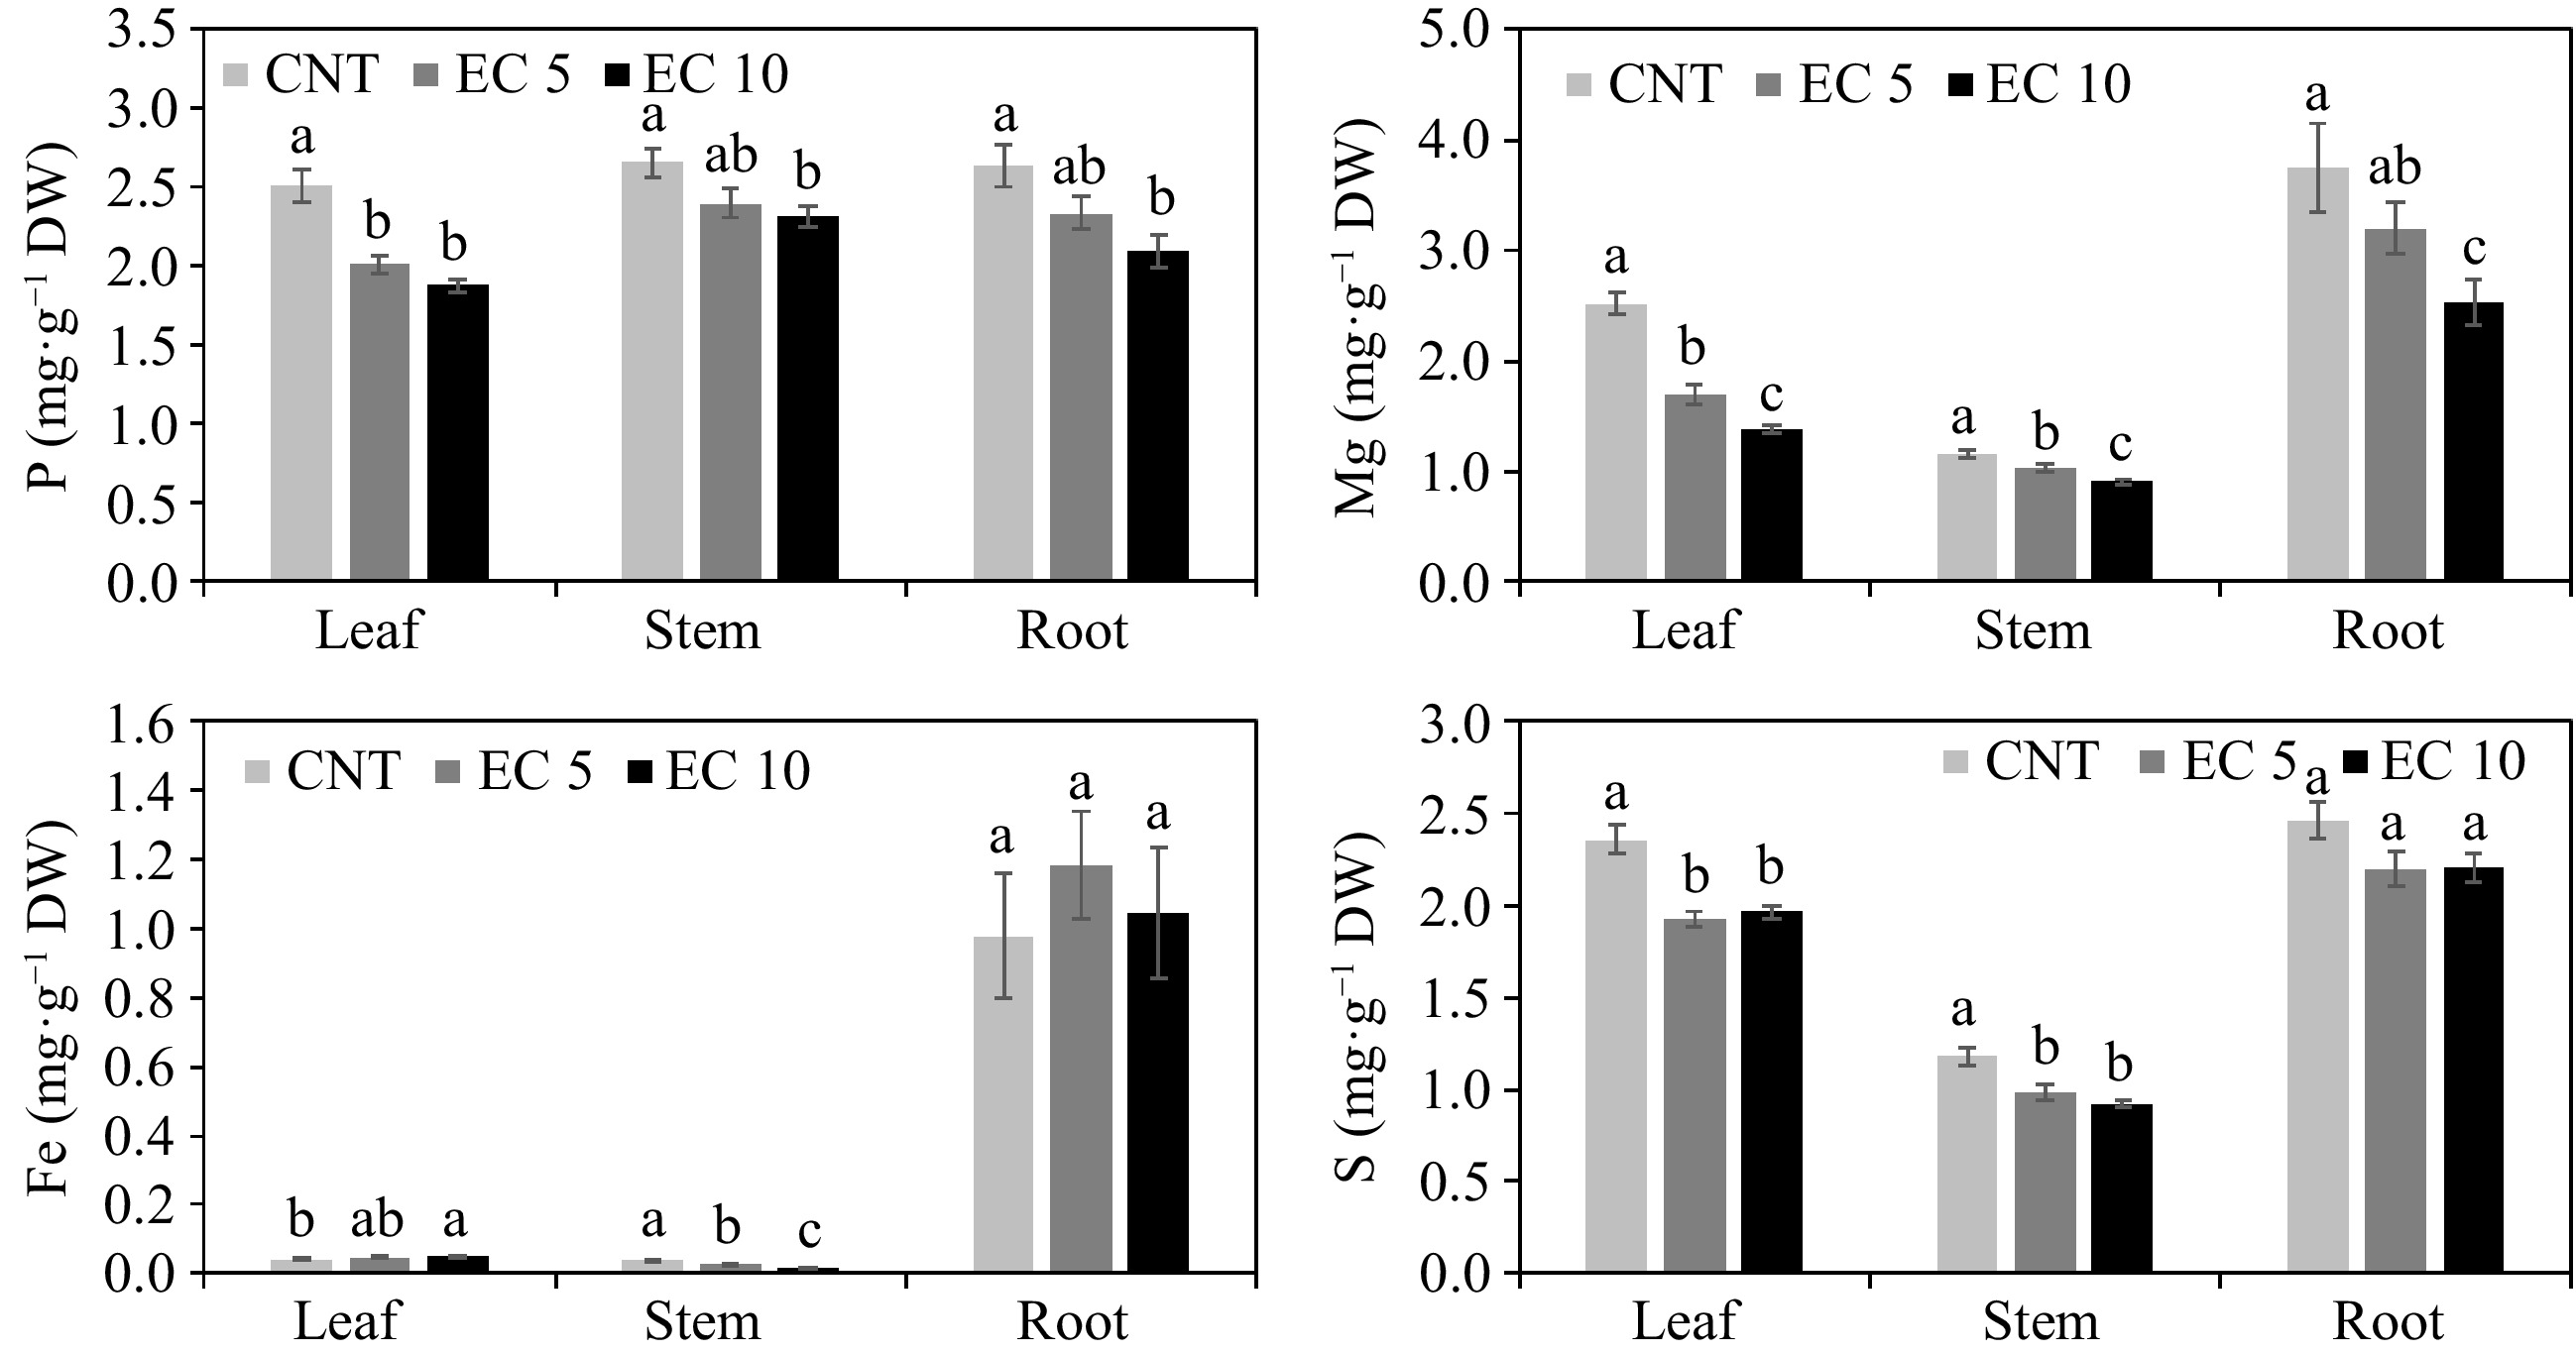
Figure 3.
Concentration of P, Mg, Fe, and S in the leaves, stems, and roots of 'Wonderful' pomegranate grown in a greenhouse and irrigated with a control nutrient solution (electrical conductivity (EC) = 1.2 dS·m−1, CNT) or one of two saline solutions (EC = 5.0 (EC 5) or 10.0 dS·m−1 (EC 10)). The same lowercase letters above the error bars indicate the treatments are not significantly different based on Tukey's honest significant difference (HSD) test at α = 0.05.
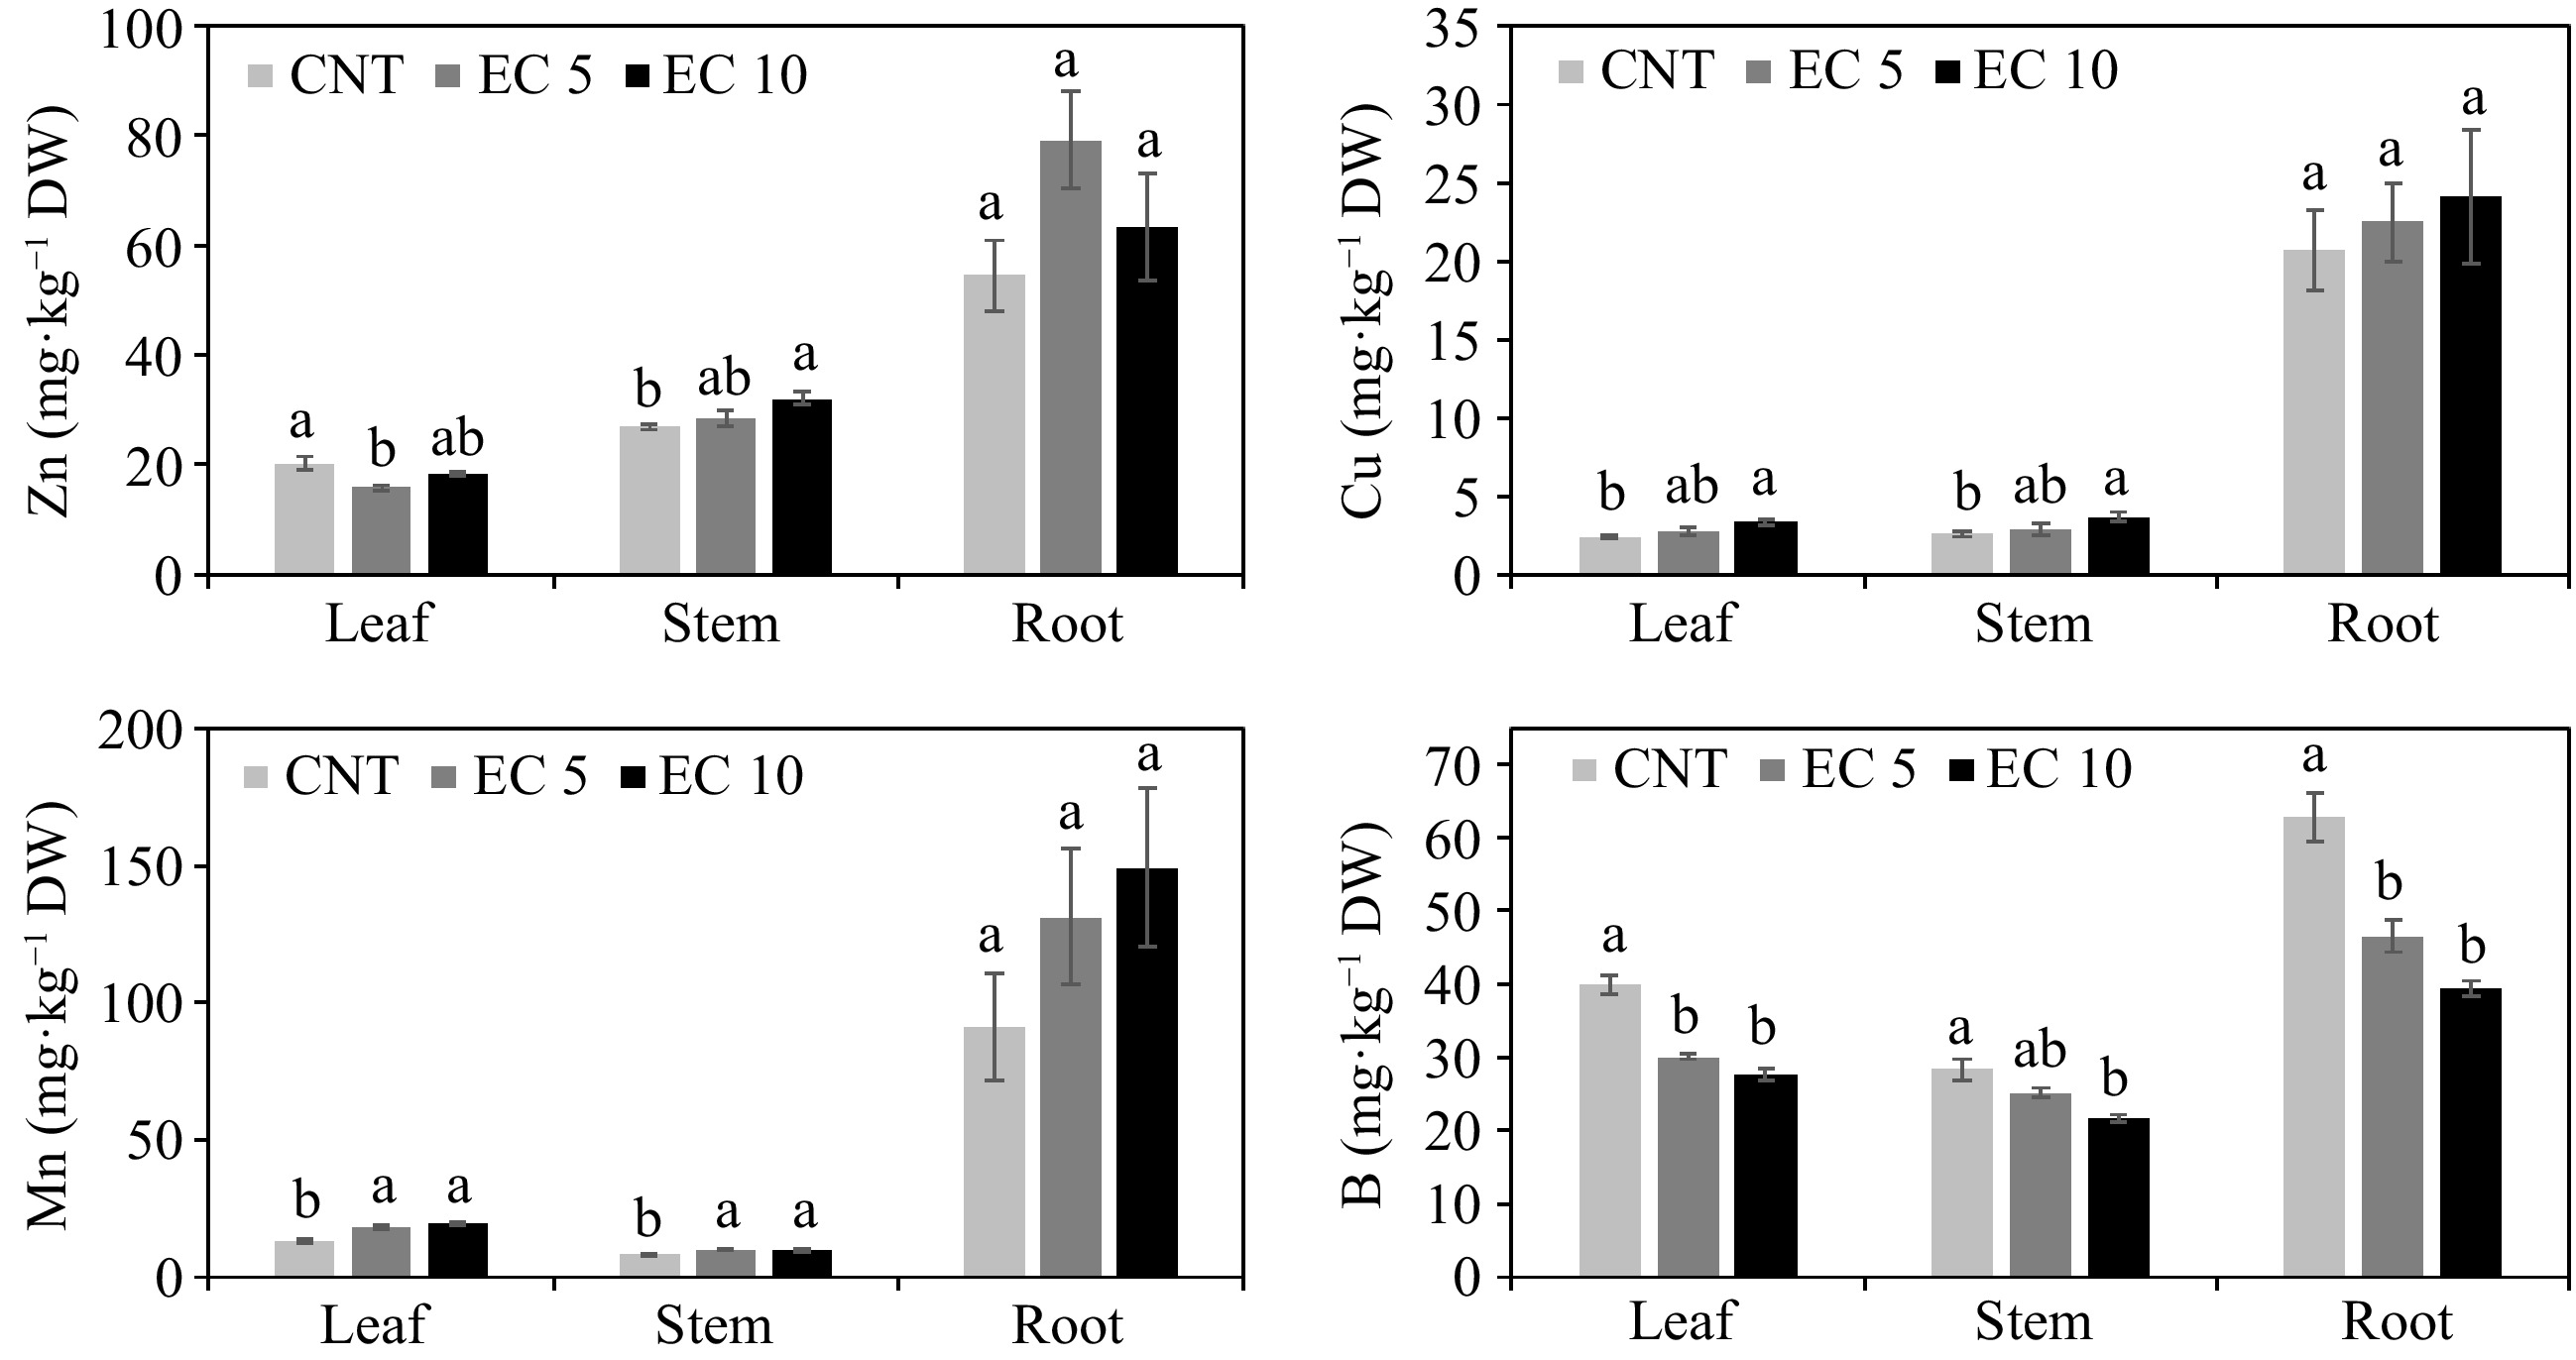
Figure 4.
Concentration of Zn, Cu, Mn, and B in the leaves, stems, and roots of 'Wonderful' pomegranate grown in a greenhouse and irrigated with a control nutrient solution (electrical conductivity (EC) = 1.2 dS·m−1, CNT) or one of two saline solutions (EC = 5.0 (EC 5) or 10.0 dS·m−1 (EC 10)). The same lowercase letters above the error bars indicate the treatments are not significantly different based on Tukey's honest significant difference (HSD) test at α = 0.05.
Leaf Ca, K, P, and B were still within the optimum range for pomegranate in each treatment, but Mg, Zn, Fe, Cu, and Mn were below the recommended levels for each nutrient[38]. Hasanpour et al.[32] observed that salinity inhibits the transport of micronutrients to the shoots in pomegranate. Khayyat et al.[31] also observed that leaf Mg and Fe concentrations declined in 'Malas-e-Saveh' pomegranate as the salinity of irrigation water increased. In contrast, salinity increased Zn and Cu in the roots and shoots of 'Rabab' and 'Shishegap' pomegranates[32].
-
'Wonderful' pomegranate was observed to be very tolerant to saline irrigation water in the present study, as evidenced by minimal salt damage to the leaves and only a slight growth reduction even at salinity levels as high as 10.0 dS·m−1. The results suggested that the cultivar was capable of reducing salt damage by restricting the uptake and/or transport of Na and Cl to the stems and leaves. Thus, 'Wonderful' pomegranate could serve as an alternative crop in arid and semiarid regions with limited potable water. Further investigations are still needed to quantify the effects of elevated salinity on the fruit yield of 'Wonderful' pomegranates when alternative water resources are used for irrigation to maintain profitability and sustainability in agriculture.
-
The authors confirm contribution to the paper as follows: study conception and design: Niu G, Sun Y, Masabni J; project administration and supervision: Niu G, Sun Y; data collection: Sun Y; analysis and interpretation of results: Sun Y, Niu G; draft manuscript preparation: Sun Y. All authors reviewed the results and approved the final version of the manuscript.
-
The datasets generated during and/or analyzed during the current study are available from the corresponding author on reasonable request.
This research is supported in part by the United States Department of Agriculture (USDA) National Institute of Food and Agriculture (NIFA) Hatch project TEX090450 and UTA01666, USDA Agricultural Marketing Service Specialty Crop Block Grant, and Texas A&M AgriLife Research. It is approved as Utah Agricultural Experiment Station (UAES) journal paper number 9736. The authors are solely responsible for the content of this publication, and it does not necessarily represent the official views of the funding agencies. Mention of a trademark, proprietary product, or vendor does not constitute a guarantee or warranty of the product by the USDA and does not imply its approval to the exclusion of other products or vendors that may also be suitable. The authors would like to acknowledge the in-kind support of plant materials from Marcelino's Nursery, Tornillo, TX, USA.
-
The authors declare that they have no conflict of interest. Genhua Niu and Youping Sun are the Editorial Board members of Technology in Horticulture who were blinded from reviewing or making decisions on the manuscript. The article was subject to the journal's standard procedures, with peer-review handled independently of these Editorial Board members and the research groups.
- Copyright: © 2024 by the author(s). Published by Maximum Academic Press, Fayetteville, GA. This article is an open access article distributed under Creative Commons Attribution License (CC BY 4.0), visit https://creativecommons.org/licenses/by/4.0/.
-
About this article
Cite this article
Sun Y, Niu G, Masabni JG. 2024. Growth, gas exchange, and mineral nutrition of 'Wonderful' pomegranate irrigated with saline water. Technology in Horticulture 4: e002 doi: 10.48130/tihort-0023-0030 

Growth, gas exchange, and mineral nutrition of 'Wonderful' pomegranate irrigated with saline water
- Received: 12 August 2023
- Accepted: 22 December 2023
- Published online: 17 January 2024
Abstract: 'Wonderful' pomegranate (Punica granatum) is currently the industry-standard cultivar, accounting for more than 90% of all commercially planted trees. The purpose of this study was to determine the response of 'Wonderful' pomegranate trees to a range of salinity by irrigating them with a nutrient solution at an electrical conductivity (EC) of 1.2 dS·m−1 (control) or one of two saline solutions at EC of 5.0 (EC 5) or 10.0 dS·m−1 (EC 10) in two rounds of treatments. Pomegranate plants with saline solution treatments had no or minimal foliar salt damage. However, EC 10 reduced shoot dry weight (DW) by 15% relative to the control in the first round, and both EC 5 and EC 10 reduced shoot DW by 13% and 31%, respectively, in the second round compared to the control. The concentration of sodium (Na) was ≤ 1 mg·g−1 in the leaves and stems in all treatments but was much higher in the roots in EC 5 and EC 10. The concentration of chloride (Cl) in the leaves, stems, and roots increased by 36%−90%, 101%−156%, and 254%−299%, respectively, in EC 5 and EC 10 compared to the control. Salinity reduced the concentration of all macronutrients and some micronutrients, especially in the leaves, compared to the control. However, there was no or minimal effect on leaf gas exchange and SPAD readings. These results indicate that 'Wonderful' pomegranate is highly tolerant to salinity and has a strong ability to exclude Na accumulation in the leaves, thus avoiding salt damage.
-
Key words:
- Chlorophyll content /
- Chlorophyll fluorescence /
- Gas exchange /
- Pomegranate /
- Salinity tolerance