ARTICLE   Open Access    

Effects of harvest day after first true leaf emergence of broccoli and radish microgreen yield and quality

More Information
  • Microgreens are 7−20-d old young vegetables with rich nutrition. In commercial settings, their harvest time varies after first true leaf emerges. To determine the optimal harvest time, the microgreen yield and quality of broccoli (Brassica oleracea var. italica Plenck) and radish (Rhaphanus sativus L.), were analyzed after different harvest times. Under hydroponic culture at 25 °C and 16/8 h photoperiod, the first true leaf of broccoli and radish emerged on day 10 and day 7 respectively. Broccoli harvested at day 13 and radish harvested at day 10, showed significantly highest yield and chlorophyll content compared to that of plants harvested on any other day. The microgreen yield was 20% higher when broccoli and radish were harvested at day 13 and day 10 compared to those harvested on earlier days. The overall visual quality of microgreens stored at 4 °C was evaluated for the extent of decay. There was less visible decay for broccoli harvested at day 13 and radish harvested at day 10. Regarding nutrient quality, there was no significant difference for glucosinolates and total phenolics among different harvested days. However, anthocyanins were decreased significantly for radish harvested at day 11. Overall, the results suggest that the best harvest time for radish and broccoli microgreens is when about 75% true leaves emerge. This research will provide microgreen growers a basis for determining the optimal harvest time of microgreens.
  • Sweet cherries (Prunus avium L.) are a major focus of agriculture in the Okanagan region of British Columbia (BC), Canada. A large portion of the cherries grown in BC are exported and undergo up to four weeks of storage during transportation before delivery and consumption[1]. In 2022, sweet cherries accounted for 11.6% of the revenue of exported fruit from Canada and have an export value of nearly CAD$130 million[2]. As such, sweet cherry is an important fruit with high commercial importance for Canada. Although the application of cold storage is a necessary postharvest tool to maintain fruit quality up to consumption, there are preharvest factors that impact quality after longer-term storage. The work of Serrano et al.[3] noted that the maturity stage at harvest determined the fruit quality of sweet cherries after storage. For this reason, producers use several parameters to establish the optimum time for harvesting. Producers have long used colour as a marker for maturity, yet the concept of fruit dry matter (DM) at harvest affecting post-storage quality has advanced[46]. In fact, Toivonen et al.[6] developed a predictive model for 'Lapins' sweet cherry DM content using a visible/near-infrared spectrometer and noted its potential application to other cultivars to provide a rapid and non-destructive means of determining DM linked to cherry fruit quality. If sweet cherries are harvested at the wrong time or stored improperly during transit the quality of the cherries at their final destination does not compare to that at the time of harvest. Therefore, it is of the utmost importance to harvest cherries at their optimal time to ensure quality retention. Cherry fruits have minimal reserve carbohydrates so respiration relies primarily upon organic acids[7]. Additionally, cherries have a high susceptibility to physical damage making them highly perishable, so it is imperative to store them properly to maintain their flavour profile and overall quality[811]. Lower respiration rates help to maintain higher titratable acidity (TA) levels, thereby retaining flavour quality[11,12]. Decreased respiration rates are achieved through low-temperature storage and shipping.

    Previous research linking cherry fruit maturity to flavour quality indicated early-harvested cherries with low soluble solids (SS) levels showed low consumer acceptance due to perceived low sweetness, while late-harvested cherries showed low consumer acceptance due to poor texture[13,14]. This information underscores the challenge growers face when determining picking date. Additionally, once cherries are harvested, quality changes occur which include changes in the balance of SS to TA levels. Previous work has shown that SS levels remain relatively constant while malic acid levels (the predominant acid in sweet cherries) decreased by 20% when stored for 4 d at 20 °C[8,14]. Further, SS, TA, and the SS/TA ratio are key parameters in defining flavour quality[15] and consumer acceptance[14] as SS and TA have been reported to be measures of the cherry fruit attributes of sweetness, and sourness, respectively. Additionally, the SS/TA ratio is regarded as an overall taste attribute determining sweet cherry acceptability[14,16,17].

    Depending on cultivar and growing location, SS values for sweet cherries have been reported to range from 12.3 to 23.7 °Brix[14]. Rootstock and storage conditions have also been reported to affect SS, TA, and SS/TA values[18]. Depending on rootstock, for 'Regina' sweet cherries, harvest SS values ranged from 14.8 to 16.6 °Brix and TA values ranged from 5.7 to 7.4 g·L−1, while SS values after storage ranged from 14.6 to 18.2 °Brix and TA values ranged from 4.4 to 6.0 g·L−1. The harvest SS/TA ratio ranged from 2.0 to 2.91 and the SS/TA ratio after storage ranged from 2.47 to 3.77 depending on rootstock. Based on sensory studies using various cherry cultivars and breeding selections to gauge flavour quality and consumer acceptance, the optimal SS/TA ratio was reported to be between 1.5 and 2.0, with SS values ranging between 17 and 19 °Brix[19].

    Unfortunately, members of British Columbia's sweet cherry industry have noted that while their cherries arrive at their export locations with good condition in terms of appearance (i.e. firm, shiny, with green stems), issues have been reported concerning flavour. Poor flavour has been associated with lower levels of TA and lower oxygen in the storage atmosphere. Our previous work noted that BC cherry growers tend to pick their cherries at lighter colours in an attempt to harvest the crop as soon as possible to avoid any weather or pest issues and achieve the highest yield possible[1]. Staccato (SC) is a late maturing economically important cultivar with little research data available. It has been reported that SC cherries have a respiration rate that is negatively correlated with colour when collected between a 2 to 6 colour level as determined with CTFIL (Centre Technique Interprofessionnel des Fruit et Legumes, Paris, France) colour chips[1], which have been typically used as a marker of maturity. For SC cultivars, data showed the lowest respiration levels with cherries harvested at CTFIL colour standards 4-5, and may potentially have better flavour quality retention due to these lower respiration rates[1]. The aim of the work was to: 1) examine indicators of maturity/readiness for harvest (colour, SS, DM, TA, and the ratio of soluble solids to titratable acidity (SS/TA)); and 2) determine whether colour at harvest or other parameters (SS, TA, SS/TA, and DM) better predict flavour quality retention after storage.

    Sweetheart (SH), Staccato (SC), and Sentennial (SL) sweet cherries were sourced from research plots located at the Summerland Research and Development Center (SuRDC, Summerland, BC, Canada) in the Okanagan Valley region of British Columbia over three growing seasons (2018, 2019, and 2021). In the 2018 growing season, two cherry cultivars (SH and SC were collected, in the 2019 growing season, in response to BC Cherry Association interest, three cherry cultivars (SH, SC, and SL) were collected. Due to COVID, data was not collected during the 2020 growing season. In the 2021 growing season, full data (SS, TA, DM, and respiration rate) was only collected on the SC cherry cultivar, while DM and respiration values at harvest were also collected for SH and SL cultivars.

    To collect fruit at different maturity levels, cherry fruits were collected at three different color levels using the CTFIL (Centre Technique Interprofessionnel des Fruit et Legumes, Paris, France) colour standard series at three harvest dates for each cultivar which corresponded to the 3-4, 4-5, and 5-6 colour levels.

    To collect environmental data, two trees were chosen in each orchard block and Onset HOBO (Bourne, MA, USA) temperature and humidity loggers were mounted in these trees as described by Ross et al.[1] and captured data at 10 min intervals. The temperature and humidity data were used to calculate average temperature (AT), average high temperature (AHT), average low temperature (ALT), and average relative humidity (ARH) for 28 d preceding the cherry harvest date.

    Cherries were generally harvested before 11:00 h on each harvest day. Harvested cherries were transported back to the lab for sorting, sampling, and storage. Upon arrival, cherries were placed into a walk-in cooler at 0.5 °C to mimic rapid hydro-cooling capabilities that the industry uses. In the afternoon of each harvest day, cherries were removed from the cooler and sorted following British Columbia Tree Fruits Company protocol: (i) size was greater than 25.4 mm (< 10.5 row size); (ii) stemless cherries were removed; and (iii) cherries with defects such as blemishes, splits, pitting, disease (rot, fungi), hail damage and insect damage were removed. Again, the colour of the cherries was assessed using the CTFIL colour standard series. Based on the harvest period, cherries were separated into different colour levels: 3-4, 4-5, and 5-6. For each colour category, quality assessments (DM, SS, TA, SS/TA ratio, firmness, size, stem pull force, stem shrivel, stem browning, pitting, and pebbling) were performed before and after storage.

    Maintaining the quality of sweet cherries undergoing long distance ocean container shipment (up to 28 d/4 weeks) is important for securing a successful export market for Canadian sweet cherries and for ensuring that current market demand is met[1]. For cherries to be marketable after storage, they must pass several quality attributes. Attributes of firmness, size, stem pull force, stem shrivel, stem browning, pitting, and pebbling were assessed using previously described methods[1,20] to assess fruit quality at harvest and after storage for 28 d at 0.5 °C, ideal refrigerated storage temperature, for all cherry cultivars, and also storage for 28 d at 3 °C, non-ideal refrigerated storage temperature, for SC cherries. The values of these parameters are provided in Supplementary Tables S1S6. As the focus of this work was to examine how maturity level at harvest influenced the flavour quality of SC, SH, and SL sweet cherry cultivars, SS, DM, TA, and respiration rate values were the focus for discussion. Respiration analysis was performed using methods described by Ross et al. on freshly harvested cherries[1]. Rates of CO2 production were expressed as mg CO2 kg−1·h−1.

    DM of the cherries was determined using a Felix F750 handheld spectrometer (Felix Instruments, Inc., Camas, WA, USA) loaded with a valid model developed at the Summerland Research and Development Centre for cherries[6]. DM was measured on 25 fruits that were randomly selected from each sample replicate (i.e. 50 cherries). For SS and TA analyses, the methods of Ross et al.[1,20] were used to test 25 fruits that were randomly selected from each sample replicate (i.e. 50 cherries). Briefly, de-stemmed cherries were transferred into a 15.2 cm × 22.9 cm polyethylene Ziplock bag. The bag was left partially open, and the cherries were pressed by hand to obtain juice. The juice was strained and collected into 60 mL polypropylene screw cap containers. The resulting filtrate was tested for SS (°Brix), and TA (g·L−1 malic acid). For SS determination, the refractive indices of the solutions were observed in °Brix temperature-corrected mode on a digital refractometer (Mettler-Toledo, Refracto 30PX, 13/02, LXC13237, Japan). An automated titrator (Metrohm 848 Tritrino Plus; Mississauga, ON, Canada) was used to measure the TA of 10 mL of the juice with 65 mL distilled water to an endpoint of 8.1 with 0.1 mol·L−1 NaOH.

    At each colour level (3-4, 4-5, or 5-6) 10 kg of cherry samples were cooled to either 0.5 or 3 °C (for SC in 2021) and then packed into cardboard boxes with a polyethylene liner, an absorbent pad, and an iButton (Thermodata, Whitewater, WI, USA), which measured temperatures experienced by the cherries in the cardboard boxes during storage. After 28 d, the same quality assessment tests were performed to see if values varied throughout storage time at each temperature.

    Statistical analysis was conducted using SAS Institute Inc. software version 9.3 (SAS Institute, Cary, NC, USA). Data were subjected to a four-way analysis of variance (ANOVA) using the SAS PROC GLM procedure. The four factors tested were colour level (3-4, 4-5, and 5-6), cultivar (SH, SC, and SL), growing year (2018, 2019, and 2021), and time (harvest or storage (0.5 °C)). The significance of the main effects and interaction of the four factors was determined using Type III sum of squares via the ANOVA test. Additionally, ANOVA using the SAS PROC GLM procedure was performed on data collected for SC cultivar in the 2021 growing year to assess the influence on storage temperature (0.5 and 3 °C) on quality parameters. Statistical significance was determined by least significant difference (LSD) Fisher's test at 5% significance level. Principal Component Analysis (PCA) was performed using SAS version 9.3 PROC PRINCOMP (SAS Institute Inc., Cary, NC, USA) on data collected from the three cultivars over the tested growing years at three colour levels (i.e., up to nine samples per cultivar) and 10 variables for each investigation. Variables included: AT, AHT, ALT, ARH, colour at harvest (ColourH), SS at harvest (SSH), SS after 28 d of storage at 0.5 °C (SS05), TA at harvest (TAH), TA after 28 d of storage at 0.5 °C (TA05), and DM of cherry fruit at harvest (DMH). Microsoft Excel was used to generate PCA plots from the data provided by SAS. Only data available for every growing year were included in the PCA. Correlation coefficients were determined using Pearson's correlation coefficient statistical function in Excel (version 2306, Microsoft, Redmond, WA, USA). Histograms and frequency data were generated using the statistical function in Excel (version 2306, Microsoft, Redmond, WA, USA). Dry matter bin sizes of 1.5% increments were used to present and analyze the histogram and frequency data.

    Tables 14 present data on flavour attributes via values of soluble solids (SS), titratable acidity (TA), SS/TA ratio, and dry matter (DM) as affected by cultivar, growing year, storage and colour level at harvest and after storage, respectively. The most influential parameters in sweet cherry flavour have been found to be SS, TA, and the SS/TA ratio[15]. Additionally, SS and TA values have been found to be related to DM values in kiwis[2124], apples[25], and cherries[6,26]. DM is a measure of solids which includes both soluble sugars and acids along with insoluble structural carbohydrates and starch. Crisosto et al.[4] proposed using DM as an additional quality parameter as DM was determined not to change during cold storage[22]. Toivonen et al.[6] have performed research linking dry matter measurements with sweet cherry quality. As cold storage is also used to maintain cherry quality, assessing DM at harvest and upon storage was of relevance, and a key aspect of this work was to examine how DM values relate to sweet cherry respiration rates and cherry quality parameters.

    Table 1.  Soluble solids values as affected by cultivar, growing year, storage, and colour level at harvest.
    Cultivar Colour level Soluble solids (SS, °Brix)
    2018 2019 2021
    Harvest Storage (0.5 °C) Harvest Storage (0.5 °C) Harvest Storage (0.5 °C) [3 °C]
    Sweetheart 3-4 18.1aA1 17.7aA1 18.1aA1 18.2aA1
    4-5 20.0bA1 19.8bA1 19.4bA1 18.8bA1
    5-6 21.9cA1* 21.1cA1* 19.9bA1* 19.6cA1*
    Staccato 3-4 17.2aA2 17.2aA1 17.1aA2 17.2aA1 18.8aA* 18.9aA*
    18.4a
    4-5 17.8aA2 17.9aA2 18.3bA23 18.1bA1 19.9bA* 18.6aB
    18.9ab
    5-6 20.2bA2 17.9aB2* 20.2cA1 20.3cA13 20.1bA 19.5aA
    19.7b
    Sentennial 3-4 18.1aA1 18.1aA1
    4-5 18.9bA13 18.5aA1
    5-6 20.8cA2 20.6bA23
    Main effects Significance F-value Degrees of freedom
    Cultivar p < 0.0001 36.90 2
    Colour level p < 0.0001 125.76 2
    Year p < 0.0001 9.26 2
    Time (harvest or storage at 0.5 °C) p = 0.0002 13.68 1
    Colour differences: within common time and cultivar, values followed by different lower case letters indicate significant differences (p ≤ 0.05); Cultivar differences: within common colour level and time, values followed by different numbers indicate significant differences (p ≤ 0.05); Growing year differences: within common time, colour level and cultivar, values followed by * indicate significant differences (p ≤ 0.05); Storage differences (Harvest versus 0.5 °C storage): within common cultivar, colour level and growing year, values followed by different uppercase letter indicate significant differences (p ≤ 0.05); Temperature differences: within Staccato cultivar at 28 d storage and at common colour level, bolded values indicate significant differences (p ≤ 0.05) between storage temperatures (0.5 °C vs 3 °C). (N.B. no bolded values appear in this table).
     | Show Table
    DownLoad: CSV
    Table 2.  Titratable acidity values as affected by cultivar, growing year, storage and colour level at harvest.
    Cultivar Colour level Titratable acidity (TA, g·L−1 malic acid)
    2018 2019 2021
    Harvest Storage (0.5 °C) Harvest Storage (0.5 °C) Harvest Storage (0.5 °C) [3 °C]
    Sweetheart 3-4 8.99aA1* 7.11aB1* 7.31aA1* 6.31aB1*
    4-5 9.55bA1* 7.57bB1* 7.14aA1* 6.13aB1*
    5-6 10.56cA1* 8.57cB1* 7.56aA1* 6.50aB1*
    Staccato 3-4 8.53aA2* 6.65aB2* 6.96aA1* 5.51aB2* 12.0aA* 10.5aB*
    9.7a
    4-5 8.87abA2* 7.04bB2* 7.30aA1* 6.21bB1* 12.8aA* 10.2aB*
    9.3a
    5-6 8.91bA2* 6.91abB2 7.18aA1* 6.46bB1 10.6bA* 9.5b*
    8.5b
    Sentennial 3-4 9.21acA2 7.60aB3
    4-5 9.33aA2 7.89aB2
    5-6 8.79bcA2 7.66aB2
    Main effects Significance F-value Degrees of freedom
    Cultivar p < 0.0001 193.58 2
    Colour level p = 0.0023 5.49 2
    Year p < 0.0001 1,007.20 2
    Time (harvest or storage at 0.5 °C) p < 0.0001 474.18 1
    Colour differences: within common time and cultivar, values followed by different lower case letters indicate significant differences (p ≤ 0.05); Cultivar differences: within common colour level and time, values followed by different numbers indicate significant differences (p ≤ 0.05); Growing year differences: within common time, colour level and cultivar, values followed by * indicate significant differences (p ≤ 0.05); Storage differences (Harvest versus 0.5 °C storage): within common cultivar, colour level and growing year, values followed by different uppercase letter indicate significant differences (p ≤ 0.05); Temperature differences: within Staccato cultivar at 28 d storage and at common colour level, bolded values indicate significant differences (p ≤ 0.05) between storage temperatures (0.5 °C vs 3 °C).
     | Show Table
    DownLoad: CSV
    Table 3.  Soluble solids to titratable acidity ratio values as affected by cultivar, growing year, storage and colour level at harvest.
    Cultivar Colour level Soluble solids to titratable acidity ratio (SS/TA)
    2018 2019 2021
    Harvest Storage (0.5 °C) Harvest Storage (0.5 °C) Harvest Storage (0.5 °C) [3 °C]
    Sweetheart 3-4 2.02a1A* 2.49a1B* 2.49a1A* 2.78a1B*
    4-5 2.09a1A* 2.61a1B* 2.71b1A* 3.06b1B*
    5-6 2.07a1A* 2.46a1B* 2.63b1A* 3.02b1B*
    Staccato 3-4 2.01a1A* 2.58a1B* 2.46a1A* 3.11a2B* 1.57aA* 1.79aB*
    1.89a
    4-5 2.0a1A* 2.54a1B* 2.51a2A* 2.91b1B* 1.55aA* 1.83aB*
    2.04a
    5-6 2.27b2A* 2.58a1B* 2.81b1A* 3.14a1B* 1.89bA* 2.06bB*
    2.32b
    Sentennial 3-4 1.97a2A 2.38a3B
    4-5 2.02a3A 2.34a2B
    5-6 2.37b2A 2.69b2B
    Main effects Significance F-value Degrees of freedom
    Cultivar p < 0.0001 94.79 2
    Colour level p < 0.0001 22.04 2
    Year p < 0.0001 361.13 2
    Time (harvest or storage at 0.5 °C) p < 0.0001 134.15 1
    Colour differences: within common time and cultivar, values followed by different lower case letters indicate significant differences (p ≤ 0.05); Cultivar differences: within common colour level and time, values followed by different numbers indicate significant differences (p ≤ 0.05); Growing year differences: within common time, colour level and cultivar, values followed by * indicate significant differences (p ≤ 0.05); Storage differences (Harvest versus 0.5 °C storage): within common cultivar, colour level and growing year, values followed by different uppercase letter indicate significant differences (p ≤ 0.05); Temperature differences: within Staccato cultivar at 28 d storage and at common colour level, bolded values indicate significant differences (p ≤ 0.05) between storage temperatures (0.5 °C vs 3 °C).
     | Show Table
    DownLoad: CSV
    Table 4.  Dry matter values as affected by cultivar, growing year, storage and colour level at harvest.
    Cultivar Colour level Dry matter (DM, %)
    2018 2019 2021
    Harvest Storage (0.5 °C) Harvest Storage (0.5 °C) Harvest Storage (0.5 °C) [3 °C]
    Sweetheart 3-4 20.9aA1* 20.6aA1* 18.6aA1* 18.6aA1* 22.1aA1*
    4-5 21.9bA1 22.0bA1* 19.9bA1* 19.8acA1* 22.5bA1
    5-6 25.2cA1* 23.5cB1* 21.1cA1* 20.6bcA1* 23.6cA1*
    Staccato 3-4 20.2aA1* 19.5aA2* 18.4aA2* 18.1aA23* 21.0aA2* 20.6aA*
    19.8a
    4-5 20.4aA2* 20.8bA2* 19.1aA1* 18.8aA2* 22.0bA2* 21.6bA*
    21.9b
    5-6 22.4bA2 22.3cA2 22.9bA2* 21.6bA23 23.0cA2 22.2bA
    22.4b
    Sentennial 3-4 18.2aA2 18.4aA13 20.5aA2*
    4-5 19.3bA1 18.8bA2 22.6bA12*
    5-6 22.9cA2 20.9bA13 23.5cA12
    Main effects Significance F-value Degrees of freedom
    Cultivar p < 0.0001 11.36 2
    Colour level p < 0.0001 130.99 2
    Year p < 0.0001 56.64 2
    Time (harvest or storage at 0.5 °C) Not significant, p = 0.0922 2.97 1
    Colour differences: within common time and cultivar, values followed by different lower case letters indicate significant differences (p ≤ 0.05); Cultivar differences: within common colour level and time, values followed by different numbers indicate significant differences (p ≤ 0.05); Growing year differences: within common time, colour level and cultivar, values followed by * indicate significant differences (p ≤ 0.05); Storage differences (Harvest versus 0.5 °C storage): within common cultivar, colour level and growing year, values followed by different uppercase letter indicate significant differences (p ≤ 0.05); Temperature differences: within Staccato cultivar at 28 d storage and at common colour level, bolded values indicate significant differences (p ≤ 0.05) between storage temperatures (0.5 °C vs 3 °C). (N.B. no bolded values appear in this table).
     | Show Table
    DownLoad: CSV

    Data in Table 1 shows the SS levels at each colour level for each sweet cherry cultivar. Overall, SH cherries at harvest had ranges of 18.1%−21.9% over the 2018 and 2019 growing seasons. SC cherries at harvest had levels between 17.1%−20.2% over the three growing years (2018, 2019, and 2021), while SL cherries at harvest had levels of 18.1%−20.8% in 2019. Statistical analysis showed that the main effects of Cultivar (p < 0.0001; F-value = 36.90; degrees of freedom (df) = 2), Colour (p < 0.0001; F-value = 125.76, df = 2), Time (p = 0.0007; F-value = 13.68; df = 1), and Year (p < 0.0001; F-value = 9.26; df = 2) were all significant. Additionally, the interactions of Cultivar * Year (p < 0.0001, F-value = 26.37; df = 1), Colour * Year (p < 0.0069; F-value = 4.19; df = 4), Cultivar * Colour * Year (p < 0.0003; F-value = 10.28; df = 2) and Colour * Time * Year (p < 0.0131; F-value = 3.67; df = 4) were all significant.

    With respect to growing year differences, in 2018, SS levels in SH were greater than those of SC at all colour levels. In 2019, again at the 3-4 colour level SC, cherries exhibited lower SS levels than SH and SL cherries. At the 4-5 colour level, SH cherries again showed higher SS levels compared to SC cherries. At the 5-6 colour level, SL cherries showed higher SS levels compared to SC and SH, while SC and SH cherries showed comparable SS levels at the 5-6 colour level. The SS values of SC cherries at 3-4 and 4-5 colour levels from the 2021 growing year were higher than values observed at the same colour levels in 2018 and 2019 growing year samples. There was no difference observed in SS levels of SC cherries at the 5-6 colour level between growing years. The data shows that colour level, cultivar, and growing year all affected SS levels.

    Within cultivars, for SH in the 2018 growing season, as colour level increased, SS level increased. An increase in SS as colour at harvest increased for SH cultivar was reported by Puniran et al.[27]. In the 2019 growing year for SH cherries and in the 2021 growing year for SC cherries, SS levels plateaued at the 4-5 colour level. For SC (2018 and 2019 growing year) and SL cherries (2019 growing year) as colour level increased, SS level increased. Ross et al.[1] reported this same trend for SC cultivar on data collected from 2015, 2016, and 2017 growing years. This data demonstrates the influence of growing conditions on SS levels.

    In general the SS levels at each colour level for each sweet cherry cultivar did not change over the 28 d storage at 0.5 °C. It should be noted that SC cherries from the 2018 growing year at the 5-6 colour level and SC cherries from the 2021 growing year at the 4-5 colour level did show a significant (p ≤ 0.05) decrease in soluble solids after 28 d of storage at 0.5 °C. SS values for 2018 SC cherries at the 5-6 colour level harvest was 20.2 °Brix, while SS values after 28 day storage at 0.5 °C was 17.9 °Brix. SS values for 2021 SC cherries at the 4-5 colour level harvest was 19.9 °Brix, while SS values after 28 d of storage at 0.5 °C was 18.6 °Brix. In 2021 the effect of storage temperature (0.5 °C vs 3 °C) was investigated. SS levels in the SC cherries at the different colour levels were not affected by the different storage temperatures. This result was consistent with other findings[1,8,14], which suggested that under typical low temperature storage conditions and proper shipping conditions, the change in flavour profiles were likely not due to major changes in SS levels. It is important to note that Alique et al.[8] found that while SS values were consistent, the levels of glucose and fructose decreased by 13% and 10%, respectively, after 4 d under ambient conditions. It may be worth investigating if under a lower temperature environment, the levels of key monosaccharides would remain constant or change.

    This moves the focus of flavour retention to TA values. Table 2 shows the TA levels at each colour level for each sweet cherry cultivar. Statistical analysis showed that the main effects of Cultivar (p < 0.0001; F-value = 193.58; df = 2), Colour (p = 0.0023; F-value = 5.49, df = 2), Time (p < 0.0001; F-value = 474.18; df = 1), and Year (p < 0.0001; F-value = 1007.20; df = 2) were all significant. The interactions of Cultivar * Colour (p < 0.001; F-value = 5.81; df = 4); Cultivar * Year (p < 0.0001; F-value = 19.9; df = 1); Colour * Time (p = 0.0431; F-value = 3.44; df = 2); Colour * Year (p < 0.0001; F-value = 18.01; df = 4); Time * Year (p < 0.0001; F-value = 17.21; df = 2); Cultivar * Colour * Year (p = 0.0009; F-value = 8.63; df = 2); Colour * Time * Year (p = 0.0127; F-value = 3.70; df = 4) were all significant.

    SH cherries at harvest had TA value ranges of 8.99−10.56 g·L−1 in 2018, and 7.31−7.56 g·L−1 in 2019. In 2018, the highest TA value was at the 5-6 colour level for SH cherries, while for the 2019 SH cherries there was no difference between colour levels for the TA values. After storage SH cherries at the various colour levels showed TA levels of 7.11−8.57 g·L−1 and 6.31−6.50 g·L−1 for 2018 and 2019, respectively. Again the stored 2018 SH cherries at the 5-6 colour level showed the highest TA values, while the TA values for the stored 2019 SH cherries were not affected by colour level. SC cherries at harvest showed TA value ranges of 8.53−8.91 g·L−1 in 2018, 6.96−7.18 g·L−1 in 2019, and 10.6−12.8 g·L−1 in 2021. After storage SC cherries had lower TA values at all colour levels for all growing years. In 2018, 2019, and 2021, TA values for SC cherries after storage ranged from 6.65–7.04 g·L−1, 5.51−6.46 g·L−1 and 8.5−10.5 g·L−1, respectively. In 2021, for the SC cherries, the higher storage temperature (3 °C) resulted in a greater loss of TA values for all colour levels compared to the lower temperature of 0.5 °C. SL cherries at harvest had TA levels of 8.79−9.33 g·L−1 in 2019 and after storage at 0.5 C, TA values ranged from 7.60−7.89 g·L−1, with the highest value of TA at the 4-5 colour level. Therefore for all cultivars over all growing years, TA values decreased upon storage, which was expected. The data from Table 2 shows the magnitude of the decrease in TA values after storage varied by growing year. Additionally, trends for differences of TA magnitude change with respect to cultivar and colour level were not obvious. The magnitude of the decrease in TA values between harvest and storage was higher for the SC cherries stored at 3 °C compared to those stored at 0.5 °C.

    Comparing the effect of colour level on TA level within cultivar for SH cherries, TA values increased as colour level at harvest increased in 2018, but the trend did not continue in 2019, possibly due to different growing conditions such as orchard temperature and relative humidity values, which will be further discussed. For SC cherries, TA values peaked at the 4-5 colour level for 2018 and 2021 growing years, but were not significantly different between colour levels in 2019 (p ≤ 0.05). In the 2019 growing year, SL cherries also had the highest TA values at the 4-5 colour level. Comparing the effect of cultivar on TA level within comparable colour level, 2018 harvest SH cherries showed higher TA values than SC cherries. In the 2018 growing year, upon storage and at comparable colour level, SH cherries again showed higher TA values than SC cherries. In the 2019 harvest, SC cherries exhibited the same TA values as SH cherries, while SL cherries had higher TA values than SC and SH. In the 2019 growing year SL cherries harvested at the 3-4 colour level showed greater TA values after storage compared to SH and SC cherries; SC cherries had the lowest TA values at this colour level. When harvested at the 4-5 and 5-6 colour levels, SL cherries had higher TA values upon storage compared to SH and SC cherries.

    The data suggests that different cultivars tend to peak TA values, which may be affected by growing conditions/growing year and maturity level/colour level. This is further supported by the work of Miloševic & Miloševic[28] that indicated TA levels of sour cherries are affected by level of ripeness. Puniran et al.[27] also indicted that finding where peak TA values occur at harvest can help negate the decrease in values that occurs during storage and therefore promote flavour quality retention.

    In 2021 the effect of storage temperature (0.5 °C vs 3 °C) was investigated as 0.5 °C represents ideal storage temperature while 3 °C represents a storage temperature where quality deterioration would be promoted, and may be a more realistic temperature experienced during overseas/export shipping (personal communication, Dr. Peter Toivonen, May, 2021). TA levels in the SC cherries harvested at the different colour levels were affected by the different storage temperature as seen in Table 2. At common colour level, SC cherries from the 2021 growing season stored at 3 °C showed lower TA values than samples stored at 0.5 °C. The SC cherries at the 5-6 colour level stored at 3 °C showed the lowest TA values upon storage. As higher TA values are associated with flavour quality[11,12], the SC cherries harvested at the 5-6 colour level and stored at 3 °C would show poorer flavour quality.

    Table 3 shows the SS/TA ratio values as affected by cultivar, growing year, storage and colour level at harvest. Statistical analysis showed that the main effects of Cultivar (p = 0.0001; F-value = 94.79; df = 2), Colour (p < 0.0001; F-value = 22.04; df = 2), Time (p < 0.0001; F-value = 134.15; df = 1), and Year (p < 0.0001; F-value = 361.13; df = 2) were all significant. The interactions of Cultivar * Colour (p = 0.0009; F-value = 5.91; df = 4) and Time * Year (p = 0.0059; F-value = 5.95; df = 2) were significant. The SS/TA ratio values over all cultivars, colour levels and growing years ranged from 1.55 to 2.81 at harvest and 1.79 to 3.14 after storage at 0.5 °C for 28 d. SC cherries in the 2021 growing year were tested to determine the effect of storage temperature (0.5 or 3 °C) on flavour quality. The SS/TA ratio for the 2021 SC cherries stored at 0.5 °C for 28 d ranged from 1.79 to 2.06 while the SS/TA ratio for the 2021 SC cherries stored at 3 °C for 28 d ranged from 1.89 to 2.32. SS/TA ratios for the 3 °C stored cherries at the 4-5 and 5-6 colour levels were significantly higher (p ≤ 0.05) compared to corresponding SS/TA ratios for the 0.5 °C stored cherries at the 4-5 and 5-6 colour levels. Higher SS/TA ratio are due to lower TA values (data in Table 3) and impact flavour quality and therefore lower storage temperatures are preferable, which was expected.

    Comparing between growing years, for SH and SC cherries, the SS/TA ratio at harvest was higher in the 2019 growing year compared to the 2018 growing year. SC cherries from the 2021 growing year showed the lowest at harvest SS/TA ratio. Within cultivar, the SH cherries from the 2018 growing year showed no difference in harvest SS/TA ratio at the different colour levels. SH cherries from the 2019 growing year showed higher harvest SS/TA ratios at the 4-5 and 5-6 colour levels compared to the 3-4 colour level. The SC cherries at all growing years showed highest harvest SS/TA ratio levels at the 5-6 colour level and comparable harvest SS/TA ratio levels at the 3-4 and 4-5 colour levels. SL cherries also showed the highest harvest SS/TA ratio at the 5-6 colour level and comparable harvest SS/TA ratios at the 3-4 and 4-5 colour levels.

    Comparing cultivars at common colour level, in 2018 growing year SC cherries at the 5-6 colour level showed a higher harvest SS/TA ratio compared to SH cherries at the corresponding colour level. In the 2019 growing year SH and SC cherries showed higher harvest SS/TA ratios at the 3-4 colour level compared to SL cherries. At the 4-5 colour level, SH cherries showed the highest harvest SS/TA ratio value and SL cherries showed the lowest harvest SS/TA ratio value. At the 5-6 colour level, SH and SC cherries showed comparable SS/TA ratios while SL cherries showed the lowest SS/TA ratio.

    Overall, this data indicates that ensuring cherry flavour quality is complex as SS/TA ratio varied by growing year, colour level and cultivar. Comparing SS/TA ratio data for all cultivars over all growing years did not show an observable trend between colour level and SS/TA ratio. As such, colour is not a reliable indicator of flavor quality.

    Table 4 shows the DM values as affected by cultivar, growing year, storage and colour level at harvest. Statistical analysis showed that the main effects of Cultivar (p = 0.0001; F-value = 11.36; df = 2), Colour (p < 0.0001; F-value = 130.99; df = 2), and Year (p < 0.0001; F-value = 56.64; df = 2) were all significant. Notably, the main effect of Time (harvest vs stored) was not significant (p = 0.0922). The interactions of Cultivar * Year (p = 0.001; F-value = 6.45; df = 3); Colour * Year (p = 0.0004; F-value = 6.38; df = 4); Cultivar * Colour * Year (p = 0.0018; F-value = 4.64; df = 5) were all significant. Although SS and TA values were not obtained for all three cultivars in 2021, DM values at harvest were obtained for all three cultivars in 2021. Data in Table 4 show, in general, DM levels did not change over 28-d storage, which was expected. Additionally, data in Table 4 shows that in most cases, at common cultivar and colour level, DM values measured in 2021 were greater than DM values measured in 2018 and 2019 for all cultivars (SH, SC, and SL).

    Within each cultivar, over all growing years, the harvest DM values were significantly different (p < 0.05) at each colour level, except for SC cherries in the 2018 and 2019 growing years. 2018 and 2019 DM values were not significantly different from colour level 3-4 to colour level 4-5. At the 5-6 colour level, over all growing years, SH cherries showed higher DM values compared to dry matter values observed for SC cherries (p < 0.05). At the 3-4 colour level, over all growing seasons, the DM values for SL and SC cherries were not significantly different (p < 0.05). At the 4-5 colour level, over all growing seasons, the DM values for SL were not significantly different than the DM values exhibited by SH and SC cherries (p < 0.05). In 2021 the effect of storage temperature (0.5 °C vs 3 °C) was investigated. DM levels in the SC cherries at the different colour levels were not affected by the different storage temperature. Overall, DM levels ranged from 18.1 to 25.2 depending on cultivar, colour level, growing year, and storage.

    Figure 1ac shows the distribution of the three cherry cultivars relative to DM value ranges over all three growing years via histograms. Cherries at the same colour level did not all have the same DM; this was observed both within and between cultivars (Fig. 1ac). DM data, compiled over all available growing years, for each cultivar in the 3-4, 4-5, and 5-6 colour levels had considerable overlap. However, it is noted there is consistent shift to a higher DM at the 5-6 colour level.

    Figure 1.  Histogram representing distribution of dry matter data for: (a) Sweetheart (SH) cherries over the 2018, 2019, and 2021 growing years; (b) Staccato (SC) cherries over the 2018, 2019, and 2021 growing years; and (c) Sentennial (SL) cherries over the 2019 and 2021 growing years. For all parts, the 3-4 colour level is solid black, the 4-5 level is black stripes, and the 5-6 level is solid grey. On the horizontal axis different dry matter value (DM) ranges are shown via bins and on the vertical axis the frequency or proportion (%) of cherries within the DM bins/ranges are shown. Data was generated from two replicates of samples of 25 cherries (i.e. 50 cherries) from all available growing years.

    Over all growing years, DM values for SH cherries ranged from 14%−27%, 14%−28.5%, and 16.5%−33%, at the 3-4, 4-5, and 5-6 colour levels, respectively (Fig. 1a). SH cherries at the 3-4 and 4-5 colour levels showed the highest proportion (26% and 26%, respectively) of cherries resided in the 22.5 and 22.5% DM bins indicating the highest percentage of SH cherries in these colour levels exhibited a DM of 21% to 22.5%, while the highest proportion (21%) of cherries at the 5-6 colour level resided in the 24% DM bin indicating the highest percentage of SH cherries at this colour level exhibited a DM of 22.5% to 24% (Fig. 1a).

    For SC cherries over all growing years, DM values ranged from 14%−25.5%, 14%−30%, and 16.5%−30%, at the 3-4, 4-5, and 5-6 colour levels, respectively (Fig. 1b). SC cherries at the 3-4 colour level showed the highest proportion of cherries (27%) resided in the 19.5% DM bin which indicated the highest percentage of SC cherries at this colour level exhibited a DM of 18 to 19.5%. SC cherries at the 4-5 colour level showed the highest proportion of cherries (25%) resided in the in the 21% DM bin which indicated the highest percentage of SC cherries at this colour level exhibited a DM of 19.5% to 21 %. At the 5-6 colour level, the highest proportion (35%) of SC cherries resided in the 22.5% DM bin which indicated the highest percentage of SC cherries exhibited a DM of 21%−22.5% (Fig. 1b).

    Over the 2019 and 2021 growing years, SL cherries DM values ranged from 15%−25.5%, 15%−28.5%, and 16.5%−33% at the 3-4, 4-5 and 5-6 colour levels, respectively (Fig. 1c). SL cherries at the 3-4 colour level showed the highest proportion of cherries (36%) resided in the 21% DM bin which indicated the highest percentage of SL cherries at this colour level exhibited a DM of 19.5% to 21%. SL cherries at the 4-5 colour level showed the highest proportion of cherries (28%) resided in the in the 21% DM bin which indicated the highest percentage of SL cherries at this colour level exhibited a DM of 19.5% to 21 %. At the 5-6 colour level, the highest proportion (26%) of SC cherries resided in the 22.5% DM bin which indicated the highest percentage of SL cherries exhibited a DM of 21%−22.5% (Fig. 1c).

    In all, the data in Tables 14 and Fig. 1 indicate that colour is not a reliable indicator of maturity or flavor quality. Cherries of the same colour may differ in DM, SS, TA, and SS/TA ratio due to cultivar and growing conditions. The implication of these results are discussed in subsequent sections.

    Temperature, relative humidity and harvest date for the 2018, 2019, and 2021 growing years are detailed in Table 5. Environmental variations between years impacted colour development, which resulted in yearly variations in our harvest dates as cherry picks were based on cherry colour levels: 2018, July 16 to August 9; 2019, July 18 to August 6; and 2021, July 5 to July 27, nearly two weeks earlier than in previous years (Table 5). In terms of environmental data, the average temperature (AT), average high temperature (AHT), and average low temperature (ALT) values measured in 2021 were greater than the values determined in 2018 and 2019, while the average relative humidity (ARH) values determined in 2021 were lower than the values measured in 2018 and 2019 (Table 5). Depending on growing year and harvest date, average temperature values ranged from 17.17 to 24.28 °C, average high temperature values ranged from 28.59 to 50.68 °C, average low temperatures ranged from 7.17 to 10.68 °C, and average relative humidity values ranged from 40.68% to 66.16% (Table 5).

    Table 5.  Temperature and relative humidity environmental data for 2018, 2019, and 2021 growing years.
    Growing year Colour level Harvest date Average
    temperature
    (AT) (°C)
    Average relative humidity (ARH) Average low temperature (ALT) (°C) Average high temperature (AHT) (°C)
    2018 Sweetheart 3-4 July 16 18.96 61.5% 7.17 32.14
    4-5 July 23 18.85 59.8% 7.17 32.13
    5-6 July 30 20.45 56.85% 7.49 32.05
    Staccato 3-4 July 30 19.74 59.17% 7.42 32.04
    4-5 August 9 21.14 54.46% 7.42 32.77
    5-6 August 9 21.14 54.49% 7.42 32.77
    2018 overall average 20.05 57.71% 7.35 32.32
    2019 Sweetheart 3-4 July 18 17.86 66.04% 7.22 28.79
    4-5 July 24 18.39 66.1% 7.22 28.59
    5-6 July 24 18.39 66.1% 7.22 28.59
    Staccato 3-4 July 22 18.03 66.16% 7.22 28.59
    4-5 July 29 19.19 62.92% 8.67 29.39
    5-6 July 31 19.19 62.92% 8.67 29.39
    Sentennial 3-4 July 22 18.03 66.16% 7.22 28.59
    4-5 July 29 18.99 63.77% 8.67 29.39
    5-6 August 6 19.79 59.94% 8.67 29.39
    2019 overall average 18.87 63.65% 8.19 28.96
    2021 Sweetheart 3-4 July 5 24.01 40.68% 8.51 50.68
    4-5 July 12 24.28 40.68% 10.68 49.23
    5-6 July 20 24.10 40.68% 9.66 47.47
    Staccato 3-4 July 13 24.01 40.68% 8.51 50.68
    4-5 July 21 24.28 40.68% 10.68 49.23
    5-6 July 27 24.10 40.68% 9.66 47.47
    Sentennial 3-4 July 12 24.01 40.68% 8.51 50.68
    4-5 July 19 24.28 40.68% 10.68 49.23
    5-6 July 26 24.10 40.68% 9.66 47.47
    2021 overall average 24.12 40.68% 9.62 49.13
     | Show Table
    DownLoad: CSV

    Principal component analysis (PCA) was performed on all cultivars over all growing seasons to best resolve cultivar specific relationships between variables affecting flavour quality parameters: colour, DM, SS and TA (Fig. 2).

    Figure 2.  Principal component analysis (PCA) plot for: Sweetheart (SH) cherries with data from 2018 and 2019 growing years at the 3-4, 4-5, and 5-6 colours levels (SH34-2018, SH45-2018, SH56-2018, SH34-2019, SH45-2019, and SH56-2019; Staccato (SC) cherries with data from 2018, 2019 and 2021 growing years at the 3-4, 4-5, and 5-6 colour levels (SC34-2018, SC45-2018, SC56-2018, SC34-2019, SC45-2019, SC56-2019, SC34-2021, SC45-2021, and SC56-2021); and Sentennial (SL) cherries with data from 2019 growing year (SL34-2019, SL45-2019, and SL56-2019). PC1 and PC2 accounted for 84.75% variation. The variables include: average temperature (AT), average high temperature (AHT), average low temperature (ALT), average relative humidity (ARH), colour at harvest (ColourH), SS at harvest (SSH), SS after 28 d of storage at 0.5 °C (SS05), titratable acidity at harvest (TAH), titratable acidity after 28 d of storage at 0.5 °C (TA05) and dry matter of cherry fruit at harvest (DMH). Orchard growing factors, flavour quality attributes (loading factors), along with sweet cherry cultivars from each growing season (component scores) were presented as lines with arrows, lines with circles, and squares, respectively. Variables close to each other with small angles between them are strongly positively correlated; variables at right angles are likely not correlated; variables at large angles (close to 180°) are strongly negatively correlated.

    Figure 2 shows that principal components 1 and 2 described most of the variation (84.75%) in the model. SS at harvest (SSH) and SS at 28-d storage at 0.5 °C (SS05) along with DM at harvest (DMH) were positively correlated with colour at harvest (ColourH). TA at harvest (TAH) and TA at 28-d storage at 0.5 °C (TA05) were positively correlated with average high temperature (ATH). AHT, average low temperature (ALT) and average temperature (AT). DMH was more strongly correlated with TAH and TA05 compared to ColourH. TAH and TA05 were positively correlated, yet negatively correlated with average relative humidity (ARH). The 2021 SC samples at the 3-4, 4-5, and 5-6 colour levels (SC34-2021, SC45-2021, and SC56-2021) were clustered with TAH, TA05, ALT, AHT, and AT variables and located in a quadrant opposite of ARH. In late June 2021 a heatwave of unprecedented magnitude impacted the Pacific Northwest region of Canada and the United States; the Canadian national temperature record was broken with a new record temperature of 49.6 °C[29]. Also, the relative humidity levels during this period were also extremely low[30]. As the location of this study was impacted by this heatwave, the data shown in Table 6 shows higher temperatures and lower relative humidity values for the 2021 growing year. The TA values measured in the 2021 growing year were nearly two times the levels measured in the 2018 and 2019 growing years (Table 2). This shows an impact of growing conditions on flavor quality; both the negative correlation between ARH and TA and positive correlations of AT, AHT, and ALT with TA are notable. However, it is noted that correlation does not mean causation. The SH and SC cultivars from the 2018 growing year at the 5-6 colour level were clustered together, and were located in the same quadrant as ColourH, SSH, SS05, and DMH variables (Fig. 2). This indicates these samples were characterized by high values of SSH, SS05, and DMH. All cultivars at the 3-4 colour level from the 2018 (SH and SC), and 2019 (SH, SC, and SL) growing years along with all cultivars at the 4-5 colour level from the 2019 (SH, SC, and SL) growing year were clustered in quadrants opposite of the SSH, SS05, DMH, ColourH, TAH, and TA05 variables while near the ARH variable. The clustering of the samples indicates similarity and lower levels of SSH, SS05, DMH, TAH, and TA05.

    Table 6.  Average colour level and respiration rate of sweet cherries at harvest.
    Growing year Colour
    level
    Average colour measured at harvest
    [average dry matter at harvest]
    Dry matter bin (%), highest
    proportions of cherries
    Respiration rate (mg CO2 kg−1·h−1)
    assessed at 0.5, 5 or 10 °C
    0.5 °C 5 °C 10 °C
    2018 Sweetheart 3-4 3.74a1 [20.9%] 21, 38% 2.87a1 * 5.99a1* 9.75a1*
    4-5 4.66b1 [21.9%] 22.5, 38% 3.57b1* 5.53b1* 9.06a1*
    5-6 5.54c1 [25.2%] 25.5, 26% 3.50b1* 5.18b1* 9.58a1*
    Staccato 3-4 3.58a1 [20.2%] 19.5, 44% 4.43a2* 7.08a2* 9.90a1*
    4-5 4.62b1 [20.4%] 21, 36% 4.58a2* 8.05b2* 11.22b2*
    5-6 5.64c1 [22.4%] 22.5, 50% 4.12b2* 6.43c2* 9.78a1*
    2019 Sweetheart 3-4 3.76a1 [18.6%] 18, 26%; 19.5, 26% Nd 6.04 13.7
    4-5 4.42b1 [19.9%] 21, 32% Nd Nd 8.3
    5-6 5.42c1 [21.1%] 22.5, 28% Nd 6.95 13.5
    Staccato 3-4 3.46a1 [18.4%] 19.5, 32% Nd 5.8 12.47
    4-5 4.40b12 [19.1%] 19.5, 40% Nd 6.14 Nd
    5-6 5.40c1 [22.9%] 22.5, 26% Nd Nd Nd
    Sentennial 3-4 3.62a1 [18.2%] 18, 28% Nd 6.5 12.80
    4-5 4.22b2 [19.3%] 21, 40% Nd 3.76 Nd
    5-6 5.20c2 [22.9%] 22.5, 24% Nd Nd Nd
    2021 Sweetheart 3-4 Nd [22.1%] 22.5, 40% 3.18a1* 5.86a1* 8.8a1*
    4-5 Nd [22.5%] 22.5, 28% 2.78a1* 5.08b1* 8.1a1*
    5-6 Nd [23.6%] 24, 30% 2.65a1* 4.32c1* 9.19a1*
    Staccato 3-4 3.50a1 [21.0%] 19.5, 28% 2.72a1 4.65ab2 10.94a2*
    4-5 4.80b1 [22.0%] 21, 24%; 22.5, 20% 3.27a1* 4.38a2* 8.22b1*
    5-6 5.60c1 [23.0%] 24, 30% 3.05a1* 5.07b2* 9.57ab1*
    Sentennial 3-4 Nd [20.5%] 21, 48% 2.71a1* 4.77a2* 7.84a1*
    4-5 Nd [22.6%] 22.5, 28%; 24, 24% 2.78a1* 4.81a12* 8.28ab1*
    5-6 Nd [23.5%] 22.5, 28%; 24, 24% 4.23b2 4.47a12 9.88b1*
    Within common cultivar and growing year, values followed by different letters indicate significant differences (p ≤ 0.05)-shows colour differences; Within common colour level and growing year, values followed by different numbers indicate significant differences (p ≤ 0.05)-shows cultivar differences; Within common cultivar, growing year and colour level, values followed by * indicate significant differences (p ≤ 0.05)-shows respiration rate differences at the different temperatures. Due to incomplete data, statistical analysis was not performed on 2019 data. Nd = Actual colour was not calculated for Sweetheart and Sentennial cherries in 2021 although cherries were collected 3-4, 4-5, 5-6 colour levels as in previous years and can be considered to have colour levels of approximately 3.5, 4.5, and 5.5, respectively.
     | Show Table
    DownLoad: CSV

    High respiration rates have long been associated with rapid fruit quality deterioration[11]. Lower respiration rates help to maintain higher TA levels, thereby retaining flavour quality[11,12]. This work aimed to provide information on assessing whether rapid and non-invasive dry matter measurements can serve as a surrogate for respiration rate measurements and/or TA measurements to predict fruit quality as this information is essential for developing recommendations to optimize cherry quality retention upon long distance transport. Although it is well known that quality deteriorates more quickly in fruit with higher respiration rates, the respiration rate data for the SH, SC, and SL cherries was collected and analyzed with respect to the different colour levels and corresponding DM values to investigate a link between respiration rate and DM value. Examining the data with this perspective is very novel and additionally very little information on respiration rates is available for SC and SL sweet cherries cultivars in the literature.

    Table 6 shows the respiration rates for a) SH and b) SC cherries at different colour levels for the 2018 growing year and how they were affected by respiration rate assessment temperature (0.5, 5, and 10 °C). Table 6 also shows the respiration rates for a) SH, b) SC, and c) SL cherries at different colour levels for the 2021 growing year and how they are affected by respiration rate assessment temperature. Please note respiration data is incomplete for the 2019 growing year because of data constraints due to equipment difficulties and therefore no statistical analysis was performed on the available 2019 respiration data. As little information exists in the literature for SC and SL cherries, we have included the incomplete respiration data. Table 6 also shows average color data and average DM data for the cherries collected at the different colour levels. Additionally, Table 6 shows data on the DM (%) bins containing the highest proportion of cherries for each cultivar in each growing year at each colour level (histograms for each cultivar for individual growing year not shown).

    Table 6 shows the average colour measured for the cherries harvested at the 3-4, 4-5, and 5-6 colour levels all varied slightly depending on growing year and cultivar. In both the 2018 and 2019 growing years there was no difference in color levels between SH and SC at harvest. In the 2019 growing year, the SL cherries showed lower average colour values at the 4-5 and 5-6 colour levels compared to the average colour levels of SH and SC cherries at the same level. Nevertheless, results indicated the cherries were harvested and sorted to the desired colour levels. In 2021, average colour was not calculated for SH and SL cherries, although cherries were collected at the 3-4, 4-5, and 5-6 colour levels, as in previous years, and can be considered to have been within range. The average colour level was calculated for SC cherries in 2021, as SC cultivar received comprehensive study over all growing years (2018, 2019 and 2021). The calculated colour level values for SC cherries in the 2021 growing year at the 3-4, 4-5, and 5-6 colour levels were 3.5, 4.8, and 5.6, respectively.

    Table 6 shows the lower the respiration rate assessment temperature, the lower the respiration rate, which was expected as cherries are recommended to be stored at 0.5 °C to ensure quality retention due to this fact[1]. In 2018, SH respiration rate values were consistently lower than SC cherries at 0.5 and 5 °C. However, at 10 °C the respiration rate values become comparable between cultivars (Table 6). Comparing between colour level, SH at colour level 3-4 showed the lowest respiration rate at 0.5 °C but had the highest respiration rate when assessed at 5 °C (Table 6). While SC 5-6 cherries at the 5 °C respiration rate assessment temperature showed a significantly lower respiration rate compared to respiration rates measured for SC 3-4 and SC 4-5 cherries at 5 °C (Table 6).

    In 2021, SH and SC respiration rates were more comparable at 0.5 and 10 °C, but at 5 °C, SH respiration rates were higher than SC at the 3-4 and 4-5 colour levels while SC cherries showed a higher respiration rate when assessed at 5 °C compared to the SH cherries at the 5-6 colour level (Table 6). SH respiration rates in 2021 were consistent at 0.5 and 10 °C for all colour levels (Table 6). However, at 5 °C SH cherries at the 5-6 colour level had the lowest respiration rate for all three of the colour levels and the SH cherries at the 3-4 colour level showed the highest respiration rate. This occurred in both 2018 and 2021 (Table 6). The respiration rates of SC cherries were not affected by colour level when assessed at 0.5 °C, but at the 5 °C respiration rate assessment temperature, 2018 SC cherries at 5-6 colour level had lower respiration values (Table 6), while 2021 SC cherries at the 4-5 colour level showed a lower respiration rate value (Table 6). Comparing colour levels, SL cherries at the 5-6 colour level had the highest respiration rates at 0.5 and 10 °C (Table 6). However, at 5 °C, all SL colour levels had comparable respiration values (Table 6). Further, in 2021, all cultivars at 0.5 °C assessment temperature showed respiration rates that were comparable between all colour levels except for SL 5-6. This respiration rate value was significantly higher than the respiration rates measured for the SL 3-4 and 4-5 colour levels and was also higher than the respiration rates determined for SH and SC at the 5-6 colour level. Interestingly, the respiration rate assessed at 0.5 °C for SL at the 5-6 colour level was not significantly different than the respiration rate assessed at 5 °C for SL at the 5-6 colour level (Table 6).

    To further discuss the results presented above, a main source of decreasing TA values in cherries is high respiratory activity[11]. Therefore, linking flavour quality, which is affected by TA levels, to differences in respiration rates is reasonable. Higher respiration rate assessment temperatures were related to higher respiration rates of cherries as seen in Table 6, which was not unexpected and again points to the importance of keeping temperature near 0.5 °C during storage. Additionally, the temperature cherries experience during a growing season affects the respiration rate of the harvested fruit, as Ross et al.[1] found the average temperature and the average high temperature measured in an orchard was positively correlated with the cherry respiration rate at both 5 and 10 °C. Therefore, understanding factors that impact respiration rate, and ensuring cherries are harvested under conditions that ensure a low respiration rate is of significant importance. Table 6 (2021 data) suggests the colour level with the lowest respiration rates for SC cherries is 4-5, which is supported by previous work[1]. While Table 6 (2018 data) suggests the 5-6 colour level gives the lowest respiration rates for SC cherries. When this information is combined with the TA value data, the peak TA values for SC cherries occurs at the 4-5 level and 5-6 colour levels. SH cherries showed that for respiration rate assessed at 0.5 °C, the colour level with the consistently lowest respiration rate was 3-4, but at the 5 °C respiration rate assessment temperature, which is a more abusive temperature, the 5-6 colour level showed the lowest respiration rate in both 2018 and 2021. The highest TA values were seen at the 5-6 colour level for SH cherries. SL cherries show highest TA values at the 3-4 and 4-5 colour level in the 2019 growing year, but insufficient respiration rate data is available in 2019 to comment further. However, the data in Tables 14 indicate that colour is not a reliable indicator of maturity and/or flavor quality. Cherries of the same colour may differ in DM, SS and TA due to cultivar and growing conditions. Figure 1 shows that not all cherries at the same colour level are at the same DM both within and between cultivars. There is a range of DM values for each cultivar in the 3-4, 4-5, and 5-6 colour ranges. However, it is noted the distribution of DM shifted to the right (higher levels) in the 5-6 colour cherries. The work of Palmer et al.[25] and Toivonen et al.[6] have indicated the importance of DM as a fruit quality metric. The implications of colour, DM, and respiration rate results on flavour quality and DM standards are discussed below.

    Associations between colour and DM at harvest with sweet cherry flavour quality attributes and respiration rates were statistically examined using Pearson's correlation coefficient from all available data over all growing years to investigate whether there may be colour/DM levels that are associated with lower respiration rates (Table 7) and could be indicative of when harvest should be performed (i.e. maturity). It was found that colour at harvest was positively correlated with SS at harvest and SS after storage (r = 0.845, p ≤ 0.0005, and r = 0.684, p ≤ 0.005, respectively). Colour at harvest was also positively correlated with DM at harvest (r = 0.768, p ≤ 0.0005). This was expected as darker cherries of a certain cultivar are generally more developed or mature; sugar content (main contributor to DM) and TA increases upon fruit development[1,6,22]. Neither colour or DM at harvest were correlated with SS/TA ratio at harvest or after storage (Table 7). Over all cultivars, no correlation was seen between respiration rate at any assessment temperature and colour level (Table 7). No significant correlations were found between respiration rate assessed at 0.5 and 10 °C and DM (Table 7). A significant negative correlation (r = −0.514, p ≤ 0.025) was found between respiration rate at 5 °C and DM. It was speculated that a correlation between respiration rate and DM was not observed when assessed at 0.5 °C, as this temperature is very low and effectively slows metabolic activity regardless of physiological status of the cherry. No observed correlation between respiration rate assessed at 10 °C and DM was speculated to be due to 10 °C being such an abusive temperature that even physiologically healthy cherries show elevated respiration rates when stored at 10 °C, and likely experienced increased flavour quality deterioration, which could be tested by measuring SS and TA values. Over all cultivars at 5 °C, cherries with lower DM tended to have higher respiration rates, and may be susceptible to more rapid quality deterioration at non-ideal temperatures such as 3−5 °C, which can be encountered in the cherry industry, particularly during export shipping (personal communication, Dr. Peter Toivonen, May, 2021). This points to the importance of good temperature control during storage and diverting lower DM cherries to the domestic and/or rapid consumption market vs export market. Colour was not correlated with TA, while DM at harvest was positively correlated with TA at harvest and upon storage (Table 7), which is relevant for flavour quality. These results indicate that DM has a greater influence on flavour quality attributes than cherry colour.

    Table 7.  Correlations between colour and dry matter at harvest with sweet cherry flavour quality attributes and respiration rate.
    Relationship assessed for Sweetheart*,
    Staccato, and Sentennial**
    cultivars over 2018, 2019,
    and 2021 growing seasons
    Pearson's
    correlation
    coefficient
    Significance
    level
    (p value)
    Colour correlated with
    Soluble solids at harvest r = +0.845 p ≤ 0.0005
    Soluble solids at 28-d storage r = +0.684 p ≤ 0.005
    Dry matter at harvest r = +0.768 p ≤ 0.0005
    Dry matter correlated with
    Soluble solids at harvest r = +0.871 p ≤ 0.0005
    Soluble solids at 28-d storage r = +0.776 p ≤ 0.0005
    Colour at harvest r = +0.769 p ≤ 0.0005
    Titratable acidity at harvest r = +0.439 p ≤ 0.05
    Titratable acidity at 28 d storage r = +0.398 p ≤ 0.10
    Respiration rate at 5 °C r = −0.514 p ≤ 0.025
    Insignificant correlations
    Colour and titratable acidity at harvest r = +0.099 p = 0.696
    Colour and titratable acidity at 28 d storage r = +0.100 p = 0.692
    Colour and soluble solids to titratable
    acidity ratio at harvest
    r = +0.218 p = 0.383
    Colour and soluble solids to titratable
    acidity ratio at 28 d storage
    r = +0.073 p = 0.774
    Colour and respiration rate at 0.5 °C r = +0.252 p = 0.364
    Colour and respiration rate at 5 °C r = −0.206 p = 0.462
    Colour and respiration rate at 10 °C r = +0.084 p = 0.766
    Dry matter and soluble solids to titratable
    acidity ratio at harvest
    r = −0.135 p = 0.595
    Dry matter and soluble solids to titratable
    acidity ratio at 28 d storage
    r = −0.227 p = 0.365
    Dry matter and respiration rate at 0.5 °C r =−0.125 p = 0.657
    Dry matter and respiration rate at 10 °C r = −0.181 p = 0.519
    *Only 2018 and 2019 growing season data available; **only 2019 growing season data available.
     | Show Table
    DownLoad: CSV

    Further, specific cultivar respiration rate and DM relationships were also examined (data not shown). For SH cherries, a negative correlation was determined between respiration rate assessed at 5 °C and DM (p ≤ 0.1), yet this correlation was not seen for SL cherries. Based on statistical parameters SC cherries only showed a negative correlation between respiration rate assessed at 5 °C and DM if a higher p value > 0.1 was used which signifies evidence is not strong enough to suggest a relationship exists. Nevertheless, the statistically significant negative correlation between respiration rate assessed at 5 °C and DM over all cultivars was identified (Table 7).

    Although colour was positively correlated with DM (Table 7), a higher colour may not necessarily indicate a low respiration rate as no significant correlation was observed between colour and respiration rate at any assessment temperature when examined over all cultivars over the growing years tested. Although this highlights the importance of DM in overall quality rather than colour, the data presented thus far suggests certain cultivars achieve different optimal DM values or ranges at maturity that are related to quality retention. In general, higher DM is positive, but is there an upper limit/threshold in terms of higher respiration rate. The lack of correlation between respiration rate assessed at 5 °C and DM for SC and SL cherries seems to indicate a lower optimal DM level for these cultivars compared to SH cherries, as a negative correlation between respiration rate assessed at 5 °C and DM was observed for SH cherries. Again, non-ideal temperatures such as 3−5 °C, can be encountered in the cherry industry, particularly during export shipping, which makes these results extremely relevant to help ensure cherry growers deliver high quality fruit for the export market.

    In 2018, the respiration rate at 5 °C was lowest at the 4-5 and 5-6 colour levels for SH cherries, and the average DM values were ~22% and 25%, respectively. Information from Table 6 shows that 38% of SH fruit were in the 22.5% DM bin indicating the highest percentage of SH cherries at the 4-5 colour level had a DM of 21% to 22.5% while 26% of SH cherries at the 5-6 colour level resided in the 25.5% DM bin indicating the highest percentage of cherries at this colour level had a DM of 24% to 25.5%. For SH cherries in 2021, the lowest respiration rate at 5 °C was at the 5-6 colour level and average DM value was ~23.6%. Information from Table 6 shows that 30% of SH at the 5-6 colour level resided in 24% DM bin indicating the highest percentage of SH cherries at this colour level had a dry mater of 22.5% to 24%. For 2018 SH cherries, titratable acidity, which is important for flavour quality, was highest at the 5-6 colour level where respiration rate assessed at 5 °C was lower. These results imply, that at maturity, cherries tend to a certain DM value or range that corresponds to reduced respiratory activity and promotes quality retention, and would therefore be considered optimal. Based on this data (lower respiration rate (2018 and 2021) and peak TA (2018)), an optimal DM range for SH may be between 22.5%−25% DM or around 23% DM. This optimal DM corresponded to cherries in the 4-5 colour level (21.9%) in 2018, and in the 5-6 colour level (25.2%, 23.6% respectively) in 2018 and 2021.

    2018 respiration rate (assessed at 5 °C) was lowest at the 5-6 colour level for SC cherries and the average DM value was ~22%, respectively. Information from Table 6 shows that 50% of SC cherries resided in the 22.5% DM bin indicating the highest percentage of SC cherries at the 5-6 colour level had a DM of 21% to 22.5% The 2021 respiration rate (assessed at 5 °C) was lowest for SC cherries at the 4-5 colour level and average DM value was ~22% while the highest respiration rate was measured at the 5-6 colour level and the average DM value was ~23.0%. Information from Table 6 shows that 24% and 20% of SC cherries resided in each the 21% and 22.5% DM bins, respectively, indicating the highest percentage of SC cherries at the 4-5 colour level had a DM of 19.5% to 22.5%. For 2021 SC cherries, TA was higher at the 4-5 colour levels, where respiration rate assessed at 5 °C was lowest. Again, these results imply that at maturity cherries tends to a certain DM value or range (optimal) that corresponds to reduced respiratory activity and promotes quality retention. Based on this data (lower respiration rate (2018 and 2021) and peak TA (2018 and 2021)) an optimal DM range for SC may be between 19.5%−22.5% DM or around 22% DM. This optimal DM corresponded to cherries in the 4-5 colour level (22.0%) in 2021, and in the 5-6 colour level (22.4%) in 2018. The data also shows the optimal DM range for SH cherries is higher than the optimal DM range for SC cherries.

    In 2021, for the SL cherries, all colour levels showed the same respiration rate (assessed at 5 °C) and average DM values were 20.5%, 22.6% and 23.5% for the 3-4, 4-5 and 5-6 colour levels, respectively. Information from Table 6 shows that SL cherries at both the 4-5 and 5-6 colour levels, 28% and 24% of the cherries resided in the 22.5% and 24% DM bins indicting the highest percentage of cherries at these colour stages ranged from 21% to 24% DM. For SL, based on the one year of respiration data (2021), determining optimum DM was not as clear. At lower storage temperature (0.5 °C), lower average DM (20.5%−22.6% vs 23.5%) maintained lower respiration rates, but at higher storage temperature (5 and 10 °C) respiration rate did not appear to be affected by DM level. These lower DM values occurred at the 3-4 and 4-5 colour levels.

    Available DM, TA and respiration rate data as discussed suggests the optimal DM range for SH may be between 22.5%−25% DM or around 23% and an optimal dry matter range for SC may be between 19.5%−22.5% DM or around 22% DM, The histogram data over all growing years does further strengthen the justification for suggesting different optimal DM values for different cultivars (Fig. 1). The data over all growing years shows higher proportions of cherries in the 24 % DM bin for SH cherries at the 5-6 colour level which indicated highest proportion of cherries with a DM of 22.5% to 24%. The SC cherries at the 5-6 colour level showed the highest proportion of cherries in the 22.5% DM bin, which indicates the highest percentage of cherries have a DM of 21% to 22.5%; again these DM ranges have been suggested as optimal DM values based on previously discussed respiration data.

    In psychology self-actualization is a concept regarding the process by which an individual reaches their full potential[31]. The data suggests that sweet cherries self-actualize, with the majority of cherries reaching maturity with a DM range that promotes quality retention during storage when growing conditions are favourable. This optimal DM range is different for different cultivars, and growing conditions would be expected to influence the rate and/or ability of this 'self-actualization', as this work and our previous research has shown that environmental factors are correlated with these important quality characteristics[1]. Placing highest importance on distribution of DM levels at the 5-6 colour levels (Fig. 1) is justified as the cherries are the most physiologically mature and will likely exhibit the highest proportion of cherries with optimal DM; however, the optimal DM can occur at other colour ranges and should be used as the primary indicator of maturity. Maturity at harvest is the most important factor that determines storage-life and final fruit quality assweet cherries produce very small quantities of ethylene and do not respond to ethylene treatment; they need to be picked when fully ripe to ensure good flavour quality[32]. It is noted the CTFIL colour standard series goes up to colour level 7, yet a balance needs to be reached between flavour quality optimization vs other quality parameters such as firmness and stem pull force. Supplementary Tables S1S6 provide values of the quality parameters of firmness, stem pull force, stem shrivel, stem browning, pebbling and pitting levels at harvest and after storage for the SH, SC and SL cherries. All of these cherry cultivars exhibited good quality attributes at the 5-6 colour level, as well as lighter colour ranges.

    It is noted that the development of DM standards for different cultivars is a novel concept. This work was positioned as field work that collected cherry data for three cultivars over three growing years in adjacent orchards using the same management practices. Equipment constraints limited respiration rate data collection. As such absolute optimal DM values and/or ranges could not be determined nor was the goal of this study. The goal of this work was to further the concept that different cultivars may reach maturity at different DM levels, which would result in lower respiration rates and higher TA levels at harvest, and after storage, achieving enhanced quality retention. In this regard, absolute optimal DM would be the DM achievable by a cherry cultivar that maximizes flavour attributes and minimizes respiration under ideal conditions. In reality, the absolute optimal DM may or may not be reached during a growing season depending on environmental conditions and orchard management practices; however, cherry cultivars will reach a DM that will be optimal for the growing conditions at harvest maturity, as the present research demonstrates. Developing definitive DM standards to determine optimal harvest points for different cultivars under different environmental conditions should be a direction of research to be further pursued to ensure cherry quality, particularly for cherries subjected to longer term storage and/or cherries destined for the overseas export market.

    The present work is not the first to point to the importance of DM and cherry flavour retention, as an anecdotal report[33] indicated that SH cherries should be harvested at a DM of no higher than 20% or the fruit will lose both sugar and acidity more rapidly during shipping storage. Although this DM value is lower than the DM recommended for SH in the current work, it indicates the importance of DM level and flavour quality in relation to a specific cultivar. The differences between optimal DM for flavour retention in our work and the anecdotal report signifies the complexity of determining DM standards and the impact of growing year/environmental conditions and orchard management practices on optimal DM. Growers will continue to face these complex issues but the present work provides valuable information to growers regarding DM standards for three cultivars.

    It must be noted again that development of absolute DM standards for different cherry cultivars requires more study under rigorous controlled environmental conditions. Additionally, given the impact of environmental conditions on optimal DM, cultivars of interest must be studied over many growing years and orchard conditions to collect a robust data set. Nevertheless, the present research indicates that SH, SC, and SL cultivars have different dry matter values at maturity. The data also shows the DM range for SH cherries at maturity is higher than the DM range for SC cherries at maturity and that for SL, lower DM levels maintained lower respiration rates at lower temperatures, potentially improving ability to maintain quality after harvest.

    Overall, this research showed that DM was a better indicator of flavour quality than colour, as DM was related to both sugars and TA, while colour was only related to sugar. Therefore, this work identified that colour may not be a reliable indicator of maturity and/or flavor quality. This work indicated that cherries of the same colour may differ in DM, SS, and TA due to cultivar type and growing conditions as influenced by growing year. Relative humidity encountered by cherries during the growing season was negatively correlated with TA and higher growing temperatures were positively correlated with TA. This work discovered that sweet cherries may self-actualize, in that when growing conditions are favourable, DM levels may tend towards a certain level at maturity (optimal DM) resulting in superior flavour quality attributes and lower respiration, allowing cherries to reach their full quality potential and ensure quality retention in storage. Therefore, optimal DM can be reached at maturity despite colour. Remaining challenges include development of DM standards for various sweet cherry cultivars and further understanding the impact of growing conditions to better allow for self-actualization and prediction of the optimal DM under those conditions to optimize timing of harvest from year-to-year. Nevertheless, this research based on field work for three sweet cherry cultivars over three growing years, indicated an optimal DM range for SH between 22.5%−25% DM and an optimal DM range for SC between 19.5%−22.5% DM. Interestingly, under the same field conditions, the optimal DM range for SH cherries was higher than the optimal DM range for SC cherries. More analysis is required for determining optimal DM for SL, but the initial data indicates DM in the range of 20.5% to 22.6% maintained lower respiration rates at lower temperature potentially improving ability to maintain quality after harvest.

    The authors confirm contribution to the paper as follows: study conception and design: Ross KA, DeLury NC, Fukumoto L; data collection: Ross KA, DeLury NC, Fukumoto L; analysis and interpretation of results: Ross KA, DeLury NC, Fukumoto L; draft manuscript preparation: Ross KA, DeLury N, Fukumoto L, Forsyth JA. All authors reviewed the results and approved the final version of the manuscript.

    The datasets generated during and/or analysed during the current study are available from the corresponding author on reasonable request.

    We are grateful to the BC Cherry Association for financial support of this research project. We acknowledge Manon Gentes, Gillian Beaudry, and Duncan Robinson for their technical assistance. We are grateful to Brenda Lannard for providing her expertise on using the Felix F750 handheld spectrometer (Felix Instruments, Inc.) to obtain dry matter values and obtaining respiration data. Kelly A. Ross would like to thank and acknowledge Dr. Peter Toivonen for his mentorship, valuable scientific discussions and consistently kind support.

  • The authors declare that they have no conflict of interest.

  • [1]

    Choe U, Yu LL, Wang TTY. 2018. The science behind microgreens as an exciting new food for the 21st century. Journal of Agricultural and Food Chemistry 66:11519−30

    doi: 10.1021/acs.jafc.8b03096

    CrossRef   Google Scholar

    [2]

    Kyriacou MC, De Pascale S, Kyratzis A, Rouphael Y. 2017. Microgreens as a component of space life support systems: a cornucopia of functional food. Frontiers in Plant Science 8:1587

    doi: 10.3389/fpls.2017.01587

    CrossRef   Google Scholar

    [3]

    Johnson CM, Boles HO, Spencer LE, Poulet L, Romeyn M, et al. 2021. Supplemental food production with plants: a review of NASA research. Frontiers in Astronomy and Space Sciences 8:734343

    doi: 10.3389/fspas.2021.734343

    CrossRef   Google Scholar

    [4]

    Khodadad CLM, Hummerick ME, Spencer LE, Dixit AR, Richards JT, et al. 2020. Microbiological and nutritional analysis of lettuce crops grown on the international space station. Frontiers in Plant Science 11:199

    doi: 10.3389/fpls.2020.00199

    CrossRef   Google Scholar

    [5]

    Ebert AW. 2022. Sprouts and microgreens—novel food sources for healthy diets. Plants 11:571

    doi: 10.3390/plants11040571

    CrossRef   Google Scholar

    [6]

    Teng Z, Luo YG, Pearlstein DJ, Wheeler RM, Johnson CM, et al. 2023. Microgreens for home, commercial, and space farming: a comprehensive update of the most recent developments. Annual Review of Food Science and Technology 14:539−62

    doi: 10.1146/annurev-food-060721-024636

    CrossRef   Google Scholar

    [7]

    Weber CF. 2017. Broccoli microgreens: a mineral-rich crop that can diversify food systems. Frontiers in Nutrition 4:7

    doi: 10.3389/fnut.2017.00007

    CrossRef   Google Scholar

    [8]

    Xiao Z, Codling EE, Luo Y, Nou X, Lester GE, et al. 2016. Microgreens of Brassicaceae: Mineral composition and content of 30 varieties. Journal of Food Composition and Analysis 49:87−93

    doi: 10.1016/j.jfca.2016.04.006

    CrossRef   Google Scholar

    [9]

    El-Nakhel C, Pannico A, Graziani G, Giordano M, Kyriacou MC, et al. 2021. Mineral and antioxidant attributes of Petroselinum crispum at different stages of ontogeny: microgreens vs. baby greens. Agronomy 11:857

    doi: 10.3390/agronomy11050857

    CrossRef   Google Scholar

    [10]

    Sun J, Xiao Z, Lin L, Lester GE, Wang Q, et al. 2013. Profiling polyphenols in five Brassica species microgreens by UHPLC-PDA-ESI/HRMSn. Journal of Agricultural and Food Chemistry 61:10960−70

    doi: 10.1021/jf401802n

    CrossRef   Google Scholar

    [11]

    Lenzi A, Orlandini A, Bulgari R, Ferrante A, Bruschi P. 2019. Antioxidant and mineral composition of three wild leafy species: a comparison between microgreens and baby greens. Foods 8:487

    doi: 10.3390/foods8100487

    CrossRef   Google Scholar

    [12]

    Di Bella MC, Niklas A, Toscano S, Picchi V, Romano D, et al. 2020. Morphometric characteristics, polyphenols and ascorbic acid variation in Brassica oleracea L. novel foods: sprouts, microgreens and baby leaves. Agronomy 10:782

    doi: 10.3390/agronomy10060782

    CrossRef   Google Scholar

    [13]

    Marchioni I, Martinelli M, Ascrizzi R, Gabbrielli C, Flamini G, et al. 2021. Small functional foods: comparative phytochemical and nutritional analyses of five microgreens of the Brassicaceae family. Foods 10:427

    doi: 10.3390/foods10020427

    CrossRef   Google Scholar

    [14]

    Xiao Z, Rausch SR, Luo Y, Sun J, Yu L, et al. 2019. Microgreens of Brassicaceae: genetic diversity of phytochemical concentrations and antioxidant capacity. LWT 101:731−37

    doi: 10.1016/j.lwt.2018.10.076

    CrossRef   Google Scholar

    [15]

    Mlinarić S, Piškor A, Melnjak A, Mikuška A, Šrajer Gajdošik M, et al. 2023. Antioxidant capacity and shelf life of radish microgreens affected by growth light and cultivars. Horticulturae 9:76

    doi: 10.3390/horticulturae9010076

    CrossRef   Google Scholar

    [16]

    Yang B, Quiros CF. 2010. Survey of glucosinolate variation in leaves of Brassica rapa crops. Genetic Resources and Crop Evolution 57:1079−89

    doi: 10.1007/s10722-010-9549-5

    CrossRef   Google Scholar

    [17]

    Kyriacou MC, El-Nakhel C, Pannico A, Graziani G, Zarrelli A, et al. 2021. Ontogenetic variation in the mineral, phytochemical and yield attributes of brassicaceous microgreens. Foods 10:1032

    doi: 10.3390/foods10051032

    CrossRef   Google Scholar

    [18]

    Agati G, Tattini M. 2010. Multiple functional roles of flavonoids in photoprotection. New Phytologist 186:786−93

    doi: 10.1111/j.1469-8137.2010.03269.x

    CrossRef   Google Scholar

    [19]

    Almushayti AY, Brandt K, Carroll MA, Scotter MJ. 2021. Current analytical methods for determination of glucosinolates in vegetables and human tissues. Journal of Chromatography A 1643:462060

    doi: 10.1016/j.chroma.2021.462060

    CrossRef   Google Scholar

    [20]

    Axelsson AS, Tubbs E, Mecham B, Chacko S, Nenonen HA, et al. 2017. Sulforaphane reduces hepatic glucose production and improves glucose control in patients with type 2 diabetes. Science Translational Medicine 9:eaah4477

    doi: 10.1126/scitranslmed.aah4477

    CrossRef   Google Scholar

    [21]

    Bhaswant M, Shanmugam DK, Miyazawa T, Abe C, Miyazawa T. 2023. Microgreens—a comprehensive review of bioactive molecules and health benefits. Molecules 28:867

    doi: 10.3390/molecules28020867

    CrossRef   Google Scholar

    [22]

    Truzzi F, Whittaker A, Roncuzzi C, Saltari A, Levesque MP, et al. 2021. Microgreens: functional food with antiproliferative cancer properties influenced by light. Foods 10:1690

    doi: 10.3390/foods10081690

    CrossRef   Google Scholar

    [23]

    Tomas M, Zhang L, Zengin G, Rocchetti G, Capanoglu E, et al. 2021. Metabolomic insight into the profile, in vitro bioaccessibility and bioactive properties of polyphenols and glucosinolates from four Brassicaceae microgreens. Food Research International 140:110039

    doi: 10.1016/j.foodres.2020.110039

    CrossRef   Google Scholar

    [24]

    El-Nakhel C, Pannico A, Graziani G, Kyriacou MC, Giordano M, et al. 2020. Variation in macronutrient content, phytochemical constitution and in vitro antioxidant capacity of green and red butterhead lettuce dictated by different developmental stages of harvest maturity. Antioxidants 9:300

    doi: 10.3390/antiox9040300

    CrossRef   Google Scholar

    [25]

    Pinto E, Almeida AA, Aguiar AA, Ferreira IMPLVO. 2015. Comparison between the mineral profile and nitrate content of microgreens and mature lettuces. Journal of Food Composition and Analysis 37:38−43

    doi: 10.1016/j.jfca.2014.06.018

    CrossRef   Google Scholar

    [26]

    Klopsch R, Baldermann S, Hanschen FS, Voss A, Rohn S, et al. 2019. Brassica-enriched wheat bread: unraveling the impact of ontogeny and breadmaking on bioactive secondary plant metabolites of pak choi and kale. Food Chemistry 295:412−22

    doi: 10.1016/j.foodchem.2019.05.113

    CrossRef   Google Scholar

    [27]

    Waterland NL, Moon Y, Tou JC, Kim MJ, Pena-Yewtukhiw EM, et al. 2017. Mineral content differs among microgreen, baby leaf, and adult stages in three cultivars of kale. HortScience 52:566−71

    doi: 10.21273/HORTSCI11499-16

    CrossRef   Google Scholar

    [28]

    de la Fuente B, López-García G, Máñez V, Alegría A, Barberá R, et al. 2019. Evaluation of the bioaccessibility of antioxidant bioactive compounds and minerals of four genotypes of Brassicaceae microgreens. Foods 8:250

    doi: 10.3390/foods8070250

    CrossRef   Google Scholar

    [29]

    Renna M. 2016. Microgreens. Novel fresh and functional food to explore all the value of biodiversity, F. Di Gioia, P. Santamaria (Eds.), ECO-logica, Bari, Italy, 2015. ISBN: 978-88-909289-3-2 (Price: free, website: www.gustailbiodiverso.com/en/microgreens-ebook). South African Journal of Botany 106: 250

    [30]

    Kyriacou MC, El-Nakhel C, Graziani G, Pannico A, Soteriou GA, et al. 2019. Functional quality in novel food sources: genotypic variation in the nutritive and phytochemical composition of thirteen microgreens species. Food Chemistry 277:107−18

    doi: 10.1016/j.foodchem.2018.10.098

    CrossRef   Google Scholar

    [31]

    Kyriacou MC, El-Nakhel C, Pannico A, Graziani G, Soteriou GA, et al. 2020. Phenolic constitution, phytochemical and macronutrient content in three species of microgreens as modulated by natural fiber and synthetic substrates. Antioxidants 9:252

    doi: 10.3390/antiox9030252

    CrossRef   Google Scholar

    [32]

    Xiao Z, Luo Y, Lester GE, Kou L, Yang T, et al. 2014. Postharvest quality and shelf life of radish microgreens as impacted by storage temperature, packaging film, and chlorine wash treatment. LWT - Food Science and Technology 55:551−58

    doi: 10.1016/j.lwt.2013.09.009

    CrossRef   Google Scholar

    [33]

    Kyriacou MC, Rouphael Y. 2018. Towards a new definition of quality for fresh fruits and vegetables. Scientia Horticulturae 234:463−69

    doi: 10.1016/j.scienta.2017.09.046

    CrossRef   Google Scholar

    [34]

    Rennie TJ, Vigneault C, Raghavan VGS, DeEll JR. 2001. Effects of pressure reduction rate on vacuum cooled lettuce quality during storage. Canadian Biosystems Engineering 43:39−43

    Google Scholar

    [35]

    Lichtenthaler HK, Buschmann C. 2001. Chlorophylls and carotenoids: measurement and characterization by UV-VIS spectroscopy. Current Protocols in Food Analytical Chemistry 1:F4.3.1−F4.3.8

    doi: 10.1002/0471142913.faf0403s01

    CrossRef   Google Scholar

    [36]

    Mawlong I, Kumar MSS, Gurung B, Singh KH, Singh D. 2017. A simple spectrophotometric method for estimating total glucosinolates in mustard de-oiled cake. International Journal of Food Properties 20:3274−81

    doi: 10.1080/10942912.2017.1286353

    CrossRef   Google Scholar

    [37]

    Singleton VL, Rossi JA. 1965. Colorimetry of total phenolics with phosphomolybdic-phosphotungstic acid reagents. American journal of Enology and Viticulture 16:144−58

    doi: 10.5344/ajev.1965.16.3.144

    CrossRef   Google Scholar

    [38]

    Giusti MM, Wrolstad RE. 2001. Characterization and measurement of anthocyanins by UV-visible spectroscopy. Current Protocols in Food Analytical Chemistry 00:F1.2.1−F1.2.13

    doi: 10.1002/0471142913.faf0102s00

    CrossRef   Google Scholar

    [39]

    Benzie IFF, Strain JJ. 1996. The ferric reducing ability of plasma (FRAP) as a measure of "antioxidant power": the FRAP assay. Analytical Biochemistry 239:70−76

    doi: 10.1006/abio.1996.0292

    CrossRef   Google Scholar

    [40]

    Hanley ME, Fenner M, Whibley H, Darvill B. 2004. Early plant growth: identifying the end point of the seedling phase. New Phytologist 163:61−66

    doi: 10.1111/j.1469-8137.2004.01094.x

    CrossRef   Google Scholar

    [41]

    Buttery BR, Buzzell RI. 1977. The relationship between chlorophyll content and rate of photosynthesis in soybeans. Canadian Journal of Plant Science 57:1−5

    doi: 10.4141/cjps77-001

    CrossRef   Google Scholar

    [42]

    Heinze M, Hanschen FS, Wiesner-Reinhold M, Baldermann S, Gräfe J, et al. 2018. Effects of developmental stages and reduced UVB and low UV conditions on plant secondary metabolite profiles in pak choi (Brassica rapa subsp. chinensis). Journal of Agricultural and Food Chemistry 66:1678−92

    doi: 10.1021/acs.jafc.7b03996

    CrossRef   Google Scholar

    [43]

    Pecket RC, Small CJ. 2018. Significance of Genetic, environmental, and pre- and postharvest factors affecting carotenoid contents in crops: a review. Journal of Agricultural and Food Chemistry 66:5310−24

    doi: 10.1021/acs.jafc.8b01613

    CrossRef   Google Scholar

    [44]

    Pecket RC, Small CJ. 1980. Occurrence, location and development of anthocyanoplasts. Phytochemistry 19:2571−76

    doi: 10.1016/S0031-9422(00)83921-7

    CrossRef   Google Scholar

    [45]

    Nicolle C, Carnat A, Fraisse D, Lamaison JL, Rock E, et al. 2004. Characterisation and variation of antioxidant micronutrients in lettuce (Lactuca sativa folium). Journal of the Science of Food and Agriculture 84:2061−69

    doi: 10.1002/jsfa.1916

    CrossRef   Google Scholar

    [46]

    Brazaitytė A, Jankauskienė J, Novičkovas A. 2013. The effects of supplementary short-term red LEDs lighting on nutritional quality of Perilla frutescens L. microgreens. Rural Development 6:54−58

    Google Scholar

  • Cite this article

    Ortiz I, Zhu X, Shakoomahally S, Wu W, Kunle-Rabiu O, et al. 2024. Effects of harvest day after first true leaf emergence of broccoli and radish microgreen yield and quality. Technology in Horticulture 4: e003 doi: 10.48130/tihort-0023-0031
    Ortiz I, Zhu X, Shakoomahally S, Wu W, Kunle-Rabiu O, et al. 2024. Effects of harvest day after first true leaf emergence of broccoli and radish microgreen yield and quality. Technology in Horticulture 4: e003 doi: 10.48130/tihort-0023-0031

Figures(5)  /  Tables(3)

Article Metrics

Article views(2994) PDF downloads(649)

ARTICLE   Open Access    

Effects of harvest day after first true leaf emergence of broccoli and radish microgreen yield and quality

Technology in Horticulture  4 Article number: e003  (2024)  |  Cite this article

Abstract: Microgreens are 7−20-d old young vegetables with rich nutrition. In commercial settings, their harvest time varies after first true leaf emerges. To determine the optimal harvest time, the microgreen yield and quality of broccoli (Brassica oleracea var. italica Plenck) and radish (Rhaphanus sativus L.), were analyzed after different harvest times. Under hydroponic culture at 25 °C and 16/8 h photoperiod, the first true leaf of broccoli and radish emerged on day 10 and day 7 respectively. Broccoli harvested at day 13 and radish harvested at day 10, showed significantly highest yield and chlorophyll content compared to that of plants harvested on any other day. The microgreen yield was 20% higher when broccoli and radish were harvested at day 13 and day 10 compared to those harvested on earlier days. The overall visual quality of microgreens stored at 4 °C was evaluated for the extent of decay. There was less visible decay for broccoli harvested at day 13 and radish harvested at day 10. Regarding nutrient quality, there was no significant difference for glucosinolates and total phenolics among different harvested days. However, anthocyanins were decreased significantly for radish harvested at day 11. Overall, the results suggest that the best harvest time for radish and broccoli microgreens is when about 75% true leaves emerge. This research will provide microgreen growers a basis for determining the optimal harvest time of microgreens.

    • Microgreens are leafy greens consisting of fully developed cotyledons and the first true leaves. They are currently in high demand in diverse population settings. Consumers in urban areas are looking for local fresh produce to avoid the nutritional loss often associated with long transport and storage of produce[1]. Leafy greens can also be grown in a space station to supplement a space crew's diet[24]. Microgreens are different from sprouts because microgreens are grown under light in comparison to sprouts grown under dark conditions[5]. They are typically harvested between 7 and 20 d after gemination. Researchers have provided information on the nutritional quality of microgreens based on various cultivars and plant cultivation conditions[6]. In comparison to mature plants, microgreens are rich in phytochemicals, vitamins, and mineral elements (macro-elements: Ca, Mg, P, and micro-elements: Fe, Zn, K, Se, Cu and Mn)[79]. Sun et al.[10] found the nutrient levels up to nine times higher in microgreens compared to mature greens. In addition, high levels of nitrate are present in certain microgreens although in lower levels than baby leaves[11].

      The phytochemical composition and antioxidant capacity especially varies in the Brassicaceae family[1215]. Glucosinolates are unique secondary metabolites mainly found in Brassica vegetables and beneficial for human health[16]. Polyphenols act as reducing agents, hydrogen donating antioxidants and singlet oxygen quenchers most often in response to biotic or abiotic stress[17,18]. Polyphenols are distributed in different plant tissues and organs at different concentrations. The most widespread groups of polyphenols in Brassica species are the flavonoids (mainly flavonols but also anthocyanins). The anthocyanins are an important group of plant pigments with multifunctional components of food due to their antioxidant activity and other beneficial biological properties. Despite the microgreens small size, they have high levels of health beneficial secondary metabolites which contribute to their value in the market[1923].

      The progression through the initial stages of post-germination in plant ontogeny has a substantial impact on inducing notable changes in both the physical and chemical composition, as well as the phytochemical content of plants[12,24,25]. Determining the optimal harvest stage for microgreens involves a meticulous balance, considering the maximization of yield, ensuring swift crop turnover, and achieving elevated sensory and functional quality. However, there is limited information on the optimal harvest time in terms of both high microgreen yield and good quality. Kyriacou et al.[17] specifically characterized microgreens as greens that are harvested when the first pair of true leaves appears, and cotyledons are fully expanded and still turgid. Nevertheless, there is variability in the reported developmental stages at harvest across different studies, with some suggesting harvest at the cotyledonary stage[26,27], others at the emergence of the first true leaf[12,28,29], and still others at the second true leaf[27,3032]. Beyond the evident shift in fresh biomass during successive ontogenic stages, previous research has highlighted noteworthy alterations in secondary plant metabolites and mineral content, which are integral components contributing to the functional qualities of vegetables[33]. In the present study, two Brassicaceae species broccoli (Brassica oleracea var. italica Plenck) and radish (Raphanus sativus L.) were grown in the controlled growth chamber and harvested at different times after first true leaf emergence. The microgreen yield, nutritional quality and shelf-life were evaluated to determine the best harvest time.

    • Organic broccoli cultivar 'Di Cicco' and radish cultivar 'Rambo' seeds were purchased from True Leaf Market Seed Company (Salt Lake City, UT, USA). The experiment was carried out at the US department of agriculture (USDA)-Agricultural Research Center (ARS) (Food Quality Laboratory), Beltsville, Maryland, USA, in a controlled growth chamber (GC-20 Bigfoot series, Biochambers, Winnipeg, MB, Canada). The average 1,000 seed weight for the broccoli and radish was 3.15 g and 8.13 g. The germination rate was above 90% for both cultivars. Seeds were sown at a density of ~66,000 and 26,000 seeds/m2 for broccoli and radish, respectively on plastic trays (W × L × D: 25 cm × 52 cm × 6 cm) filled with a BioStrate™ felt hydroponic growing mats (Grow-Tech, Inc, Brentwood, TN, USA). A tray was used to grow two replicates for a total of two trays for each experimental unit. Seeds germinated in darkness at 25 °C and 90% relative humidity (RH) for 4 d. Daily irrigation of ~0.4 L water was manually applied to each tray. Deionized water (pH 5.8) was used to keep the mats moist throughout the experiment. On the fifth day after sowing, the seedlings were grown in hydroponic conditions at 25 °C and RH at 65/75% accordingly under a 16/8 h photoperiod regime delivered by Light Emitting Diode (LED) panels (K5 Series XL750, Kind LED, Santa Rosa, CA, USA). Photosynthetic photon flux density at the canopy level was maintained at 200 ± 10 mmol/m2/s of white light. The plants were fertilized by plant fertilizer (General Hydroponics, Inc; FloraGro 2-1-6 fertilizer, Sebastopol, CA, USA) by hand spray at day 7 after sowing the seeds. Daily rotation of tray positions maintained an equal distribution of light and humidity over the chamber growth surface. The first true leaf of broccoli and radish emerged on day 10 and day 7 respectively. Then the microgreens were harvested at days 11, 12, 13 and 14 for broccoli or days 8, 9, 10, and 11 for radish. Microgreens were harvested by hand with sterilized scissors. For each harvest day, three replicates were harvested. The length of ten randomly picked hypocotyls were measured for hypocotyl lengths for each replicate. The experiments were repeated three times.

    • On harvest day, 10 g samples of each microgreen species microgreens were harvested and stored in food-grade linear low-density polyethylene (LLDPE) bags. The LLDPE bags were 16 cm × 12 cm size (8.0 g per bag) and 51 μm thickness. The samples were then stored in three replications at 4 °C (in the dark) and RH 40%. For decay assessment, microgreens were visually inspected on days 4, 8, 12, and 16 of storage. The evaluation system was modified from Rennie et al.[34] based on the physical condition of the microgreens (Table 1). The extent of decay was recorded as a percentage of the total. The rating scale ranged from 1% (no decay) to 100% (degraded product). The higher the percentage, the more decayed plants. A marketability threshold was set at 50% on the visual quality scale. A rating of above 50% designated an unmarketable product.

      Table 1.  Microgreen decay evaluation scale based on overall visual analysis modified from Rennie et al.[34].

      ScoreDescriptionVisual quality
      0%Essentially free from defects, freshly harvested
      Excellent
      < 10%Minor defects, not objectionable
      Good
      < 25%Moderately objectionable defectsFair
      > 50%Excessive defects, not saleable, marketability thresholdPoor
      100%Unusable, degraded productVery poor
    • On harvest day and each day of decay analysis (4, 8, 12, and 16), 10 g per replicate of harvested microgreens were weighed and placed in 100 mL of deionized water (DI) for 30 min. An electrical conductivity reading of the water was taken using the Oakton WD-35419-20 Eutech series benchtop meter (Cole-Parmer, Vernon Hills, Illinois, USA). Microgreens were stored in plastic containers and frozen at −80 °C. Percent leakage was obtained by dividing measured leakage by total leakage.

    • One gram of each fresh broccoli sample and radish sample separately was added to 40 mL of 80% (v/v) acetone diluted in deionized water (DI) water and kept in darkness at room temperature (RT) until all the chlorophyll was cleared from the tissue. Absorbance of each sample was read at 663 nm and 646 nm using 1-mL cuvettes and a Bio-Rad SmartSpec™ plus UV–Vis spectrophotometer (Hercules, CA, USA). Total chlorophyll concentrations (mg/g F.W.) were calculated from absorbances (Abs) as described by Lichtenthaler & Buschmann[35].

    • Four grams of fresh microgreens sample were ground in a pestle and mortar using liquid nitrogen. Total glucosinolate content was evaluated by spectrophotometric estimation of Mawlong et al.[36]. For glucosinolate extractions, 0.1 g of ground fresh sample was added to 2-ml of 80% methanol in a 2-mL vial. Samples were incubated overnight or at least 12 h at RT. Tubes were centrifuged at 10,000 g for 4 min and supernatants were collected. One hundred µL of supernatant was added to a glass test tube with 300 µL water and 3 mL of 2 mM sodium tetrachloropalladate. Samples were incubated at RT for 1 h in the dark. Each sample (250 µL) was measured in triplicate in a multi-mode detection microplate reader, BioTek, Synergy™2 (Shoreline, WA, USA) at 425 nm. The glucosinolate concentration is calculated using the formula 1.40 + 118.86 × observation data (O.D.) at 425 nm.

      For phenolic and anthocyanin analyses, 2.5 g of ground frozen sample was added to 5 mL of extraction buffer comprising formic acid, methanol and water in a 3:60:37 ratio, respectively. The samples were stored in a 50-mL falcon tube at 4 °C overnight. The following day, the samples were centrifuged at 20,000 g for 20 min at 4 °C. The supernatant was collected and divided for phenolics and anthocyanin analysis. One 300 µL sample was used to determine total phenolics and two 600 µL individual samples were used to determine total anthocyanins as described below.

      Total phenolic content (TPC) was determined using the modified colorimetric Folin–Ciocalteu method[37]. For phenolic analysis, the 300 µL of supernatant sample and 300 µL of 0.2 M Folin–Ciocalteu reagent, and 2.1 mL water were added in a glass culture tube and mixed briefly. Then 75% sodium carbonate was added in a glass culture tube and samples were incubated at room temperature for 2 h in the dark. Each sample (250 µL) was measured in triplicates in a multi-mode detection microplate reader (BioTek, Synergy™, USA) at 765 nm. The total phenolic concentration is calculated using the formula ((O.D. 765 × 315.16 × 51) × 0.001). The same procedure was applied for standard solutions of different concentrations of gallic acid. The phenolic content was expressed as gallic acid (GA) equivalents.

      Total anthocyanin content was measured according to the pH differential method in Giusti & Wrolstad[38] by two buffer systems: 0.4 M sodium acetate (pH = 4.5) and 0.025 M potassium chloride (pH = 1). For anthocyanin analysis, 600 µL supernatant sample and 2.4 mL of 0.025 M potassium chloride pH 1 were added in a glass culture tube. In addition, another 600 µL supernatant sample and 2.4 mL of 0.025 M potassium chloride pH 4.5 were also added to a separate glass culture tube. Samples were incubated at room temperature in the dark for 15 min. Each sample (250 µL) was measured in triplicate in a multi-mode detection microplate reader (BioTek, Synergy™) at 510 and 700 nm. The following formula was used to calculate total anthocyanins in mg/kg units: [(O.D. 510 pH 1 – O.D. 700 nm pH 1) – (O.D. 510 nm pH 4.5 – O.D. 700 nm pH 4.5) × 449.2 × 255 × 1,000] / 26,900.

      The ferric reduction capacity of the tissues was determined using the ferric reducing antioxidant power (FRAP) assay based on Benzie & Strain[39]. The FRAP reagent was made from 300 mmol/L acetate buffer (pH 3.6) and 10 mmol 2,4,6-Tris(2-pyridyl)-1,3,5-triazine (TPTZ) in a 40 mmol/L HCl solution with 20 mmol/L FeCl3 in 10:1:1 ratio. 100 μl of the samples and 100 μl of the different concentrations of standard solutions (Trolox) were mixed with 900 μL FRAP reagent separately. Then, the samples and the standard were read at 595 nm with a microplate reader (BioTek, Synergy™). The standard Trolox curve was made with a concentration range of 10–800 μmol Trolox equivalents (TE). The total antioxidant activity was expressed as mg TE/100 g FW.

    • Quantitative measurements were analyzed in three replications per harvest day. Data was subjected to ordinary one-way ANOVA with Tukey's multiple comparisons test in GraphPad Software, LLC. Two-way ANOVA with Tukey's multiple comparisons test was performed for tissue decay after storage days. Two-way ANOVA with Tukey's multiple comparisons test was performed for tissue leakage after storage days. In all ANOVA tests, each p-value was adjusted to account for multiple comparisons, and this was reported as adj p-value. The asterisks in graphs represent statistical significance based on adj p-value.

      Statistical regression for correlation of postharvest quality parameters was performed in Microsoft Excel. The statistical regression was performed separately for broccoli and radish microgreens. The correlation coefficient (r) values were shown. The asterisks in tables represent statistical significance between correlation coefficients as p-value equal to or less than 0.05.

    • Under our indoor growth conditions, we observed the first true leaf emergence in a few broccoli plants on day 10 post seed sowing. Thus, broccoli microgreens were harvested on days 11, 12, 13, and 14 because harvest day 11 is the start of the first true leaf emergence in about 10% of plants. On harvest day 13, there were about 75% of plants with emergence of first true leaf. There was no significant difference in the number of true leaves between harvest days 13 and 14. There was a higher microgreen yield (fresh weight) when comparing yield harvested on day 12 to day 11. The yield of broccoli microgreens was significantly higher (adj p <0.0001) when harvested on days 13 and 14 compared to on day 11 or 12 (Fig. 1c). The hypocotyl length was also significantly taller (adj p < 0.0001) for plants harvested at days 14 compared to days 11 and 12 (Fig. 1d). The harvest day positively correlated with the yield (correlation coefficient r = 0.946) and hypocotyl length (r = 0.868) (Table 2). The microgreen yield also positively correlated with the hypocotyl length (r = 0.872).
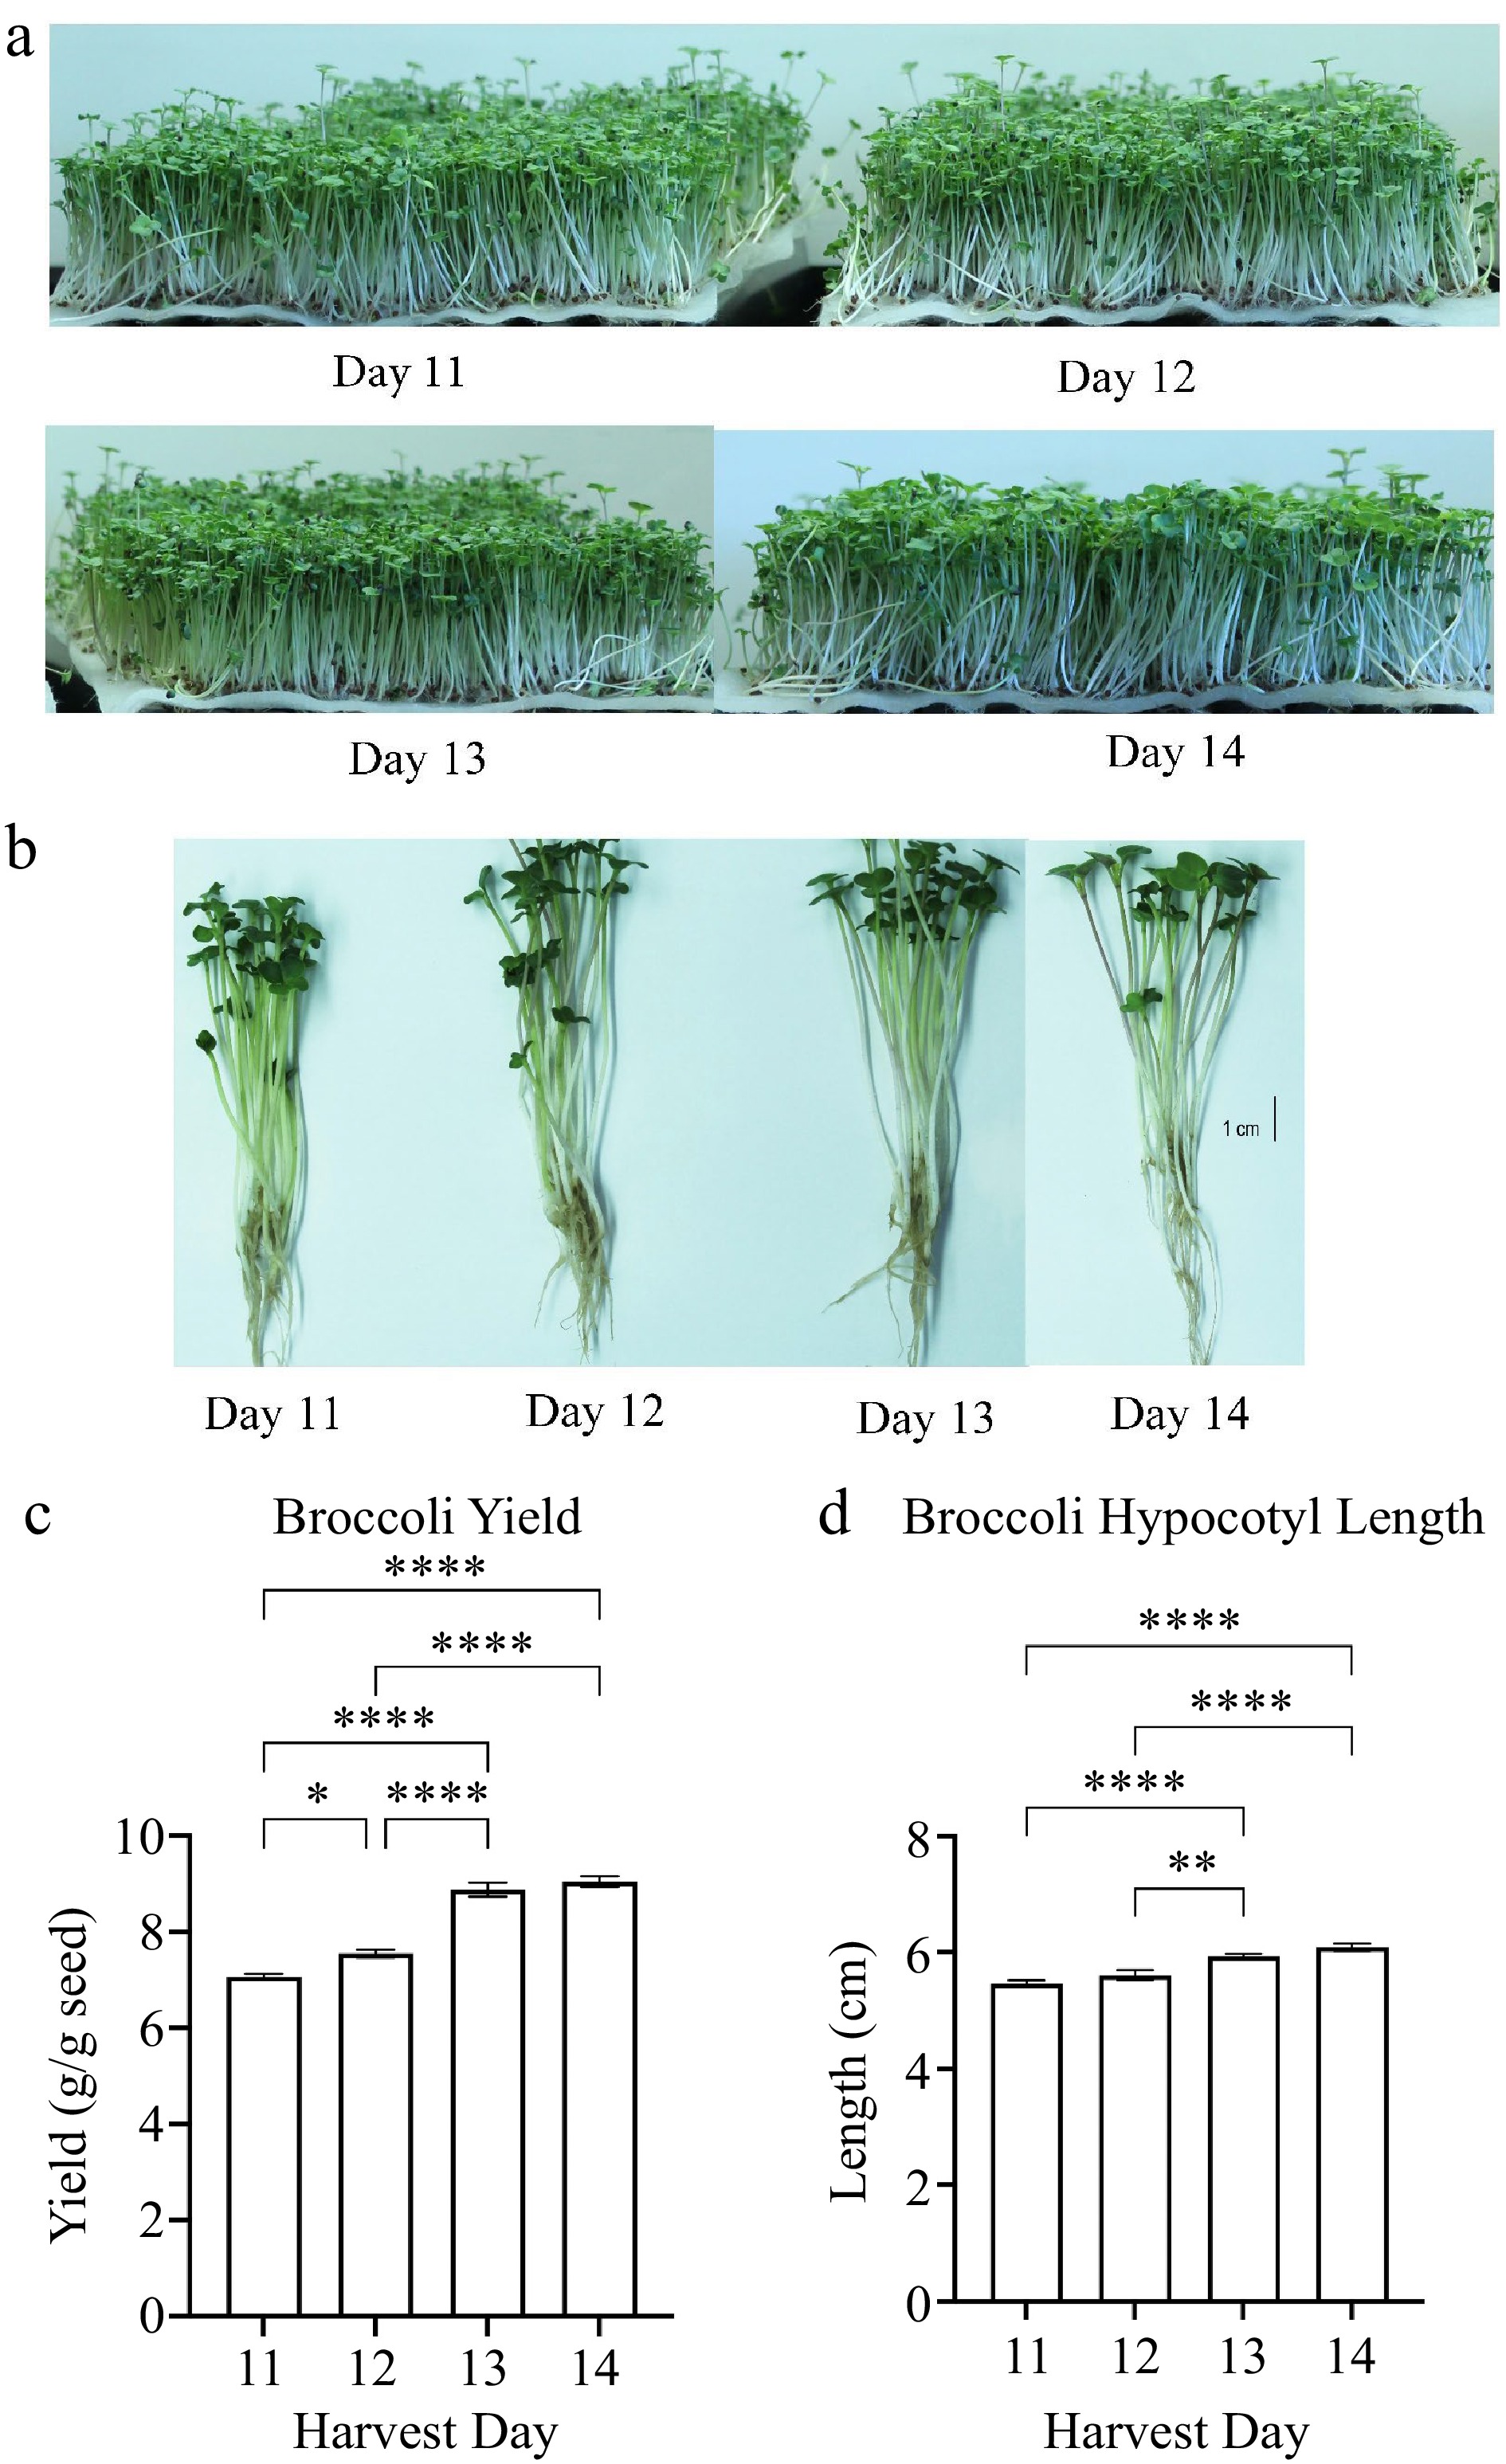
      Figure 1. 

      (a), (b) Broccoli plants images and measurements of microgreen (c) yield and (d) plant height. Seedlings of broccoli cultivar Di Cicco grown hydroponically in BioStrate™ growing mats for 11 to 14 d post sowing. Microgreen yield and height were measured at harvest days 11 to 14. Bars represent standard error of the means. Asterisks indicate significant differences in yield or height between harvest days. * Indicates adjusted (adj) p-value = 0.0485; ** indicates adj p-value = 0.0043; **** indicates adj p-value < 0.0001.

      Table 2.  Correlation for broccoli microgreen quality traits.

      Harvest dayPlant yieldPlant hypocotyl lengthTotal chlorophyllTotal
      phenolics
      Total glucosinolatesTotal antioxidant activityTissue decay after 16 storage daysTissue leakage after 16 storage days
      Harvest day1.000
      Plant yield0.946****1.000
      Plant hypocotyl length0.868**0.872**1.000
      Total chlorophyll0.917****0.930****0.841**1.000
      Total phenolics−0.276−0.286−0.303−0.3431.000
      Total glucosinolates−0.457−0.461−0.334−0.4210.3501.000
      Total antioxidant activity0.735*0.639*0.731*0.574*0.0730.0531.000
      Tissue decay after 16 storage days−0.789*−0.904****−0.750*−0.794*0.2940.3050.4591.000
      Tissue leakage after 16 storage days0.1510.3200.3130.0970.2020.0400.4130.3341.000
      The correlation coefficient (r) values are shown for comparisons of broccoli microgreens quality traits. The asterisks represent significance in r. * indicates 0.0021 < p-value ≤ 0.05; ** indicates 0.0002 < p-value ≤ 0.0021; *** indicates 0.0001 < p-value ≤ 0.0002; **** indicates p-value < 0.0001.

      To determine whether other vegetables had the same trend, we did a similar test on radish. Radish microgreens were harvested at the start of about 10% first true leaf emergence initiating on day 8 post sowing (Fig. 2a & b). On harvest day 10, there were about 75% of plants with emergence of first true leaf. The yield of radish microgreens was significantly higher (0.0002 < adj p-value ≤ 0.0021) when harvested at harvest days 10 and 11 compared to harvest days 8 and 9 post sowing (Fig. 2c). There was a positive correlation between harvest day and plant yield (r = 0.875) (Table 3). The hypocotyl length for radish microgreens was not affected by harvest day after first true leaf emergence (Fig. 2d).
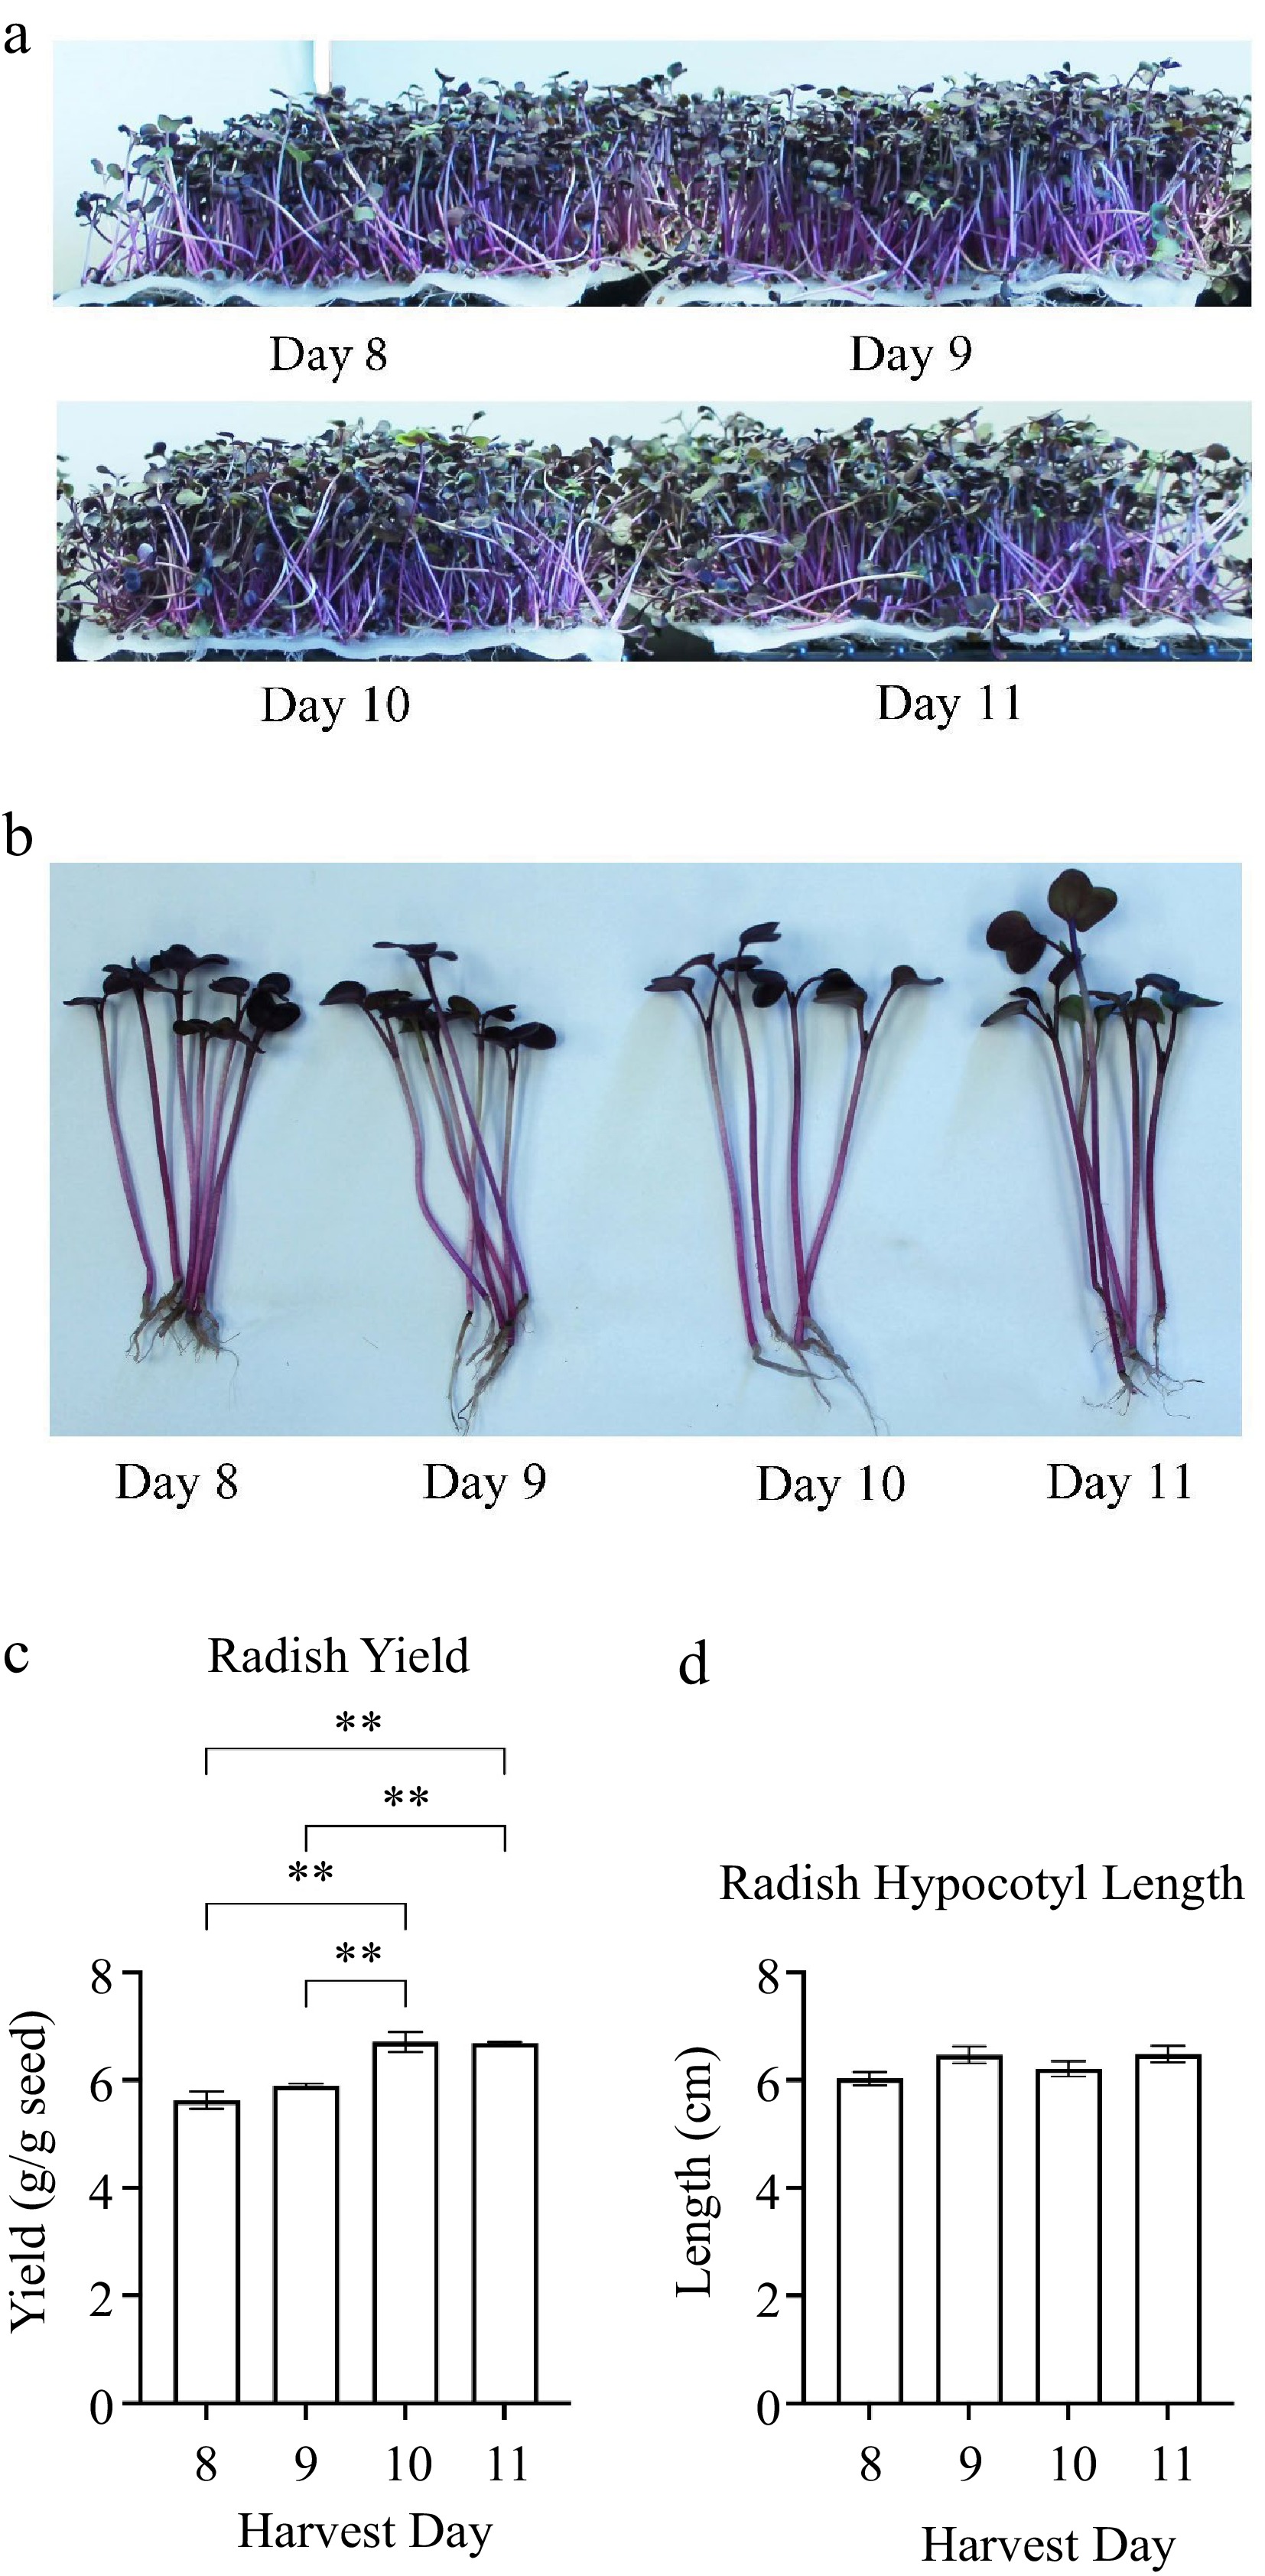
      Figure 2. 

      (a), (b) Radish plant images and measurements of (c) yield and (d) plant height. Radish cultivar Rambo were grown hydroponically in BioStrate™ growing mats for 8 to 11 days post sowing. Radish microgreens' yield and height were measured on harvest days 8 to 11. Bars represent standard error of the means. Asterisks indicate significant differences between harvest days. ** Indicates 0.0002 < adj p-value ≤ 0.0021.

      Table 3.  Correlation for radish microgreens quality traits.

      Harvest dayPlant yieldPlant hypocotyl lengthTotal chlorophyllTotal anthocyaninsTotal phenolicsTotal glucosinolatesTotal antioxidant activityTissue decay after 16 storage daysTissue leakage after 16 storage days
      Harvest day1.000
      Plant yield0.875**1.000
      Plant hypocotyl length0.2950.1561.000
      Total chlorophyll0.0250.0260.3311.000
      Total anthocyanins−0.659*−0.391−0.2620.2561.000
      Total phenolics0.2930.4900.2370.107−0.3621.000
      Total glucosinolates−0.267−0.232−0.0140.0850.488−0.4231.000
      Total antioxidant activity0.3240.3950.0480.2730.1950.3920.2901.000
      Tissue decay after 16 storage days−0.673*−0.724*−0.0480.1930.165−0.3170.0300.4111.000
      Tissue leakage after 16 storage days0.2160.3950.0480.3350.1950.3920.2900.3240.4111.000
      The correlation coefficient (r) values are shown for comparisons of radish microgreens quality traits. The asterisks represent significance in r, * indicates 0.0021 < p-value ≤ 0.05; ** indicates 0.0002 < p-value ≤ 0.0021.
    • The broccoli total chlorophyll content was significantly higher on harvest day 13 (0.75 mg/g FW) compared to harvest days 11 (0.62 mg/g FW) and 12 (0.66 mg/g FW) (Fig. 3a). The total chlorophyll content was highest on harvest day 14 (0.77 mg/g FW) (Fig. 3a). The harvest day positively correlated with the total chlorophyll content (r = 0.917) (Table 2). The plant yield and hypocotyl length also positively correlated with the total chlorophyll content (Table 2). However, the total glucosinolates in broccoli decreased on harvest days 12 (40.44 µmole/g), 13 (40.67 µmole/g), and 14 (40.84 µmole/g) compared to harvest day 11 (41.57 µmole/g) (Fig. 3b). There was not a significant change in total phenolics in broccoli for harvest days 11 to 14 (Fig. 3c). Neither phenolics nor glucosinolates correlated with the physiological or other nutrient qualities of broccoli microgreens (Table 2). The total antioxidant activity levels were the lowest at harvest day 14 (1.5 mg TE/100 g FW) compared to harvest day 11 (2.0 mg TE/100 g FW), harvest day 12 (2.1 mg TE/100 g FW), and harvest day 13 (1.9 mg TE/ 100 g FW) (Fig. 3d). The total antioxidant activity was comparatively similar between harvest days 11 to 13 in broccoli (Fig. 3d).
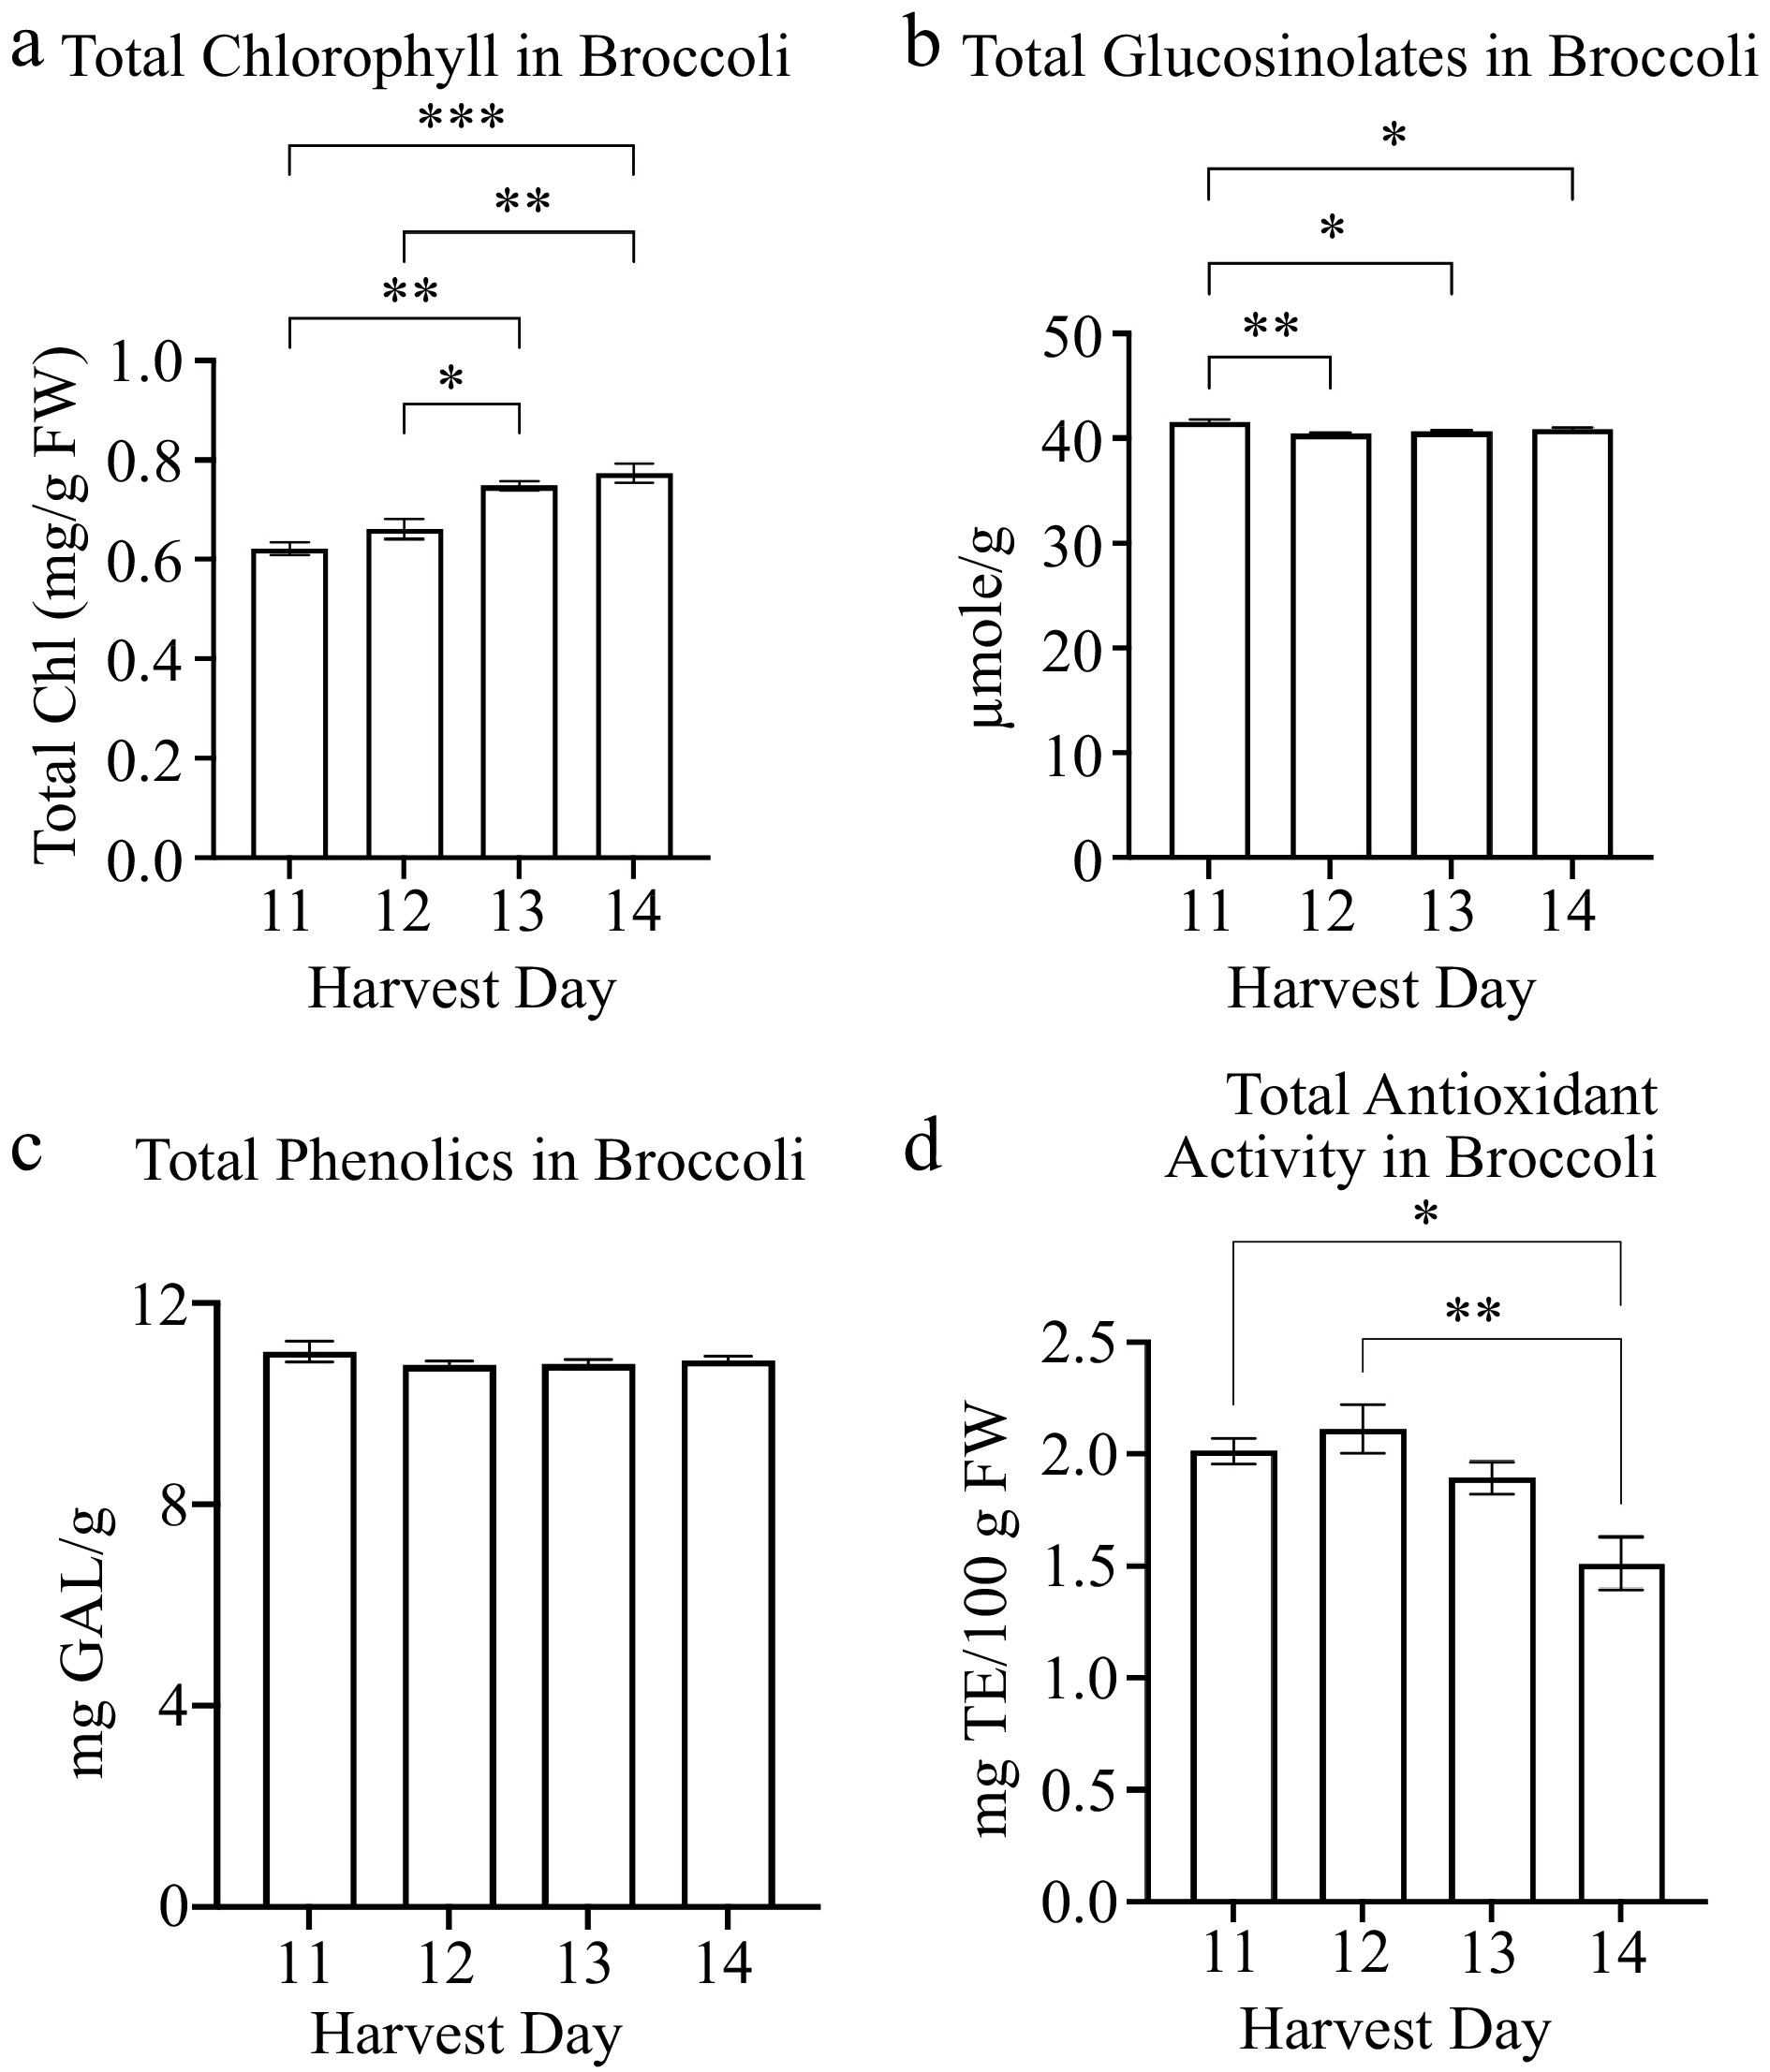
      Figure 3. 

      Concentrations of broccoli microgreens (a) total chlorophyll and secondary metabolites: (b) glucosinolates, (c) phenolics and (d) antioxidant activity in broccoli microgreens for several harvest days is shown. Bars represent standard error of the means. Asterisks indicate significant differences in total chlorophyll or glucosinolates between harvest days. * Indicates 0.0021 < adj p-value ≤ 0.05; ** indicates 0.0002 < adj p-value ≤ 0.0021; *** indicates 0.0001 < adj p-value ≤ 0.0002.

      The total chlorophyll content was similar between harvest days 8 to 11 in radish (Fig. 4a, Table 3). The total glucosinolates and phenolics were comparatively similar between harvest days 8 to 11 in radish (Fig. 4b & c, Table 3). The radish total antioxidant activity was significantly higher on harvest day 10 (4.2 mg TE/100 g FW) compared to harvest day 8 (3.02 mg TE/100 g FW), 9 (3.8 mg TE/100 g FW), and 11 (3.2 mg TE/100 g FW) (Fig. 4d). The total antioxidant activity was lowest on harvest day 8 (3.02 mg TE/100 g FW) (Fig. 4d). The harvest day positively increased the total antioxidant activity during microgreen growth from day 8 to 10. However, the total antioxidant activity in radish decreased on harvest day 11 (Fig. 4d). An additional antioxidant measured in radish was total anthocyanin content. There was a negative correlation between total anthocyanins and harvest day (r = −0.659) (Table 3). The anthocyanin levels were the lowest at harvest day 11 (4,300 mg/kg) compared to harvest day 8 (5,562 mg/kg), 9 (5,748 mg/kg), and 10 (5,322 mg/kg) (Fig. 4e).
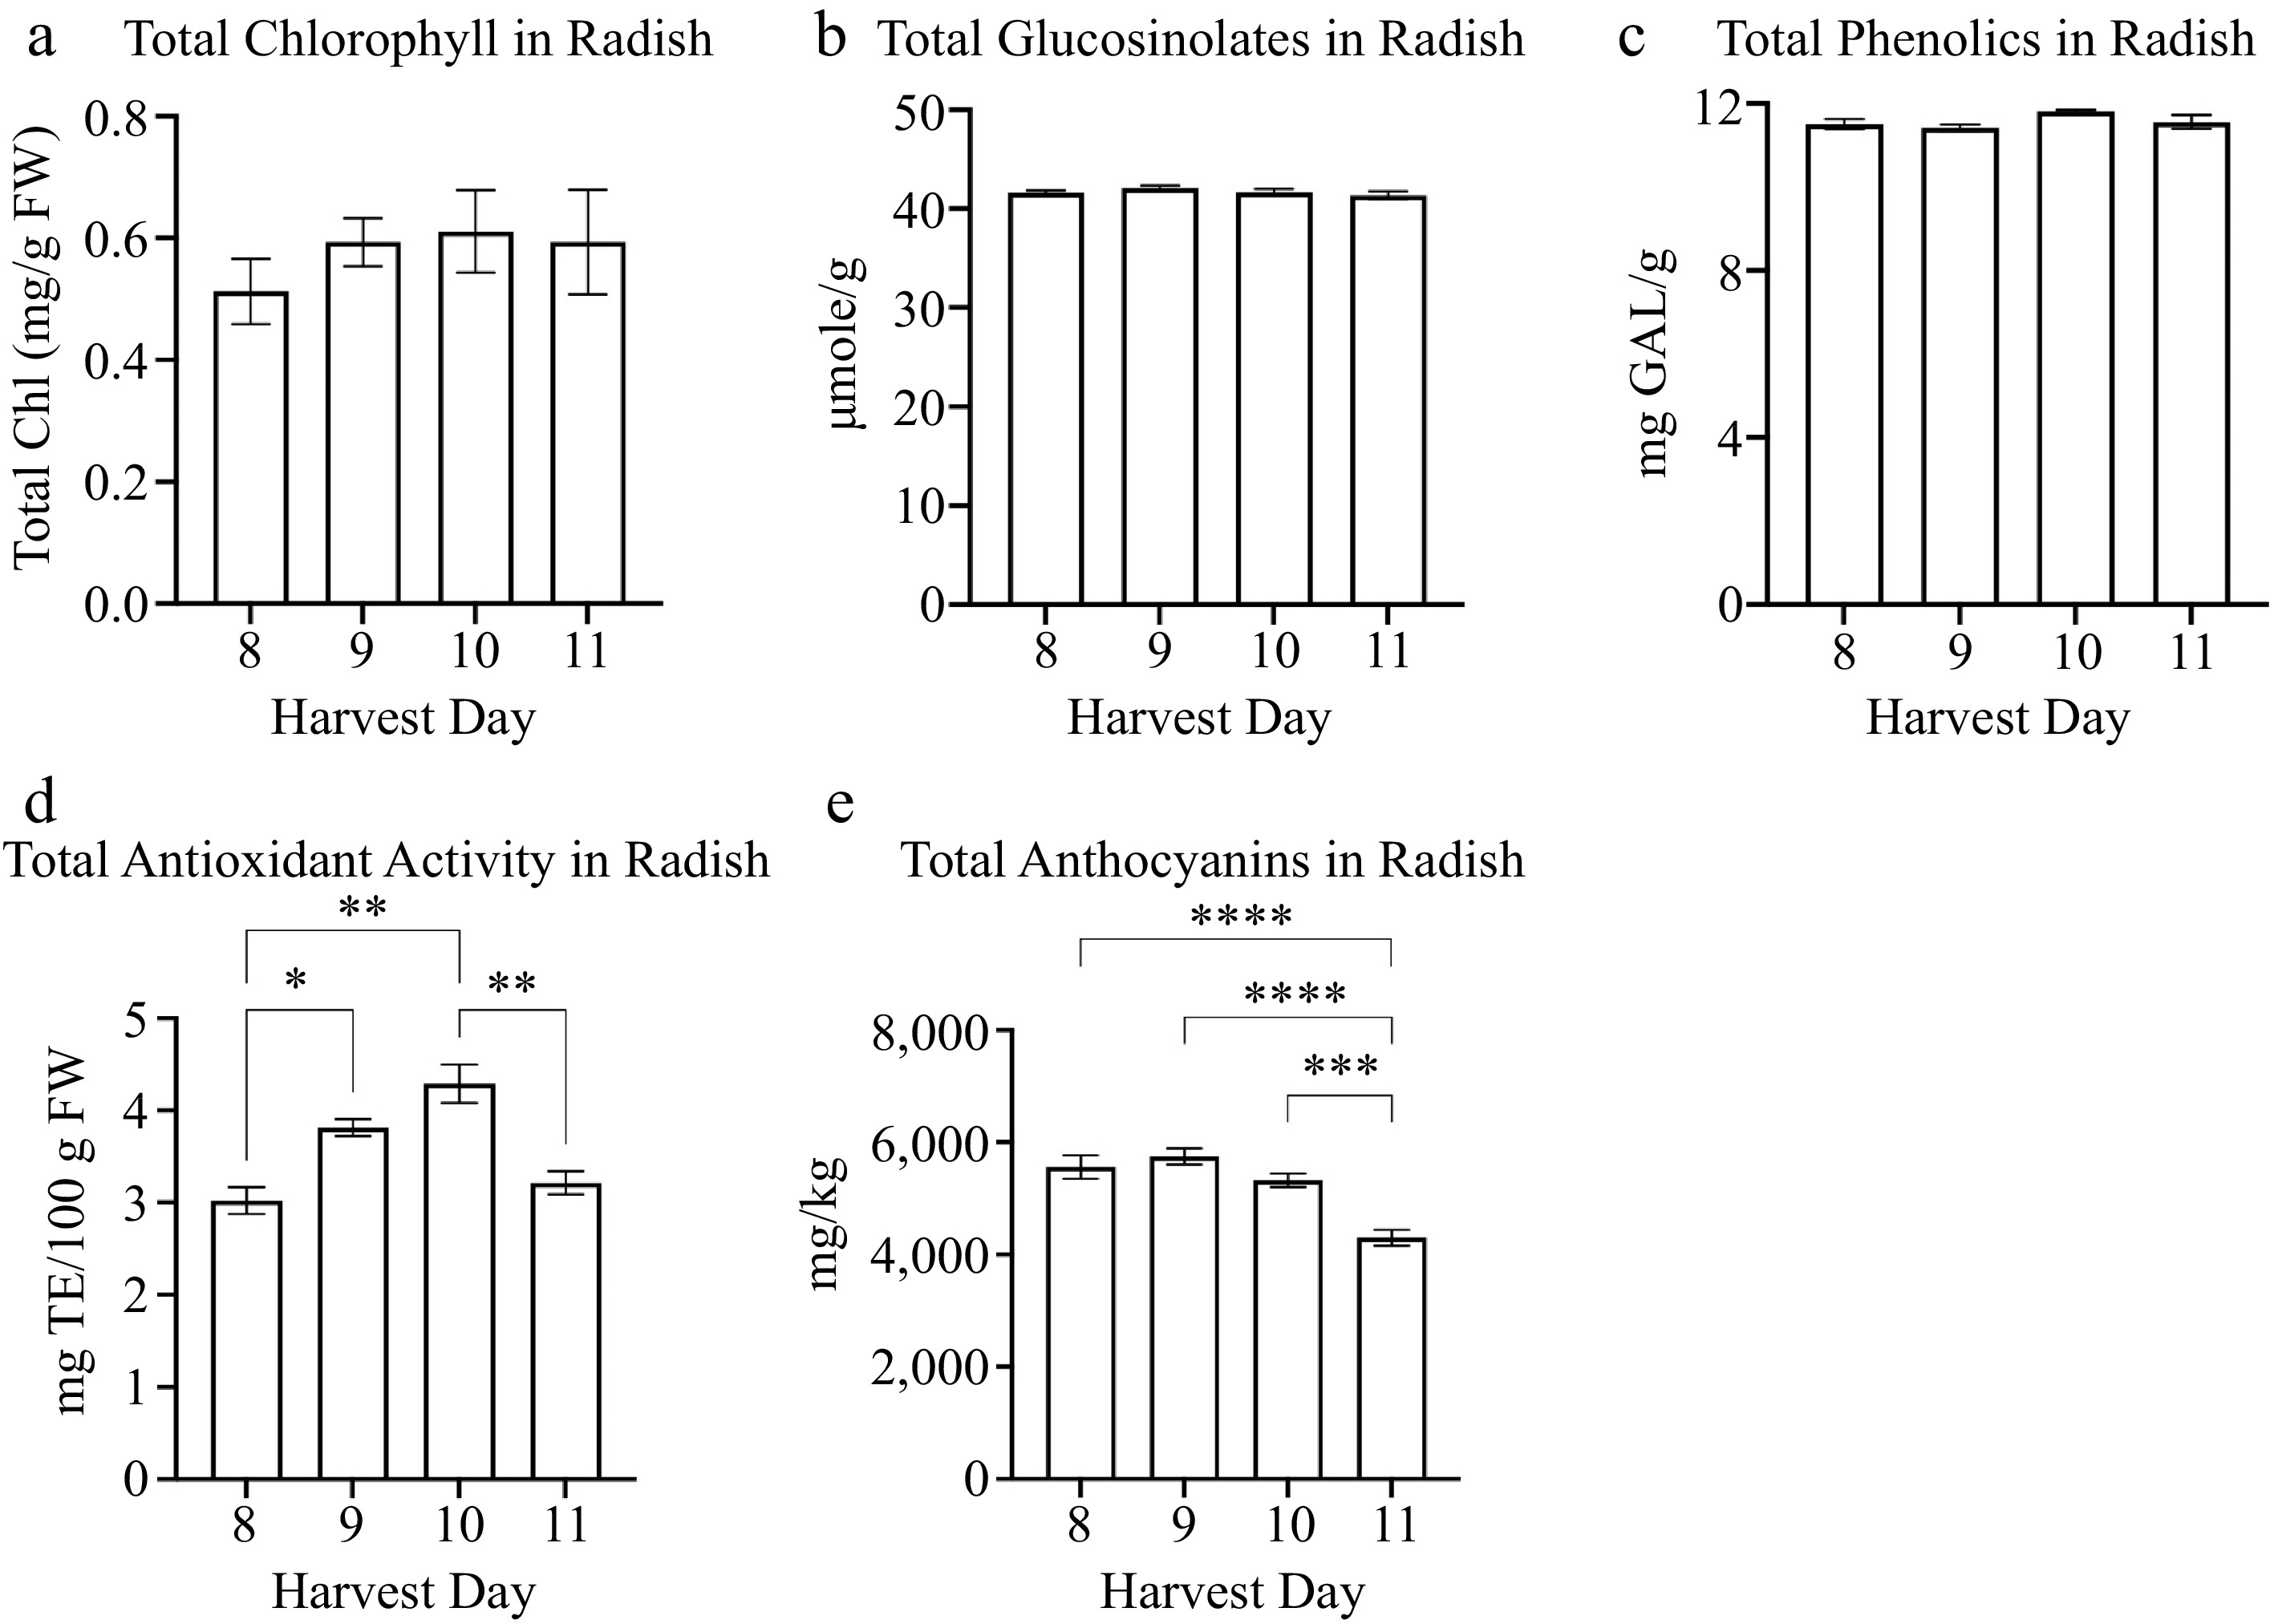
      Figure 4. 

      Concentrations of radish microgreens (a) total chlorophyll and secondary metabolites: (a) glucosinolates, (b) phenolics, (c) antioxidant activity, and (d) anthocyanins for radish microgreens at several harvest days is shown. Bars represent standard error of the means. Asterisks indicate significant differences in total anthocyanins between harvest days. * Indicates 0.0021 < adj p-value ≤ 0.05; ** indicates 0.0002 < adj p-value ≤ 0.0021; *** indicates 0.0001 < adj p-value ≤ 0.0002; **** indicates adj p-value < 0.0001.

    • The extent of broccoli and radish decay (Fig. 5) was observed on storage days 4, 8, 12 and 16 of storage at 4 °C. The difference in decay between broccoli samples harvested at different ages was visible by the 8th day of storage (Fig. 5a). Differences in decay between radish samples harvested at different ages were apparent by the 12th day of storage (Fig. 5c). At storage day 16, the highest incidence of decay for both broccoli and radish microgreens occurred in plants harvested at the stage when the first true leaf had emerged in about 10% of the plants (harvest day 11 for broccoli and harvest day 8 for radish). The lowest incidence of decay occurred in plants harvested when about 75% of the first true leaves had emerged, i.e., on harvest day 13 for broccoli and harvest day 10 for radish. The extent of microgreen decay after 16 d of storage negatively correlated with harvest day (r = −0.7889 in broccoli) (Table 2), (r = −0.673 in radish) (Table 3). The incidence of decay in radish after 16 storage days negatively correlated with the yield (r = −0.724) (Table 3). In comparison, the incidence of decay in broccoli negatively correlated with microgreen yield, hypocotyl length, and total chlorophyll content (Table 2). The tissue leakage is variable for both broccoli and radish at storage days 0 to 16 for all harvest days (Fig. 5b & d).
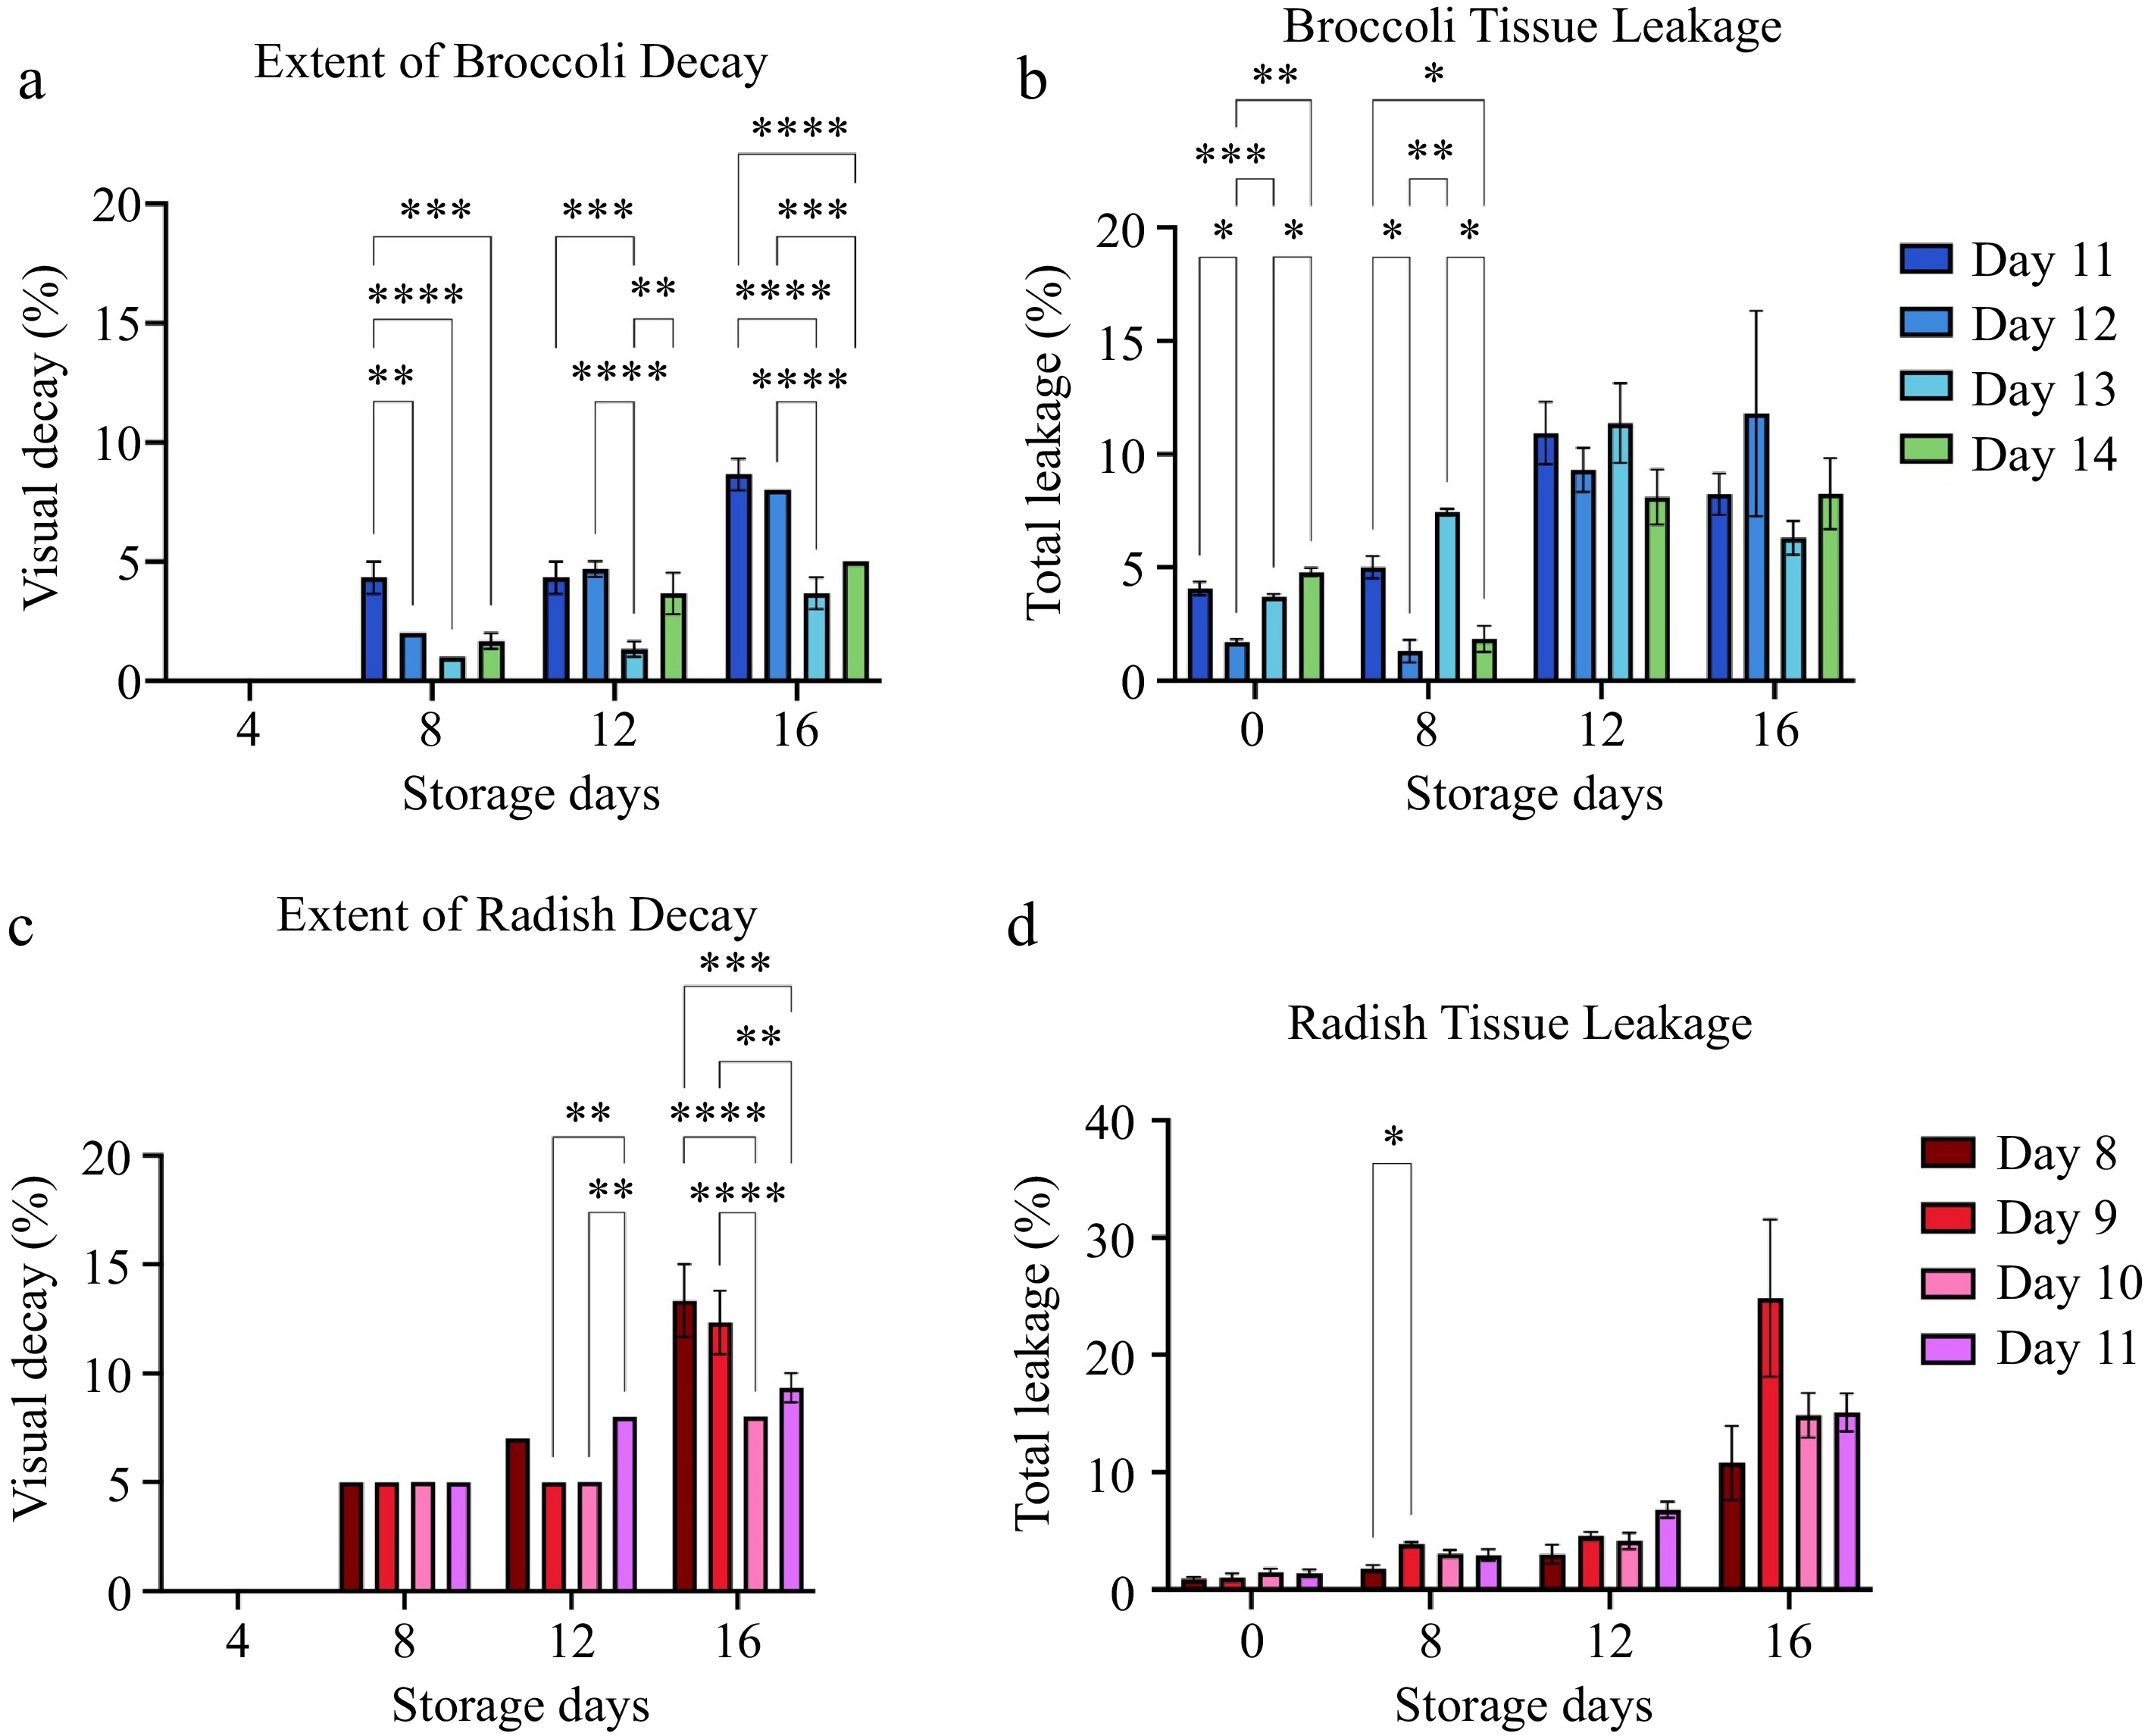
      Figure 5. 

      The extent of decay and tissue leakage for (a), (b) broccoli and (c), (d) radish microgreens at several storage days is shown. Bars represent standard error of the means. Asterisks indicate significant differences in total anthocyanins between harvest days. * Indicates 0.0021 < adj p-value ≤ 0.05; ** Indicates 0.0002 < adj p-value ≤ 0.0021; *** indicates 0.0001 < adj p-value ≤ 0.0002; **** indicates adj p-value < 0.0001.

    • The ideal harvest time for microgreens should strike a balance between achieving high yield, rapid crop turnover, and maintaining superior quality. Much of the existing research on microgreens has no clarity regarding plant growth stage to harvest. In their review of microgreens, Kyriacou et al.[17] specified microgreens as greens harvested when the first pair of true leaves emerges, and cotyledons are fully expanded and still turgid. However, the developmental stage at harvest varies among different studies, with some researchers advocating for harvest at the cotyledonary stage[26,27], others at the emergence of the first true leaf[12,28,29], or at the second true leaf[27,3032].

      In this study, we demonstrated that harvest day 13 is the optimal time for 'Di Cicco' broccoli microgreens based on higher yield, chlorophyll content, and lower decay at storage day 16. The optimal time to harvest Rambo radish microgreens was at harvest day 10 based on higher yield and lower decay at storage day 16 (Figs 2 & 5). Both day 13 for broccoli and day 10 for radish were at the stage when about 75% first true leaf emerged. Furthermore, both broccoli and radish microgreens at this stage exhibited the lowest decay and the longest shelf life (Tables 2 & 3). However, when microgreens were harvested after this stage (day 13 and day 10 for broccoli and radish microgreens), the yield did not increase significantly, while the quality and shelf life of broccoli and radish microgreens decreased. This could result from the depletion of the reserved nutrients in the cotyledons because we did not provide much additional plant nutrients during hydroponic culture. Hanley et al.[40] studied the seedling growth pattern of pea without adding any nutrients and found the relative growth rate decreased between 11 and 13 days after emergence. The slow growth is correlated with the reduction of nutrients such as nitrogen, phosphorus and potassium in the cotyledons. Hence, it will be interesting to investigate whether applying plant nutrients will affect the optimal harvest time of microgreens.

      The total chlorophyll in broccoli showed a significant positive correlation with the harvest day, plant yield, and hypocotyl length. The higher chlorophyll content in broccoli may play a role in light harvesting for photosynthesis and other plant metabolic pathways essential for nutrient acquisition. As shown in previous research, the plant photosynthesis rate correlates with increased chlorophyll and increased biomass in plants[41]. Although the parameters of nutrient quality and plant physiology (yield and height) did not show a difference between harvest days 13 and 14, there is lower decay for harvest day 13. There was not a larger leaf size in true leaves at harvest day 14 compared to day 13. The same comparison can be made for radish 'Rambo' microgreens harvest days 10 and 11, and there was less decay for harvest day 10 microgreens. Hence, harvest day 13 broccoli and harvest day 10 radish had the longest shelf life. The observed significant variability across growth stages also extends to the concentration of chlorophyll in microgreens. This aligns with similar findings that emphasized a substantial interaction between growth stages and chlorophyll pigment concentration, as demonstrated in prior research involving red and green butterhead lettuce cultivars harvested at different times, covering both microgreens and mature growth stages[24]. Notably, studies conducted by Klopsch et al.[26] and Heinze et al.[42] revealed a significant increase in chlorophyll levels from cotyledonary microgreens to the mature-leaf stage. This suggests that the brief ontogenic interval from an earlier harvest time to a later harvest time may introduce variations in chlorophyll levels, crucial components of the developing photosynthetic apparatus synthesized in response to evolving light-harvesting requirements[43].

      Interestingly, there were slightly lower glucosinolates in harvest days 13 and 14 in broccoli and there were comparatively similar phenolic levels between harvest days 11 to 14. In radish, there were similar phenolic and glucosinolate levels between harvest days 8 to 11. The current study indicated that the harvest time was not potentially a significant source of variation in glucosinolates and phenolic content.

      The total anthocyanin contents decreased in radish at later harvest days. A decrease in anthocyanins can be due to a dilution of anthocyanins after cotyledons and leaf expansion[44]. Kyriacou et al.[17] reached the conclusion that the developmental changes in red genotypes were inconsistent. In Komatsuna, anthocyanin concentration increased during the transition when the second true leaf emerged. In contrast, in Pak Choi, maximal concentrations were observed when the first true leaf appeared. This inconsistency highlights that, beyond the evident disparity in the relative abundance of anthocyanins, the variation with developmental stage is primarily genotype-specific. Consequently, determining the optimal harvest stage based on visual quality must be tailored to each specific genotype, emphasizing the need for a case-by-case approach.

      The radical-quenching antioxidant activity can significantly differ among microgreen varieties, especially between red and green types, with red microgreens generally demonstrating greater antioxidant capacity[45]. This suggests that including red microgreens in the human diet is expected to help counteract the effects of oxidative stress. This observation aligns with earlier research by Brazaitytė et al. [46] and is further substantiated by our current study, where the purple radish microgreens exhibited higher antioxidant capacity compared to the green broccoli microgreens (Figs 3 & 4). Additionally, the antioxidant characteristics of microgreens seem to vary not just based on genotype but also with growth stage. In the case of radish, the total antioxidant activity was notably higher on harvest day 10, which also coincided with the optimal harvest day, resulting in the least decay after storage.

    • Microgreens are usually harvested after first true leaf emergence. However, the harvest time varied by difference researchers and growers. In this study, optimal harvest time for broccoli and radish under hydroponic culture were identified as day 13 for broccoli and day 10 for radish microgreens, characterized by approximately 75% first true leaf emergence. Microgreens harvested on these days exhibited higher overall yields, increased chlorophyll content in broccoli, and lower decay compared to other harvest days. In terms of nutritional quality, total phenolic and glucosinolate content in radish and broccoli mcirogreens showed minimal variation across harvest times. Instead, delaying radish harvest to day 11 significantly reduced anthocyanin content and antioxidant activity. Similarly, delaying broccoli harvest to day 14 significantly decreased antioxidant activity. While determining the optimal harvest stage should account for genotype-specific yield and nutritional quality considerations, harvesting on day 13 for broccoli and day 10 for radish is recommended for growers in hydroponic growth conditions.

    • The authors confirm contribution to the paper as follows: conception and experiment design: Yang T, Ortiz I, Zhu X, Shakoomahally S; data collection: Ortiz I, Zhu X, Shakoomahally S; analysis and interpretation of results: Ortiz I, Zhu X, Shakoomahally S, Wu W, Kunle-Rabiu O, Turner E, Yang T; draft manuscript preparation: Ortiz I, Shakoomahally S, Wu W, Yang T. All authors reviewed the results and approved the final version of the manuscript.

    • The datasets generated during and/or analyzed during the current study are available from the corresponding author on reasonable request.

      • This study was supported by USDA-ARS National Program 306 (No. 8042-43000-016-00D), USDA NE1836 and USDA-ARS/NASA MOU No. 58-8042-1-003.

      • The authors declare that they have no conflict of interest. Tianbao Yang is the Editorial Board member of Technology in Horticulture who was blinded from reviewing or making decisions on the manuscript. The article was subject to the journal's standard procedures, with peer-review handled independently of this Editorial Board member and the research groups.

      • Copyright: © 2024 by the author(s). Published by Maximum Academic Press, Fayetteville, GA. This article is an open access article distributed under Creative Commons Attribution License (CC BY 4.0), visit https://creativecommons.org/licenses/by/4.0/.
    Figure (5)  Table (3) References (46)
  • About this article
    Cite this article
    Ortiz I, Zhu X, Shakoomahally S, Wu W, Kunle-Rabiu O, et al. 2024. Effects of harvest day after first true leaf emergence of broccoli and radish microgreen yield and quality. Technology in Horticulture 4: e003 doi: 10.48130/tihort-0023-0031
    Ortiz I, Zhu X, Shakoomahally S, Wu W, Kunle-Rabiu O, et al. 2024. Effects of harvest day after first true leaf emergence of broccoli and radish microgreen yield and quality. Technology in Horticulture 4: e003 doi: 10.48130/tihort-0023-0031

Catalog

  • About this article

/

DownLoad:  Full-Size Img  PowerPoint
Return
Return