-
Cassia angustifolia (Caesalpinaceae), known as Tinnevelly or Indian Senna, is cultivated for its leaves and immature pods. Dianthrone glucosides and sennosides A and B in the leaves and pods have potent laxative properties[1,2]. Sennosides primarily operate on the lower colon and are notably beneficial in cases of chronic constipation[1,3]. The glycosides are absorbed from the intestinal system; they stimulate the peristaltic movements of the colon, causing it to move. Long-term usage of the leaves may induce colon problems and produce grip if not paired with carminatives. The National Medicinal Plant Board (NMPB) of India has identified 32 plants for scaling up, and Senna is one of them. Senna is the second-largest earner of foreign exchange through exports. Its leaves and pods are regarded as reliable sennoside sources in global trade[4]. However, Indian Senna should compete with Alexandrian Senna regarding cost-effectiveness and quality. Alexandrian senna natural collections cannot supply the growing demand for Senna commodities. India has a tremendous opportunity to expand its manufacturing, commerce, and export opportunities. Tinnevelly Senna (C. angustifolia) is grown in India's southern and central parts[5]. Senna herbage production is estimated to be around 7,500 tonnes per year. The pods and leaves of a few other senna species, the most important of which is Alexandrian Senna, have laxative properties similar to those of Cassia angustifolia. Alexandrian Senna grows naturally in North African countries such as Ethiopia and Sudan[1,2].
The swiftly increasing global population and continuously expanding geographical boundaries of the global agricultural system are extending agricultural activities on marginal soils unsuited for growing. On such terrain, crop options are limited, especially in an arid macroregion. Senna is a tropical medicinal plant that could be a dry-land crop for barren land. Areas with inadequate irrigation facilities (arid or semi-arid) are ideal for Senna cultivation, while regions with heavy rainfall, high humidity, and poor drainage are not perfect[6−8]. Senna grows as a perennial shrub in dry areas of Africa and neighboring countries. The Senna crop is commercially grown in all sub-tropical regions of India and spread in semi-arid parts of southern India; it is marketed under the brand name 'Tirunelveli Senna' (C. angustifolia)[3,9,10]. Tuticorin has many exporters, shipping 7,500 to 9,000 tonnes of Senna leaves each year and earning Rs 35 to 60 crore in forex 'depending on the current market price'[9].
Modern agriculture relies heavily on chemical fertilizers to cope with the demands of a growing population. The continued use of inorganic fertilizers endangers soil health. The beneficial microorganisms decline, and natural nutrition restoration in the soil ceases, causing the soil to become unfertile[9,10]. As a result, the use of organic manure and proportionate inorganic fertilizers needs to be reduced to improve the quality and productivity of the crop's food grain, oilseed, or medicinal crop. This gradually results in a significant need for integrated nutrient management (INM), which will boost soil productivity continuously over time through the appropriate use of fertilizers and liquid organic manure[11,12].
Organic farming has recently risen in popularity because of its inherent benefits. It contributes to crop production sustainability, complex soil nutrient status, and a clean environment[11,12]. Using fermented liquid organic manure or bio-enhancers like Jeevamrutha is a less expensive and eco-friendly preparation made from cow products. A natural biostimulant (Jeevamrutha) is a plant growth stimulant that increases crop biological efficiency[13]. It aids in accelerating soil, protects plants from diseases, and enhances the nutritional content of fruits and vegetables. It has been utilized in seedling treatment, soil application with irrigation water, foliar spraying, and much more.
The application of liquid manure boosts microbial activity and biomass in the soil. The use of liquid organic inputs like Jeevamrutha boosts the population of beneficial bacteria and has a substantial impact on soil enzyme activity. As a result, they promote crop growth and help to maintain a safe environment and production of crops. Given the foregoing, the experiment was conducted at CSIR-CIMAP, RC, Hyderabad, with the aim of establishing the optimal doses of Jeevamrutha for increasing Senna quality and production.
-
A trial was undertaken in the CSIR-CIMAP R.C. in Hyderabad, India, for two consecutive years, 2020−2021 and 2021−2022 in the Rabi season (September to January). The experimental site's latitude, longitude, and altitude were 17°25' N, 78°33' E, and 582 m above mean sea level. Table 1 lists further information, including the climatic conditions. The experiment was laid out in a randomized complete block design (RCBD) with three replications on well-drained, red sandy soil (Table 1).
Table 1. Location, climate and soil of CSIR-CIMAP R.C. at Boduppal, Hyderabad, Telangana State, PIN: 500 092, India and chemical composition of bio stimulant.
GPS coordinates, soil and climate Estimated parameters of bio stimulant (Jeevamrutha) Latitude 17°25' N Longitudes 78º33' E pH 7.08 Mean sea level 582 m above EC (dS·m−1) 2.98 Climate Semi-arid tropical Total nitrogen (ppm) 67 Average annual rainfall 764 mm Total phosphorus (ppm) 154 Soil Red sandy soil (79.2% sand, 9.8% silt, 6.8% clay) Total potassium (ppm) 112 pH 7.7 Total zinc (ppm) 3.52 EC 0.77 dS·m−1 Total copper 1.32 Organic carbon 0.29% Total iron (ppm) 12.4 Available N 162.4kg·ha−1 Total manganese (ppm) 7.4 Available P 9.2 kg·ha−1 IAA (ppm) 5.9 Available K 272.6 kg−1 GA3 (ppm) 3.1 Preparation of biostimulant/ Jeevamrutha
-
The method of Palekar was used to prepare the organic liquid formulation Jeevamrutha[14]. The following were the ingredients: 10 kg cow dung, 10 L of cow urine of Gir cow breeds, 2 kg jaggery, 2 kg gram/chickpea (pulse) flour, a handful of rhizospheric soil, and 200 L of water were well combined in a stainless steel container with the help of a wooden stick. The cow dung and urine source was a local dairy farm located at Boduppal, Hyderabad, Telangana State, 500092, India. The mixture was mixed twice daily and fermented for 5–7 d. The prepared liquid formulation was used for soil application by applying irrigation water. In the Department of Soil Chemistry Laboratory at the Council of Scientific Research-Central Institute of Medicinal and Aromatic Plants, Boduppal, Hyderabad, Telangana State, 500092, India, the chemical composition of the biostimulant (Jeevamrutha) was determined. The results are presented in Table 1.
Treatments
-
The treatments were comprised of seven treatments with three replications, viz., T1: application of 150 L of Jeevamrutha per acre, T2: application of 125 L of Jeevamrutha per acre, T3: application of 100 L of Jeevamrutha per acre, T4: application of 75 L of Jeevamrutha per acre, T5: application of 50 L of Jeevamrutha per acre, T6: application of 25 L of Jeevamrutha per acre, and T7: control (treated with water).
Recommended cultivation practices
-
Senna (C. Angustifolia) var: Sona seeds were soaked in water for a whole night and treated with Trichoderma to minimize the seeds' correlation with diseases before dibbling in the field at 45 cm × 30 cm spacing. The field was irrigated for the first few weeks; one weeding was performed 30 d after seeding, and N:P:K (kg·ha−1) was applied at the seeding time.
Quantitative and qualitative traits evaluated
-
Growth and yield contributing attributes were recorded at regular intervals at various phases of plant growth. The sennoside content of leaves and pods was determined using the HPLC method developed by Rama Reddy et al.[15] at the pod formation stage. Finely ground samples of dry leaves and pods (300 mg) were extracted three times with sonication (25 °C) in 30 ml of 70% methanol in water. Before being fed into the chromatographic equipment, the materials were filtered through a 0.45 m membrane. The HPLC study was conducted on a Waters HPLC system outfitted with an SPD-M20 photodiode array detector.
The dilution plate technique determined each treatment's fungal, bacterial, and actinomycete populations[10,13,16]. For each treatment, a composite of 10 g of soil samples was extracted, and 1 g of each sample was suspended in 1 mL sterile saline (1g NaCl in 100 mL distilled H2O) in a sterile test tube and carefully vortexed. Different treatment tubes were employed to count fungi, bacteria, and actinomycetes as part of the inoculation. Soil samples were taken from the rhizosphere of plants for counting microbial load at harvest for N-fixers and P-solubilizers. Ten grams of soil was serially diluted up to 10−6 by using sterilized distilled water, and cell count per gram of rhizosphere soil was enumerated for P-solubilizers and free-living N-fixer by Pikovaskaya's media (Himedia) and Waksman No.77[13,17,18], respectively, by following the serial dilution plate count technique.
Soil dehydrogenase activity was determined by reducing 2,3,5-triphenyl tetrazolium chloride[2,10,19]. Protease activity was measured by measuring the amount of tyrosine produced after incubating 1 g of the oven-dry equivalent of a field-moist soil sample in 5 ml of 50 mM Tri's buffer (pH 8.1) and 5 ml of 2% Na-caseinate for 2 h at 50 + 1 °C. The aromatic amino acids were removed, and the residual substrate was precipitated with 0.92 M trichloroacetic acid and calorimetrically quantified at 700 nm using the Folin-Ciocalteu reagent. Protease activity was quantified as mg tyrosine generated g−1·soil·h−1.
Acid and alkaline phosphatase activities were determined using a standard approach[20]. In a 50 ml flask, 1 g of soil was mixed with 0.2 mL toluene, 4 mL of modified universal buffer (MUB) (pH 6.5 and 11, respectively, for acid and alkaline phosphatase), and 1 mL of p-nitrophenyl phosphate solution. After an hour of incubation, 1 mL of 0.5 M CaCl2 and 4 mL of 0.5 M NaOH were added. After the suspension was filtered, the filtrate's absorbance at 420 nm was measured using a UV-visible spectrophotometer. Controls were prepared by repeating the phosphatase activity assay technique but adding 1 mL of p-nitrophenol solution after adding 0.5 M CaCl2 and 4 mL of 0.5 M NaOH. Determination of β-glucosidase enzyme involves colorimetric estimation of P-nitrophenol released by β-glucosidase activity when soil is incubated in Mcilvaine buffer (pH 4.8) with P-nitrophenyl β-D-glucoside and toluene at 30 °C for 1 h[21] (Fig. 1).
Economics
-
The benefit of gross returns was determined by multiplying the total yield by the present cost of each kilogram. The cost of cultivation for each treatment was calculated by summing up the seed cost, land preparation, labour, cultural operations, pesticides, and manure costs. Net returns were computed by subtracting manufacturing costs from gross returns. The benefit-cost ratio was determined by calculating the ratio between cultivation costs and gross returns. It is obtained by dividing the gross returns by the cost of cultivation in USD
${\$} $ Statistical analysis
-
The analysis of variance (ANOVA) was performed on the pooled data for the experimental years 2020−2021 and 2021−2022 using CSIR-CIMAP statistical software Ver. 4.0[22].
-
The obtained results reveal that Jeevamrutha application had a significant influence on all of the characteristics of Senna (C. angustifolia). Amid the various doses of Jeevamrutha, the application of 150 L of Jeevamrutha recorded significantly higher plant height (T1; 43.7 cm) compared to another dose of application and was comparable to the applications of 125 L of Jeevamrutha per acre (T2; 40.2 cm) and 100 L of Jeevamrutha per acre (T3; 39.2 cm). Significantly, lower plant height was noticed in control (T7; 26.9 cm) and was on par with applying Jeevamrutha at 25 L per acre (T6; 29.9 cm). The number of branches and plant leaves per plant, and total dry matter production all followed a similar pattern. Applying 150 L (T1) of biostimulant/Jeevamrutha per acre recorded a substantially higher branch per plant, leaves per plant, and total dry matter production (19.9, 180.3, and 35.9 g·plant−1). It was on par with (T2) 125 L of Jeevamrutha (17.2, 177.2, and 34.2 g·plant−1), and the application of 100 L (T3) of Jeevamrutha (16.8, 176.4 and 33.1 g·plant−1). Senna's plant height and dry matter content may have improved substantially due to the availability of micronutrients and a big beneficial microbial population in Jeevamrutha[1−3,23]; thus, when applied to the crop as a foliar spray and through the soil, they stimulate the necessary plant growth, which encourages vegetative growth and finally increases plant height and metabolic and photosynthetic activity for improving the biological efficiency of the plant, allowing the roots to spread into deeper layers of soil and uptake more nutrients from the soil, resulting in the accumulation of more carbohydrates and higher dry matter. Our results are consistent with those of other researchers[3,16,24−26]. Whereas, chlorophyll content, leaf area, and index also differed significantly with the use of a varied dose of Jeevamrutha, with the application of 150 L (T1) of Jeevamrutha per acre recording significantly higher chlorophyll content (13.2), leaf area (66.2 cm2) and LAI (4.89) comparison with the other treatments and was succeeded with T2 (12.1, 64.2 cm2, 4.76) and T3 (10.2, 63.9 cm2, 4.73) (Fig. 2). The use of Jeevamrutha resulted in faster synthesis, translocation, and accumulation of photosynthates from sources to sinks, ultimately contributing to higher growth and yield metrics (Tables 1 & 2, Fig. 2). These findings are consistent with those of other studies[27,28] in Senna.
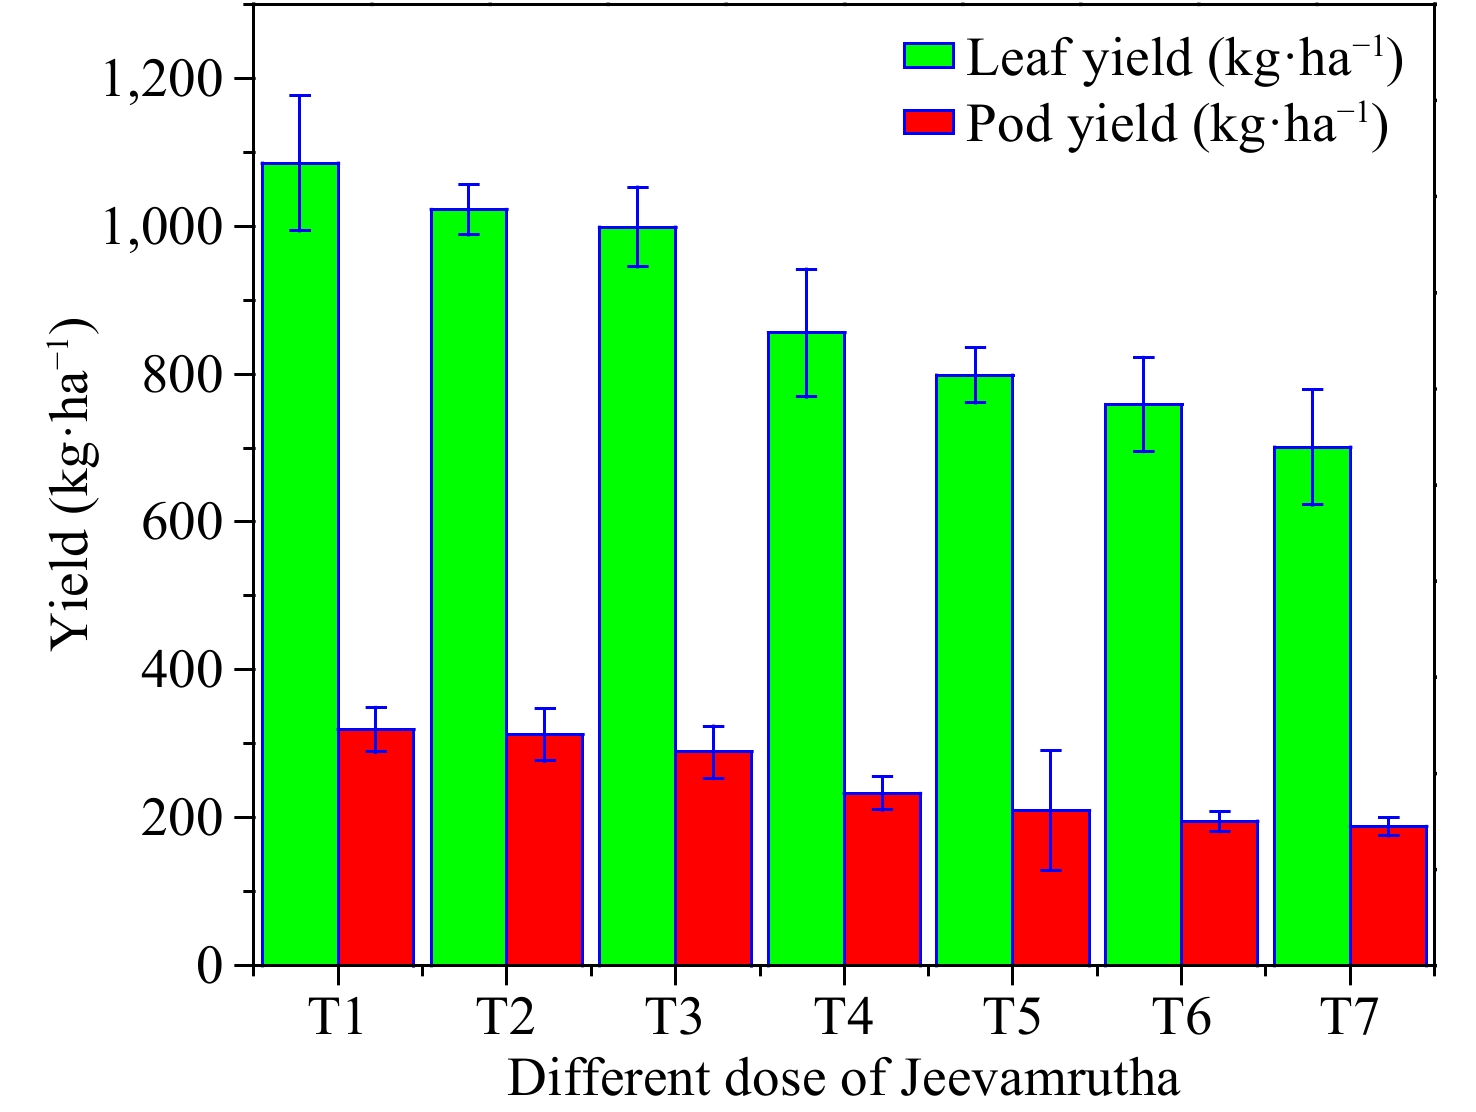
Figure 2.
Influence of different doses of biostimulant/Jeevamrutha on leaf yield (kg·ha−1) and pod yield (kg·ha−1) of Senna.
Table 2. Microbial population in bio stimulant.
Organisms Bio stimulant (Jeevamrutha) Bacteria (cfu·mL−1) 15.42 × 10⁵ Fungi (cfu·mL−1) 12.12 × 10³ Actinomycetes (cfu·mL−1) 2.92 × 10³ Free-living nitrogen fixers (cfu·mL−1) 5.20 × 10² Phosphate solubilizing organisms (cfu·mL−1) 3.20 × 10² Effect of biostimulant/Jeevamrutha on the pods per plant
-
The pods/plant produced significantly depended on the dose of Jeevamrutha used. Among the various Jeevamrutha dosages, the application of Jeevamrutha at 150 L per acre recorded significantly higher pods per plant (T1; 726) compared to other treatments and was on par with (T2; 720) and (T3; 689). The significantly lower pods per plant were noticed in control (T7; 700.8) and were followed by T6 (T6; 758.9) (Table 3). The increase in pods per plant might be due to Jeevamrutha, which increases the production of growth hormones, viz., IAA, GA, and dehydrozeatin, resulting in good pod characteristics[1,29,30]. These phytohormones increased cell proliferation, elongation, and nutrient uptake, increasing pods per plant. Ramesh Babu[31] found similar results in Ashwagandha (Table 3).
Table 3. Effect of different doses of bio stimulant (Jeevamrutha) on growth and yield parameters of Senna in semi-arid regions of India.
Treatments Plant height (cm) No. of branches per plant No. of leaves per plant Total dry matter production (g·plant−1) Chlorophyll content Leaf area LAI No of pods
per plantT1 43.7 19.9 180.3 35.91 13.25 66.02 4.89 726 T2 40.2 17.2 177.2 34.25 12.13 64.21 4.76 720 T3 39.2 16.8 176.4 33.12 10.24 63.92 4.73 689 T4 34.2 14.2 165.2 29.74 9.23 59.21 4.39 654 T5 31.5 13.8 154.7 25.15 9.01 56.27 4.17 598 T6 29.9 10.2 144.3 23.21 8.78 55.32 4.10 546 T7 26.9 8.5 135.2 21.58 8.03 49.13 3.64 487 S.Em± 1.82 0.91 2.8 1.34 0.52 1.4 0.11 18.2 CD (P = 0.05) 5.41 2.74 8.4 4.02 1.56 4.2 0.34 54.7 T1: 150 L of bio stimulant per acre, T2: 125 L of bio stimulant per acre, T3: 100 L of bio stimulant per acre, T4: 75 L of bio stimulant per acre, T5: 50 L of bio stimulant per acre, T6: 25 L of bio stimulant per acre, T7: Control. Effect of Jeevamrutha on leaf and pod yield
-
Leaf and pod yield of C. angustifolia differ significantly with a varied dose of Jeevamrutha. Among the varied treatments, the application of 150 L (T1) of Jeevamrutha per acre recorded significantly higher leaf yield (1,085.2 kg·ha−1) and pod yield (318.7kg·ha−1) in comparison to the rest of the treatments. It was on par with T2 i.e., applying 125 L of Jeevamrutha per acre (1,022.5 kg·ha−1, 312.1 kg·ha−1) followed by T3, i.e., application of 100 L of Jeevamrutha per acre (998.5 kg·ha−1, 288.5 kg·ha−1, respectively). Significantly, lower leaf (700.2 kg·ha−1) and pod yield (487 kg·ha−1) were noticed in the control (T7) (Fig. 3). Raised nutrient availability, enhanced soil health, and an appropriate supply of macro and micronutrients might all have contributed to the rise in leaf and pod yield, which raised seed yield. Furthermore, Jeevamrutha may have created a favorable environment in the soil for nitrogen buildup in addition to boosting nutrient availability (Fig. 3). Hemalatha et al.[32] found similar results in kalmegh[13,32], and Kalyanasundaram et al.[33] in the sweet flag, and Anuja & Jayasri[34] in sweet basil[30,34]. The sustained availability of nutrients by applying Jeevamrutha throughout the cropping period increased soil microbial activity, and the photosynthetic rate might have increased the leaf and pod yield[4,8,35−38].
Effect of biostimulant/Jeevamrutha on sennoside content
-
Despite the Jeevamrutha dose, the sennoside concentration of Senna (C. angustifolia) pods is always higher than that of the leaves. Sennoside content in both leaf and pod altered drastically following Jeevamrutha treatment, as seen in (Table 2). Among the different treatments, T1, i.e., application of 150 l of Jeevamrutha per acre, recorded significantly higher sennoside content in leaves (2.01%) and pods (3.11%) in comparison to the rest of the treatment and was followed by T2 (1.98%, 3.09%) and T3 (1.89%, 2.97%). This feature could be related to an increase in enzyme activity associated with the sennoside biosynthesis pathway, as well as a shift from primary to secondary metabolite synthesis[39−43]. Lower sennoside content in leaves and pods is recorded in control (T7; 1.52%, 2.42%). A similar trend was noticed in sennoside yield with T1, i.e., application of Jeevamrutha at 150 L per acre recorded significantly higher sennoside yield (31.7 kg−1) compared to other treatments. It was followed by T2 (29.9 kg·ha−1) and T3 (27.4 kg·ha−1). Lower sennoside yield was noticed in control (T7; 15.2 kg·ha−1) (Table 4). This attribute might be owing to increased yield and sennoside content in the leaf and pod, which in turn, increase the sennoside yield in T1 and T2 treatments, i.e., application of Jeevamrutha at 150 and 125 L per acre, respectively (Tables 4 & 5).
Table 4. Effect of bio stimulant (Jeevamrutha) on sennoside content in leaves and pod and sennoside yield.
Treatments Sennoside content (%) Sennoside yield
(kg·ha−1)Leaves Pod T1 2.01 3.11 31.7 T2 1.98 3.09 29.9 T3 1.89 2.97 27.4 T4 1.93 2.69 22.8 T5 1.87 2.66 20.5 T6 1.69 2.59 17.9 T7 1.52 2.42 15.2 S.Em± 0.03 0.06 1.2 CD (P = 0.05) 0.09 0.12 3.7 T1: 150 L of bio stimulant per acre, T2: 125 L of bio stimulant per acre, T3: 100 L of bio stimulant per acre, T4: 75 L of bio stimulant per acre, T5: 50 L of bio stimulant per acre, T6: 25 L of bio stimulant per acre, T7: Control. Table 5. Effect of different doses of bio stimulant (Jeevamrutha) on beneficial microorganisms in the soil.
Treatments Bacteria
(cfu·g−1)Fungi
(cfu·g−1)Actinomycetes
(cfu·g−1)Nitrogen fixer
(cfu·g−1)P solubilizers
(cfu·g−1)T1 8.2 × 10⁵ 7.3 × 10⁴ 4.1 × 10³ 1.9 × 10³ 3.9 × 10³ T2 7.6 × 10⁵ 6.8 × 10⁴ 4.0 × 10³ 2.1 × 10³ 3.2 × 10³ T3 7.1 × 10⁵ 6.2 × 10⁴ 3.7 × 10³ 1.7 × 10³ 2.7 × 10³ T4 6.7 × 10⁵ 5.8 × 10⁴ 3.6 × 10³ 1.8 × 10³ 2.5 × 10³ T5 6.0 × 10⁵ 5.1 × 10⁴ 3.4 × 10³ 1.2 × 10³ 1.9 × 10³ T6 6.2 × 10⁵ 4.9 × 10⁴ 2.8 × 10³ 1.4 × 10³ 1.7 × 10³ T7 5.7 × 10⁵ 4.2 × 10⁴ 2.2 × 10³ 1.3 × 10³ 1.6 × 10³ S.Em± 0.3 × 10⁵ 0.4 × 10⁴ 0.23 × 10³ 0.3 × 10³ 0.1 × 10³ CD
(P = 0.05)0.9 × 10⁵ 1.2 × 10⁴ 0.55 × 10³ NS 0.3 × 10³ T1: 150 L of bio stimulant per acre, T2: 125 L of bio stimulant per acre, T3: 100 L of bio stimulant per acre, T4: 75 L of bio stimulant per acre, T5: 50 L of bio stimulant per acre, T6: 25 L of bio stimulant per acre, T7: Control. Effect of biostimulant/Jeevamrutha on beneficial microorganisms and enzyme activity
-
Beneficial microorganisms in soil differ significantly with the application of different doses of Jeevamrutha in Senna; with an application of 150 L of Jeevamrutha per acre recorded significantly higher bacteria (8.2 × 10⁵ cfu·g−1), fungi (7.3 × 10⁴ cfu·g−1), actinomycetes (4.1 × 10³ cfu·g−1) and P solubilizers (3.9 × 10³ cfu·g−1) compared to rest of the treatment and was on par with the application of 150 L of Jeevamrutha per acre (7.6 × 10⁵ cfu·g−1, 6.8 × 10⁴ cfu·g−1, 3.7 × 10³ cfu·g−1, and 2.7 × 10³ cfu·g−1, respectively).
Nonetheless, the greater dose of Jeevamrutha resulted in a more substantial microbial population, which might be ascribed to Jeevamrutha acting as a source of carbon and energy for microorganisms, boosting the number of microorganisms in the soil. However, a significantly lower microbial population was noticed in control, i.e., bacteria (5.7 × 10⁵ cfu·g−1), fungi (4.2 × 10⁴ cfu·g−1), actinomycetes (2.2 × 10³ cfu·g−1), and P solubilizers (1.6 × 10³ cfu·g−1). The low microbial population counts in control could be attributed to a lack of substrate to sustain microbial biomass. The acquired results are consistent with the findings of Boraiah et al.[44]. Similarly, enzyme activity in soil differs dramatically when Jeevamrutha is applied to Senna. Among the different doses of Jeevamrutha, the application of 150 L of Jeevamrutha per acre recorded significantly higher dehydrogenase activity (1.33 µg·TPF−1·g−1·h−1), alkaline phosphatase (412 µg·TPF−1·g−1·h−1), acid phosphatase (367 µg·TPF−1·g−1·h−1), β-Glucosidase (120 µg·TPF−1·g−1·h−1) and protease (154 µg·TPF−1·g−1·h−1) compared to rest of the treatment and was followed by application of 125 L of Jeevamrutha per acre (1.17 µg·TPF−1·g−1·h−1, 374 µg·TPF−1·g−1·h−1, 355 µg·TPF−1·g−1·h−1, 99 µg·TPF−1·g−1·h−1 and 123 µg·TPF−1·g−1·h−1). Enzymatic activity was considerably lower in the control group.
Nonetheless, the increased enzymatic activity in the soil can be attributed to the important function of the microbial population as a result of the addition of Jeevamrutha, which acted as a tonic for enhanced microbial development[1,2,4,29]. Enzymatic activity in the soil may have increased due to favorable bacterial environments (Tables 5 & 6). The higher enzymatic activity in the Jeevamrutha plot could be explained by enhanced microbial activity[44−47].
Table 6. Effect of different doses of bio stimulant (Jeevamrutha) on enzyme activity in the soil.
Treatments Dehydrogenase activity (µg·TPF−1·g−1·h−1) Alkaline phosphatase (µg·TPF−1·g−1·h−1) Acid phosphatase (µg·TPF−1·g−1·h−1) β-Glucosidase
(µg·TPF−1·g−1·h−1)Protease
(µg·TPF−1·g−1·h−1)T1 1.33 412 367 120 154 T2 1.17 374 355 99 123 T3 0.90 382 248 84 120 T4 0.75 291 201 75 100 T5 0.54 277 155 65 85 T6 0.48 132 112 50 59 T7 0.41 88 55 29 22 SEm± 0.15 12.8 7.1 3.9 4.8 CD (P = 0.05) 0.45 38.2 21.4 11.7 14.1 T1: 150 L of bio stimulant per acre, T2: 125 L of bio stimulant per acre, T3: 100 L of bio stimulant per acre, T4: 75 L of bio stimulant per acre, T5: 50 L of bio stimulant per acre, T6: 25 L of bio stimulant per acre, T7: Control. Effect of biostimulant/ Jeevamrutha on economics
-
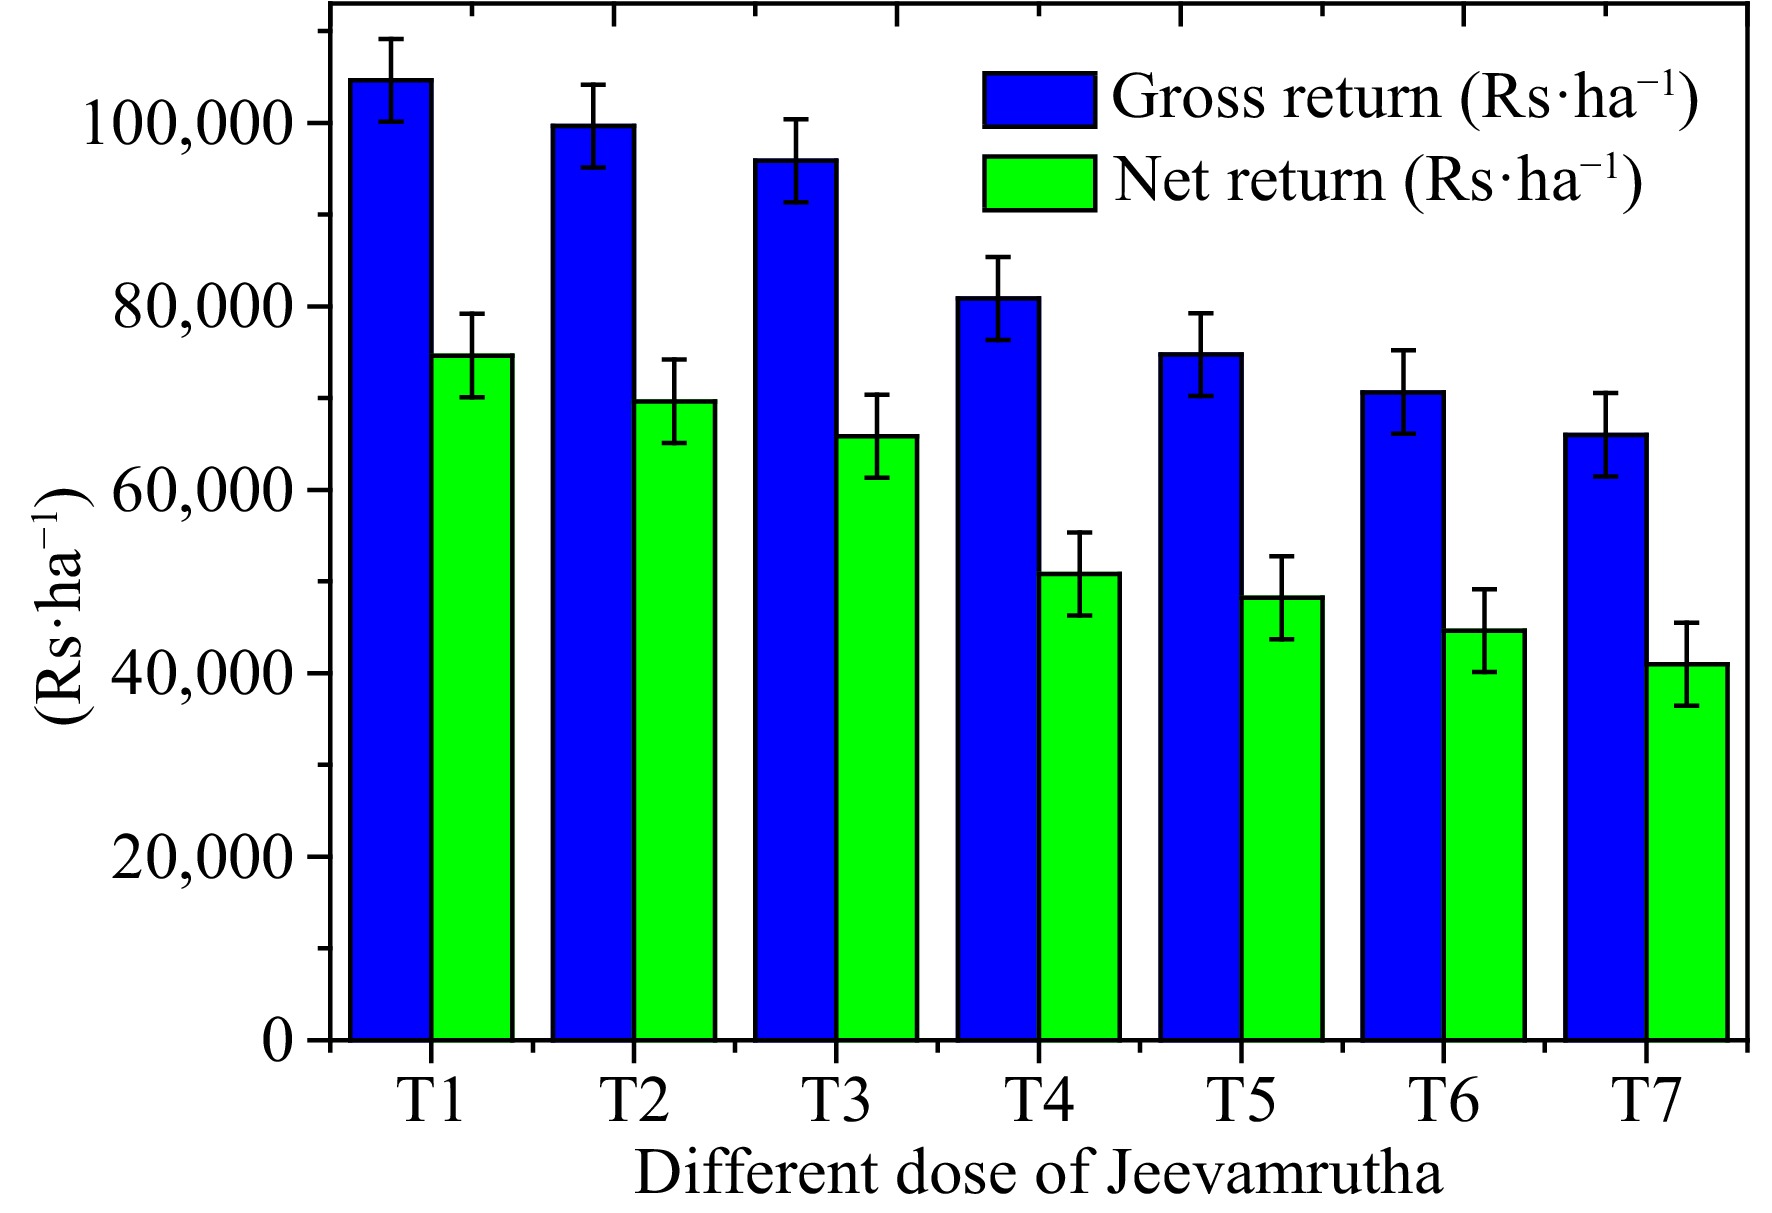
Economics of Senna (C. angustifolia) may differ significantly about the varied application of Jeevamrutha, with the application of 150 L (T1) of Jeevamrutha per acre recorded substantially higher gross return per ha (USD
${\$} $ ${\$} $ ${\$} $ ${\$} $ ${\$} $ ${\$} $ Table 7. Effect of different doses of bio stimulant (Jeevamrutha) on gross and net return of Senna.
Treatments Gross return
(USD${\$} $·ha−1)Net return
(USD${\$} $·ha−1)Benefit-cost ratio T1 1,495.0 1,066.4 3.49 T2 1,423.8 995.2 3.32 T3 1,369.4 940.9 3.20 T4 1,154.9 726.3 2.99 T5 1,067.9 689.3 2.82 T6 1,009.4 637.9 2.72 T7 942.9 585.8 2.64 S.Em± 21.8 21.8 CD (P = 0.05) 64.5 64.5 T1: 150 L of bio stimulant per acre, T2: 125 L of bio stimulant per acre, T3: 100 L of bio stimulant per acre, T4: 75 L of bio stimulant per acre, T5: 50 L of bio stimulant per acre, T6: 25 L of bio stimulant per acre, T7: Control. Finally, Jeevamrutha is a natural fertilizer that can be used in place of chemical fertilizers. It is a type of organic liquid fertilizer used in organic farming and gardening. It is made from natural ingredients and is believed to be a sustainable and eco-friendly alternative to synthetic fertilizers. While it can be a valuable addition to organic farming practices, it's important to note that its nutrient content, including NPK (Nitrogen, Phosphorus, and Potassium), varies depending on how it's prepared. In general, Jeevamrutha is not typically formulated to have specific NPK values like synthetic fertilizers. Instead, its primary focus is on improving soil health and promoting microbial activity in the soil, which can lead to better nutrient availability for plants over time. It is rich in beneficial microorganisms, such as beneficial bacteria, fungi, and other soil organisms, which help break down organic matter and release nutrients in a form that plants can absorb. Jeevamrutha is more of a soil conditioner and biofertilizer that enhances soil fertility and overall plant health rather than directly providing specific nutrient values like NPK ratios. It is used to improve the structure and fertility of the soil and is often considered a holistic approach to sustainable agriculture. If farmers are looking for specific NPK values in fertilizer, they may need to consider synthetic fertilizers or other organic fertilizers that provide more precise nutrient content. However, many organic and sustainable farmers prefer using Jeevamrutha and similar products to support long-term soil health and reduce their reliance on chemical fertilizers. It is high in macronutrients and micronutrients, which are necessary for plant growth and development. Jeevamrutha promotes microbial activity, which enhances soil fertility. When compared to previous Jeevamrutha doses, using Jeevamrutha at 150 (T1) or 125 (T2) L per acre resulted in significantly higher leaf, pod, and sennoside yields. Meanwhile, increased leaf and pod production from a higher Jeevamrutha dose boosts Senna's gross and net returns, as well as the benefit-cost ratio.
-
Jeevamrutha is a natural fertilizer that can replace chemical fertilizers. It is an excellent source of macro and micro nutrients for plant growth and development. Jeevamrutha improves soil fertility by stimulating microbial activity. The current study found that applying Jeevamrutha at 150 (T1)/125 (T2) L per acre resulted in significantly higher leaf, pod, and sennoside yields when compared to other Jeevamrutha doses. Meanwhile, increased leaf and pod production from a higher dose of biostimulant/Jeevamrutha raises Senna's gross and net returns and the benefit-cost ratio.
-
The authors confirm contribution to the paper as follows: study planning, actual experimentation: Jnanesha AC; experimentation: Venugopal S, Kumar SR; Kumar A; data collection: Bisht D; Chemical analysis: Chanotiya CS; statistical analyses, and manuscript preparation: Lal RK. All authors reviewed the results and approved the final version of the manuscript.
-
The datasets generated during and/or analyzed during the current study are available from the corresponding author on reasonable request.
This work was supported by the Council of Scientific and Industrial Research, India, under HCP 010; the last author is related to an emeritus scientist, CIMAP Publication No. CIMAP/PUB/2021/118. The authors are thankful to the director of CSIR-CIMAP Lucknow, India, for providing facilities and encouragement throughout the work. Thanks also to the Scientist-in-Charge at CRC Hyderabad for the necessary facilities during this investigation.
-
The authors declare that they have no conflict of interest.
- Copyright: © 2024 by the author(s). Published by Maximum Academic Press, Fayetteville, GA. This article is an open access article distributed under Creative Commons Attribution License (CC BY 4.0), visit https://creativecommons.org/licenses/by/4.0/.
-
About this article
Cite this article
Jnanesha AC, Venugopal S, Kumar SR, Kumar A, Bisht D, et al. 2024. Optimization of a new organic approach to natural biostimulant (Jeevamrutha) for yield and quality management in Senna (Cassia angustifolia Vahl.): an agriculturally highly export-oriented crop. Technology in Horticulture 4: e009 doi: 10.48130/tihort-0024-0006
Optimization of a new organic approach to natural biostimulant (Jeevamrutha) for yield and quality management in Senna (Cassia angustifolia Vahl.): an agriculturally highly export-oriented crop
- Received: 20 June 2023
- Revised: 25 December 2023
- Accepted: 01 March 2024
- Published online: 02 April 2024
Abstract: Senna is a leguminous and industrial crop that produces high-quality glycosides (sennosides) in its leaves and pods, which have substantial therapeutic effects for alleviating constipation worldwide. However, further research on employing Jeevamrutha in Senna is required. As a result, the experiment was carried out at CSIR-CIMAP in Hyderabad for two consecutive years, in the years 2020–2021 and 2021–2022. The main aim is to identify the optimum dose of Jeevamrutha for higher growth, yield, and quality in Senna. The study used a randomized complete block design (RCBD) with seven treatments repeated three times. From the obtained result, it was observed that the application of 150 L of Jeevamrutha per acre observed significantly high leaf yields (1,085.2 kg·ha−1) and pod (318.7 kg·ha−1) equivalent to T2 in comparison to other treatments, i.e., application of 125 L of Jeevamrutha per acre (1,022.5 kg·ha−1, 312.1 kg·ha−1), and was succeeded by T3, i.e., application of 100 L of Jeevamrutha per acre (998.5 kg·ha−1, 288.5 kg·ha−1, respectively). Lower leaf yield (700.2 kg·ha−1) and pod yield (487 kg·ha−1) were observed in the control (T7). Similarly, the application of 150 L of Jeevamrutha per acre recorded significantly higher sennoside content in leaves (2.01%) and pods (3.11%), in comparison to other treatments, and was followed by T2 (1.98%, 3.09%) and T3 (1.89%, 2.97%). A similar trend was noticed in returns, i.e., the application of 150 L of Jeevamrutha per acre recorded significantly higher gross returns (USD${\$} $1,495 ha−1) and net returns (USD${\$} $1,066.4 ha−1).
-
Key words:
- Bio-enhancers /
- Carminatives /
- Economics /
- Leaves /
- Pods /
- Sennoside


