REVIEW   Open Access    

Culture conditions for somatic embryogenesis in banana: brief review of the current practices, advantages, and constraints

More Information
  • Banana (Musa spp.) is a high-value cash crop that serves as a staple food across Asia. However, numerous pests and diseases challenge the global production of bananas. The advent of advanced molecular technologies, such as plant tissue culture, played a pivotal role in banana production with enhanced physiology, morphology, and disease resistance. Since then, researchers and agricultural industries' interest has shifted to using plant tissue culture for the large-scale production of bananas. The production of somatic embryos from plant tissues, termed somatic embryogenesis (SE), is often utilized as an asexual means of reproducing banana plantlets with uniform genotypic characteristics. Various studies have also demonstrated the function of somatic embryogenesis for genetic transformation studies. However, the efficiency of SE protocols differs from one genotype to another. It is affected by several factors, including the type of explant, culture media, plant growth regulators, and environmental conditions. This review will summarize the current methodologies for performing SE in banana. In addition, the advantages and constraints of performing SE protocols were discussed.
  • Sweet cherries (Prunus avium L.) are a major focus of agriculture in the Okanagan region of British Columbia (BC), Canada. A large portion of the cherries grown in BC are exported and undergo up to four weeks of storage during transportation before delivery and consumption[1]. In 2022, sweet cherries accounted for 11.6% of the revenue of exported fruit from Canada and have an export value of nearly CAD$130 million[2]. As such, sweet cherry is an important fruit with high commercial importance for Canada. Although the application of cold storage is a necessary postharvest tool to maintain fruit quality up to consumption, there are preharvest factors that impact quality after longer-term storage. The work of Serrano et al.[3] noted that the maturity stage at harvest determined the fruit quality of sweet cherries after storage. For this reason, producers use several parameters to establish the optimum time for harvesting. Producers have long used colour as a marker for maturity, yet the concept of fruit dry matter (DM) at harvest affecting post-storage quality has advanced[46]. In fact, Toivonen et al.[6] developed a predictive model for 'Lapins' sweet cherry DM content using a visible/near-infrared spectrometer and noted its potential application to other cultivars to provide a rapid and non-destructive means of determining DM linked to cherry fruit quality. If sweet cherries are harvested at the wrong time or stored improperly during transit the quality of the cherries at their final destination does not compare to that at the time of harvest. Therefore, it is of the utmost importance to harvest cherries at their optimal time to ensure quality retention. Cherry fruits have minimal reserve carbohydrates so respiration relies primarily upon organic acids[7]. Additionally, cherries have a high susceptibility to physical damage making them highly perishable, so it is imperative to store them properly to maintain their flavour profile and overall quality[811]. Lower respiration rates help to maintain higher titratable acidity (TA) levels, thereby retaining flavour quality[11,12]. Decreased respiration rates are achieved through low-temperature storage and shipping.

    Previous research linking cherry fruit maturity to flavour quality indicated early-harvested cherries with low soluble solids (SS) levels showed low consumer acceptance due to perceived low sweetness, while late-harvested cherries showed low consumer acceptance due to poor texture[13,14]. This information underscores the challenge growers face when determining picking date. Additionally, once cherries are harvested, quality changes occur which include changes in the balance of SS to TA levels. Previous work has shown that SS levels remain relatively constant while malic acid levels (the predominant acid in sweet cherries) decreased by 20% when stored for 4 d at 20 °C[8,14]. Further, SS, TA, and the SS/TA ratio are key parameters in defining flavour quality[15] and consumer acceptance[14] as SS and TA have been reported to be measures of the cherry fruit attributes of sweetness, and sourness, respectively. Additionally, the SS/TA ratio is regarded as an overall taste attribute determining sweet cherry acceptability[14,16,17].

    Depending on cultivar and growing location, SS values for sweet cherries have been reported to range from 12.3 to 23.7 °Brix[14]. Rootstock and storage conditions have also been reported to affect SS, TA, and SS/TA values[18]. Depending on rootstock, for 'Regina' sweet cherries, harvest SS values ranged from 14.8 to 16.6 °Brix and TA values ranged from 5.7 to 7.4 g·L−1, while SS values after storage ranged from 14.6 to 18.2 °Brix and TA values ranged from 4.4 to 6.0 g·L−1. The harvest SS/TA ratio ranged from 2.0 to 2.91 and the SS/TA ratio after storage ranged from 2.47 to 3.77 depending on rootstock. Based on sensory studies using various cherry cultivars and breeding selections to gauge flavour quality and consumer acceptance, the optimal SS/TA ratio was reported to be between 1.5 and 2.0, with SS values ranging between 17 and 19 °Brix[19].

    Unfortunately, members of British Columbia's sweet cherry industry have noted that while their cherries arrive at their export locations with good condition in terms of appearance (i.e. firm, shiny, with green stems), issues have been reported concerning flavour. Poor flavour has been associated with lower levels of TA and lower oxygen in the storage atmosphere. Our previous work noted that BC cherry growers tend to pick their cherries at lighter colours in an attempt to harvest the crop as soon as possible to avoid any weather or pest issues and achieve the highest yield possible[1]. Staccato (SC) is a late maturing economically important cultivar with little research data available. It has been reported that SC cherries have a respiration rate that is negatively correlated with colour when collected between a 2 to 6 colour level as determined with CTFIL (Centre Technique Interprofessionnel des Fruit et Legumes, Paris, France) colour chips[1], which have been typically used as a marker of maturity. For SC cultivars, data showed the lowest respiration levels with cherries harvested at CTFIL colour standards 4-5, and may potentially have better flavour quality retention due to these lower respiration rates[1]. The aim of the work was to: 1) examine indicators of maturity/readiness for harvest (colour, SS, DM, TA, and the ratio of soluble solids to titratable acidity (SS/TA)); and 2) determine whether colour at harvest or other parameters (SS, TA, SS/TA, and DM) better predict flavour quality retention after storage.

    Sweetheart (SH), Staccato (SC), and Sentennial (SL) sweet cherries were sourced from research plots located at the Summerland Research and Development Center (SuRDC, Summerland, BC, Canada) in the Okanagan Valley region of British Columbia over three growing seasons (2018, 2019, and 2021). In the 2018 growing season, two cherry cultivars (SH and SC were collected, in the 2019 growing season, in response to BC Cherry Association interest, three cherry cultivars (SH, SC, and SL) were collected. Due to COVID, data was not collected during the 2020 growing season. In the 2021 growing season, full data (SS, TA, DM, and respiration rate) was only collected on the SC cherry cultivar, while DM and respiration values at harvest were also collected for SH and SL cultivars.

    To collect fruit at different maturity levels, cherry fruits were collected at three different color levels using the CTFIL (Centre Technique Interprofessionnel des Fruit et Legumes, Paris, France) colour standard series at three harvest dates for each cultivar which corresponded to the 3-4, 4-5, and 5-6 colour levels.

    To collect environmental data, two trees were chosen in each orchard block and Onset HOBO (Bourne, MA, USA) temperature and humidity loggers were mounted in these trees as described by Ross et al.[1] and captured data at 10 min intervals. The temperature and humidity data were used to calculate average temperature (AT), average high temperature (AHT), average low temperature (ALT), and average relative humidity (ARH) for 28 d preceding the cherry harvest date.

    Cherries were generally harvested before 11:00 h on each harvest day. Harvested cherries were transported back to the lab for sorting, sampling, and storage. Upon arrival, cherries were placed into a walk-in cooler at 0.5 °C to mimic rapid hydro-cooling capabilities that the industry uses. In the afternoon of each harvest day, cherries were removed from the cooler and sorted following British Columbia Tree Fruits Company protocol: (i) size was greater than 25.4 mm (< 10.5 row size); (ii) stemless cherries were removed; and (iii) cherries with defects such as blemishes, splits, pitting, disease (rot, fungi), hail damage and insect damage were removed. Again, the colour of the cherries was assessed using the CTFIL colour standard series. Based on the harvest period, cherries were separated into different colour levels: 3-4, 4-5, and 5-6. For each colour category, quality assessments (DM, SS, TA, SS/TA ratio, firmness, size, stem pull force, stem shrivel, stem browning, pitting, and pebbling) were performed before and after storage.

    Maintaining the quality of sweet cherries undergoing long distance ocean container shipment (up to 28 d/4 weeks) is important for securing a successful export market for Canadian sweet cherries and for ensuring that current market demand is met[1]. For cherries to be marketable after storage, they must pass several quality attributes. Attributes of firmness, size, stem pull force, stem shrivel, stem browning, pitting, and pebbling were assessed using previously described methods[1,20] to assess fruit quality at harvest and after storage for 28 d at 0.5 °C, ideal refrigerated storage temperature, for all cherry cultivars, and also storage for 28 d at 3 °C, non-ideal refrigerated storage temperature, for SC cherries. The values of these parameters are provided in Supplementary Tables S1S6. As the focus of this work was to examine how maturity level at harvest influenced the flavour quality of SC, SH, and SL sweet cherry cultivars, SS, DM, TA, and respiration rate values were the focus for discussion. Respiration analysis was performed using methods described by Ross et al. on freshly harvested cherries[1]. Rates of CO2 production were expressed as mg CO2 kg−1·h−1.

    DM of the cherries was determined using a Felix F750 handheld spectrometer (Felix Instruments, Inc., Camas, WA, USA) loaded with a valid model developed at the Summerland Research and Development Centre for cherries[6]. DM was measured on 25 fruits that were randomly selected from each sample replicate (i.e. 50 cherries). For SS and TA analyses, the methods of Ross et al.[1,20] were used to test 25 fruits that were randomly selected from each sample replicate (i.e. 50 cherries). Briefly, de-stemmed cherries were transferred into a 15.2 cm × 22.9 cm polyethylene Ziplock bag. The bag was left partially open, and the cherries were pressed by hand to obtain juice. The juice was strained and collected into 60 mL polypropylene screw cap containers. The resulting filtrate was tested for SS (°Brix), and TA (g·L−1 malic acid). For SS determination, the refractive indices of the solutions were observed in °Brix temperature-corrected mode on a digital refractometer (Mettler-Toledo, Refracto 30PX, 13/02, LXC13237, Japan). An automated titrator (Metrohm 848 Tritrino Plus; Mississauga, ON, Canada) was used to measure the TA of 10 mL of the juice with 65 mL distilled water to an endpoint of 8.1 with 0.1 mol·L−1 NaOH.

    At each colour level (3-4, 4-5, or 5-6) 10 kg of cherry samples were cooled to either 0.5 or 3 °C (for SC in 2021) and then packed into cardboard boxes with a polyethylene liner, an absorbent pad, and an iButton (Thermodata, Whitewater, WI, USA), which measured temperatures experienced by the cherries in the cardboard boxes during storage. After 28 d, the same quality assessment tests were performed to see if values varied throughout storage time at each temperature.

    Statistical analysis was conducted using SAS Institute Inc. software version 9.3 (SAS Institute, Cary, NC, USA). Data were subjected to a four-way analysis of variance (ANOVA) using the SAS PROC GLM procedure. The four factors tested were colour level (3-4, 4-5, and 5-6), cultivar (SH, SC, and SL), growing year (2018, 2019, and 2021), and time (harvest or storage (0.5 °C)). The significance of the main effects and interaction of the four factors was determined using Type III sum of squares via the ANOVA test. Additionally, ANOVA using the SAS PROC GLM procedure was performed on data collected for SC cultivar in the 2021 growing year to assess the influence on storage temperature (0.5 and 3 °C) on quality parameters. Statistical significance was determined by least significant difference (LSD) Fisher's test at 5% significance level. Principal Component Analysis (PCA) was performed using SAS version 9.3 PROC PRINCOMP (SAS Institute Inc., Cary, NC, USA) on data collected from the three cultivars over the tested growing years at three colour levels (i.e., up to nine samples per cultivar) and 10 variables for each investigation. Variables included: AT, AHT, ALT, ARH, colour at harvest (ColourH), SS at harvest (SSH), SS after 28 d of storage at 0.5 °C (SS05), TA at harvest (TAH), TA after 28 d of storage at 0.5 °C (TA05), and DM of cherry fruit at harvest (DMH). Microsoft Excel was used to generate PCA plots from the data provided by SAS. Only data available for every growing year were included in the PCA. Correlation coefficients were determined using Pearson's correlation coefficient statistical function in Excel (version 2306, Microsoft, Redmond, WA, USA). Histograms and frequency data were generated using the statistical function in Excel (version 2306, Microsoft, Redmond, WA, USA). Dry matter bin sizes of 1.5% increments were used to present and analyze the histogram and frequency data.

    Tables 14 present data on flavour attributes via values of soluble solids (SS), titratable acidity (TA), SS/TA ratio, and dry matter (DM) as affected by cultivar, growing year, storage and colour level at harvest and after storage, respectively. The most influential parameters in sweet cherry flavour have been found to be SS, TA, and the SS/TA ratio[15]. Additionally, SS and TA values have been found to be related to DM values in kiwis[2124], apples[25], and cherries[6,26]. DM is a measure of solids which includes both soluble sugars and acids along with insoluble structural carbohydrates and starch. Crisosto et al.[4] proposed using DM as an additional quality parameter as DM was determined not to change during cold storage[22]. Toivonen et al.[6] have performed research linking dry matter measurements with sweet cherry quality. As cold storage is also used to maintain cherry quality, assessing DM at harvest and upon storage was of relevance, and a key aspect of this work was to examine how DM values relate to sweet cherry respiration rates and cherry quality parameters.

    Table 1.  Soluble solids values as affected by cultivar, growing year, storage, and colour level at harvest.
    Cultivar Colour level Soluble solids (SS, °Brix)
    2018 2019 2021
    Harvest Storage (0.5 °C) Harvest Storage (0.5 °C) Harvest Storage (0.5 °C) [3 °C]
    Sweetheart 3-4 18.1aA1 17.7aA1 18.1aA1 18.2aA1
    4-5 20.0bA1 19.8bA1 19.4bA1 18.8bA1
    5-6 21.9cA1* 21.1cA1* 19.9bA1* 19.6cA1*
    Staccato 3-4 17.2aA2 17.2aA1 17.1aA2 17.2aA1 18.8aA* 18.9aA*
    18.4a
    4-5 17.8aA2 17.9aA2 18.3bA23 18.1bA1 19.9bA* 18.6aB
    18.9ab
    5-6 20.2bA2 17.9aB2* 20.2cA1 20.3cA13 20.1bA 19.5aA
    19.7b
    Sentennial 3-4 18.1aA1 18.1aA1
    4-5 18.9bA13 18.5aA1
    5-6 20.8cA2 20.6bA23
    Main effects Significance F-value Degrees of freedom
    Cultivar p < 0.0001 36.90 2
    Colour level p < 0.0001 125.76 2
    Year p < 0.0001 9.26 2
    Time (harvest or storage at 0.5 °C) p = 0.0002 13.68 1
    Colour differences: within common time and cultivar, values followed by different lower case letters indicate significant differences (p ≤ 0.05); Cultivar differences: within common colour level and time, values followed by different numbers indicate significant differences (p ≤ 0.05); Growing year differences: within common time, colour level and cultivar, values followed by * indicate significant differences (p ≤ 0.05); Storage differences (Harvest versus 0.5 °C storage): within common cultivar, colour level and growing year, values followed by different uppercase letter indicate significant differences (p ≤ 0.05); Temperature differences: within Staccato cultivar at 28 d storage and at common colour level, bolded values indicate significant differences (p ≤ 0.05) between storage temperatures (0.5 °C vs 3 °C). (N.B. no bolded values appear in this table).
     | Show Table
    DownLoad: CSV
    Table 2.  Titratable acidity values as affected by cultivar, growing year, storage and colour level at harvest.
    Cultivar Colour level Titratable acidity (TA, g·L−1 malic acid)
    2018 2019 2021
    Harvest Storage (0.5 °C) Harvest Storage (0.5 °C) Harvest Storage (0.5 °C) [3 °C]
    Sweetheart 3-4 8.99aA1* 7.11aB1* 7.31aA1* 6.31aB1*
    4-5 9.55bA1* 7.57bB1* 7.14aA1* 6.13aB1*
    5-6 10.56cA1* 8.57cB1* 7.56aA1* 6.50aB1*
    Staccato 3-4 8.53aA2* 6.65aB2* 6.96aA1* 5.51aB2* 12.0aA* 10.5aB*
    9.7a
    4-5 8.87abA2* 7.04bB2* 7.30aA1* 6.21bB1* 12.8aA* 10.2aB*
    9.3a
    5-6 8.91bA2* 6.91abB2 7.18aA1* 6.46bB1 10.6bA* 9.5b*
    8.5b
    Sentennial 3-4 9.21acA2 7.60aB3
    4-5 9.33aA2 7.89aB2
    5-6 8.79bcA2 7.66aB2
    Main effects Significance F-value Degrees of freedom
    Cultivar p < 0.0001 193.58 2
    Colour level p = 0.0023 5.49 2
    Year p < 0.0001 1,007.20 2
    Time (harvest or storage at 0.5 °C) p < 0.0001 474.18 1
    Colour differences: within common time and cultivar, values followed by different lower case letters indicate significant differences (p ≤ 0.05); Cultivar differences: within common colour level and time, values followed by different numbers indicate significant differences (p ≤ 0.05); Growing year differences: within common time, colour level and cultivar, values followed by * indicate significant differences (p ≤ 0.05); Storage differences (Harvest versus 0.5 °C storage): within common cultivar, colour level and growing year, values followed by different uppercase letter indicate significant differences (p ≤ 0.05); Temperature differences: within Staccato cultivar at 28 d storage and at common colour level, bolded values indicate significant differences (p ≤ 0.05) between storage temperatures (0.5 °C vs 3 °C).
     | Show Table
    DownLoad: CSV
    Table 3.  Soluble solids to titratable acidity ratio values as affected by cultivar, growing year, storage and colour level at harvest.
    Cultivar Colour level Soluble solids to titratable acidity ratio (SS/TA)
    2018 2019 2021
    Harvest Storage (0.5 °C) Harvest Storage (0.5 °C) Harvest Storage (0.5 °C) [3 °C]
    Sweetheart 3-4 2.02a1A* 2.49a1B* 2.49a1A* 2.78a1B*
    4-5 2.09a1A* 2.61a1B* 2.71b1A* 3.06b1B*
    5-6 2.07a1A* 2.46a1B* 2.63b1A* 3.02b1B*
    Staccato 3-4 2.01a1A* 2.58a1B* 2.46a1A* 3.11a2B* 1.57aA* 1.79aB*
    1.89a
    4-5 2.0a1A* 2.54a1B* 2.51a2A* 2.91b1B* 1.55aA* 1.83aB*
    2.04a
    5-6 2.27b2A* 2.58a1B* 2.81b1A* 3.14a1B* 1.89bA* 2.06bB*
    2.32b
    Sentennial 3-4 1.97a2A 2.38a3B
    4-5 2.02a3A 2.34a2B
    5-6 2.37b2A 2.69b2B
    Main effects Significance F-value Degrees of freedom
    Cultivar p < 0.0001 94.79 2
    Colour level p < 0.0001 22.04 2
    Year p < 0.0001 361.13 2
    Time (harvest or storage at 0.5 °C) p < 0.0001 134.15 1
    Colour differences: within common time and cultivar, values followed by different lower case letters indicate significant differences (p ≤ 0.05); Cultivar differences: within common colour level and time, values followed by different numbers indicate significant differences (p ≤ 0.05); Growing year differences: within common time, colour level and cultivar, values followed by * indicate significant differences (p ≤ 0.05); Storage differences (Harvest versus 0.5 °C storage): within common cultivar, colour level and growing year, values followed by different uppercase letter indicate significant differences (p ≤ 0.05); Temperature differences: within Staccato cultivar at 28 d storage and at common colour level, bolded values indicate significant differences (p ≤ 0.05) between storage temperatures (0.5 °C vs 3 °C).
     | Show Table
    DownLoad: CSV
    Table 4.  Dry matter values as affected by cultivar, growing year, storage and colour level at harvest.
    Cultivar Colour level Dry matter (DM, %)
    2018 2019 2021
    Harvest Storage (0.5 °C) Harvest Storage (0.5 °C) Harvest Storage (0.5 °C) [3 °C]
    Sweetheart 3-4 20.9aA1* 20.6aA1* 18.6aA1* 18.6aA1* 22.1aA1*
    4-5 21.9bA1 22.0bA1* 19.9bA1* 19.8acA1* 22.5bA1
    5-6 25.2cA1* 23.5cB1* 21.1cA1* 20.6bcA1* 23.6cA1*
    Staccato 3-4 20.2aA1* 19.5aA2* 18.4aA2* 18.1aA23* 21.0aA2* 20.6aA*
    19.8a
    4-5 20.4aA2* 20.8bA2* 19.1aA1* 18.8aA2* 22.0bA2* 21.6bA*
    21.9b
    5-6 22.4bA2 22.3cA2 22.9bA2* 21.6bA23 23.0cA2 22.2bA
    22.4b
    Sentennial 3-4 18.2aA2 18.4aA13 20.5aA2*
    4-5 19.3bA1 18.8bA2 22.6bA12*
    5-6 22.9cA2 20.9bA13 23.5cA12
    Main effects Significance F-value Degrees of freedom
    Cultivar p < 0.0001 11.36 2
    Colour level p < 0.0001 130.99 2
    Year p < 0.0001 56.64 2
    Time (harvest or storage at 0.5 °C) Not significant, p = 0.0922 2.97 1
    Colour differences: within common time and cultivar, values followed by different lower case letters indicate significant differences (p ≤ 0.05); Cultivar differences: within common colour level and time, values followed by different numbers indicate significant differences (p ≤ 0.05); Growing year differences: within common time, colour level and cultivar, values followed by * indicate significant differences (p ≤ 0.05); Storage differences (Harvest versus 0.5 °C storage): within common cultivar, colour level and growing year, values followed by different uppercase letter indicate significant differences (p ≤ 0.05); Temperature differences: within Staccato cultivar at 28 d storage and at common colour level, bolded values indicate significant differences (p ≤ 0.05) between storage temperatures (0.5 °C vs 3 °C). (N.B. no bolded values appear in this table).
     | Show Table
    DownLoad: CSV

    Data in Table 1 shows the SS levels at each colour level for each sweet cherry cultivar. Overall, SH cherries at harvest had ranges of 18.1%−21.9% over the 2018 and 2019 growing seasons. SC cherries at harvest had levels between 17.1%−20.2% over the three growing years (2018, 2019, and 2021), while SL cherries at harvest had levels of 18.1%−20.8% in 2019. Statistical analysis showed that the main effects of Cultivar (p < 0.0001; F-value = 36.90; degrees of freedom (df) = 2), Colour (p < 0.0001; F-value = 125.76, df = 2), Time (p = 0.0007; F-value = 13.68; df = 1), and Year (p < 0.0001; F-value = 9.26; df = 2) were all significant. Additionally, the interactions of Cultivar * Year (p < 0.0001, F-value = 26.37; df = 1), Colour * Year (p < 0.0069; F-value = 4.19; df = 4), Cultivar * Colour * Year (p < 0.0003; F-value = 10.28; df = 2) and Colour * Time * Year (p < 0.0131; F-value = 3.67; df = 4) were all significant.

    With respect to growing year differences, in 2018, SS levels in SH were greater than those of SC at all colour levels. In 2019, again at the 3-4 colour level SC, cherries exhibited lower SS levels than SH and SL cherries. At the 4-5 colour level, SH cherries again showed higher SS levels compared to SC cherries. At the 5-6 colour level, SL cherries showed higher SS levels compared to SC and SH, while SC and SH cherries showed comparable SS levels at the 5-6 colour level. The SS values of SC cherries at 3-4 and 4-5 colour levels from the 2021 growing year were higher than values observed at the same colour levels in 2018 and 2019 growing year samples. There was no difference observed in SS levels of SC cherries at the 5-6 colour level between growing years. The data shows that colour level, cultivar, and growing year all affected SS levels.

    Within cultivars, for SH in the 2018 growing season, as colour level increased, SS level increased. An increase in SS as colour at harvest increased for SH cultivar was reported by Puniran et al.[27]. In the 2019 growing year for SH cherries and in the 2021 growing year for SC cherries, SS levels plateaued at the 4-5 colour level. For SC (2018 and 2019 growing year) and SL cherries (2019 growing year) as colour level increased, SS level increased. Ross et al.[1] reported this same trend for SC cultivar on data collected from 2015, 2016, and 2017 growing years. This data demonstrates the influence of growing conditions on SS levels.

    In general the SS levels at each colour level for each sweet cherry cultivar did not change over the 28 d storage at 0.5 °C. It should be noted that SC cherries from the 2018 growing year at the 5-6 colour level and SC cherries from the 2021 growing year at the 4-5 colour level did show a significant (p ≤ 0.05) decrease in soluble solids after 28 d of storage at 0.5 °C. SS values for 2018 SC cherries at the 5-6 colour level harvest was 20.2 °Brix, while SS values after 28 day storage at 0.5 °C was 17.9 °Brix. SS values for 2021 SC cherries at the 4-5 colour level harvest was 19.9 °Brix, while SS values after 28 d of storage at 0.5 °C was 18.6 °Brix. In 2021 the effect of storage temperature (0.5 °C vs 3 °C) was investigated. SS levels in the SC cherries at the different colour levels were not affected by the different storage temperatures. This result was consistent with other findings[1,8,14], which suggested that under typical low temperature storage conditions and proper shipping conditions, the change in flavour profiles were likely not due to major changes in SS levels. It is important to note that Alique et al.[8] found that while SS values were consistent, the levels of glucose and fructose decreased by 13% and 10%, respectively, after 4 d under ambient conditions. It may be worth investigating if under a lower temperature environment, the levels of key monosaccharides would remain constant or change.

    This moves the focus of flavour retention to TA values. Table 2 shows the TA levels at each colour level for each sweet cherry cultivar. Statistical analysis showed that the main effects of Cultivar (p < 0.0001; F-value = 193.58; df = 2), Colour (p = 0.0023; F-value = 5.49, df = 2), Time (p < 0.0001; F-value = 474.18; df = 1), and Year (p < 0.0001; F-value = 1007.20; df = 2) were all significant. The interactions of Cultivar * Colour (p < 0.001; F-value = 5.81; df = 4); Cultivar * Year (p < 0.0001; F-value = 19.9; df = 1); Colour * Time (p = 0.0431; F-value = 3.44; df = 2); Colour * Year (p < 0.0001; F-value = 18.01; df = 4); Time * Year (p < 0.0001; F-value = 17.21; df = 2); Cultivar * Colour * Year (p = 0.0009; F-value = 8.63; df = 2); Colour * Time * Year (p = 0.0127; F-value = 3.70; df = 4) were all significant.

    SH cherries at harvest had TA value ranges of 8.99−10.56 g·L−1 in 2018, and 7.31−7.56 g·L−1 in 2019. In 2018, the highest TA value was at the 5-6 colour level for SH cherries, while for the 2019 SH cherries there was no difference between colour levels for the TA values. After storage SH cherries at the various colour levels showed TA levels of 7.11−8.57 g·L−1 and 6.31−6.50 g·L−1 for 2018 and 2019, respectively. Again the stored 2018 SH cherries at the 5-6 colour level showed the highest TA values, while the TA values for the stored 2019 SH cherries were not affected by colour level. SC cherries at harvest showed TA value ranges of 8.53−8.91 g·L−1 in 2018, 6.96−7.18 g·L−1 in 2019, and 10.6−12.8 g·L−1 in 2021. After storage SC cherries had lower TA values at all colour levels for all growing years. In 2018, 2019, and 2021, TA values for SC cherries after storage ranged from 6.65–7.04 g·L−1, 5.51−6.46 g·L−1 and 8.5−10.5 g·L−1, respectively. In 2021, for the SC cherries, the higher storage temperature (3 °C) resulted in a greater loss of TA values for all colour levels compared to the lower temperature of 0.5 °C. SL cherries at harvest had TA levels of 8.79−9.33 g·L−1 in 2019 and after storage at 0.5 C, TA values ranged from 7.60−7.89 g·L−1, with the highest value of TA at the 4-5 colour level. Therefore for all cultivars over all growing years, TA values decreased upon storage, which was expected. The data from Table 2 shows the magnitude of the decrease in TA values after storage varied by growing year. Additionally, trends for differences of TA magnitude change with respect to cultivar and colour level were not obvious. The magnitude of the decrease in TA values between harvest and storage was higher for the SC cherries stored at 3 °C compared to those stored at 0.5 °C.

    Comparing the effect of colour level on TA level within cultivar for SH cherries, TA values increased as colour level at harvest increased in 2018, but the trend did not continue in 2019, possibly due to different growing conditions such as orchard temperature and relative humidity values, which will be further discussed. For SC cherries, TA values peaked at the 4-5 colour level for 2018 and 2021 growing years, but were not significantly different between colour levels in 2019 (p ≤ 0.05). In the 2019 growing year, SL cherries also had the highest TA values at the 4-5 colour level. Comparing the effect of cultivar on TA level within comparable colour level, 2018 harvest SH cherries showed higher TA values than SC cherries. In the 2018 growing year, upon storage and at comparable colour level, SH cherries again showed higher TA values than SC cherries. In the 2019 harvest, SC cherries exhibited the same TA values as SH cherries, while SL cherries had higher TA values than SC and SH. In the 2019 growing year SL cherries harvested at the 3-4 colour level showed greater TA values after storage compared to SH and SC cherries; SC cherries had the lowest TA values at this colour level. When harvested at the 4-5 and 5-6 colour levels, SL cherries had higher TA values upon storage compared to SH and SC cherries.

    The data suggests that different cultivars tend to peak TA values, which may be affected by growing conditions/growing year and maturity level/colour level. This is further supported by the work of Miloševic & Miloševic[28] that indicated TA levels of sour cherries are affected by level of ripeness. Puniran et al.[27] also indicted that finding where peak TA values occur at harvest can help negate the decrease in values that occurs during storage and therefore promote flavour quality retention.

    In 2021 the effect of storage temperature (0.5 °C vs 3 °C) was investigated as 0.5 °C represents ideal storage temperature while 3 °C represents a storage temperature where quality deterioration would be promoted, and may be a more realistic temperature experienced during overseas/export shipping (personal communication, Dr. Peter Toivonen, May, 2021). TA levels in the SC cherries harvested at the different colour levels were affected by the different storage temperature as seen in Table 2. At common colour level, SC cherries from the 2021 growing season stored at 3 °C showed lower TA values than samples stored at 0.5 °C. The SC cherries at the 5-6 colour level stored at 3 °C showed the lowest TA values upon storage. As higher TA values are associated with flavour quality[11,12], the SC cherries harvested at the 5-6 colour level and stored at 3 °C would show poorer flavour quality.

    Table 3 shows the SS/TA ratio values as affected by cultivar, growing year, storage and colour level at harvest. Statistical analysis showed that the main effects of Cultivar (p = 0.0001; F-value = 94.79; df = 2), Colour (p < 0.0001; F-value = 22.04; df = 2), Time (p < 0.0001; F-value = 134.15; df = 1), and Year (p < 0.0001; F-value = 361.13; df = 2) were all significant. The interactions of Cultivar * Colour (p = 0.0009; F-value = 5.91; df = 4) and Time * Year (p = 0.0059; F-value = 5.95; df = 2) were significant. The SS/TA ratio values over all cultivars, colour levels and growing years ranged from 1.55 to 2.81 at harvest and 1.79 to 3.14 after storage at 0.5 °C for 28 d. SC cherries in the 2021 growing year were tested to determine the effect of storage temperature (0.5 or 3 °C) on flavour quality. The SS/TA ratio for the 2021 SC cherries stored at 0.5 °C for 28 d ranged from 1.79 to 2.06 while the SS/TA ratio for the 2021 SC cherries stored at 3 °C for 28 d ranged from 1.89 to 2.32. SS/TA ratios for the 3 °C stored cherries at the 4-5 and 5-6 colour levels were significantly higher (p ≤ 0.05) compared to corresponding SS/TA ratios for the 0.5 °C stored cherries at the 4-5 and 5-6 colour levels. Higher SS/TA ratio are due to lower TA values (data in Table 3) and impact flavour quality and therefore lower storage temperatures are preferable, which was expected.

    Comparing between growing years, for SH and SC cherries, the SS/TA ratio at harvest was higher in the 2019 growing year compared to the 2018 growing year. SC cherries from the 2021 growing year showed the lowest at harvest SS/TA ratio. Within cultivar, the SH cherries from the 2018 growing year showed no difference in harvest SS/TA ratio at the different colour levels. SH cherries from the 2019 growing year showed higher harvest SS/TA ratios at the 4-5 and 5-6 colour levels compared to the 3-4 colour level. The SC cherries at all growing years showed highest harvest SS/TA ratio levels at the 5-6 colour level and comparable harvest SS/TA ratio levels at the 3-4 and 4-5 colour levels. SL cherries also showed the highest harvest SS/TA ratio at the 5-6 colour level and comparable harvest SS/TA ratios at the 3-4 and 4-5 colour levels.

    Comparing cultivars at common colour level, in 2018 growing year SC cherries at the 5-6 colour level showed a higher harvest SS/TA ratio compared to SH cherries at the corresponding colour level. In the 2019 growing year SH and SC cherries showed higher harvest SS/TA ratios at the 3-4 colour level compared to SL cherries. At the 4-5 colour level, SH cherries showed the highest harvest SS/TA ratio value and SL cherries showed the lowest harvest SS/TA ratio value. At the 5-6 colour level, SH and SC cherries showed comparable SS/TA ratios while SL cherries showed the lowest SS/TA ratio.

    Overall, this data indicates that ensuring cherry flavour quality is complex as SS/TA ratio varied by growing year, colour level and cultivar. Comparing SS/TA ratio data for all cultivars over all growing years did not show an observable trend between colour level and SS/TA ratio. As such, colour is not a reliable indicator of flavor quality.

    Table 4 shows the DM values as affected by cultivar, growing year, storage and colour level at harvest. Statistical analysis showed that the main effects of Cultivar (p = 0.0001; F-value = 11.36; df = 2), Colour (p < 0.0001; F-value = 130.99; df = 2), and Year (p < 0.0001; F-value = 56.64; df = 2) were all significant. Notably, the main effect of Time (harvest vs stored) was not significant (p = 0.0922). The interactions of Cultivar * Year (p = 0.001; F-value = 6.45; df = 3); Colour * Year (p = 0.0004; F-value = 6.38; df = 4); Cultivar * Colour * Year (p = 0.0018; F-value = 4.64; df = 5) were all significant. Although SS and TA values were not obtained for all three cultivars in 2021, DM values at harvest were obtained for all three cultivars in 2021. Data in Table 4 show, in general, DM levels did not change over 28-d storage, which was expected. Additionally, data in Table 4 shows that in most cases, at common cultivar and colour level, DM values measured in 2021 were greater than DM values measured in 2018 and 2019 for all cultivars (SH, SC, and SL).

    Within each cultivar, over all growing years, the harvest DM values were significantly different (p < 0.05) at each colour level, except for SC cherries in the 2018 and 2019 growing years. 2018 and 2019 DM values were not significantly different from colour level 3-4 to colour level 4-5. At the 5-6 colour level, over all growing years, SH cherries showed higher DM values compared to dry matter values observed for SC cherries (p < 0.05). At the 3-4 colour level, over all growing seasons, the DM values for SL and SC cherries were not significantly different (p < 0.05). At the 4-5 colour level, over all growing seasons, the DM values for SL were not significantly different than the DM values exhibited by SH and SC cherries (p < 0.05). In 2021 the effect of storage temperature (0.5 °C vs 3 °C) was investigated. DM levels in the SC cherries at the different colour levels were not affected by the different storage temperature. Overall, DM levels ranged from 18.1 to 25.2 depending on cultivar, colour level, growing year, and storage.

    Figure 1ac shows the distribution of the three cherry cultivars relative to DM value ranges over all three growing years via histograms. Cherries at the same colour level did not all have the same DM; this was observed both within and between cultivars (Fig. 1ac). DM data, compiled over all available growing years, for each cultivar in the 3-4, 4-5, and 5-6 colour levels had considerable overlap. However, it is noted there is consistent shift to a higher DM at the 5-6 colour level.

    Figure 1.  Histogram representing distribution of dry matter data for: (a) Sweetheart (SH) cherries over the 2018, 2019, and 2021 growing years; (b) Staccato (SC) cherries over the 2018, 2019, and 2021 growing years; and (c) Sentennial (SL) cherries over the 2019 and 2021 growing years. For all parts, the 3-4 colour level is solid black, the 4-5 level is black stripes, and the 5-6 level is solid grey. On the horizontal axis different dry matter value (DM) ranges are shown via bins and on the vertical axis the frequency or proportion (%) of cherries within the DM bins/ranges are shown. Data was generated from two replicates of samples of 25 cherries (i.e. 50 cherries) from all available growing years.

    Over all growing years, DM values for SH cherries ranged from 14%−27%, 14%−28.5%, and 16.5%−33%, at the 3-4, 4-5, and 5-6 colour levels, respectively (Fig. 1a). SH cherries at the 3-4 and 4-5 colour levels showed the highest proportion (26% and 26%, respectively) of cherries resided in the 22.5 and 22.5% DM bins indicating the highest percentage of SH cherries in these colour levels exhibited a DM of 21% to 22.5%, while the highest proportion (21%) of cherries at the 5-6 colour level resided in the 24% DM bin indicating the highest percentage of SH cherries at this colour level exhibited a DM of 22.5% to 24% (Fig. 1a).

    For SC cherries over all growing years, DM values ranged from 14%−25.5%, 14%−30%, and 16.5%−30%, at the 3-4, 4-5, and 5-6 colour levels, respectively (Fig. 1b). SC cherries at the 3-4 colour level showed the highest proportion of cherries (27%) resided in the 19.5% DM bin which indicated the highest percentage of SC cherries at this colour level exhibited a DM of 18 to 19.5%. SC cherries at the 4-5 colour level showed the highest proportion of cherries (25%) resided in the in the 21% DM bin which indicated the highest percentage of SC cherries at this colour level exhibited a DM of 19.5% to 21 %. At the 5-6 colour level, the highest proportion (35%) of SC cherries resided in the 22.5% DM bin which indicated the highest percentage of SC cherries exhibited a DM of 21%−22.5% (Fig. 1b).

    Over the 2019 and 2021 growing years, SL cherries DM values ranged from 15%−25.5%, 15%−28.5%, and 16.5%−33% at the 3-4, 4-5 and 5-6 colour levels, respectively (Fig. 1c). SL cherries at the 3-4 colour level showed the highest proportion of cherries (36%) resided in the 21% DM bin which indicated the highest percentage of SL cherries at this colour level exhibited a DM of 19.5% to 21%. SL cherries at the 4-5 colour level showed the highest proportion of cherries (28%) resided in the in the 21% DM bin which indicated the highest percentage of SL cherries at this colour level exhibited a DM of 19.5% to 21 %. At the 5-6 colour level, the highest proportion (26%) of SC cherries resided in the 22.5% DM bin which indicated the highest percentage of SL cherries exhibited a DM of 21%−22.5% (Fig. 1c).

    In all, the data in Tables 14 and Fig. 1 indicate that colour is not a reliable indicator of maturity or flavor quality. Cherries of the same colour may differ in DM, SS, TA, and SS/TA ratio due to cultivar and growing conditions. The implication of these results are discussed in subsequent sections.

    Temperature, relative humidity and harvest date for the 2018, 2019, and 2021 growing years are detailed in Table 5. Environmental variations between years impacted colour development, which resulted in yearly variations in our harvest dates as cherry picks were based on cherry colour levels: 2018, July 16 to August 9; 2019, July 18 to August 6; and 2021, July 5 to July 27, nearly two weeks earlier than in previous years (Table 5). In terms of environmental data, the average temperature (AT), average high temperature (AHT), and average low temperature (ALT) values measured in 2021 were greater than the values determined in 2018 and 2019, while the average relative humidity (ARH) values determined in 2021 were lower than the values measured in 2018 and 2019 (Table 5). Depending on growing year and harvest date, average temperature values ranged from 17.17 to 24.28 °C, average high temperature values ranged from 28.59 to 50.68 °C, average low temperatures ranged from 7.17 to 10.68 °C, and average relative humidity values ranged from 40.68% to 66.16% (Table 5).

    Table 5.  Temperature and relative humidity environmental data for 2018, 2019, and 2021 growing years.
    Growing year Colour level Harvest date Average
    temperature
    (AT) (°C)
    Average relative humidity (ARH) Average low temperature (ALT) (°C) Average high temperature (AHT) (°C)
    2018 Sweetheart 3-4 July 16 18.96 61.5% 7.17 32.14
    4-5 July 23 18.85 59.8% 7.17 32.13
    5-6 July 30 20.45 56.85% 7.49 32.05
    Staccato 3-4 July 30 19.74 59.17% 7.42 32.04
    4-5 August 9 21.14 54.46% 7.42 32.77
    5-6 August 9 21.14 54.49% 7.42 32.77
    2018 overall average 20.05 57.71% 7.35 32.32
    2019 Sweetheart 3-4 July 18 17.86 66.04% 7.22 28.79
    4-5 July 24 18.39 66.1% 7.22 28.59
    5-6 July 24 18.39 66.1% 7.22 28.59
    Staccato 3-4 July 22 18.03 66.16% 7.22 28.59
    4-5 July 29 19.19 62.92% 8.67 29.39
    5-6 July 31 19.19 62.92% 8.67 29.39
    Sentennial 3-4 July 22 18.03 66.16% 7.22 28.59
    4-5 July 29 18.99 63.77% 8.67 29.39
    5-6 August 6 19.79 59.94% 8.67 29.39
    2019 overall average 18.87 63.65% 8.19 28.96
    2021 Sweetheart 3-4 July 5 24.01 40.68% 8.51 50.68
    4-5 July 12 24.28 40.68% 10.68 49.23
    5-6 July 20 24.10 40.68% 9.66 47.47
    Staccato 3-4 July 13 24.01 40.68% 8.51 50.68
    4-5 July 21 24.28 40.68% 10.68 49.23
    5-6 July 27 24.10 40.68% 9.66 47.47
    Sentennial 3-4 July 12 24.01 40.68% 8.51 50.68
    4-5 July 19 24.28 40.68% 10.68 49.23
    5-6 July 26 24.10 40.68% 9.66 47.47
    2021 overall average 24.12 40.68% 9.62 49.13
     | Show Table
    DownLoad: CSV

    Principal component analysis (PCA) was performed on all cultivars over all growing seasons to best resolve cultivar specific relationships between variables affecting flavour quality parameters: colour, DM, SS and TA (Fig. 2).

    Figure 2.  Principal component analysis (PCA) plot for: Sweetheart (SH) cherries with data from 2018 and 2019 growing years at the 3-4, 4-5, and 5-6 colours levels (SH34-2018, SH45-2018, SH56-2018, SH34-2019, SH45-2019, and SH56-2019; Staccato (SC) cherries with data from 2018, 2019 and 2021 growing years at the 3-4, 4-5, and 5-6 colour levels (SC34-2018, SC45-2018, SC56-2018, SC34-2019, SC45-2019, SC56-2019, SC34-2021, SC45-2021, and SC56-2021); and Sentennial (SL) cherries with data from 2019 growing year (SL34-2019, SL45-2019, and SL56-2019). PC1 and PC2 accounted for 84.75% variation. The variables include: average temperature (AT), average high temperature (AHT), average low temperature (ALT), average relative humidity (ARH), colour at harvest (ColourH), SS at harvest (SSH), SS after 28 d of storage at 0.5 °C (SS05), titratable acidity at harvest (TAH), titratable acidity after 28 d of storage at 0.5 °C (TA05) and dry matter of cherry fruit at harvest (DMH). Orchard growing factors, flavour quality attributes (loading factors), along with sweet cherry cultivars from each growing season (component scores) were presented as lines with arrows, lines with circles, and squares, respectively. Variables close to each other with small angles between them are strongly positively correlated; variables at right angles are likely not correlated; variables at large angles (close to 180°) are strongly negatively correlated.

    Figure 2 shows that principal components 1 and 2 described most of the variation (84.75%) in the model. SS at harvest (SSH) and SS at 28-d storage at 0.5 °C (SS05) along with DM at harvest (DMH) were positively correlated with colour at harvest (ColourH). TA at harvest (TAH) and TA at 28-d storage at 0.5 °C (TA05) were positively correlated with average high temperature (ATH). AHT, average low temperature (ALT) and average temperature (AT). DMH was more strongly correlated with TAH and TA05 compared to ColourH. TAH and TA05 were positively correlated, yet negatively correlated with average relative humidity (ARH). The 2021 SC samples at the 3-4, 4-5, and 5-6 colour levels (SC34-2021, SC45-2021, and SC56-2021) were clustered with TAH, TA05, ALT, AHT, and AT variables and located in a quadrant opposite of ARH. In late June 2021 a heatwave of unprecedented magnitude impacted the Pacific Northwest region of Canada and the United States; the Canadian national temperature record was broken with a new record temperature of 49.6 °C[29]. Also, the relative humidity levels during this period were also extremely low[30]. As the location of this study was impacted by this heatwave, the data shown in Table 6 shows higher temperatures and lower relative humidity values for the 2021 growing year. The TA values measured in the 2021 growing year were nearly two times the levels measured in the 2018 and 2019 growing years (Table 2). This shows an impact of growing conditions on flavor quality; both the negative correlation between ARH and TA and positive correlations of AT, AHT, and ALT with TA are notable. However, it is noted that correlation does not mean causation. The SH and SC cultivars from the 2018 growing year at the 5-6 colour level were clustered together, and were located in the same quadrant as ColourH, SSH, SS05, and DMH variables (Fig. 2). This indicates these samples were characterized by high values of SSH, SS05, and DMH. All cultivars at the 3-4 colour level from the 2018 (SH and SC), and 2019 (SH, SC, and SL) growing years along with all cultivars at the 4-5 colour level from the 2019 (SH, SC, and SL) growing year were clustered in quadrants opposite of the SSH, SS05, DMH, ColourH, TAH, and TA05 variables while near the ARH variable. The clustering of the samples indicates similarity and lower levels of SSH, SS05, DMH, TAH, and TA05.

    Table 6.  Average colour level and respiration rate of sweet cherries at harvest.
    Growing year Colour
    level
    Average colour measured at harvest
    [average dry matter at harvest]
    Dry matter bin (%), highest
    proportions of cherries
    Respiration rate (mg CO2 kg−1·h−1)
    assessed at 0.5, 5 or 10 °C
    0.5 °C 5 °C 10 °C
    2018 Sweetheart 3-4 3.74a1 [20.9%] 21, 38% 2.87a1 * 5.99a1* 9.75a1*
    4-5 4.66b1 [21.9%] 22.5, 38% 3.57b1* 5.53b1* 9.06a1*
    5-6 5.54c1 [25.2%] 25.5, 26% 3.50b1* 5.18b1* 9.58a1*
    Staccato 3-4 3.58a1 [20.2%] 19.5, 44% 4.43a2* 7.08a2* 9.90a1*
    4-5 4.62b1 [20.4%] 21, 36% 4.58a2* 8.05b2* 11.22b2*
    5-6 5.64c1 [22.4%] 22.5, 50% 4.12b2* 6.43c2* 9.78a1*
    2019 Sweetheart 3-4 3.76a1 [18.6%] 18, 26%; 19.5, 26% Nd 6.04 13.7
    4-5 4.42b1 [19.9%] 21, 32% Nd Nd 8.3
    5-6 5.42c1 [21.1%] 22.5, 28% Nd 6.95 13.5
    Staccato 3-4 3.46a1 [18.4%] 19.5, 32% Nd 5.8 12.47
    4-5 4.40b12 [19.1%] 19.5, 40% Nd 6.14 Nd
    5-6 5.40c1 [22.9%] 22.5, 26% Nd Nd Nd
    Sentennial 3-4 3.62a1 [18.2%] 18, 28% Nd 6.5 12.80
    4-5 4.22b2 [19.3%] 21, 40% Nd 3.76 Nd
    5-6 5.20c2 [22.9%] 22.5, 24% Nd Nd Nd
    2021 Sweetheart 3-4 Nd [22.1%] 22.5, 40% 3.18a1* 5.86a1* 8.8a1*
    4-5 Nd [22.5%] 22.5, 28% 2.78a1* 5.08b1* 8.1a1*
    5-6 Nd [23.6%] 24, 30% 2.65a1* 4.32c1* 9.19a1*
    Staccato 3-4 3.50a1 [21.0%] 19.5, 28% 2.72a1 4.65ab2 10.94a2*
    4-5 4.80b1 [22.0%] 21, 24%; 22.5, 20% 3.27a1* 4.38a2* 8.22b1*
    5-6 5.60c1 [23.0%] 24, 30% 3.05a1* 5.07b2* 9.57ab1*
    Sentennial 3-4 Nd [20.5%] 21, 48% 2.71a1* 4.77a2* 7.84a1*
    4-5 Nd [22.6%] 22.5, 28%; 24, 24% 2.78a1* 4.81a12* 8.28ab1*
    5-6 Nd [23.5%] 22.5, 28%; 24, 24% 4.23b2 4.47a12 9.88b1*
    Within common cultivar and growing year, values followed by different letters indicate significant differences (p ≤ 0.05)-shows colour differences; Within common colour level and growing year, values followed by different numbers indicate significant differences (p ≤ 0.05)-shows cultivar differences; Within common cultivar, growing year and colour level, values followed by * indicate significant differences (p ≤ 0.05)-shows respiration rate differences at the different temperatures. Due to incomplete data, statistical analysis was not performed on 2019 data. Nd = Actual colour was not calculated for Sweetheart and Sentennial cherries in 2021 although cherries were collected 3-4, 4-5, 5-6 colour levels as in previous years and can be considered to have colour levels of approximately 3.5, 4.5, and 5.5, respectively.
     | Show Table
    DownLoad: CSV

    High respiration rates have long been associated with rapid fruit quality deterioration[11]. Lower respiration rates help to maintain higher TA levels, thereby retaining flavour quality[11,12]. This work aimed to provide information on assessing whether rapid and non-invasive dry matter measurements can serve as a surrogate for respiration rate measurements and/or TA measurements to predict fruit quality as this information is essential for developing recommendations to optimize cherry quality retention upon long distance transport. Although it is well known that quality deteriorates more quickly in fruit with higher respiration rates, the respiration rate data for the SH, SC, and SL cherries was collected and analyzed with respect to the different colour levels and corresponding DM values to investigate a link between respiration rate and DM value. Examining the data with this perspective is very novel and additionally very little information on respiration rates is available for SC and SL sweet cherries cultivars in the literature.

    Table 6 shows the respiration rates for a) SH and b) SC cherries at different colour levels for the 2018 growing year and how they were affected by respiration rate assessment temperature (0.5, 5, and 10 °C). Table 6 also shows the respiration rates for a) SH, b) SC, and c) SL cherries at different colour levels for the 2021 growing year and how they are affected by respiration rate assessment temperature. Please note respiration data is incomplete for the 2019 growing year because of data constraints due to equipment difficulties and therefore no statistical analysis was performed on the available 2019 respiration data. As little information exists in the literature for SC and SL cherries, we have included the incomplete respiration data. Table 6 also shows average color data and average DM data for the cherries collected at the different colour levels. Additionally, Table 6 shows data on the DM (%) bins containing the highest proportion of cherries for each cultivar in each growing year at each colour level (histograms for each cultivar for individual growing year not shown).

    Table 6 shows the average colour measured for the cherries harvested at the 3-4, 4-5, and 5-6 colour levels all varied slightly depending on growing year and cultivar. In both the 2018 and 2019 growing years there was no difference in color levels between SH and SC at harvest. In the 2019 growing year, the SL cherries showed lower average colour values at the 4-5 and 5-6 colour levels compared to the average colour levels of SH and SC cherries at the same level. Nevertheless, results indicated the cherries were harvested and sorted to the desired colour levels. In 2021, average colour was not calculated for SH and SL cherries, although cherries were collected at the 3-4, 4-5, and 5-6 colour levels, as in previous years, and can be considered to have been within range. The average colour level was calculated for SC cherries in 2021, as SC cultivar received comprehensive study over all growing years (2018, 2019 and 2021). The calculated colour level values for SC cherries in the 2021 growing year at the 3-4, 4-5, and 5-6 colour levels were 3.5, 4.8, and 5.6, respectively.

    Table 6 shows the lower the respiration rate assessment temperature, the lower the respiration rate, which was expected as cherries are recommended to be stored at 0.5 °C to ensure quality retention due to this fact[1]. In 2018, SH respiration rate values were consistently lower than SC cherries at 0.5 and 5 °C. However, at 10 °C the respiration rate values become comparable between cultivars (Table 6). Comparing between colour level, SH at colour level 3-4 showed the lowest respiration rate at 0.5 °C but had the highest respiration rate when assessed at 5 °C (Table 6). While SC 5-6 cherries at the 5 °C respiration rate assessment temperature showed a significantly lower respiration rate compared to respiration rates measured for SC 3-4 and SC 4-5 cherries at 5 °C (Table 6).

    In 2021, SH and SC respiration rates were more comparable at 0.5 and 10 °C, but at 5 °C, SH respiration rates were higher than SC at the 3-4 and 4-5 colour levels while SC cherries showed a higher respiration rate when assessed at 5 °C compared to the SH cherries at the 5-6 colour level (Table 6). SH respiration rates in 2021 were consistent at 0.5 and 10 °C for all colour levels (Table 6). However, at 5 °C SH cherries at the 5-6 colour level had the lowest respiration rate for all three of the colour levels and the SH cherries at the 3-4 colour level showed the highest respiration rate. This occurred in both 2018 and 2021 (Table 6). The respiration rates of SC cherries were not affected by colour level when assessed at 0.5 °C, but at the 5 °C respiration rate assessment temperature, 2018 SC cherries at 5-6 colour level had lower respiration values (Table 6), while 2021 SC cherries at the 4-5 colour level showed a lower respiration rate value (Table 6). Comparing colour levels, SL cherries at the 5-6 colour level had the highest respiration rates at 0.5 and 10 °C (Table 6). However, at 5 °C, all SL colour levels had comparable respiration values (Table 6). Further, in 2021, all cultivars at 0.5 °C assessment temperature showed respiration rates that were comparable between all colour levels except for SL 5-6. This respiration rate value was significantly higher than the respiration rates measured for the SL 3-4 and 4-5 colour levels and was also higher than the respiration rates determined for SH and SC at the 5-6 colour level. Interestingly, the respiration rate assessed at 0.5 °C for SL at the 5-6 colour level was not significantly different than the respiration rate assessed at 5 °C for SL at the 5-6 colour level (Table 6).

    To further discuss the results presented above, a main source of decreasing TA values in cherries is high respiratory activity[11]. Therefore, linking flavour quality, which is affected by TA levels, to differences in respiration rates is reasonable. Higher respiration rate assessment temperatures were related to higher respiration rates of cherries as seen in Table 6, which was not unexpected and again points to the importance of keeping temperature near 0.5 °C during storage. Additionally, the temperature cherries experience during a growing season affects the respiration rate of the harvested fruit, as Ross et al.[1] found the average temperature and the average high temperature measured in an orchard was positively correlated with the cherry respiration rate at both 5 and 10 °C. Therefore, understanding factors that impact respiration rate, and ensuring cherries are harvested under conditions that ensure a low respiration rate is of significant importance. Table 6 (2021 data) suggests the colour level with the lowest respiration rates for SC cherries is 4-5, which is supported by previous work[1]. While Table 6 (2018 data) suggests the 5-6 colour level gives the lowest respiration rates for SC cherries. When this information is combined with the TA value data, the peak TA values for SC cherries occurs at the 4-5 level and 5-6 colour levels. SH cherries showed that for respiration rate assessed at 0.5 °C, the colour level with the consistently lowest respiration rate was 3-4, but at the 5 °C respiration rate assessment temperature, which is a more abusive temperature, the 5-6 colour level showed the lowest respiration rate in both 2018 and 2021. The highest TA values were seen at the 5-6 colour level for SH cherries. SL cherries show highest TA values at the 3-4 and 4-5 colour level in the 2019 growing year, but insufficient respiration rate data is available in 2019 to comment further. However, the data in Tables 14 indicate that colour is not a reliable indicator of maturity and/or flavor quality. Cherries of the same colour may differ in DM, SS and TA due to cultivar and growing conditions. Figure 1 shows that not all cherries at the same colour level are at the same DM both within and between cultivars. There is a range of DM values for each cultivar in the 3-4, 4-5, and 5-6 colour ranges. However, it is noted the distribution of DM shifted to the right (higher levels) in the 5-6 colour cherries. The work of Palmer et al.[25] and Toivonen et al.[6] have indicated the importance of DM as a fruit quality metric. The implications of colour, DM, and respiration rate results on flavour quality and DM standards are discussed below.

    Associations between colour and DM at harvest with sweet cherry flavour quality attributes and respiration rates were statistically examined using Pearson's correlation coefficient from all available data over all growing years to investigate whether there may be colour/DM levels that are associated with lower respiration rates (Table 7) and could be indicative of when harvest should be performed (i.e. maturity). It was found that colour at harvest was positively correlated with SS at harvest and SS after storage (r = 0.845, p ≤ 0.0005, and r = 0.684, p ≤ 0.005, respectively). Colour at harvest was also positively correlated with DM at harvest (r = 0.768, p ≤ 0.0005). This was expected as darker cherries of a certain cultivar are generally more developed or mature; sugar content (main contributor to DM) and TA increases upon fruit development[1,6,22]. Neither colour or DM at harvest were correlated with SS/TA ratio at harvest or after storage (Table 7). Over all cultivars, no correlation was seen between respiration rate at any assessment temperature and colour level (Table 7). No significant correlations were found between respiration rate assessed at 0.5 and 10 °C and DM (Table 7). A significant negative correlation (r = −0.514, p ≤ 0.025) was found between respiration rate at 5 °C and DM. It was speculated that a correlation between respiration rate and DM was not observed when assessed at 0.5 °C, as this temperature is very low and effectively slows metabolic activity regardless of physiological status of the cherry. No observed correlation between respiration rate assessed at 10 °C and DM was speculated to be due to 10 °C being such an abusive temperature that even physiologically healthy cherries show elevated respiration rates when stored at 10 °C, and likely experienced increased flavour quality deterioration, which could be tested by measuring SS and TA values. Over all cultivars at 5 °C, cherries with lower DM tended to have higher respiration rates, and may be susceptible to more rapid quality deterioration at non-ideal temperatures such as 3−5 °C, which can be encountered in the cherry industry, particularly during export shipping (personal communication, Dr. Peter Toivonen, May, 2021). This points to the importance of good temperature control during storage and diverting lower DM cherries to the domestic and/or rapid consumption market vs export market. Colour was not correlated with TA, while DM at harvest was positively correlated with TA at harvest and upon storage (Table 7), which is relevant for flavour quality. These results indicate that DM has a greater influence on flavour quality attributes than cherry colour.

    Table 7.  Correlations between colour and dry matter at harvest with sweet cherry flavour quality attributes and respiration rate.
    Relationship assessed for Sweetheart*,
    Staccato, and Sentennial**
    cultivars over 2018, 2019,
    and 2021 growing seasons
    Pearson's
    correlation
    coefficient
    Significance
    level
    (p value)
    Colour correlated with
    Soluble solids at harvest r = +0.845 p ≤ 0.0005
    Soluble solids at 28-d storage r = +0.684 p ≤ 0.005
    Dry matter at harvest r = +0.768 p ≤ 0.0005
    Dry matter correlated with
    Soluble solids at harvest r = +0.871 p ≤ 0.0005
    Soluble solids at 28-d storage r = +0.776 p ≤ 0.0005
    Colour at harvest r = +0.769 p ≤ 0.0005
    Titratable acidity at harvest r = +0.439 p ≤ 0.05
    Titratable acidity at 28 d storage r = +0.398 p ≤ 0.10
    Respiration rate at 5 °C r = −0.514 p ≤ 0.025
    Insignificant correlations
    Colour and titratable acidity at harvest r = +0.099 p = 0.696
    Colour and titratable acidity at 28 d storage r = +0.100 p = 0.692
    Colour and soluble solids to titratable
    acidity ratio at harvest
    r = +0.218 p = 0.383
    Colour and soluble solids to titratable
    acidity ratio at 28 d storage
    r = +0.073 p = 0.774
    Colour and respiration rate at 0.5 °C r = +0.252 p = 0.364
    Colour and respiration rate at 5 °C r = −0.206 p = 0.462
    Colour and respiration rate at 10 °C r = +0.084 p = 0.766
    Dry matter and soluble solids to titratable
    acidity ratio at harvest
    r = −0.135 p = 0.595
    Dry matter and soluble solids to titratable
    acidity ratio at 28 d storage
    r = −0.227 p = 0.365
    Dry matter and respiration rate at 0.5 °C r =−0.125 p = 0.657
    Dry matter and respiration rate at 10 °C r = −0.181 p = 0.519
    *Only 2018 and 2019 growing season data available; **only 2019 growing season data available.
     | Show Table
    DownLoad: CSV

    Further, specific cultivar respiration rate and DM relationships were also examined (data not shown). For SH cherries, a negative correlation was determined between respiration rate assessed at 5 °C and DM (p ≤ 0.1), yet this correlation was not seen for SL cherries. Based on statistical parameters SC cherries only showed a negative correlation between respiration rate assessed at 5 °C and DM if a higher p value > 0.1 was used which signifies evidence is not strong enough to suggest a relationship exists. Nevertheless, the statistically significant negative correlation between respiration rate assessed at 5 °C and DM over all cultivars was identified (Table 7).

    Although colour was positively correlated with DM (Table 7), a higher colour may not necessarily indicate a low respiration rate as no significant correlation was observed between colour and respiration rate at any assessment temperature when examined over all cultivars over the growing years tested. Although this highlights the importance of DM in overall quality rather than colour, the data presented thus far suggests certain cultivars achieve different optimal DM values or ranges at maturity that are related to quality retention. In general, higher DM is positive, but is there an upper limit/threshold in terms of higher respiration rate. The lack of correlation between respiration rate assessed at 5 °C and DM for SC and SL cherries seems to indicate a lower optimal DM level for these cultivars compared to SH cherries, as a negative correlation between respiration rate assessed at 5 °C and DM was observed for SH cherries. Again, non-ideal temperatures such as 3−5 °C, can be encountered in the cherry industry, particularly during export shipping, which makes these results extremely relevant to help ensure cherry growers deliver high quality fruit for the export market.

    In 2018, the respiration rate at 5 °C was lowest at the 4-5 and 5-6 colour levels for SH cherries, and the average DM values were ~22% and 25%, respectively. Information from Table 6 shows that 38% of SH fruit were in the 22.5% DM bin indicating the highest percentage of SH cherries at the 4-5 colour level had a DM of 21% to 22.5% while 26% of SH cherries at the 5-6 colour level resided in the 25.5% DM bin indicating the highest percentage of cherries at this colour level had a DM of 24% to 25.5%. For SH cherries in 2021, the lowest respiration rate at 5 °C was at the 5-6 colour level and average DM value was ~23.6%. Information from Table 6 shows that 30% of SH at the 5-6 colour level resided in 24% DM bin indicating the highest percentage of SH cherries at this colour level had a dry mater of 22.5% to 24%. For 2018 SH cherries, titratable acidity, which is important for flavour quality, was highest at the 5-6 colour level where respiration rate assessed at 5 °C was lower. These results imply, that at maturity, cherries tend to a certain DM value or range that corresponds to reduced respiratory activity and promotes quality retention, and would therefore be considered optimal. Based on this data (lower respiration rate (2018 and 2021) and peak TA (2018)), an optimal DM range for SH may be between 22.5%−25% DM or around 23% DM. This optimal DM corresponded to cherries in the 4-5 colour level (21.9%) in 2018, and in the 5-6 colour level (25.2%, 23.6% respectively) in 2018 and 2021.

    2018 respiration rate (assessed at 5 °C) was lowest at the 5-6 colour level for SC cherries and the average DM value was ~22%, respectively. Information from Table 6 shows that 50% of SC cherries resided in the 22.5% DM bin indicating the highest percentage of SC cherries at the 5-6 colour level had a DM of 21% to 22.5% The 2021 respiration rate (assessed at 5 °C) was lowest for SC cherries at the 4-5 colour level and average DM value was ~22% while the highest respiration rate was measured at the 5-6 colour level and the average DM value was ~23.0%. Information from Table 6 shows that 24% and 20% of SC cherries resided in each the 21% and 22.5% DM bins, respectively, indicating the highest percentage of SC cherries at the 4-5 colour level had a DM of 19.5% to 22.5%. For 2021 SC cherries, TA was higher at the 4-5 colour levels, where respiration rate assessed at 5 °C was lowest. Again, these results imply that at maturity cherries tends to a certain DM value or range (optimal) that corresponds to reduced respiratory activity and promotes quality retention. Based on this data (lower respiration rate (2018 and 2021) and peak TA (2018 and 2021)) an optimal DM range for SC may be between 19.5%−22.5% DM or around 22% DM. This optimal DM corresponded to cherries in the 4-5 colour level (22.0%) in 2021, and in the 5-6 colour level (22.4%) in 2018. The data also shows the optimal DM range for SH cherries is higher than the optimal DM range for SC cherries.

    In 2021, for the SL cherries, all colour levels showed the same respiration rate (assessed at 5 °C) and average DM values were 20.5%, 22.6% and 23.5% for the 3-4, 4-5 and 5-6 colour levels, respectively. Information from Table 6 shows that SL cherries at both the 4-5 and 5-6 colour levels, 28% and 24% of the cherries resided in the 22.5% and 24% DM bins indicting the highest percentage of cherries at these colour stages ranged from 21% to 24% DM. For SL, based on the one year of respiration data (2021), determining optimum DM was not as clear. At lower storage temperature (0.5 °C), lower average DM (20.5%−22.6% vs 23.5%) maintained lower respiration rates, but at higher storage temperature (5 and 10 °C) respiration rate did not appear to be affected by DM level. These lower DM values occurred at the 3-4 and 4-5 colour levels.

    Available DM, TA and respiration rate data as discussed suggests the optimal DM range for SH may be between 22.5%−25% DM or around 23% and an optimal dry matter range for SC may be between 19.5%−22.5% DM or around 22% DM, The histogram data over all growing years does further strengthen the justification for suggesting different optimal DM values for different cultivars (Fig. 1). The data over all growing years shows higher proportions of cherries in the 24 % DM bin for SH cherries at the 5-6 colour level which indicated highest proportion of cherries with a DM of 22.5% to 24%. The SC cherries at the 5-6 colour level showed the highest proportion of cherries in the 22.5% DM bin, which indicates the highest percentage of cherries have a DM of 21% to 22.5%; again these DM ranges have been suggested as optimal DM values based on previously discussed respiration data.

    In psychology self-actualization is a concept regarding the process by which an individual reaches their full potential[31]. The data suggests that sweet cherries self-actualize, with the majority of cherries reaching maturity with a DM range that promotes quality retention during storage when growing conditions are favourable. This optimal DM range is different for different cultivars, and growing conditions would be expected to influence the rate and/or ability of this 'self-actualization', as this work and our previous research has shown that environmental factors are correlated with these important quality characteristics[1]. Placing highest importance on distribution of DM levels at the 5-6 colour levels (Fig. 1) is justified as the cherries are the most physiologically mature and will likely exhibit the highest proportion of cherries with optimal DM; however, the optimal DM can occur at other colour ranges and should be used as the primary indicator of maturity. Maturity at harvest is the most important factor that determines storage-life and final fruit quality assweet cherries produce very small quantities of ethylene and do not respond to ethylene treatment; they need to be picked when fully ripe to ensure good flavour quality[32]. It is noted the CTFIL colour standard series goes up to colour level 7, yet a balance needs to be reached between flavour quality optimization vs other quality parameters such as firmness and stem pull force. Supplementary Tables S1S6 provide values of the quality parameters of firmness, stem pull force, stem shrivel, stem browning, pebbling and pitting levels at harvest and after storage for the SH, SC and SL cherries. All of these cherry cultivars exhibited good quality attributes at the 5-6 colour level, as well as lighter colour ranges.

    It is noted that the development of DM standards for different cultivars is a novel concept. This work was positioned as field work that collected cherry data for three cultivars over three growing years in adjacent orchards using the same management practices. Equipment constraints limited respiration rate data collection. As such absolute optimal DM values and/or ranges could not be determined nor was the goal of this study. The goal of this work was to further the concept that different cultivars may reach maturity at different DM levels, which would result in lower respiration rates and higher TA levels at harvest, and after storage, achieving enhanced quality retention. In this regard, absolute optimal DM would be the DM achievable by a cherry cultivar that maximizes flavour attributes and minimizes respiration under ideal conditions. In reality, the absolute optimal DM may or may not be reached during a growing season depending on environmental conditions and orchard management practices; however, cherry cultivars will reach a DM that will be optimal for the growing conditions at harvest maturity, as the present research demonstrates. Developing definitive DM standards to determine optimal harvest points for different cultivars under different environmental conditions should be a direction of research to be further pursued to ensure cherry quality, particularly for cherries subjected to longer term storage and/or cherries destined for the overseas export market.

    The present work is not the first to point to the importance of DM and cherry flavour retention, as an anecdotal report[33] indicated that SH cherries should be harvested at a DM of no higher than 20% or the fruit will lose both sugar and acidity more rapidly during shipping storage. Although this DM value is lower than the DM recommended for SH in the current work, it indicates the importance of DM level and flavour quality in relation to a specific cultivar. The differences between optimal DM for flavour retention in our work and the anecdotal report signifies the complexity of determining DM standards and the impact of growing year/environmental conditions and orchard management practices on optimal DM. Growers will continue to face these complex issues but the present work provides valuable information to growers regarding DM standards for three cultivars.

    It must be noted again that development of absolute DM standards for different cherry cultivars requires more study under rigorous controlled environmental conditions. Additionally, given the impact of environmental conditions on optimal DM, cultivars of interest must be studied over many growing years and orchard conditions to collect a robust data set. Nevertheless, the present research indicates that SH, SC, and SL cultivars have different dry matter values at maturity. The data also shows the DM range for SH cherries at maturity is higher than the DM range for SC cherries at maturity and that for SL, lower DM levels maintained lower respiration rates at lower temperatures, potentially improving ability to maintain quality after harvest.

    Overall, this research showed that DM was a better indicator of flavour quality than colour, as DM was related to both sugars and TA, while colour was only related to sugar. Therefore, this work identified that colour may not be a reliable indicator of maturity and/or flavor quality. This work indicated that cherries of the same colour may differ in DM, SS, and TA due to cultivar type and growing conditions as influenced by growing year. Relative humidity encountered by cherries during the growing season was negatively correlated with TA and higher growing temperatures were positively correlated with TA. This work discovered that sweet cherries may self-actualize, in that when growing conditions are favourable, DM levels may tend towards a certain level at maturity (optimal DM) resulting in superior flavour quality attributes and lower respiration, allowing cherries to reach their full quality potential and ensure quality retention in storage. Therefore, optimal DM can be reached at maturity despite colour. Remaining challenges include development of DM standards for various sweet cherry cultivars and further understanding the impact of growing conditions to better allow for self-actualization and prediction of the optimal DM under those conditions to optimize timing of harvest from year-to-year. Nevertheless, this research based on field work for three sweet cherry cultivars over three growing years, indicated an optimal DM range for SH between 22.5%−25% DM and an optimal DM range for SC between 19.5%−22.5% DM. Interestingly, under the same field conditions, the optimal DM range for SH cherries was higher than the optimal DM range for SC cherries. More analysis is required for determining optimal DM for SL, but the initial data indicates DM in the range of 20.5% to 22.6% maintained lower respiration rates at lower temperature potentially improving ability to maintain quality after harvest.

    The authors confirm contribution to the paper as follows: study conception and design: Ross KA, DeLury NC, Fukumoto L; data collection: Ross KA, DeLury NC, Fukumoto L; analysis and interpretation of results: Ross KA, DeLury NC, Fukumoto L; draft manuscript preparation: Ross KA, DeLury N, Fukumoto L, Forsyth JA. All authors reviewed the results and approved the final version of the manuscript.

    The datasets generated during and/or analysed during the current study are available from the corresponding author on reasonable request.

    We are grateful to the BC Cherry Association for financial support of this research project. We acknowledge Manon Gentes, Gillian Beaudry, and Duncan Robinson for their technical assistance. We are grateful to Brenda Lannard for providing her expertise on using the Felix F750 handheld spectrometer (Felix Instruments, Inc.) to obtain dry matter values and obtaining respiration data. Kelly A. Ross would like to thank and acknowledge Dr. Peter Toivonen for his mentorship, valuable scientific discussions and consistently kind support.

  • The authors declare that they have no conflict of interest.

  • [1]

    Lescot T. 2020. Banana genetic diversity. FruiTrop n°269 98−102. https://www.fruitrop.com/en/Articles-by-subject/Varieties/2020/Banana-genetic-diversity

    Google Scholar

    [2]

    Department of Agriculture. 2019. Philippine banana industry roadmap 2019−2022. Department of Agriculture, High Value Crops Program. 50 pp. www.da.gov.ph/wp-content/uploads/2019/06/Philippine-Banana-Industry-Roadmap-2019-2022.pdf

    [3]

    Uma S, Kumaravel M, Backiyarani S, Saraswathi MS, Durai P, et al. 2021. Somatic embryogenesis as a tool for reproduction of genetically stable plants in banana and confirmatory field trials. Plant Cell, Tissue and Organ Culture (PCTOC) 147:181−88

    doi: 10.1007/s11240-021-02108-0

    CrossRef   Google Scholar

    [4]

    Tumuhimbise R, Talengera D. 2018. Improved propagation techniques to enhance the productivity of banana (Musa spp.). Open Agriculture 3:138−45

    doi: 10.1515/opag-2018-0014

    CrossRef   Google Scholar

    [5]

    Johns GG. 1994. Field evaluation of five clones of tissue-cultured bananas in northern NSW. Australian Journal of Experimental Agriculture 34:521−28

    doi: 10.1071/EA9940521

    CrossRef   Google Scholar

    [6]

    Elhiti M, Stasolla C, Wang A. 2013. Molecular regulation of plant somatic embryogenesis. In Vitro Cellular & Developmental Biology - Plant 49:631−42

    doi: 10.1007/s11627-013-9547-3

    CrossRef   Google Scholar

    [7]

    Raemakers CJJM, Jacobsen E, Visser RGF. 1995. Secondary somatic embryogenesis and applications in plant breeding. Euphytica 81:93−107

    doi: 10.1007/BF00022463

    CrossRef   Google Scholar

    [8]

    Slatter A, Scott NW, Fowler MR. 2003. Plant biotechnology. Oxford: Oxford University Press. 346 pp.

    [9]

    Remakanthan A, Menon TG, Soniya EV. 2014. Somatic embryogenesis in banana (Musa acuminata AAA cv. Grand Naine): effect of explant and culture conditions. In Vitro Cellular & Developmental Biology - Plant 50:127−36

    doi: 10.1007/s11627-013-9546-4

    CrossRef   Google Scholar

    [10]

    Panis B, Van Wauwe A, Swennen R. 1993. Plant regeneration through direct somatic embryogenesis from protoplasts of banana (Musa spp.). Plant Cell Reports 12:403−7

    doi: 10.1007/BF00234701

    CrossRef   Google Scholar

    [11]

    Zimmerman JL. 1993. Somatic embryogenesis: a model for early development in higher plants. The Plant Cell 5:1411−23

    doi: 10.1105/tpc.5.10.1411

    CrossRef   Google Scholar

    [12]

    Salaün C, Lepiniec L, Dubreucq B. 2021. Genetic and molecular control of somatic embryogenesis. Plants 10:1467

    doi: 10.3390/plants10071467

    CrossRef   Google Scholar

    [13]

    Escobedo-Gracia Medrano RM, Enríquez-Valencia AJ, Youssef M, López-Gómez P, Cruz-Cárdenas CI, et al. 2016. Somatic embryogenesis in banana, Musa ssp. In Somatic Embryogenesis: Fundamental Aspects and Applications, eds. Loyola-Vargas V, Ochoa-Alejo N. Cham: Springer. pp. 381−400. https://doi.org/10.1007/978-3-319-33705-0_21

    [14]

    Guan Y, Li S, Fan X, Su Z. 2016. Application of somatic embryogenesis in woody plants. Frontiers in Plant Science 7:938

    doi: 10.3389/fpls.2016.00938

    CrossRef   Google Scholar

    [15]

    Panis BJ, Withers LA, De Langhe E. 1990. Cryopreservation of Musa suspension cultures and subsequent regeneration of plants. Cryoletters 11:337−50

    Google Scholar

    [16]

    Strosse H, Domergue R, Panis B, Escalant JV, Côte F. 2003. Banana and plantain embryogenic cell suspensions. In INIBAP Technical Guidelines 8, eds. Vézina A, Picq C. Montpellier. France: The International Network for the Improvement of Banana and Plantain. https://cropgenebank.sgrp.cgiar.org/files/tg8_en.pdf

    [17]

    López J, Rayas A, Medero V, Santos A, Basail M, et al. 2022. Somatic embryogenesis in banana (Musa spp.). In Somatic Embryogenesis, ed. Ramírez-Mosqueda MA. New York, NY: Humana. 2527:97−110. https://doi.org/10.1007/978-1-0716-2485-2_8

    [18]

    Kulkarni VM, Ganapathi TR. 2009. A simple procedure for slow growth maintenance of banana (Musa spp.) embryogenic cell suspension cultures at low temperature. Current Science 96:1372−77

    Google Scholar

    [19]

    Joshi R, Kumar P. 2013. Regulation of somatic embryogenesis in crops: a review. Agricultural Reviews 34:1−20

    Google Scholar

    [20]

    Ikeuchi M, Sugimoto K, Iwase A. 2013. Plant callus: mechanisms of induction and repression. The Plant Cell 25:3159−73

    doi: 10.1105/tpc.113.116053

    CrossRef   Google Scholar

    [21]

    Emons AMC. 1994. Somatic embryogenesis: cell biological aspects. Acta Botanica Neerlandica 43:1−14

    doi: 10.1111/j.1438-8677.1994.tb00729.x

    CrossRef   Google Scholar

    [22]

    Khatri A, Khan IA, Dahot MU, Shah G, Nizamani GS, et al. 2005. Study of callus induction in banana (Musa sp). Pakistan Journal of Biotechnology 2:36−40

    Google Scholar

    [23]

    Manulis S, Haviv-Chesner A, Brandl MT, Lindow SE, Barash I. 1998. Differential involvement of indole-3-acetic acid biosynthetic pathways in pathogenicity and epiphytic fitness of Erwinia herbicola pv. gypsophilae. Molecular Plant-Microbe Interactions 11:634−42

    doi: 10.1094/MPMI.1998.11.7.634

    CrossRef   Google Scholar

    [24]

    Efferth T. 2019. Biotechnology applications of plant callus cultures. Engineering 5:50−59

    doi: 10.1016/j.eng.2018.11.006

    CrossRef   Google Scholar

    [25]

    Jamil SZMR, Rohani ER, Baharum SN, Noor NM. 2018. Metabolite profiles of callus and cell suspension cultures of mangosteen. 3 Biotech 8:322

    doi: 10.1007/s13205-018-1336-6

    CrossRef   Google Scholar

    [26]

    Banerjee N, Schoofs J, Hollevoet S, Dumortier F, De Langhe E. 1987. Aspects and prospects of somatic embryogenesis in musa, abb, cv. bluggoe. Acta Horticulturae :727−30

    doi: 10.17660/actahortic.1987.212.126

    CrossRef   Google Scholar

    [27]

    Da Silva Conceição ADS, Matsumoto K, Bakry F, Bernd-Souza RB. 1998. Plant regeneration from long-term callus culture of AAA-group dessert banana. Pesquisa Agropecuária Brasileira 33:1291−96

    Google Scholar

    [28]

    Kumar R, Ahmed MF, Mir H, Mehta S, Sohane RK. 2019. Study on in vitro establishment and callus induction in banana cv. Grand Nain. Current Journal of Applied Science and Technology 33: 1−5

    doi: 10.9734/cjast/2019/v33i330073

    CrossRef   Google Scholar

    [29]

    Megia R, Haïcour R, Rossignol L, Sihachakr D. 1992. Callus formation from cultured protoplasts of banana (Musa sp.). Plant Science 85:91−98

    doi: 10.1016/0168-9452(92)90097-6

    CrossRef   Google Scholar

    [30]

    Perez EA, Brunner H, Afza R. 1998. Somatic embryogenesis in banana (Musa ssp.) cv. lakatan and latundan. Philippine Journal of Crop Science 23:85

    Google Scholar

    [31]

    Dai X, Xiao W, Huang X, Zhao J, Chen Y, et al. 2010. Plant regeneration from embryogenic cell suspensions and protoplasts of dessert banana cv. 'Da Jiao' (Musa paradisiacal ABB Linn.) via somatic embryogenesis. In Vitro Cellular & Developmental Biology - Plant 46:403−10

    doi: 10.1007/s11627-010-9314-7

    CrossRef   Google Scholar

    [32]

    Assani A, Haicour R, Wenzel G, Côte F, Bakry F, et al. 2001. Plant regeneration from protoplasts of dessert banana cv. Grande Naine (Musa spp., Cavendish sub-group AAA) via somatic embryogenesis. Plant Cell Reports 20:482−88

    doi: 10.1007/s002990100366

    CrossRef   Google Scholar

    [33]

    Skoog F, Miller CO. 1957. Chemical regulation of growth and organ formation in plant tissues cultured in vitro. Symposia of the Society for Experimental Biology 11:118−30

    Google Scholar

    [34]

    Goren R, Altman A, Giladi I. 1979. Role of ethylene in abscisic acid-induced callus formation in Citrus bud cultures. Plant Physiology 63:280−82

    doi: 10.1104/pp.63.2.280

    CrossRef   Google Scholar

    [35]

    Hu Y, Bao F, Li J. 2000. Promotive effect of brassinosteroids on cell division involves a distinct CycD3-induction pathway in Arabidopsis. The Plant Journal 24:693−701

    doi: 10.1046/j.1365-313x.2000.00915.x

    CrossRef   Google Scholar

    [36]

    Srangsam A, Kanchanapoom K. 2003. Thidiazuron induced plant regeneration in callus culture of triploid banana (Musa sp.) 'Gros Michel', AAA group. Songklanakarin Journal of Science and Technology 25:689−96

    Google Scholar

    [37]

    Escalant JV, Teisson C, Cote F. 1994. Amplified somatic embryogenesis from male flowers of triploid banana and plantain cultivars (Musa spp.). In Vitro – Plant 30:181−86

    doi: 10.1007/BF02823029

    CrossRef   Google Scholar

    [38]

    Pervin MR, Azam FMS, Morshed MT, Rahman S, Hero MKA, et al. 2013. Natural growth substances has effective role in callus culture of banana (Musa spp.) cultivar 'Anupam' (AAB genome, Sapientum subgroup). American-Eurasian Journal of Sustainable Agriculture 7:149−54

    Google Scholar

    [39]

    Nandhakumar N, Kumar K, Sudhakar D, Soorianathasundaram K. 2018. Plant regeneration, developmental pattern and genetic fidelity of somatic embryogenesis derived Musa spp. Journal of Genetic Engineering and Biotechnology 16:587−98

    doi: 10.1016/j.jgeb.2018.10.001

    CrossRef   Google Scholar

    [40]

    Kumaravel M, Backiyarani S, Saraswathi MS, Arun K, Uma S. 2020. Induction of somatic embryogenesis (SE) in recalcitrant Musa spp. by media manipulation based on SE's molecular mechanism. Acta Horticulturae 1272: 119−27

    doi: 10.17660/actahortic.2020.1272.15

    CrossRef   Google Scholar

    [41]

    Kevers C, Bisbis B, Le Dily F, Billard JP, Huault C, et al. 1995. Darkness improves growth and delays necrosis in a nonchlorophyllous habituated sugarbeet callus: biochemical changes. In Vitro Cellular & Developmental Biology - Plant 31:122−26

    doi: 10.1007/BF02632249

    CrossRef   Google Scholar

    [42]

    Munguatosha N, Emerald M, Patric N. 2014. Control of lethal browning by using ascorbic acid on shoot tip cultures of a local Musa spp. (Banana) cv. Mzuzu in Tanzania. African Journal of Biotechnology 13:1721−25

    doi: 10.5897/ajb2013.13251

    CrossRef   Google Scholar

    [43]

    Safwat G, Abdul-Rahman F, El Sharbasy S. 2016. The effect of some antioxidants on blackening and growth of in vitro culture of banana (Musa spp. cv. grand naine). Egyptian Journal of Genetics and Cytology 44:47−59

    Google Scholar

    [44]

    Jarret RL, Rodriguez W, Fernandez R. 1985. Evaluation, tissue culture propagation, and dissemination of 'Saba' and 'Pelipita' plantains in Costa Rica. Scientia Horticulturae 25:137−47

    doi: 10.1016/0304-4238(85)90085-8

    CrossRef   Google Scholar

    [45]

    Santos de Oliveira H, Filgueira de Lemos O, Miranda VS, Cristina da Paixão Moura H, Campelo MF, et al. 2011. Establishment and in vitro multiplication of banana (Musa spp.) cultivars with the use of PVP (Polyvinylpyrrolidone). Acta Amazonica 41:369−76

    doi: 10.1590/S0044-59672011000300006

    CrossRef   Google Scholar

    [46]

    Onuoha IC, Eze CJ, Unamba CIN. 2011. In vitro prevention of browning in plantain culture. OnLine Journal of Biological Sciences 11:13−17

    doi: 10.3844/ojbsci.2011.13.17

    CrossRef   Google Scholar

    [47]

    Schoofs H. 1997. The origin of embryogenic cells in Musa. PhD thesis. KU Leuven, Belgium. 257 pp.

    [48]

    Rustagi A, Shekhar S, Kumar D, Lawrence K, Bhat V, et al. 2019. High speed regeneration via somatic embryogenesis in elite Indian banana cv. Somrani monthan (ABB). Vegetos 32:39−47

    doi: 10.1007/s42535-019-00005-8

    CrossRef   Google Scholar

    [49]

    Srivastava PS, Bharti N, Pande D, Srivastava S. 2002. Role of mycorrhiza in in vitro micropropagation of plants. In Techniques in Mycorrhizal Studies, eds. Mukerji KG, Manoharachary C, Chamola BP. Dordrecht, Netherlands: Springer. pp. 443−68. https://doi.org/10.1007/978-94-017-3209-3_23

    [50]

    Jiménez VM. 2005. Involvement of plant hormones and plant growth regulators on in vitro somatic embryogenesis. Plant Growth Regulation 47:91−110

    doi: 10.1007/s10725-005-3478-x

    CrossRef   Google Scholar

    [51]

    Horstman A, Li M, Heidmann I, Weemen M, Chen B, et al. 2017. The BABY BOOM transcription factor activates the LEC1-ABI3-FUS3-LEC2 network to induce somatic embryogenesis. Plant Physiology 175:848−57

    doi: 10.1104/pp.17.00232

    CrossRef   Google Scholar

    [52]

    Marimuthu K, Subbaraya U, Suthanthiram B, Marimuthu SS. 2019. Molecular analysis of somatic embryogenesis through proteomic approach and optimization of protocol in recalcitrant Musa spp. Physiologia Plantarum 167:282−301

    doi: 10.1111/ppl.12966

    CrossRef   Google Scholar

    [53]

    Chung JP, Lu CC, Kuo LT, Ma SS, Shii CT. 2016. Acidogenic growth model of embryogenic cell suspension culture and qualitative mass production of somatic embryos from triploid bananas. Plant Cell, Tissue and Organ Culture (PCTOC) 124:241−51

    doi: 10.1007/s11240-015-0888-y

    CrossRef   Google Scholar

    [54]

    Tripathi JN, Muwonge A, Tripathi L. 2012. Efficient regeneration and transformation protocol for plantain cv. 'Gonja manjaya' (Musa spp. AAB) using embryogenic cell suspension. In Vitro Cellular & Developmental Biology - Plant 48:216−24

    doi: 10.1007/s11627-011-9422-z

    CrossRef   Google Scholar

    [55]

    Konan NK, Schöpke C, Cárcamo R, Beachy RN, Fauquet C. 1997. An efficient mass propagation system for cassava (Manihot esculenta Crantz) based on nodal explants and axillary bud-derived meristems. Plant Cell Reports 16:444−49

    doi: 10.1007/BF01092763

    CrossRef   Google Scholar

    [56]

    Groll J, Mycock DJ, Gray VM. 2002. Effect of medium salt concentration on differentiation and maturation of somatic embryos of cassava (Manihot esculenta Crantz). Annals of Botany 89:645−48

    doi: 10.1093/aob/mcf095

    CrossRef   Google Scholar

    [57]

    Gray DJ. 1995. Somatic embryogenesis in grape. In Somatic Embryogenesis in Woody Plants, eds. Jain SM, Gupta PK, Newton RJ. Dordrecht: Springer. pp. 191–217. https://doi.org/10.1007/978-94-011-0491-3_12

    [58]

    Toonen MAJ, De Vries SC. 1995. Initiation of somatic embryos from single cells. In Embryogenesis: the Generation of a Plant, eds. Wang TL, Cuning A. Oxford: Bios Scientific Publishers. pp. 173−89

    [59]

    Côte FX, Folliot M, Domergue R, Dubois C. 2000. Field performance of embryogenic cell suspension-derived banana plants (Musa AAA, cv. Grande naine). Euphytica 112:245−51

    doi: 10.1023/A:1003960724547

    CrossRef   Google Scholar

    [60]

    Jafari N, Othman RY, Tan BC, Khalid N. 2015. Morphohistological and molecular profiles during the developmental stages of somatic embryogenesis of Musa acuminata cv. 'Berangan' (AAA). Acta Physiologiae Plantarum 37:45

    doi: 10.1007/s11738-015-1796-9

    CrossRef   Google Scholar

    [61]

    Husin N, Jalil M, Othman RY, Khalid N. 2014. Enhancement of regeneration efficiency in banana (Musa acuminata cv. Berangan) by using proline and glutamine. Scientia Horticulturae 168:33−37

    doi: 10.1016/j.scienta.2014.01.013

    CrossRef   Google Scholar

    [62]

    Ma SS. 1991. Somatic embryogenesis and plant regeneration from cell suspension culture of banana. Proceedings of Symposium on Tissue culture of horticultural crops, Taipei, Taiwan, 1988. pp. 181–88

    [63]

    Litz RE, Gray DJ. 1995. Somatic embryogenesis for agricultural improvement. World Journal of Microbiology and Biotechnology 11:416−25

    doi: 10.1007/BF00364617

    CrossRef   Google Scholar

    [64]

    Schiavo FL, Giuliano G, de Vries SC, Genga A, Bollini R, et al. 1990. A carrot cell variant temperature sensitive for somatic embryogenesis reveals a defect in the glycosylation of extracellular proteins. Molecular and General Genetics MGG 223:385−93

    doi: 10.1007/BF00264444

    CrossRef   Google Scholar

    [65]

    Guzzo F, Baldan B, Mariani P, Schiavo FL, Terzi M. 1994. Studies on the origin of totipotent cells in explants of Daucus carota L. Journal of Experimental Botany 45:1427−32

    doi: 10.1093/jxb/45.10.1427

    CrossRef   Google Scholar

    [66]

    Danin M, Upfold SJ, Levin N, Nadel BL, Altman A, et al. 1993. Polyamines and cytokinins in celery embryogenic cell cultures. Plant Growth Regulation 12:245−54

    doi: 10.1007/BF00027205

    CrossRef   Google Scholar

    [67]

    Hare PD, van Staden J. 1997. The molecular basis of cytokinin action. Plant Growth Regulation 23:41−78

    doi: 10.1023/A:1005902508249

    CrossRef   Google Scholar

    [68]

    Schiavone FM, Cooke TJ. 1985. A geometric analysis of somatic embryo formation in carrot cell cultures. Canadian Journal of Botany 63:1573−78

    doi: 10.1139/b85-218

    CrossRef   Google Scholar

    [69]

    Attree SM, Moore D, Sawhney VK, Fowke LC. 1991. Enhanced maturation and desiccation tolerance of white spruce[Picea glauca (Moench) voss] somatic embryos: effects of a non-plasmolysing water stress and abscisic acid. Annals of Botany 68:519−25

    doi: 10.1093/oxfordjournals.aob.a088291

    CrossRef   Google Scholar

    [70]

    Bomal C, Le VQ, Tremblay FM. 2002. Induction of tolerance to fast desiccation in black spruce (Picea mariana) somatic embryos: relationship between partial water loss, sugars, and dehydrins. Physiologia Plantarum 115:523−30

    doi: 10.1034/j.1399-3054.2002.1150406.x

    CrossRef   Google Scholar

    [71]

    Bewley JD, Bradford KJ, Hilhorst HWM, Nonogaki H. 2013. Development and maturation. In Seeds: Physiology of Development, Germination and Dormancy, 3rd Edition. New York, NY: Springer. pp. 27–83. https://doi.org/10.1007/978-1-4614-4693-4_2

    [72]

    Dekkers BJW, Bentsink L. 2015. Regulation of seed dormancy by abscisic acid and DELAY OF GERMINATION 1. Seed Science Research 25:82−98

    doi: 10.1017/s0960258514000415

    CrossRef   Google Scholar

    [73]

    Maldonado-Borges JI, Ku-Cauich JR, Escobedo-GraciaMedrano RM. 2013. Annotation of differentially expressed genes in the somatic embryogenesis of Musa and their location in the banana genome. The Scientific World Journal 2013:535737

    doi: 10.1155/2013/535737

    CrossRef   Google Scholar

    [74]

    del Rivero Bautista N, Agramante-Peñalver D, Barbón-Rodríguez R, Camacho-Chiu W, Collado-López R, et al. 2008. Embriogénesis somática en (Anthurium andraeanum Lind.) variedad 'LAMBADA'. Ra Ximhai 135−49

    Google Scholar

    [75]

    Smith DL, Krikorian AD. 1990. Somatic embryogenesis of carrot in hormone-free medium: external pH control over morphogenesis. American Journal of Botany 77:1634−47

    doi: 10.1002/j.1537-2197.1990.tb11403.x

    CrossRef   Google Scholar

    [76]

    Smith DL, Krikorian AD. 1991. Growth and maintenance of an embryogenic cell culture of daylily (Hemerocallis) on hormone-free medium. Annals of Botany 67:443−49

    doi: 10.1093/oxfordjournals.aob.a088180

    CrossRef   Google Scholar

    [77]

    Krikorian AD. 2000. Historical insights into some contemporary problems in somatic embryogenesis. In Somatic Embryogenesis in Woody Plants, eds. Jain SM, Gupta PK, Newton RJ. Dordrecht: Springer. pp. 17–49. https://doi.org/10.1007/978-94-017-3030-3_2

    [78]

    Nomura K, Komamine A. 1985. Identification and isolation of single cells that produce somatic embryos at a high frequency in a carrot suspension culture. Plant Physiology 79:988−91

    doi: 10.1104/pp.79.4.988

    CrossRef   Google Scholar

    [79]

    Fujimura T, Komamine A. 1979. Synchronization of somatic embryogenesis in a carrot cell suspension culture. Plant Physiology 64:162−64

    doi: 10.1104/pp.64.1.162

    CrossRef   Google Scholar

    [80]

    Namanya P, Magambo SM, Mutumba G, Tushemereirwe W. 2004. Somatic embryogenesis from immature male inflorescences of East African highland banana CV 'Nakyetengu'. African Crop Science Journal 12:43−49

    doi: 10.4314/acsj.v12i1.27661

    CrossRef   Google Scholar

    [81]

    Domergue FGR, Ferrière N, Côte FX. 2000. Morphohistological study of the different constituents of a banana (Musa AAA, cv. Grande naine) embryogenic cell suspension. Plant Cell Reports 19:748−54

    doi: 10.1007/s002999900188

    CrossRef   Google Scholar

    [82]

    Kulkarni VM, Bapat VA. 2013. Somatic embryogenesis and plant regeneration from cell suspension cultures of Rajeli (AAB), an endangered banana cultivar. Journal of Plant Biochemistry and Biotechnology 22:132−37

    doi: 10.1007/s13562-012-0119-0

    CrossRef   Google Scholar

    [83]

    Bhardwaj L, Ramawat KG. 1993. Effect of anti-oxidants and adsorbents on tissue browning associated metabolism in Cocculus pendulus callus cultures. Indian Journal of Experimental Biology 31:715−18

    Google Scholar

    [84]

    El-Kereamy A, Bi YM, Mahmood K, Ranathunge K, Yaish MW, et al. 2015. Overexpression of the CC-type glutaredoxin, OsGRX6 affects hormone and nitrogen status in rice plants. Frontiers in Plant Science 6:934

    doi: 10.3389/fpls.2015.00934

    CrossRef   Google Scholar

    [85]

    Patterson K, Walters LA, Cooper AM, Olvera JG, Rosas MA, et al. 2016. Nitrate-regulated glutaredoxins control Arabidopsis primary root growth. Plant Physiology 170:989−99

    doi: 10.1104/pp.15.01776

    CrossRef   Google Scholar

    [86]

    Boutilier K, Offringa R, Sharma VK, Kieft H, Ouellet T, et al. 2002. Ectopic expression of BABY BOOM triggers a conversion from vegetative to embryonic growth. The Plant Cell 14:1737−49

    doi: 10.1105/tpc.001941

    CrossRef   Google Scholar

    [87]

    Lotan T, Ohto MA, Yee KM, West MAL, Lo R, et al. 1998. Arabidopsis LEAFY COTYLEDON1 is sufficient to induce embryo development in vegetative cells. Cell 93:1195−205

    doi: 10.1016/s0092-8674(00)81463-4

    CrossRef   Google Scholar

    [88]

    Ji W, Zhu Y, Li Y, Yang L, Zhao X, et al. 2010. Over-expression of a glutathione S-transferase gene, GsGST, from wild soybean (Glycine soja) enhances drought and salt tolerance in transgenic tobacco. Biotechnology Letters 32:1173−79

    doi: 10.1007/s10529-010-0269-x

    CrossRef   Google Scholar

    [89]

    Suer S, Agusti J, Sanchez P, Schwarz M, Greb T. 2011. WOX4 imparts auxin responsiveness to cambium cells in Arabidopsis. The Plant Cell 23:3247−59

    doi: 10.1105/tpc.111.087874

    CrossRef   Google Scholar

    [90]

    Grapin A, Ortiz JL, Domergue R, Babeau J, Monmarson S, et al. 1998. Establishment of embryogenic callus and initiation and regeneration of embryogenic cell suspensions from female and male immature flowers of Musa. InfoMusa 7:13−15

    Google Scholar

    [91]

    Cote F, Goue O, Domergue R, Panis B, Jenny C. 2000. In-field behaviour of banana plants (Musa AA sp) obtained after regeneration of cryopreserved embryogenic cell suspensions. Cryo Letters 21:19−24

    Google Scholar

    [92]

    Youssef M, James A, Mayo-Mosqueda A, Ku-Cauich JR, Grijalva-Arango R, et al. 2010. Influence of genotype and age of explant source on the capacity for somatic embryogenesis of two Cavendish banana cultivars Musa acuminata Colla AAA. African Journal of Biotechnology 9:2216−23

    Google Scholar

    [93]

    Widholm JM. 1972. The use of fluorescein diacetate and phenosafranine for determining viability of cultured plant cells. Stain Technology 47:189−94

    doi: 10.3109/10520297209116483

    CrossRef   Google Scholar

    [94]

    Roux N, Strosse H, Toloza A, Panis B, Doležel J. 2004. Detecting ploidy level instability of banana embryogenic cell suspension cultures by flow cytometry. In Banana Improvement: Cellular Molecular Biology and Induced Mutations, eds. Jain S.M, Sweennen R. Enfield, UK: Science Publishers Inc. pp.183−91

    [95]

    Rodrigues PHV, Tulmann Neto A, Cassieri Neto P, Mendes BMJ. 1998. Influence of the number of subcultures on somaclonal variation in micropropagated nanicão (Musa spp., AAA group). Acta Horticulturae 490:469−74

    doi: 10.17660/actahortic.1998.490.49

    CrossRef   Google Scholar

    [96]

    Pérez EA, Hooks CR. 2008. Preparing tissue-cultured banana plantlets for field planting. Biotechnology 8:1−3

    Google Scholar

    [97]

    Tomekpe K, Fondi E. 2008. Regeneration guidelines of banana. In Crop specific regeneration guidelines, eds. Dulloo ME, Thormann I, Jorge MA, Hanson J. Rome, Italy: SGRP. 9 pp

    [98]

    Ghag SB, Shekhawat UKS, Ganapathi TR. 2014. Transgenic banana plants expressing a Stellaria media defensin gene (Sm-AMP-D1) demonstrate improved resistance to Fusarium oxysporum. Plant Cell, Tissue and Organ Culture (PCTOC) 119:247−55

    doi: 10.1007/s11240-014-0529-x

    CrossRef   Google Scholar

    [99]

    Schoofs H, Panis B, Strosse H, Mayo Mosqueda A, Lopez Torres J, et al. 1999. Bottlenecks in the generation and maintenance of morphogenic banana cell suspensions and plant regeneration via somatic embryogenesis therefrom. InfoMusa 8:3−7

    Google Scholar

    [100]

    Konieczny R, Sliwinska E, Pilarska M, Tuleja M. 2012. Morphohistological and flow cytometric analyses of somatic embryogenesis in Trifolium nigrescens Viv. Plant Cell, Tissue and Organ Culture (PCTOC) 109:131−41

    doi: 10.1007/s11240-011-0081-x

    CrossRef   Google Scholar

    [101]

    Larkin PJ, Scowcroft WR. 1981. Somaclonal variation—a novel source of variability from cell cultures for plant improvement. Theoretical and Applied Genetics 60:197−214

    doi: 10.1007/BF02342540

    CrossRef   Google Scholar

    [102]

    Bairu MW, Aremu AO, Van Staden J. 2011. Somaclonal variation in plants: causes and detection methods. Plant Growth Regulation 63:147−73

    doi: 10.1007/s10725-010-9554-x

    CrossRef   Google Scholar

    [103]

    D'Amato F. 1990. Somatic nuclear mutationsin vivo and in vitro in higher plants. Caryologia 43:191−204

    doi: 10.1080/00087114.1990.10796998

    CrossRef   Google Scholar

    [104]

    Evans DA, Sharp WR, Medina-Filho HP. 1984. Somaclonal and gametoclonal variation. American Journal of Botany 71:759−74

    doi: 10.2307/2443467

    CrossRef   Google Scholar

    [105]

    Sahijram L, Soneji JR, Bollamma KT. 2003. Analyzing somaclonal variation in micropropagated bananas (Musa spp.). In Vitro Cellular & Developmental Biology - Plant 39:551−56

    doi: 10.1079/IVP2003467

    CrossRef   Google Scholar

    [106]

    Dhed'a D. 1992. Culture de suspensions cellulaires embryogèniques et règènèration en plantules par embryogènèse somatique chez le bananier et le bananier plantain (Musa spp.). PhD Thesis. KU Leuven, Belgium

    [107]

    Côte FX, Domergue R, Monmarson S, Schwendiman J, Teisson C, et al. 1996. Embryogenic cell suspensions from the male flower of Musa AAA cv. Grand nain. Physiologia Plantarum 97:285−90

    doi: 10.1034/j.1399-3054.1996.970211.x

    CrossRef   Google Scholar

    [108]

    Bairu MW, Fennell CW, van Staden J. 2006. The effect of plant growth regulators on somaclonal variation in Cavendish banana (Musa AAA cv. 'Zelig'). Scientia Horticulturae 108:347−51

    doi: 10.1016/j.scienta.2006.01.039

    CrossRef   Google Scholar

    [109]

    Xu C, Panis B, Strosse H, Li H, Xiao H, et al. 2005. Establishment of embryogenic cell suspensions and plant regeneration of the dessert banana 'Williams' (Musa AAA group). The Journal of Horticultural Science and Biotechnology 80:551−56

    doi: 10.1080/14620316.2005.11511972

    CrossRef   Google Scholar

    [110]

    Torres JL, Kosky RG, Pérez NM, Alvarez DR, Cabrera AR, et al. 2012. New explant for somatic embryogenesis induction and plant regeneration from diploid banana ('Calcutta 4', Musa AA). Biotecnología Vegetal 12:25−31

    Google Scholar

    [111]

    Sidha M, Suprasanna P, Bapat VA, Kulkarni UG, Shinde BN. 2007. Developing somatic embryogenic culture system and plant regeneration in banana. BARC Newsletter 285:153−61

    Google Scholar

    [112]

    Ali M, Abbasi BH, Ihsan-ul-haq. 2013. Production of commercially important secondary metabolites and antioxidant activity in cell suspension cultures of Artemisia absinthium L. Industrial Crops and Products 49:400−6

    doi: 10.1016/j.indcrop.2013.05.033

    CrossRef   Google Scholar

    [113]

    Tripathi JN, Oduor RO, Tripathi L. 2015. A high-throughput regeneration and transformation platform for production of genetically modified banana. Frontiers in Plant Science 6:1025

    doi: 10.3389/fpls.2015.01025

    CrossRef   Google Scholar

    [114]

    Ribeiro LO, Paiva LV, Pádua MS, Santos BR, Alves E, et al. 2012. Morphological and ultrastructural analysis of various types of banana callus, cv. Prata anã. Acta Scientiarum Agronomy 34:423−29

    doi: 10.4025/actasciagron.v34i4.14501

    CrossRef   Google Scholar

    [115]

    Aspuria ET, de Juras RJC. 2009. Plantlet regeneration from cell suspension cultures of banana cv. Saba via somatic embryogenesis. Philippine Journal of Crop Science 34:1−12

    Google Scholar

    [116]

    Cronauer SS, Krikorian AD. 1986. Banana (Musa spp.). Trees 1: 233

    [117]

    Krikorian AD. 1996. Strategies for "minimal growth maintenance" of cell cultures: a perspective on management for extended duration experimentation in the microgravity environment of a space station. The Botanical Review 62:41−108

    doi: 10.1007/BF02868920

    CrossRef   Google Scholar

    [118]

    Dhed'a DB, Dumortier F, Panis B, Vuylsteke D. 1991. Plant regeneration in cell suspension cultures of the cooking banana cv. Bluggoes' (Musa spp. ABB group). Fruits 46:125−35

    Google Scholar

    [119]

    Meenakshi S, Shinde BN, Suprasanna P. 2011. Somatic embryogenesis from immature male flowers and molecular analysis of regenerated plants in banana 'Lal Kela' (AAA). Journal of Fruit and Ornamental Plant Research 19:15−30

    Google Scholar

    [120]

    Elayabalan S, Kalaiponmani K, Pillay M, Chandrasekar A, Selvarajan R, et al. 2013. Efficient regeneration of the endangered banana cultivar Virupakshi AAB via embryogenic cell suspension from immature male flowers. African Journal of Biotechnology 12:563−69

    Google Scholar

    [121]

    Khalil S, Cheah K, Perez E, Gaskill D, Hu J. 2002. Regeneration of banana (Musa spp. AAB cv. Dwarf Brazilian) via secondary somatic embryogenesis. Plant Cell Reports 20:1128−34

    doi: 10.1007/s00299-002-0461-0

    CrossRef   Google Scholar

    [122]

    Karintanyakit P, Suvittawat K, Chinachit W, Silayoi B, Saratultad P. 2014. The impact of genome and 2, 4-d on callus induction from immature male flowers of seven banana cultivars. Acta Horticulturae 1027:253−55

    doi: 10.17660/actahortic.2014.1024.33

    CrossRef   Google Scholar

    [123]

    Morais-Lino LS, Almeida Santos-Serejo J, Amorim EP, de Santana JRF, Pasqual M, et al. 2016. Somatic embryogenesis, cell suspension, and genetic stability of banana cultivars. In Vitro Cellular & Developmental Biology - Plant 52:99−106

    doi: 10.1007/s11627-015-9729-2

    CrossRef   Google Scholar

    [124]

    Morais-Lino LS, Almeida dos Santos-Serejo J, de Oliveira e Silva S, de Santana JRF, Kobayashi AK. 2008. Cell suspension culture and plant regeneration of a Brazilian plantain, cultivar Terra. Pesquisa Agropecuária Brasileira 43:1325−30

    doi: 10.1590/s0100-204x2008001000010

    CrossRef   Google Scholar

    [125]

    Navarro C, Escobedo RM, Mayo A. 1997. In vitro plant regeneration from embryogenic cultures of a diploid and a triploid, Cavendish banana. Plant Cell, Tissue and Organ Culture 51:17−25

    doi: 10.1023/A:1005965030075

    CrossRef   Google Scholar

    [126]

    Wei Y, Yang H, Huang B, Huang X, Huang X, et al. 2007. Effects of picloram, ABA and TDZ on somatic embryogenesis of banana. Acta Horticulturae Sinica 34:81−86

    doi: 10.16420/j.issn.0513-353x.2007.01.017

    CrossRef   Google Scholar

    [127]

    Strosse H, Schoofs H, Panis B, Andre E, Reyniers K, et al. 2006. Development of embryogenic cell suspensions from shoot meristematic tissue in bananas and plantains (Musa spp.). Plant Science 170:104−12

    doi: 10.1016/j.plantsci.2005.08.007

    CrossRef   Google Scholar

    [128]

    Sadik K, Arinaitwe G, Rubaihayo PR, Kiggundu A, and Mukasa SB. 2014. TDZ and 4-CPPU in Gamborg B5 salts with ms vitamins doubles embryogenic response from male flowers of EA-AAA banana. African Crop Science Journal 22:191−203

    Google Scholar

    [129]

    Novak FJ, Afza R, Van Duren M, Perea-Dallos M, Conger BV, et al. 1989. Somatic embryogenesis and plant regeneration in suspension cultures of dessert (AA and AAA) and cooking (ABB) bananas (Musa spp.). Bio/Technology 7:154−59

    doi: 10.1038/nbt0289-154

    CrossRef   Google Scholar

    [130]

    Jalil M, Khalid N, Yasmin Othman RY. 2003. Plant regeneration from embryogenic suspension cultures of Musa acuminata cv. Mas (AA). Plant Cell, Tissue and Organ Culture 75:209−14

    doi: 10.1023/A:1025814922547

    CrossRef   Google Scholar

    [131]

    Grapin A, Ortíz JL, Lescot T, Ferrière N, Côte FX. 2000. Recovery and regeneration of embryogenic cultures from female flowers of False Horn Plantain. Plant Cell, Tissue and Organ Culture 61:237−44

    doi: 10.1023/A:1006423304033

    CrossRef   Google Scholar

    [132]

    Khalil SM, Elbanna AAM. 2004. Highly efficient somatic embryogenesis and plant regeneration via suspension cultures of banana (Musa spp.). Arab Journal of Biotechnology 7:99−110

    Google Scholar

  • Cite this article

    Cruz MA, Alcasid C, Silvosa-Millado CS, Balendres MA. 2024. Culture conditions for somatic embryogenesis in banana: brief review of the current practices, advantages, and constraints. Technology in Horticulture 4: e016 doi: 10.48130/tihort-0024-0013
    Cruz MA, Alcasid C, Silvosa-Millado CS, Balendres MA. 2024. Culture conditions for somatic embryogenesis in banana: brief review of the current practices, advantages, and constraints. Technology in Horticulture 4: e016 doi: 10.48130/tihort-0024-0013

Figures(2)  /  Tables(5)

Article Metrics

Article views(2667) PDF downloads(572)

REVIEW   Open Access    

Culture conditions for somatic embryogenesis in banana: brief review of the current practices, advantages, and constraints

Technology in Horticulture  4 Article number: e016  (2024)  |  Cite this article

Abstract: Banana (Musa spp.) is a high-value cash crop that serves as a staple food across Asia. However, numerous pests and diseases challenge the global production of bananas. The advent of advanced molecular technologies, such as plant tissue culture, played a pivotal role in banana production with enhanced physiology, morphology, and disease resistance. Since then, researchers and agricultural industries' interest has shifted to using plant tissue culture for the large-scale production of bananas. The production of somatic embryos from plant tissues, termed somatic embryogenesis (SE), is often utilized as an asexual means of reproducing banana plantlets with uniform genotypic characteristics. Various studies have also demonstrated the function of somatic embryogenesis for genetic transformation studies. However, the efficiency of SE protocols differs from one genotype to another. It is affected by several factors, including the type of explant, culture media, plant growth regulators, and environmental conditions. This review will summarize the current methodologies for performing SE in banana. In addition, the advantages and constraints of performing SE protocols were discussed.

    • Bananas (Genus Musa, family Musacaea) are herbaceous perennial monocots grown in more than 150 countries worldwide[1]. In the Philippines, banana accounts for around 17.2% of the total agricultural exports[2]. Cavendish bananas remain the primary cultivar grown commercially, accounting for 53.2% of the total production in the Philippines, followed by Lakatan (16.8%) [1] and Cardaba (14%)[2]. Commercial bananas, including the Cavendish group, are generally seedless and sterile[3]. Large-scale propagation of banana is therefore highly dependent on using vegetative planting materials- sword suckers, rhizomes, and bits- that potentially carry disease-causing microorganisms[4]. Throughout the years, various methods have been explored for banana production via plant tissue culture. The process allows the propagation of thousands of plantlets from a small amount of planting material. Shoot tip cultures and sword suckers are used primarily for in vitro propagation of true-to-type and disease-free plantlets. However, increased production of off-types has been observed using these methods[5].

      Somatic embryogenesis is another important means of plant production. It is defined as the asexual reproduction of plants from somatic embryos[6]. The success of the technology relies on the potential of cells for totipotency: the ability of a single cell to divide and undergo differentiation[7]. Somatic embryo formation is based on dedifferentiation in plants and the plants ability to reinitiate cell division. Somatic embryos may be induced using direct or indirect methods. Indirect embryogenesis, unlike direct, involves an intermediate callus phase from organized tissues[8]. Studies have reported the establishment of direct somatic embryogenesis, but low plant conversion rates were observed (for example, Remakanthan et al.[9]). Panis et al. reported direct somatic embryogenesis from protoplast cultures[10]. Recently, the use of shoot-tip cultures has been reported[9]. Here, the indirect production of somatic embryos from callus cultures were the focus.

      Somatic embryogenesis was first described in carrot (Daucus carota) cells in culture[11]. Although initially investigated for micropropagation of plants, somatic embryogenesis is also utilized for gene expression programs and genetic transformation to improve quality and disease resistance[12]. Genetic transformation using somatic embryos has been proven to minimize the formation of chimeric plantlets[13]. In plant breeding, somatic embryogenesis shortens the breeding cycle[14]. The protocol is also primarily used for cryopreservation of Musa germplasms[15].

      Several cultivars of banana, especially those belonging to the Cavendish subgroup, have been propagated from somatic embryogenesis (Table 1). The protocol for somatic embryogenesis in bananas is standardized using different types of explants. However, low embryo germination and plant conversion rates remain a concern[13]. Other issues include the labor-intensive optimization of culture medium, high production costs, and the formation of off-types[16]. Nevertheless, somatic embryogenesis has been exploited to generate planting materials that are of value and disease-free. Several of these methods have been scaled up to commercial laboratories and some for the protection and preservation of commercial banana cultivars that are under threat of extinction[17,18]. Studies have reported the use of somatic embryogenesis in banana but few have focused on the different culture conditions for growth. This review explored the different culture conditions used for somatic embryogenesis in banana and some of their advantages and constraints.

      Table 1.  Cultivars with successful embryogenic callus (EC) and cell suspension (ECS) protocols.

      Cultivar Genetic group Explants used EC ECS Ref.
      Calcutta 4 AA Scalps
      Axillary buds
      x x [110]
      Lakatan AA Shoot tips x x [30]
      Highgate AAA Scalps x [47]
      Yangambi km5 AAA Immature flowers x [90]
      Williams AAA Scalps
      Immature flowers
      x x [47,109,16,
      92,113]
      Grand Nain AAA Scalps
      Immature flowers
      Shoot tips
      x x [37,47,111,
      112,39,92,9]
      Nanicão AAA Leaf sheath disks x [27]
      Gros Michel AAA Immature flowers x x [90,113]
      Lady finger AAB Scalps x [47]
      Prata AAB Scalps x [47,114]
      Saba ABB Immature flowers
      Scalps
      x x [106,115]
      Cardaba ABB Scalps, shoot tips x [106,116,117]
      Bluggoe ABB Shoot tips
      Scalps
      x x [26,118]
    • Somatic embryogenesis is an elaborate and complex process involving the production of a whole new plant from unorganized cells. The process is generally comprised of five stages: selection of suitable explant, production of embryogenic callus, development of somatic embryos from cell suspensions, regeneration of viable cells into plantlets, and field monitoring of acclimatized plants (Fig. 1). Each developmental stage requires different nutritional and environmental conditions for growth and is controlled by several factors including endogenous hormones, proteins, and transcription factors[19].
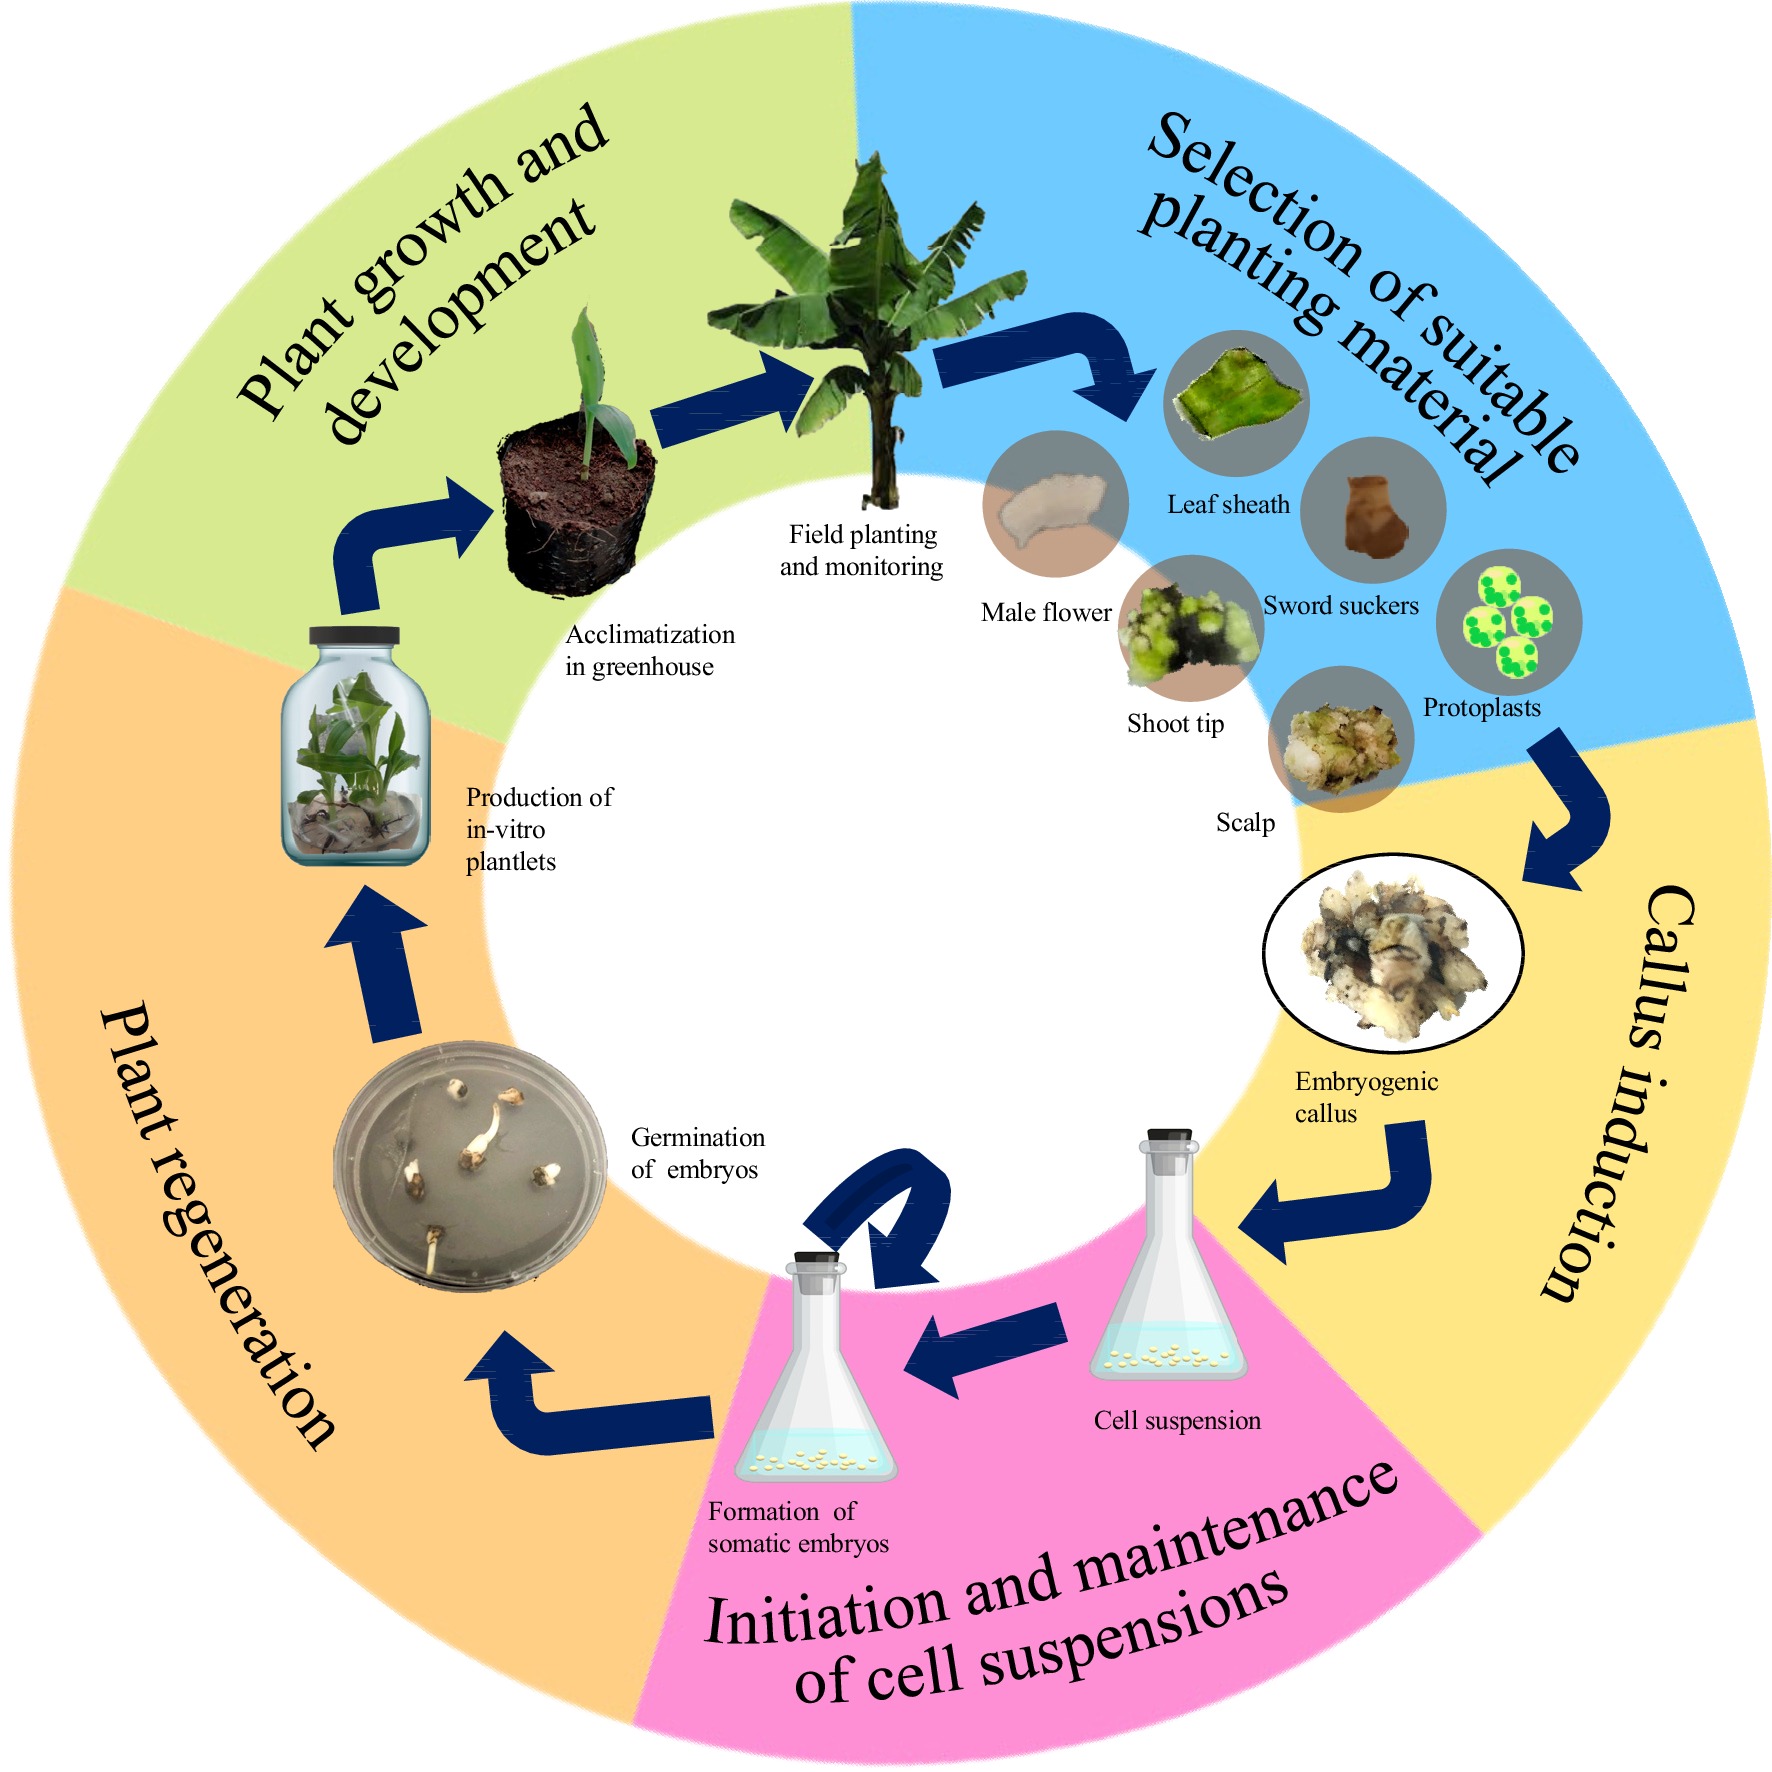
      Figure 1. 

      Flowchart showing the different stages of somatic embryogenesis in banana.

    • The quality and volume of embryogenic callus are crucial for implementing the subsequent steps in somatic embryogenesis[16]. A callus is a mass of unorganized cells naturally found in plants that form in response to stress and wounding[6]. Callus formation in plants is highly controlled by abiotic (light condition, pH and osmotic pressure, sugar content) and biotic (explant age and size, genotype, phytohormones) stimuli[20]. Callus formation differs between monocots and dicots and between diploid and triploid species[21,22]. Pathogen infection also leads to callus formation in plants through auxin and cytokinin production[23].

      Callus forms may vary from one set-up to another and can be differentiated based on macroscopic characteristics[20]. Generally, four types of calli can be observed in banana cultures: white and compact (Fig. 2a), clear and friable (Fig. 2b), yellow nodular (Fig. 2c), and ideal callus with translucent proembryos (Fig. 2d). Out of these four, only the ideal callus with translucent proembryos can regenerate and develop into a whole new plant[20]. The translucent proembryos contain differentiated and competent cells that enable plant organogenesis and regeneration[24]. Meanwhile, the white and compact, clear and friable, and yellow nodular calli are all non-embryogenic and non-regenerative types that may be used for further biotechnological studies such as metabolite production and cell suspensions[24,25]. In some cases, shoots and roots may form alongside these non-embryogenic calli that also have the potential to develop into new plants[20].
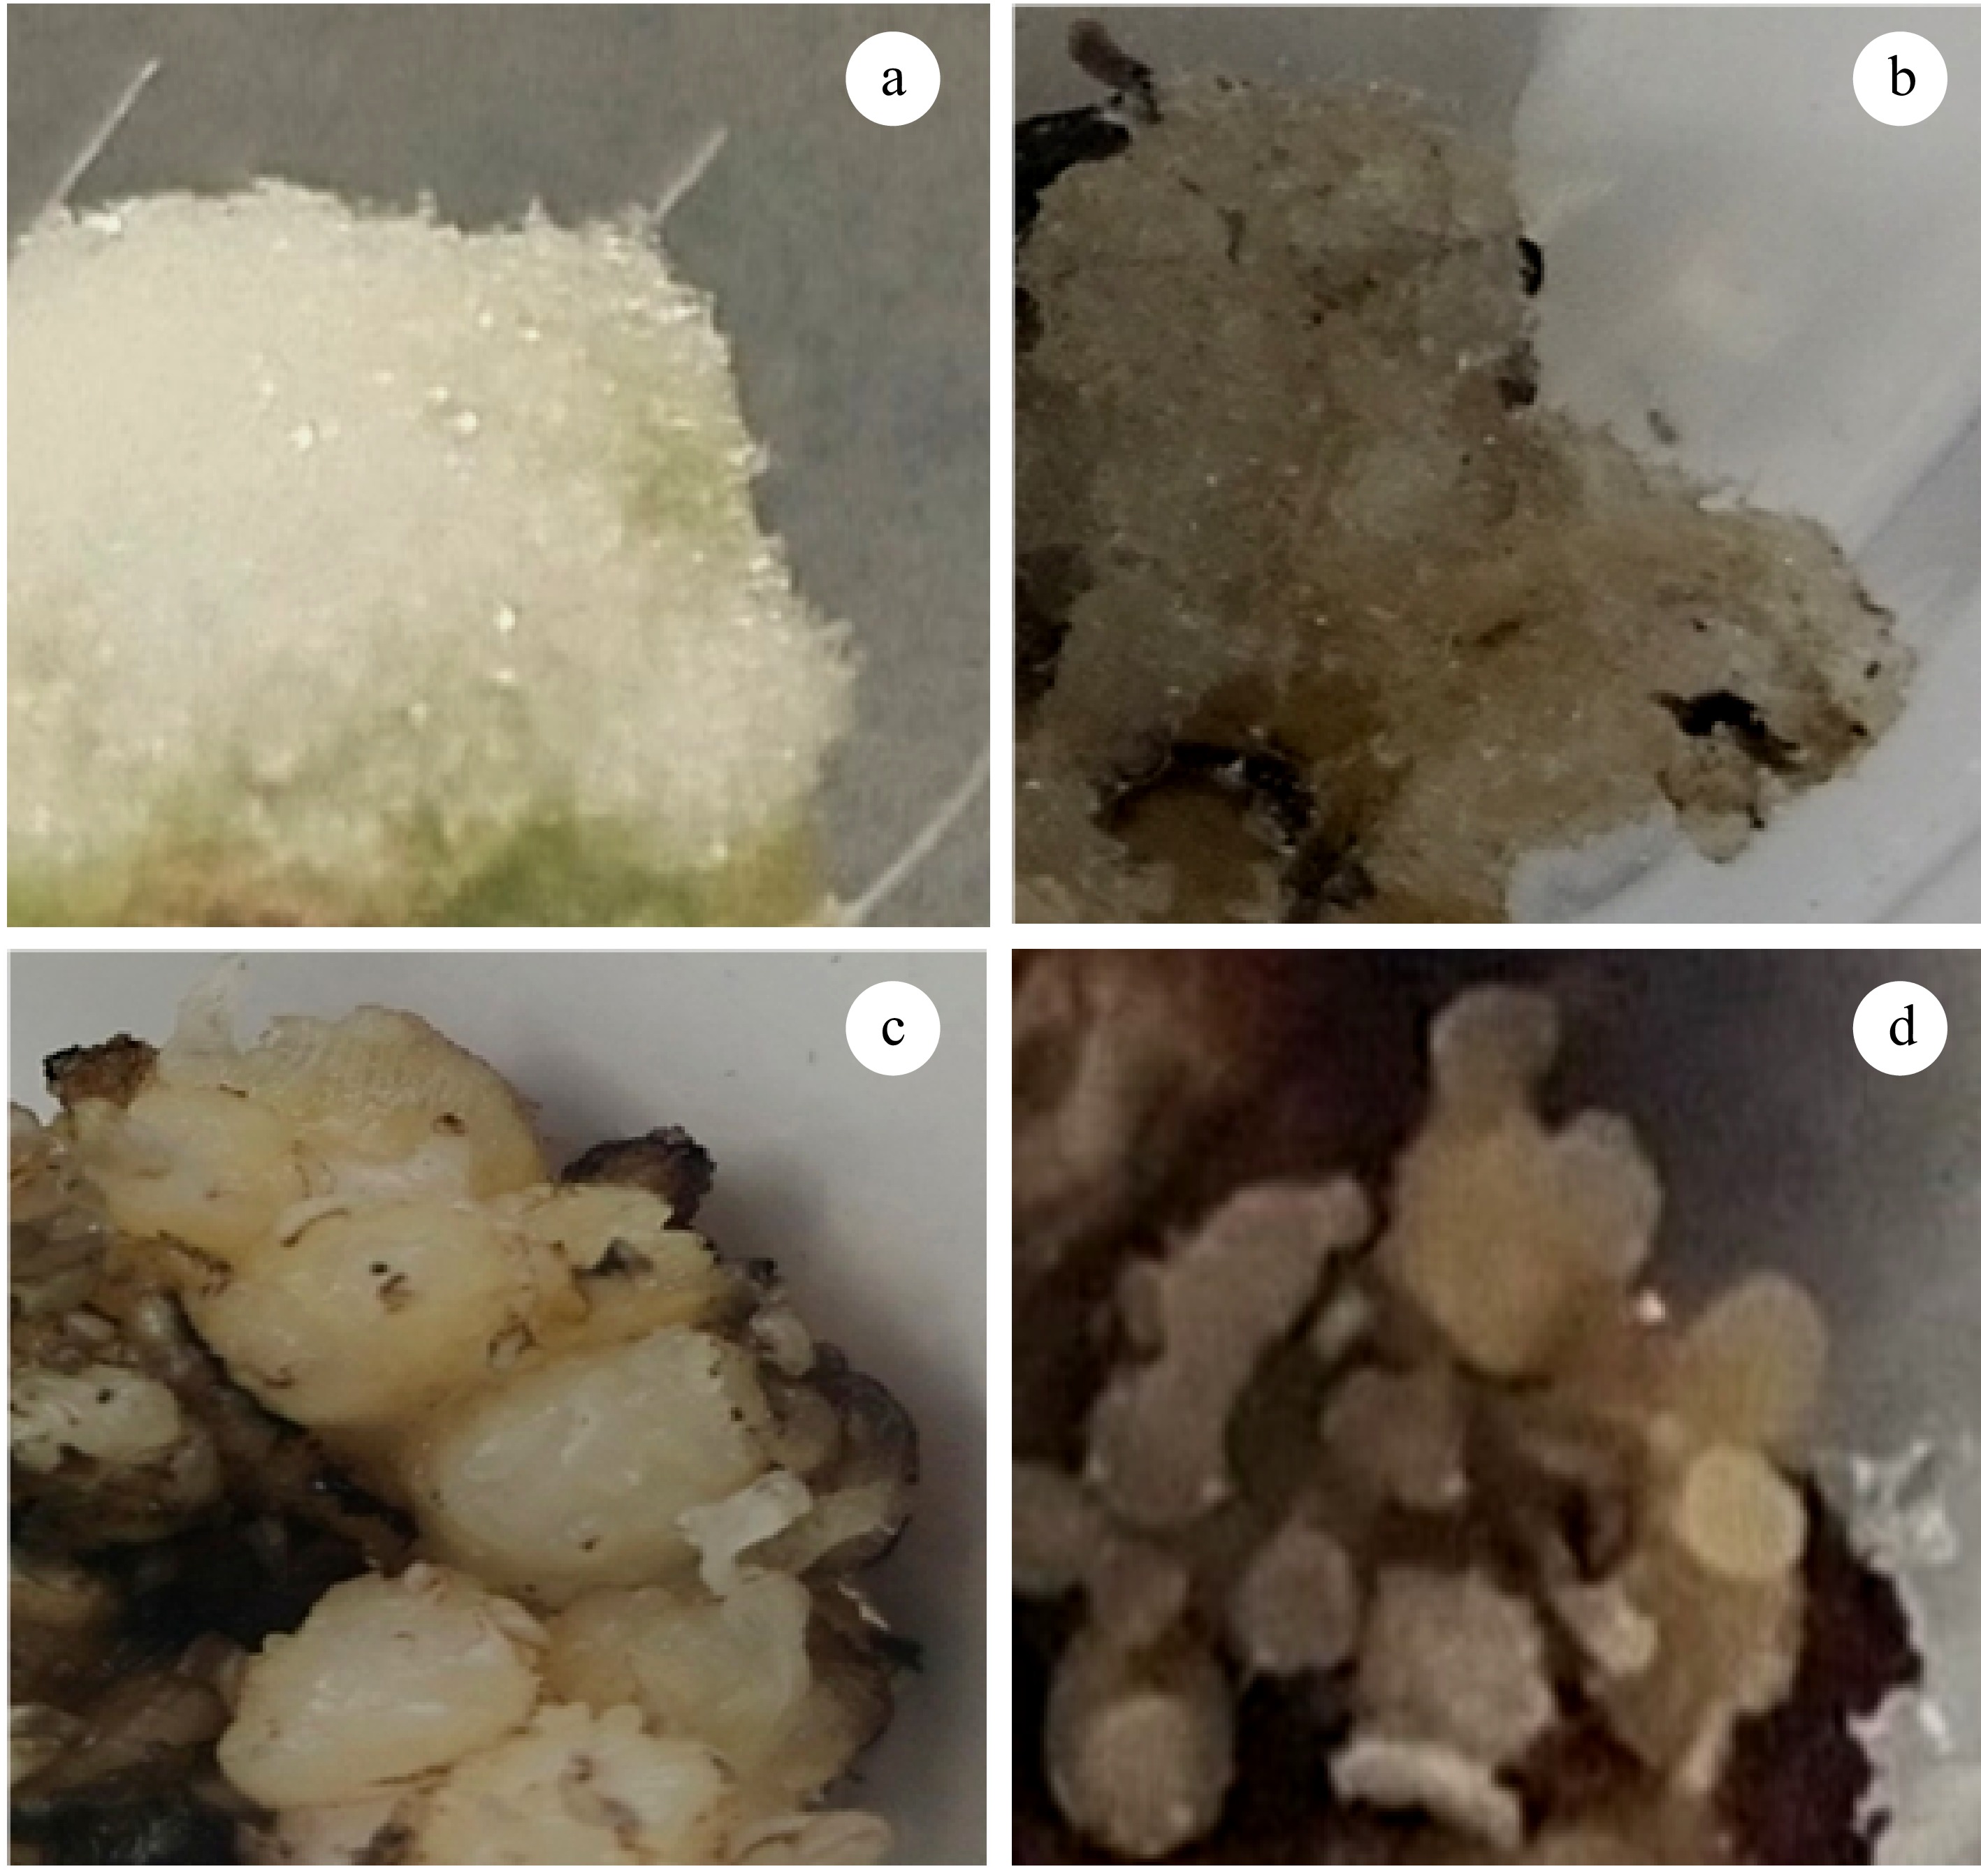
      Figure 2. 

      Types of callus formed in banana: (a) white and compact (non-embryogenic), (b) clear and friable, (c) non-embryogenic yellow nodular, and (d) ideal callus with translucent proembryos.

      Scalps (meristematic tissues with cauliflower-like structure) and immature flowers (male and female inflorescence) are the two most commonly used explants in banana[16]. However, shoot-tips[26], leaf sheaths[27], sword suckers[28], and protoplasts[29] from tissue-cultured plantlets have also been reported. Callus induction may take from 8 weeks to 8 months, depending on the type of explant used. The formation of callus cultures from scalps take the longest, with 6 months average induction time[16]. Induction of embryogenic callus in 12 weeks has been observed from shoot tips[30], sword suckers[28], and immature flowers[20,31]. Callus induction from protoplast cultures are initiated in about three weeks[3,32]. However, it is usually derived from established cell suspensions[29].

      Somatic embryogenesis relies on the exogenous application of auxins and cytokinins to promote in-vitro callus induction in plants[16,33]. The combination of callus induction hormones differs from the type of explant used (Table 2). Commonly used auxins for callus initiation are 2,4-dichloro phenoxy acetic acid (2,4-D), indoleacetic acid (IAA), naphthalene acetic acid (NAA), 3,6 dichloro-2 methoxybenzoic acid (Dicamba) and picloram. These may be prepared with cytokinins such as kinetin (KIN), 6-benzyl amino purine (BAP), and zeatin. Brassinosteroids and abscisic acid (ABA) also induce callus formation in some plant species[34,35]. Thidiazuron (TDZ), a hormone with both cytokinin and auxin effects on plants, was also found to induce callus formation in banana[36].

      Table 2.  Synthetic hormones commonly used for embryogenic callus induction in Musa spp.

      Explant used Hormones tested (mg/L) Ref.
      2,4-D IAA NAA KIN 2iP BAP TDZ 4-CPPU ZEATIN Picloram Dicamba
      Immature flowers 2−6 1 1 [107,121,16,111,
      92,82,119,120,
      122,52,123,39]
      2−9 [62,37,125,16,112,13]
      2 [126]
      2 0.5−1 [111]
      1 0.22 [54]
      Scalps 1 0.22 [106,118,127,115,109,
      114,54,113,110,48]
      2−2.9 2.2−3.2 [128]
      6.4 [128]
      5.7 [128]
      Shoot tips 0.05 1 [9]
      0.1−4 [9]
      Leaf sheaths & rhizomes 6.63 [129]
      Protoplasts 2 [29]
      Leaf sheath disks 1.1 6.64 [22]
      100 100 [27]
      Sword suckers 0.5-2 0.5 [28]

      Optimum hormone levels for callus induction in banana vary from one genotype to another. For auxins, concentrations range from 0.2 to 4 mg/L when used alongside cytokinins and 4 to 9 mg/L if treated alone. Cytokinins, at 0.5 to 1.0 mg/L, are combined with auxins for callus induction. In addition, culture additives such as amino acids (e.g. proline, glutamine, methionine, tryptophan), sugars (e.g., sucrose, maltose, myo-inositol), and vitamins (e.g., biotin) also support callus induction in banana[22,3740].

      Light exposure also affects callus formation in banana. In numerous studies, callus formation was frequently performed under dark conditions. One study found that light exposure is positively correlated with tissue browning due to increased physiological activity[22]. Hence, the dark treatment seems to prevent necrosis caused by photooxidative stress[41]. Color change of medium is also frequently encountered and can be resolved using gerlite as a gelling agent[22]. Blackening or browning of tissues due to the wounding of explant can be minimized by subculture every two weeks[16]. The addition of antioxidants such as ascorbic acid[42], citric acid[43], cysteine[44], activated charcoal[43], polyvinylpyrrolidone (PVP)[45], potassium citrate, and citrate[46] have been proven to prevent explant browning in banana. It is challenging to optimize culture conditions and culture medium composition due to the extremely low amount of good embryogenic material available for use. Usually, young banana suspensions require a high inoculum density and frequent transfer to a new medium (every three to seven days) during the first few months[47]. In Grand Nain, only 3% to 10% of embryogenic calli (EC) were formed from scalps and 8% from immature flowers[16]. But for other species, % EC can reach up to 97%[48]. The embryogenic potential of callus is also expected to decrease over long periods of incubation[9,21].

    • Somatic embryos are clones of the parent material formed in response to the changing culture conditions of the explant[49]. Unlike sexual structures (zygotic embryos), somatic embryos form in response to the drastic reduction of auxin levels after exposure to callus cultures[7]. Somatic embryos possess a bipolar structure that allows the formation of both apical and radical meristems where shoot and root structures initiate, respectively[13]. Depending on the cultivar, embryos generally form in 3 to 8 months[47].

      Complex processes are known to affect somatic embryogenesis in banana. Kumaravel et al. have characterized 25 endogenous proteins in banana associated with somatic embryo formation[40]. Several studies have further explored the involvement of genetic transcription factors in growth[21,5052]. The addition of cytokinins, alternation of physiological state (pH), and heat shock are known drivers of somatic embryogenesis[21,53]. Reduction of MS salts to half strength and exposure to dark conditions to reduce osmotic pressure and prevent phenolic oxidation, respectively have also been frequently performed in established ECS protocols but the underlying principle remains poorly understood[47,48,54]. In cassava (Manihot esculenta), the use of half and quarter-strength MS resulted in enhanced viability and formation of somatic embryos compared to full-strength MS medium[55]. On the other hand, Groll and co-workers reported a higher formation of mature somatic embryos in full-strength MS[56].

      There are four main stages in the formation of somatic embryos- globule stage, oblong stage, heart stage, and torpedo stage- a developmental process shared with zygotic embryos that can be differentiated through distinct cell shape formation[12,57,58]. The first stage, the globular stage, is achieved through the establishment of embryogenic cell suspensions (ECS). Banana ECS protocols vary with the explant used for callus formation (Table 3) and are established by transferring the embryogenic callus into a (liquid) medium with reduced auxin levels or callus-induction medium devoid of agar; most with added amino acids (e.g. L-glutamine and malt extract) that function for metabolism and protein synthesis (Table 4)[13,16,59,60]. For instance, L-glutamine and proline were found to enhance the plant regeneration efficiency of banana (Musa acuminata cv. Berangan)[61]. Scalp-derived ECS utilizes a uniform concentration of exogenous growth regulators (e.g., 2,4-D and zeatin) during induction and multiplication phases[16]. For the immature flower method, somatic embryo expression is enhanced by reducing auxin concentration[59,60,62]. The continued presence of auxin drives the synthesis of gene products necessary to complete the globular stage through increased DNA demethylation[63,64].

      Table 3.  Culture media used for formation of somatic embryos in banana.

      ComponentsMA2ZZ1M2bECS1BM2SK4SS2IM1
      Macro-elementsMS1/2MS1/2MS1/2MSMSMSMSSH
      MicroelementsMSMSMSMSMSMSMSSH
      VitaminsMAMSDhed'aMSMSMSMSMS
      FeEDTA+
      2,4-D (mg/L)1111
      Picloram0.11
      Zeatin (mg/L)0.2190.2190.219
      BAP (mg/L)0.05
      Coconut water (%)10
      Biotin (mg/L)11
      Casein hydrolysate200
      Ascorbic acid (mg/L)101010
      Malt extract (mg/L)100100100100100
      Amino acidsGlutamine
      100 g/L
      Glutamine
      100 mg/L
      Proline
      4 mg/L
      Glutamine
      100 mg/L
      Glutamine
      100 mg/L
      Glutamine
      100 mg/L
      SugarSaccharose
      45 g/L
      Sucrose
      30 g/L
      Sucrose
      20 g/L
      Sucrose
      30 g/L
      Sucrose
      45 g/L
      Sucrose
      30 g/L
      Sucrose
      30 g/L
      Sucrose
      30 g/L
      pH5.35.85.85.85.35.85.85.8
      Cultivars testedGrand Nain, Tropical, Rasthali,Somrani monthan,
      High gate, Williams,
      Gros Michel, Lady
      finger, Prata
      Mas, Bluggoe,
      Saba, Cardaba
      Calcutta 4RajeliDwarf BrazilianGrand NainGrand Nain, Ardhapuri, Basrai, Shrimanti, Mutheli, Lalkela and
      Safed Velchi
      Ref.[39,107,90,131,52][39,54,113,48][118,130,115][110][82][121][9][111]
      Ma2, M2b, BM2, SK4, IM1-immature flower method; ECS1, ZZI-scalps method; SS2-split shoot tips.

      Table 4.  Culture media used for somatic embryo maturation in banana.

      ComponentsMA3RD1BM3SK8MMSS3IM2M3b
      Macro-elementsSH1/2MSSH1/2MSSHMSSHMS
      MicroelementsSHMSSHMSMSMSSHMS
      VitaminsMAMSMSMSMSMSMSMS
      FeEDTA+
      2,4-D (mg/L)1
      BAP (mg/L)50.050.05
      IAA (mg/L)0.2
      NAA (mg/L)0.20.2
      Zeatin (mg/L)0.050.05
      Kinetin (mg/L)0.10.1
      2iP (mg/L)0.2
      Picloram (mg/L)0.1
      Myo-inositol (mg/L)100100
      Biotin (mg/L)1
      Ascorbic acid (mg/L)10
      Malt extract (mg/L)100100100100
      Amino acidsGlutamine
      100 mg/L
      Proline
      230 mg/L
      Glutamine
      100 mg/L
      Glutamine
      100 mg/L
      SugarSaccharose
      45 g/L
      Sucrose
      30 g/L
      Sucrose
      45 g/L
      Sucrose
      30 g/L
      Saccharose
      45 g/L
      Sucrose
      30 g/L
      Sucrose
      30 g/L
      Sucrose
      30 g/L
      Gelling agent (g/L)Phytagel
      4 g/L
      Gelrite
      3 g/L
      Gelrite
      2 g/L
      Phytagel
      2.6 g/L
      Gelrite
      2 g/L
      Gelrite
      3 g/L
      pH5.85.85.85.85.85.85.85.8
      Cultivars testedGrand Nain, Gros Michel, WilliamsGrand Nain, Calcutta 4,
      Somrani monthan,
      High gate, Williams,
      Lady finger, Prata
      Rajeli, Grand
      Nain, Tropical
      Dwarf BrazilianGrand Nain; RasthaliGrand NainGrand Nain, Ardhapuri, Basrai, Shrimanti,
      Mutheli, Lalkela,
      Safed Velchi
      Bluggoe, Saba,
      Cardaba
      Ref.[39,107,125][47,110,54,113][82,123,124][121,132][125,16,52][9][111][118,115]
      Ma3, BM3, SK8, MM , IM2, M3b-immature flower method; RDI-scalps method; SS3-split shoot tips.

      At the globular stage, the pro-embryos also contain other mRNAs and proteins that generally inhibit the continuation of embryogenesis[11]. The removal of auxin is believed to result in the inactivation of these genes necessary to enter the next embryogenic growth stage[50]. Guzzo et al. proposed a model linking auxin response, asymmetric division, and totipotency: upon environmental stimuli, cells can be made morpho-genetically totipotent in response to auxin if the cells contain inducible receptors to complete embryogenesis; but only organogenesis or unorganized proliferation will occur otherwise[65]. Cytokinins, in minute concentrations, may also affect the sensitivity of somatic embryogenesis and cell division, but their molecular basis remains unknown[66,67].

      The globular embryo then enters the oblong stage, signaling the shift from isodiametric to bilaterally symmetrical growth, followed by the beginning of the heart stage[68]. This globular-to-heart embryot ransition is pronounced by the outgrowth of the two cotyledons, hypocotyl elongation, and radicle initiation[11]. Finally, the embryo enters the torpedo stage, a stage with a distinct increase in size, before reaching full maturity[68]. Sometimes, immature embryos formed from callus cultures may undergo differentiation, and this can be prevented through high osmotic pressure and the addition of abscisic acid[21]. Removal of bigger aggregates of, more developed, somatic embryos is recommended because they have the tendency to accumulate starch and produce high amounts of polyphenols[47].

      Water stress is one of the most important factors for somatic embryo maturation[69]. During maturation, embryos undergo gradual loss of water and initiate desiccation tolerance to survive[7072]. Available ECS protocols regulate water availability to the developing somatic embryos through high concentrations of gelling gum or overlaid filter paper[13]. Studies suggest the involvement of early response to dehydration proteins (ERDs) in embryo maturation[73]. Oxygen availability and pH of the culture medium also affect embryo maturation. High levels of oxygen have been shown to promote somatic embryo multiplication while low levels result in histodifferentiation[74]. The optimum pH for embryo development is pH 5.8, but relatively lower quality and irregular embryos may also form at pH 4.5-5.5 and at pH 6.0 to 7.0[7577].

    • The germination of the somatic embryo into normal shoots, termed regeneration, is achieved primarily on culture medium in a genotype-dependent manner. Plants derived from embryogenic cell suspensions (ECS), called emblings, are highly dependent on ECS density and quality[50]. High cell density (105 cells/mL) is for embryogenic cell clusters formation from and lower cell density (2 × 10⁴ cells/mL) for embryo development originating from embryogenic cells[78,79]. Embling conversion rates vary within banana genotypes. For instance, 13% in the edible (AA) Pisang Mas and 13% to 25% for Grand Nain of the Cavendish subgroup (AAA)[80]. High regeneration rates (90% to 95%) from ECS cultures have been recorded for some triploid and diploid species such as cv. Dwarf Brasilian (AAB) and M. a. ssp. malaccensis (AA), both of which passed through a differentiation–maturation phase[13,81].

      Most commonly, BAP, at 0.2 to 3 mg/L concentrations, is used for plant regeneration[47,54,82]. Sometimes, BAP is complemented with other cytokinins (at 0.2 to 0.5 mg/L) for embryo germination (Table 5). These are supplemented with antioxidants such as activated charcoal and ascorbic acid to prevent browning and further support the regeneration of tissues[83]. Kumaravel and co-workers further investigated different concentrations of NAA (2.68, 5.37, and 10.74 μM) for the regeneration of banana somatic embryos with three (100 and 200 μM) and methionine (335.09, 670.19, and 1 mM) as additives[40]. They also tested various concentrations of CaCl2 (5, 10, and 15 mM) and gibberellic acid (GA3) (1.44, 2.88, and 5.77 μM) with 11.41 μM IAA and 2.21 μM BAP. In 'Grand Nain', media supplemented with 5.37 μM NAA + 1.44 μM GA3 showed the highest regeneration efficiency (91.0%). The lowest regeneration was recorded in the medium supplemented with 1 mM methionine in 'Rasthali', whereas 'Grand Nain' media with 200 μM showed the least germination. It was found that in 'Grand Nain', an increased concentration of IAA recorded the highest regeneration (24.28%), but relatively lower (showed 18.96%) in 'Red Banana' in kinetin-supplemented media. These results demonstrate that in banana, regeneration is not only genome-dependent but also cultivar-dependent. The observed overexpression of IAA monooxygenase in the emblings also showed that tryptophan-dependent auxin biosynthesis plays a key role in somatic embryo formation. El-Kereamy et al. previously reported the overexpression of these proteins in rice resulted in enhanced shoot formation due to increased biosynthesis of GA and cytokinin, whereas Patterson et al. reported the role of germination-related proteins for root hormone regulation in Arabidopsis[84,85]. These results suggested that the endogenous hormones stimulated the formation of pro-embryonic roots and shoots of somatic embryos. Furthermore, scientists discovered important genes affecting the morphogenesis of somatic embryos. Boutilier and co-workers described the role of the BABY BOOM1 (BBM1) gene for morphogenesis in coffee (Coffea canephora) embryogenesis, while the LEAFY COTYLEDON1 (LEC1) and WUSCHEL-RELATED HOMEOBOX4 (WOX4) genes are crucial in the initial phase of cell differentiation[8689]. Elhiti and co-workers further identified 12 candidate genes that play key roles in the early stages of somatic embryogenesis[6]. According to their study, epigenetic regulation occurs among the candidate genes involved.

      Table 5.  Culture conditions used for plant regeneration from somatic embryos of banana.

      ComponentsMA4RD2BM5SK10M4SS4IM3SB4
      Macro-elementsMS1/2 MSSHMSMSMS1/2 MSMS
      MicroelementsMSMSSHMSMSMSMSMS
      VitaminsMorelMSMSMorelMorelMorelMSMorel
      FeEDTA++
      IAA (mg/L)2.02
      BAP (mg/L)0.50.2270.520.4
      NAA (mg/L)0.5
      Zeatin (mg/L)2
      Myo-inositol (mg/L)100
      Ascorbic acid (mg/L)10
      Activated charcoal (%)0.5
      Lactose (g/L)0.1
      SugarSaccharose
      30 g/L
      Sucrose
      30 g/L
      Sucrose
      30 g/L
      Sucrose
      30 g/L
      Saccharose
      30 g/L
      Sucrose
      30 g/L
      Sucrose
      30 g/L
      Sucrose
      30 g/L
      Gelling agent (g/L)Phytagel
      3 g/L
      Gelrite
      3 g/L
      Gelrite
      3 g/L
      Phytagel
      2.6 g/L
      Gelrite
      2 g/L
      Gelrite
      3 g/L
      Gelrite
      2 g/L
      Gelrite
      2 g/L
      pH5.85.85.85.85.75.85.85.8
      Cultivars testedGrand Nain, Tropical, Rasthali, Calcutta 4Somrani monthan,
      High gate, Williams,
      Lady finger, Prata
      RajeliDwarf BrazilianMasGrand NainGrand Nain, Ardhapuri,Basrai, Shrimanti, Mutheli, Lalkela and
      Safed Velchi
      Bluggoe, Saba,
      Cardaba
      Ref.[39,107,125,110,52,123][47,54,113,48][82][121,130][13]
      [9][111][118,115]
      Ma4, BM5, SK10, IM3, SB4-immature flower method; RD2-scalps method; SS4-split shoot tips.
    • A common method for quantitative and qualitative assessment of callus induction is obtaining the percent formation of ideal callus (IC) calculated using the formula: %IC = the number of IC/number of inoculated explants. The %IC values obtained for 'Grand Nain' range between 3% to 10%, using the scalping method, and 8% on average, using the immature flower method[16]. But a higher callus induction percentage of 70% has been reported using sword suckers[28]. Qualitative assessment of IC can be performed by physical examination of the type of callus formed as previously mentioned above (Fig. 2).

    • According to Strosse and co-workers, the quality of an embryogenic cell suspension (ECS) can be primarily assessed according to the number of embryos/mL of plated cells[16]. It can be conveniently applied for analysis since it only requires a very small aliquot (1 mL) of the cell material[47]. The number of embryos/mL can yield between 100 to 300,000[60,90]. But only one out of two to one out of five embryonic calli will lead to a good quality ECS, characterized by bright to light yellow color with a high proportion of homogeneous embryogenic cell aggregates[91]. On the other hand, pale white suspensions are indicative of a high proportion of starch-rich and non-regenerable cells[16].

      ECS establishment can further be measured using the formula: % of ECS initiated = number of ECSs/number of IC placed in liquid medium or by counting the number of embryos formed per IC[13,39,92]. A cell viability test using fluorescein diacetate (FDA) is usually accompanied to determine ECS quality[93]. To perform the FDA test, add a few drops of fluorescein diacetate (FDA) stock (−20 °C, dissolved in acetone water) to distilled water until a blue shine is observed. Add 1 to 2 drops of this diluted stock to a suspension sample. Viable tissue fluorescence is brightly green when observed under ultra-violet light. Somatic embryos with an FDA score over 80% are considered to be viable and acceptable for regeneration.

      ECS quality declines with increased subcultures[18]. Subsequently, higher rates of subculture result in an increased probability of contamination and a decreased growth rate, regeneration capacity, and higher risk of somaclonal variation[13]. The increased contamination and regeneration can be owed to the fast-growing, dense, and starch-rich cells taking over the cultures[91]. To reduce these problems, cryopreservation protocols have been developed which allow the storage of ECSs for longer periods[10]. In addition, early detection of undesirable genetic variation in suspensions can be assessed using the flow cytometry method[94].

    • The regeneration rate of somatic embryos often describes the success of a somatic embryogenesis protocol. Hence, proper evaluation of a regeneration process is crucial for somatic embryogenesis. Strosse and co-workers suggested the following criteria for evaluation: % of germination (number of plantlets obtained/number of embryos in medium) and regeneration capacity (Regeneration capacity = number of in vitro plants produced/mL of plated cells)[16]. According to their study, the regeneration capacity of an ECS may further be assessed using the following morphometric assays: total weight of the regenerated embryos, the average number of green shoots 1.5 months after shoot emergence, and the average amount of rooted shoots 1.5 to 2 months after root initiation. The settled cell volume (SCV) (precipitation by gravity forces), packed cell volume (PCV) (precipitation by centrifugation), and fresh and dry weights were also described as determinants of regeneration capacity and growth rate.

      Subculture of regenerants (somaclones) is an important part of the regeneration stage to prevent the production of somaclonal variants[95]. The required number of cycles for the subculture of regenerated embryos (clones) depends on the genotype but usually ranges from 2 to 10 cycles[13]. The subcultured clones are then transferred to a rooting medium followed by acclimatization under greenhouse conditions before planting in the field[90]. Regenerated plantlets should be 6−8 cm tall before transplanting in the greenhouse[96]. High relative humidity (> 80%) and a temperature ranging from 19 to 30 °C are also required for growth under greenhouse conditions[97].

    • Somatic embryogenesis (SE) is essential in the development of in vitro regeneration systems which are critical steps for the development of resistant varieties[98]. Despite extensive studies in SE, low embryo regeneration rates, and somaclonal variation continue to be the bottlenecks of SE procedures in various banana embryogenic systems[90]. In 'Grand Nain', regeneration values reach as low as 8% under optimal conditions and less than 1% under non-optimal conditions[99]. Embryogenic responses of over 30% could be obtained, from scalps, for some plantain types and cooking bananas[47]. Recently, Youssef and co-workers recorded a high regeneration rate (80%) of 'Grand Nain' from male flower buds[92].

      The in vitro culture environment, the type (and concentration) of plant growth regulators (PGRs), the plant's genetic background and the number and duration of subcultures can also affect the properties of plants regenerated by somatic embryos, contributing to the generation of genetic and epigenetic variation[100]. This variation is apparent in the culture's phenotype, more popularly known as somaclonal variation was thought to be a pre-existent genetic variation in the explant due to changes in chromosome structure, chromosome numbers such as polyploidy and aneuploidy, or induced during in vitro culture[101104]. These genetic variations may be detected based on plant morphology (e.g. plant height, size, and number of hands) and using advanced DNA markers (e.g. ISSR, SSR, RAPD, SNP)[105].

      Dhed'a observed 5%−10% abnormal somatic embryos recovered from a 'Bluggoe' (ABB, cooking banana) suspension derived from the scalp with only one off-type (0.7%) found with phenotypic changes[106]. Grapin and co-workers reported 16%−22% somaclonal variants regenerated from a 'French Sombre' (AAB, plantain) male flower-derived suspension[90]. Côte and co-workers reported 'variegated' plants with 'double' leaves (two parts coalescing at the central vein) in 'Grand Nain' plants due to somaclonal variation[107]. But all 500 tested plants showed later an agronomical behavior similar to that of plants produced by in vitro budding method. Contrastingly, Uma and co-workers evaluated genetic fidelity in banana cv. 'Grand Nain' and 'Rasthali' were produced from embryogenic cell suspensions using ISSR markers[3]. The overall variation was found to be 3.34% and 2.09%, respectively. Field evaluation further showed no negative effects of vegetative and yield, with no off-types produced.

      Somaclonal variation in banana has been reported to be associated with long-term cultures or cultures that involve a callus phase or high rates of multiplication treatments[96,108]. The decline in the regeneration capacity of ECS cultures has also been associated with cytogenetic instabilities in triploid (AAA, genome) Cavendish bananas, off-type regenerants from long-term Bluggoe suspension cultures (ABB, cooking banana), and the subsequent loss of regeneration potential[13,95,100]. For example, a four-year-old Three Han Planty' (AAB, plantain) suspension was found to have very high regeneration potential with normal ploidy levels, but a nine-year-old 'Bluggoe' (ABB, cooking banana) suspension was found to lack 4−5 chromosomes[47].

    • This paper reviews the current protocols used for somatic embryogenesis in banana, with a focus on the commercial Cavendish group. Due to the various factors affecting somatic embryogenesis and the laborious aspect of optimization, protocols are usually standardized based on the explant source. Much attention was given to the alteration of culture media conditions such as the concentration of plant growth regulators and additives for the formation of desirable clones. However, the particular effect of these alterations on the genetic aspect and the formation of somaclonal variants is lacking. Understanding the physiological, biochemical, and molecular processes involved in each stage of growth is therefore essential for the proper optimization of somatic embryogenesis protocols. For example, determining the sensitivity of clones to changes in the exogenous hormone application, the subsequent levels of endogenous hormones, and gene regulation which miRNA-mediated gene silencing can offer. Functional characterization of key genes involved during somatic embryogenesis may lead to an enhanced understanding of the totipotency of plant cells and provide approaches to improve the efficiency of the process.

    • The authors confirm contribution to the paper as follows: topic conception: Cruz MA, Alcasid C, Silvosa-Millado CS, Balendres MA; data collection: Cruz MA; data curation: Cruz MA; formal analysis: Cruz MA, Alcasid C, Silvosa-Millado CS, Balendres MA; writing - original draft: Cruz MA; writing - review & editing: Alcasid C, Silvosa-Millado CS, Balendres MA; supervision: Balendres MA. All authors reviewed the results and approved the final version of the manuscript.

    • Data sharing not applicable to this article as no datasets were generated or analyzed during the current study.

    • The authors thank the Department of Agriculture-Bureau of Agricultural Research and the University of the Philippines Los Baños.

      • The authors declare that they have no conflict of interest.

      • Copyright: © 2024 by the author(s). Published by Maximum Academic Press, Fayetteville, GA. This article is an open access article distributed under Creative Commons Attribution License (CC BY 4.0), visit https://creativecommons.org/licenses/by/4.0/.
    Figure (2)  Table (5) References (132)
  • About this article
    Cite this article
    Cruz MA, Alcasid C, Silvosa-Millado CS, Balendres MA. 2024. Culture conditions for somatic embryogenesis in banana: brief review of the current practices, advantages, and constraints. Technology in Horticulture 4: e016 doi: 10.48130/tihort-0024-0013
    Cruz MA, Alcasid C, Silvosa-Millado CS, Balendres MA. 2024. Culture conditions for somatic embryogenesis in banana: brief review of the current practices, advantages, and constraints. Technology in Horticulture 4: e016 doi: 10.48130/tihort-0024-0013

Catalog

  • About this article

/

DownLoad:  Full-Size Img  PowerPoint
Return
Return