ARTICLE   Open Access    

The effects of freezing and stratification on pecan (Carya illinoinensis) seed germination and seedling growth

More Information
  • Pecan (Carya illinoinensis) cultivation is crucial for commercial production and relies on selecting rootstocks adapted to local environments. Historically, pecan breeding has prioritized scion improvement over rootstock selection due to propagation challenges. However, rootstocks significantly impact scion growth, phenology, and productivity. Pecan nurseries use open-pollinated seeds from regionally favored cultivars (seedstocks) as rootstocks, and seedstock influences germination. Challenges arise from seed dormancy, with some varieties stratification or having thick shells, which affect germination and seedling growth. Pecan nurseries use freezing to eliminate pecan weevil infestations and stratification to synchronize seed germination, but their effects are not well quantified. This study investigates how freezing and stratification impact seed germination and seedling growth across 12 pecan seedstocks from diverse origins. Results indicate that both freezing and stratification, or their combination significantly affect seed germination. Stratification improved germination rates, with non-stratified frozen seeds averaging only 15.7% compared to 48.5% for stratified seeds. Stratified seeds also emerged faster, averaging 18 d, whereas non-stratified seeds took 37 d. The effect of stratification on germination was not influenced by freezing. Although freezing reduced germination rates, especially when combined with stratification, seedstock origins did not significantly affect germination. Stratification interacted significantly with northern and southern origins. The study underscores the need for a nuanced approach to seed treatment. While stratification is crucial for enhancing germination and seedling growth, freezing treatments should be optimized to balance pest control with seed viability. Future research should focus on refining these treatments to minimize their negative impacts.
  • Sweet cherries (Prunus avium L.) are a major focus of agriculture in the Okanagan region of British Columbia (BC), Canada. A large portion of the cherries grown in BC are exported and undergo up to four weeks of storage during transportation before delivery and consumption[1]. In 2022, sweet cherries accounted for 11.6% of the revenue of exported fruit from Canada and have an export value of nearly CAD$130 million[2]. As such, sweet cherry is an important fruit with high commercial importance for Canada. Although the application of cold storage is a necessary postharvest tool to maintain fruit quality up to consumption, there are preharvest factors that impact quality after longer-term storage. The work of Serrano et al.[3] noted that the maturity stage at harvest determined the fruit quality of sweet cherries after storage. For this reason, producers use several parameters to establish the optimum time for harvesting. Producers have long used colour as a marker for maturity, yet the concept of fruit dry matter (DM) at harvest affecting post-storage quality has advanced[46]. In fact, Toivonen et al.[6] developed a predictive model for 'Lapins' sweet cherry DM content using a visible/near-infrared spectrometer and noted its potential application to other cultivars to provide a rapid and non-destructive means of determining DM linked to cherry fruit quality. If sweet cherries are harvested at the wrong time or stored improperly during transit the quality of the cherries at their final destination does not compare to that at the time of harvest. Therefore, it is of the utmost importance to harvest cherries at their optimal time to ensure quality retention. Cherry fruits have minimal reserve carbohydrates so respiration relies primarily upon organic acids[7]. Additionally, cherries have a high susceptibility to physical damage making them highly perishable, so it is imperative to store them properly to maintain their flavour profile and overall quality[811]. Lower respiration rates help to maintain higher titratable acidity (TA) levels, thereby retaining flavour quality[11,12]. Decreased respiration rates are achieved through low-temperature storage and shipping.

    Previous research linking cherry fruit maturity to flavour quality indicated early-harvested cherries with low soluble solids (SS) levels showed low consumer acceptance due to perceived low sweetness, while late-harvested cherries showed low consumer acceptance due to poor texture[13,14]. This information underscores the challenge growers face when determining picking date. Additionally, once cherries are harvested, quality changes occur which include changes in the balance of SS to TA levels. Previous work has shown that SS levels remain relatively constant while malic acid levels (the predominant acid in sweet cherries) decreased by 20% when stored for 4 d at 20 °C[8,14]. Further, SS, TA, and the SS/TA ratio are key parameters in defining flavour quality[15] and consumer acceptance[14] as SS and TA have been reported to be measures of the cherry fruit attributes of sweetness, and sourness, respectively. Additionally, the SS/TA ratio is regarded as an overall taste attribute determining sweet cherry acceptability[14,16,17].

    Depending on cultivar and growing location, SS values for sweet cherries have been reported to range from 12.3 to 23.7 °Brix[14]. Rootstock and storage conditions have also been reported to affect SS, TA, and SS/TA values[18]. Depending on rootstock, for 'Regina' sweet cherries, harvest SS values ranged from 14.8 to 16.6 °Brix and TA values ranged from 5.7 to 7.4 g·L−1, while SS values after storage ranged from 14.6 to 18.2 °Brix and TA values ranged from 4.4 to 6.0 g·L−1. The harvest SS/TA ratio ranged from 2.0 to 2.91 and the SS/TA ratio after storage ranged from 2.47 to 3.77 depending on rootstock. Based on sensory studies using various cherry cultivars and breeding selections to gauge flavour quality and consumer acceptance, the optimal SS/TA ratio was reported to be between 1.5 and 2.0, with SS values ranging between 17 and 19 °Brix[19].

    Unfortunately, members of British Columbia's sweet cherry industry have noted that while their cherries arrive at their export locations with good condition in terms of appearance (i.e. firm, shiny, with green stems), issues have been reported concerning flavour. Poor flavour has been associated with lower levels of TA and lower oxygen in the storage atmosphere. Our previous work noted that BC cherry growers tend to pick their cherries at lighter colours in an attempt to harvest the crop as soon as possible to avoid any weather or pest issues and achieve the highest yield possible[1]. Staccato (SC) is a late maturing economically important cultivar with little research data available. It has been reported that SC cherries have a respiration rate that is negatively correlated with colour when collected between a 2 to 6 colour level as determined with CTFIL (Centre Technique Interprofessionnel des Fruit et Legumes, Paris, France) colour chips[1], which have been typically used as a marker of maturity. For SC cultivars, data showed the lowest respiration levels with cherries harvested at CTFIL colour standards 4-5, and may potentially have better flavour quality retention due to these lower respiration rates[1]. The aim of the work was to: 1) examine indicators of maturity/readiness for harvest (colour, SS, DM, TA, and the ratio of soluble solids to titratable acidity (SS/TA)); and 2) determine whether colour at harvest or other parameters (SS, TA, SS/TA, and DM) better predict flavour quality retention after storage.

    Sweetheart (SH), Staccato (SC), and Sentennial (SL) sweet cherries were sourced from research plots located at the Summerland Research and Development Center (SuRDC, Summerland, BC, Canada) in the Okanagan Valley region of British Columbia over three growing seasons (2018, 2019, and 2021). In the 2018 growing season, two cherry cultivars (SH and SC were collected, in the 2019 growing season, in response to BC Cherry Association interest, three cherry cultivars (SH, SC, and SL) were collected. Due to COVID, data was not collected during the 2020 growing season. In the 2021 growing season, full data (SS, TA, DM, and respiration rate) was only collected on the SC cherry cultivar, while DM and respiration values at harvest were also collected for SH and SL cultivars.

    To collect fruit at different maturity levels, cherry fruits were collected at three different color levels using the CTFIL (Centre Technique Interprofessionnel des Fruit et Legumes, Paris, France) colour standard series at three harvest dates for each cultivar which corresponded to the 3-4, 4-5, and 5-6 colour levels.

    To collect environmental data, two trees were chosen in each orchard block and Onset HOBO (Bourne, MA, USA) temperature and humidity loggers were mounted in these trees as described by Ross et al.[1] and captured data at 10 min intervals. The temperature and humidity data were used to calculate average temperature (AT), average high temperature (AHT), average low temperature (ALT), and average relative humidity (ARH) for 28 d preceding the cherry harvest date.

    Cherries were generally harvested before 11:00 h on each harvest day. Harvested cherries were transported back to the lab for sorting, sampling, and storage. Upon arrival, cherries were placed into a walk-in cooler at 0.5 °C to mimic rapid hydro-cooling capabilities that the industry uses. In the afternoon of each harvest day, cherries were removed from the cooler and sorted following British Columbia Tree Fruits Company protocol: (i) size was greater than 25.4 mm (< 10.5 row size); (ii) stemless cherries were removed; and (iii) cherries with defects such as blemishes, splits, pitting, disease (rot, fungi), hail damage and insect damage were removed. Again, the colour of the cherries was assessed using the CTFIL colour standard series. Based on the harvest period, cherries were separated into different colour levels: 3-4, 4-5, and 5-6. For each colour category, quality assessments (DM, SS, TA, SS/TA ratio, firmness, size, stem pull force, stem shrivel, stem browning, pitting, and pebbling) were performed before and after storage.

    Maintaining the quality of sweet cherries undergoing long distance ocean container shipment (up to 28 d/4 weeks) is important for securing a successful export market for Canadian sweet cherries and for ensuring that current market demand is met[1]. For cherries to be marketable after storage, they must pass several quality attributes. Attributes of firmness, size, stem pull force, stem shrivel, stem browning, pitting, and pebbling were assessed using previously described methods[1,20] to assess fruit quality at harvest and after storage for 28 d at 0.5 °C, ideal refrigerated storage temperature, for all cherry cultivars, and also storage for 28 d at 3 °C, non-ideal refrigerated storage temperature, for SC cherries. The values of these parameters are provided in Supplementary Tables S1S6. As the focus of this work was to examine how maturity level at harvest influenced the flavour quality of SC, SH, and SL sweet cherry cultivars, SS, DM, TA, and respiration rate values were the focus for discussion. Respiration analysis was performed using methods described by Ross et al. on freshly harvested cherries[1]. Rates of CO2 production were expressed as mg CO2 kg−1·h−1.

    DM of the cherries was determined using a Felix F750 handheld spectrometer (Felix Instruments, Inc., Camas, WA, USA) loaded with a valid model developed at the Summerland Research and Development Centre for cherries[6]. DM was measured on 25 fruits that were randomly selected from each sample replicate (i.e. 50 cherries). For SS and TA analyses, the methods of Ross et al.[1,20] were used to test 25 fruits that were randomly selected from each sample replicate (i.e. 50 cherries). Briefly, de-stemmed cherries were transferred into a 15.2 cm × 22.9 cm polyethylene Ziplock bag. The bag was left partially open, and the cherries were pressed by hand to obtain juice. The juice was strained and collected into 60 mL polypropylene screw cap containers. The resulting filtrate was tested for SS (°Brix), and TA (g·L−1 malic acid). For SS determination, the refractive indices of the solutions were observed in °Brix temperature-corrected mode on a digital refractometer (Mettler-Toledo, Refracto 30PX, 13/02, LXC13237, Japan). An automated titrator (Metrohm 848 Tritrino Plus; Mississauga, ON, Canada) was used to measure the TA of 10 mL of the juice with 65 mL distilled water to an endpoint of 8.1 with 0.1 mol·L−1 NaOH.

    At each colour level (3-4, 4-5, or 5-6) 10 kg of cherry samples were cooled to either 0.5 or 3 °C (for SC in 2021) and then packed into cardboard boxes with a polyethylene liner, an absorbent pad, and an iButton (Thermodata, Whitewater, WI, USA), which measured temperatures experienced by the cherries in the cardboard boxes during storage. After 28 d, the same quality assessment tests were performed to see if values varied throughout storage time at each temperature.

    Statistical analysis was conducted using SAS Institute Inc. software version 9.3 (SAS Institute, Cary, NC, USA). Data were subjected to a four-way analysis of variance (ANOVA) using the SAS PROC GLM procedure. The four factors tested were colour level (3-4, 4-5, and 5-6), cultivar (SH, SC, and SL), growing year (2018, 2019, and 2021), and time (harvest or storage (0.5 °C)). The significance of the main effects and interaction of the four factors was determined using Type III sum of squares via the ANOVA test. Additionally, ANOVA using the SAS PROC GLM procedure was performed on data collected for SC cultivar in the 2021 growing year to assess the influence on storage temperature (0.5 and 3 °C) on quality parameters. Statistical significance was determined by least significant difference (LSD) Fisher's test at 5% significance level. Principal Component Analysis (PCA) was performed using SAS version 9.3 PROC PRINCOMP (SAS Institute Inc., Cary, NC, USA) on data collected from the three cultivars over the tested growing years at three colour levels (i.e., up to nine samples per cultivar) and 10 variables for each investigation. Variables included: AT, AHT, ALT, ARH, colour at harvest (ColourH), SS at harvest (SSH), SS after 28 d of storage at 0.5 °C (SS05), TA at harvest (TAH), TA after 28 d of storage at 0.5 °C (TA05), and DM of cherry fruit at harvest (DMH). Microsoft Excel was used to generate PCA plots from the data provided by SAS. Only data available for every growing year were included in the PCA. Correlation coefficients were determined using Pearson's correlation coefficient statistical function in Excel (version 2306, Microsoft, Redmond, WA, USA). Histograms and frequency data were generated using the statistical function in Excel (version 2306, Microsoft, Redmond, WA, USA). Dry matter bin sizes of 1.5% increments were used to present and analyze the histogram and frequency data.

    Tables 14 present data on flavour attributes via values of soluble solids (SS), titratable acidity (TA), SS/TA ratio, and dry matter (DM) as affected by cultivar, growing year, storage and colour level at harvest and after storage, respectively. The most influential parameters in sweet cherry flavour have been found to be SS, TA, and the SS/TA ratio[15]. Additionally, SS and TA values have been found to be related to DM values in kiwis[2124], apples[25], and cherries[6,26]. DM is a measure of solids which includes both soluble sugars and acids along with insoluble structural carbohydrates and starch. Crisosto et al.[4] proposed using DM as an additional quality parameter as DM was determined not to change during cold storage[22]. Toivonen et al.[6] have performed research linking dry matter measurements with sweet cherry quality. As cold storage is also used to maintain cherry quality, assessing DM at harvest and upon storage was of relevance, and a key aspect of this work was to examine how DM values relate to sweet cherry respiration rates and cherry quality parameters.

    Table 1.  Soluble solids values as affected by cultivar, growing year, storage, and colour level at harvest.
    Cultivar Colour level Soluble solids (SS, °Brix)
    2018 2019 2021
    Harvest Storage (0.5 °C) Harvest Storage (0.5 °C) Harvest Storage (0.5 °C) [3 °C]
    Sweetheart 3-4 18.1aA1 17.7aA1 18.1aA1 18.2aA1
    4-5 20.0bA1 19.8bA1 19.4bA1 18.8bA1
    5-6 21.9cA1* 21.1cA1* 19.9bA1* 19.6cA1*
    Staccato 3-4 17.2aA2 17.2aA1 17.1aA2 17.2aA1 18.8aA* 18.9aA*
    18.4a
    4-5 17.8aA2 17.9aA2 18.3bA23 18.1bA1 19.9bA* 18.6aB
    18.9ab
    5-6 20.2bA2 17.9aB2* 20.2cA1 20.3cA13 20.1bA 19.5aA
    19.7b
    Sentennial 3-4 18.1aA1 18.1aA1
    4-5 18.9bA13 18.5aA1
    5-6 20.8cA2 20.6bA23
    Main effects Significance F-value Degrees of freedom
    Cultivar p < 0.0001 36.90 2
    Colour level p < 0.0001 125.76 2
    Year p < 0.0001 9.26 2
    Time (harvest or storage at 0.5 °C) p = 0.0002 13.68 1
    Colour differences: within common time and cultivar, values followed by different lower case letters indicate significant differences (p ≤ 0.05); Cultivar differences: within common colour level and time, values followed by different numbers indicate significant differences (p ≤ 0.05); Growing year differences: within common time, colour level and cultivar, values followed by * indicate significant differences (p ≤ 0.05); Storage differences (Harvest versus 0.5 °C storage): within common cultivar, colour level and growing year, values followed by different uppercase letter indicate significant differences (p ≤ 0.05); Temperature differences: within Staccato cultivar at 28 d storage and at common colour level, bolded values indicate significant differences (p ≤ 0.05) between storage temperatures (0.5 °C vs 3 °C). (N.B. no bolded values appear in this table).
     | Show Table
    DownLoad: CSV
    Table 2.  Titratable acidity values as affected by cultivar, growing year, storage and colour level at harvest.
    Cultivar Colour level Titratable acidity (TA, g·L−1 malic acid)
    2018 2019 2021
    Harvest Storage (0.5 °C) Harvest Storage (0.5 °C) Harvest Storage (0.5 °C) [3 °C]
    Sweetheart 3-4 8.99aA1* 7.11aB1* 7.31aA1* 6.31aB1*
    4-5 9.55bA1* 7.57bB1* 7.14aA1* 6.13aB1*
    5-6 10.56cA1* 8.57cB1* 7.56aA1* 6.50aB1*
    Staccato 3-4 8.53aA2* 6.65aB2* 6.96aA1* 5.51aB2* 12.0aA* 10.5aB*
    9.7a
    4-5 8.87abA2* 7.04bB2* 7.30aA1* 6.21bB1* 12.8aA* 10.2aB*
    9.3a
    5-6 8.91bA2* 6.91abB2 7.18aA1* 6.46bB1 10.6bA* 9.5b*
    8.5b
    Sentennial 3-4 9.21acA2 7.60aB3
    4-5 9.33aA2 7.89aB2
    5-6 8.79bcA2 7.66aB2
    Main effects Significance F-value Degrees of freedom
    Cultivar p < 0.0001 193.58 2
    Colour level p = 0.0023 5.49 2
    Year p < 0.0001 1,007.20 2
    Time (harvest or storage at 0.5 °C) p < 0.0001 474.18 1
    Colour differences: within common time and cultivar, values followed by different lower case letters indicate significant differences (p ≤ 0.05); Cultivar differences: within common colour level and time, values followed by different numbers indicate significant differences (p ≤ 0.05); Growing year differences: within common time, colour level and cultivar, values followed by * indicate significant differences (p ≤ 0.05); Storage differences (Harvest versus 0.5 °C storage): within common cultivar, colour level and growing year, values followed by different uppercase letter indicate significant differences (p ≤ 0.05); Temperature differences: within Staccato cultivar at 28 d storage and at common colour level, bolded values indicate significant differences (p ≤ 0.05) between storage temperatures (0.5 °C vs 3 °C).
     | Show Table
    DownLoad: CSV
    Table 3.  Soluble solids to titratable acidity ratio values as affected by cultivar, growing year, storage and colour level at harvest.
    Cultivar Colour level Soluble solids to titratable acidity ratio (SS/TA)
    2018 2019 2021
    Harvest Storage (0.5 °C) Harvest Storage (0.5 °C) Harvest Storage (0.5 °C) [3 °C]
    Sweetheart 3-4 2.02a1A* 2.49a1B* 2.49a1A* 2.78a1B*
    4-5 2.09a1A* 2.61a1B* 2.71b1A* 3.06b1B*
    5-6 2.07a1A* 2.46a1B* 2.63b1A* 3.02b1B*
    Staccato 3-4 2.01a1A* 2.58a1B* 2.46a1A* 3.11a2B* 1.57aA* 1.79aB*
    1.89a
    4-5 2.0a1A* 2.54a1B* 2.51a2A* 2.91b1B* 1.55aA* 1.83aB*
    2.04a
    5-6 2.27b2A* 2.58a1B* 2.81b1A* 3.14a1B* 1.89bA* 2.06bB*
    2.32b
    Sentennial 3-4 1.97a2A 2.38a3B
    4-5 2.02a3A 2.34a2B
    5-6 2.37b2A 2.69b2B
    Main effects Significance F-value Degrees of freedom
    Cultivar p < 0.0001 94.79 2
    Colour level p < 0.0001 22.04 2
    Year p < 0.0001 361.13 2
    Time (harvest or storage at 0.5 °C) p < 0.0001 134.15 1
    Colour differences: within common time and cultivar, values followed by different lower case letters indicate significant differences (p ≤ 0.05); Cultivar differences: within common colour level and time, values followed by different numbers indicate significant differences (p ≤ 0.05); Growing year differences: within common time, colour level and cultivar, values followed by * indicate significant differences (p ≤ 0.05); Storage differences (Harvest versus 0.5 °C storage): within common cultivar, colour level and growing year, values followed by different uppercase letter indicate significant differences (p ≤ 0.05); Temperature differences: within Staccato cultivar at 28 d storage and at common colour level, bolded values indicate significant differences (p ≤ 0.05) between storage temperatures (0.5 °C vs 3 °C).
     | Show Table
    DownLoad: CSV
    Table 4.  Dry matter values as affected by cultivar, growing year, storage and colour level at harvest.
    Cultivar Colour level Dry matter (DM, %)
    2018 2019 2021
    Harvest Storage (0.5 °C) Harvest Storage (0.5 °C) Harvest Storage (0.5 °C) [3 °C]
    Sweetheart 3-4 20.9aA1* 20.6aA1* 18.6aA1* 18.6aA1* 22.1aA1*
    4-5 21.9bA1 22.0bA1* 19.9bA1* 19.8acA1* 22.5bA1
    5-6 25.2cA1* 23.5cB1* 21.1cA1* 20.6bcA1* 23.6cA1*
    Staccato 3-4 20.2aA1* 19.5aA2* 18.4aA2* 18.1aA23* 21.0aA2* 20.6aA*
    19.8a
    4-5 20.4aA2* 20.8bA2* 19.1aA1* 18.8aA2* 22.0bA2* 21.6bA*
    21.9b
    5-6 22.4bA2 22.3cA2 22.9bA2* 21.6bA23 23.0cA2 22.2bA
    22.4b
    Sentennial 3-4 18.2aA2 18.4aA13 20.5aA2*
    4-5 19.3bA1 18.8bA2 22.6bA12*
    5-6 22.9cA2 20.9bA13 23.5cA12
    Main effects Significance F-value Degrees of freedom
    Cultivar p < 0.0001 11.36 2
    Colour level p < 0.0001 130.99 2
    Year p < 0.0001 56.64 2
    Time (harvest or storage at 0.5 °C) Not significant, p = 0.0922 2.97 1
    Colour differences: within common time and cultivar, values followed by different lower case letters indicate significant differences (p ≤ 0.05); Cultivar differences: within common colour level and time, values followed by different numbers indicate significant differences (p ≤ 0.05); Growing year differences: within common time, colour level and cultivar, values followed by * indicate significant differences (p ≤ 0.05); Storage differences (Harvest versus 0.5 °C storage): within common cultivar, colour level and growing year, values followed by different uppercase letter indicate significant differences (p ≤ 0.05); Temperature differences: within Staccato cultivar at 28 d storage and at common colour level, bolded values indicate significant differences (p ≤ 0.05) between storage temperatures (0.5 °C vs 3 °C). (N.B. no bolded values appear in this table).
     | Show Table
    DownLoad: CSV

    Data in Table 1 shows the SS levels at each colour level for each sweet cherry cultivar. Overall, SH cherries at harvest had ranges of 18.1%−21.9% over the 2018 and 2019 growing seasons. SC cherries at harvest had levels between 17.1%−20.2% over the three growing years (2018, 2019, and 2021), while SL cherries at harvest had levels of 18.1%−20.8% in 2019. Statistical analysis showed that the main effects of Cultivar (p < 0.0001; F-value = 36.90; degrees of freedom (df) = 2), Colour (p < 0.0001; F-value = 125.76, df = 2), Time (p = 0.0007; F-value = 13.68; df = 1), and Year (p < 0.0001; F-value = 9.26; df = 2) were all significant. Additionally, the interactions of Cultivar * Year (p < 0.0001, F-value = 26.37; df = 1), Colour * Year (p < 0.0069; F-value = 4.19; df = 4), Cultivar * Colour * Year (p < 0.0003; F-value = 10.28; df = 2) and Colour * Time * Year (p < 0.0131; F-value = 3.67; df = 4) were all significant.

    With respect to growing year differences, in 2018, SS levels in SH were greater than those of SC at all colour levels. In 2019, again at the 3-4 colour level SC, cherries exhibited lower SS levels than SH and SL cherries. At the 4-5 colour level, SH cherries again showed higher SS levels compared to SC cherries. At the 5-6 colour level, SL cherries showed higher SS levels compared to SC and SH, while SC and SH cherries showed comparable SS levels at the 5-6 colour level. The SS values of SC cherries at 3-4 and 4-5 colour levels from the 2021 growing year were higher than values observed at the same colour levels in 2018 and 2019 growing year samples. There was no difference observed in SS levels of SC cherries at the 5-6 colour level between growing years. The data shows that colour level, cultivar, and growing year all affected SS levels.

    Within cultivars, for SH in the 2018 growing season, as colour level increased, SS level increased. An increase in SS as colour at harvest increased for SH cultivar was reported by Puniran et al.[27]. In the 2019 growing year for SH cherries and in the 2021 growing year for SC cherries, SS levels plateaued at the 4-5 colour level. For SC (2018 and 2019 growing year) and SL cherries (2019 growing year) as colour level increased, SS level increased. Ross et al.[1] reported this same trend for SC cultivar on data collected from 2015, 2016, and 2017 growing years. This data demonstrates the influence of growing conditions on SS levels.

    In general the SS levels at each colour level for each sweet cherry cultivar did not change over the 28 d storage at 0.5 °C. It should be noted that SC cherries from the 2018 growing year at the 5-6 colour level and SC cherries from the 2021 growing year at the 4-5 colour level did show a significant (p ≤ 0.05) decrease in soluble solids after 28 d of storage at 0.5 °C. SS values for 2018 SC cherries at the 5-6 colour level harvest was 20.2 °Brix, while SS values after 28 day storage at 0.5 °C was 17.9 °Brix. SS values for 2021 SC cherries at the 4-5 colour level harvest was 19.9 °Brix, while SS values after 28 d of storage at 0.5 °C was 18.6 °Brix. In 2021 the effect of storage temperature (0.5 °C vs 3 °C) was investigated. SS levels in the SC cherries at the different colour levels were not affected by the different storage temperatures. This result was consistent with other findings[1,8,14], which suggested that under typical low temperature storage conditions and proper shipping conditions, the change in flavour profiles were likely not due to major changes in SS levels. It is important to note that Alique et al.[8] found that while SS values were consistent, the levels of glucose and fructose decreased by 13% and 10%, respectively, after 4 d under ambient conditions. It may be worth investigating if under a lower temperature environment, the levels of key monosaccharides would remain constant or change.

    This moves the focus of flavour retention to TA values. Table 2 shows the TA levels at each colour level for each sweet cherry cultivar. Statistical analysis showed that the main effects of Cultivar (p < 0.0001; F-value = 193.58; df = 2), Colour (p = 0.0023; F-value = 5.49, df = 2), Time (p < 0.0001; F-value = 474.18; df = 1), and Year (p < 0.0001; F-value = 1007.20; df = 2) were all significant. The interactions of Cultivar * Colour (p < 0.001; F-value = 5.81; df = 4); Cultivar * Year (p < 0.0001; F-value = 19.9; df = 1); Colour * Time (p = 0.0431; F-value = 3.44; df = 2); Colour * Year (p < 0.0001; F-value = 18.01; df = 4); Time * Year (p < 0.0001; F-value = 17.21; df = 2); Cultivar * Colour * Year (p = 0.0009; F-value = 8.63; df = 2); Colour * Time * Year (p = 0.0127; F-value = 3.70; df = 4) were all significant.

    SH cherries at harvest had TA value ranges of 8.99−10.56 g·L−1 in 2018, and 7.31−7.56 g·L−1 in 2019. In 2018, the highest TA value was at the 5-6 colour level for SH cherries, while for the 2019 SH cherries there was no difference between colour levels for the TA values. After storage SH cherries at the various colour levels showed TA levels of 7.11−8.57 g·L−1 and 6.31−6.50 g·L−1 for 2018 and 2019, respectively. Again the stored 2018 SH cherries at the 5-6 colour level showed the highest TA values, while the TA values for the stored 2019 SH cherries were not affected by colour level. SC cherries at harvest showed TA value ranges of 8.53−8.91 g·L−1 in 2018, 6.96−7.18 g·L−1 in 2019, and 10.6−12.8 g·L−1 in 2021. After storage SC cherries had lower TA values at all colour levels for all growing years. In 2018, 2019, and 2021, TA values for SC cherries after storage ranged from 6.65–7.04 g·L−1, 5.51−6.46 g·L−1 and 8.5−10.5 g·L−1, respectively. In 2021, for the SC cherries, the higher storage temperature (3 °C) resulted in a greater loss of TA values for all colour levels compared to the lower temperature of 0.5 °C. SL cherries at harvest had TA levels of 8.79−9.33 g·L−1 in 2019 and after storage at 0.5 C, TA values ranged from 7.60−7.89 g·L−1, with the highest value of TA at the 4-5 colour level. Therefore for all cultivars over all growing years, TA values decreased upon storage, which was expected. The data from Table 2 shows the magnitude of the decrease in TA values after storage varied by growing year. Additionally, trends for differences of TA magnitude change with respect to cultivar and colour level were not obvious. The magnitude of the decrease in TA values between harvest and storage was higher for the SC cherries stored at 3 °C compared to those stored at 0.5 °C.

    Comparing the effect of colour level on TA level within cultivar for SH cherries, TA values increased as colour level at harvest increased in 2018, but the trend did not continue in 2019, possibly due to different growing conditions such as orchard temperature and relative humidity values, which will be further discussed. For SC cherries, TA values peaked at the 4-5 colour level for 2018 and 2021 growing years, but were not significantly different between colour levels in 2019 (p ≤ 0.05). In the 2019 growing year, SL cherries also had the highest TA values at the 4-5 colour level. Comparing the effect of cultivar on TA level within comparable colour level, 2018 harvest SH cherries showed higher TA values than SC cherries. In the 2018 growing year, upon storage and at comparable colour level, SH cherries again showed higher TA values than SC cherries. In the 2019 harvest, SC cherries exhibited the same TA values as SH cherries, while SL cherries had higher TA values than SC and SH. In the 2019 growing year SL cherries harvested at the 3-4 colour level showed greater TA values after storage compared to SH and SC cherries; SC cherries had the lowest TA values at this colour level. When harvested at the 4-5 and 5-6 colour levels, SL cherries had higher TA values upon storage compared to SH and SC cherries.

    The data suggests that different cultivars tend to peak TA values, which may be affected by growing conditions/growing year and maturity level/colour level. This is further supported by the work of Miloševic & Miloševic[28] that indicated TA levels of sour cherries are affected by level of ripeness. Puniran et al.[27] also indicted that finding where peak TA values occur at harvest can help negate the decrease in values that occurs during storage and therefore promote flavour quality retention.

    In 2021 the effect of storage temperature (0.5 °C vs 3 °C) was investigated as 0.5 °C represents ideal storage temperature while 3 °C represents a storage temperature where quality deterioration would be promoted, and may be a more realistic temperature experienced during overseas/export shipping (personal communication, Dr. Peter Toivonen, May, 2021). TA levels in the SC cherries harvested at the different colour levels were affected by the different storage temperature as seen in Table 2. At common colour level, SC cherries from the 2021 growing season stored at 3 °C showed lower TA values than samples stored at 0.5 °C. The SC cherries at the 5-6 colour level stored at 3 °C showed the lowest TA values upon storage. As higher TA values are associated with flavour quality[11,12], the SC cherries harvested at the 5-6 colour level and stored at 3 °C would show poorer flavour quality.

    Table 3 shows the SS/TA ratio values as affected by cultivar, growing year, storage and colour level at harvest. Statistical analysis showed that the main effects of Cultivar (p = 0.0001; F-value = 94.79; df = 2), Colour (p < 0.0001; F-value = 22.04; df = 2), Time (p < 0.0001; F-value = 134.15; df = 1), and Year (p < 0.0001; F-value = 361.13; df = 2) were all significant. The interactions of Cultivar * Colour (p = 0.0009; F-value = 5.91; df = 4) and Time * Year (p = 0.0059; F-value = 5.95; df = 2) were significant. The SS/TA ratio values over all cultivars, colour levels and growing years ranged from 1.55 to 2.81 at harvest and 1.79 to 3.14 after storage at 0.5 °C for 28 d. SC cherries in the 2021 growing year were tested to determine the effect of storage temperature (0.5 or 3 °C) on flavour quality. The SS/TA ratio for the 2021 SC cherries stored at 0.5 °C for 28 d ranged from 1.79 to 2.06 while the SS/TA ratio for the 2021 SC cherries stored at 3 °C for 28 d ranged from 1.89 to 2.32. SS/TA ratios for the 3 °C stored cherries at the 4-5 and 5-6 colour levels were significantly higher (p ≤ 0.05) compared to corresponding SS/TA ratios for the 0.5 °C stored cherries at the 4-5 and 5-6 colour levels. Higher SS/TA ratio are due to lower TA values (data in Table 3) and impact flavour quality and therefore lower storage temperatures are preferable, which was expected.

    Comparing between growing years, for SH and SC cherries, the SS/TA ratio at harvest was higher in the 2019 growing year compared to the 2018 growing year. SC cherries from the 2021 growing year showed the lowest at harvest SS/TA ratio. Within cultivar, the SH cherries from the 2018 growing year showed no difference in harvest SS/TA ratio at the different colour levels. SH cherries from the 2019 growing year showed higher harvest SS/TA ratios at the 4-5 and 5-6 colour levels compared to the 3-4 colour level. The SC cherries at all growing years showed highest harvest SS/TA ratio levels at the 5-6 colour level and comparable harvest SS/TA ratio levels at the 3-4 and 4-5 colour levels. SL cherries also showed the highest harvest SS/TA ratio at the 5-6 colour level and comparable harvest SS/TA ratios at the 3-4 and 4-5 colour levels.

    Comparing cultivars at common colour level, in 2018 growing year SC cherries at the 5-6 colour level showed a higher harvest SS/TA ratio compared to SH cherries at the corresponding colour level. In the 2019 growing year SH and SC cherries showed higher harvest SS/TA ratios at the 3-4 colour level compared to SL cherries. At the 4-5 colour level, SH cherries showed the highest harvest SS/TA ratio value and SL cherries showed the lowest harvest SS/TA ratio value. At the 5-6 colour level, SH and SC cherries showed comparable SS/TA ratios while SL cherries showed the lowest SS/TA ratio.

    Overall, this data indicates that ensuring cherry flavour quality is complex as SS/TA ratio varied by growing year, colour level and cultivar. Comparing SS/TA ratio data for all cultivars over all growing years did not show an observable trend between colour level and SS/TA ratio. As such, colour is not a reliable indicator of flavor quality.

    Table 4 shows the DM values as affected by cultivar, growing year, storage and colour level at harvest. Statistical analysis showed that the main effects of Cultivar (p = 0.0001; F-value = 11.36; df = 2), Colour (p < 0.0001; F-value = 130.99; df = 2), and Year (p < 0.0001; F-value = 56.64; df = 2) were all significant. Notably, the main effect of Time (harvest vs stored) was not significant (p = 0.0922). The interactions of Cultivar * Year (p = 0.001; F-value = 6.45; df = 3); Colour * Year (p = 0.0004; F-value = 6.38; df = 4); Cultivar * Colour * Year (p = 0.0018; F-value = 4.64; df = 5) were all significant. Although SS and TA values were not obtained for all three cultivars in 2021, DM values at harvest were obtained for all three cultivars in 2021. Data in Table 4 show, in general, DM levels did not change over 28-d storage, which was expected. Additionally, data in Table 4 shows that in most cases, at common cultivar and colour level, DM values measured in 2021 were greater than DM values measured in 2018 and 2019 for all cultivars (SH, SC, and SL).

    Within each cultivar, over all growing years, the harvest DM values were significantly different (p < 0.05) at each colour level, except for SC cherries in the 2018 and 2019 growing years. 2018 and 2019 DM values were not significantly different from colour level 3-4 to colour level 4-5. At the 5-6 colour level, over all growing years, SH cherries showed higher DM values compared to dry matter values observed for SC cherries (p < 0.05). At the 3-4 colour level, over all growing seasons, the DM values for SL and SC cherries were not significantly different (p < 0.05). At the 4-5 colour level, over all growing seasons, the DM values for SL were not significantly different than the DM values exhibited by SH and SC cherries (p < 0.05). In 2021 the effect of storage temperature (0.5 °C vs 3 °C) was investigated. DM levels in the SC cherries at the different colour levels were not affected by the different storage temperature. Overall, DM levels ranged from 18.1 to 25.2 depending on cultivar, colour level, growing year, and storage.

    Figure 1ac shows the distribution of the three cherry cultivars relative to DM value ranges over all three growing years via histograms. Cherries at the same colour level did not all have the same DM; this was observed both within and between cultivars (Fig. 1ac). DM data, compiled over all available growing years, for each cultivar in the 3-4, 4-5, and 5-6 colour levels had considerable overlap. However, it is noted there is consistent shift to a higher DM at the 5-6 colour level.

    Figure 1.  Histogram representing distribution of dry matter data for: (a) Sweetheart (SH) cherries over the 2018, 2019, and 2021 growing years; (b) Staccato (SC) cherries over the 2018, 2019, and 2021 growing years; and (c) Sentennial (SL) cherries over the 2019 and 2021 growing years. For all parts, the 3-4 colour level is solid black, the 4-5 level is black stripes, and the 5-6 level is solid grey. On the horizontal axis different dry matter value (DM) ranges are shown via bins and on the vertical axis the frequency or proportion (%) of cherries within the DM bins/ranges are shown. Data was generated from two replicates of samples of 25 cherries (i.e. 50 cherries) from all available growing years.

    Over all growing years, DM values for SH cherries ranged from 14%−27%, 14%−28.5%, and 16.5%−33%, at the 3-4, 4-5, and 5-6 colour levels, respectively (Fig. 1a). SH cherries at the 3-4 and 4-5 colour levels showed the highest proportion (26% and 26%, respectively) of cherries resided in the 22.5 and 22.5% DM bins indicating the highest percentage of SH cherries in these colour levels exhibited a DM of 21% to 22.5%, while the highest proportion (21%) of cherries at the 5-6 colour level resided in the 24% DM bin indicating the highest percentage of SH cherries at this colour level exhibited a DM of 22.5% to 24% (Fig. 1a).

    For SC cherries over all growing years, DM values ranged from 14%−25.5%, 14%−30%, and 16.5%−30%, at the 3-4, 4-5, and 5-6 colour levels, respectively (Fig. 1b). SC cherries at the 3-4 colour level showed the highest proportion of cherries (27%) resided in the 19.5% DM bin which indicated the highest percentage of SC cherries at this colour level exhibited a DM of 18 to 19.5%. SC cherries at the 4-5 colour level showed the highest proportion of cherries (25%) resided in the in the 21% DM bin which indicated the highest percentage of SC cherries at this colour level exhibited a DM of 19.5% to 21 %. At the 5-6 colour level, the highest proportion (35%) of SC cherries resided in the 22.5% DM bin which indicated the highest percentage of SC cherries exhibited a DM of 21%−22.5% (Fig. 1b).

    Over the 2019 and 2021 growing years, SL cherries DM values ranged from 15%−25.5%, 15%−28.5%, and 16.5%−33% at the 3-4, 4-5 and 5-6 colour levels, respectively (Fig. 1c). SL cherries at the 3-4 colour level showed the highest proportion of cherries (36%) resided in the 21% DM bin which indicated the highest percentage of SL cherries at this colour level exhibited a DM of 19.5% to 21%. SL cherries at the 4-5 colour level showed the highest proportion of cherries (28%) resided in the in the 21% DM bin which indicated the highest percentage of SL cherries at this colour level exhibited a DM of 19.5% to 21 %. At the 5-6 colour level, the highest proportion (26%) of SC cherries resided in the 22.5% DM bin which indicated the highest percentage of SL cherries exhibited a DM of 21%−22.5% (Fig. 1c).

    In all, the data in Tables 14 and Fig. 1 indicate that colour is not a reliable indicator of maturity or flavor quality. Cherries of the same colour may differ in DM, SS, TA, and SS/TA ratio due to cultivar and growing conditions. The implication of these results are discussed in subsequent sections.

    Temperature, relative humidity and harvest date for the 2018, 2019, and 2021 growing years are detailed in Table 5. Environmental variations between years impacted colour development, which resulted in yearly variations in our harvest dates as cherry picks were based on cherry colour levels: 2018, July 16 to August 9; 2019, July 18 to August 6; and 2021, July 5 to July 27, nearly two weeks earlier than in previous years (Table 5). In terms of environmental data, the average temperature (AT), average high temperature (AHT), and average low temperature (ALT) values measured in 2021 were greater than the values determined in 2018 and 2019, while the average relative humidity (ARH) values determined in 2021 were lower than the values measured in 2018 and 2019 (Table 5). Depending on growing year and harvest date, average temperature values ranged from 17.17 to 24.28 °C, average high temperature values ranged from 28.59 to 50.68 °C, average low temperatures ranged from 7.17 to 10.68 °C, and average relative humidity values ranged from 40.68% to 66.16% (Table 5).

    Table 5.  Temperature and relative humidity environmental data for 2018, 2019, and 2021 growing years.
    Growing year Colour level Harvest date Average
    temperature
    (AT) (°C)
    Average relative humidity (ARH) Average low temperature (ALT) (°C) Average high temperature (AHT) (°C)
    2018 Sweetheart 3-4 July 16 18.96 61.5% 7.17 32.14
    4-5 July 23 18.85 59.8% 7.17 32.13
    5-6 July 30 20.45 56.85% 7.49 32.05
    Staccato 3-4 July 30 19.74 59.17% 7.42 32.04
    4-5 August 9 21.14 54.46% 7.42 32.77
    5-6 August 9 21.14 54.49% 7.42 32.77
    2018 overall average 20.05 57.71% 7.35 32.32
    2019 Sweetheart 3-4 July 18 17.86 66.04% 7.22 28.79
    4-5 July 24 18.39 66.1% 7.22 28.59
    5-6 July 24 18.39 66.1% 7.22 28.59
    Staccato 3-4 July 22 18.03 66.16% 7.22 28.59
    4-5 July 29 19.19 62.92% 8.67 29.39
    5-6 July 31 19.19 62.92% 8.67 29.39
    Sentennial 3-4 July 22 18.03 66.16% 7.22 28.59
    4-5 July 29 18.99 63.77% 8.67 29.39
    5-6 August 6 19.79 59.94% 8.67 29.39
    2019 overall average 18.87 63.65% 8.19 28.96
    2021 Sweetheart 3-4 July 5 24.01 40.68% 8.51 50.68
    4-5 July 12 24.28 40.68% 10.68 49.23
    5-6 July 20 24.10 40.68% 9.66 47.47
    Staccato 3-4 July 13 24.01 40.68% 8.51 50.68
    4-5 July 21 24.28 40.68% 10.68 49.23
    5-6 July 27 24.10 40.68% 9.66 47.47
    Sentennial 3-4 July 12 24.01 40.68% 8.51 50.68
    4-5 July 19 24.28 40.68% 10.68 49.23
    5-6 July 26 24.10 40.68% 9.66 47.47
    2021 overall average 24.12 40.68% 9.62 49.13
     | Show Table
    DownLoad: CSV

    Principal component analysis (PCA) was performed on all cultivars over all growing seasons to best resolve cultivar specific relationships between variables affecting flavour quality parameters: colour, DM, SS and TA (Fig. 2).

    Figure 2.  Principal component analysis (PCA) plot for: Sweetheart (SH) cherries with data from 2018 and 2019 growing years at the 3-4, 4-5, and 5-6 colours levels (SH34-2018, SH45-2018, SH56-2018, SH34-2019, SH45-2019, and SH56-2019; Staccato (SC) cherries with data from 2018, 2019 and 2021 growing years at the 3-4, 4-5, and 5-6 colour levels (SC34-2018, SC45-2018, SC56-2018, SC34-2019, SC45-2019, SC56-2019, SC34-2021, SC45-2021, and SC56-2021); and Sentennial (SL) cherries with data from 2019 growing year (SL34-2019, SL45-2019, and SL56-2019). PC1 and PC2 accounted for 84.75% variation. The variables include: average temperature (AT), average high temperature (AHT), average low temperature (ALT), average relative humidity (ARH), colour at harvest (ColourH), SS at harvest (SSH), SS after 28 d of storage at 0.5 °C (SS05), titratable acidity at harvest (TAH), titratable acidity after 28 d of storage at 0.5 °C (TA05) and dry matter of cherry fruit at harvest (DMH). Orchard growing factors, flavour quality attributes (loading factors), along with sweet cherry cultivars from each growing season (component scores) were presented as lines with arrows, lines with circles, and squares, respectively. Variables close to each other with small angles between them are strongly positively correlated; variables at right angles are likely not correlated; variables at large angles (close to 180°) are strongly negatively correlated.

    Figure 2 shows that principal components 1 and 2 described most of the variation (84.75%) in the model. SS at harvest (SSH) and SS at 28-d storage at 0.5 °C (SS05) along with DM at harvest (DMH) were positively correlated with colour at harvest (ColourH). TA at harvest (TAH) and TA at 28-d storage at 0.5 °C (TA05) were positively correlated with average high temperature (ATH). AHT, average low temperature (ALT) and average temperature (AT). DMH was more strongly correlated with TAH and TA05 compared to ColourH. TAH and TA05 were positively correlated, yet negatively correlated with average relative humidity (ARH). The 2021 SC samples at the 3-4, 4-5, and 5-6 colour levels (SC34-2021, SC45-2021, and SC56-2021) were clustered with TAH, TA05, ALT, AHT, and AT variables and located in a quadrant opposite of ARH. In late June 2021 a heatwave of unprecedented magnitude impacted the Pacific Northwest region of Canada and the United States; the Canadian national temperature record was broken with a new record temperature of 49.6 °C[29]. Also, the relative humidity levels during this period were also extremely low[30]. As the location of this study was impacted by this heatwave, the data shown in Table 6 shows higher temperatures and lower relative humidity values for the 2021 growing year. The TA values measured in the 2021 growing year were nearly two times the levels measured in the 2018 and 2019 growing years (Table 2). This shows an impact of growing conditions on flavor quality; both the negative correlation between ARH and TA and positive correlations of AT, AHT, and ALT with TA are notable. However, it is noted that correlation does not mean causation. The SH and SC cultivars from the 2018 growing year at the 5-6 colour level were clustered together, and were located in the same quadrant as ColourH, SSH, SS05, and DMH variables (Fig. 2). This indicates these samples were characterized by high values of SSH, SS05, and DMH. All cultivars at the 3-4 colour level from the 2018 (SH and SC), and 2019 (SH, SC, and SL) growing years along with all cultivars at the 4-5 colour level from the 2019 (SH, SC, and SL) growing year were clustered in quadrants opposite of the SSH, SS05, DMH, ColourH, TAH, and TA05 variables while near the ARH variable. The clustering of the samples indicates similarity and lower levels of SSH, SS05, DMH, TAH, and TA05.

    Table 6.  Average colour level and respiration rate of sweet cherries at harvest.
    Growing year Colour
    level
    Average colour measured at harvest
    [average dry matter at harvest]
    Dry matter bin (%), highest
    proportions of cherries
    Respiration rate (mg CO2 kg−1·h−1)
    assessed at 0.5, 5 or 10 °C
    0.5 °C 5 °C 10 °C
    2018 Sweetheart 3-4 3.74a1 [20.9%] 21, 38% 2.87a1 * 5.99a1* 9.75a1*
    4-5 4.66b1 [21.9%] 22.5, 38% 3.57b1* 5.53b1* 9.06a1*
    5-6 5.54c1 [25.2%] 25.5, 26% 3.50b1* 5.18b1* 9.58a1*
    Staccato 3-4 3.58a1 [20.2%] 19.5, 44% 4.43a2* 7.08a2* 9.90a1*
    4-5 4.62b1 [20.4%] 21, 36% 4.58a2* 8.05b2* 11.22b2*
    5-6 5.64c1 [22.4%] 22.5, 50% 4.12b2* 6.43c2* 9.78a1*
    2019 Sweetheart 3-4 3.76a1 [18.6%] 18, 26%; 19.5, 26% Nd 6.04 13.7
    4-5 4.42b1 [19.9%] 21, 32% Nd Nd 8.3
    5-6 5.42c1 [21.1%] 22.5, 28% Nd 6.95 13.5
    Staccato 3-4 3.46a1 [18.4%] 19.5, 32% Nd 5.8 12.47
    4-5 4.40b12 [19.1%] 19.5, 40% Nd 6.14 Nd
    5-6 5.40c1 [22.9%] 22.5, 26% Nd Nd Nd
    Sentennial 3-4 3.62a1 [18.2%] 18, 28% Nd 6.5 12.80
    4-5 4.22b2 [19.3%] 21, 40% Nd 3.76 Nd
    5-6 5.20c2 [22.9%] 22.5, 24% Nd Nd Nd
    2021 Sweetheart 3-4 Nd [22.1%] 22.5, 40% 3.18a1* 5.86a1* 8.8a1*
    4-5 Nd [22.5%] 22.5, 28% 2.78a1* 5.08b1* 8.1a1*
    5-6 Nd [23.6%] 24, 30% 2.65a1* 4.32c1* 9.19a1*
    Staccato 3-4 3.50a1 [21.0%] 19.5, 28% 2.72a1 4.65ab2 10.94a2*
    4-5 4.80b1 [22.0%] 21, 24%; 22.5, 20% 3.27a1* 4.38a2* 8.22b1*
    5-6 5.60c1 [23.0%] 24, 30% 3.05a1* 5.07b2* 9.57ab1*
    Sentennial 3-4 Nd [20.5%] 21, 48% 2.71a1* 4.77a2* 7.84a1*
    4-5 Nd [22.6%] 22.5, 28%; 24, 24% 2.78a1* 4.81a12* 8.28ab1*
    5-6 Nd [23.5%] 22.5, 28%; 24, 24% 4.23b2 4.47a12 9.88b1*
    Within common cultivar and growing year, values followed by different letters indicate significant differences (p ≤ 0.05)-shows colour differences; Within common colour level and growing year, values followed by different numbers indicate significant differences (p ≤ 0.05)-shows cultivar differences; Within common cultivar, growing year and colour level, values followed by * indicate significant differences (p ≤ 0.05)-shows respiration rate differences at the different temperatures. Due to incomplete data, statistical analysis was not performed on 2019 data. Nd = Actual colour was not calculated for Sweetheart and Sentennial cherries in 2021 although cherries were collected 3-4, 4-5, 5-6 colour levels as in previous years and can be considered to have colour levels of approximately 3.5, 4.5, and 5.5, respectively.
     | Show Table
    DownLoad: CSV

    High respiration rates have long been associated with rapid fruit quality deterioration[11]. Lower respiration rates help to maintain higher TA levels, thereby retaining flavour quality[11,12]. This work aimed to provide information on assessing whether rapid and non-invasive dry matter measurements can serve as a surrogate for respiration rate measurements and/or TA measurements to predict fruit quality as this information is essential for developing recommendations to optimize cherry quality retention upon long distance transport. Although it is well known that quality deteriorates more quickly in fruit with higher respiration rates, the respiration rate data for the SH, SC, and SL cherries was collected and analyzed with respect to the different colour levels and corresponding DM values to investigate a link between respiration rate and DM value. Examining the data with this perspective is very novel and additionally very little information on respiration rates is available for SC and SL sweet cherries cultivars in the literature.

    Table 6 shows the respiration rates for a) SH and b) SC cherries at different colour levels for the 2018 growing year and how they were affected by respiration rate assessment temperature (0.5, 5, and 10 °C). Table 6 also shows the respiration rates for a) SH, b) SC, and c) SL cherries at different colour levels for the 2021 growing year and how they are affected by respiration rate assessment temperature. Please note respiration data is incomplete for the 2019 growing year because of data constraints due to equipment difficulties and therefore no statistical analysis was performed on the available 2019 respiration data. As little information exists in the literature for SC and SL cherries, we have included the incomplete respiration data. Table 6 also shows average color data and average DM data for the cherries collected at the different colour levels. Additionally, Table 6 shows data on the DM (%) bins containing the highest proportion of cherries for each cultivar in each growing year at each colour level (histograms for each cultivar for individual growing year not shown).

    Table 6 shows the average colour measured for the cherries harvested at the 3-4, 4-5, and 5-6 colour levels all varied slightly depending on growing year and cultivar. In both the 2018 and 2019 growing years there was no difference in color levels between SH and SC at harvest. In the 2019 growing year, the SL cherries showed lower average colour values at the 4-5 and 5-6 colour levels compared to the average colour levels of SH and SC cherries at the same level. Nevertheless, results indicated the cherries were harvested and sorted to the desired colour levels. In 2021, average colour was not calculated for SH and SL cherries, although cherries were collected at the 3-4, 4-5, and 5-6 colour levels, as in previous years, and can be considered to have been within range. The average colour level was calculated for SC cherries in 2021, as SC cultivar received comprehensive study over all growing years (2018, 2019 and 2021). The calculated colour level values for SC cherries in the 2021 growing year at the 3-4, 4-5, and 5-6 colour levels were 3.5, 4.8, and 5.6, respectively.

    Table 6 shows the lower the respiration rate assessment temperature, the lower the respiration rate, which was expected as cherries are recommended to be stored at 0.5 °C to ensure quality retention due to this fact[1]. In 2018, SH respiration rate values were consistently lower than SC cherries at 0.5 and 5 °C. However, at 10 °C the respiration rate values become comparable between cultivars (Table 6). Comparing between colour level, SH at colour level 3-4 showed the lowest respiration rate at 0.5 °C but had the highest respiration rate when assessed at 5 °C (Table 6). While SC 5-6 cherries at the 5 °C respiration rate assessment temperature showed a significantly lower respiration rate compared to respiration rates measured for SC 3-4 and SC 4-5 cherries at 5 °C (Table 6).

    In 2021, SH and SC respiration rates were more comparable at 0.5 and 10 °C, but at 5 °C, SH respiration rates were higher than SC at the 3-4 and 4-5 colour levels while SC cherries showed a higher respiration rate when assessed at 5 °C compared to the SH cherries at the 5-6 colour level (Table 6). SH respiration rates in 2021 were consistent at 0.5 and 10 °C for all colour levels (Table 6). However, at 5 °C SH cherries at the 5-6 colour level had the lowest respiration rate for all three of the colour levels and the SH cherries at the 3-4 colour level showed the highest respiration rate. This occurred in both 2018 and 2021 (Table 6). The respiration rates of SC cherries were not affected by colour level when assessed at 0.5 °C, but at the 5 °C respiration rate assessment temperature, 2018 SC cherries at 5-6 colour level had lower respiration values (Table 6), while 2021 SC cherries at the 4-5 colour level showed a lower respiration rate value (Table 6). Comparing colour levels, SL cherries at the 5-6 colour level had the highest respiration rates at 0.5 and 10 °C (Table 6). However, at 5 °C, all SL colour levels had comparable respiration values (Table 6). Further, in 2021, all cultivars at 0.5 °C assessment temperature showed respiration rates that were comparable between all colour levels except for SL 5-6. This respiration rate value was significantly higher than the respiration rates measured for the SL 3-4 and 4-5 colour levels and was also higher than the respiration rates determined for SH and SC at the 5-6 colour level. Interestingly, the respiration rate assessed at 0.5 °C for SL at the 5-6 colour level was not significantly different than the respiration rate assessed at 5 °C for SL at the 5-6 colour level (Table 6).

    To further discuss the results presented above, a main source of decreasing TA values in cherries is high respiratory activity[11]. Therefore, linking flavour quality, which is affected by TA levels, to differences in respiration rates is reasonable. Higher respiration rate assessment temperatures were related to higher respiration rates of cherries as seen in Table 6, which was not unexpected and again points to the importance of keeping temperature near 0.5 °C during storage. Additionally, the temperature cherries experience during a growing season affects the respiration rate of the harvested fruit, as Ross et al.[1] found the average temperature and the average high temperature measured in an orchard was positively correlated with the cherry respiration rate at both 5 and 10 °C. Therefore, understanding factors that impact respiration rate, and ensuring cherries are harvested under conditions that ensure a low respiration rate is of significant importance. Table 6 (2021 data) suggests the colour level with the lowest respiration rates for SC cherries is 4-5, which is supported by previous work[1]. While Table 6 (2018 data) suggests the 5-6 colour level gives the lowest respiration rates for SC cherries. When this information is combined with the TA value data, the peak TA values for SC cherries occurs at the 4-5 level and 5-6 colour levels. SH cherries showed that for respiration rate assessed at 0.5 °C, the colour level with the consistently lowest respiration rate was 3-4, but at the 5 °C respiration rate assessment temperature, which is a more abusive temperature, the 5-6 colour level showed the lowest respiration rate in both 2018 and 2021. The highest TA values were seen at the 5-6 colour level for SH cherries. SL cherries show highest TA values at the 3-4 and 4-5 colour level in the 2019 growing year, but insufficient respiration rate data is available in 2019 to comment further. However, the data in Tables 14 indicate that colour is not a reliable indicator of maturity and/or flavor quality. Cherries of the same colour may differ in DM, SS and TA due to cultivar and growing conditions. Figure 1 shows that not all cherries at the same colour level are at the same DM both within and between cultivars. There is a range of DM values for each cultivar in the 3-4, 4-5, and 5-6 colour ranges. However, it is noted the distribution of DM shifted to the right (higher levels) in the 5-6 colour cherries. The work of Palmer et al.[25] and Toivonen et al.[6] have indicated the importance of DM as a fruit quality metric. The implications of colour, DM, and respiration rate results on flavour quality and DM standards are discussed below.

    Associations between colour and DM at harvest with sweet cherry flavour quality attributes and respiration rates were statistically examined using Pearson's correlation coefficient from all available data over all growing years to investigate whether there may be colour/DM levels that are associated with lower respiration rates (Table 7) and could be indicative of when harvest should be performed (i.e. maturity). It was found that colour at harvest was positively correlated with SS at harvest and SS after storage (r = 0.845, p ≤ 0.0005, and r = 0.684, p ≤ 0.005, respectively). Colour at harvest was also positively correlated with DM at harvest (r = 0.768, p ≤ 0.0005). This was expected as darker cherries of a certain cultivar are generally more developed or mature; sugar content (main contributor to DM) and TA increases upon fruit development[1,6,22]. Neither colour or DM at harvest were correlated with SS/TA ratio at harvest or after storage (Table 7). Over all cultivars, no correlation was seen between respiration rate at any assessment temperature and colour level (Table 7). No significant correlations were found between respiration rate assessed at 0.5 and 10 °C and DM (Table 7). A significant negative correlation (r = −0.514, p ≤ 0.025) was found between respiration rate at 5 °C and DM. It was speculated that a correlation between respiration rate and DM was not observed when assessed at 0.5 °C, as this temperature is very low and effectively slows metabolic activity regardless of physiological status of the cherry. No observed correlation between respiration rate assessed at 10 °C and DM was speculated to be due to 10 °C being such an abusive temperature that even physiologically healthy cherries show elevated respiration rates when stored at 10 °C, and likely experienced increased flavour quality deterioration, which could be tested by measuring SS and TA values. Over all cultivars at 5 °C, cherries with lower DM tended to have higher respiration rates, and may be susceptible to more rapid quality deterioration at non-ideal temperatures such as 3−5 °C, which can be encountered in the cherry industry, particularly during export shipping (personal communication, Dr. Peter Toivonen, May, 2021). This points to the importance of good temperature control during storage and diverting lower DM cherries to the domestic and/or rapid consumption market vs export market. Colour was not correlated with TA, while DM at harvest was positively correlated with TA at harvest and upon storage (Table 7), which is relevant for flavour quality. These results indicate that DM has a greater influence on flavour quality attributes than cherry colour.

    Table 7.  Correlations between colour and dry matter at harvest with sweet cherry flavour quality attributes and respiration rate.
    Relationship assessed for Sweetheart*,
    Staccato, and Sentennial**
    cultivars over 2018, 2019,
    and 2021 growing seasons
    Pearson's
    correlation
    coefficient
    Significance
    level
    (p value)
    Colour correlated with
    Soluble solids at harvest r = +0.845 p ≤ 0.0005
    Soluble solids at 28-d storage r = +0.684 p ≤ 0.005
    Dry matter at harvest r = +0.768 p ≤ 0.0005
    Dry matter correlated with
    Soluble solids at harvest r = +0.871 p ≤ 0.0005
    Soluble solids at 28-d storage r = +0.776 p ≤ 0.0005
    Colour at harvest r = +0.769 p ≤ 0.0005
    Titratable acidity at harvest r = +0.439 p ≤ 0.05
    Titratable acidity at 28 d storage r = +0.398 p ≤ 0.10
    Respiration rate at 5 °C r = −0.514 p ≤ 0.025
    Insignificant correlations
    Colour and titratable acidity at harvest r = +0.099 p = 0.696
    Colour and titratable acidity at 28 d storage r = +0.100 p = 0.692
    Colour and soluble solids to titratable
    acidity ratio at harvest
    r = +0.218 p = 0.383
    Colour and soluble solids to titratable
    acidity ratio at 28 d storage
    r = +0.073 p = 0.774
    Colour and respiration rate at 0.5 °C r = +0.252 p = 0.364
    Colour and respiration rate at 5 °C r = −0.206 p = 0.462
    Colour and respiration rate at 10 °C r = +0.084 p = 0.766
    Dry matter and soluble solids to titratable
    acidity ratio at harvest
    r = −0.135 p = 0.595
    Dry matter and soluble solids to titratable
    acidity ratio at 28 d storage
    r = −0.227 p = 0.365
    Dry matter and respiration rate at 0.5 °C r =−0.125 p = 0.657
    Dry matter and respiration rate at 10 °C r = −0.181 p = 0.519
    *Only 2018 and 2019 growing season data available; **only 2019 growing season data available.
     | Show Table
    DownLoad: CSV

    Further, specific cultivar respiration rate and DM relationships were also examined (data not shown). For SH cherries, a negative correlation was determined between respiration rate assessed at 5 °C and DM (p ≤ 0.1), yet this correlation was not seen for SL cherries. Based on statistical parameters SC cherries only showed a negative correlation between respiration rate assessed at 5 °C and DM if a higher p value > 0.1 was used which signifies evidence is not strong enough to suggest a relationship exists. Nevertheless, the statistically significant negative correlation between respiration rate assessed at 5 °C and DM over all cultivars was identified (Table 7).

    Although colour was positively correlated with DM (Table 7), a higher colour may not necessarily indicate a low respiration rate as no significant correlation was observed between colour and respiration rate at any assessment temperature when examined over all cultivars over the growing years tested. Although this highlights the importance of DM in overall quality rather than colour, the data presented thus far suggests certain cultivars achieve different optimal DM values or ranges at maturity that are related to quality retention. In general, higher DM is positive, but is there an upper limit/threshold in terms of higher respiration rate. The lack of correlation between respiration rate assessed at 5 °C and DM for SC and SL cherries seems to indicate a lower optimal DM level for these cultivars compared to SH cherries, as a negative correlation between respiration rate assessed at 5 °C and DM was observed for SH cherries. Again, non-ideal temperatures such as 3−5 °C, can be encountered in the cherry industry, particularly during export shipping, which makes these results extremely relevant to help ensure cherry growers deliver high quality fruit for the export market.

    In 2018, the respiration rate at 5 °C was lowest at the 4-5 and 5-6 colour levels for SH cherries, and the average DM values were ~22% and 25%, respectively. Information from Table 6 shows that 38% of SH fruit were in the 22.5% DM bin indicating the highest percentage of SH cherries at the 4-5 colour level had a DM of 21% to 22.5% while 26% of SH cherries at the 5-6 colour level resided in the 25.5% DM bin indicating the highest percentage of cherries at this colour level had a DM of 24% to 25.5%. For SH cherries in 2021, the lowest respiration rate at 5 °C was at the 5-6 colour level and average DM value was ~23.6%. Information from Table 6 shows that 30% of SH at the 5-6 colour level resided in 24% DM bin indicating the highest percentage of SH cherries at this colour level had a dry mater of 22.5% to 24%. For 2018 SH cherries, titratable acidity, which is important for flavour quality, was highest at the 5-6 colour level where respiration rate assessed at 5 °C was lower. These results imply, that at maturity, cherries tend to a certain DM value or range that corresponds to reduced respiratory activity and promotes quality retention, and would therefore be considered optimal. Based on this data (lower respiration rate (2018 and 2021) and peak TA (2018)), an optimal DM range for SH may be between 22.5%−25% DM or around 23% DM. This optimal DM corresponded to cherries in the 4-5 colour level (21.9%) in 2018, and in the 5-6 colour level (25.2%, 23.6% respectively) in 2018 and 2021.

    2018 respiration rate (assessed at 5 °C) was lowest at the 5-6 colour level for SC cherries and the average DM value was ~22%, respectively. Information from Table 6 shows that 50% of SC cherries resided in the 22.5% DM bin indicating the highest percentage of SC cherries at the 5-6 colour level had a DM of 21% to 22.5% The 2021 respiration rate (assessed at 5 °C) was lowest for SC cherries at the 4-5 colour level and average DM value was ~22% while the highest respiration rate was measured at the 5-6 colour level and the average DM value was ~23.0%. Information from Table 6 shows that 24% and 20% of SC cherries resided in each the 21% and 22.5% DM bins, respectively, indicating the highest percentage of SC cherries at the 4-5 colour level had a DM of 19.5% to 22.5%. For 2021 SC cherries, TA was higher at the 4-5 colour levels, where respiration rate assessed at 5 °C was lowest. Again, these results imply that at maturity cherries tends to a certain DM value or range (optimal) that corresponds to reduced respiratory activity and promotes quality retention. Based on this data (lower respiration rate (2018 and 2021) and peak TA (2018 and 2021)) an optimal DM range for SC may be between 19.5%−22.5% DM or around 22% DM. This optimal DM corresponded to cherries in the 4-5 colour level (22.0%) in 2021, and in the 5-6 colour level (22.4%) in 2018. The data also shows the optimal DM range for SH cherries is higher than the optimal DM range for SC cherries.

    In 2021, for the SL cherries, all colour levels showed the same respiration rate (assessed at 5 °C) and average DM values were 20.5%, 22.6% and 23.5% for the 3-4, 4-5 and 5-6 colour levels, respectively. Information from Table 6 shows that SL cherries at both the 4-5 and 5-6 colour levels, 28% and 24% of the cherries resided in the 22.5% and 24% DM bins indicting the highest percentage of cherries at these colour stages ranged from 21% to 24% DM. For SL, based on the one year of respiration data (2021), determining optimum DM was not as clear. At lower storage temperature (0.5 °C), lower average DM (20.5%−22.6% vs 23.5%) maintained lower respiration rates, but at higher storage temperature (5 and 10 °C) respiration rate did not appear to be affected by DM level. These lower DM values occurred at the 3-4 and 4-5 colour levels.

    Available DM, TA and respiration rate data as discussed suggests the optimal DM range for SH may be between 22.5%−25% DM or around 23% and an optimal dry matter range for SC may be between 19.5%−22.5% DM or around 22% DM, The histogram data over all growing years does further strengthen the justification for suggesting different optimal DM values for different cultivars (Fig. 1). The data over all growing years shows higher proportions of cherries in the 24 % DM bin for SH cherries at the 5-6 colour level which indicated highest proportion of cherries with a DM of 22.5% to 24%. The SC cherries at the 5-6 colour level showed the highest proportion of cherries in the 22.5% DM bin, which indicates the highest percentage of cherries have a DM of 21% to 22.5%; again these DM ranges have been suggested as optimal DM values based on previously discussed respiration data.

    In psychology self-actualization is a concept regarding the process by which an individual reaches their full potential[31]. The data suggests that sweet cherries self-actualize, with the majority of cherries reaching maturity with a DM range that promotes quality retention during storage when growing conditions are favourable. This optimal DM range is different for different cultivars, and growing conditions would be expected to influence the rate and/or ability of this 'self-actualization', as this work and our previous research has shown that environmental factors are correlated with these important quality characteristics[1]. Placing highest importance on distribution of DM levels at the 5-6 colour levels (Fig. 1) is justified as the cherries are the most physiologically mature and will likely exhibit the highest proportion of cherries with optimal DM; however, the optimal DM can occur at other colour ranges and should be used as the primary indicator of maturity. Maturity at harvest is the most important factor that determines storage-life and final fruit quality assweet cherries produce very small quantities of ethylene and do not respond to ethylene treatment; they need to be picked when fully ripe to ensure good flavour quality[32]. It is noted the CTFIL colour standard series goes up to colour level 7, yet a balance needs to be reached between flavour quality optimization vs other quality parameters such as firmness and stem pull force. Supplementary Tables S1S6 provide values of the quality parameters of firmness, stem pull force, stem shrivel, stem browning, pebbling and pitting levels at harvest and after storage for the SH, SC and SL cherries. All of these cherry cultivars exhibited good quality attributes at the 5-6 colour level, as well as lighter colour ranges.

    It is noted that the development of DM standards for different cultivars is a novel concept. This work was positioned as field work that collected cherry data for three cultivars over three growing years in adjacent orchards using the same management practices. Equipment constraints limited respiration rate data collection. As such absolute optimal DM values and/or ranges could not be determined nor was the goal of this study. The goal of this work was to further the concept that different cultivars may reach maturity at different DM levels, which would result in lower respiration rates and higher TA levels at harvest, and after storage, achieving enhanced quality retention. In this regard, absolute optimal DM would be the DM achievable by a cherry cultivar that maximizes flavour attributes and minimizes respiration under ideal conditions. In reality, the absolute optimal DM may or may not be reached during a growing season depending on environmental conditions and orchard management practices; however, cherry cultivars will reach a DM that will be optimal for the growing conditions at harvest maturity, as the present research demonstrates. Developing definitive DM standards to determine optimal harvest points for different cultivars under different environmental conditions should be a direction of research to be further pursued to ensure cherry quality, particularly for cherries subjected to longer term storage and/or cherries destined for the overseas export market.

    The present work is not the first to point to the importance of DM and cherry flavour retention, as an anecdotal report[33] indicated that SH cherries should be harvested at a DM of no higher than 20% or the fruit will lose both sugar and acidity more rapidly during shipping storage. Although this DM value is lower than the DM recommended for SH in the current work, it indicates the importance of DM level and flavour quality in relation to a specific cultivar. The differences between optimal DM for flavour retention in our work and the anecdotal report signifies the complexity of determining DM standards and the impact of growing year/environmental conditions and orchard management practices on optimal DM. Growers will continue to face these complex issues but the present work provides valuable information to growers regarding DM standards for three cultivars.

    It must be noted again that development of absolute DM standards for different cherry cultivars requires more study under rigorous controlled environmental conditions. Additionally, given the impact of environmental conditions on optimal DM, cultivars of interest must be studied over many growing years and orchard conditions to collect a robust data set. Nevertheless, the present research indicates that SH, SC, and SL cultivars have different dry matter values at maturity. The data also shows the DM range for SH cherries at maturity is higher than the DM range for SC cherries at maturity and that for SL, lower DM levels maintained lower respiration rates at lower temperatures, potentially improving ability to maintain quality after harvest.

    Overall, this research showed that DM was a better indicator of flavour quality than colour, as DM was related to both sugars and TA, while colour was only related to sugar. Therefore, this work identified that colour may not be a reliable indicator of maturity and/or flavor quality. This work indicated that cherries of the same colour may differ in DM, SS, and TA due to cultivar type and growing conditions as influenced by growing year. Relative humidity encountered by cherries during the growing season was negatively correlated with TA and higher growing temperatures were positively correlated with TA. This work discovered that sweet cherries may self-actualize, in that when growing conditions are favourable, DM levels may tend towards a certain level at maturity (optimal DM) resulting in superior flavour quality attributes and lower respiration, allowing cherries to reach their full quality potential and ensure quality retention in storage. Therefore, optimal DM can be reached at maturity despite colour. Remaining challenges include development of DM standards for various sweet cherry cultivars and further understanding the impact of growing conditions to better allow for self-actualization and prediction of the optimal DM under those conditions to optimize timing of harvest from year-to-year. Nevertheless, this research based on field work for three sweet cherry cultivars over three growing years, indicated an optimal DM range for SH between 22.5%−25% DM and an optimal DM range for SC between 19.5%−22.5% DM. Interestingly, under the same field conditions, the optimal DM range for SH cherries was higher than the optimal DM range for SC cherries. More analysis is required for determining optimal DM for SL, but the initial data indicates DM in the range of 20.5% to 22.6% maintained lower respiration rates at lower temperature potentially improving ability to maintain quality after harvest.

    The authors confirm contribution to the paper as follows: study conception and design: Ross KA, DeLury NC, Fukumoto L; data collection: Ross KA, DeLury NC, Fukumoto L; analysis and interpretation of results: Ross KA, DeLury NC, Fukumoto L; draft manuscript preparation: Ross KA, DeLury N, Fukumoto L, Forsyth JA. All authors reviewed the results and approved the final version of the manuscript.

    The datasets generated during and/or analysed during the current study are available from the corresponding author on reasonable request.

    We are grateful to the BC Cherry Association for financial support of this research project. We acknowledge Manon Gentes, Gillian Beaudry, and Duncan Robinson for their technical assistance. We are grateful to Brenda Lannard for providing her expertise on using the Felix F750 handheld spectrometer (Felix Instruments, Inc.) to obtain dry matter values and obtaining respiration data. Kelly A. Ross would like to thank and acknowledge Dr. Peter Toivonen for his mentorship, valuable scientific discussions and consistently kind support.

  • The authors declare that they have no conflict of interest.

  • Supplementary Table S1 Numberes of seeds emerged and germiantion rates of freezing treatment in the different planting time.
    Supplementary Table S2 Scaled Estimates using the nominal factors expanded to all levels.
    Supplementary Table S3 The influence of pecan rootstock origin on days to emergence and seedling growth in the first season.
    Supplementary Fig. S1 The visual comparisons of seedling height (A), and stem diameter (B) of the seedstocks from four regions under different seed treatments.
  • [1]

    National Agricultural Statistics Service (NASS). 2023. Pecan production. https://downloads.usda.library.cornell.edu/usda-esmis/files/5425kg32f/n5840623x/ww72cn927/pecnpr23.pdf

    [2]

    Thompson TE, Grauke LJ. 1991. Pecans and other hickories (carya). Acta Horticulturae 1991:839−906

    doi: 10.17660/actahortic.1991.290.19

    CrossRef   Google Scholar

    [3]

    Wells L. 2021. Antoine: slave, creole gardener, and expert grafter of pecan trees. In Plant Breeding Reviews, volume 45, ed. Goldwin I. pp. 1−8. US: John Wiley & Sons, Inc. doi: 10.1002/9781119828235.ch1

    [4]

    Gast RT, Overcash JP. 1980. Pecan rootstocks and scion cultivars produced by commercial nurseries in the southern United States. Pecan South 1:14−18

    Google Scholar

    [5]

    Grauke LJ. 1991. Development of selection criteria for pecan seedstocks. In Pecan Husbandry: Challenges and Opportunities. National Pecan Workshop Proceedings (1 st), Georgia, US, 1990. Beltsville, MD: Agricultural Research Service

    [6]

    Grauke LJ, Thompson TE. 1995. Patterns of rootstock usage in the pecan industry. HortScience 30:431f−431

    doi: 10.21273/hortsci.30.3.431f

    CrossRef   Google Scholar

    [7]

    Grauke LJ, O'Barr RD. 1996. Initial survival of pecan grafts on seedling rootstock of pecan, water hickory, and their interspecific hybrid. HortTechnology 6:45−48

    doi: 10.21273/horttech.6.1.45

    CrossRef   Google Scholar

    [8]

    Reid W. 1997. Rootstock influences yield, nut quality, and leaf analysis of pecan trees. HortScience 32:474G−475

    doi: 10.21273/hortsci.32.3.474g

    CrossRef   Google Scholar

    [9]

    Grauke LJ, Iqbal MJ, Reddy AS, Thompson TE. 2003. Developing microsatellite DNA markers in pecan. Journal of the American Society for Horticultural Science 128:374−80

    doi: 10.21273/jashs.128.3.0374

    CrossRef   Google Scholar

    [10]

    Grauke LJ. 2010. Pecan seed stock selection — regional implications. pp. 42−51. www.sambuz.com/doc/pecan-seed-stock-selection-regional-implications-pdf-document-248893

    [11]

    Mir MM, Parveze MU, Iqbal U, Rehman MU, Kumar A, et al. 2023. Development and selection of rootstocks. In Temperate NutsMir MM, Rehman MU, Iqbal U, Ahmad Mir S. Singapore: Springer. pp. 45−78. doi: 10.1007/978-981-19-9497-5_3

    [12]

    Grauke LJTTE, Wood BW, Storey JB. 2003. Rootstock influence on tree performance. Proceedings of the Texas Pecan Growers Association 1:20−24

    Google Scholar

    [13]

    Grauke LJ, Pratt JW. 1992. Pecan bud growth and freeze damage are influenced by rootstock. Journal of the American Society for Horticultural Science 117:404−6

    doi: 10.21273/jashs.117.3.404

    CrossRef   Google Scholar

    [14]

    Smith MW, Cheary BS, Carroll BL. 2001. Rootstock and scion affect cold injury of young pecan trees. Journal American Pomological Society 55:124−28

    Google Scholar

    [15]

    Smith MW, Goff WD. 2014. Patch budding pecan: girdling, tipping, age, and size of budwood and rootstock for budding; girdling, 2,3,5-triodobenzoic acid and 6-benzylaminopurine for bud forcing. HortTechnology 24:512−18

    doi: 10.21273/horttech.24.5.512

    CrossRef   Google Scholar

    [16]

    Ibacache A, Verdugo-Vásquez N, Zurita-Silva A. 2020. Rootstock: scion combinations and nutrient uptake in grapevines. In Fruit Crops, eds Srivastava AK, Hu C. Amsterdam: Elsevier. pp. 297−316. doi: 10.1016/b978-0-12-818732-6.00021-6

    [17]

    Garcı́a-Gusano M, Martı́nez-Gómez P, Dicenta F. 2004. Breaking seed dormancy in almond (Prunus dulcis (Mill.) D.A. Webb). Scientia Horticulturae 99:363−70

    doi: 10.1016/j.scienta.2003.07.001

    CrossRef   Google Scholar

    [18]

    Hepher A, Roberts JA. 1985. The control of seed germination in Trollius ledebouri: the breaking of dormancy. Planta 166:314−20

    doi: 10.1007/BF00401167

    CrossRef   Google Scholar

    [19]

    Finch-Savage WE, Leubner-Metzger G. 2006. Seed dormancy and the control of germination. New Phytologist 171:501−23

    doi: 10.1111/j.1469-8137.2006.01787.x

    CrossRef   Google Scholar

    [20]

    Bakker J. 2001. Seeds, ecology, biogeography and evolution of dormancy, and germination. C.C. Baskin & J.M. Baskin. Plant Ecology 152:204−5

    doi: 10.1023/A:1011465920842

    CrossRef   Google Scholar

    [21]

    Bou Daher F, Chebli Y, Geitmann A. 2009. Optimization of conditions for germination of cold-stored Arabidopsis thaliana pollen. Plant Cell Reports 28:347−57

    doi: 10.1007/s00299-008-0647-1

    CrossRef   Google Scholar

    [22]

    Peng HZ, Jin QY, Ye HL, Zhu TJ. 2015. A novel in vitro germination method revealed the influence of environmental variance on the pecan pollen viability. Scientia Horticulturae 181:43−51

    doi: 10.1016/j.scienta.2014.10.057

    CrossRef   Google Scholar

    [23]

    Harris MK. 1973. Pecan weevil larval response to some temperatures while in the nut. Progress report. Texas Agricultural Experiment Station, US. 3 pp.

    [24]

    Mulder PG, Jr, Harris MK, Grantham RA. 2012. Biology and management of the pecan weevil (Coleoptera: Curculionidae). Journal of Integrated Pest Management 3:A1−A9

    doi: 10.1603/IPM10027

    CrossRef   Google Scholar

    [25]

    Dodge FN. 1944. A method of measuring the degree of kernel development of samples of pecan. Journal of the American Society for Horticultural Science 45:151−57

    Google Scholar

    [26]

    Cavieres LA, Sierra-Almeida A. 2018. Assessing the importance of cold-stratification for seed germination in alpine plant species of the High-Andes of central Chile. Perspectives in Plant Ecology, Evolution and Systematics 30:125−31

    doi: 10.1016/j.ppees.2017.09.005

    CrossRef   Google Scholar

    [27]

    Chen D, Yuan Z, Luo X, Yang L, Chen X, et al. 2022. Cold stratification requirements for seed dormancy-break differ in soil moisture content but not duration for alpine and desert species. Plant and Soil 471:393−407

    doi: 10.1007/s11104-021-05212-4

    CrossRef   Google Scholar

    [28]

    Cheng J, Huang H, Liu W, Zhou Y, Han W, et al. 2022. Unraveling the effects of cold stratification and temperature on the seed germination of invasive Spartina alterniflora across latitude. Frontiers in Plant Science 13:911804

    doi: 10.3389/fpls.2022.911804

    CrossRef   Google Scholar

    [29]

    Rawat JMS, Tomar YK, Rawat SS. 2008. Effect of stratification on seed germination and seedling performance of wild pomegranate. Progressive Agriculture 8:15−16

    Google Scholar

    [30]

    Song Y, Li X, Zhang M, Xia G, Xiong C. 2023. Effect of cold stratification on the temperature range for germination of Pinus koraiensis. Journal of Forestry Research 34:221−31

    doi: 10.1007/s11676-022-01540-y

    CrossRef   Google Scholar

    [31]

    Rahemi A, Gradziel TM. 2024. Seed germination of almond species. The Almonds and Related Species. Cham: Springer International Publishing. pp. 141−44. doi: 10.1007/978-3-031-58938-6_6

    [32]

    Loayza AP, García-Guzmán P, Carozzi-Figueroa G, Carvajal DE. 2023. Dormancy-break and germination requirements for seeds of the threatened Austral papaya (Carica chilensis). Scientific Reports 13:17358

    doi: 10.1038/s41598-023-44386-y

    CrossRef   Google Scholar

    [33]

    Yüceda C, Gültekin HC. 2011. Effects of cold stratification and sowing time on germination of almond (Amygdalus communis L.) and wild almond (Amygdalus orientalis L.) seeds. African Journal of Agricultural Research 6:3522−25

    doi: 10.5897/AJAR11.600

    CrossRef   Google Scholar

    [34]

    Bashabsheh N, Al-Ramamneh EAD, Alhrout H, Al-Tawaha AR, Al-Rawashdeh ZB. 2018. Effects of pre-treatment solution, soaking period and cultivar on germination of pistachio (Pistacia vera) seeds. Research on Crops 19:211−16

    doi: 10.5958/2348-7542.2018.00031.1

    CrossRef   Google Scholar

    [35]

    Cohn MA. 1996. Chemical mechanisms of breaking seed dormancy. Seed Science Research 6:95−99

    doi: 10.1017/S0960258500003111

    CrossRef   Google Scholar

    [36]

    Nguyen DQ, Phan TPH, Dao VT. 2015. Effect of storage time and pretreatment on seed germination of the threatened coniferous species Fokienia hodginsii. Plant Species Biology 30:291−96

    doi: 10.1111/1442-1984.12062

    CrossRef   Google Scholar

    [37]

    Otani M, Zheng L, Kawakami N. 2024. Genetic, epigenetic, and environmental control of seed dormancy and germination. In Seed Dormancy, Kawakami N, Sato K. New York, NY: Humana. Vol 2830. pp. 3−12. doi: 10.1007/978-1-0716-3965-8_1

    [38]

    Tuan PA, Kumar R, Rehal PK, Toora PK, Ayele BT. 2018. Molecular mechanisms underlying abscisic acid/gibberellin balance in the control of seed dormancy and germination in cereals. Frontiers in Plant Science 9:668

    doi: 10.3389/fpls.2018.00668

    CrossRef   Google Scholar

    [39]

    Graeber K, Linkies A, Steinbrecher T, Mummenhoff K, Tarkowská D, et al. 2014. DELAY OF GERMINATION1 mediates a conserved coat-dormancy mechanism for the temperature- and gibberellin-dependent control of seed germination. Proceedings of the National Academy of Sciences of the United States of America 111:E3571−E3580

    doi: 10.1073/pnas.1403851111

    CrossRef   Google Scholar

    [40]

    Nishimura N, Tsuchiya W, Moresco JJ, Hayashi Y, Satoh K, et al. 2018. Control of seed dormancy and germination by DOG1-AHG1 PP2C phosphatase complex via binding to heme. Nature Communications 9:2132

    doi: 10.1038/s41467-018-04437-9

    CrossRef   Google Scholar

    [41]

    Yan A, Chen Z. 2020. The control of seed dormancy and germination by temperature, light and nitrate. The Botanical Review 86:39−75

    doi: 10.1007/s12229-020-09220-4

    CrossRef   Google Scholar

  • Cite this article

    Wang X, Kubenka K, Hilton A, Chatwin W, Cox T, et al. 2025. The effects of freezing and stratification on pecan (Carya illinoinensis) seed germination and seedling growth. Technology in Horticulture 5: e002 doi: 10.48130/tihort-0024-0030
    Wang X, Kubenka K, Hilton A, Chatwin W, Cox T, et al. 2025. The effects of freezing and stratification on pecan (Carya illinoinensis) seed germination and seedling growth. Technology in Horticulture 5: e002 doi: 10.48130/tihort-0024-0030

Figures(3)  /  Tables(5)

Article Metrics

Article views(766) PDF downloads(140)

ARTICLE   Open Access    

The effects of freezing and stratification on pecan (Carya illinoinensis) seed germination and seedling growth

Technology in Horticulture  5 Article number: e002  (2025)  |  Cite this article

Abstract: Pecan (Carya illinoinensis) cultivation is crucial for commercial production and relies on selecting rootstocks adapted to local environments. Historically, pecan breeding has prioritized scion improvement over rootstock selection due to propagation challenges. However, rootstocks significantly impact scion growth, phenology, and productivity. Pecan nurseries use open-pollinated seeds from regionally favored cultivars (seedstocks) as rootstocks, and seedstock influences germination. Challenges arise from seed dormancy, with some varieties stratification or having thick shells, which affect germination and seedling growth. Pecan nurseries use freezing to eliminate pecan weevil infestations and stratification to synchronize seed germination, but their effects are not well quantified. This study investigates how freezing and stratification impact seed germination and seedling growth across 12 pecan seedstocks from diverse origins. Results indicate that both freezing and stratification, or their combination significantly affect seed germination. Stratification improved germination rates, with non-stratified frozen seeds averaging only 15.7% compared to 48.5% for stratified seeds. Stratified seeds also emerged faster, averaging 18 d, whereas non-stratified seeds took 37 d. The effect of stratification on germination was not influenced by freezing. Although freezing reduced germination rates, especially when combined with stratification, seedstock origins did not significantly affect germination. Stratification interacted significantly with northern and southern origins. The study underscores the need for a nuanced approach to seed treatment. While stratification is crucial for enhancing germination and seedling growth, freezing treatments should be optimized to balance pest control with seed viability. Future research should focus on refining these treatments to minimize their negative impacts.

    • Pecan (Carya illinoinensis (Wangenh.) K. Koch) is a tree species with a large geographic range endemic to North America, producing a drupe containing an edible seed or nut. This nut is not only a popular snack but also a key ingredient in various culinary dishes, contributing significantly to the US agricultural economy. The pecan industry is valued at approximately USD$460 million (271.45 pounds in production) in 2023, underscoring its economic importance and the role it plays in the livelihoods of many farmers and producers[1]. Native pecans have desirable traits adapted to local climates but require horticultural improvement in traits such as nut size, disease resistance, and nut yield to support commercial production[2]. Commercial pecan production began in the mid-1800s when an enslaved gardener named Antoine (no known last name) grafted 126 pecan trees at Oak Alley Plantation in St. James Parish, Louisiana, USA[3]. Since that time, pecan genetic improvement has primarily focused on the grafted scion due to the difficulty and lack of clonal propagation techniques for rootstocks. To date, the United States has become the largest producer of pecans, accounting for around 80% of the global supply. The leading states in production — New Mexico, Georgia, and Texas, — have developed extensive orchards that thrive in their favorable climates.

      Over the years, the focus of genetic improvement in pecans has primarily centered on the grafted scion, as the challenges of clonal propagation for rootstocks have limited options. However, the selection of appropriate rootstocks is crucial, as it significantly influences the health, growth, phenology, and productivity of the grafted trees[411]. In optimal conditions, pecan yields can reach up to 2,000 pounds per acre[6,12]. This productivity highlights the importance of ongoing research and horticultural practices aimed at enhancing nut size, disease resistance, and overall yield, ensuring the long-term viability of the pecan industry. Pecan growers and the nursery industry commonly use open-pollinated seeds from regionally adapted cultivars for rootstock production. Seedstock selection influences valuable characteristics such as improved germination, vigor, budbreak timing, and/or abiotic stress tolerance[1315]. Factors influencing the choice of seedstock include seed availability, seed fill, seed size, seedling vigor, seedling uniformity, and seedling root characteristics[6,11,16]. Generally, well-filled seeds are considered essential for good germination, with round seeds being preferred over long seeds due to improved performance in some mechanical planters[6]. Smaller seeds are often preferred when purchasing seeds due to the greater quantity per kilogram, maximizing potential seedling production[12]. One of the long-term goals of the USDA ARS Pecan Breeding Program is to improve regionally adapted pecan rootstocks through seedstock selection.

      Pecan trees, native to temperate regions, exhibit a lower cold tolerance compared to other hickory species in the Carya genus. This characteristic can complicate the seed germination process, as breaking seed dormancy is crucial for overcoming the physiological and environmental barriers that inhibit germination[1721]. Some pecan varieties have characteristics such as a thick shell, strong shell suture, or specific stratification preference, leading to challenges such as slow or uneven germination and weak seedling growth.

      To enhance germination rates and improve seedling vigor, cold stratification—a process where seeds are exposed to cold, moist conditions for a specified period — is commonly employed in pecan nurseries. This method mimics natural winter conditions, promoting biochemical changes within the seeds that facilitate germination[4,11,22]. However, the specific effects of cold stratification on seedling growth remain poorly quantified, with limited research available on optimal conditions and outcomes. In contrast, freezing seeds before germination has been a practice aimed at killing pests like the pecan weevil[23,24]. This method, while effective for pest control, differs fundamentally from stratification. Freezing may halt all seed metabolic processes, potentially leading to reduced viability, whereas stratification enhances germination by preparing the seed for growth. Understanding these processes is vital for optimizing pecan cultivation and ensuring robust seedling development.

      The USDA Pecan Breeding & Genetics Program conducted a complex seed germination experiment to investigate the effect of low temperatures on seed germination and seedling growth in the nursery. In this study, open-pollinated seeds from 12 seedstocks originating from different geographical locations were treated in combinations of freezing and stratified treatments. Non-frozen, non-stratified seeds were used as the control.

    • In this study, 12 seedstocks originating from different locations ranging from Santa Catarina, San Luis Potosí, Mexico, to Peruque, Missouri, United States of America (Table 1), were used to test the effects of freezing and stratification treatments on seed germination and seedling growth. The seedstocks can be grouped by eastern, southern, western, and northern provenances based on their geographical origins. These trees were either planted on their roots or grafted 20 or more years ago (Table 1) and maintained in the USDA-ARS National Collection of Genetic Resources for Pecans and Hickories (Carya) orchards in Brownwood and Somerville, TX, USA.

      Table 1.  The geographical origin of the 12 pecan seedstocks and seed source in the USDA-ARS National Clonal Germplasm Repository (NCGR) for pecans and hickories.

      Seedstock Orchard Row Tree Provenance Origin Grafted date
      87MX1-2.2 CSP 4 3 Southern Santa Catarina, San Luis Potosi, MX 1990*
      87MX5-1.7 CSP 16 9 Southern Jaumave, Tamaulipas, MX 1990*
      Frutoso BWRom 109 23 Southern Parras, Coahuila, MX 1992
      Elliott BWV 5 42 Eastern Milton, Santa Rosa, FL 1993
      Moore BWV 4 39 Eastern Waukeenah, Jefferson, FL 1993
      Giles BWV 6 11 Northern Chetopa, Cherokee, KS 1991
      Major BWV 6 21 Northern Green River, Henderson, KY 1991
      Peruque BWV 8 36 Northern Peruque, St. Charles, MO 1991
      Posey BWV 7 7 Northern Gibson, IN 1991
      Riverside BWV 3 16 Western Big Valley, Mills, TX 2005
      San Felipe BWV 6 20 Western Del Rio, Val Verde, TX 2003
      VC1-68 CSP 1 15 Western Phoenix, Maricopa, AZ 1995
      * One-year-old seedlings from open-pollinated seeds were planted.

      Open-pollinated seeds were collected as a seedstock from these mature maternal trees in the fall of 2008. Eighty seeds from each seedstock were individually weighed, measured, and divided into 20 nut lots for various treatments. Two lots (2 × 20 seeds) of each seedstock were frozen at −18 °C for 7 d[23,24], while another two lots (2 × 20 seeds) were stored in a refrigerator at 4 °C for 7 d. The first batch (consisting of 20 frozen and 20 non-frozen seeds of each seedstock) was planted in 10.2 cm × 10.2 cm × 60 cm pots, filled with pine bark moss, in the greenhouse in Brownwood, TX, USA on 9 Jan 2009 (first planting). In the second batch, half of the frozen seeds (20) and half of the non-frozen seeds (20) were stratified by placement in 16.5 cm × 14.9 cm Ziploc sandwich bags (20 seeds per bag), layered with moisturized perlite, kept in the refrigerator for 50 d, and planted on 27 Feb 2009 (second planting). Consequently, there were four treatment combinations: Frozen/Non-stratified, Frozen/Stratified, Non-frozen/Stratified, and Non-frozen/Non-stratified (control).

    • Before treatments, seeds were measured for seed length (measured from the base and apex in mm), seed height (measured perpendicular to the plane of the suture at the widest point in mm), seed width (measured in the plane of the suture at the widest point in mm), and seed buoyancy (g). Seed buoyancy is measured as the rise (in mL) in a volume of water at room temperature (20−25 °C) converted to grams[25]. Seed density was calculated using the formula: seed density = seed weight (g)/(seed weight (g) + seed buoyancy (g)). Seed density is an important indicator of seed quality and was used to investigate its effect on seed germination and seedling growth.

      The planting and germination dates were recorded on the calendar day and converted to Julian days. The germination days of emergence were calculated by subtracting the Julian planting date from the Julian germination date to determine the total number of days it took for the seeds to emerge. The number of emerged and non-emerged seeds was counted, and the percentage of emerged seeds in each treatment was calculated. Seedling heights in millimeters were measured from the soil line to the top of the seedling, and stem diameters in millimeters were taken approximately 5 mm above the soil line using calipers on 19 Jun 2009 (during the first growing season). Since the differing treatments required separated planting dates, the growth rates were calculated using the following formula: height or diameter growth rate (mm/day) = height (mm) or diameter (mm)/(measuring Julian days − germination Julian days).

    • All analyses were performed with JMP® Pro 17.0.0 (SAS Institute Inc). The following parameters were analyzed: 1) the effect of freezing and stratification treatment on the seed germination rates for the first and second plantings separately, using a Multinominal Logistic Regression; 2) the effects of the freezing and stratified treatments and their interactions using the Likelihood Ratio Tests in the Nominal Logistic Model, and; 3) the effects of the treatments on seedstocks, using the Standard Least Squares model under the hypothesis of no effect of treatments on seed germination. The effects of seedstocks, seed treatments, and treatment × origin interactions were analyzed using a one-way analysis of variance (ANOVA). The means of the days from seed plantings to seedling emergence (days to emergence), seedling height and stem diameter were compared using the Tukey-Kramer HSD test. All variables were compared using a principal component analysis (PCA).

    • Overall, treating seeds by freezing, stratification, or their combination significantly affected seed germination across the 12 seedstocks (p < 0.05) (Table 2, Fig. 1). The freezing treatment significantly impacted seed germination across seedstocks, with many frozen seeds failing to germinate (Fig. 1a). Nearly half of all seedstocks greater than 40% germination failure after freezing (Fig. 1b, Supplementary Table S1). Some seedstocks, such as 'Major', were particularly impacted by freezing compared to others (Fig. 1b). The interaction of the stratified and freezing treatments with seed germination rate was only significant when the seedstock maternal family was included as a factor (likely due to high variation across the different seedstocks) (Table 2). Compared to non-frozen seeds, the germination rate of frozen seeds was reduced from 0% to 45% (average 15.71%) in the first planting (i.e. non-stratified), and 0% to 90% (average 48.5%) in the second planting (i.e. stratified) (Supplementary Table S1). This indicates that the freezing treatment decreased seed germination rates, and frozen/stratified seeds had lower germination rates than non-frozen/stratified seeds (Fig. 1b). Variation in treatment response between seedstocks was observed. Some seedstocks, like 'Moore', 87MX1-2.2, and 87MX5-1.7, maintained high germination rates across all treatments, while others like 'Riverside', 'Peruque', 'San Felipe, and 'Elliott' showed significantly lower germination rates (Fig. 1b, Supplementary Table S1). Overall, the days of emergence were not significantly affected by freezing or stratified treatment or their combination when considering seedstock origins, with 25.4, 27.1, 27.8, and 28.5 d of emergence for southern, western, eastern, and northern respectively. However, stratified seeds germinated faster than non-stratified seeds, regardless of frozen or not (Fig. 2, Table 3).

      Table 2.  The treatment effect tests on the seed germination rates.

      Source Nparm DF L-R ChiSquare Prob > ChiSq
      Without considering seedstocks
      Frozen/Non-Frozen 1 1 144.1823 < 0.0001**
      Stratified/Non-Stratified 1 1 11.5772 0.0007**
      Frozen/Non-Frozen*Stratified/Non-Stratified 1 1 38.7198 < 0.0001**
      With considering seedstocks
      Frozen/Non-Frozen 1 1 91.1617 < 0.0001**
      Stratified/Non-Stratified 1 1 0.0000 0.9964
      Frozen/Non-Frozen*Stratified/Non-Stratified 1 1 0.0000 0.9961
      Seedstock 11 11 92.2452 < 0.0001**
      Seedstock*Frozen/Non-Frozen 11 11 40.7617 < 0.0001**
      Seedstock*Stratified/Non-Stratified 11 11 30.0626 0.0015**
      Seedstock*Frozen/Non-Frozen*Stratified/Non-Stratified 11 11 20.1627 0.0432*
      Nparm: The number of parameters associated with this effect; DF: The degree of freedom for the effect test; L-R ChiSquare is the likelihood ratio chi-square test statistic for the hypothesis that the corresponding regression parameter is zero, given the other terms in the model. Prob > ChiSq: The probability of obtaining a greater chi-square value if the specified model fits no better than the model that includes only an intercept. * Indicates significance at p < 0.05 and ** at p < 0.01.
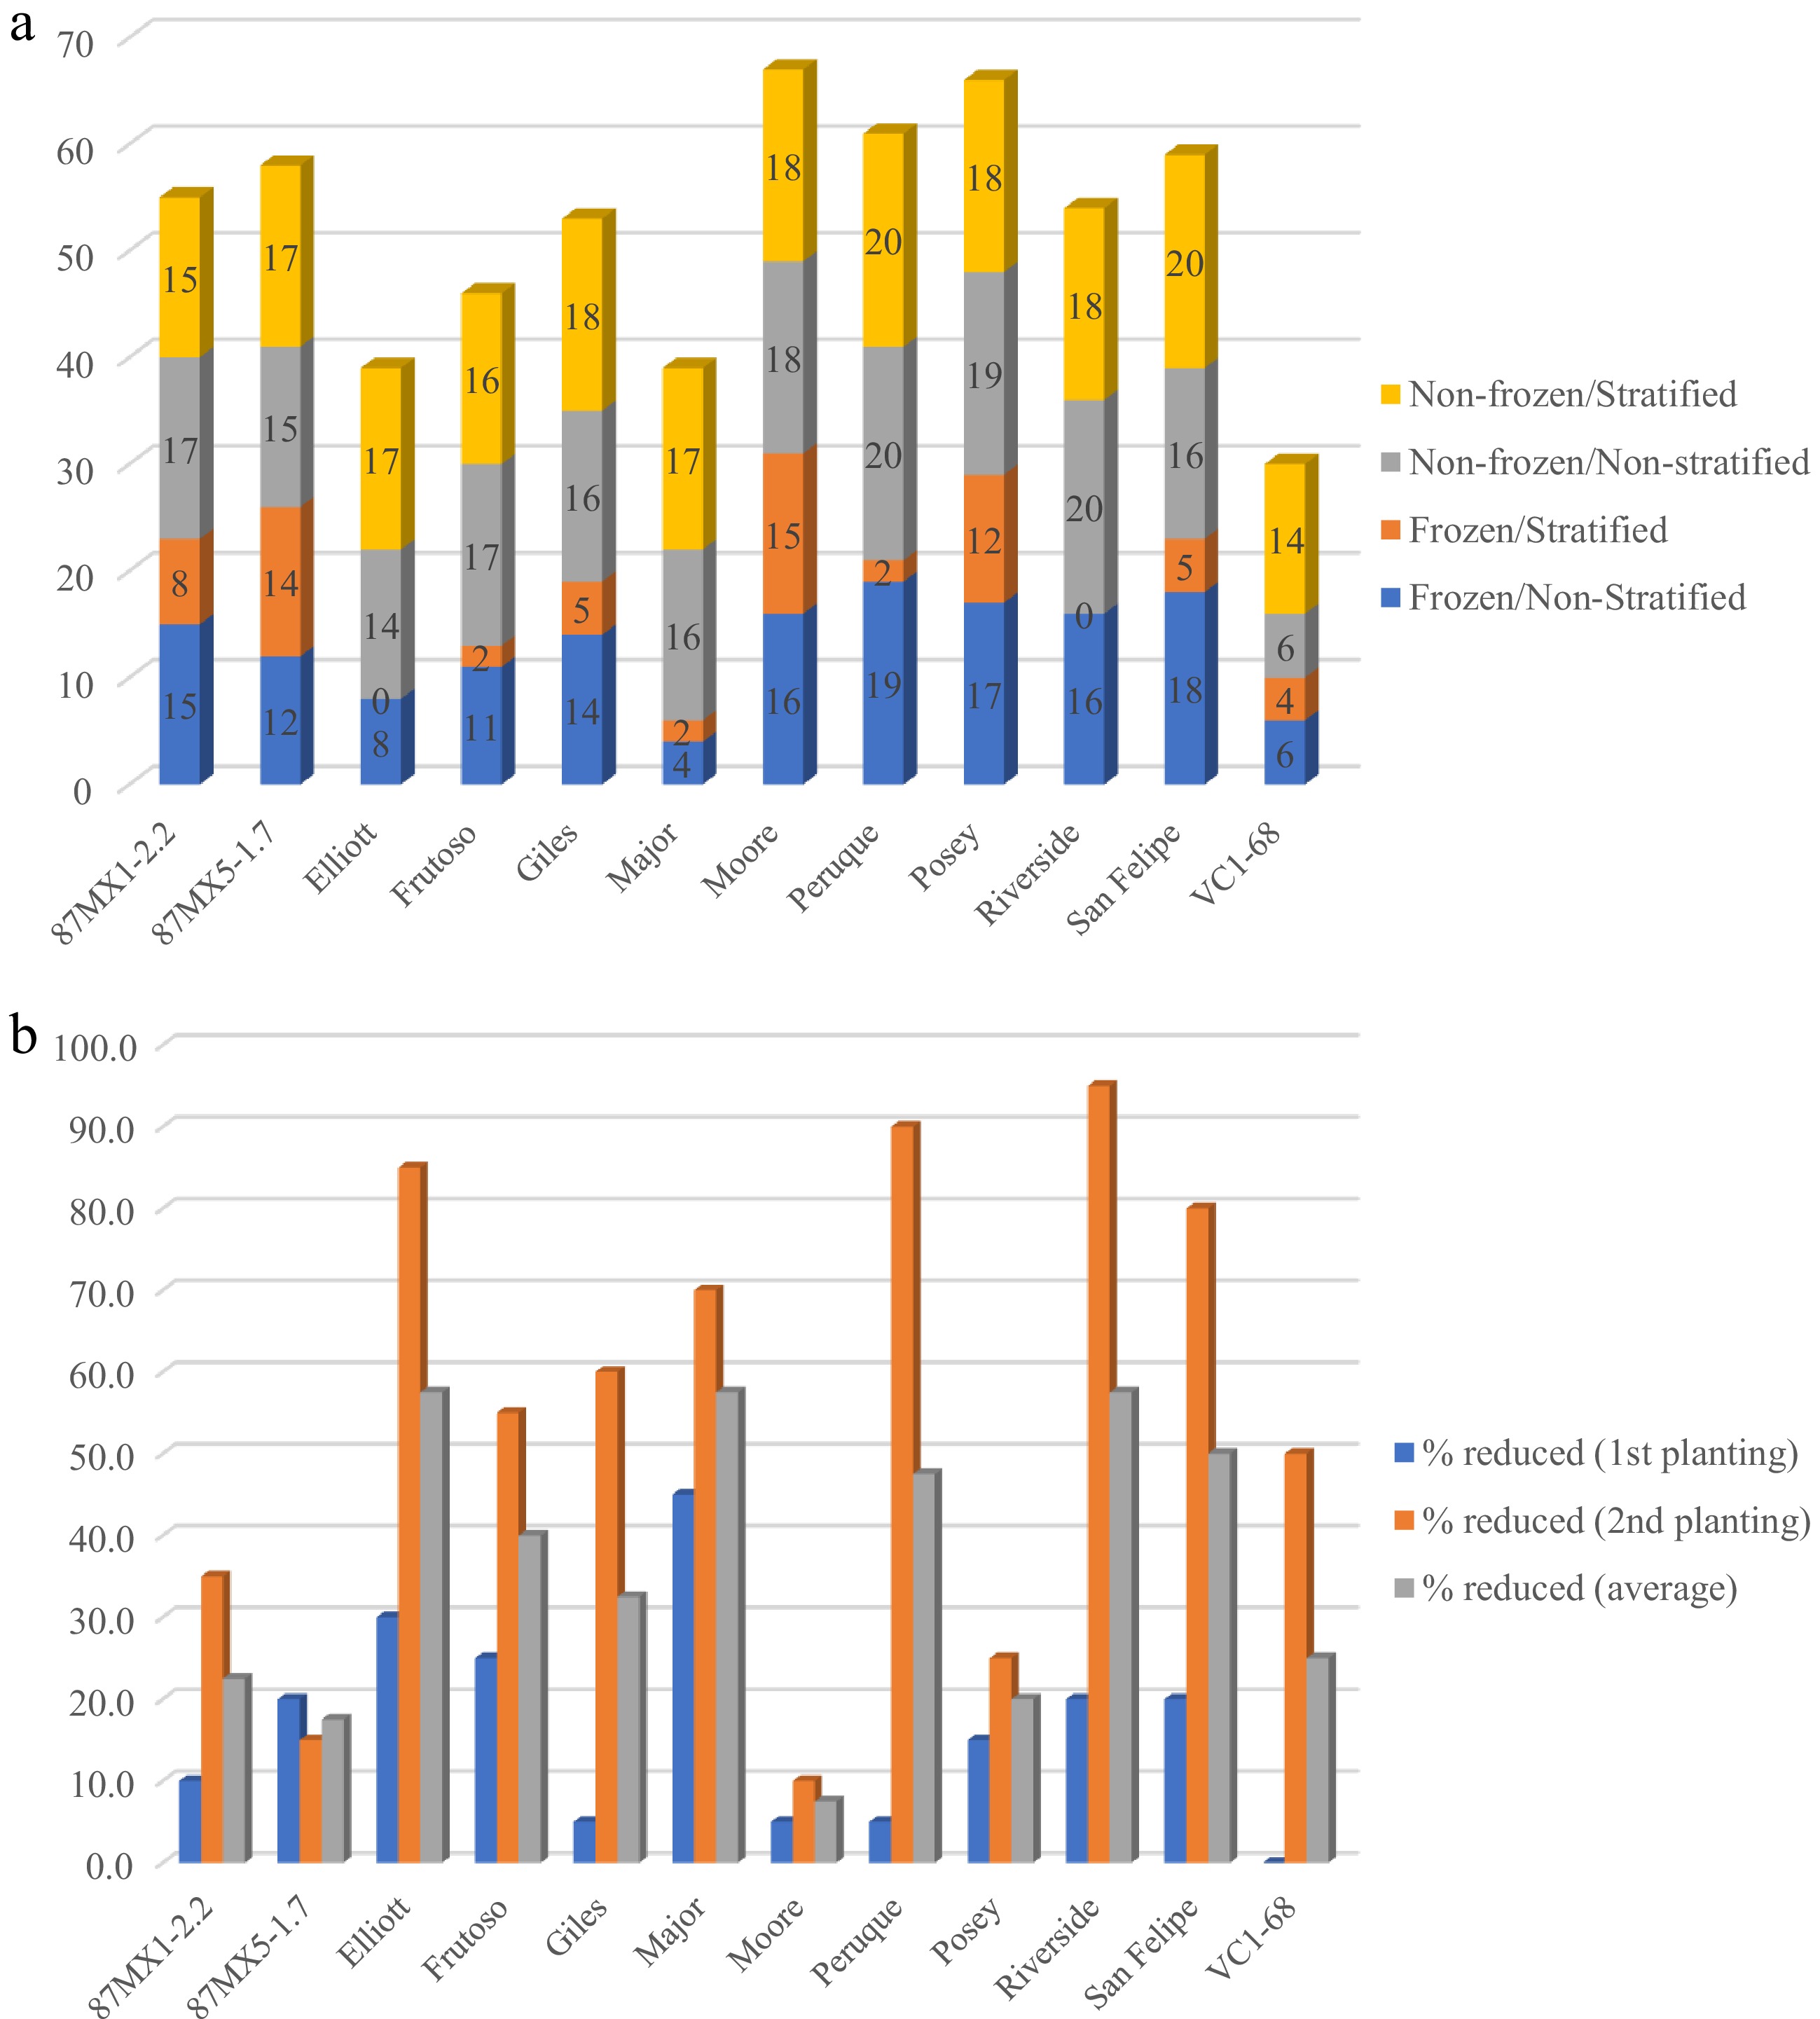
      Figure 1. 

      (a) Numbers of germinated seeds of 12 seedstocks for each treatment of 20 seeds, and (b) percentage of seeds that failed to germinate in the first planting (frozen and non-frozen but non-stratified seeds) and the second planting (frozen and non-frozen but stratified).
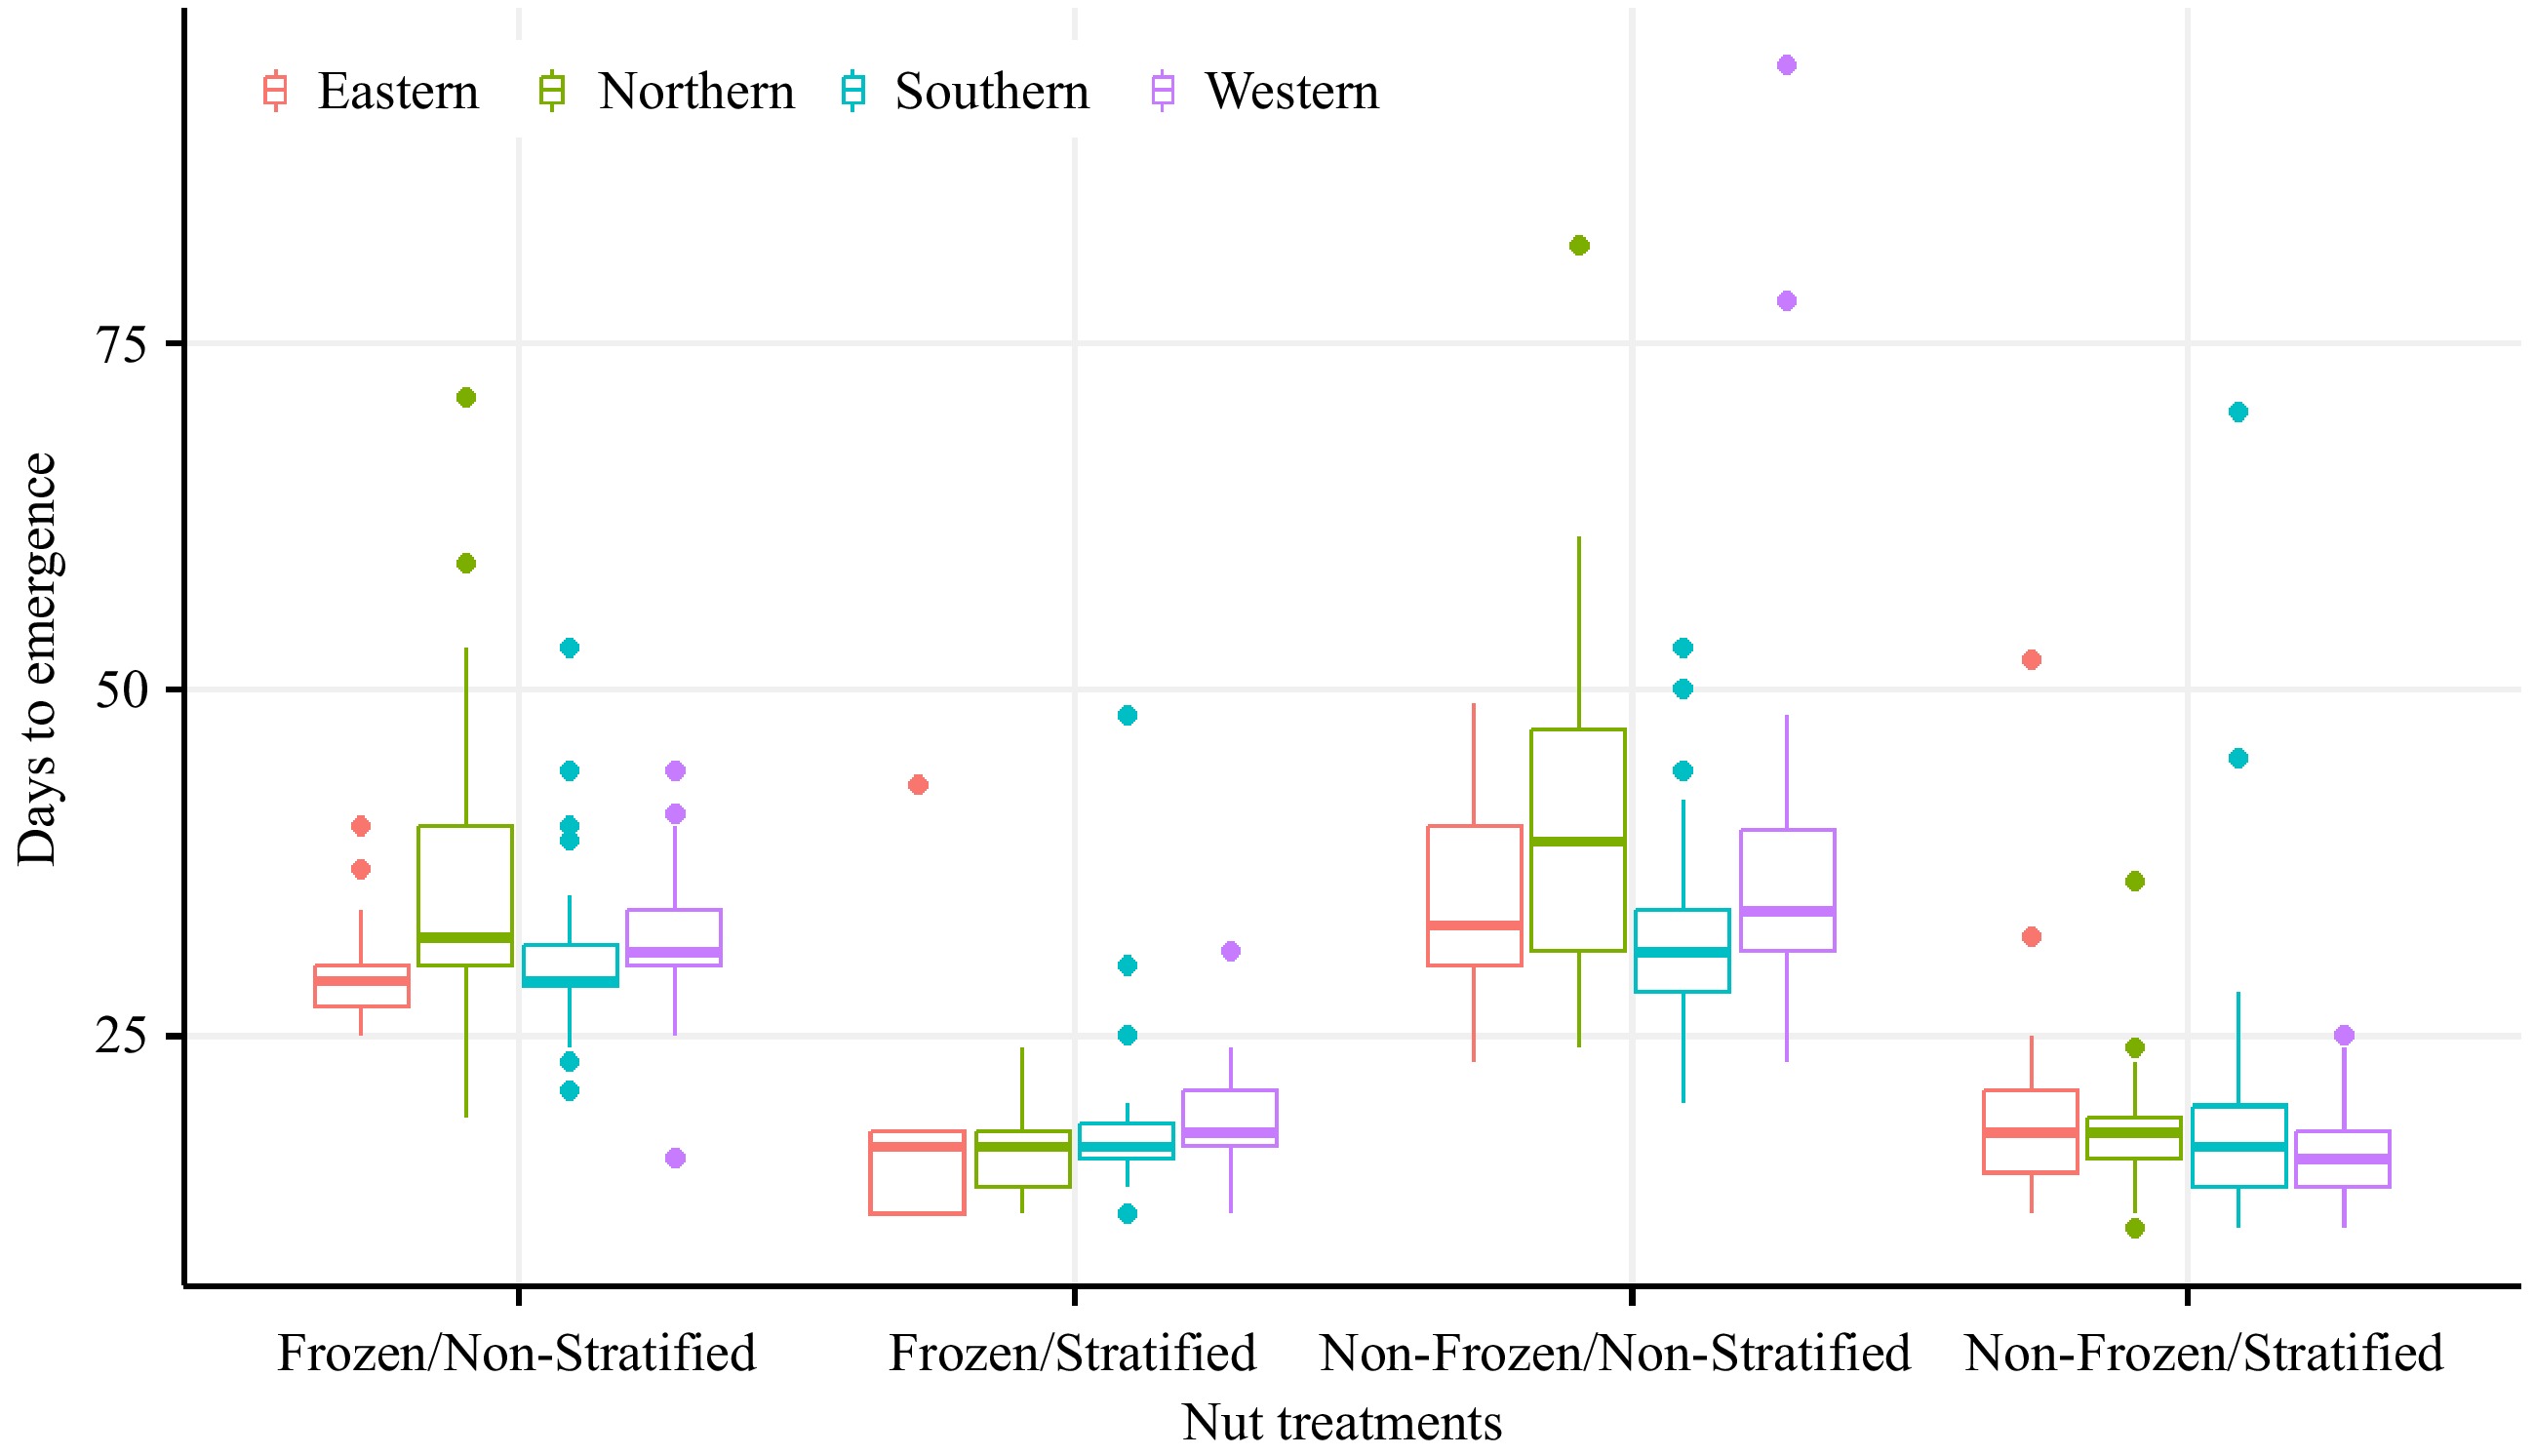
      Figure 2. 

      The visual comparisons of days to emergence of the 12 seedstocks from four regions under different seed treatments.

      Table 3.  The influence of seed treatments on days to emergence and seedling growth in the first season.

      Treatment Days to emergence Height growth rate (mm/day) Diameter growth rate (mm/day)
      Mean Std dev Std error Mean Std dev Std error Mean Std dev Std error
      Frozen/Non-stratified 32.455 b 7.321 0.7179 0.396 0.184 b 0.0136 0.035 c 0.008 0.0006
      Frozen/Stratified 18.028 c 6.012 1.0641 0.418 0.130 b 0.0205 0.039 b 0.007 0.0009
      Non-frozen/Stratified 17.802 c 6.196 0.6232 0.530 0.158 a 0.0118 0.043 a 0.007 0.0005
      Non-frozen/Non-stratified 36.911 a 12.827 0.6505 0.438 0.182 b 0.0123 0.037 b 0.007 0.0005
      F Ratio 192.691 21.346 39.200
      Prob > F < 0.0001** < 0.0001** < 0.0001**
      Values within the column followed by different letters are significantly different at p < 0.01 using the Tukey-Kramer HSD test.

      Because the seeds were planted and germinated on different dates, their days to emergence was calculated by subtracting the Julian date of planting from the Julian date the individual seedlings emerged. When comparing the treatment effects across seedstocks, stratification significantly reduced the average days to emergence, with stratified seeds emerging after being planted for approximately 18 d, regardless of freezing treatment (Table 3). The freezing treatment showed a slight, but significant, effect of reducing the days to emergence on non-stratified seeds, compared to the control. For example, frozen but non-stratified seeds emerged over 33 d, which was approximately 4 d faster than control (non-stratified, non-frozen) seeds that took 37 d (Table 3). The results indicate that seed stratification significantly affected the germination date across frozen and non-frozen conditions, compared to the control.

      The comprehensive test for the interactions of treatment effects and seedstock origin can be found in Supplementary Table S2. The freezing treatment had no significant interaction with the origin, while the stratification treatment had a significant interaction with the northern and southern seedstocks (Supplementary Table S2). Although seeds from southern seedstock germinated 3 d faster than other seedstocks, the days to emergence of all seeds across the treatments did not have significant differences with origin (Supplementary Table S3).

      The germination rate of the non-frozen seed showed no significant difference, whether stratified or not (averaging 86.7% emerged vs 80.8% emerged) (Table 4, Supplementary Table S1). However, stratification significantly decreased the seed germination rate for the frozen seed compared to non-stratified seed (averaging 28.8% emerged to 65% emerged). The results indicate that stratification alone had the highest seed germination rate (86.7% emerged), while combining freezing and stratification significantly reduced seed germination rate (28.8% emerged). The freezing treatment alone decreased seed germination rate, but not significantly (65.0% vs 80.8% emerged) (Table 4, Supplementary Table S1).

      Table 4.  Seed germination rate (%) of 12 seedstocks under different treatments.

      Seedstock Frozen/
      Non-Stratified
      Frozen/
      Stratified
      Non-frozen/
      Non-stratified
      Non-frozen/
      Stratified
      Average
      87MX1-2.2 75 40 85 75 68.75
      87MX5-1.7 60 70 75 85 72.50
      Elliott 40 0 70 85 48.75
      Frutoso 55 10 85 80 57.50
      Giles 70 25 80 90 66.25
      Major 20 10 80 85 48.75
      Moore 80 75 90 90 83.75
      Peruque 95 10 100 100 76.25
      Posey 85 60 95 90 82.50
      Riverside 80 0 100 90 67.50
      San Felipe 90 25 80 100 73.75
      VC1-68 30 20 30 70 37.50
      Average 65 28.75 80.83 86.67
      Data showed the percentage obtained by dividing the number of germinated seeds by the total number of seeds (20) in each treatment.

      The eastern seedstock 'Moore' had the highest germination rate (83.8%), followed by the northern seedstock 'Posey' (82.5%). Western seedstock 'VC1-68' had the lowest seed germination rate (37.5%) (Table 4). Interestingly, the northern seedstock 'Peruque' had the highest seed germination rate (95%−100%), except for the frozen, stratified seed (10%). No seed emerged for 'Elliott' (eastern) and 'Riverside' (western) after the Frozen/Stratified combined treatment (Table 4, Fig. 1a). The days to emergence varied among all seedstocks across the treatments, with no significant differences observed except for 87MX5-1.7 and 'Posey'. 87MX5-1.7 exhibited the shortest days to emergence, while 'Posey' took the longest (approximately 8 d difference) (Table 5).

      Table 5.  Days to emergence of different treated seed and seedling growth of different pecan rootstocks in the first season.

      Seedstock Days to emergence Height growth rate (mm/day) Diameter growth rate (mm/day)
      Mean Std dev Std error Mean Std dev Std error Mean Std dev Std error
      87MX1-2.2 24.764 ab 8.658 1.666 0.483 bcd 0.126 0.020 0.037 bc 0.006 0.001
      87MX5-1.7 23.526 b 9.659 1.637 0.520 abc 0.116 0.020 0.037 bc 0.005 0.001
      Elliott 26.872 ab 9.606 1.979 0.474 bcd 0.145 0.024 0.037 bc 0.006 0.001
      Frutoso 28.556 ab 10.400 1.842 0.587 a 0.168 0.022 0.039 bc 0.007 0.001
      Giles 28.528 ab 19.122 1.697 0.414 de 0.213 0.020 0.037 bc 0.010 0.001
      Major 29.910 ab 14.766 2.004 0.397 de 0.213 0.024 0.041 abc 0.009 0.001
      Moore 26.881 ab 11.073 1.510 0.508 abc 0.163 0.018 0.040 bc 0.007 0.001
      Peruque 26.629 ab 10.131 1.582 0.225 f 0.100 0.019 0.031 c 0.009 0.001
      Posey 31.000 a 15.114 1.510 0.359 e 0.129 0.018 0.040 bc 0.008 0.001
      Riverside 27.964 ab 9.303 1.666 0.460 cd 0.149 0.020 0.041 abc 0.006 0.001
      San Felipe 27.895 ab 15.239 1.637 0.557 ab 0.108 0.020 0.042 ab 0.005 0.001
      VC1-68 24.167 ab 7.905 2.256 0.567 ab 0.110 0.027 0.045 a 0.006 0.001
      F Ratio 1.7144 26.042 10.815
      Prob > F 0.0665 < 0.0001* < 0.0001*
      Values within the column followed by different letters are significantly different at p < 0.01 using the Tukey-Kramer HSD test.
    • Because stratified seeds were planted a month later than non-stratified seeds, the number of growing days for the seedlings in the first planting group were not equal to those of the second group. Therefore, directly comparing their heights and diameters is inappropriate. However, the comparisons are possible when data are aggregated across origins based on the stratification treatment (which crosses both planting groups). Stratified, non-frozen seedlings had significantly greater average growth rates for height (0.53 mm height/day vs 0.396 to 0.438 mm height/day) and stem diameter (0.043 mm/day vs 0.035−0.039 mm/day), than all other treatments (Table 3). When seedlings were non-stratified, freezing significantly reduced average stem diameter growth (0.035 mm/day vs 0.037 mm/day), but had no significant effect on the average height growth rate (Table 3). The growth of frozen, stratified seedlings was not significantly different than the non-frozen, non-stratified control (Table 3). These results indicate that stratified or freezing treatments can independently influence seedling growth.

      Overall, the seedlings displayed significant variation in vigor, with the greatest plant height observed on 'Frutoso', followed by 'San Felipe', 'VC1-68', and 87MX5-1.7, and the largest diameters observed on 'VC1-68', followed by 'San Felipe', and 'Riverside' (Table 5). In summary, western and southern seedstocks resulted in taller seedlings with larger stem diameters, and northern seedstocks resulted in shorter seedlings and smaller stem diameters (Table 5, Supplementary Table S3, Supplementary Fig. S1). In this test, seed quality (nut density) did not significantly correlate with days to emergence, seedling height, or diameter.

      This study contains several variables, such as phenotypic traits, seedstock genotypes, origins, seed quality, and seed treatments. To reduce the complexity and uncover the underlying structure of the data, a principal component analysis (PCA) was conducted. The PCA visualized the data structure and relationship among these variables (Fig. 3). This biplot indicated that the top two principal components captured nearly 90% variances, with PC1 explaining 56.4% of the total variance of phenotypes and PC2 explaining 33.3% of the total variation. The patterns, trends, and relationships among the seed treatments, seed germination, and seedling growth corroborate the main findings of this study. For instance, stratification is negatively correlated with days to emergence, whereas freezing is positively correlated, suggesting that stratification promotes seed germination and freezing inhibits seed germination (though this correlation was not statistically significant).
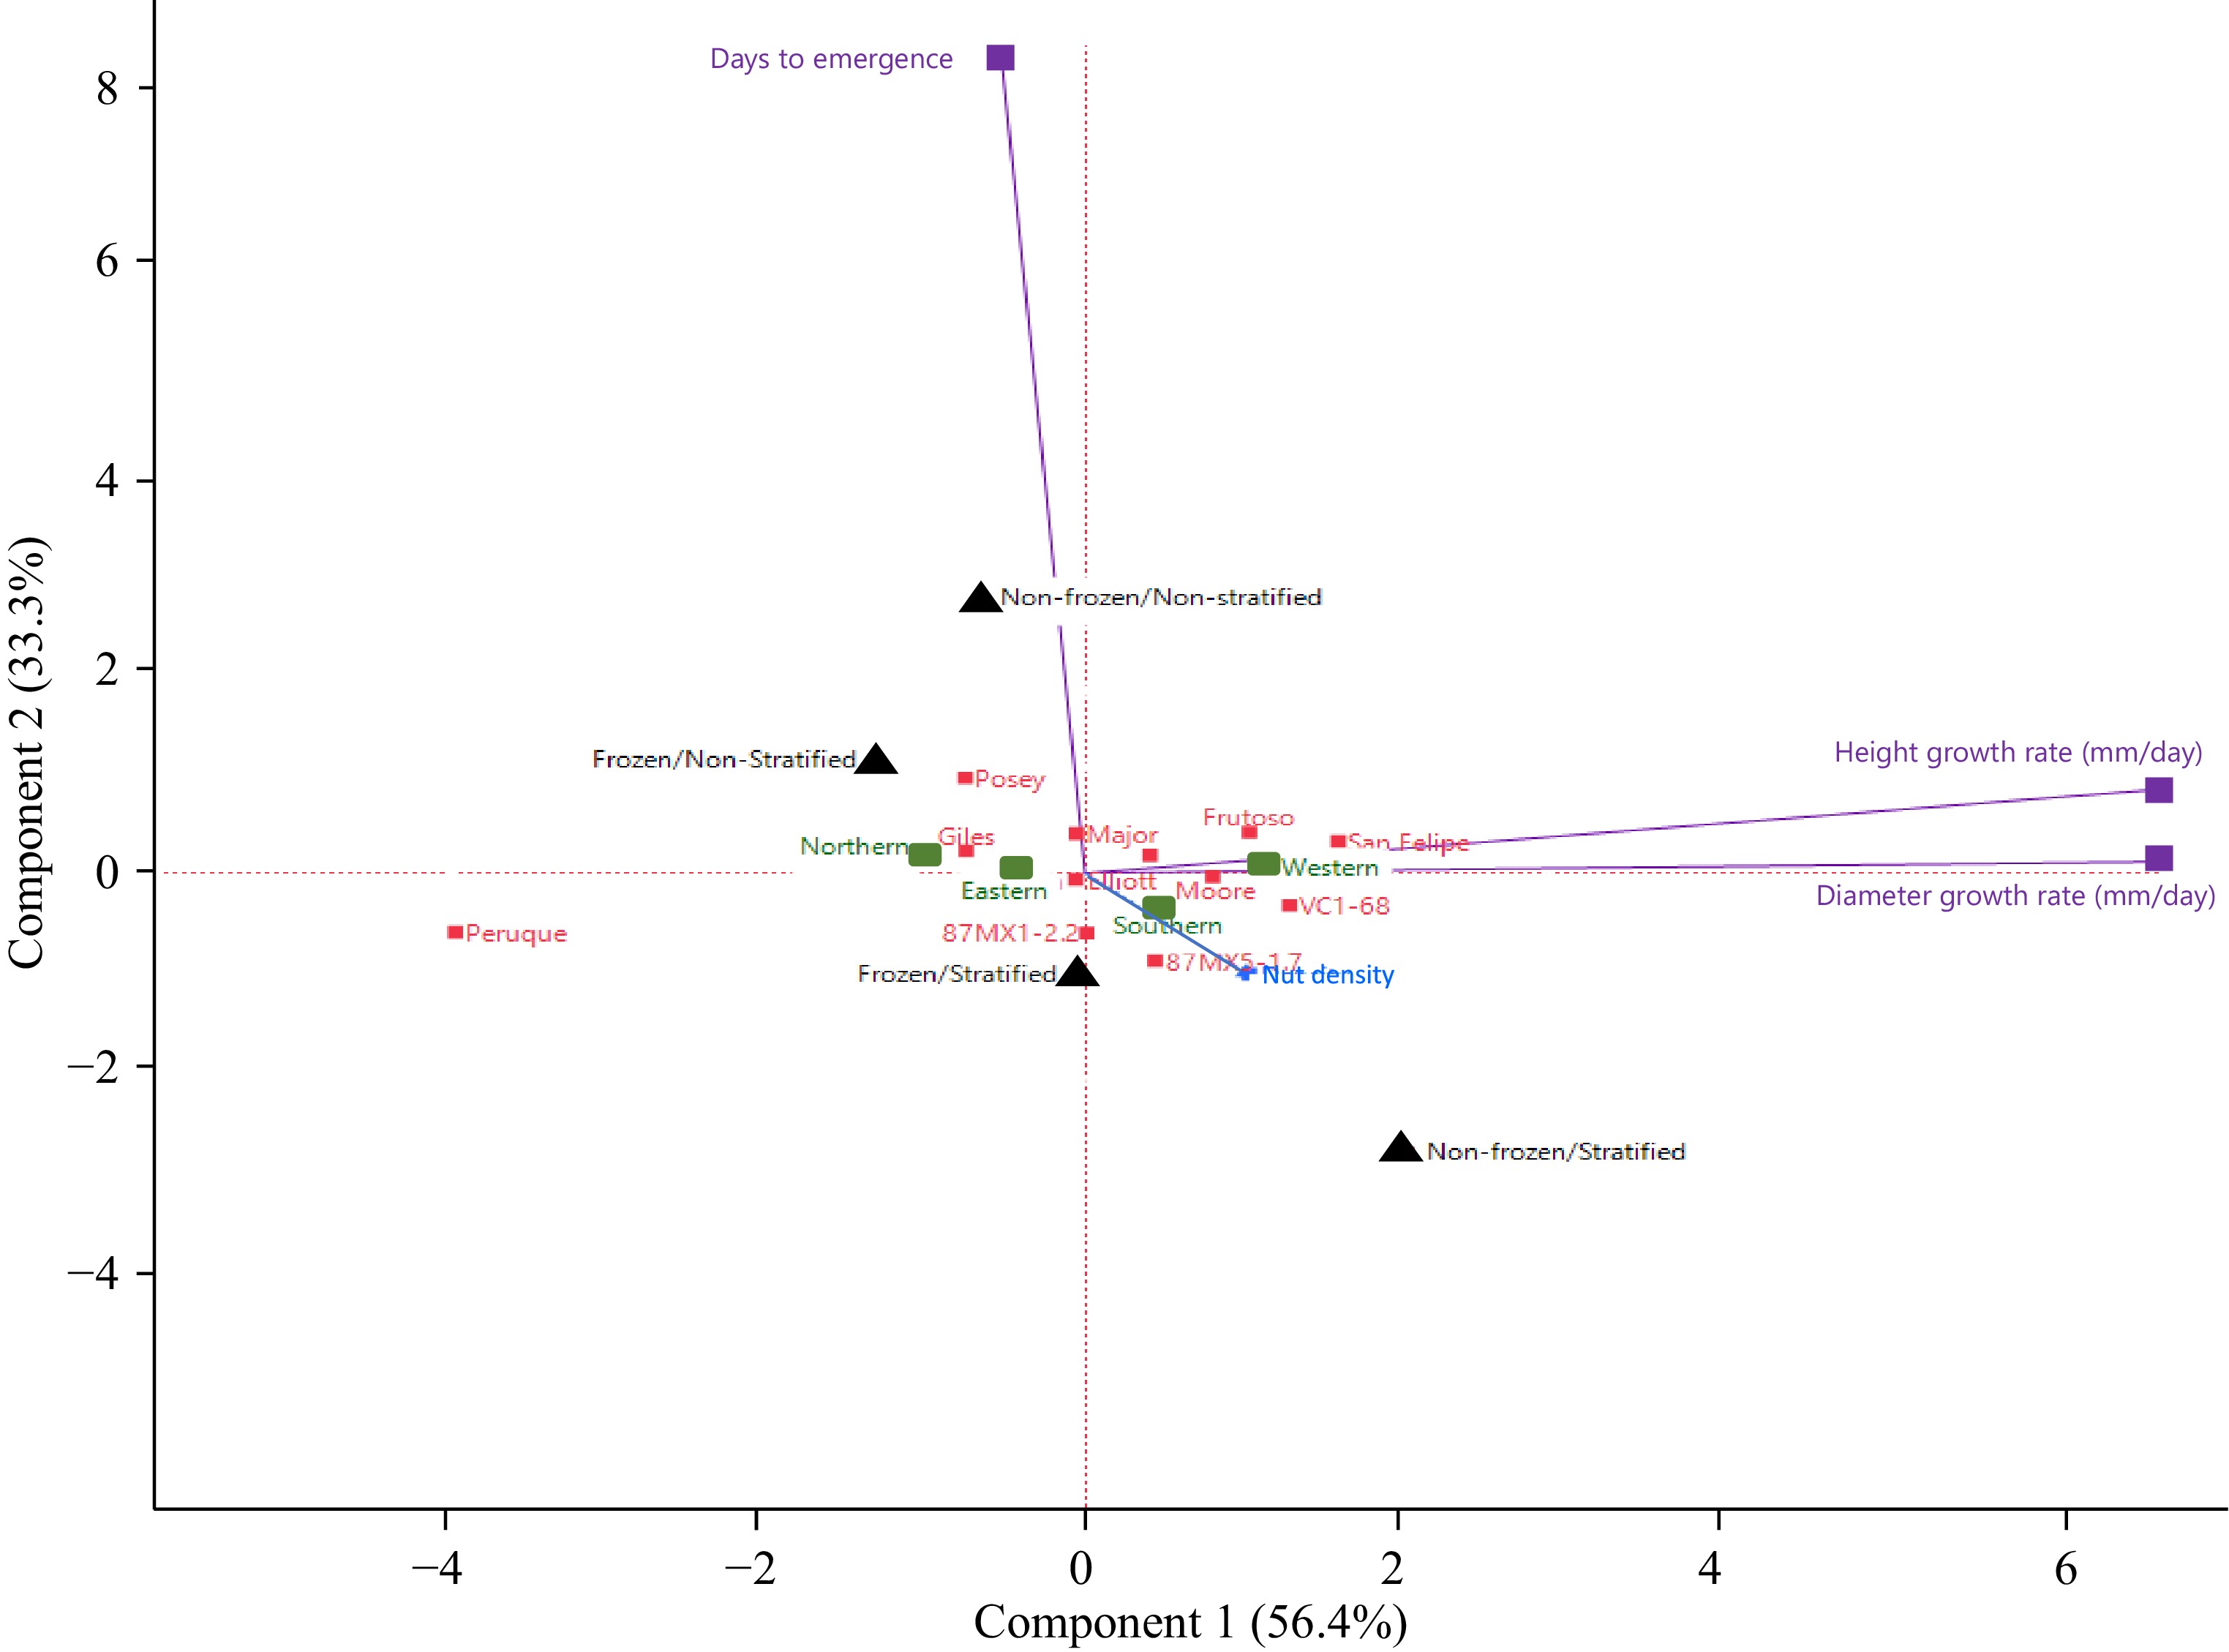
      Figure 3. 

      PCA biplot of nut treatments to 12 seedstocks, origins, and nut density on nut germination, seedling height, and diameter. The explained variance of the axes is given in percentage. The eigenvalues of the first two PCA axes were 1.691 (56.4%) and 0.999 (33.3%), respectively. Treatments are presented in black, seedstocks in red, provenance origins in green, seed quality in blue, and phenotypic traits in purple.

    • Pecan growers face several challenges related to seed germination. Dormancy issues, including thick seed coats and strong seed sutures, often result in slow or uneven germination, impacting the overall efficiency of nursery operations. Additionally, pecan seeds require specific environmental conditions for successful germination and deviations from these conditions can lead to poor seedling establishment. These challenges necessitate precise management of pre-planting treatments to ensure optimal germination rates and seedling vigor. This study provides a detailed examination of how freezing and stratification treatments influence pecan seed germination and subsequent seedling growth across 12 seedstocks. The present findings indicate that these treatments significantly influence seed performance, which is essential for effective rootstock management and its horticultural practices, offering insights into practical nursery management and broader implications for nut crop cultivation.

    • The data revealed a notable impact of freezing treatment on seed germination, with a significant proportion of frozen seeds failing to germinate. Specifically, nearly half of the seedstocks exhibited over 40% germination failure post-freezing, underscoring the potential detrimental effects of this treatment. Seedstock 'Major' displayed significant sensitivity to freezing, further illustrating the variability among different seedstocks. This response highlights the importance of selecting appropriate seed treatment protocols based on specific seedstock characteristics[2630]. Interestingly, the interaction between stratification and freezing treatments was significant only when considering the maternal family of the seedstocks, suggesting that inherent genetic variability plays a crucial role in how these treatments affect germination rates[31,32]. The overall reduction in germination rates for frozen seeds—averaging only 15.71% in the first planting and 48.5% in the second—indicates a clear trend: freezing negatively impacts seed viability. In contrast, stratified seeds generally demonstrated higher germination rates, reinforcing the idea that stratification serves as a beneficial treatment to enhance seed performance[17,30,32,33].

      The present findings indicate that stratification significantly decreases the time required for germination after planting, whereas freezing alone has a significant but decreased influence on days to emergence. Stratification, a process that involves exposing seeds to cold temperatures to break dormancy[6,21,2729,33], proved beneficial across all seedstocks, leading to quicker and more uniform germination. The freezing treatment had a marginal impact on seed days to emergence but was still 4 d quicker than the control (non-frozen/non-stratified seed) (Table 3). However, the freezing treatment significantly decreased germination rates. This is consistent with findings in other nut crops where excessive cold exposure can negatively impact seed viability[27,28,33,34]. Therefore, freezing seeds without stratification would not be recommended as a meaningful practice for accelerating seedling germination, but is an essential step used by nurseries for killing pecan weevil infestations[23,24]. The present study did not evaluate the effectiveness of freezing for pecan weevil elimination; however, it is important to carefully balance the effects of a freezing treatment with stratification to prevent negative impacts on seed germination.

    • While freezing treatment was shown to delay germination rates, it was somewhat surprising that it did not significantly alter the days to emergence across different seedstock origins (Supplementary Table S3). Stratification, however, consistently resulted in faster emergence, reducing the average days to emergence to approximately 18 d across treatments. This finding aligns with previous research indicating that stratification can facilitate quicker germination and emergence by breaking seed dormancy[2729]. The slight but significant reduction in days to emergence for frozen, non-stratified seeds—emerging 4 d earlier than the control—suggests that while freezing is generally detrimental, it may still have minor effects that need further investigation. The overall lack of significant differences in days to emergence across seedstock origins, aside from the notable trend in southern seedstocks emerging faster emphasizes the need for broader evaluations of how genetic factors influence germination dynamics[31].

    • The results showed substantial variation in germination rates among the seedstocks, with 'Moore' achieving a high germination rate of 83.8% compared to the significantly lower rate of 37.5% observed in 'VC1-68'. This is a surprising result because 'VC1-68' has been using rootstock by the US pecan growers, especially in California and southern Texas. This variability is crucial for understanding which seedstocks may be better suited for specific environmental conditions or treatment protocols. Notably, the northern seedstock 'Peruque' exhibited exceptional germination rates under non-frozen conditions but dramatically declined when subjected to the combined freezing and stratification treatment.

      These findings suggest that certain seedstocks have innate characteristics that make them more resilient to specific treatments, further highlighting the importance of tailoring seed management strategies to individual seedstock needs. Additionally, the absence of germination in certain seedstocks after combined treatments raise questions about potential thresholds of stress that seeds can tolerate, which could guide future breeding and selection efforts.

      Seed quality is another factor affecting germination[31]. This study showed that well-filled seeds (higher density) germinated faster and exhibited quicker seedling growth (Fig. 3), a finding that is consistent with previous research[6], even though this interaction was not statistically significant in the present study.

    • While seedling growth comparisons between stratified and non-stratified treatments were complicated by differences in planting dates, aggregated data across origins allowed for meaningful insights. Stratified, non-frozen seedlings exhibited significantly higher growth rates in both height and stem diameter compared to other treatments. This aligns with existing research on nut crops, such as almonds and walnuts, where cold stratification has similarly improved germination rates by overcoming physiological dormancy barriers[17,31,33]. This suggests that stratification not only improves germination but also promotes better seedling development. Conversely, freezing led to a significant reduction in the stem diameter growth rate compared to the control. When freezing was combined with stratification, no significant differences in growth from the control were observed. Similar trends have been observed in pistachios, in which cold stratification improved seedling growth, whereas excessive freezing hindered it[34]. Nevertheless, this finding reinforces the hypothesis that stratification enhances not only germination but also early seedling vigor, which is crucial for establishing strong plants in competitive environments.

      The observation that freezing negatively impacted stem diameter growth in non-stratified seedlings, while height growth remained unaffected, suggests differential responses of growth parameters to stress. This differential impact emphasizes the complexity of seedling development, where some traits may be more sensitive to environmental stressors than others.

    • The analysis revealed significant variation in seedling vigor across different seedstocks, with 'Frutoso' displaying the tallest seedlings and 'VC1-68' exhibiting the largest diameters. Notably, the western and southern seedstocks produced taller seedlings with larger diameters compared to northern seedstocks. This pattern raises important considerations for seedstock selection based on intended agricultural outcomes, such as yield potential or adaptability to specific environments. Interestingly, seed quality as measured by nutrient density did not correlate significantly with days to emergence or seedling growth metrics. This lack of correlation suggests that factors influencing seed performance may extend beyond intrinsic seed quality, warranting further exploration into the complex interactions among genetics, environmental conditions, and seed treatment protocols.

    • In this study, principal component analysis (PCA) was employed to simplify the complexity of the dataset, which included variables such as phenotypic traits, genotypes, origins, seed quality, and seed treatments. By conducting PCA, the aim was to uncover the underlying relationships among these variables and visualize the data structure. The resulting biplot revealed that the first two principal components (PC1 and PC2) together accounted for nearly 90% of the total variance—specifically, 56.4% for PC1 and 33.3% for PC2. This substantial explanation of variance indicates that these components effectively capture the critical patterns within the data.

      The PCA also highlighted notable trends, particularly concerning seed treatments and their impact on germination and seedling growth. For example, the analysis suggested that stratification may enhance seed germination by being negatively correlated with the number of days to emergence. Conversely, freezing treatments appeared to delay germination, as indicated by a positive correlation with days to emergence. While these correlations were observable trends, it is important to note that they were not statistically validated. Overall, the PCA results provide valuable insights into how different factors influence seed performance, laying the groundwork for further investigation into optimal seed treatment strategies.

    • The findings from this study have significant implications for seed management practices. Understanding the differential responses of various seedstocks to freezing and stratification can guide farmers and seed producers in selecting appropriate treatments tailored to specific seed types. For example, seedstocks that are particularly sensitive to freezing may benefit from exclusive stratification treatments to enhance germination rates without the added stress of freezing. Moreover, the observed variability in seedling vigor and growth emphasizes the necessity of evaluating seedstocks based on their specific growth characteristics, which can influence overall crop performance. By integrating knowledge of seed treatment impacts and genetic variability, stakeholders can develop more effective seed management strategies that maximize germination success and seedling establishment.

    • The study underscores the need for a nuanced approach to seed treatment. While stratification is crucial for enhancing germination and seedling growth, freezing treatments should be optimized to balance pest control with seed viability. Future research should focus on refining these treatments to minimize their negative impacts. For instance, exploring different freezing durations and temperatures could help mitigate adverse effects on seed germination. Additionally, investigating other pre-planting treatments, such as chemical scarification[32,35], varying stratification periods[26,36], or temperature ranges[30] could provide further insights into improving seedling production efficiency. While this study provides valuable insights into the effects of freezing and stratification on seed germination and growth, several avenues for future research remain. First, a deeper exploration of the genetic mechanisms underlying the observed variability among seedstocks would provide a clearer understanding of how certain traits can be enhanced through breeding programs[6,3740]. Additionally, longitudinal studies tracking the long-term performance of seedlings originating from different treatments could offer insights into how early germination and growth impacts overall plant health and productivity. Finally, investigating the interactions between environmental conditions, such as temperature and moisture levels[27,28,41], with seed treatments could further refine our understanding of optimal seed management practices[12,17,37].

    • In conclusion, the results of this study demonstrate the significant effects of various seed treatments on germination rates and seedling growth across 12 pecan seedstocks. The freezing treatment led to notably high germination failure, with nearly 50% of the seedstocks exhibiting over 40% failure rates. In contrast, stratification consistently improved germination, with stratified seeds emerging approximately 18 d after planting, compared to longer durations for non-stratified seeds. Specifically, non-stratified, frozen seeds took an average of 33 d to emerge, while control seeds averaged 37 d. Moreover, the analysis revealed distinct variations among seedstocks, with 'Moore' achieving the highest germination rate at 83.8%, while 'VC1-68' struggled with a low rate of 37.5%. The interaction between freezing and stratification treatments significantly affected the germination rates, with frozen, stratified seeds showing only 10% germination for the northern seedstock 'Peruque'. Seedling growth metrics further emphasized the benefits of stratification, as stratified, non-frozen seedlings exhibited a growth rate of 0.53 mm/day in height, outperforming all other treatments. These findings indicate that effective management of seed treatments is crucial for optimizing germination and seedling vigor, which can ultimately enhance commercial pecan production. Future research should continue to explore these interactions to refine cultivation strategies and improve yield outcomes.

      • This research was supported by the US Department of Agriculture – Agriculture Research Service National Programs through CRIS project 3091-21000-046-000-D (Crop Germplasm Research Unit, TX, USA). The authors highly appreciate the efforts of Dr. LJ Grauke, a retired Horticulturist in the USDA-ARS Pecan Breeding and Genetics Program, for establishing this project, and retired senior technician Lynn Johnson for his efforts in seed measurement, germination, seedling management, and data collection. This article reports the results of research only. Mention of a trademark or proprietary product is solely for the purpose of providing specific information and does not constitute a guarantee or warranty of the product by the US Department of Agriculture and does not imply its approval to the exclusion of other products that may also be suitable.

      • The authors confirm contribution to the paper as follows: study conception and design: Cox T, Kubenka K; analysis and interpretation of results: Wang X, Hilton A, Chatwin W; draft manuscript preparation: Wang X; review of the manuscript: Chatwin, W, Hilton A, Kubenka K, Tondre B. All authors have read and agreed to the final version submitted for publication.

      • The datasets generated during and/or analyzed during the current study are available from the corresponding author on reasonable request.

      • The authors declare that they have no conflict of interest.

      • Supplementary Table S1 Numberes of seeds emerged and germiantion rates of freezing treatment in the different planting time.
      • Supplementary Table S2 Scaled Estimates using the nominal factors expanded to all levels.
      • Supplementary Table S3 The influence of pecan rootstock origin on days to emergence and seedling growth in the first season.
      • Supplementary Fig. S1 The visual comparisons of seedling height (A), and stem diameter (B) of the seedstocks from four regions under different seed treatments.
      • Copyright: © 2025 by the author(s). Published by Maximum Academic Press, Fayetteville, GA. This article is an open access article distributed under Creative Commons Attribution License (CC BY 4.0), visit https://creativecommons.org/licenses/by/4.0/.
    Figure (3)  Table (5) References (41)
  • About this article
    Cite this article
    Wang X, Kubenka K, Hilton A, Chatwin W, Cox T, et al. 2025. The effects of freezing and stratification on pecan (Carya illinoinensis) seed germination and seedling growth. Technology in Horticulture 5: e002 doi: 10.48130/tihort-0024-0030
    Wang X, Kubenka K, Hilton A, Chatwin W, Cox T, et al. 2025. The effects of freezing and stratification on pecan (Carya illinoinensis) seed germination and seedling growth. Technology in Horticulture 5: e002 doi: 10.48130/tihort-0024-0030

Catalog

  • About this article

/

DownLoad:  Full-Size Img  PowerPoint
Return
Return