


-
Cauliflower (Brassica oleracea var. botrytis) is an important vegetable crop cultivated worldwide. It originates from the European wild cabbage (Brassica oleracea var. oleracea), which initially grew along the Mediterranean coast[1]. The specific organ that distinguishes cauliflower, known as curd, develops from the rapid proliferation of the inflorescence meristem[2,3]. The curd has a crispy and tender texture, delicious taste, and rich nutritional content, making it highly favored by consumers worldwide[4].
The curd of cauliflower develops at the apex of the main stem and is surrounded by rosette leaves. The 'curd setting height' (CSH) refers to the distance from the bottom edge of the mature curd to the ground. CSH is one of the most important agronomic traits in cauliflower, as it affects plant architecture, land utilization, agronomic management, and harvesting practices. Depending on the variety, the weight of mature curd ranges from approximately 1.0 to 3.0 kg, with a spherical diameter of 20−35 cm. To support the weight of curd and prevent lodging, the cauliflower varieties selected thus far present a relatively short CSH, usually less than 15 cm[5]. Such a low CSH not only expands the plant width, but also increases the difficulty of mechanized harvesting of curds. To reduce the dependence on manpower, future cauliflower breeding efforts will focus on high curd setting height, small plant type, dense planting and mechanized harvesting techniques[6,7].
For other crops that lack a curd at the apex of the main stem, the CSH trait closely resembles plant height. Numerous genes have been reported to control plant height, especially those involved in plant hormone biosynthesis or signaling pathways, including auxin, gibberellic acid (GA), brassinosteroid (BR) and abscisic acid (ABA)[8−10]. One of the landmark achievements of the Green Revolution was the development of semi-dwarf and high-yield varieties of rice and wheat. Genes responsible for the Green Revolution have been mapped and cloned, such as semi-dwarf 1 (SD1) in rice, which encodes GA20 oxidase involved in GA biosynthesis, and reduced height-1 (Rht1) in wheat, which encodes DELLA protein associated with GA signal transduction[11,12]. In Brassica crops, research on plant height trait has primarily focused on B. napus. Dwarf and semi-dwarf mutants have been extensively studied in rapeseed crops, and several QTLs have been identified on different chromosomes, although successful gene cloning is rare[13,14].
Cauliflower, a variety of Brassica oleracea species in the Cruciferae family, has been extensively bred by agricultural research institutions in collaboration with seed companies, leading to the development of numerous excellent cauliflower varieties. However, molecular biology research related to cauliflower has been lacking[15]. Fortunately, recent advancements in de novo genome sequencing and chromosomal assembly have facilitated the mapping and cloning of target genes responsible for beneficial traits in cauliflower[3,16,17]. However, there have been no reports thus far on the genetic analysis and mapping of QTLs associated with the CSH trait in cauliflower.
In this study, we developed two F2 segregation populations and constructed two high-density linkage maps using the 10K multiple nucleotide polymorphism (MNP) array specific to the Brassica oleracea species (unpublished data) developed by our research group. Through QTL mapping, a major QTL associated with CSH was consistently identified in these two F2 populations. Subsequently, the parents were resequenced, and the Kompetitive Allele Specific PCR (KASP) markers were designed to narrow the initial QTL interval. Additionally, candidate genes related to CSH were predicted. The findings of this study lay the foundation for future cloning of CSH-related genes and contribute to our understanding of the genetic basis underlying plant height in Brassica species.
-
The DH line ZAASC4101 of cauliflower, characterized by a short main stem, was used as a common male parent in this study. This parent was crossed with the Chinese kale ZAASJ1401 and broccoli landraces ZAASR06, both possessing long main stems. Consequently, two F2 segregating populations were established. The first population, CJ-F2, consisted of 218 individuals derived from the cross between ZAASC4101 and ZAASJ1401 (Supplemental File 1), and the second population, CR-F2, comprised 212 individuals obtained from the cross between ZAASC4101 and ZAASR06 (Supplemental File 2). The F3 and F4 offspring were obtained by self-crossing with the selected recombinants.
Seeds of all materials were sown in multicellular trays filled with commercial seedling substrate. Once the seedlings reached the stage of four true leaves, they were transplanted into the experimental field in Jiaxing, China, in autumn of 2020 (parents, F1 and F2), 2021 (parents, F1, F3 and germplasm lines) and 2022 (parents, F1, F4 and germplasm lines). The transplants were spaced at intervals of 40 cm between plants and 50 cm between rows.
Trait measurement and statistical analysis
-
The CSH trait was assessed using two indicators: main stem height (MSH) and leaf scar spacing (LSS). MSH was defined as the length of the main stem from the bottom of the curd or buds to the first true leaf scar, while LSS represented the distance between the first and third leaf scars in the middle of the main stem (Fig. 1). These two indicators were measured when the curd diameter reached approximately 2 cm or when the buds became visible to the naked eye.
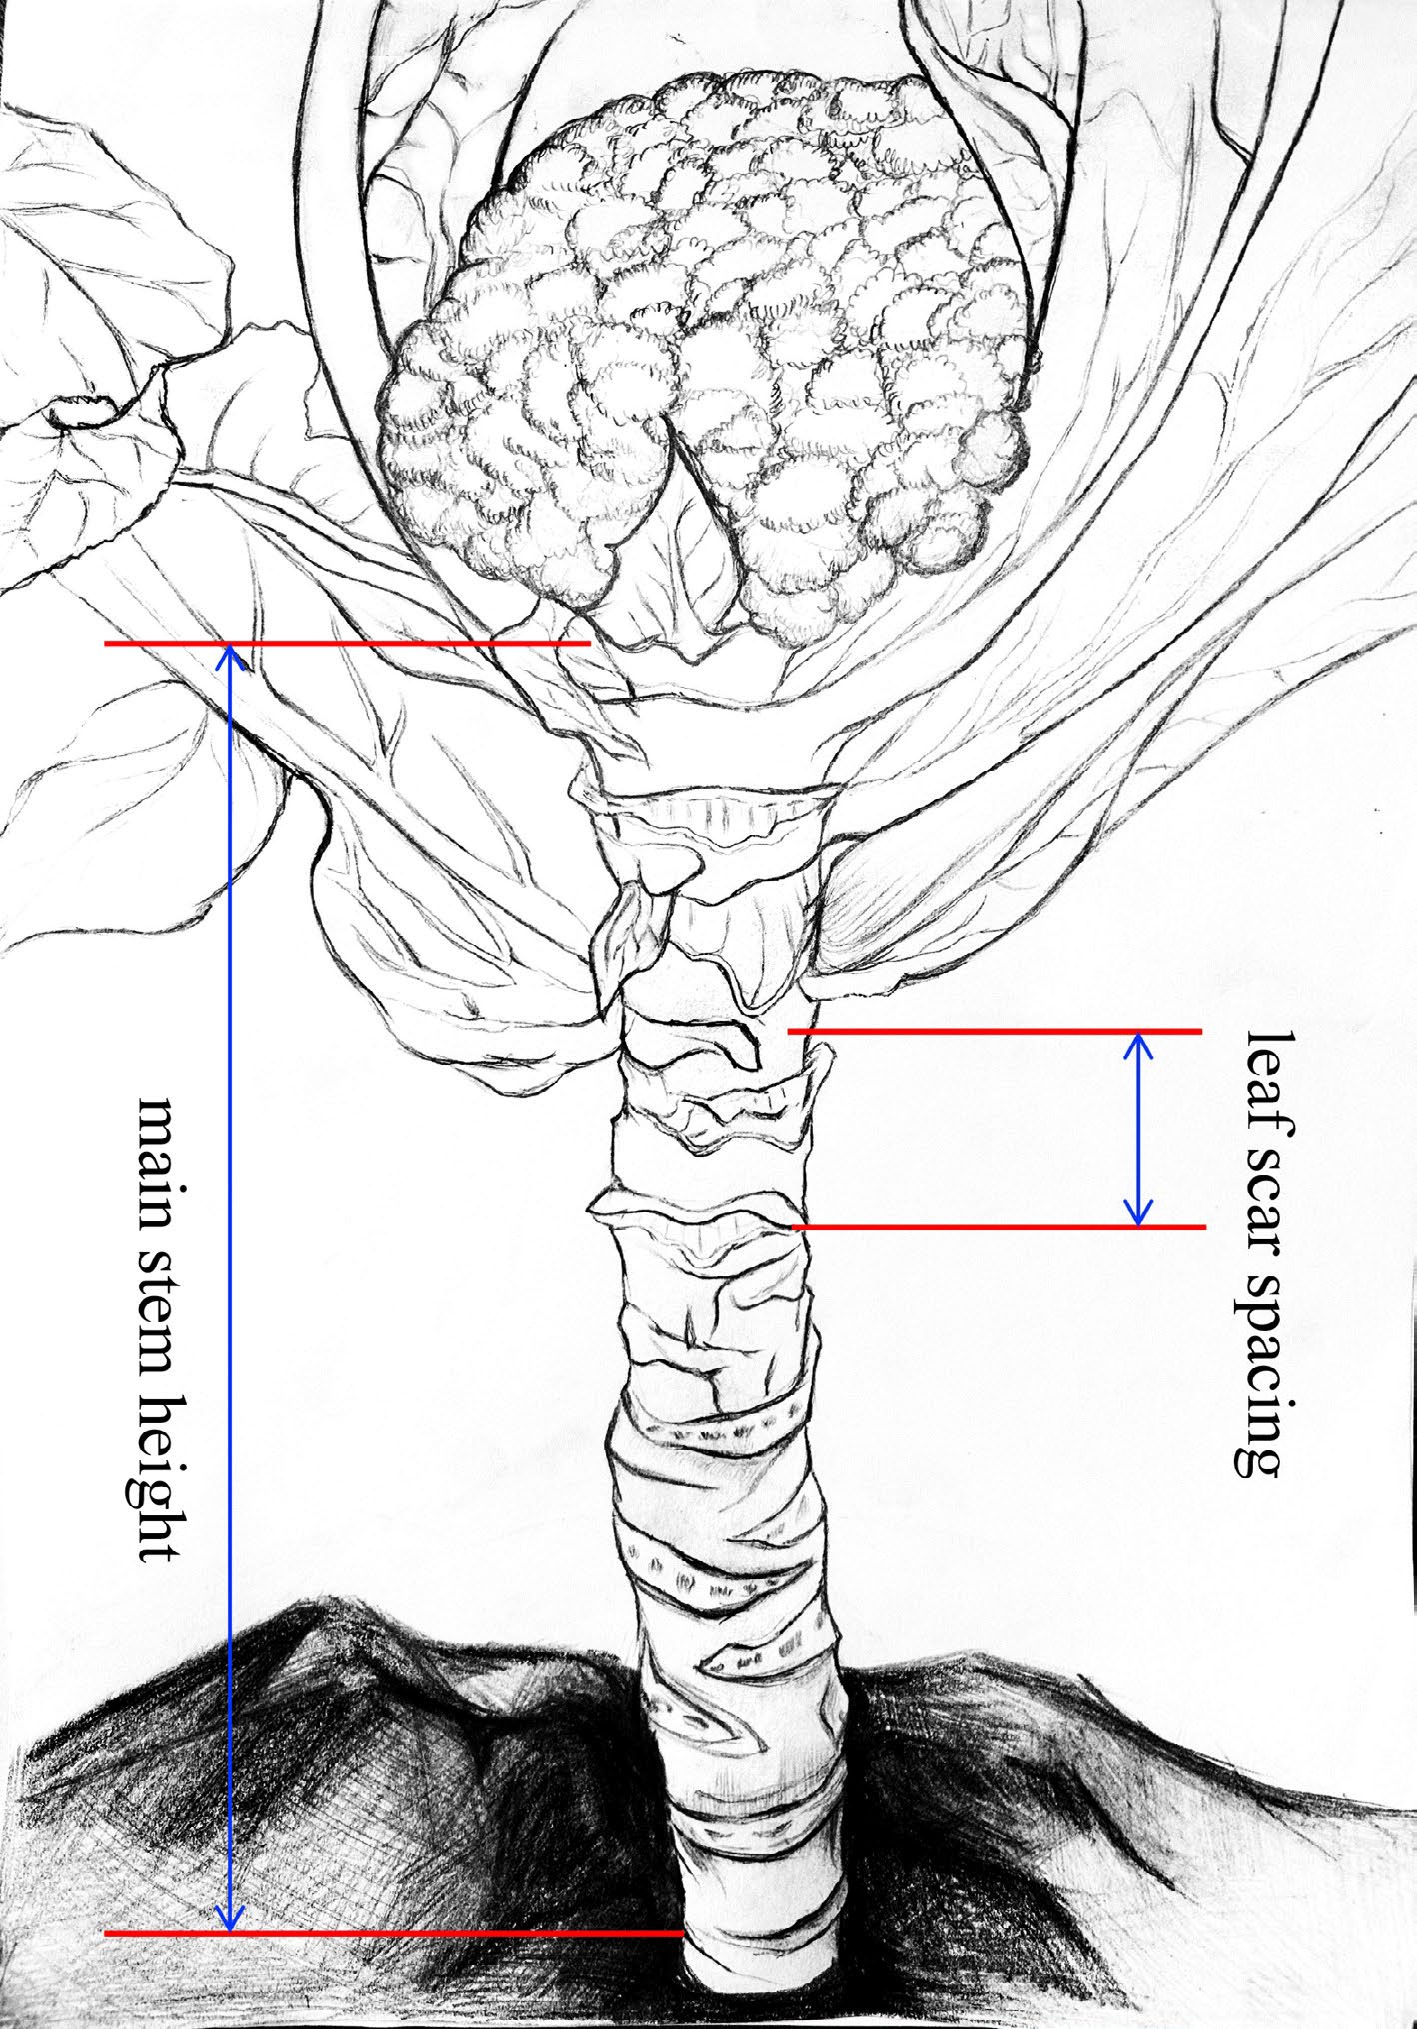
Figure 1.
Measurement criterias for the traits of main stem height (MSH) and leaf scar spacing (LSS). MSH, the length of the main stem from the first true leaf scar to the bottom of the curd or buds. LSS, the distance between the first and third leaf scars in the middle of the main stem.
Statistical analysis of the phenotypic data was performed using the SPSS statistic software version 26. The procedure of 'describe statistics' in SPSS was used to calculate the progeny distribution for each trait studied across the two F2 populations. Additionally, the Pearson's correlation coefficient of MSH and LSS were calculated by the 'bivariate correlation' procedure in SPSS.
SNP marker filtration
-
Genomic DNA was extracted from young leaf tissues using a DNA extraction kit (TIANGEN, Beijing, China). Genotyping of the CJ-F2 and CR-F2 populations, as well their respective parents, was conducted using the Brassica oleracea 10K MNP array containing 72,791 SNPs (unpublished data). To ensure data quality, a series of filtering steps were performed on the polymorphic SNP markers obtained from the SNP array based on the procedure outlined by Shen et al.[18]. First, SNPs with nonparental genotypes were excluded. Then, SNPs with more than 20% missing data were removed from the analysis. Finally, SNPs exhibiting more than 5% distorted segregation were filtered out. The remaining SNPs were further utilized for genetic map construction.
Linkage map construction and QTL mapping
-
The MSTmap software program was used to construct the genetic linkage maps using the filtered SNP markers[19]. The positions of the SNP loci were verified to determine the permutation order. The genetic distance between markers in each linkage group was calculated using the Kosambi mapping function[20]. For QTL analysis, the inclusive composite interval mapping (ICIM) algorithm from the QTL IciMapping v4.2 Software (
www.isbreeding.net ) was used in the two F2 populations.The additive tool (ICIM-ADD) in the 'BIP' modules of this software was employed to identify additive and epistatic QTLs. A stepping size of 0.1 cM was chosen for all QTL analyses, and automatic cofactor selection with a significance level of p = 0.050 was applied. To determine significant QTLs, an LOD threshold was set at the p = 0.050 significance level using 1,000 random permutations. The identified QTLs within overlapping confidence intervals were treated as the same QTL.
-
In this study, two F2 populations were developed, including 'CJ-F2' (♀ZAASC4101 × ♂ZAASJ1401) and 'CR-F2' (♀ZAASC4101 × ♂ZAASR06). The DH line ZAASC4101, which was an early maturing cauliflower, took approximately 55 d from seedling transplanting to curd maturation. When a small curd became visible to the naked eye at the apex of the main stem, the plant's leaves exhibited a lotus-shaped appearance. The mean values for MSH and LSS in ZAASC4101 were notably short, measuring only 7.62 and 1.79 cm, respectively. ZAASJ1401, on the other hand, was an F8 inbred line of Chinese kale. The meristem at the apex of its main stem didn't form a curd but directly formed buds that led to flowering. In ZAASJ1401, the MSH and LSS reached average lengths of 28.61 and 5.47 cm, respectively. ZAASR06, a broccoli landrace had been inbred up to the F7 generation. Its shoot apical meristem (SAM) formed a loose curd composed of numerous small flower buds, resembling broccoli. The MSH and LSS of ZAASR06 were the longest among the three parental lines, measuring 35.22 and 6.21 cm, respectively (Table 1, Fig. 2).
Table 1. Statistical analysis of MSH and LSS for the F2 population and their parents.
Trait Populationa Parents F1 F2 populations Female Male Meanb ± SDc Ranged Mean ± SD Skewnesse Kurtosisf MSH CJ 7.62 ± 1.79 28.61 ± 3.03 19.37 ± 3.97 11.00−37.00 22.96 ± 5.46 0.067 −0.49 CR 7.62 ± 1.79 35.22 ± 2.92 21.81 ± 3.64 / / / / LSS CJ 1.79 ± 0.29 5.47 ± 0.49 4.23 ± 0.64 2.00−7.00 3.98 ± 0.94 0.56 0.21 CR 1.79 ± 0.29 6.21 ± 0.55 4.41 ± 0.62 2.10−5.90 3.82 ± 0.82 0.34 −0.43 a Population: CJ, ♀ZAASC4101 × ♂ZAASJ1401; CR, ♀ZAASC4101 × ♂ZAASCR06. b Mean (cm): The average value of phenotypic data from ten. c SD: Standard deviation of the phenotypic trait. d Range: The interval of phenotypic data of two F2 populations. e Skewness: Skewness of the phenotypic trait. f Kurtosis: Kurtosis of the phenotypic trait. 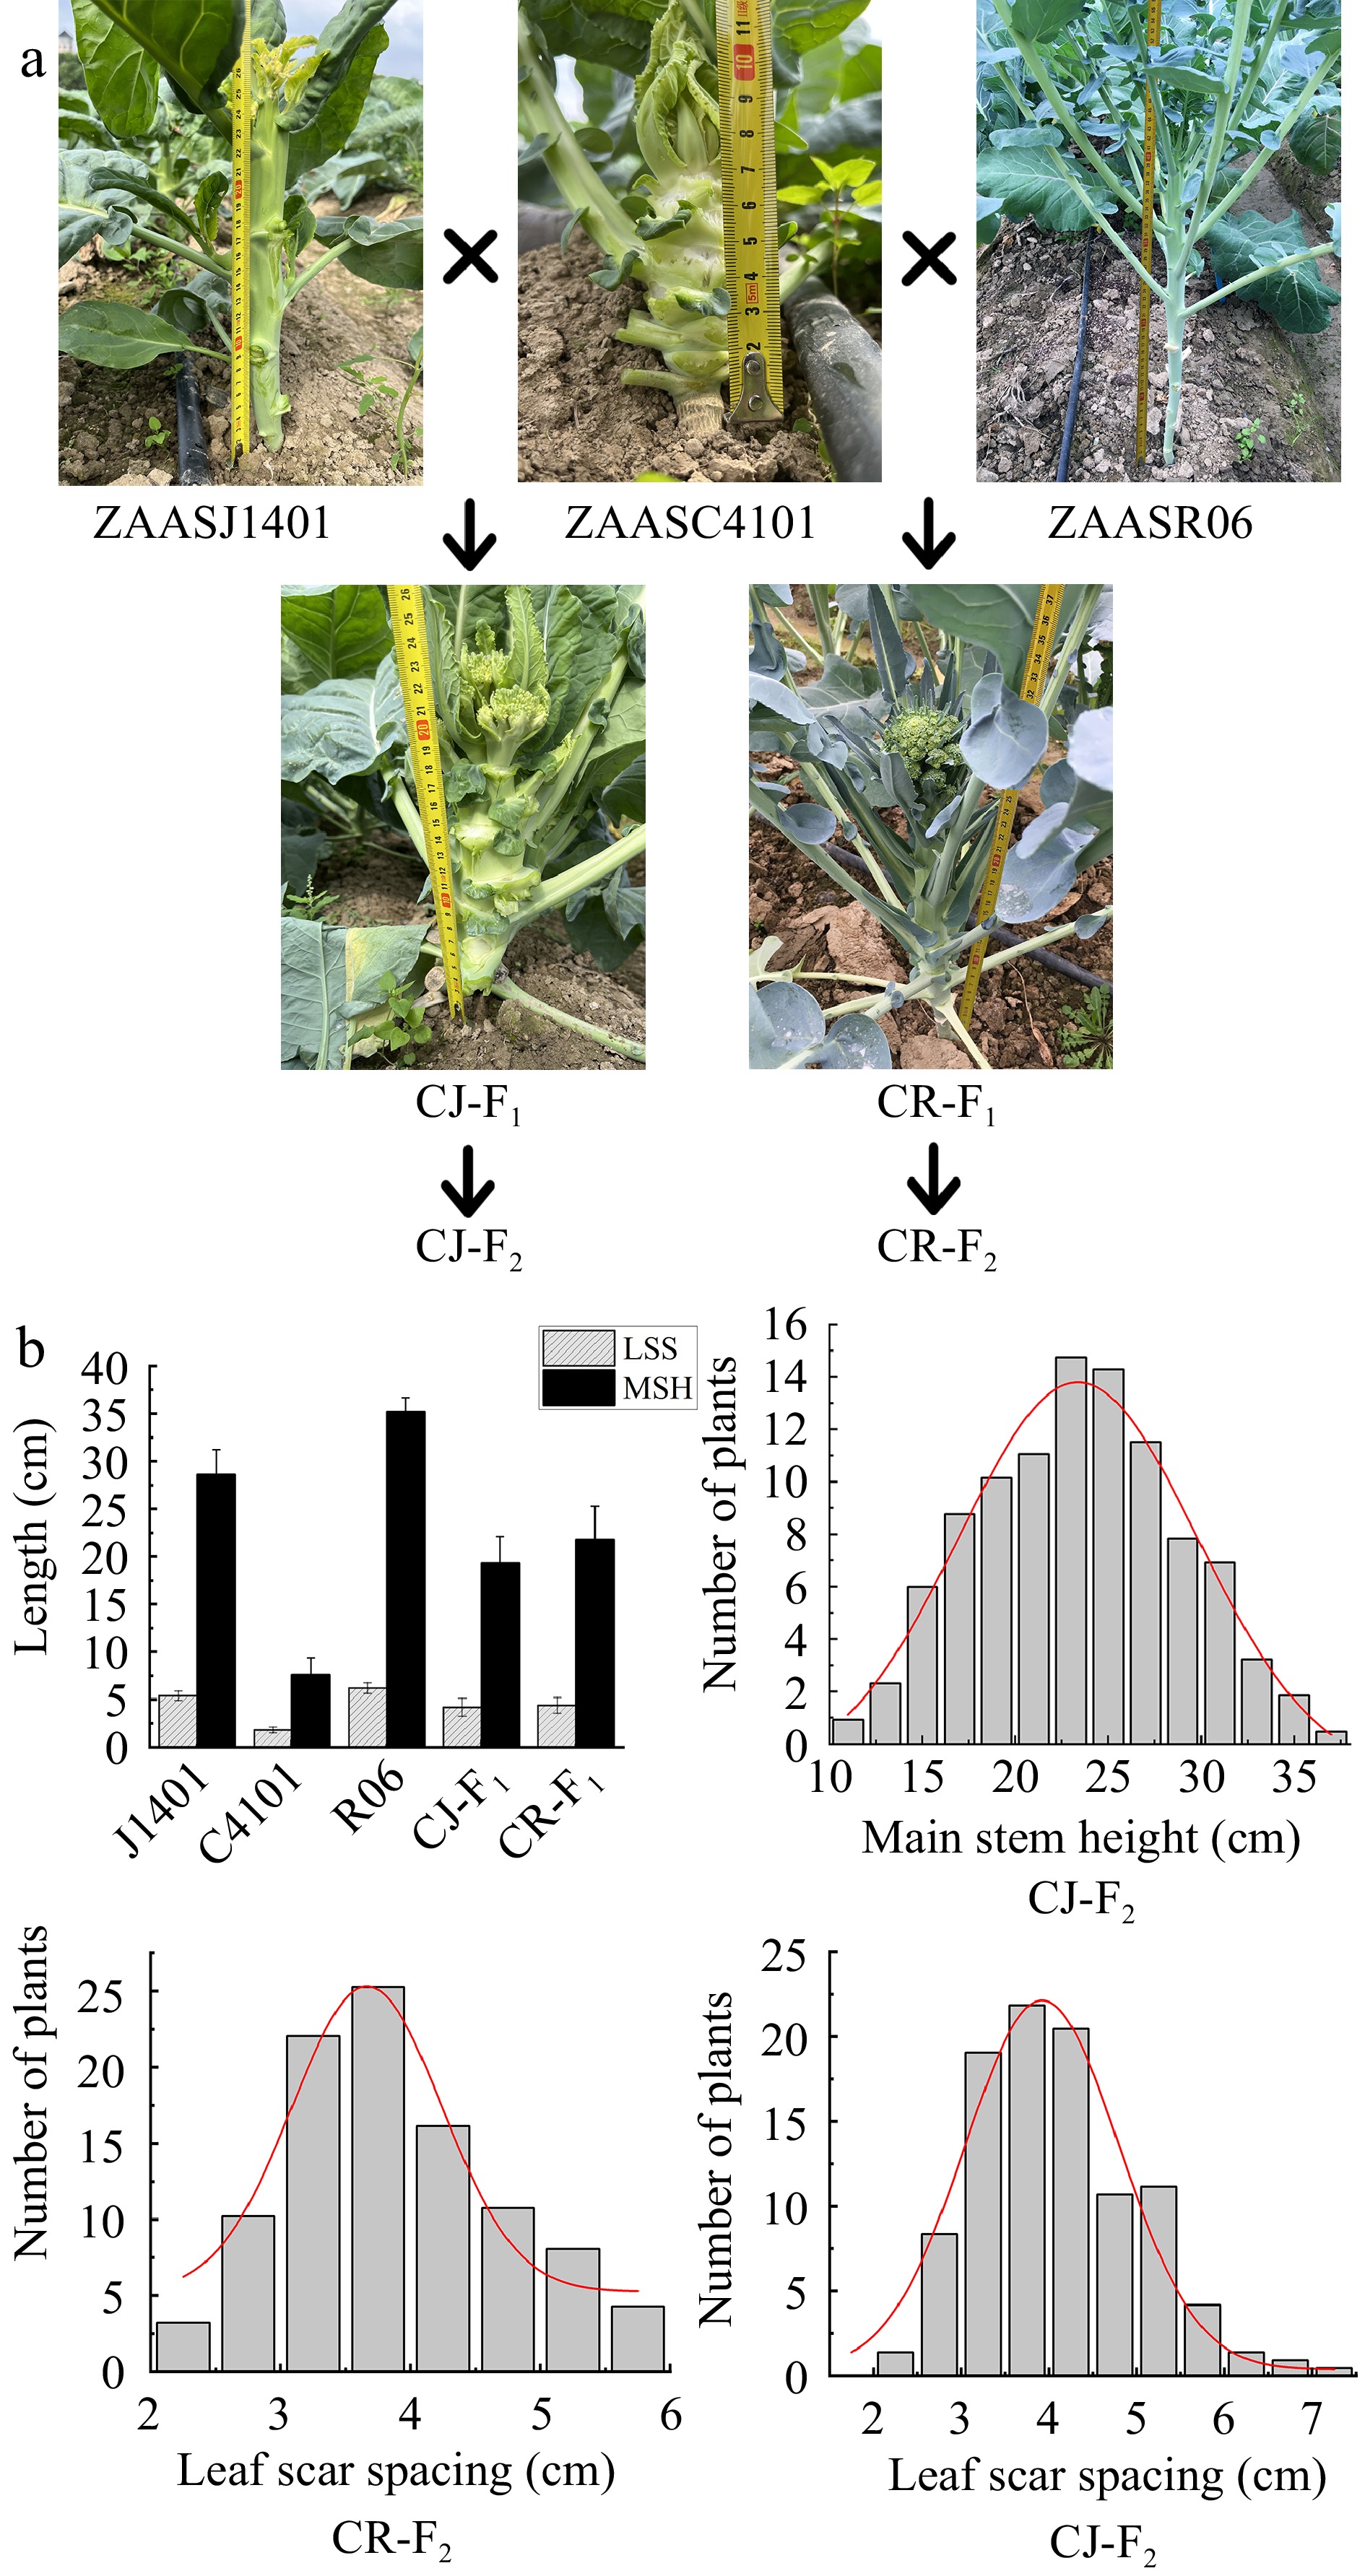
Figure 2.
The MSH and LSS phenotypes of the parents and their F2 populations. (a) The MSH and LSS phenotypes of ZAASC4101 (female parent, cauliflower with short MSH), ZAASJ1401 (male parent, Chinese kale with high MSH), ZAASR06 (male parent, broccoli landraces with high MSH) and their F1 hybrids (CJ-F1 and CR-F1). (b) Frequency distribution of MSH and LSS of the F2 individuals in the CJ-F2 population and LSS of the F2 individuals in the CR-F2 population.
The F1 plants generated from the crosses CJ and CR exhibited intermediate values compared to their respective parents for MSH and LSS, measuring 19.37 and 21.81 cm, and 4.23 and 4.41 cm, respectively. In the CJ-F2 population, both MSH and LSS displayed a continuous and near normal distribution, ranging from 11.0 to 37.0 cm and 2.0 to 7.0 cm, respectively (Table 1, Fig. 2). Furthermore, the correlation coefficient between MSH and LSS in the CJ-F2 population was approximately 0.95, indicating a significant positive correlation. In the CR-F2 population, the range of LSS was slightly narrower, ranging from 2.1 to 5.9 cm, compared to the CJ-F2 population (Table 1, Fig. 2).
High-density SNP maps construction for the two F2 populations
-
The customized 10K MNP array of Brassica oleracea was employed for genotyping the parental lines and F2 individuals. All the SNP markers were assigned to nine linkage groups, corresponding to the nine chromosomes of cauliflower. In the CJ-F2 population, a total of 3,569 filtered SNPs were used to construct a high-density linkage map with a total length of 8,373.66 cM. The average distance between adjacent markers was 2.35 cM, corresponding to a physical distance of approximately 0.141 Mb on the reference genome (Fig. 3).
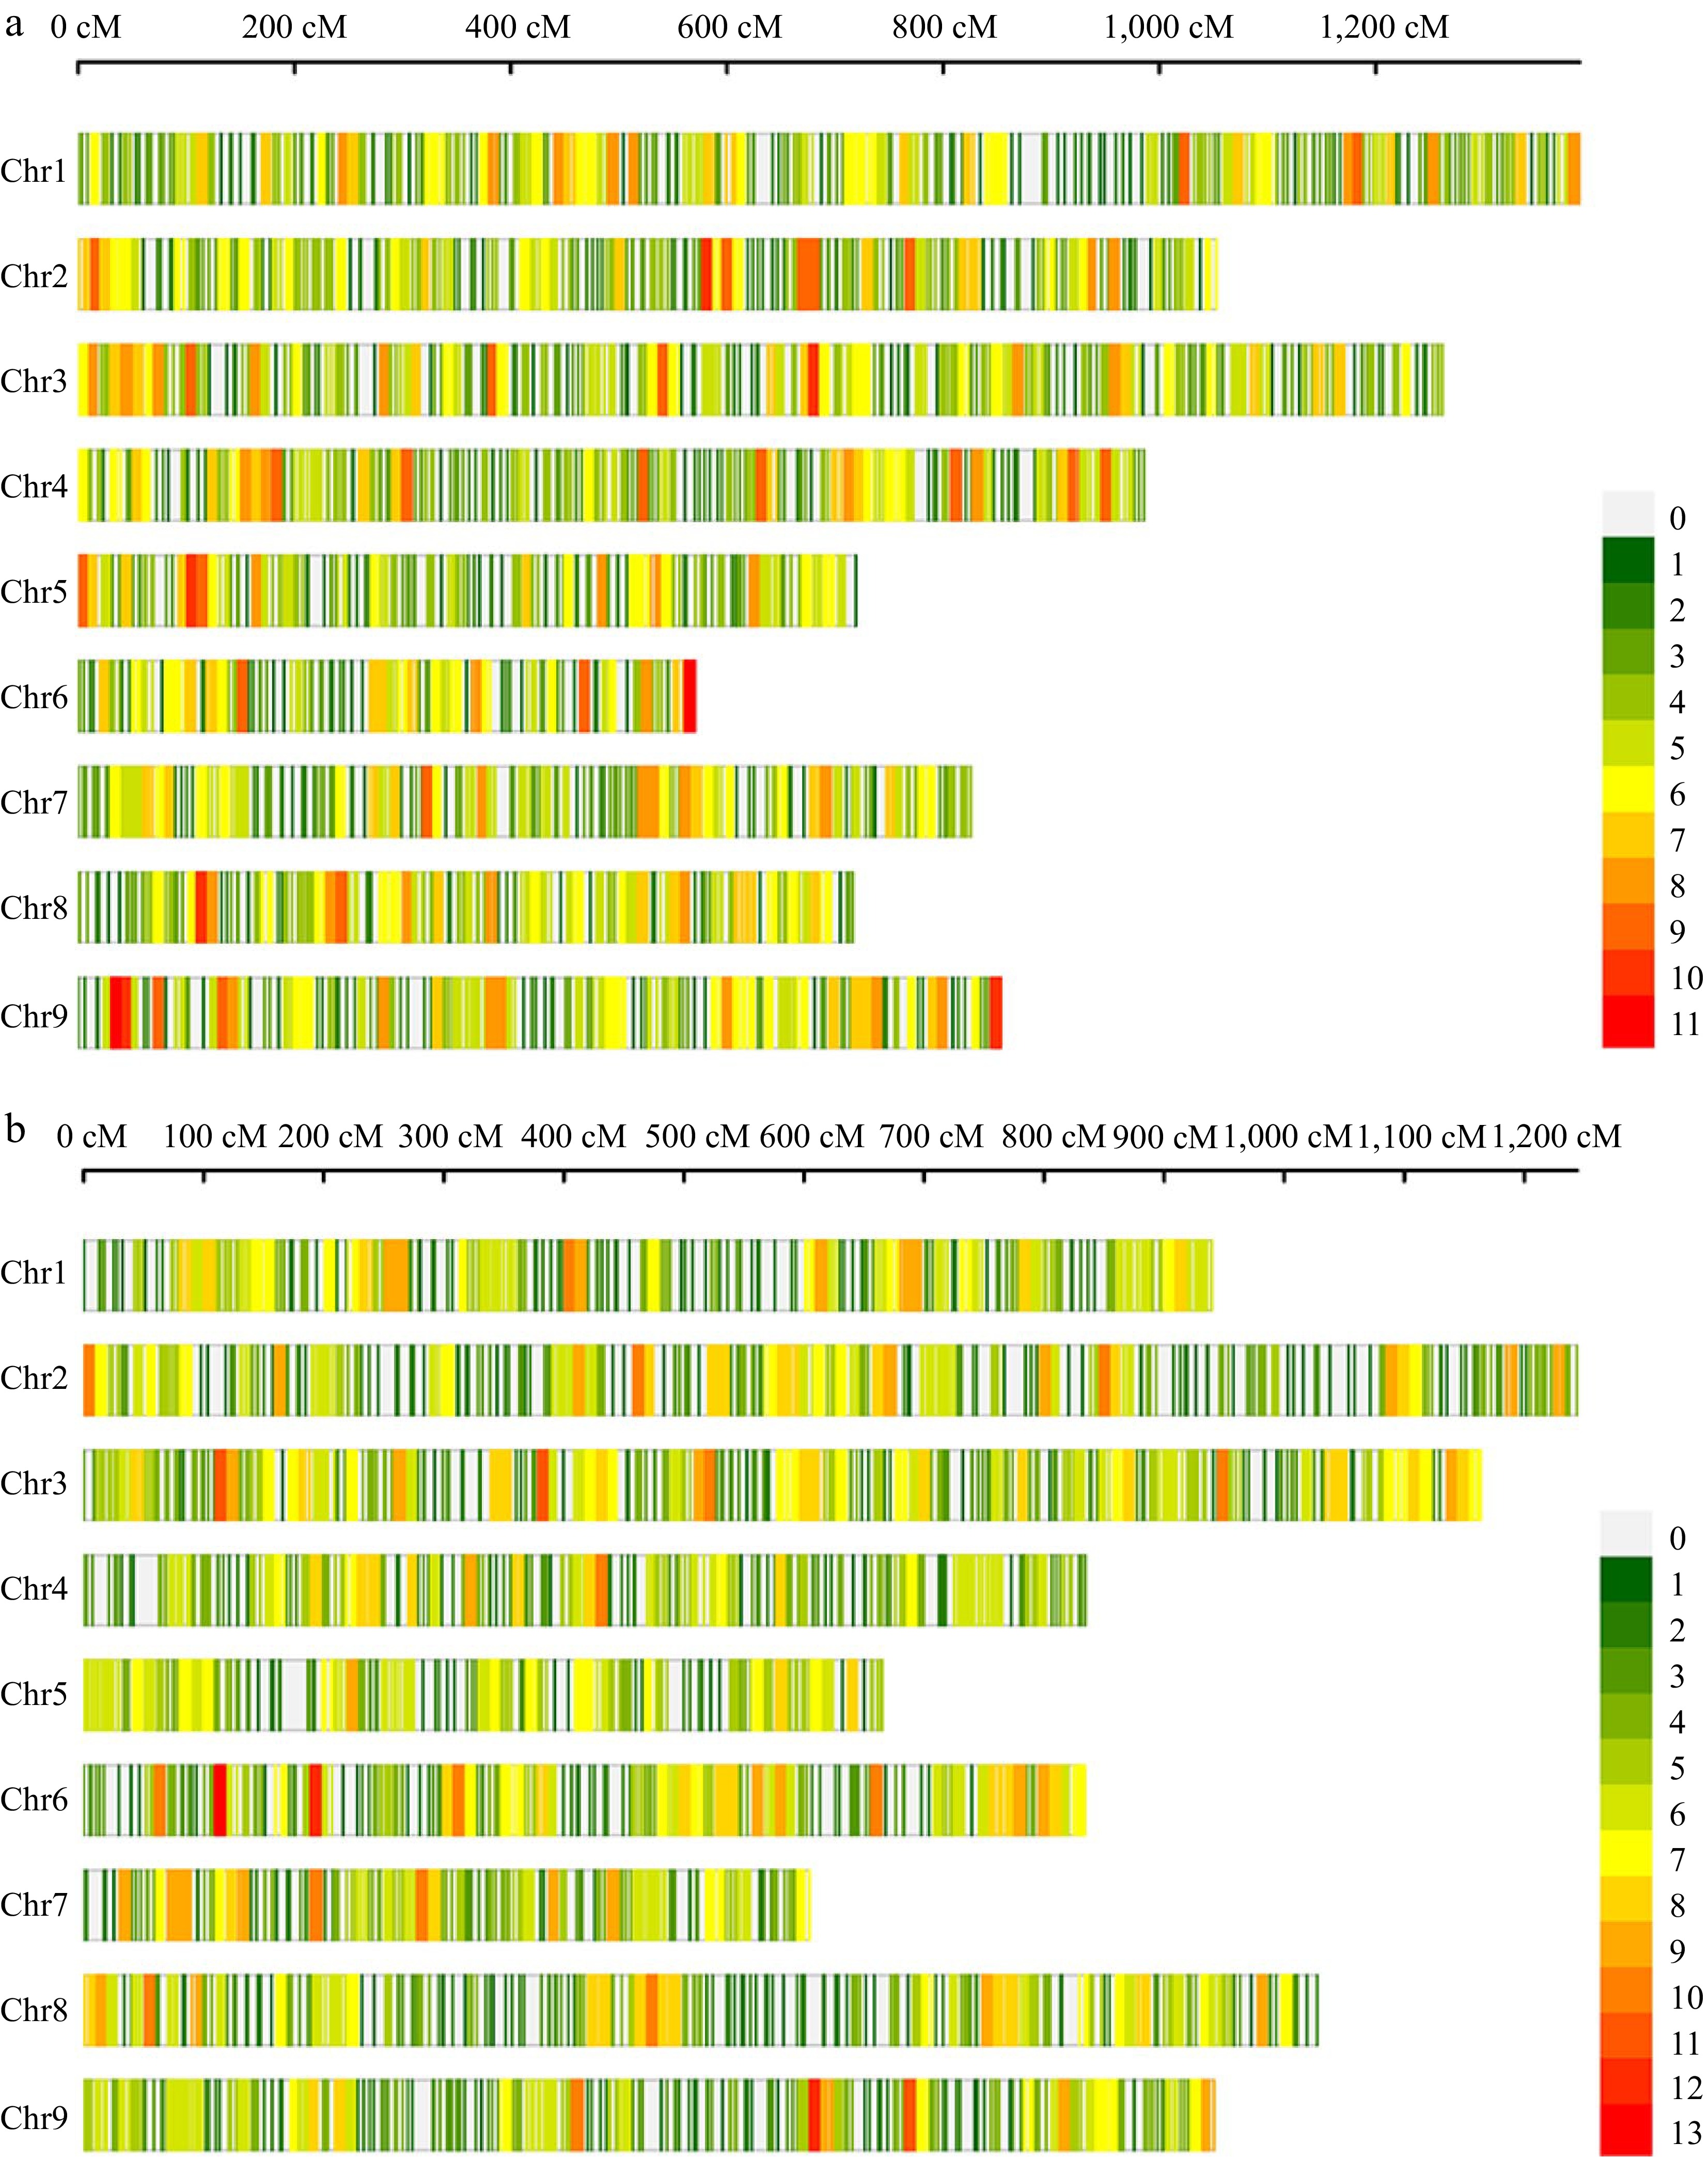
Figure 3.
High-density genetic maps constructed using a 10K chip for populations CJ-F2 and CR-F2. (a) The distribution of SNP markers on chromosomes in the CJ-F2 population. (b) The distribution of SNP markers on chromosomes in the CR-F2 population. The color represents the number of markers in the 10 cM interval.
Similarly, for the CR-F2 population, a total of 3685 filtered SNPs were used to construct the linkage map, covering a total length of 8,250.01 cM. The genetic distance and physical distances between adjacent markers were consistent with those in the CJ-F2 population, measuring 2.24 cM and 0.135 Mb, respectively (Fig. 3). A comprehensive summary of marker information for each chromosome in both F2 populations was provided in Supplemental Table S1. Notably, 95.32% of the SNPs in both maps had gaps of less than 3.0 cM, indicating a relatively uniform distribution of markers.
QTL identification for curd setting height in the two mapping populations
-
In the CJ-F2 population, the MSH and LSS data were used to detect QTLs associated with the curd setting height trait (Table 2, Fig. 4). A total of seven QTLs for MSH were identified on chromosomes C01, C02, C04, C05, C06, C07 and C09 with an LOD threshold of 4.28. These QTLs explained phenotypic variation (PVE) ranging from 3.05% to 33.0%, with additive effects ranging from −4.37 to 1.79. Among them, the QTL located on C01 (qCJMSH.C01-1) displayed the highest LOD value of 32.80 and explained the largest phenotypic variation of 32.99%. These values were significantly higher than those of the other six QTLs. In the CJ-F2 population, only two QTLs for LSS were detected on C01 and C05, respectively. Among these two loci, qCJLSS.C01-1 locus exhibited a relatively higher LOD value of 14.66 and explained a higher phenotypic variation of 23.48%. Furthermore, this locus overlapped significantly with the QTL qCJMSH.C01-1 controlling the MSH trait on chromosome C01.
Table 2. Summary of the identified QTLs detected.
Trait Population Identified QTL Chr.a Position CIb (cM) Physical interval (kb) LODc PVE (%)d Add.e MSH CJ-F2 qCJMSH.C01-1 C01 1,182 1,181.5−1,182.5 40,144−40,154 32.80 32.99 −4.37 qCJMSH.C02-1 C02 44 41.5−45.5 4,282−4,552 4.47 3.05 −1.35 qCJMSH.C04-1 C04 752 748.5−752.5 52,941−52,862 6.50 3.90 −1.43 qCJMSH.C05-1 C05 130 127.5−130.5 9,370−9,580 4.97 3.76 −1.51 qCJMSH.C06-1 C06 536 535.5−538.5 43,467−43,548 7.33 4.63 −1.73 qCJMSH.C07-1 C07 637 627.5−637.5 47,752−47,545 7.09 5.03 1.79 qCJMSH.C09-1 C09 360 355.5−360.5 19,188−19,188 5.21 4.37 −1.44 LSS CJ-F2 qCJLSS.C01-1 C01 1,205 1,181.5−1,183.5 40,144−40,277 14.66 23.48 −0.57 qCJLSS.C05-1 C05 110 203.5−211.5 6,824−7,020 6.13 8.96 −0.40 CR-F2 qCRLSS.C01-1 C01 777 774.5−779.5 38,823−40,682 5.52 10.02 −0.40 qCRLSS.C09-1 C09 669 664.5−674.5 49,244−49,346 5.52 9.97 −0.40 a Chromosome. b Confidence interval. c Logarithm of odds. d Phenotypic variation explained by the identified QTL. e Phenotypic variation explained by additive effect. 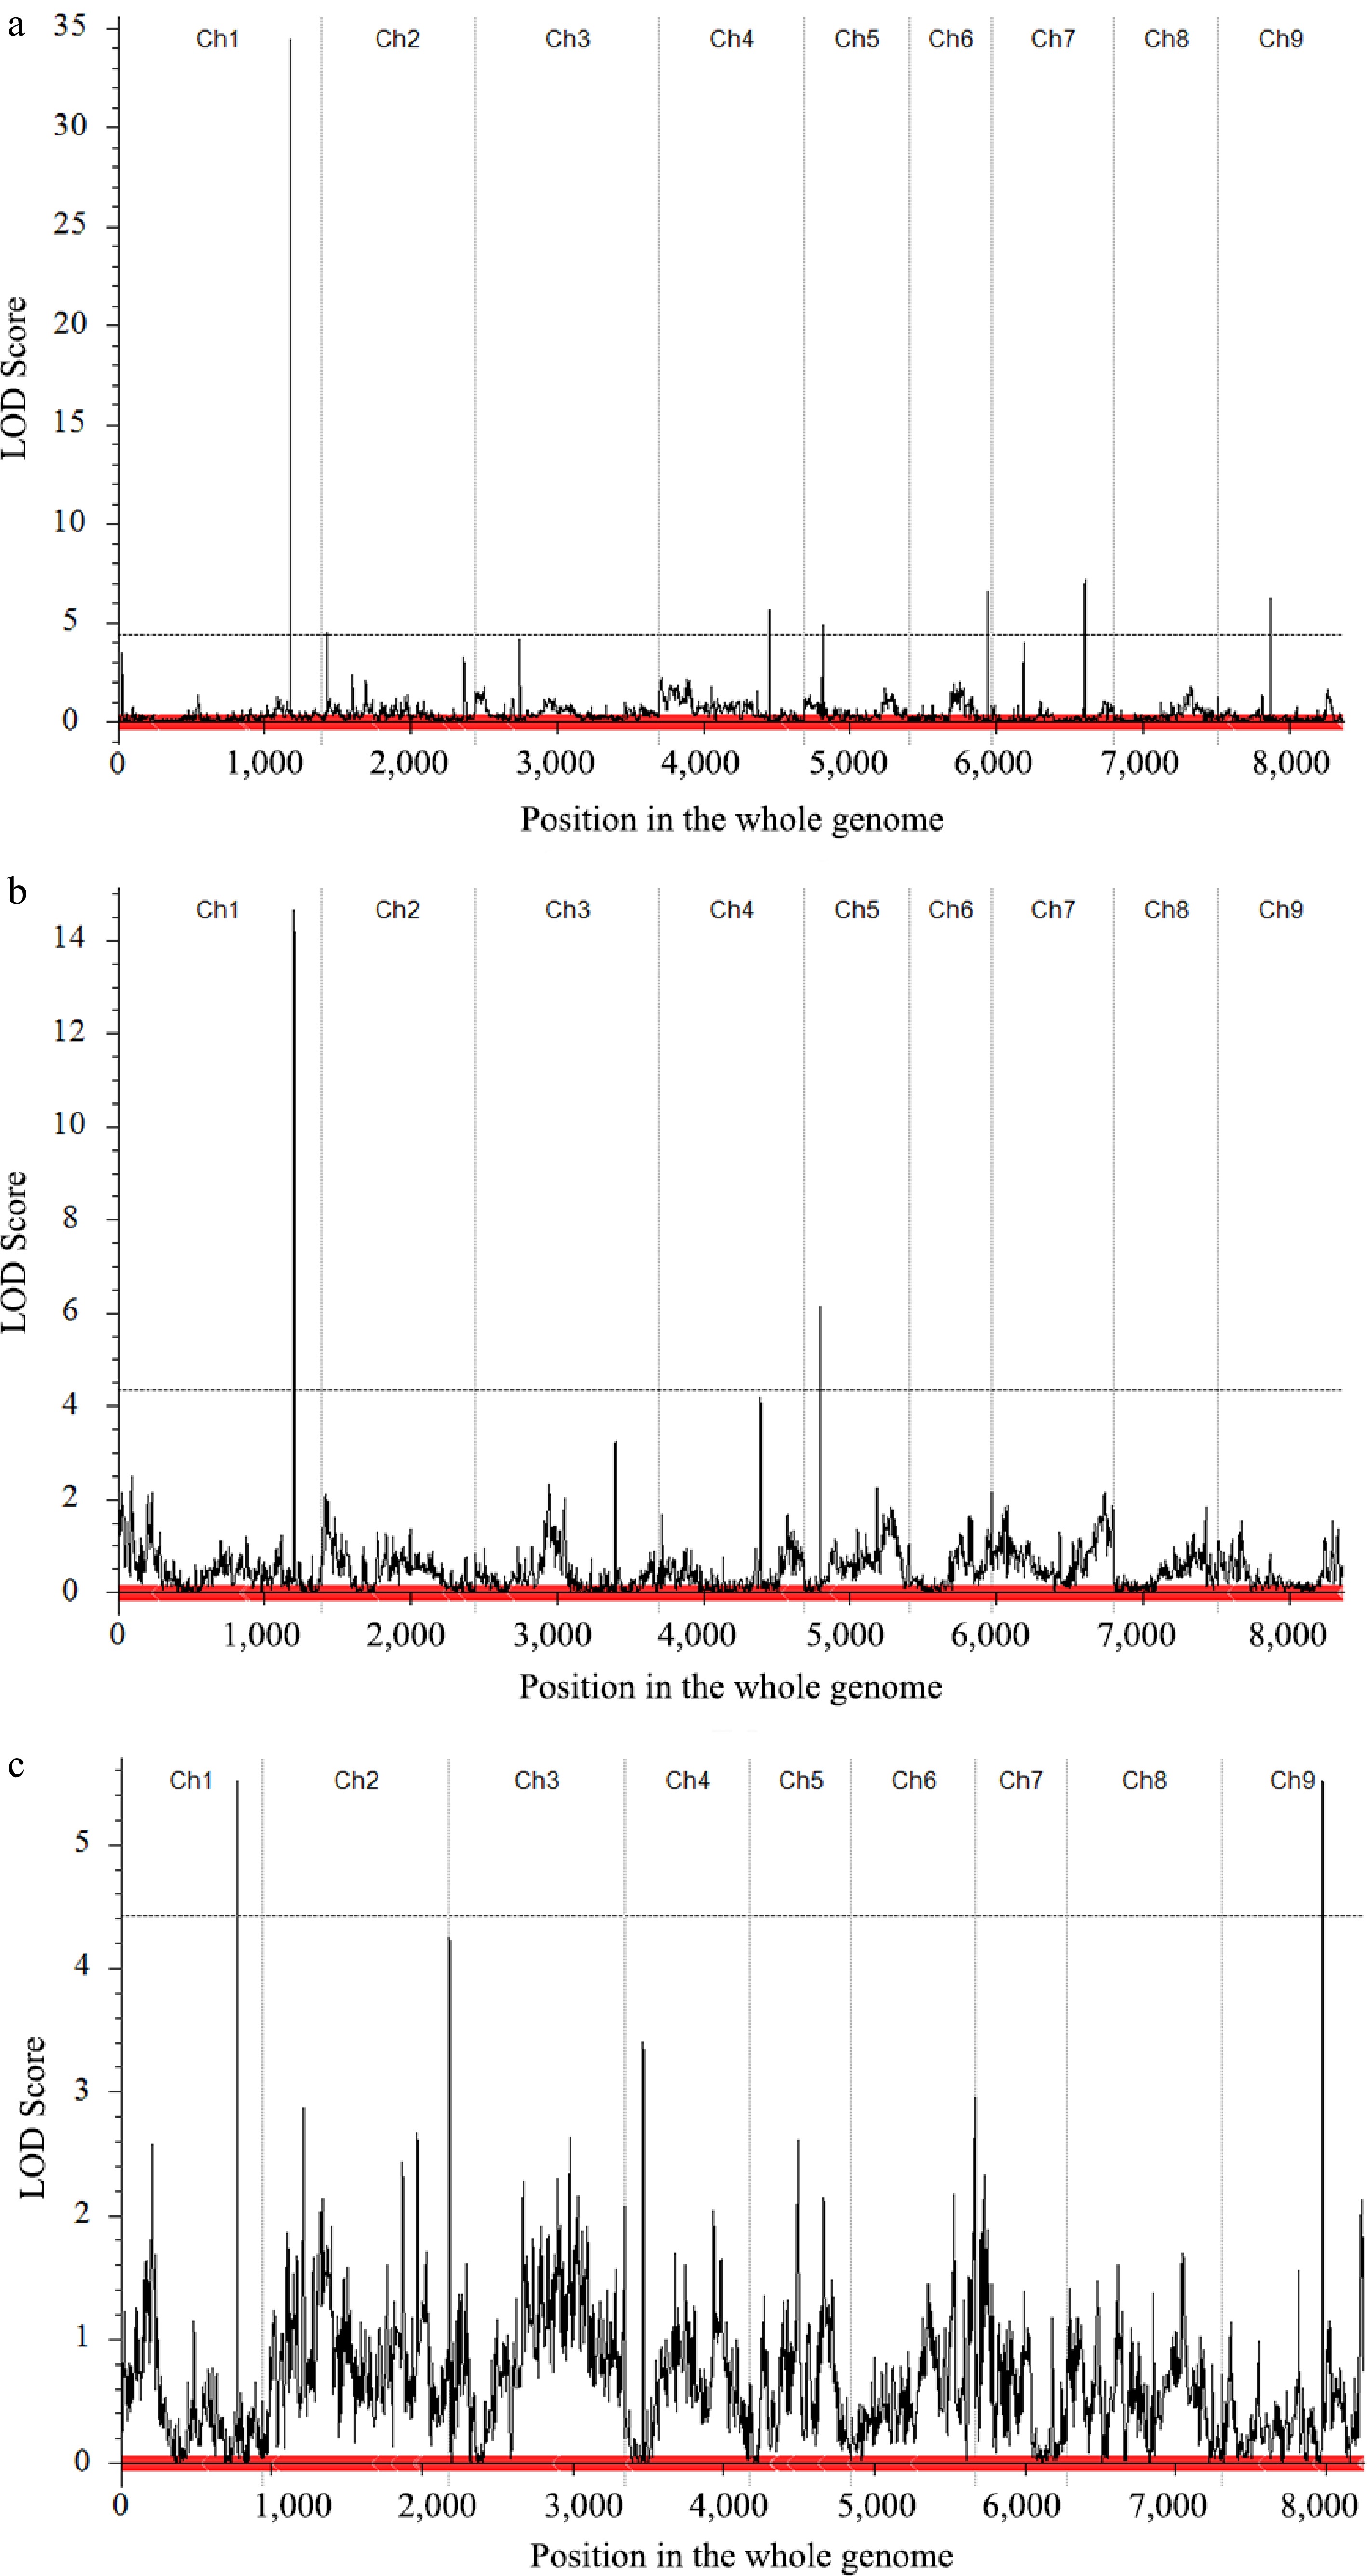
Figure 4.
Quantitative trait locus (QTL) mapping and co-localization of the curd setting height-related traits. (a) Main QTL on C01 of MSH trait in CJ-F2 population. (b) Main QTL on C01 of LSS trait in CJ-F2 population. (c) Main QTL on C01 of LSS trait in CR-F2 population.
In the CR-F2 population, only the LSS trait was used for QTL detection (Table 2, Fig. 4). Two QTLs, qCRLSS.C01-1 on C01 and qCRLSS.C09-1 on C09, surpassed the LOD significance threshold of 4.45. Among these, the QTL on C01, which was consistently detected in the CJ-F2 population, was also identified in this population and overlapped with qCRLSS.C01-1 locus. The QTL located on C01 was repeatedly detected in both F2 populations, indicating it as the target region harboring a causal variant for the curd setting height.
Fine mapping of the qCRLSS.C01-1 locus for curd setting height
-
Among the three co-localized QTLs identified for curd setting height, qCJMSH.C01-1 locus had the smallest genetic distance, corresponding to a physical interval of approximately 10 kb (C01: 40,144–40,154 kb), with only two genes located within the interval. The qCJLSS.C01-1 locus had a larger genetic distance, with a corresponding physical interval of approximately 133 kb (C01: 40,144–40,277 kb), encompassing 11 genes within the interval. The qCRLSS.C01-1 locus exhibited the largest genetic distance, corresponding to a physical interval of approximately 1859 kb (C01: 38,823–40,682 kb), and contained 136 genes. To effectively identify candidate genes, qCRLSS.C01-1 locus with the largest physical interval was selected for the subsequent fine mapping, referred to as BocDWARF1 in the following paragraphs.
In the CJ-F2 population, a single plant (147-CJ-F2) with a heterozygous target locus (BocDWARF1) and homozygous other loci were selected for selfing to generate an F2:3 population consisting of 1,580 individuals. Within the target region, nine SNP loci were designed as stable KASP markers for fine mapping. A total of seven recombinants were identified (147-3-F3, 147-498-F3, 147-667-F3, 147-592-F3, 147-989-F3 147-1183-F3 and 147-1289-F3) with homozygous fragments originated from the biparental chromosome at one side of the exchange site and the other side being heterozygous. The offspring of each recombinant above were chosen for the selection of homozygote recombinants. Finally, plants 147-3-8-F4, 147-498-6-F4, 147-667-8-F4 and 147-1183-12-F4, which harbored ZAASJ1401 chromosomal segment within the interval of C01: 38,839−40,094 kb, displayed relatively short MSH (< 19 cm) and LSS (< 3.5 cm). On the other hand, lines 147-592-3-F4 and 147-989-11-F4, carrying ZAASJ1401 chromosomal segment within the interval of C01: 40,298−40,627 kb, exhibited significantly longer MSH (> 26.5 cm) and LSS (> 4.3 cm), indicating the presence of a curd setting height-related QTL in the later interval. Furthermore, the recombinant line 147-1289-2-F4, harboring ZAASJ1401 chromosomal segment within the interval of C01: 40,400−40,627 kb displayed a short MSH (12.7 cm) and LSS (2.8 cm), providing strong support for the region of interest (C1: 40,298−40,400 kb) as a causative region relevant to curd setting height (Fig. 5).
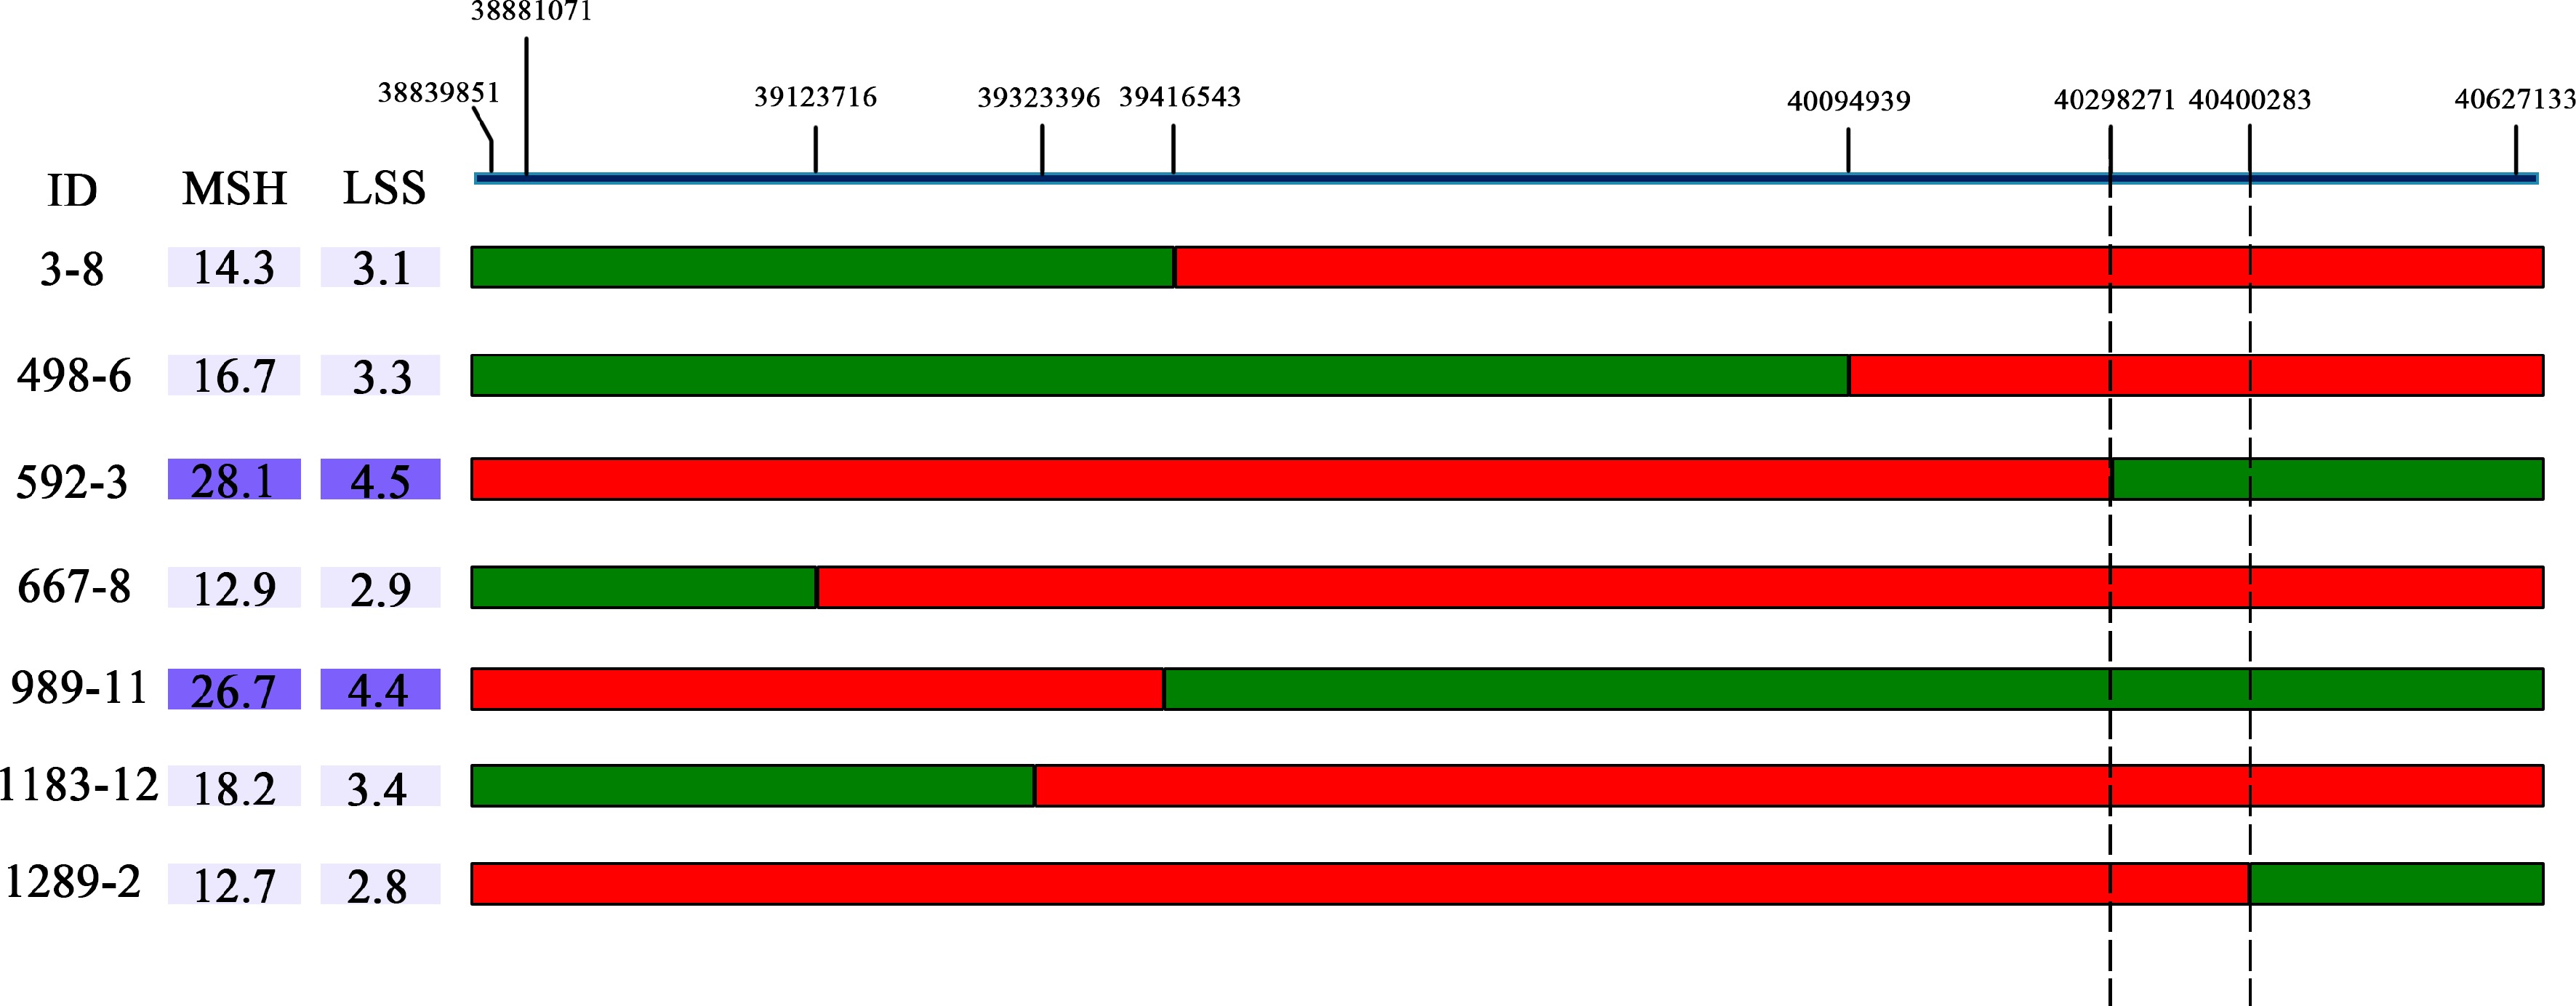
Figure 5.
The BocDWARF1 locus was fine-mapped in the 102 kb region between 40,298,271 bp and 40,400,283 bp. The green bars indicate homozygous segments from ZAASJ1401 with high MSH and red bars indicate homozygous segments from ZAASC4101 with short MSH. The ID indicates the name of recombinants from the F4 population.
Candidate gene analysis in the target region of C1: 40,298–40,400 kb
-
Based on the annotated information of the reference genome, a reduced target interval of ~102 kb (C1: 40,298−40,400) contained a total of 12 genes (Supplemental Table S2). To gain insights into the sequence variations between the parental lines within this target interval, we performed genome resequencing of ZAASC4101 and ZAASJ1401. Following alignment to the HDEM reference genome, we selected 13.36 and 12.15 Gb of clean reads for ZAASC4101 and ZAASJ1401, respectively, for subsequent analysis. These reads corresponded to a genome coverage of ~22× for ZAASC4101 and ~20× for ZAASJ1401. After filtration, a total of 1,139,237 high-quality SNPs and 127,915 InDels were identified between the two parents.
Within the target region of approximately 102 kb, a total of 65 SNPs and five indels were found distributed in the exon regions of the 12 genes. Notably, none of these variants resulted in termination or frameshift mutations. Strikingly, a particular gene (BolC1t04399H) caught our attention as it was a homolog of the classic plant height control gene DWARF1. Thirteen SNPs were identified within the exon region of BolC1t04399H, and four of these SNPs resulted in amino acid differences (Fig. 6, Supplemental Fig. S1). Furthermore, numerous SNPs and Indels were found between the two parents in the 2.0 kb regulatory region upstream and downstream of this gene (unpublished), suggesting potential effects on its transcription level. In summary, although further genetic functional validation is still required, the current results indicated that BolC1t04399H was the most likely candidate gene responsible for controlling the curd setting height trait of cauliflower.
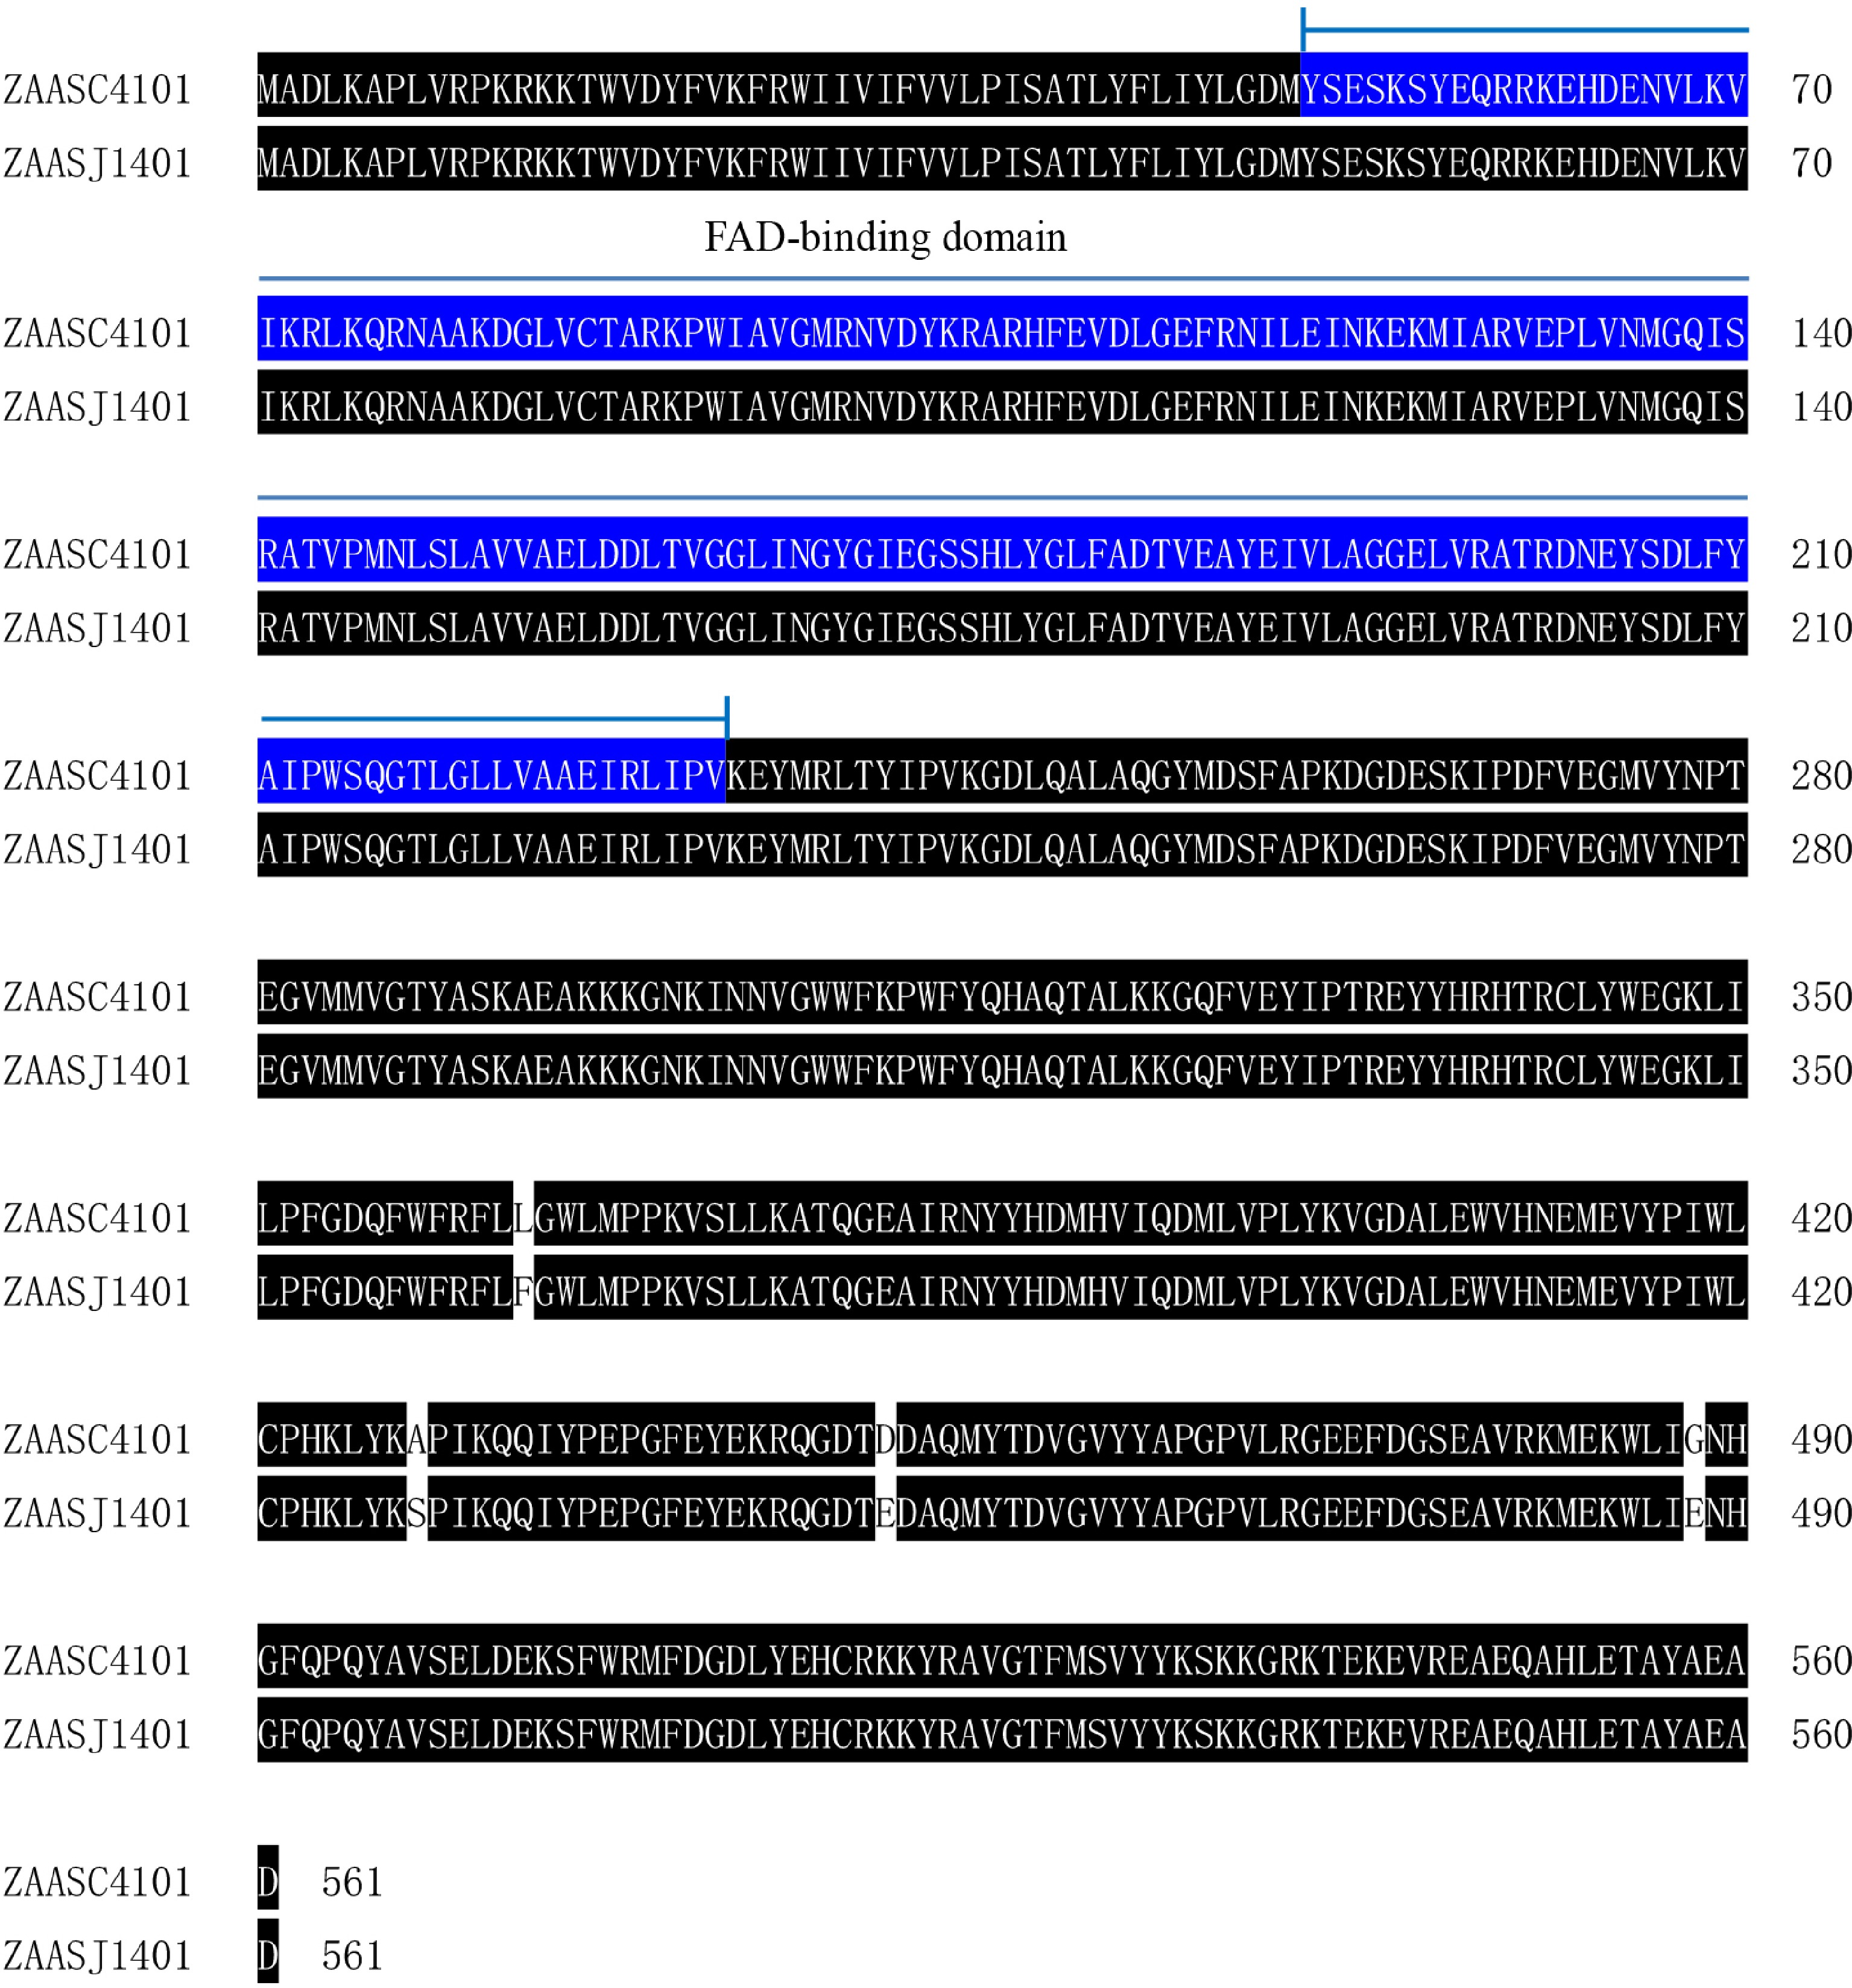
Figure 6.
Amino acid sequence differences of BolC1t04399H between parental lines. The blue background indicates the conservative FAD binding domain. There are a total of four non synonymous SNPs causing amino acid differences.
Development of a KASP marker linked to CSH trait
-
To facilitate selection of high CSH carrying BocDWARF1 in future breeding programmes, a KASP marker for the SNP 1_40298271 that flanks BocDWARF1 was developed. The female line of ZAASC4101 with short MSH and LSS showed the genotype of TT at this locus, while the male line of ZAASJ1401 with long MSH and LSS presented the genotype of CC at this locus. TC was a heterozygous genotype with intermediate MSH and LSS. Among 218 individuals from CJ-F2 population, the MSH and LSS both displayed marked ascending patterns of CC > TC > TT (Fig. 7a, b).
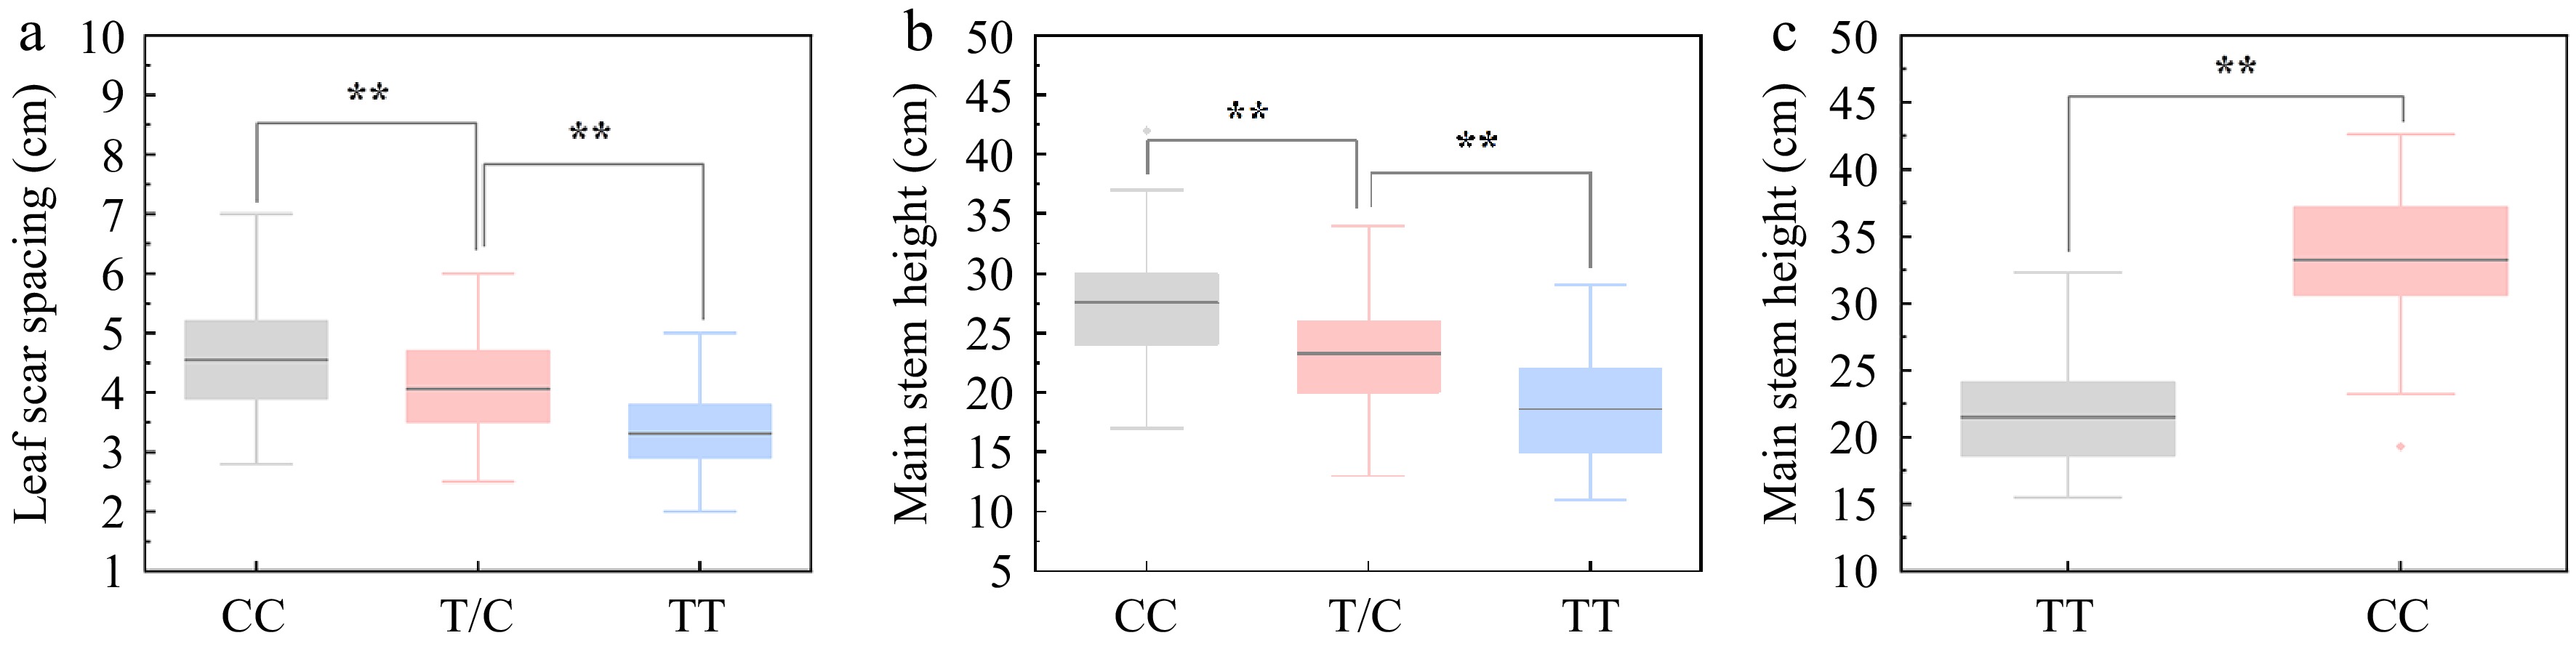
Figure 7.
Association between the genotypes at SNP40298271 locus and curd setting height (CSH) variation. (a), (b) Association analysis between genotypes at SNP40298271 locus (CC, TC and TT) and leaf scar spacing (LSS)/main stem height (MSH) in 218 individuals of CJ-F2 population. (c) Association analysis between genotypes at SNP40298271 locus (CC and TT) and MSH in 38 germplasm accessions.
In addition, to explore the allelic distributions of the SNP 1_40298271 in other germplasm accessions, 38 breeding lines including F7-8 generation inbred lines and double haploid (DH) lines were analysed using KASP. From Fig. 7c, the MSH of the CC genotype was significantly higher than that of TT, indicating the usefulness of this KASP marker in the future marker-assisted selection. However, several accessions with CC genotype at this locus displayed lower MSH as that of TT, suggesting that there might be other loci controlling the CSH of cauliflower.
-
Plant height is a fundamental trait that plays a significant role in determining crop yield. During the 1960s and 1970s, the first 'Green Revolution' focused on genes associated with dwarf trait, such as Rht1 and SD1, leading to the development of semi-dwarf varieties with increased yield in rice and wheat[21,22]. In Brassica crops, genetic mapping research on plant height has primarily centered around rapeseed. Several dwarf-related genes in B. napus have been mapped or identified, such as DS-1[23], NDF-1[24], DS-3[25], DS-4[26], G7[27], BnaDwf.C9[28] and BnaC01.BIN2[29]. In cauliflower, the curd setting height largely depended on the height of the main stem supporting it, constituting a significant component of overall plant height. However, due to extensive artificial selection for high yield, modern cauliflower varieties available on the market exhibit low curd setting height, which has now become a key limiting factor for mechanized harvesting and production of cauliflower[30].
Plant height is a complex trait known to be controlled by multiple genes[31,32]. In the past, most plant height-associated genes were identified through map-based cloning using dwarf mutants as parental lines, which were usually governed by a single gene[33,34]. However, for quantitative traits, successfully cloning the target genes through this approach has proven challenging. Therefore, it was crucial to accurately identify the major QTLs related to the target traits, which necessitated cross-validation among different genetic populations or the same stable genetic population in different environments[35,36]. Research on molecular biology in cauliflower commenced relatively late, and the development of important agronomic traits mutants, such as those related to curd formation or plant height, was lacking[37]. In this study, two F2 populations were constructed to map the QTLs for curd setting height defined by MSH and LSS. The results revealed a significant correlation between these two indicators and their mapping to the same region (C01: 38,823−40,682 kb), which was considered the target locus controlling the curd setting height in cauliflower. Therefore, the mutual validation of multiple populations can improve the accuracy and effectiveness of identifying key loci for quantitative traits.
When conducting fine mapping of the target major loci associated with major quantitative genetic traits, it is necessary to mitigate the impact of other loci and convert the quantitative trait controlled by multiple genes into a qualitative trait controlled by a single gene[38,39]. In this study, we focused on two phenotypic indicators, MSH and LSS, which were mapped to a total of seven loci on chromosomes C01-02, C04-07, and C09 in the CJ-F2 and CR-F2 populations. Among these loci, only the main locus on the C01 chromosome, with the highest LOD value, was consistently detected. The remaining loci were inconsistent and appeared to be minor and specific, contributing to curd setting height. To facilitate fine mapping, an individual from the CJ-F2 population with a heterozygous target region and homozygous alleles at other minor loci was selected to construct a large F2:3 population. Through resequencing of the parental lines and utilizing KASP markers targeting the specific segment of interest, we efficiently identified recombinants in the F2:3 population with homozygous domains at the target region. Combining the genotypic and phenotypic data from these recombinants enabled the narrowing down of the target region to a segment spanning 102 kb. Within this segment, we identified a total of 12 genes, and among them, BolC1t04399H, a homolog of DWARF1, was selected as a potential regulator of curd setting height.
Brassinolide (BL), the final product of the brassinosteroid (BR) biosynthesis pathway, is synthesized from sterol substrates[40]. As a result, plant mutants that are defective in the biosynthetic steps leading from mevalonic acid to sterol, as well as in the steps involved in modifying sterols to brassinolide, often display the characteristic dwarf phenotype[41,42]. DWARF1 was reported as a biosynthetic enzyme involved in the conversion of the early brassinosteroid precursor 24-methylenecholesterol to campesterol[43]. In DWARF1, a conserved flavin adenine dinucleotide (FAD)-binding domain has been observed across various plant species[11,44,45]. In Arabidopsis, the majority of dwarf1 mutants carry mutation sites located within or near this FAD-binding domain. These Arabidopsis dwarf1 mutants exhibited distinct phenotypes, such as reduced height and fertility, robust stems, a prolonged life cycle, and round and curled leaves[45]. Cauliflower is a typical green vernalized plant. During its seedling growth, the hypocotyl elongates normally. When the plant grows to about 6–10 leaves, the tissue of shoot apical meristem perceives low temperature and undergoes vernalization. From then on, the process of curd development begins. Meanwhile, the elongation of the main stem of the plant is inhibited, and the spacing between leaf scars is shortened. Finally, during the curd development and maturation, the leaves of cauliflower exhibit a lotus shape[46,47]. BRs, as the endogenous hormone signals, have been widely reported to have a significant promoting effect on plant growth, especially on plant height increasing and internode elongation[48,49]. So, we speculate that factors involved in BR biosynthesis or signaling pathways also play an important role in regulating the CSH trait of cauliflower. In the present study, the putative candidate gene BolC1t04399H is the homologue of DWARF1 in Arabidopsis. It displayed four non-synonymous SNPs between the parents, located near the conserved FAD-binding domain. Therefore, further experimental validation is required to determine whether these SNPs within the coding region of BolC1t04399H contribute to functional differences.
In conclusion, this study represented the first successful fine mapping of BocDWARF1 in B. oleracea crops and proposed the candidate gene BolC1t04399H as a regulator of curd setting height in cauliflower. The findings of this study provided valuable insights about the genes responsible for regulating the main stem elongation in Brassica crops. Additionally, further functional validation of the candidate gene, along with investigating the reported plant height-regulating genes in rapeseed and Arabidopsis, will enhance our understanding of the signaling and regulatory network underlying plant height formation in Cruciferous crops.
-
The authors confirm contribution to the paper as follows: supervised and designed the experiments: Sheng X, Gu H; performed the experiments: Cai S, Yu H, Lin F; analyzed the data: Shen Y, Qiao S; wrote the manuscript: Sheng X, Cai S; revised the manuscript: Wang J, Gu H. All authors reviewed the results and approved the final version of the manuscript.
-
All data generated or analyzed during this study are included in this published article and its supplementary information files.
This study is supported by the Science and Technology Department of Zhejiang Province for Key Agriculture Development (2021C02065-4-3, 2021C02065-4-1), the Key R&D Program in Zhejiang Province (2021C02042, 2022C02051), Natural Science Foundation of Zhejiang Province (LD22C150002) and Project of Zhejiang Academy of Agricultural Sciences.
-
The authors declare that they have no conflict of interest.
-
# Authors contributed equally: Xiaoguang Sheng, Shiyi Cai
- Supplemental Table S1 Detailed information of SNP markers on each chromosome of the two genetic maps.
- Supplemental Table S2 The information of twelve genes within the fine mapping interval.
- Supplemental File 1 Genetic map information for CJ-F2 population.
- Supplemental File 2 Genetic map information for CR-F2 population.
- Supplemental Fig. S1 Coding sequence differences of BolC1t04399H between parental lines.
- Copyright: © 2024 by the author(s). Published by Maximum Academic Press, Fayetteville, GA. This article is an open access article distributed under Creative Commons Attribution License (CC BY 4.0), visit https://creativecommons.org/licenses/by/4.0/.
-
About this article
Cite this article
Sheng X, Cai S, Shen Y, Yu H, Wang J, et al. 2024. QTL analysis and fine mapping of a major QTL and identification of candidate genes controlling curd setting height in cauliflower. Vegetable Research 4: e008 doi: 10.48130/vegres-0024-0002 

QTL analysis and fine mapping of a major QTL and identification of candidate genes controlling curd setting height in cauliflower
- Received: 16 October 2023
- Revised: 11 December 2023
- Accepted: 19 December 2023
- Published online: 15 March 2024
Abstract: Curd setting height, a critical component of plant height, plays an important role in ideotype construction and yield improvement in cauliflower. However, the underlying mechanisms governing this trait in Brassica crops remain unclear. In this study, we developed two F2 populations by crossing a cauliflower DH line, ZAASC4101, having a short main stem, with two Brassica oleracea inbred lines possessing a long main stem. Subsequently, two high-density linkage maps were constructed for each F2 population using a 10K MNP (multiple nucleotide polymorphism) array developed for Brassica oleracea species. These maps covered genetic distances of 8,373.66 and 8,250.01 cM, respectively. Notably, a major QTL related to curd setting height (BocDWARF1) was consistently identified on chromosome C01 with the highest LOD value in both F2 populations. Through the analysis of the recombinants identified from the F2:3 and F3:4 populations at the BocDWARF1 locus, we successfully fine-mapped this locus to a narrow interval delimited by SNP markers 1_40298271 and 1_40400283. This interval corresponds to an approximately 102-kb region harboring 12 predicted genes. Combined with parental resequencing data with HDEM reference genome annotation information, we proposed BolC1t04399H as the most promising candidate gene. This gene exhibits homology to the well-known plant height-controlling gene DWARF1 and shows a total of four nonsynonymous SNPs in the exon region between the parents. This study lays the foundation for map-based cloning of BocDWARF1 and provides valuable insights for breeding improved cauliflower varieties with the ideal curd setting height.
-
Key words:
- Cauliflower /
- Curd setting height /
- QTL analysis /
- Candidate genes