


-
Humankind is experiencing unprecedented population growth. An additional 1.5 billion people are estimated to join the current 7.6 billion over the next 30 years[1]. The primary challenge of the contemporary world is to meet accelerating requirements for food, energy, water and basic health. Demand for agricultural products is growing and is expected to increase by about 70% by 2050[2]. There have been considerable improvements in agricultural productivity as reflected by the relatively unchanged total global land area under cultivation since 1991, during which time production has increased and intensified[3]. However, interlinked threats related to food security, increasing pressure on natural resources and climate change have become ever more apparent, and this is attracting the interest of scientists and policymakers in conceptualizing sustainable agricultural practices[4].
Mixed farming systems that integrate crops and livestock on the same farm are one of the most ancient agricultural practices[5,6]. Such a system in which a tree-integrated with livestock and crops together is known as agrosilvipasture and is one of very old agroforestry practice. These systems occur in nearly all agro-ecological zones under a variety of climatic and soil conditions. Such systems are the mainstay of smallholder production in developing countries and are crucial for food security, accounting for the greatest share of production of staple crops, including 41% of maize, 86% of rice, 66% of sorghum, and 74% of millet production[6]. These systems also produce the bulk of livestock products in the developing world, account for 90% of the milk and 80% of the meat[7] as well as employ millions of people in farms and across value chains.
In China, mixed-farming systems cover 83% of the total cropland and produce 74% and 87% of corn and wheat, respectively. They produce 90% of mutton and beef, and 50% of pork and poultry meat in China. About 55% of China’s agricultural population is farming in integrated crop-livestock systems[8]. Social, economic and ecological sustainability in China, to a large extent, depends on the management and continual optimization of these mixed crop-livestock production systems. Rice, corn, wheat and sorghum are important crops for China and are cultivated alongside livestock in mixed farming systems. Corn foliage contains significant amounts of nutrients, which can contribute greatly to cattle nutrition and health. Similarly, post-harvest sorghum residue sorghum an excellent source of fodder to ruminants. These mixed systems minimize risks resulting from crop failure, add value to crop residues by converting them into animal protein, cycle nutrients through manure and enhance cultivation through traction[6,8].
Integrating trees, and in particular, nitrogen-fixating trees, such as leguminous trees, into mixed crop-livestock farms can increase the resilience of farming systems by increasing species richness[9] while providing considerable mitigation benefits[10]. Tree introduction enhanced the resilience of mixed farming systems that nurture soils, increase nutrient cycling and protect against climate shocks[11,12]; at the same time, trees could help mitigate heat-stress related problems in livestock[13]. Diversifying production also makes producers more resilient to economic shocks. Sharing the same piece of land used for crop and livestock production with useful trees is a wise land use decision to minimize competition for available land resources[14,15]. We use the term 'integration' in this paper for these systems, which maximizes land use and promote agricultural diversity as well as livestock production. In addition to diversified farming systems that allow soil and water to be better conserved, such an integrated approach also enables the production of many other ecosystem services including carbon sequestration and biodiversity conservation.
In this system, crops, livestock and trees interact to create synergy, with recycling allowing the maximal use of available resources (Fig. 1). Aside from total environmental benefits, there are many production and economic benefits of integration. The integration provides ecosystem services such as plant pollinators and birdlife that can help reduce pesticide use and associated costs. Integrated systems increase farm value and can reduce salinity, waterlogging and erosion problems from wind and water in farmlands. Firewood provision and timber production are other benefits, along with carbon farming where such initiatives are implemented[12,14]. The system optimizes the use of all biomass and by-products. The overall environmental and production benefits of integrated livestock, crop and tree farming can provide a sustainable form of agriculture that includes circular agriculture in the context of climate change, including mitigation of the heat stress impact on livestock in the Anthropocene[13,16].
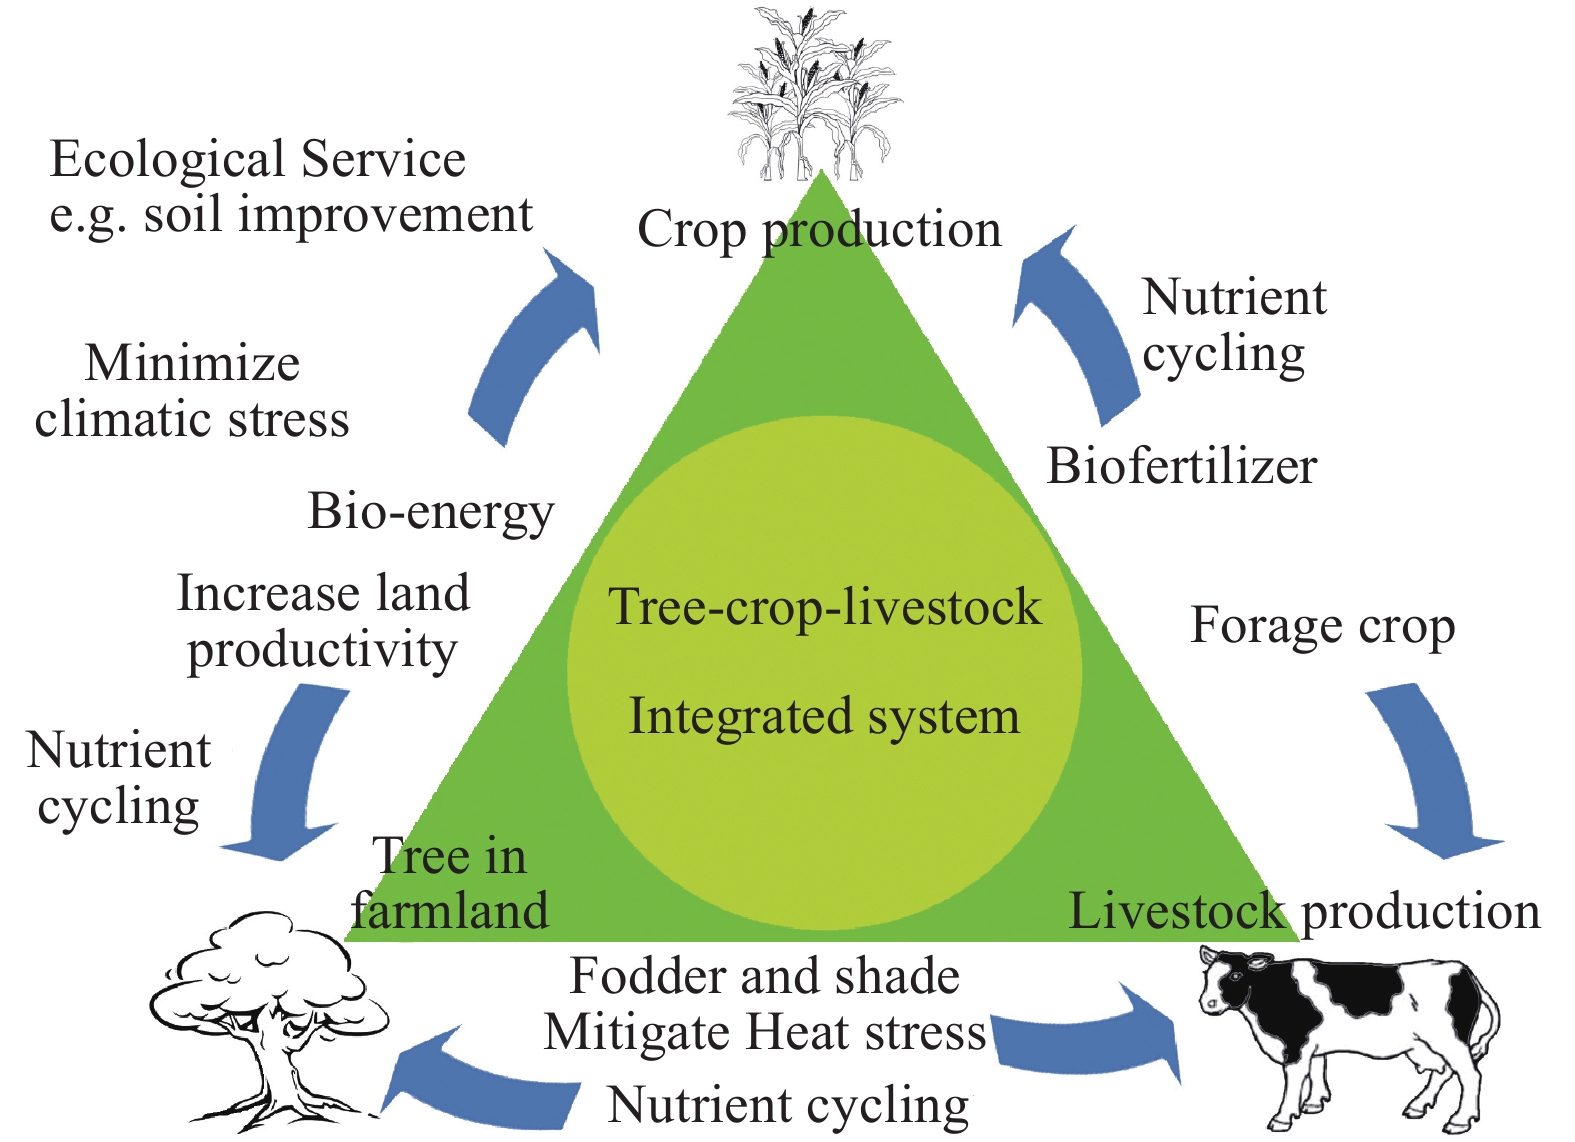
Figure 1.
Outline of synergy between tree, livestock and crops in cropland.
In this context, choosing the appropriate trees to include based on climatic suitability is an important step in developing integrated systems. Species distribution models (SDM) can provide an estimate of the potential distribution of the ‘climatic niche’ of tree species[17] based on knowledge of its existing distribution. SDM can be valuable to guide climate-based adaptation strategies involving habitat restoration, planning and conservation objectives[18-20]. Based on the set theory, intersection of climatic suitability of tree, crop and livestock can be determined. Fuzzy logic models could be useful in evaluating such intersection. Fuzzy logic refers to a group of methodologies applied in optimal site selection or suitability modelling using a multi-criteria overlay analysis[21]. It is a model of choice in the comparison of species distributions, management, conservation and land use planning[22-24]. In this context, the study aimed to: (i) generate suitability maps for trees and crops based on the theory of niche modelling; (ii) determine possible mixing of trees with crops and livestock using fuzzy logic concept; and (iii) identify suitable sites for appropriate agroforestry systems. We emphasize the importance of maintaining and enhancing locally developed agroforestry systems that have been shown to bolster resilience in mountain ecosystems and livelihoods.
-
For modelling purposes, we selected 20 native/naturalized tree species ethnobotanically important as fodder resources and commonly used in afforestation or in social forestry in China. A review of the literature (ESM 1) revealed that most of these species were multipurpose, fast growing and beneficial for the soil through various combinations of N-fixation, C-sequestration, soil stabilization and erosion prevention (Table 1). Many of the selected trees were already used in agroforestry systems as shelterbelts, windbreaks, or for improving crop and livestock production through alley cropping. In addition to adding fodder value for livestock, selected trees were or could be used as: edible (12), timber (12), medicinal (10), fiber (10), bioenergy feedstock (11) and industrial value (5) (Table 1).
Table 1. Characteristic of selected fodder trees, ethnobotanical notes, and agroforestry uses.
Species Growth rate Fodder value Soil improvement Potential economic uses Agroforestry Ailanthus altissima Fast High especially for goat, good for silkworm C-sequestration, soil stabilization Medicinal, timber, fuelwood Shelterbelt, potential for cultivation in heavily polluted areas and drought tolerant; known to have allelopathic effect, and therefore, proper management is necessary Amorpha fruticosa Fast High, bee forage N-fixation, Erosion control Medicinal, edible, industrial uses Shelterbelt, tolerates poor sandy soils, dry soils, limey soils, acidic soils Arundo donax Fast High C-sequestration, soil stabilization Bioenergy feedstock, medicinal, thatching Shelterbelt, windbreak, ability to grow in different soil types and climatic conditions Boehmeria clidemioides Fast High Remediate soils with heavy metals contamination Fiber, medicinal Local ethnobotanical value, planted in gullies Boehmeria nivea Fast High Prevent soil erosion Important fiber crop in China, medicinal, edible Planted in gullies Broussonetia papyrifera Fast High Increase phosphorus and nitrogen and improve soil moisture Food, paper making, bioenergy feedstock, fiber, medicinal, timber Shelterbelt and windbreak, economic fallow crop, leading to increased crop production Castanea mollissima Medium High Increase organic matter, nitrogen, phosphorus, and potassium content Edible, bioenergy feedstock, produce utilizable timber every 10 year Alley cropping, silviculture practices, good results from Castanea-tea intercropping Cyclobalanopsis glauca Medium High C-sequestration, improve soil nitrogen Fuelwood, bioenergy feedstock, timber Branch and twigs are good material for mushroom culture Debregeasia orientalis Fast High Improve metal contaminated soil Edible, high-quality fiber Local ethnobotanical value Elaeagnus angustifolia Fast Medium, good bee forage N-fixation, Erosion control or dune stabilization Edible, industrial value, bioenergy feedstock, timber Shelterbelts, windbreaks or protective plantings Ficus heteromorpha Fast Medium Stabilize soil and increase fertility of soil Medicinal, edible, paper making, pig feed Shelterbelts, windbreaks Leucaena leucocephala Fast High, good bee forage N-fixation, C-sequestration Fiber, edible, timber Very good for a maize crop, alley cropping systems Machilus gamblei Fast High, used for Muga silkworm (Antherea assamensis) in NE India N-fixation, C-sequestration Edible, fiber, medicinal, timber, potential for bioenergy feedstock Local ethnobotanical value Morus alba Fast High, good for silkworm Erosion control Edible, industrial value, bioenergy feedstock Shade and shelter, windbreak Populus adenopoda Fast High Increase in soil organic carbon, soil stabilization Timber, fiber, bioenergy feedstock Shade and shelter, windbreak Populus davidiana Fast High Increase in soil organic carbon, soil stabilization Timber, bioenergy feedstock Shade and shelter, windbreak Populus tomentosa Fast High Increase in soil organic carbon, soil stabilization Timber, fiber, bioenergy feedstock Shade and shelter, windbreak Salix babylonica Fast High, bee forage Erosion control Medicinal, fiber, light timber, bioenergy feedstock Shade and shelter, windbreak Saurauia thyrsiflora Fast High Erosion control Edible, medicinal Local ethnobotanical value, high milk production in livestock Ulmus pumila Fast High Erosion control, stabilizing sand dunes Fiber, medicinal, edible, timber Shelterbelt, windbreak, enhance crop production Source: literature listed in ESM 1 Climatic suitability of trees and crops
-
The stepwise elimination of bioclimatic variables with VIF values greater than 10 resulted in a set of ten least correlated (Pearson correlation value < 0.8) bioclimatic variables: bio2, bio3, bio8, bio13, bio14, bio15, bio21, bio22, bio25 and bio31. These variables successfully produced a distribution model for each of the selected tree species. Consensus maps showing the results from ensemble model for each fodder tree species are given in Figure 2. The models correctly predicted most of the test locations in all cases. Sub-models for all selected species weight between 0.05 and 0.29 (Table 2). The ensemble models had final AUC ranges from 0.82 to 0.98 for different species, while kappa values ranged from 0.74 to 0.97 (Table 2).
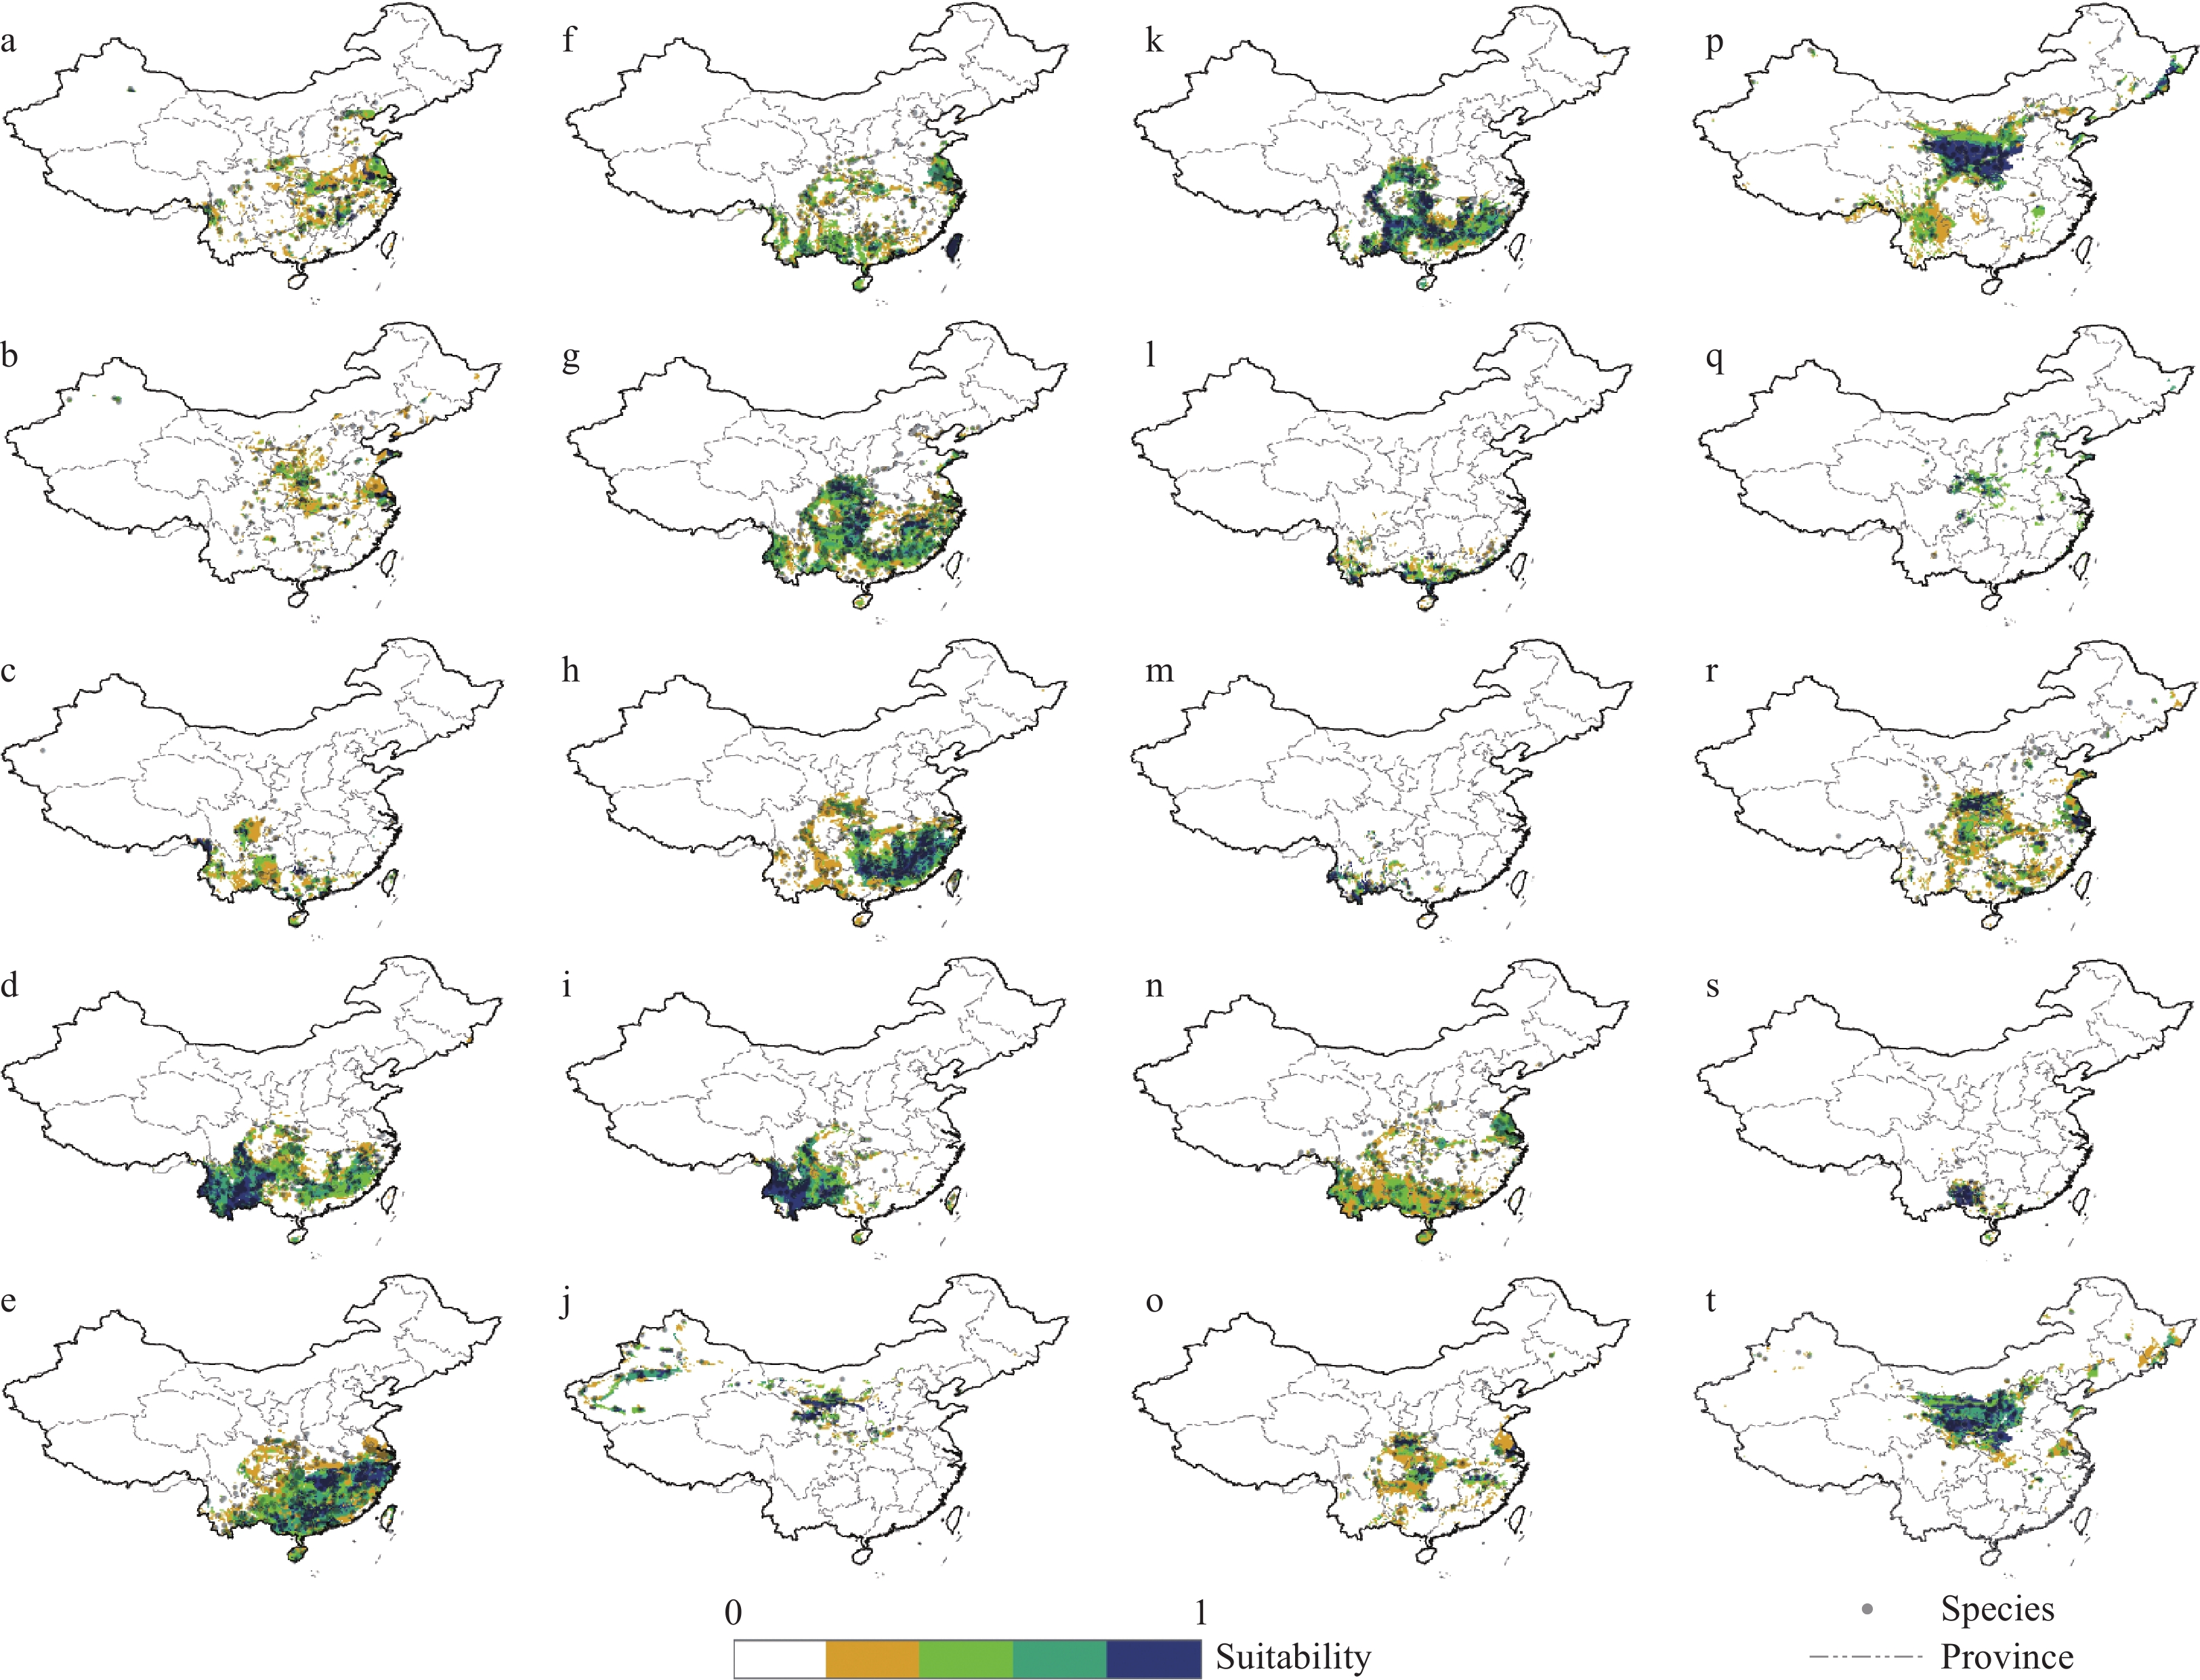
Figure 2.
Consensus mapping based on ensemble modelling. The bioclimatic suitability for each of the selected species, with the observed point distributions overlain. ‘a’ to ‘t’ are species codes for the fodder tree species as listed in Table 2.
Table 2. Final weights of each sub-models for ensemble forecasting, AUC, kappa and threshold for ensemble models
GLM MAXENT MAXLIKE RF RPART ENSEMBLE Spp code Spp Weight Weight Weight Weight Weight AUC Kappa maxTPR+TNR a Ailanthus altissima 0.22 0.24 0.22 0.23 0.09 0.84 0.81 0.59 b Amorpha fruticosa 0.25 0.26 0.22 0.26 0 0.82 0.74 0.57 c Arundo donax 0.24 0.25 0.17 0.25 0.09 0.93 0.84 0.6 d Boehmeria clidemioides 0.22 0.22 0.15 0.22 0.19 0.92 0.85 0.48 e Boehmeria nivea 0.2 0.22 0.21 0.22 0.16 0.92 0.89 0.53 f Broussonetia papyrifera 0.23 0.24 0.1 0.24 0.19 0.92 0.82 0.56 g Castanea mollissima 0.21 0.21 0.2 0.21 0.16 0.88 0.83 0.65 h Cyclobalanopsis glauca 0.2 0.21 0.2 0.21 0.18 0.92 0.86 0.51 i Debregeasia orientalis 0.19 0.21 0.21 0.21 0.18 0.95 0.94 0.46 j Elaeagnus angustifolia 0.21 0.22 0.15 0.23 0.18 0.89 0.85 0.61 k Ficus heteromorpha 0.21 0.21 0.21 0.21 0.16 0.91 0.81 0.55 l Leucaena leucocephala 0.24 0.25 0.17 0.26 0.08 0.94 0.93 0.68 m Machilus gamblei 0.21 0.24 0.23 0.23 0.08 0.97 0.97 0.75 n Morus alba 0.25 0.25 0.25 0.24 0 0.84 0.85 0.64 o Populus adenopoda 0.29 0.29 0.05 0.29 0.09 0.89 0.9 0.54 p Populus davidiana 0.22 0.22 0.21 0.23 0.12 0.85 0.89 0.44 q Populus tomentosa 0.21 0.24 0.21 0.26 0.09 0.89 0.81 0.6 r Salix babylonica 0.18 0.26 0.24 0.27 0.06 0.83 0.74 0.55 s Saurauia thyrsiflora 0.19 0.21 0.2 0.21 0.18 0.98 0.97 0.76 t Ulmus pumila 0.22 0.22 0.2 0.22 0.13 0.84 0.86 0.51 NB: sub-model with ‘0’ indicate that particular sub-model was calibrated but not used in the ensemble model. Bioclimatic suitability of 20 fodder tree species within China as estimated by the ensemble modelling is presented in Figure 2 (also listed in ESM 2). Species were classified based on the area of bioclimatic suitability and magnitude of suitability. Suitability of fodder trees was well represented across each of the seven crop growing areas (Fig. 2 and Fig. 3) in China. More fodder species found bioclimatic suitability in areas where grain crops, crop/pasture rotations, agro-silvopastoral systems and ponds systems dominated. Few of the selected fodder tree species showed bioclimatic suitability in areas dominated by rangeland systems.
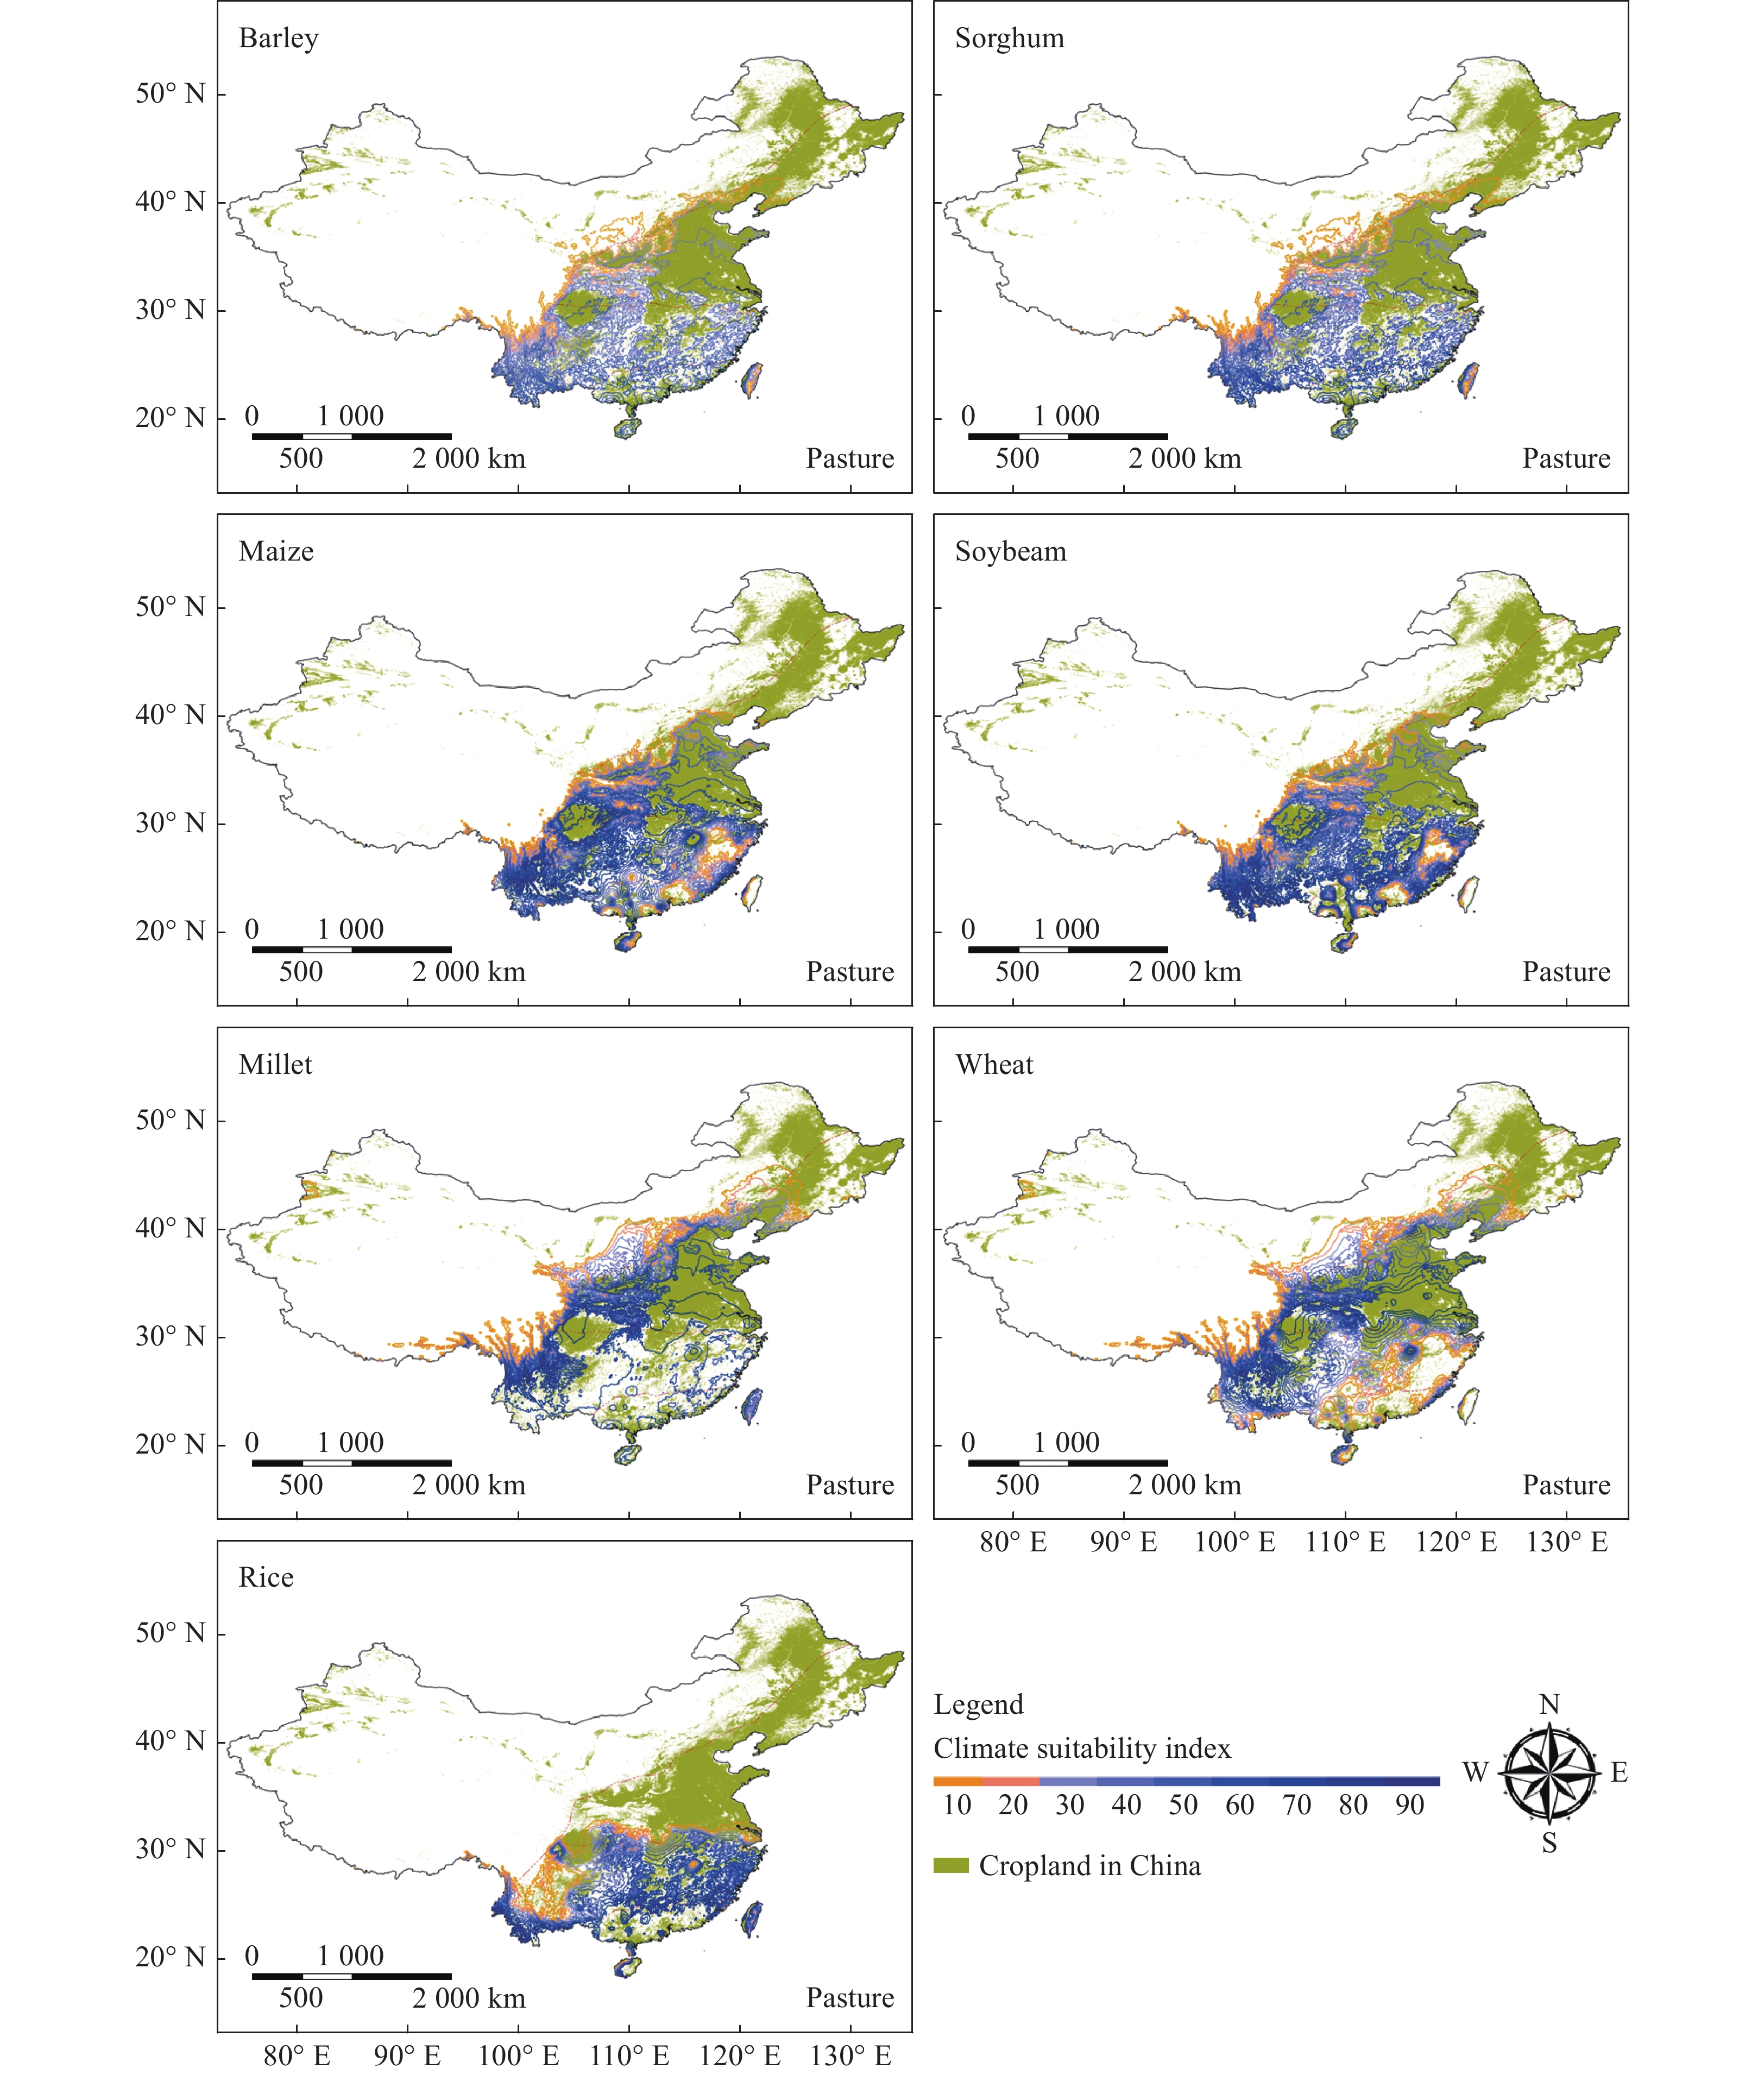
Figure 3.
Climatic suitability index of important crops in China; Millet include both pearl and foxtail millet.
The climate suitability index of selected crops was found to be relatively low for northern and western China where low yield was reported. Higher climate suitability index was found for all the crops in southern and eastern parts of China comprised of mostly overlapping farmlands and adjoining areas (Fig. 3).
Integration possibilities
-
The fuzzy logic model output identified areas where fodder trees could be integrated with livestock and crops. According to the model, rice-based integration could be suitable in the southern, southeast and eastern parts of China. Maize, soybean and sorghum could be integrated in the southern, eastern and central parts, whereas millet, wheat and sorghum could be integrated in central and northern parts. Distinct spatial data were available for different livestock species, whereas such data were lacking for individual crops, meaning that crops could not be treated individually like livestock and fodder tree species. The potential distribution of each fodder tree was overlain with the distributions of different livestock species and crops to produce fuzzy maps (Fig. 4; for individual livestock detail maps documented in ESM 3). The range of the fuzzy maps lies between ‘0’ and ‘1’. When membership function values of all the three layers were 0 (minimum), the suitability for integration was minimum, and when the membership function values were 1 (maximum) the possibility for integration was at its greatest. Our model revealed that most of the fodder tree species were suitable for integration toward the eastern and southern parts of China. Few species found agro-ecological suitability in northern China, and few species could be incorporated into integrated systems in western China (Fig. 4). The most suitable areas fell in the humid and sub-humid regions, with few options for integration in the more arid regions.
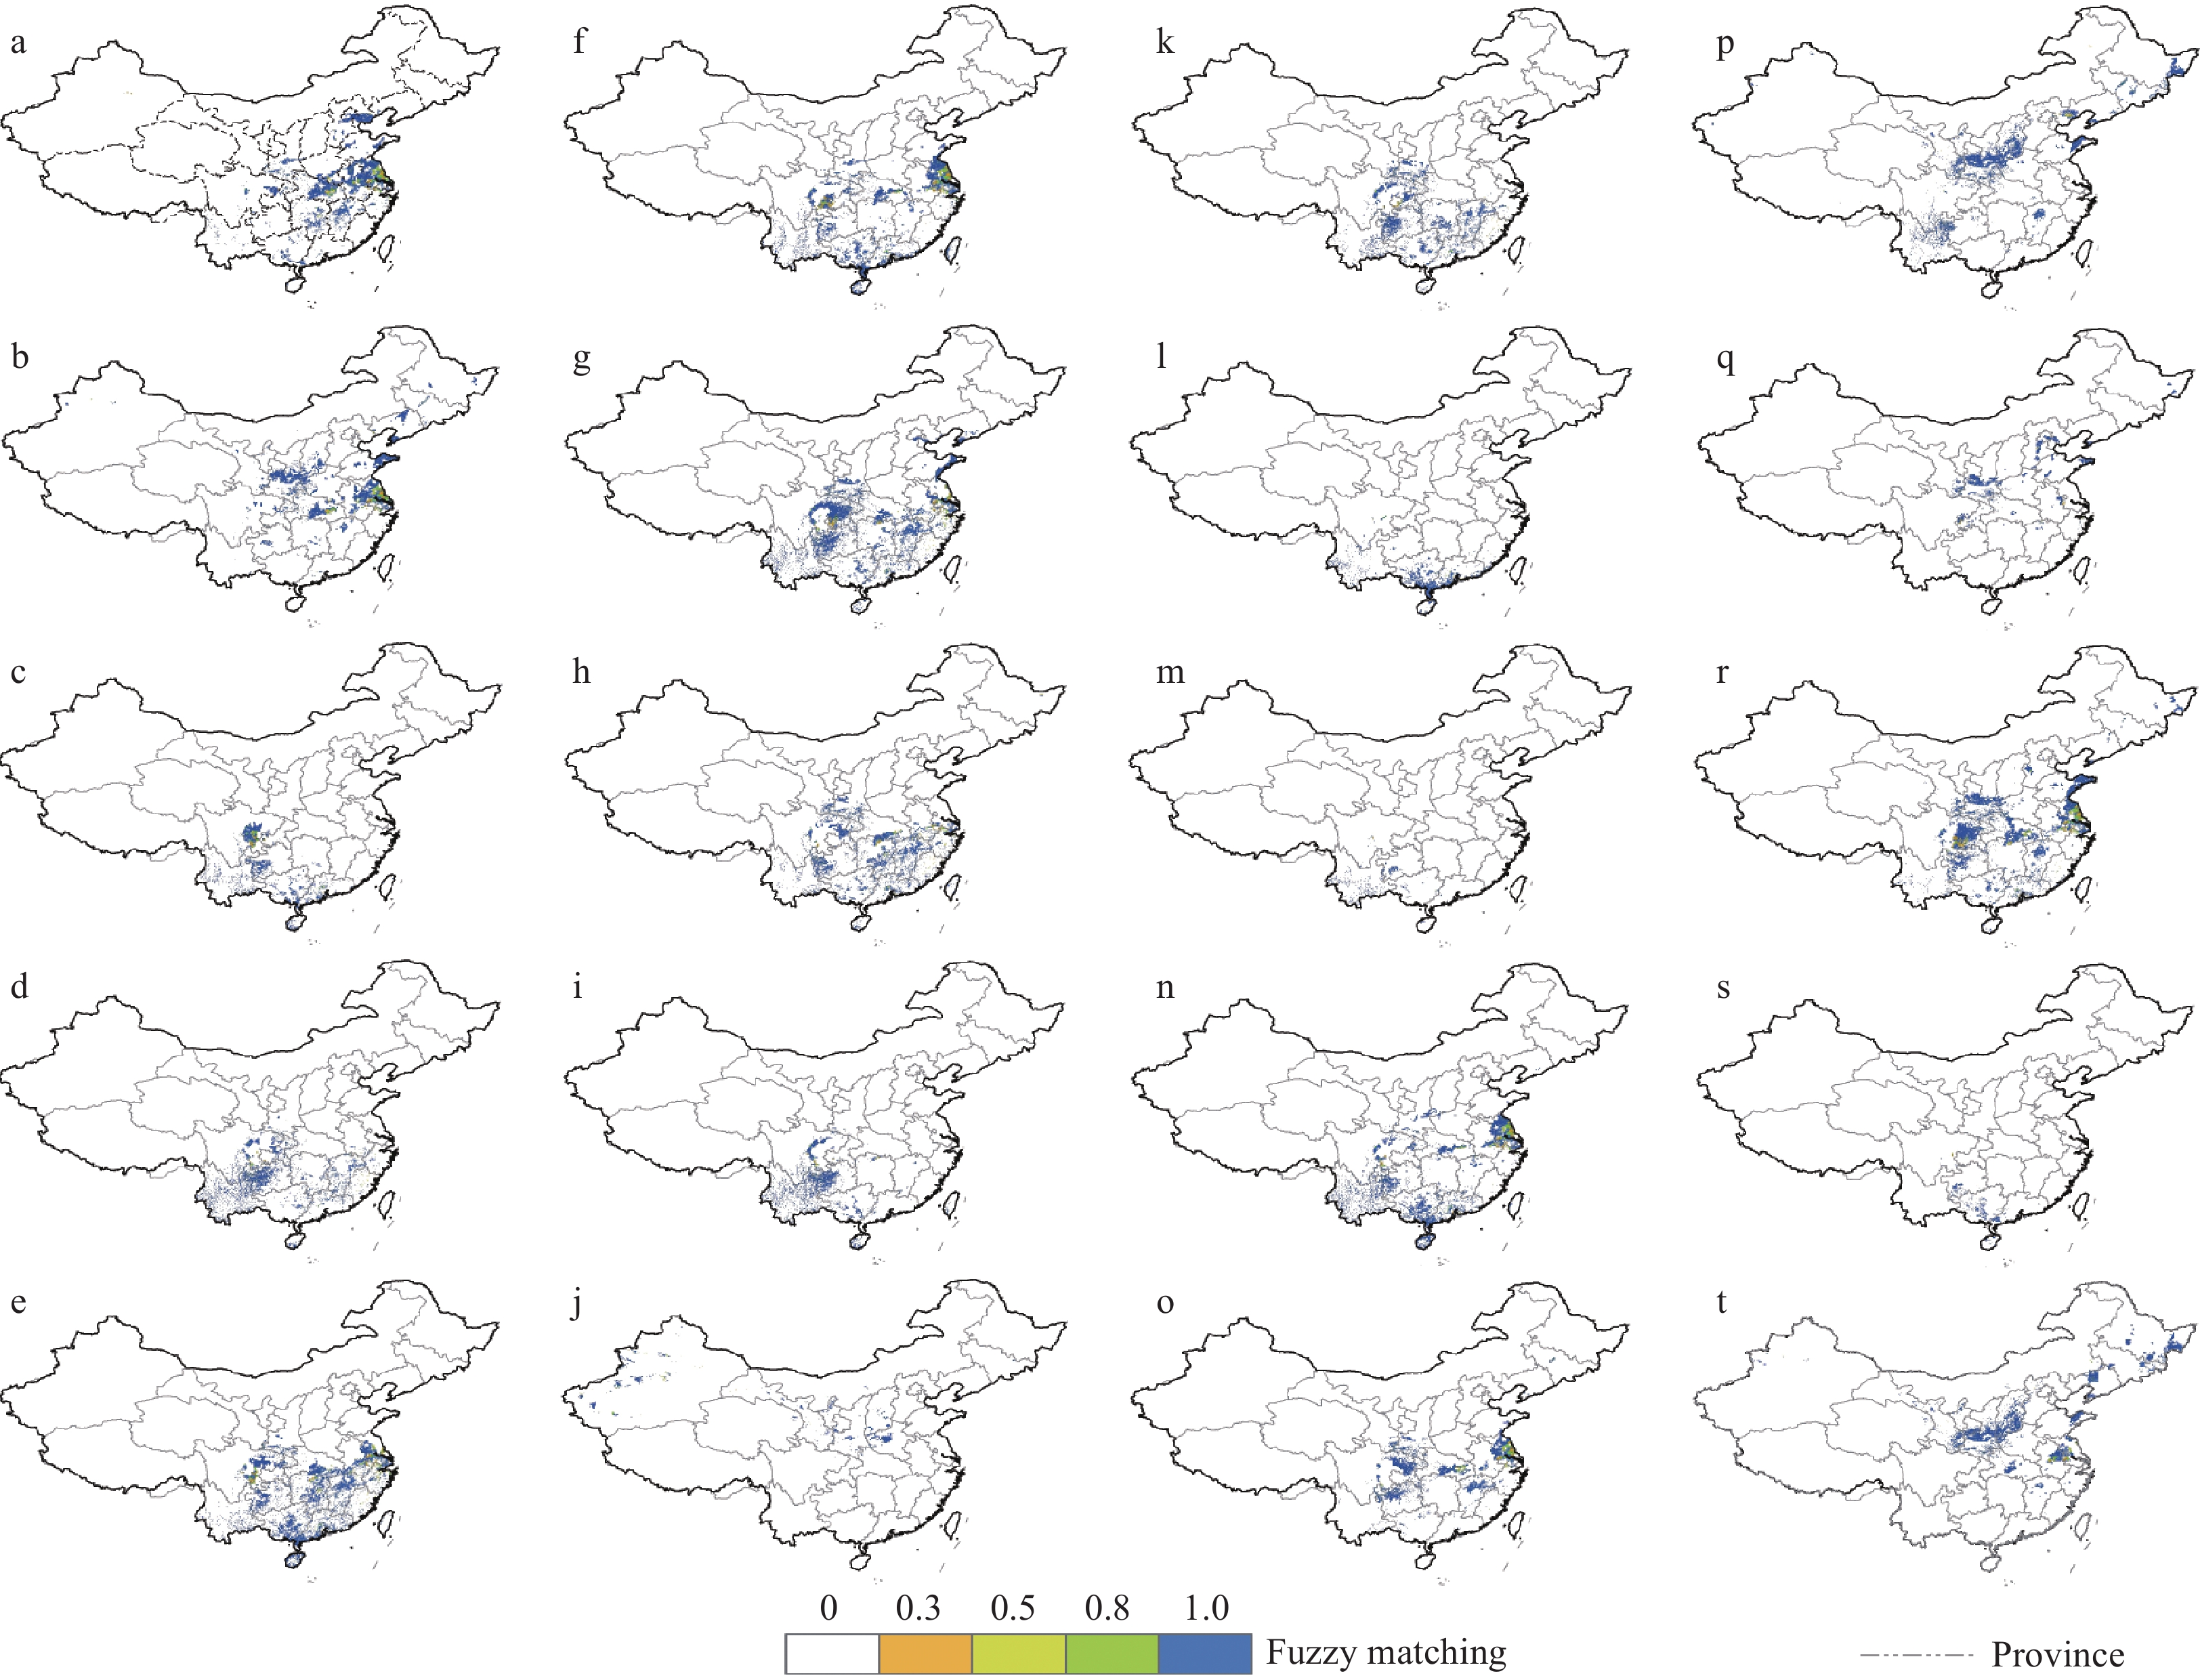
Figure 4.
Major areas suitable for integration of selected fodder trees with crops and livestock. ‘a’ to ‘t’ are species codes for the fodder species as listed in Table 2.
-
We presented a comprehensive analysis of climatically suibtable areas where a system could be adopted that potentially integrates fodder trees with crop and livestock. This is a pioneering work aimed at planning theintegration of trees with crops and livestock. The integration of trees, crops and livestock is potentially beneficial for yield and ecosystem, services such as mitigating climate change and reducing land degradation[11,12]. However, it is challenging to select trees that are both appropriate for the climate and capable of delivering benefits to farmers on agricultural lands[25,26]. Farmer’s decision to adopt tree on the agricultural land mostly based on the economic benefit and immediate return[26]. Providing farmers with the option of climatically suitable trees that have multiple benefits including economic benefits is thus extremely important, and it is essential to identify the right trees and locations that are best suited for implementation[4]. This study has identified suitable places for the integration of specific fodder trees with crops and livestock. Selecting appropriate tree species for agroforestry practices largely depends upon understanding the environmental requirements of the species under question and matching those to the prevailing conditions in a given area[25]. Evans et al.[27] reported SDMs as a promising and useful method for modeling biofuel feedstocks and other cultivated crops. Our model was successful in defining the bioclimatic boundaries for the 20 fodder tree species. Fuzzy logic has been applied for geographical modelling; however, recent research applied this method to assess climate suitability of crops (e.g. Kim et al. [28]). It also provides a variety of options for combining variables[29], which we used in intersecting tree suitability with crop and livestock distribution.
Rudel et al.[15], in their global meta-analysis, showed a strong association between mixed crop-livestock operations and sustainable practices. The integration of fodder trees into mixed systems provides greater diversification in the farming landscape that might decrease the threat of crop failures due to climate change and increased climate variability and increase resilience to economic shocks[30,31]. When the price of inputs or outputs changes to make one commodity no longer profitable, a diversity of products can help farmers to overcome difficult economic times[16]. Research shows the economic performance of mixed farming systems is better than that of specialized farming systems in the Netherlands[32]. A similar case from Belgium was observed during a crisis of milk prices; the farmers of mixed systems fared much better than producers who had specialized only in milk production. In a linear bio-economy excreta from the intensive animal, production becomes a form of waste, polluting soil and water as well as emitting GHGs[33,34]. An integrated system, conversely, promotes a circular bio-economy in which crops and livestock interact through recycling. For example, manure is returned to the land to fertilize crops, and livestock are fed on crop residues, allowing the maximum use of available resources. On-farm GHG emissions can be reduced through the development of an integrated system that changes land-use patterns and improves farm management practices[34]. Hence, integrated systems that involve trees, crops and livestock can be more environmentally sustainable than specialized systems or simple mixed crop-livestock system[35].
Similarly, ecological interactions between trees, crops and livestock can provide a wide range of services, including soil and water management, microclimate modification, weed control, natural fencing, carbon sequestration and nutrient cycling[36,37]. Such an integrated system has manifold benefits and, through centuries of experience, has proven to be sustainable in many Asian communities[38]. These systems intensify agrobiodiversity, which is valuable for food security, health and income[39]. Because of the high agro-biodiversity, nutritional supplements and waste recycling in integrated farming, resilience to climatic extremes is higher[15]. In addition to regular and seasonal feed source, fodder trees can provide shade to livestock, which is important for mitigating heat stress, which can potentially cause problems in reproduction and reduce milk production in cattles[13]. Most of the tree species selected for modelling in our study are useful in atmospheric nitrogen fixation, carbon sequestration, improving soil through phosphorus and potassium, stabilizing soil and reducing soil erosion. Ideal fodder tree species should meet fodder deficiencies in times of extreme climatic conditions, such as droughts. They must be fast growing, require little land, labor or capital, produce numerous by-products and, ideally, supply feed within a year after planting[40]. Most of the selected species are fast-growing and all of them are ethnobotanically important fodder trees. A review of the literature (listed in ESM 1) shows them to be valuable fodder resources, economic values (e.g. timber, medicinal) and have high agroforestry potential. Several examples of successful agroforestry using the selected species are available. For instance, Broussonetia papyrifera is successfully grown with rice in Laos[41] and Leucaena leucocephala is grown as a hedge tree with maize or millet in middle hills of Nepal[42]. Similarly, the majority of farmers grow trees species of Morus, Leucaena, Ficus, Cyclobalanopsis with cereal crops (maize, wheat, millet), lentils and vegetable as an agroforestry practice in Nepal[42]. Research show Castanea mollissima intercropping in tea plantations improves resource availability, ecosystem function and product quantity and quality[43]. Poplar (Populus spp.) based agroforestry is popular in different parts of Asia, including China[44]. In addition, most of them are important for timber, bioenergy feedstock, edible products and have medicinal purposes. There are also possibilities for marketing fodder tree biomass and its use in commercial feeds[40]. Beside fodder value, species like Arundo donax, Broussonetia papyrifera, Castanea mollissima, Cyclobalanopsis glauca, Machilus gamblei and Morus alba have potential value as bioenergy feedstocks[45,46]. The next step is to investigate specifically what these different species may contribute to existing farming systems in the area and conduct trials to quantify benefits.
Despite the many benefits, trade-offs between different options need to be considered carefully as strategies and policies are developed. One possible trade-off includes a reduced crop yields per unit of land area used during the tree establishment and development phase of integrated farms[47]. Integrating trees in farmland is held back because of a lack of reliable tools to accurately predict yields from tree-crop mixtures[48]. These fully integrated systems are highly labor-intensive during the startup phase and are not well suited to mechanization. There are several examples that indicate proper management of trees in integrated systems can maximize landuse, ecosystem services as well as production[49]. For example, when the paper mulberry is managed properly (lopping and trimming), rice yields maintain the same levels as before intercropping was introduced[41]. The findings from other places indicate that in addition to ecological services, selected trees could provide off-farm income and opportunities to bolster income. However, conducting trials and systematic data collection of integrated systems would allow closer examination of the socio-economic and ecological factors as well as ecosystem services.
Implementation
-
Results from our work provide an initial step in the planning and implementation of tree-crop-livestock systems, which can bring many environmental benefits to more specialized production practices[50,51]. A logical next step is the investigation of these results through appropriate field implementation. The results presented here provide landscape-level indications of where it is expected that particular tree fodder species will thrive in integrated tree-crop-livestock systems. As an example, we have listed the candidate species for tree-livestock-crop system integration in Honghe County of Yunnan Province, where the authors are currently implementing agroforestry projects. The results indicate that 13 of the 20 species analyzed could be integrated into various sites of Southeast or Northwest Honghe. These species include Ailanthus altissima, Arundo donax, Boehmeria clidemioides, Boehmeria nivea, Broussonetia papyrifera, Castanea mollissima, Cyclobalanopsis glauca, Debregeasia orientalis, Ficus heteromorpha, Leucaena leucocephala, Machilus gamblei, Morus alba and Populus davidiana.
-
We considered the whole of China for the modelling work. Agriculture is a vital sector in China, providing livelihoods to several hundred million people. Rice, corn, wheat, sorghum and soybeans are among the major crop produced in China. Mixed crop-livestock production systems are commonly practiced, and five broad production systems are recognized[8]. These systems are separated based on agro-ecology, dividing the country into rangeland, grain crops, crop/pasture rotations, agro-silvopastoral systems and pond systems, overlain with the seven important crops mentioned above (Fig. 5).
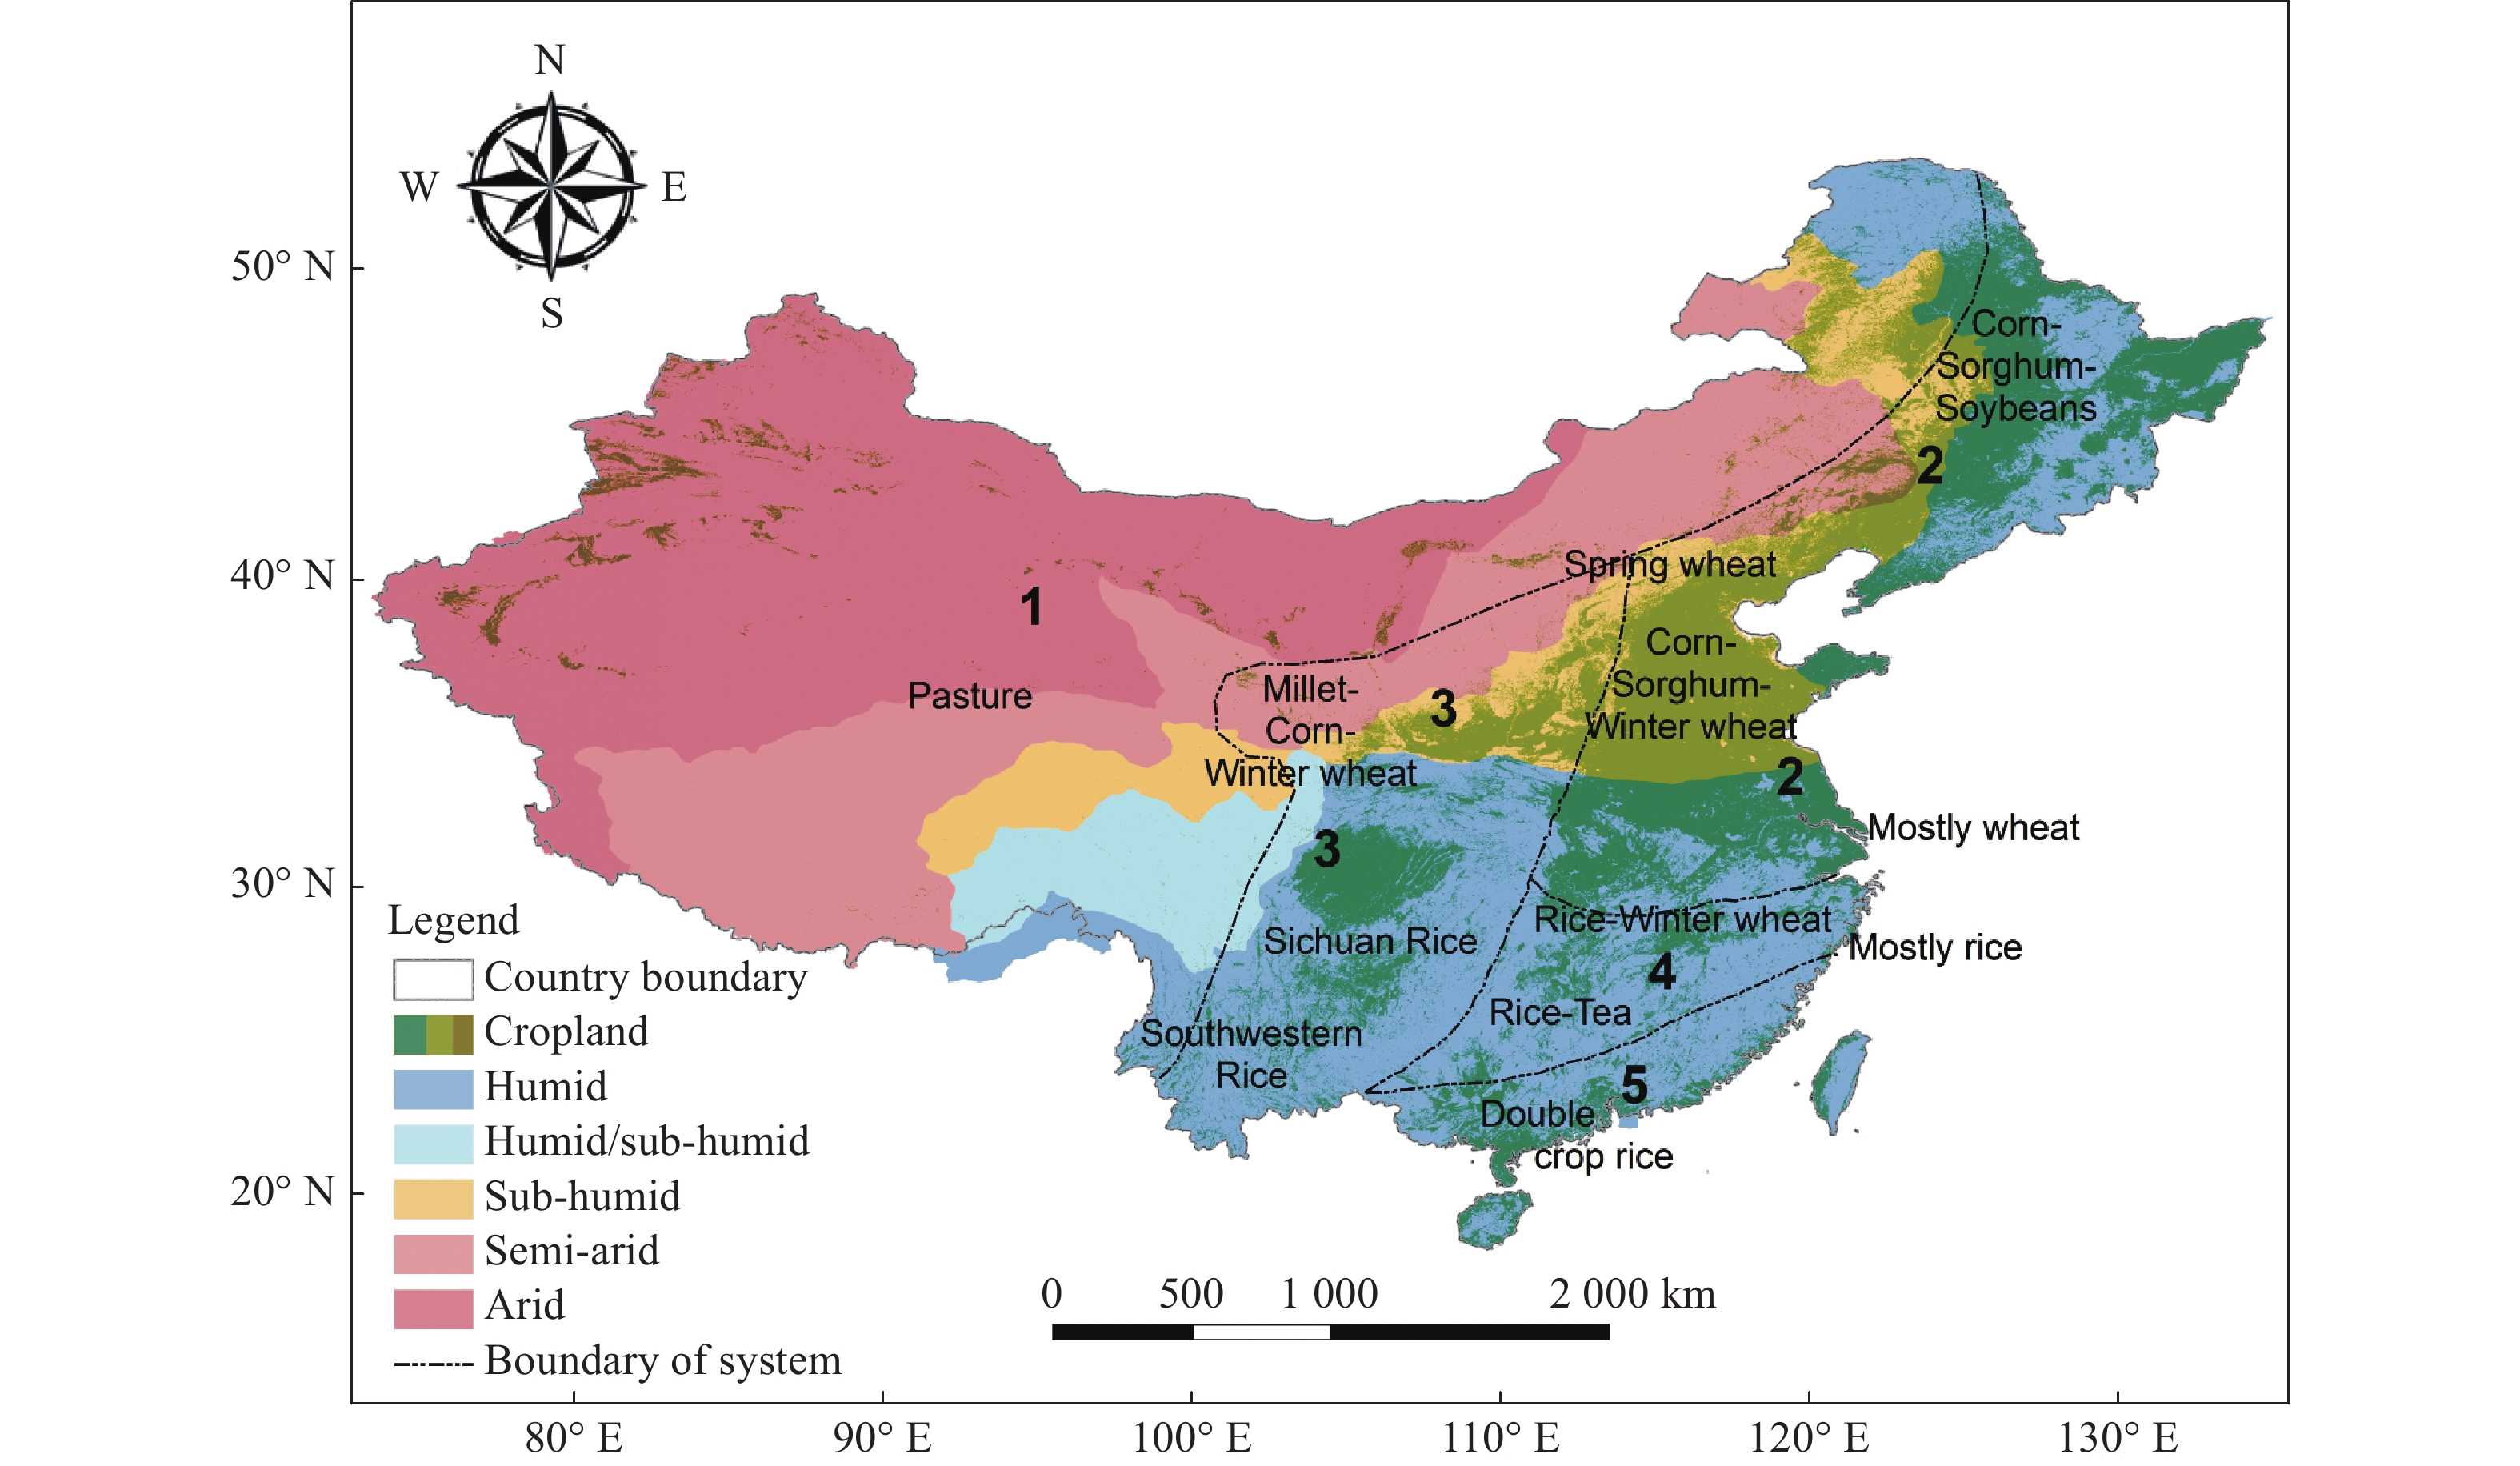
Figure 5.
Map of eco-regions, cropland and the crop-livestock production systems in China: 1. systems based on rangeland; 2. systems based on grain crops; 3. systems based on crop/pasture rotations; 4. agro-silvopastoral systems; and 5. systems based on ponds (adapted from Hou et al.[8] and Broxton et al.[52])
Data
-
In this paper, we included 20 tree species. These were selected based on (i) existing plantation practice and farmers' preferences; (ii) well-perceived potential of the species to address economic and ecological benefits (e.g., livelihood source, soil fertility, shade tree and combinations thereof); and (iii) availability of ground data from various ethnobotanical and agroforestry projects in which the authors were involved as well as a review of the relevant literature (e.g., Fang et al.[53]). The twenty fodder tree species were represented by a total 3,016 geo-coordinated points which were consigned to a 2 km grid for the analysis. Cropland data were extracted using the Land Use Land Cover (LULC) 2010 map of China. Crops (Table 3) were modelled based on temperature and precipitation relations. Livestock data were obtained from Robinson et al.[54] and confirmed with annual statistical information from the Chinese government. Livestock used in this study includes cattle, buffaloes, goats and sheep. We used bio-climatic variables downloaded from the CliMond archive[55] as inputs for the modelling of the 20 fodder tree species. Detailed information on these bio-climatic variables, comprising variables of temperature, precipitation, radiation and moisture indexes are listed in ESM 4.
Table 3. Optimum and absolute range of temperature and precipitation for selected crops.
Absolute Optimum Crop Tmax Tmin Pmax Pmin Tmax Tmin Pmax Pmin Oryza sativa Rice 36 10 4 000 1 000 30 20 2 000 1 500 Sorghum bicolor Sorghum 40 8 3 000 300 35 27 1 000 500 Zea mays Maize 47 10 1 800 400 33 18 1 200 600 Hordeum vulgare Barley 40 2 2 000 200 20 15 1 000 500 Pennisetum glaucum Pearl millet 40 12 1 700 200 35 25 900 400 Setaria italica Foxtail millet 35 5 4 000 300 26 16 700 500 Glycine max Soybean 38 10 1 800 450 33 20 1 500 600 Triticum aestivum Wheat 27 5 1 600 300 23 15 900 750 Tmax − Maximum temperature, Tmin − Minimum temperature in °C; Pmax − Maximum precipitation, Pmin − Minimum precipitation in mm Tree and crop distribution modelling
-
BiodiversityR package (Ver. 2.8−2) and dismo package in R were used to prepare bioclimatic suitability maps for the 20 fodder trees, important crops and other analysis. Five different algorithms − Maxent, Maxlike, Random Forests (RF), Generalized Linear Models (GLM) and Recursive Partitioning and Regression Trees (RPart) − were used in the tree modelling. Following Hijmans[56], we used 4-fold cross-validation, where tree occurrence and background data were partitioned into 75% calibration and 25% evaluation observations. The consensus mapping technique is based on an ensemble of several niche-modeling algorithms (sub-models). The results using each model were treated as individual sub-models (Pmod), with weights assigned based on their performance. An ensemble model (Pensemble) was then calculated using the following formula[57,58]:
$ {P}_{ensemble}=\frac{\sum ({w}_{mod}{P}_{mod})}{\sum \left({w}_{mod}\right)} $ (1) where, wmod = weighted averages of sub-models (Pmod).
Bioclimatic variables were selectively removed based on variance inflation factor (VIF)[59] calculations where VIF > 10 were eliminated (ESM 5) to provide a minimum set of the least correlated bioclimatic variables.
An EcoCrop model was used to identify areas suitable for selected seven important crops in China. The EcoCrop is a simple mechanistic model that use expert-based temperature and rainfall ranges[60]. The FAO-EcoCrop database (
http://ecocrop.fao.org/ ) provided such ranges for crops and hence used in this work to determine the climatic niche of crops in China and then produces a suitability score. The model needs absolute range (at which the crop can grow) and the optimum range (at which the crop grows best) of temperature and precipitation. Table 3 presents range of absolute and optimum temperature and precipitation for selected crops. The model determines suitability index based on the conditions over the growing season at a particular place using a gridded data of temperature and rainfall. The suitability index ranges from zero (not suitable) to 100 (highly suitable). The model performs two different calculations separately, one for rainfall and the other for temperatures, and then calculates the interaction by multiplying them.Model evaluation
-
We evaluated the ability of sub-models to cope with spatial autocorrelation by calculating calibrated Area Under the Receiver Operator Curve (cAUC) values and comparing these with a geographical null mode[59]. Spatial sorting bias[56] was removed and carried out through several rounds of calibration and evaluation of all models (including the geographical null model), each time using three partitions for model calibration and one partition for model evaluation. Elimination of spatial sorting bias in testing data in model calibrations produced cAUC values of the different algorithms between 0.6 to 0.85 for different tree species. These values were significantly different from the null model (0.49 and 0.501 for the null model, which is equivalent to a random draw[56]; Mann-Whitney tests, p < 0.05 in all cases). Weights calculated for the sub-models were used to determine the appropriate weights (ranging between 0 and 1) for the ensemble model.
Kappa and AUC values were calculated for each of the ensemble models. The ensemble output consists of a consensus map that represents the agreement between sub-models. All pixels in the consensus map output were classified according to the cut-off point, based on a threshold defined by maximizing the sum of the true presence and true absence rates (maxTPR+TNR). A score above this threshold represents the suitable climatic space for the species in question[57]. All pixels with suitability scores above the cut-off point were included in the final bioclimatic suitability map for each species.
Predicting potential zones for mixed plantations
-
A fuzzy logic model was employed to identify areas suitable for tree-crop-livestock integration. Classified raster layers of fodder tree and crop distributions were overlain with raster layers of ruminant livestock and cropland in China (Fig. 5). Fuzzy overlay analysis is based on set theory in which a set generally corresponds to a class. Fuzzy overlay analysis reclassifies or transforms data values to a common scale, but the transformed values represent the probability of belonging to a specified class. Fuzzy logic system can facilitate complex approaches, such as the incorporation of biotic interaction in the modelling[28]. The combining step in fuzzy overlay analysis quantifies each location’s probability of belonging to specified sets from various input rasters[24,29]. The equation using fuzzy Gaussian function is:
$ \mu \left(x\right)={e}^{-{f}_{1}×{\left(x-{f}_{2}\right)}^{2}} $ (2) where, the inputs to the equation f1 and f2 are the spread and the midpoint, respectively. The midpoint is a user-defined value with a fuzzy membership of 1. The default is the midpoint of the range of values of the input raster. Spread defines the membership of the Gaussian function. It generally ranges from 0.01 to 1. Increasing the spread causes the fuzzy membership curve steeper. Fuzzy overlay analysis quantifies the possibilities of each cell or location to a specified set based on membership value[29].
The research was financially supported by key research project “Agroforestry Systems for restoration and bio-industry technology development (grant no: 2017YFC0505101)”, by the Agriculture Science and Technology Innovation Program (ASTIP-IAS07; CAAS-XTCX2016011-01), Research Program of the State Key Laboratory of Animal Nutrition (2004DA125184G1103), Bureau of International Cooperation Chinese Academy of Sciences (151853KYSB20160032) and CGIAR Research Program on Climate Change (FTA-FP5). We acknowledge support from Key Laboratory of Economic Plants and Biotechnology Kunming Institute of Botany, Chinese Academy of Sciences Kunming China and Prof. Yuhua Wang for providing information and data on fodder trees.
-
The authors declare that they have no conflict of interest.
- ESM 1 List of literature cited to understand the characteristic of selected fodder trees mentioned in Table 1.
- ESM 2 Presence absence map generated based on a threshold (see Table 2) defined by maximizing the sum of the true presence and true absence rates (maxTPR+TNR) for 20 fodder tree species as estimated by the ensemble modelling. ‘A’ to ‘T’ are tree species codes for the fodder tree species as listed in Table 2.
- ESM 3 Fuzzy map produced for different livestock to show suitable regions for integration with tree potential distribution and cropland. ‘A’ to ‘T’ are tree species codes for the fodder tree species as listed in Table 2.
- ESM 4 Description of Bioclim variables and the contributing variables used in their calculation.
- ESM 5 Results of VIF analysis for selection of least correlate bioclimatic variables.
- Copyright: © 2021 by the author(s). Published by Maximum Academic Press, Fayetteville, GA. This article is an open access article distributed under Creative Commons Attribution License (CC BY 4.0), visit https://creativecommons.org/licenses/by/4.0/.
-
About this article
Cite this article
Ranjitkar S, Bu D, Sujakhu NM, Marius G, Robinson TP, et al. 2021. Mapping tree species distribution in support of China's integrated tree-livestock-crop system. Circular Agricultural Systems 1: 2 doi: 10.48130/CAS-2021-0002 

Mapping tree species distribution in support of China's integrated tree-livestock-crop system
- Received: 24 November 2020
- Accepted: 04 January 2021
- Published online: 01 March 2021
Abstract: The primary challenge of the contemporary world is to meet accelerating requirements for food. Limited land, competition between crop and livestock farming and climate change are major challenges. Agroforestry offer a form of sustainable agriculture through the direct provision of food by raising farmers’ incomes and through various ecosystem services. The first essential step in adopting agroforestry is the selection of appropriate tree species that fit local climates. In this paper, we mapped 20 fodder trees and important crops in China using the multi-model ensemble and Ecocrop modelling approach. Relying on the intersectional concept of set theory, the fuzzy logic technique was applied to identify regions where candidate trees could be grown with appropriate crops and livestock. The resulting models provide important insights into the climatic suitability of trees and crops and offer knowledge critical to the proper integration of trees with crops and livestock at specific locations. The results offer support for developing appropriate strategies regarding potential land-use within agroforestry systems in order to maximize ecosystem services and the benefits of sustainable agriculture. Model outputs could easily convert into conventional maps with clearly defined boundaries for site-specific planning for tree-crop-livestock integration. The next step for actualizing an integrated system is to investigate specifically what these different species may contribute to the existing farming systems, quantify the benefits and estimate any possible trade-offs.
-
Key words:
- fodder tree /
- agroforestry /
- fuzzy logic /
- livestock /
- mixed system