ARTICLE   Open Access    

Essential aroma substances and release pattern of Xinhui Chenpi

More Information
  • This study focuses on analyzing aqueous solutions of aroma-active compounds in Xinhui Chenpi distilled after being heated with headspace solid-phase microextraction and gas chromatography-mass spectrometry (HS-SPME-GC/MS). Feasibility of this method was also tested by comparison with crushed samples. The study also analyzed the aqueous solutions of the aroma-active compounds employing gas chromatography-olfactometry (GC-O) defense, aroma extraction dilution analysis (AEDA) and odor activity value (OAV) as well as their emission patterns. According to the study, there are 24 major aroma-active detected in the aqueous solution. Linalool, d-limonene, 2-methoxy-4-vinylphenol, and α-terpineol with sweet, spicy, and woody aroma contributed the most to the aroma-active compounds and were considered to be the essential aroma substances of Chenpi. When heated, the aroma of aromatic-active compounds rich in Chenpi volatilized rapidly and the release dropped dramatically in a short time. The substantial aroma-active compounds can be collected from the first ten released segments.
  • The Fabaceae family, the third largest family in angiosperms, contains about 24,480 species (WFO, https://wfoplantlist.org), and has been a historically important source of food crops[14]. Peas (formerly Pisum sativa L. renamed to Lathyrus oleraceusPisum spp. will be used hereafter due to historical references to varietal names and subspecies that may not have been fully synonymized), are a member of the Fabaceae family and is among one of the oldest domesticated food crops with ongoing importance in feeding humans and stock. Peas originated in Western Asia and the Mediterranean basin where early finds from Egypt have been dated to ~4500 BCE and further east in Afghanistan from ~2000 BCE[5], and have since been extensively cultivated worldwide[6,7]. Given that peas are rich in protein, dietary fiber, vitamins, and minerals, have become an important part of people's diets globally[810].

    Domesticated peas are the result of long-term human selection and cultivation, and in comparison to wild peas, domesticated peas have undergone significant changes in morphology, growth habits, and yield[1113]. From the long period of domestication starting in and around Mesopotamia many diverse lineages of peas have been cultivated and translocated to other parts of the world[14,15]. The subspecies, Pisum sativum subsp. sativum is the lineage from which most cultivars have been selected and is known for possessing large, round, or oval-shaped seeds[16,17]. In contrast, the subspecies, P. sativum subsp. elatius, is a cultivated pea which more closely resembles wild peas and is mainly found in grasslands and desert areas in Europe, Western Asia, and North Africa. Pisum fulvum is native to the Mediterranean basin and the Balkan Peninsula[15,18], and is resistant to pea rust caused by the fungal pathogen Uromyces pisi. Due to its resistance to pea rust, P. fulvum has been cross-bred with cultivated peas in the development of disease-resistant strains[19]. These examples demonstrate the diverse history of the domesticated pea and why further study of the pea pan-plastome could be employed for crop improvement. While studies based on the nuclear genome have been used to explore the domestication history of pea, these approaches do not account for certain factors, such as maternal inheritance. Maternal lineages, which are inherited through plastomes, play a critical role in understanding the full domestication process. A pan-plastome-based approach will no doubt allow us to investigate the maternal genetic contributions and explore evolutionary patterns that nuclear genome studies may overlook. Besides, pan-plastome analysis enables researchers to systematically compare plastome diversity across wild and cultivated species, identifying specific regions of the plastome that contribute to desirable traits. These plastid traits can then be transferred to cultivated crops through introgression breeding or genetic engineering, leading to varieties with improved resistance to disease, environmental stress, and enhanced agricultural performance.

    Plastids are organelles present in plant cells and are the sites in which several vital biological processes take place, such as photosynthesis in chloroplasts[2024]. Because the origin of plastids is the result of an ancient endosymbiotic event, extant plastids retain a genome (albeit much reduced) from the free-living ancestor[25]. With the advancement of high-throughput DNA sequencing technology, over 13,000 plastid genomes or plastomes have been published in public databases by the autumn of 2023[24]. Large-scale comparison of plastomic data at multiple taxonomic levels has shown that plastomic data can provide valuable insights into evolution, interspecies relationships, and population genetic structure. The plastome, in most cases, displays a conserved quadripartite circular genomic architecture with two inverted repeat (IR) regions and two single copy (SC) regions, referred to as the large single-copy (LSC) and small single-copy (SSC) regions. However, some species have lost one copy of the inverted repeated regions, such as those in Erodium (Geraniaceae family)[26,27] and Medicago (Fabaceae)[28,29]. Compared to previous plastomic studies based on a limited number of plastomes, the construction of pan-plastomes attempts to describe all nucleotide variants present in a lineage through intensive sampling and comparisons. Such datasets can provide detailed insights into the maternal history of a species and help to better understand applied aspects such as domestication history or asymmetries in maternal inheritance, which can help guide future breeding programs. Such pan-plastomes have recently been constructed for several agriculturally important species. A recent study focuses on the genus Gossypium[20], using plastome data at the population level to construct a robust map of plastome variation. It explored plastome diversity and population structure relationships within the genus while uncovering genetic variations and potential molecular marker loci in the plastome. Besides, 65 samples were combined to build the pan-plastome of Hemerocallis citrina[30] , and 322 samples for the Prunus mume pan-plastome[31]. Before these recent efforts, similar pan-plastomes were also completed for Beta vulgaris[32], and Nelumbo nucifera[33]. However, despite the agricultural importance of peas, no such pan-plastome has been completed.

    In this study, 103 complete pea plastomes were assembled and combined another 42 published plastomes to construct the pan-plastome. Using these data, the following analyses were conducted to better understand the evolution and domestication history of pea: (1) genome structural comparisons, (2) codon usage bias, (3) simple sequence repeat patterns, (4) phylogenetic analysis, and (5) nucleotide variation of plastomes in peas.

    One hundred and three complete pea plastomes were de novo assembled from public whole-genome sequencing data[34]. For data quality control, FastQC v0.11.5 (www.bioinformatics.babraham.ac.uk/projects/fastqc/) was utilized to assess the quality of the reads and ensure that the data was suitable for assembly. The clean reads were then mapped to a published pea plastome (MW308610) plastome from the GenBank database (www.ncbi.nlm.nih.gov/genbank) as the reference using BWA v0.7.17[35] and SAMtools v1.9[36] to isolate plastome-specific reads from the resequencing data. Finally, these plastome-specific reads were assembled de novo using SPAdes v3.15.2[37]. The genome annotation was conducted by Geseq online program (https://chlorobox.mpimp-golm.mpg.de/geseq.html). Finally, the OGDRAW v1.3.1[38] program was utilized to visualize the circular plastome maps with default settings. To better resolve the pan-plastome for peas, 42 complete published pea plastomes were also downloaded from NCBI and combined them with the de novo data (Supplementary Table S1).

    To investigate the codon usage in the pan-plastome of pea, we utilized CodonW v.1.4.2 (http://codonw.sourceforge.net) to calculate the Relative Synonymous Codon Usage (RSCU) value of the protein-coding genes (PCGs) longer than 300 bp, excluding stop codons. The RSCU is a calculated metric used to evaluate the relative frequency of usage among synonymous codons encoding the same amino acid. An RSCU value above 1 suggests that the codon is utilized more frequently than the average for a synonymous codon. Conversely, a value below 1 indicates a lower-than-average usage frequency. Besides, the Effective Number of Codons (ENC) and the G + C content at the third position of synonymous codons (GC3s) were also calculated in CodonW v.1.4.2. The ENC value and GC3s value were utilized for generating the ENC-GC3s plot, with the expected ENC values (standard curve), are calculated according to formula: ENC = 2 + GC3s + 29 / [GC3s2 + (1 – GC3s)2][39].

    The MISA program[40] was utilized to detect simple sequence repeats (SSRs), setting the minimum threshold for repeat units at 10 for mono-motifs, 6 for di-motifs, and 5 for tri-, tetra-, penta-, and hexa-motif microsatellites, respectively.

    The 145 complete pea plastomes were aligned using MAFFT v 7.487[41]. Single nucleotide variants (SNVs)-sites were used to derive an SNV only dataset from the entire-plastome alignment[42]. A total of 959 SNVs were analyzed using IQ-TREE v2.1[43] with a TVMe + ASC + R2 substitution model, determined by ModelTest-NG[44] based on BIC, and clade support was assessed with 1,000 bootstrap replicates. Vavilovia formosa (MK604478) was chosen as an outgroup. The principal coordinates analysis (PCA) was conducted in TASSEL 5.0[45].

    DnaSP v6[46] was utilized to identify different haplotypes among the plastomes, with gaps and missing data excluded. Haplotype networks were constructed in Popart v1.7[47] using the median-joining algorithm. Haplotype diversity (Hd) for each group was calculated by DnaSP v6[46], and the evolutionary distances based on the Tamura-Nei distance model were computed based on the population differentiation index (FST) between different groups with the plastomic SNVs.

    In this study, the pan-plastome structure of peas was elucidated (Fig. 1). The length of these plastomes ranged from 120,826 to 122,547 bp. And the overall GC content varied from 34.74% to 34.87%. In contrast to typical plastomes characterized by a tetrad structure, the plastomes of peas contained a single IR copy. The average GC content among all pea plastomes was 34.8%, with the highest amount being 34.84% and the lowest 34.74%, with minimal variation among the pea plastomes.

    Figure 1.  Pea pan-plastome annotation map. Indicated by arrows, genes listed inside and outside the circle are transcribed clockwise and counterclockwise, respectively. Genes are color-coded by their functional classification. The GC content is displayed as black bars in the second inner circle. SNVs, InDels, block substitutions and mixed variants are represented with purple, green, red, and black lines, respectively. Single nucleotide variants (SNVs), block substitutions (BS, two or more consecutive nucleotide variants), nucleotide insertions or deletions (InDels), and mixed sites (which comprise two or more of the preceding three variants at a particular site) are the four categories into which variants are divided.

    A total of 110 unique genes were annotated (Supplementary Table S2), of which 76 genes were PCGs, 30 were transfer RNA (tRNA) genes and four were ribosomal RNA (rRNA) genes. Genes containing a single intron, include nine protein-coding genes (rpl16, rpl2, ndhB, ndhA, petB, petD, rpoC1, clpP, atpF) and six tRNA genes (trnK-UUU, trnV-UAC, trnL-UAA, trnA-UGC, trnI-GAU, trnG-UCC). Additionally, two protein-coding genes ycf3 and rps12 were found to contain two introns.

    The codon usage frequency in pea plastome genes is shown in Fig. 2a. The analysis of codon usage in the pea plastome indicated significant biases for specific codons across various amino acids. Here a nearly average usage in some amino acids was observed, such as Alanine (Ala) and Valine (Val). For most amino acids, the usage of different synonymous codons was not evenly distributed. Regarding stop codons, a nearly even usage was found, with 37.0% for TAA, 32.2% for TAG and 30.8% for TGA.

    Figure 2.  (a) The overall codon usage frequency in 51 CDSs (length > 300 bp) from the pea pan-plastome. (b) The heatmap of RSCU values in 51 CDSs (length > 300 bp) from the pea pan-plastome. The x-axis represents different codons and the y-axis represents different CDSs. The tree at the top was constructed based on a Neighbor-Joining algorithm.

    The RSCU heatmap (Fig. 2b) showed different RSCU values for all codons in plastomic CDSs. In general, a usage bias for A/T in the third position of codons was found among CDSs in the pea pan-plastome. The RSCU values among these CDSs ranged from 0 to 4.8. The highest RSCU value (4.8) was found with the CGT codon in the cemA gene, where six synonymous codons exist for Arg but only CGT (4.8) and AGG (1.2) were used in this gene. This explained in large part the extreme RSCU value for CGT, resulting in an extreme codon usage bias in this amino acid.

    In the ENC-GC3s plot (Fig. 3), 31 PCGs were shown below the standard curve, while 20 PCGs were above. Besides, around 12 PCGs were near the curve, which meant these PCGs were under the average natural selection and mutation pressure. This plot displayed that the codon usage preferences in pea pan-plastomes were mostly influenced by natural selection. Five genes were shown an extreme influence with natural selection for its extreme ΔENC (ENCexpected – ENC) higher than 5, regarding as petB (ΔENC = 5.18), psbA (ΔENC = 8.96), rpl16 (ΔENC = 5.62), rps14 (ΔENC = 14.29), rps18 (ΔENC = 6.46) (Supplementary Table S3).

    Figure 3.  The ENC-GC3s plot for pea pan-plastome, with GC3s as the x-axis and ENC as the y-axis. The expected ENC values (standard curve) are calculated according to formula: ENC = 2 + GC3s + 29 / [GC3s2 + (1 − GC3s)2].

    For SSR detection (Fig. 4), mononucleotide, dinucleotide, and trinucleotide repeats were identified in the pea pan-plastome including A/T, AT/TA, and AAT/ATT. The majority of these SSRs were mononucleotides (A/T), accounting for over 90% of all identified repeats. Additionally, we observed that A/T and AT/TA repeats were present in all pea accessions, whereas only about half of the plastomes contained AAT/ATT repeats. It was also found that the number of A/T repeats exhibited the greatest diversity, while the number of AAT/ATT repeats showed convergence in all plastomes that possessed this repeat.

    Figure 4.  Simple sequence repeats (SSRs) in the pea pan-plastome. The x-axis represents different samples of pea and the y-axis represents the number of repeats in this sample. (a) The number of A/T repeats in the peapan-plastome. (b) The number of AT/TA and AAT/ATT repeats of pea pan-plastomes.

    To better understand the phylogenetic relationships and evolutionary history of peas, a phylogenetic tree was reconstructed using maximum likelihood for 145 pea accessions utilizing the whole plastome sequences (Fig. 5a). The 145 pea accessions were grouped into seven clades with high confidence. These groups were named the 'PF group', 'PSeI-a group', 'PSeI-b group', 'PA group', 'PSeII group', 'PSeIII group', and the 'PS group'. The naming convention for these groups relates to the majority species names for accessions in each group, where P. fulvum makes up the 'PF group', P. sativum subsp. elatius in the 'PSeI-a group', 'PSeI-b group', 'PSeII group', and 'PSeIII group', P. abyssinicum in the 'PA group', and P. sativum in the 'PS group'. From this phylogenetic tree, it was observed that the 'PSeI-a group' and the 'PSeI-b group' had a close phylogenetic relationship and nearly all accessions in these two groups (except DCG0709 accession was P. sativum) were identified as P. sativum subsp. elatius. In addition to the P. sativum subsp. elatius found in PSeI, seven accessions from the PS group were identified as P. sativum subsp. elatius.

    The PCA results (Fig. 5b) also confirmed that domesticated varieties P. abyssinicum were closer to cultivated varieties PSeI and PSeII, while PSeIII was more closely clustered with cultivated varieties of P. sativum. A previous study has indicated that P. sativum subsp. sativum and P. abyssinicum were independently domesticated from different P. sativum subsp. elatius populations[34].

    The complete plastome sequences were utilized for haplotype analysis using TCS and median-joining network methods (Fig. 5c). A total of 76 haplotypes were identified in the analysis. The TCS network resolved a similar pattern as the other analyses in that six genetic clusters were resolved with genetic clusters PS and PSeIII being very closely related. The genetic cluster containing P. fulvum exhibits greater genetic distance from other genetic clusters. The genetic clusters containing P. abyssinicum (PA) and P. sativum (PS) had lower levels of intracluster differentiation. In the TCS network, Hap30 and Hap31 formed distinct clusters from other haplotypes, such as Hap27, which may account for the genetic difference between the 'PSeI-a group' and 'PSeI-b group'. The network analysis results were consistent with the findings of the phylogenetic tree and principal component analyses results in this study.

    Figure 5.  (a) An ML tree resolved from 145 pea plastomes. (b) PCA analysis showing the first two components. (c) Haplotype network of pea plastomes. The size of each circle is proportional to the number of accessions with the same haplotype. (d) Genetic diversity and differentiation of six clades of peas. Pairwise FST between the corresponding genetic clusters is represented by the numbers above the lines joining two bubbles.

    Among the six genetic clusters, the highest haplotype diversity (Hd) was observed in PSeIII (Hd = 0.99, π = 0.22 × 10⁻³), followed by PSeII (Hd = 0.96, π = 0.43 × 10⁻³), PSeI (Hd = 0.96, π = 0.94 × 10⁻³), PF (Hd = 0.94, π = 0.6 × 10⁻⁴), PS (Hd = 0.88, π = 0.3 × 10⁻⁴), and PA (Hd = 0.70, π = 0.2 × 10⁻⁴). Genetic differentiation was evaluated between each genetic cluster by calculating FST values. As shown in Fig. 5d, except for the relatively lower population differentiation between PS and PSeIII (FST = 0.54), and between PSeI and PSeII (FST = 0.59), the FST values between the remaining clades ranged from 0.7 to 0.9. The highest population differentiation was observed between PF and PA (FST = 0.98). The FST values between PSeI and different genetic clusters were relatively low, including PSeI and PF (FST = 0.80), PSeI and PS (FST = 0.77), PSeI and PSeIII (FST = 0.72), PSeI and PSeII (FST = 0.59), and PSeI and PA (FST = 0.72).

    To further determine the nucleotide variations in the pea pan-plastome, 145 plastomes were aligned and nucleotide differences analyzed across the dataset. A total of 1,579 variations were identified from the dataset (Table 1), including 965 SNVs, 24 Block Substitutions, 426 InDels, and 160 mixed variations of these three types. Among the SNVs, transitions were more frequent than transversions, with 710 transitions and 247 transversions. In transitions, T to G and A to C had 148 and 139 occurrences, respectively, while in transversions, G to A and C to T had 91 and 77 occurrences, respectively.

    Table 1.  Nucleotide variation in the pan-plastome of peas.
    Variant Total SNV Substitution InDel Mix
    (InDel, SNV)
    Mix
    (InDel, SUB)
    Total 1,576 965 24 426 156 4
    CDS 734 445 6 176 103 4
    Intron 147 110 8 29 0 0
    tRNA 20 15 1 4 0 0
    rRNA 11 3 0 6 2 0
    IGS 663 392 9 211 51 0
     | Show Table
    DownLoad: CSV

    When analyzing variants by their position to a gene (Fig. 6), there were 731 variations in CDSs, accounting for 46.3% of the total variations, including 443 SNVs (60.6%), six block substitutions (0.83%), 175 InDels (23.94%), and four mixed variations (14.64%). There were 104 variants in introns, accounting for 6.59% of the total variations, including 78 SNVs (75%), seven block substitutions (6.73%), and 19 InDels (18.27%). IGS (Intergenic spacers) contained 660 variations, accounting for 41.8% of the total variations, including 394 SNVs (59.7%), nine block substitutions (1.36%), 207 InDels (31.36%), and 50 mixed variations (7.58%). The tRNA regions contained 63 variants, accounting for 3.99% of the total variations, including 47 SNVs (74.6%) and 14 InDels (22.2%). The highest number of variants were detected in the IGS regions, while the lowest were found in introns. Among CDSs, accD (183) had the highest number of variations. In introns, rpL16 (18) and ndhA (16) had the most variants. In the IGS regions, ndhD-trnI-CAU (73), and trnL-UAA-trnT-UGU (44) possessed the greatest number of variants.

    Figure 6.  Variant locations within the pea pan-plastome categorized by genic position (Introns, CDS, and IGS).

    Finally, examples of some genes with typical variants were provided to better illustrate the sequence differences between clades (Fig. 7). For example, the present analysis revealed that the ycf1 gene exhibited a high number of variant loci, which included unique single nucleotide variants (SNVs) specific to the P. abyssinicum clade. Additionally, a unique InDel variant belonging to P. abyssinicum was identified. Similar unique SNVs and InDels were also found in other genes, such as matK and rpoC2, distinguishing the P. fulvum clade from others. These unique SNVs and InDels could serve as DNA barcodes to distinguish different maternal lineages of peas.

    Figure 7.  Examples of variant sites.

    The present research combined 145 pea plastomes to construct a pan-plastome of peas. Compared to single plastomic studies, pan-plastome analyses across a species or genus provide a higher-resolution understanding of phylogenetic relationships and domestication history. Most plastomes in plants possess a quadripartite circular structure with two inverted repeat (IR) regions and two single copy regions (LSC and SSC)[2024]. However, the complete loss of one of the IR regions in the pea plastome was observed which is well-known among the inverted repeat-lacking clade (IRLC) species in Fabaceae. The loss of IRs has been documented in detail from other genera such as Erodium (Geraniaceae family)[26,27] and Medicago (Fabaceae family)[28,29]. This phenomenon although not commonly observed, constitutes a significant event in the evolutionary trajectories of certain plant lineages[26]. Such large-scale changes in plastome architecture are likely driven in part by a combination of selective pressures and genetic drift[48]. In the pea pan-plastome, it was also found that, compared to some plants with IR regions, the length of the plastomes was much shorter, and the overall GC content was lower. This phenomenon was due to the loss of one IR with high GC content.

    Repetitive sequences are an important part of the evolution of plastomes and can be used to reconstruct genealogical relationships. Mononucleotide SSRs are consistently abundant in plastomes, with many studies identifying them as the most common type of SSR[4952]. Among these, while C/G-type SSRs may dominate in certain species[53,54], A/T types are more frequently observed in land plants. The present research was consistent with these previous conclusions, showing an A/T proportion exceeding 90% (Fig. 4). Due to their high rates of mutation, SSRs are widely used to study phylogenetic relationships and genetic variation[55,56]. Additionally, like other plants, pea plastome genes have a high frequency of A/Ts in the third codon position. This preference is related to the higher AT content common among most plant plastomes and Fabaceae plastomes in particular with their single IRs[57,58]. The AT-rich regions are often associated with easier unwinding of DNA during transcription and potentially more efficient and accurate translation processes[59]. The preference for A/T in third codon positions may also be influenced by tRNA availability, as the abundance of specific tRNAs that recognize these codons can enhance the efficiency of protein synthesis[60,61]. However, not all organisms exhibit this preference for A/T-ending codons. For instance, many bacteria have GC-rich genomes and thus show a preference for G/C-ending codons[6264]. This variation in codon usage bias reflects the differences in genomic composition and the evolutionary pressures unique to different lineages.

    This study also comprehensively examined the variant loci of the pea pan-plastome. Among these variant sites, some could potentially serve as DNA barcode sites for specific lineages of peas, such as ycf1, rpoC2, and matK. Both ycf1 and matK have been widely used as DNA barcodes in many species[6568], as they are hypervariable. Researchers now have a much deeper understanding of the crucial role plastomes have played in plant evolution[6971]. By generating a comprehensive map of variant sites, future researchers can now more effectively trace differences in plastotypes to physiological and metabolic traits for use in breeding elite cultivars.

    The development of a pan-plastome for peas provides new insights into the maternal domestication history of this important food crop. Based on the phylogenetic analysis in this study, we observed a clear differentiation between wild and cultivated peas, with P. fulvum being the earliest diverging lineage, and was consistent with former research[34]. The ML tree (Fig. 5a) indicated that cultivated peas had undergone at least two independent domestications, namely from the PA and PS groups, which is consistent with former research[34]. However, as the present study added several accessions over the previous study and plastomic data was utilized, several differences were also found[34], such as the resolution of the two groups, referred to as PSeI-a group and PSeI-b group which branched between the PA group and PF group. Previous research based on nuclear data[34] only and with fewer accessions showed that the PA group and PF group were closely related in phylogeny, with no PSeI group appearing between them. One possible explanation is that the PSeI-a and PSeI-b lineages represents the capture and retention of a plastome from a now-extinct lineage while backcrossing to modern cultivars has obscured this signal in the nuclear genomic datasets. However, procedural explanations such as incorrectly identified accessions might have also resulted in such patterns. In either case, the presence of these plastomes in the cultivated pea gene pool should be explored for possible associations with traits such as disease resistance and hybrid incompatibility. This finding underscores the complexity of the domestication process and highlights the role of hybridization and selection in shaping the genetic landscape of cultivated peas. As such, future studies integrating data from the nuclear genome, mitogenome, and plastome will undoubtedly provide deeper insights into the phylogeny and domestication of peas. This pan-plastome research, encompassing a variety of cultivated taxa, will also support the development of elite varieties in the future.

    This study newly assembled 103 complete pea plastomes. These plastomes were combined with 42 published pea plastomes to construct the first pan-plastome of peas. The length of pea plastomes ranged from 120,826 to 122,547 bp, with the GC content varying from 34.74% to 34.87%. The codon usage pattern in the pea pan-plastome displayed a strong bias for A/T in the third codon position. Besides, the codon usage of petB, psbA, rpl16, rps14, and rps18 were shown extremely influenced by natural selection. Three types of SSRs were detected in the pea pan-plastome, including A/T, AT/TA, and AAT/ATT. From phylogenetic analysis, seven well-supported clades were resolved from the pea pan-plastome. The genes ycf1, rpoC2, and matK were found to be suitable for DNA barcoding due to their hypervariability. The pea pan-plastome provides a valuable supportive resource in future breeding and selection research considering the central role chloroplasts play in plant metabolism as well as the association of plastotype to important agronomic traits such as disease resistance and interspecific compatibility.

  • The authors confirm contribution to the paper as follows: study conception and design: Wang J; data collection: Kan J; analysis and interpretation of results: Kan J, Wang J; draft manuscript preparation: Kan J, Wang J, Nie L; project organization and supervision: Tiwari R, Wang M, Tembrock L. All authors reviewed the results and approved the final version of the manuscript.

  • The annotation files of newly assembled pea plastomes were uploaded to the Figshare website (https://figshare.com/, doi: 10.6084/m9.figshare.26390824).

  • This study was funded by the Guangdong Pearl River Talent Program (Grant No. 2021QN02N792) and the Shenzhen Fundamental Research Program (Grant No. JCYJ20220818103212025). This work was also funded by the Science Technology and Innovation Commission of Shenzhen Municipality (Grant No. RCYX20200714114538196) and the Innovation Program of Chinese Academy of Agricultural Sciences. We are also particularly grateful for the services of the High-Performance Computing Cluster in the Agricultural Genomics Institute at Shenzhen, Chinese Academy of Agricultural Sciences.

  • The authors declare that they have no conflict of interest.

  • [1]

    Lv W, Lin T, Ren Z, Jiang Y, Zhang J, et al. 2020. Rapid discrimination of Citrus reticulata ‘Chachi’ by headspace-gas chromatography-ion mobility spectrometry fingerprints combined with principal component analysis. Food Research International 131:108985

    doi: 10.1016/j.foodres.2020.108985

    CrossRef   Google Scholar

    [2]

    Luo M, Luo H, Hu P, Yang Y, Wu B, et al. 2018. Evaluation of chemical components in Citri Reticulatae Pericarpium of different cultivars collected from different regions by GC-MS and HPLC. Food Science & Nutrition 6:400−16

    doi: 10.1002/fsn3.569

    CrossRef   Google Scholar

    [3]

    Luo Y, Zeng W, Huang K, Li D, Chen W, et al. 2019. Discrimination of Citrus reticulata Blanco and Citrus reticulata ‘Chachi’ as well as the Citrus reticulata ‘Chachi’ within different storage years using ultra high-performance liquid chromatography quadrupole/time-of-flight mass spectrometry-based metabolomics approach. Journal of Pharmaceutical and Biomedical Analysis 171:218−31

    doi: 10.1016/j.jpba.2019.03.056

    CrossRef   Google Scholar

    [4]

    Wang P, Zhang J, Zhang Y, Su H, Qiu X, et al. 2019. Chemical and genetic discrimination of commercial Guangchenpi (Citrus reticulata 'Chachi') by using UPLC-QTOF-MS/MS based metabolomics and DNA barcoding approaches. RSC Advances 9:23373−81

    doi: 10.1039/c9ra03740c

    CrossRef   Google Scholar

    [5]

    Yu X, Sun S, Guo Y, Liu Y, Yang D, et al. 2018. Citri Reticulatae Pericarpium (Chenpi): Botany, ethnopharmacology, phytochemistry, and pharmacology of a frequently used traditional Chinese medicine. Journal of Ethnopharmacology 220:265−82

    doi: 10.1016/j.jep.2018.03.031

    CrossRef   Google Scholar

    [6]

    Zareiyan F, Khajehsharifi H. 2022. Bioactive compounds analysis in ethanolic extracts of Citrus maxima and Citrus sinensis exocarp and mesocarp. Natural Product Research 36:4505−8

    doi: 10.1080/14786419.2021.1986819

    CrossRef   Google Scholar

    [7]

    Calvaruso E, Cammilleri G, Pulvirenti A, Lo Dico G M, Lo Cascio G, et, al. 2020. Residues of 165 pesticides in citrus fruits using LC-MS/MS: a study of the pesticides distribution from the peel to the pulp. Natural Product Research 34:34−38

    doi: 10.1080/14786419.2018.1561682

    CrossRef   Google Scholar

    [8]

    Ye Y, Xu G, Li D. 2022. Acridone alkaloids and flavones from the leaves of Citrus reticulata. Natural Product Research 36:3644−50

    doi: 10.1080/14786419.2021.1876047

    CrossRef   Google Scholar

    [9]

    Schieberle P. 1995. New Developments in Methods for Analysis of Volatile Flavor Compounds and their Precursors. In Characterization of Food, ed. Gaonkar AG. Amsterdam: Elsevier. 65: 403−31. https://doi.org/10.1016/B978-044481499-9/50018-4

    [10]

    Duan L, Guo L, Dou L, Zhou C, Xu F, et al. 2016. Discrimination of Citrus reticulata Blanco and Citrus reticulata ‘Chachi’ by gas chromatograph-mass spectrometry based metabolomics approach. Food Chemistry 212:123−27

    doi: 10.1016/j.foodchem.2016.05.141

    CrossRef   Google Scholar

    [11]

    Liu L, Fu M, Xu Y, Wu J, et al. 2020. Analysis of differences in volatile components of Pericarpium Citri Reticulatae in different storage years based on GC-MS. Guangdong Agricultural Science 47:114−20

    doi: 10.16768/j.issn.1004-874X.2020.09.015

    CrossRef   Google Scholar

    [12]

    Chen MH, Huang TC. 2016. Volatile and nonvolatile constituents and antioxidant capacity of oleoresins in three Taiwan Citrus varieties as determined by supercritical fluid extraction. Molecules 21:1735

    doi: 10.3390/molecules21121735

    CrossRef   Google Scholar

    [13]

    Silvestre WP, Agostini F, Muniz LAR, Pauletti GF. 2016. Fractionating of green mandarin (Citrus deliciosa Tenore) essential oil by vacuum fractional distillation. Journal of Food Engineering 178:90−94

    doi: 10.1016/j.jfoodeng.2016.01.011

    CrossRef   Google Scholar

    [14]

    Fischer A, Grab W, Schieberle P. 2008. Characterisation of the most odour-active compounds in a peel oil extract from Pontianak oranges (Citrus nobilis var. Lour. microcarpa Hassk.). European Food Research and Technology 227:735−44

    doi: 10.1007/s00217-007-0781-y

    CrossRef   Google Scholar

    [15]

    Umano K, Hagi Y, Shibamoto T. 2002. Volatile chemicals identified in extracts from newly hybrid citrus, dekopon (Shiranuhi mandarin Suppl. J.). Journal of Agricultural and Food Chemistry 50:5355−59

    doi: 10.1021/jf0203951

    CrossRef   Google Scholar

    [16]

    Dharmawan J, Kasapis S, Sriramula P, Lear MJ, Curran P. 2009. Evaluation of aroma-active compounds in Pontianak orange peel oil (Citrus nobilis Lour. Var. microcarpa Hassk.) by gas chromatography-olfactometry, aroma reconstitution, and omission test. Journal of Agricultural and Food Chemistry 57:239−44

    doi: 10.1021/jf801070r

    CrossRef   Google Scholar

    [17]

    Xiao Z, Wu Q, Niu Y, Wu M, Zhu J, et al. 2017. Characterization of the key aroma compounds in five varieties of mandarins by gas chromatography–olfactometry, odor activity values, aroma recombination, and omission analysis. Journal of Agricultural and Food Chemistry 65:8392−401

    doi: 10.1021/acs.jafc.7b02703

    CrossRef   Google Scholar

    [18]

    Wang C, Li J, Zhang Y, Zhang X, Guo Z, et al. 2022. Effects of electrostatic spray drying on the sensory qualities, aroma profile and microstructural features of instant Pu-erh tea. Food Chemistry 373:131546

    doi: 10.1016/j.foodchem.2021.131546

    CrossRef   Google Scholar

    [19]

    Zhu J, Niu Y, Xiao Z. 2021. Characterization of the key aroma compounds in Laoshan green teas by application of odour activity value (OAV), gas chromatography-mass spectrometry-olfactometry (GC-MS-O) and comprehensive two-dimensional gas chromatography mass spectrometry (GC × GC-qMS). Food Chemistry 339:128136

    doi: 10.1016/j.foodchem.2020.128136

    CrossRef   Google Scholar

    [20]

    Pang X, Zhang Y, Qiu J, Cao J, Sun Y, et al. 2019. Coupled multidimensional GC and odor activity value calculation to identify off-odors in thermally processed muskmelon juice. Food Chemistry 301:125307

    doi: 10.1016/j.foodchem.2019.125307

    CrossRef   Google Scholar

    [21]

    Buttery RG, Teranishi R, Ling LC, Turnbaugh JG. 1990. Quantitative and sensory studies on tomato paste volatiles. Journal of Agricultural and Food Chemistry 38:336−40

    doi: 10.1021/jf00091a074

    CrossRef   Google Scholar

    [22]

    Czerny M, Christlbauer M, Christlbauer M, Fischer A, Granvogl M, et al. 2008. Re-investigation on odour thresholds of key food aroma compounds and development of an aroma language based on odour qualities of defined aqueous odorant solutions. European Food Research and Technology 228:265−73

    doi: 10.1007/s00217-008-0931-x

    CrossRef   Google Scholar

    [23]

    Mao D, Hong L, Li Z, Niu Y, Xiao Z, et al. 2019. Characterization of aroma-active compounds in delicious apples juices by gas chromatography-mass spectrometry (GC-MS), gas chromatography-olfactometry (GC-O) and odor activity value (OAV). bioRxiv Pre-print

    doi: 10.1101/611061

    CrossRef   Google Scholar

    [24]

    Grosch W. 1993. Detection of potent odorants in foods by aroma extract dilution analysis. Trends in Food Science & Technology 4:68−73

    doi: 10.1016/0924-2244(93)90187-F

    CrossRef   Google Scholar

    [25]

    Buettner A, Schieberle P. 2001. Evaluation of aroma differences between hand-squeezed juices from Valencia late and Navel oranges by quantitation of key odorants and flavor reconstitution experiments. Journal of Agricultural and Food Chemistry 49:2387−94

    doi: 10.1021/jf001363l

    CrossRef   Google Scholar

    [26]

    Choi HS, Kondo Y, Sawamura M. 2001. Characterization of the odor-active volatiles in citrus Hyuganatsu (Citrus tamurana Hort. ex Tanaka). Journal of Agricultural and Food Chemistry 49:2404−8

    doi: 10.1021/jf001467w

    CrossRef   Google Scholar

    [27]

    Plotto A, Margaría CA, Goodner KL, Goodrich R, Baldwin EA. 2004. Odour and flavour thresholds for key aroma components in an orange juice matrix: terpenes and aldehydes. Flavour and Fragrance Journal 19:491−98

    doi: 10.1002/ffj.1470

    CrossRef   Google Scholar

    [28]

    Qiao Y, Xie B, Zhang Y, Zhou H, Pan S. 2007. Study on aroma components in fruit from three different satsuma mandarin varieties. Agricultural Sciences in China 6:1487−93

    doi: 10.1016/S1671-2927(08)60012-7

    CrossRef   Google Scholar

    [29]

    Sawamura M, Thi Minh Tu N, Onishi Y, Ogawa E, Choi HS. 2004. Characteristic odor components of Citrus reticulata Blanco (ponkan) cold-pressed oil. Bioscience, Biotechnology, and Biochemistry 68:1690−97

    doi: 10.1271/bbb.68.1690

    CrossRef   Google Scholar

    [30]

    Xiao Z, Ma S, Niu Y, Chen F, Yu D. 2016. Characterization of odour-active compounds of sweet orange essential oils of different regions by gas chromatography-mass spectrometry, gas chromatography-olfactometry and their correlation with sensory attributes. Flavour and Fragrance Journal 31:41−50

    doi: 10.1002/ffj.3268

    CrossRef   Google Scholar

    [31]

    Noguerol-Pato R, González-Barreiro C, Simal-Gándara J, Martínez MC, Santiago JL, et al. 2012. Active odorants in Mouratón grapes from shoulders and tips into the bunch. Food Chemistry 133:1362−72

    doi: 10.1016/j.foodchem.2012.01.113

    CrossRef   Google Scholar

    [32]

    Song HS, Sawamura M, Ito T, Kawashimo K, Ukeda H. 2000. Quantitative determination and characteristic flavour of Citrus junos (yuzu) peel oil. Flavour and Fragrance Journal 15:245−50

    doi: 10.1002/1099-1026(200007/08)15:4<245::AID-FFJ904>3.0.CO;2-V

    CrossRef   Google Scholar

    [33]

    Fan H, Fan W, Xu Y. 2015. Characterization of key odorants in Chinese chixiang aroma-type liquor by gas chromatography-olfactometry, quantitative measurements, aroma recombination, and omission studies. Journal of Agricultural and Food Chemistry 63:3660−68

    doi: 10.1021/jf506238f

    CrossRef   Google Scholar

    [34]

    Zhu J, Chen F, Wang L, Niu Y, Chen H, et al. 2016. Characterization of the key aroma volatile compounds in cranberry (Vaccinium macrocarpon Ait.) using gas chromatography-olfactometry (GC-O) and odor activity value (OAV). Journal of Agricultural and Food Chemistry 64:4990−99

    doi: 10.1021/acs.jafc.6b01150

    CrossRef   Google Scholar

    [35]

    Van Gemert LJ. 2011. Odour Thresholds - Compilations of odour threshold values in air, water and other media. Utrecht, Netherlands: Oliemans, Punter & Partners BV. 485 pp

  • Cite this article

    Yang D, Wu X, Shi H, Zhang J, Wang C. 2022. Essential aroma substances and release pattern of Xinhui Chenpi. Beverage Plant Research 2:22 doi: 10.48130/BPR-2022-0022
    Yang D, Wu X, Shi H, Zhang J, Wang C. 2022. Essential aroma substances and release pattern of Xinhui Chenpi. Beverage Plant Research 2:22 doi: 10.48130/BPR-2022-0022

Figures(4)  /  Tables(4)

Article Metrics

Article views(4923) PDF downloads(752)

Other Articles By Authors

ARTICLE   Open Access    

Essential aroma substances and release pattern of Xinhui Chenpi

Beverage Plant Research  2 Article number: 22  (2022)  |  Cite this article

Abstract: This study focuses on analyzing aqueous solutions of aroma-active compounds in Xinhui Chenpi distilled after being heated with headspace solid-phase microextraction and gas chromatography-mass spectrometry (HS-SPME-GC/MS). Feasibility of this method was also tested by comparison with crushed samples. The study also analyzed the aqueous solutions of the aroma-active compounds employing gas chromatography-olfactometry (GC-O) defense, aroma extraction dilution analysis (AEDA) and odor activity value (OAV) as well as their emission patterns. According to the study, there are 24 major aroma-active detected in the aqueous solution. Linalool, d-limonene, 2-methoxy-4-vinylphenol, and α-terpineol with sweet, spicy, and woody aroma contributed the most to the aroma-active compounds and were considered to be the essential aroma substances of Chenpi. When heated, the aroma of aromatic-active compounds rich in Chenpi volatilized rapidly and the release dropped dramatically in a short time. The substantial aroma-active compounds can be collected from the first ten released segments.

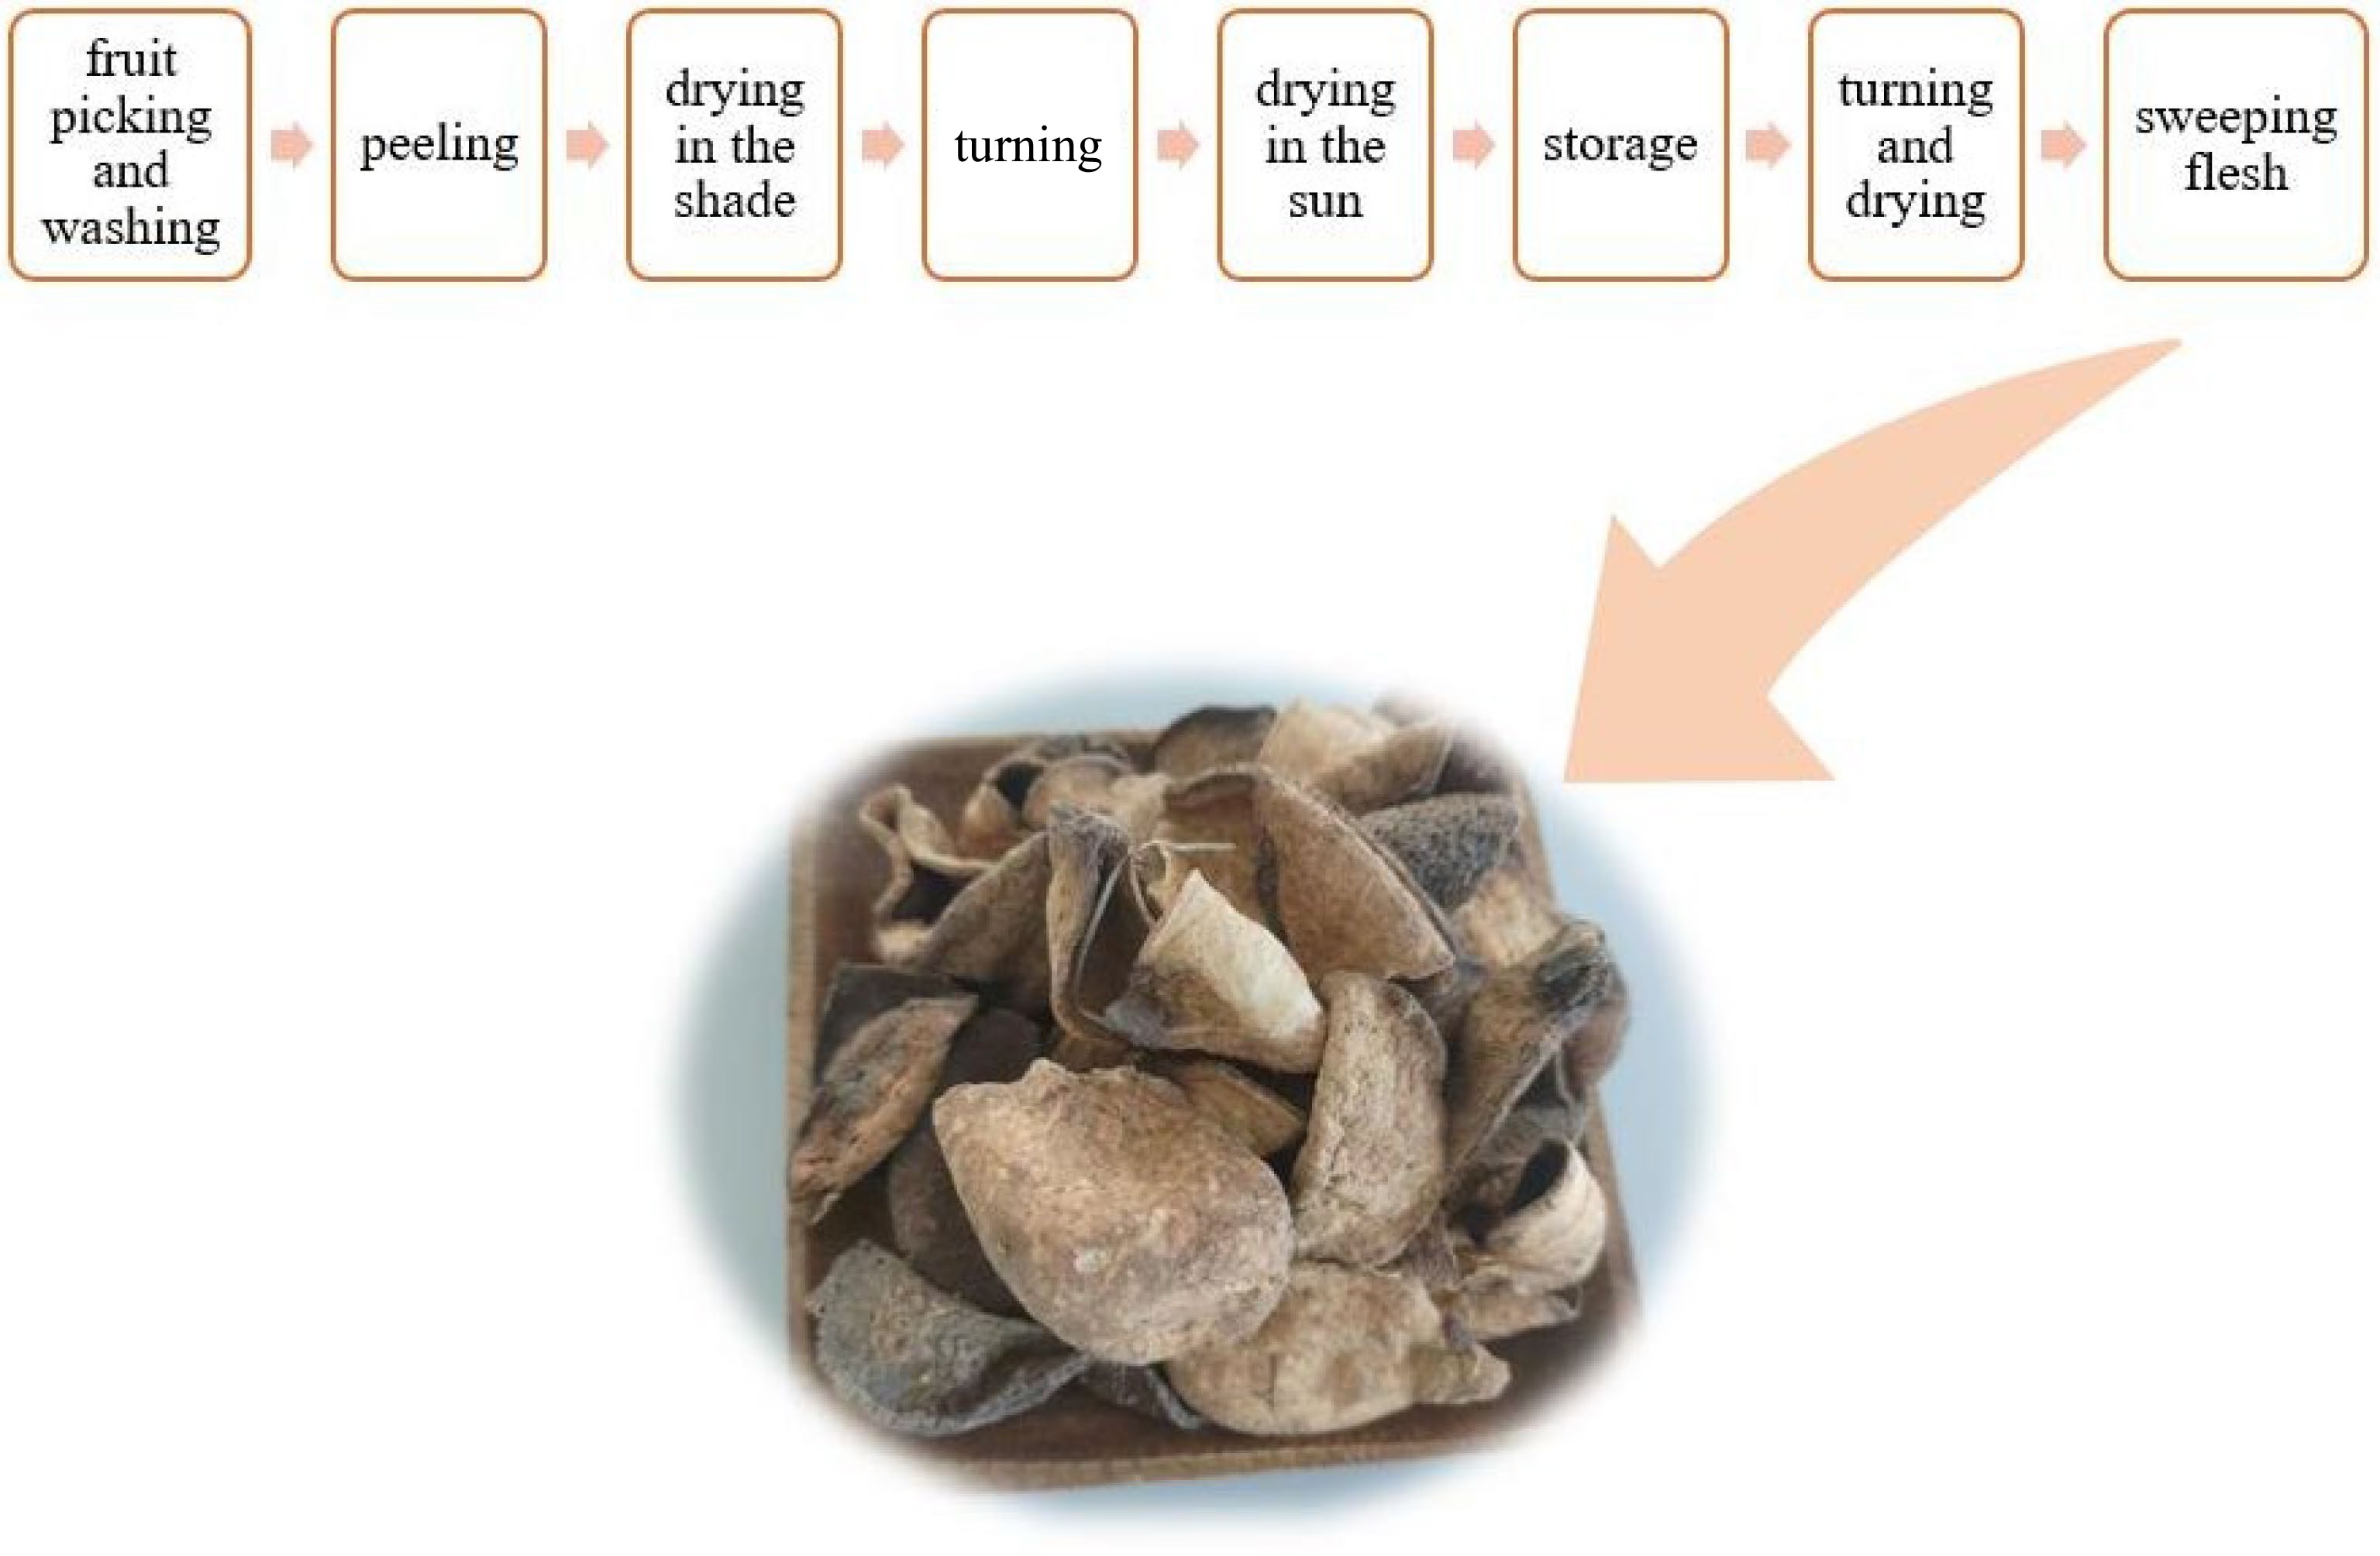
    • Chenpi (Tangerine peel) is made from ripe peels of citrus (Citrus reticulata Blanco), dried in the sun or low temperatures[1]. The production of dried Chenpi mainly includes fruit picking and washing, peeling, drying in the shade, turning, drying in the sun, storage, turning and drying, and flesh sweeping, as shown in Fig. 1. Chenpi is known for its 'chen' (in Chinese it means a long time), so the best Chenpi comes from being stored for a very long period of time. It should be stored at least for three years. Citrus are usually produced from Guangdong, Fujian, Sichuan, Guangxi and Zhejiang, etc, in China. Multiple kinds of citrus from different places can be made into Chenpi of various qualities. And Xinhui Chenpi is top in its family, Chenpi is usually hard and brittle with a fragrant-pungent, and bitter taste. It plays an important part in promoting digestion and curing-vomiting, coughs, and respiratory diseases[28].

      Figure 1. 

      Xinhui Chenpi production process flow chart.

      The unique aroma of Chenpi is among the many criteria used to evaluate its quality. According to available literature, the aroma of food comes mainly from its volatile compounds, also called aroma-active compounds[9]. Much progress has been made in studying aroma-active compounds of Chenpi with the method of GC-MS. Duan et al.[10] used the GC-MS metabolomics approach combined with principal component analysis and orthogonal partial least squares discriminant analysis to show that the method effectively differentiated samples. Finally, 15 compounds such as methyl methanthranilate, α-sinensal, geranyl acetate, thymol were identified as chemical markers of Chenpi samples. With the method of GC-MS, Luo et al.[2] detected 98 compounds in Chenpi volatile oil and their main components were d-limonene, γ-pinene, α-pinene, linalool and myrcene.

      The extraction of volatile compounds of Chenpi is a key technology for its quality analysis. At present, most studies on aroma-active compounds of Chenpi are based on shearing treatment[11] or extraction of volatile compounds with the help of solvent apparatus, and the main extraction methods involved are supercritical fluid extraction (SFE)[12], hydro-distillation (HD)[9], vacuum steam fraction (VSF)[13], solvent extraction (SE)[6,14] and simultaneous distillation extraction (SDE)[15], each of which has its own advantages and disadvantages. The main disadvantages of these methods including the solvent being contaminated and the time consuming nature of the complicated steps, as well as the variety of equipment needed. In this study, water vapor condensation reflux method was used to extract the aroma-active compounds, which is simple and easy to operate. This method resulted in an aqueous solution of aroma-active compounds (hereafter referred to as aroma water), which fully enriched the aroma-active compounds of Chenpi without solvent contamination.

      In addition, GC-O was more often used to screen aroma-active compounds. Analyzing Chenpi oil by GC-O and AEDA, Dharmawan et al.[16] concluded that β-pinene, α-pinene, linalool, and 2-methoxy-3-(2-methylpropyl) pyrazine were characteristic aroma substances. Xiao et al.[17] used GC-O to analyze five citruses and concluded that substances such as nonanal, hexanal, linalool and limonene (OAVs ≥ 1) were the characteristic aroma compounds of orange juice samples.

      This experiment collects Chenpi aroma water from Chenpi volatiles obtained by heating and hydro distillation. Then the aroma water was analyzed by HS-SPME-GC-MS, and its essential aroma substances were selected using the method of GC-O, AEDA results were expressed as flavor dilution factors (FD), and OAV was used to identify the unique contribution of each compound to the characteristic aroma. In addition, the essential aroma-active compounds of Chenpi varied with heating time during the aroma collecting process. Therefore, the release pattern of essential aroma substances of Chenpi was identified.

    • Xinhui Chenpi sample (WG20210023, WG20210045, and WG20210066) were obtained from Yunnan Tasly Deepure Biological Tea Group Co., Ltd. (Pu’er, Yunnan, China).

    • Furfural (PubChem CID: 7362; ≥ 99.5%), octanal (PubChem CID: 454; 99%), myrcene (PubChem CID: 31253; ≥ 90%), γ-terpinene (PubChem CID: 7461; 95%), thymol (PubChem CID: 6989; > 99%), (−)-carvone (PubChem CID: 379; ≥ 95%), cymenol (PubChem CID: 10364; 99%), 2-methoxy-4-vinylphenol (PubChem CID: 332; ≥ 98%), citronellyl acetate (PubChem CID: 9017; ≥ 96%), methyl methanthranilate (PubChem CID: 6826; 98%), geranyl acetate (PubChem CID: 7780; 96%), α-terpinene (PubChem CID: 7462; 95%), octanoic acid (PubChem CID: 379; ≥ 99.5%) and n-decanol (PubChem CID: 8174; 98%) were purchased from McLean Biochemical Technology Co., Ltd (Shanghai, China). Geraniol (PubChem CID: 637566; 99%), 1-nonanol (PubChem CID: 8175; 99.5%), 4-terpineol (PubChem CID: 11230; 98%), α-terpineol (PubChem CID: 17100; > 95%), β-ionone (PubChem CID: 638014; 97%), p-cymene (PubChem CID: 7463; ≥ 99.5%), 1-octanol (PubChem CID: 957; > 99.5%), n-decanoic acid (PubChem CID: 2969; > 99%) and β-ionone (PubChem CID: 638014; 97%) were purchased from Aladdin (Shanghai, China). nonanal (PubChem CID: 31289; ≥ 95%), linalool (PubChem CID: 6549; 98%) and d-limonene (PubChem CID: 440917; > 95%) were purchased from TCI (Shanghai, China). NaCl (analytical purity 99.5%) were purchased from Tianjin Zhiyuan Chemical Reagant Co. n-Alkanes solution (C8-C32) was employed to calculate the retention index (RI) of the detected components.

    • Samples were treated using two different methods. Samples were crushed with a universal crusher (Tianjin Teste Instruments Co., Ltd, Tianjin, China) and passed through 30 mesh sieves before the experiment. The second method is as follows: 100 g of sample was weighed in a 2000-mL round bottom flask, 1,500 mL of hot water was added, soaked for 40 min (in order to shorten the extraction time, and the aroma substances are concentrated), then the samples were distilled by heating. The hydro-distillation method was used to recover condensed water (rich in volatile aroma-active components) and saved for HS-SPME pretreatment. The experiments were repeated in triplicate.

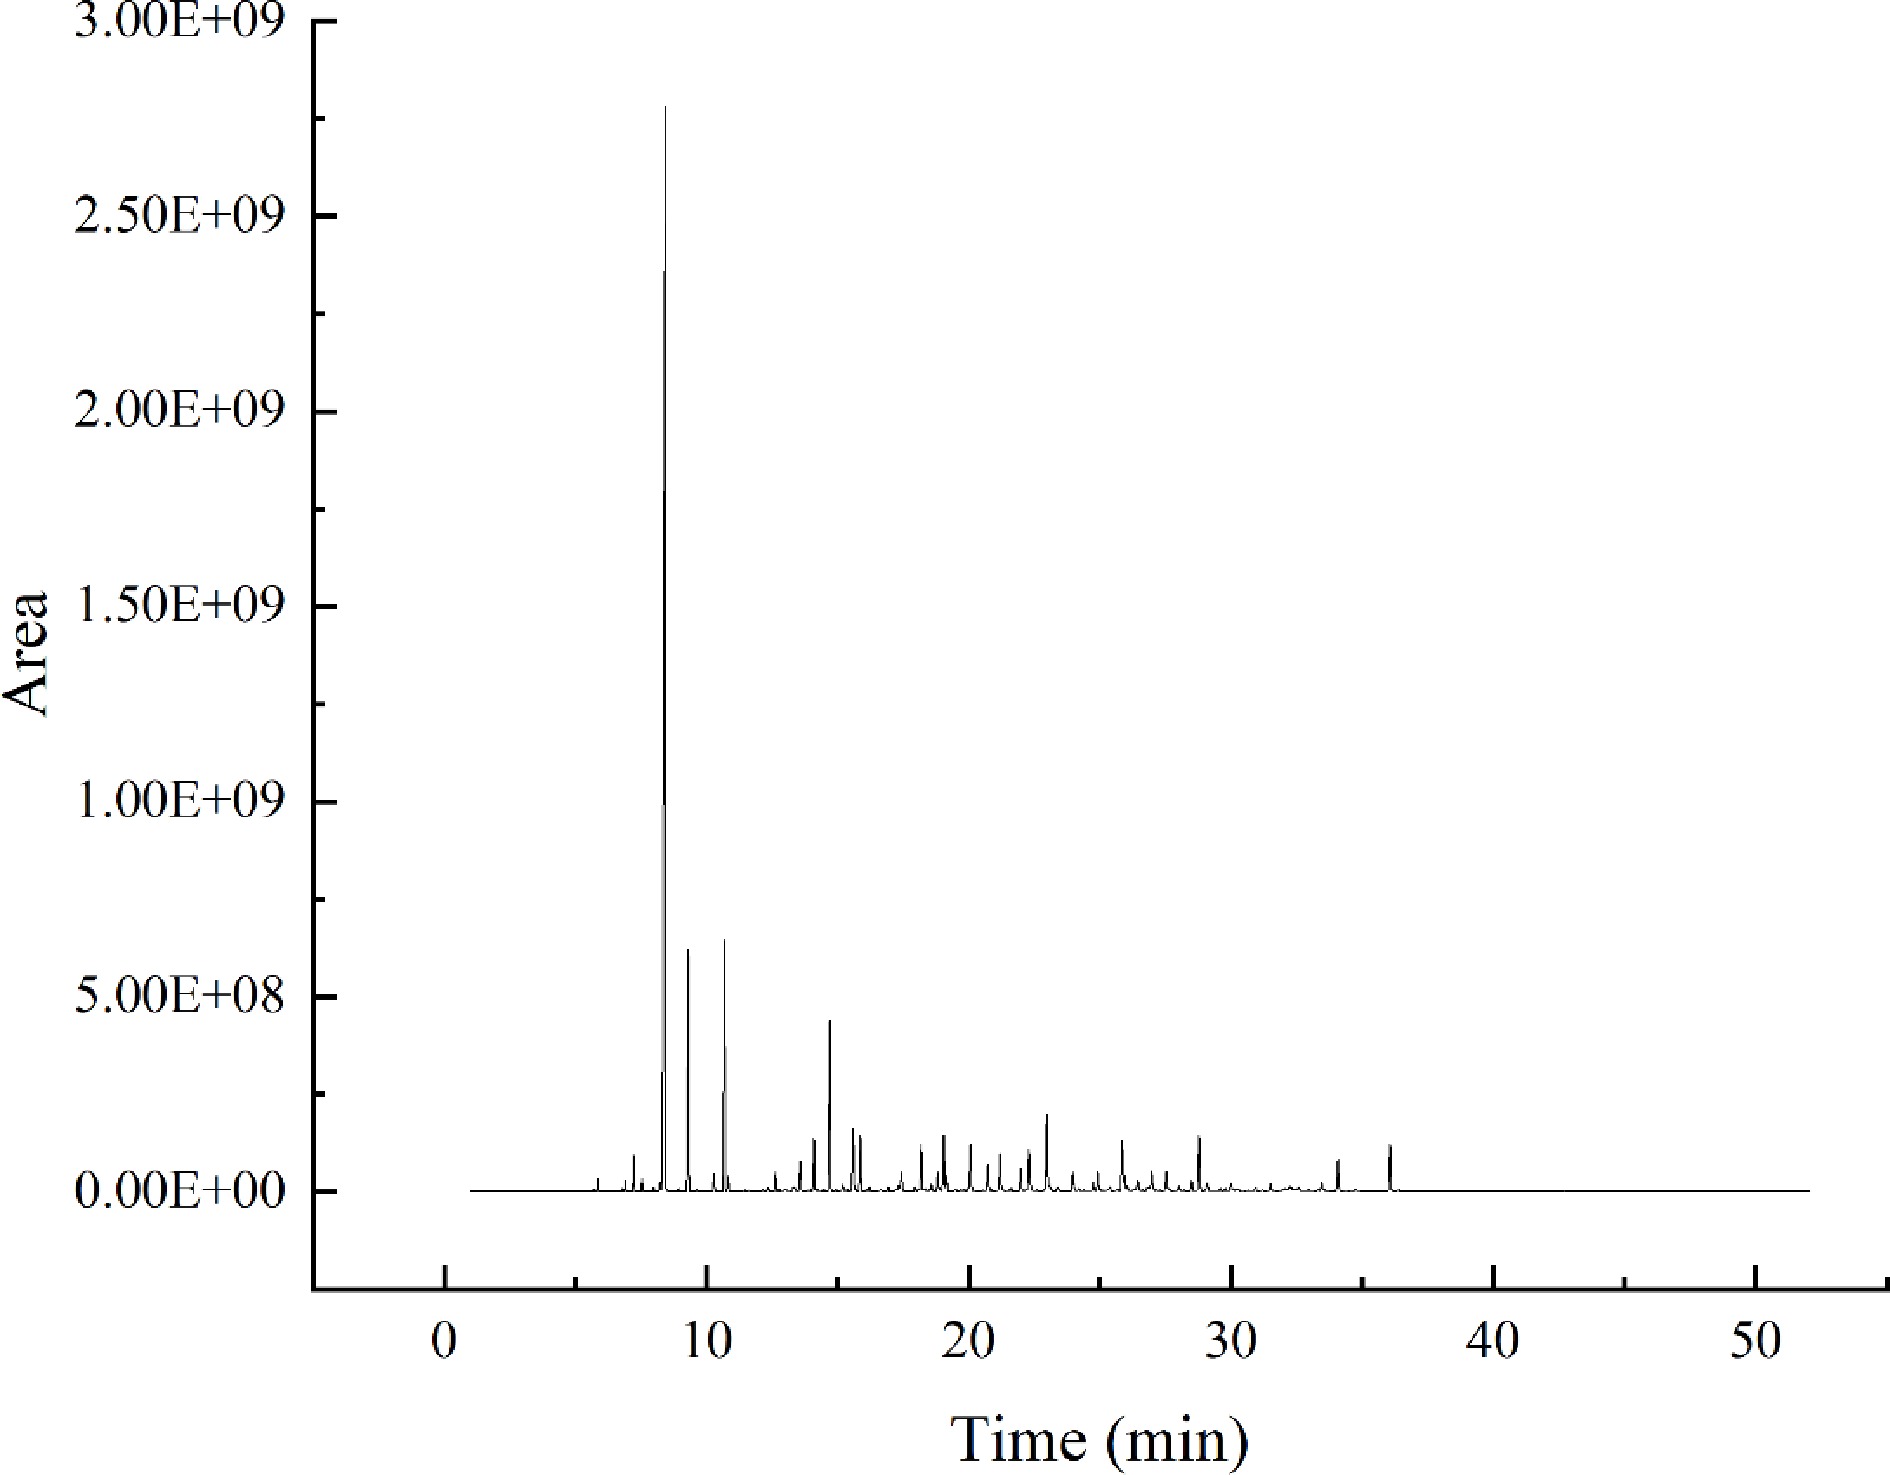
    • The analytical conditions of HS-SPME, GC-MS, and GC-O were adapted based on the proven method of Liu et al.[11]. The temperature rise procedure, shunt ratio, sample volume, and NaCl addition were optimized to establish the detection method, as shown in Fig. 2. The results showed good peak patterns and were suitable for this study.

      Figure 2. 

      Total ion chromatogram (TIC) of volatile compounds of Chenpi.

      New extraction heads were activated, as follows: the 50/30 μm DVB/CAR/PDMS extraction head was placed on the GC-MS inlet for about 30 min under the inlet temperature of 250 °C.

      TriPlus RSH autosampler (Thermo Fisher Scientific, USA) coupled with 50/30 μm divinylbenzene/carboxen/Polydimethylsiloxane (DVB/CAR/PDMS) (purchased from Supelco) was used for HS-SPME analysis. Respectively, 1.0 g of sample crushing (add 5 mL of ultra-pure water), 5 mL aroma water sample and 1.5 g of NaCl were placed into a 20-mL headspace bottle. Extraction temperature 65 °C, extraction time 30 min, equilibrium temperature 65 °C, equilibrium time 10 min, desorption time 5 min.

    • The equipment used was Rtx-5MS column (30 m × 0.25 mm internal diameter, 0.25 μm film thickness (Restek, Bellefonte, PA, USA), TRACE1300-ISQ gas chromatograph-mass spectrometer (Thermo Fisher Scientific, USA), Thermo Scientific Barnstead water purification system (Thermo Fisher Scientific, USA). The procedures of temperature increase are as follows: initial temperature 40 °C, ramp-up to 70 °C at 10 °C/min, ramp-up to 190 °C at 3 °C/min, ramp-up to 250 °C at 10 °C/min, hold for 3 min; flow rate: 1.0 mL/min; inlet temperature: 250 °C; injection volume: 1.0 μL; split ratio: 70:1; carrier gas: 99.999% high purity helium. EI ion source; ion source temperature: 250 °C; transfer line temperature: 250 °C; ionization energy: 70 eV; scan mode: full scan; mass scan range 40−500 m/z.

      Quantitative analysis of volatile compounds was conducted using a standard curve that obtained for each compound. The stock solution composed of 24 aroma-active compounds was configured and diluted with ethanol to six gradients of 2, 2.5, 10/3, 5, 10 and 20 to produce the standard curve. Meanwhile, the retention indices and aroma characteristics of each aroma-active compound were also used to verify the qualitative results.

    • GC-O analysis was performed using a Thermo Trace 1300 gas chromatograph (Thermo Fisher Scientific Inc., USA) equipped with a flame ionization detector and a sniffing port (ODP2, Gerstel, Inc., Germany), Rtx-5MS column (30 m × 0.25 mm internal diameter, 0.25 µm film thickness; Restek, Bellefonte, PA, USA) was used for the separation, other equipment used was SGH-300 high-purity hydrogen generator, SGK-2L low-noise air pump (Beijing Zhongke Jirui Technology Co. Ltd., Beijing, China).

      Experienced sensory evaluators completed GC-O sniffing experiments, three panelists were selected and trained based on GB/T 16291.1-2012 (Sensory analysis-general guidance for the selection, training, and monitoring of assessors)[18]. The time of odor appearance, end time, and odor description were recorded by the selected panelists.

    • OAV is often used to evaluate and screen the contribution of aroma-active compounds to the aroma formation of samples[19]. According to the calculation formula, OAV is the ratio of concentration of aroma-active compounds relative to their respective threshold in water, the compound concentration is the absolute concentration corrected by the GC-MS standard curve, and the odor threshold in water is obtained from previous literature[16,2024].

    • Aroma water was diluted in gradient with water at 2n to obtain dilution multiples of 1:2, 1:4, 1:8, 1:16, etc. GC-O detection, based on sniffing until the aroma-active compound odor disappears, was determined as the FD factor of the compound.

    • In order to study the content changes of aroma-active compounds of samples with heating time during the aroma enrichment process, segmented interception of aroma extracts was performed during the extraction of aroma substances, with each 50 mL segment being collected 20 times. The relative quantification was performed by adding 0.01 mL of n-decanol (0.13 mg/kg) to analyze the release pattern of aromatic compounds. The process was repeated three times.

    • The study analyzed crushed samples, as well as aroma water samples. The number of aroma-active compounds in the samples and their relative content was examined to select the best treatment method. As shown in Fig. 3, 24 aroma-active compounds were identified in the detected values of the two forms of samples, such as d-limonene, linalool, 2-methoxy-4-vinylphenol, furfural, and α-terpinene, etc.; aroma-active compounds specific to the heated enriched aroma-active water such as p-cymene, 1-octanol, 4-terpineol, etc. There were 19 kinds of aroma-active compounds particular to the directly crushed samples such as undecanal, citronellol, neral, etc. There were eight kinds of aromatic compounds.
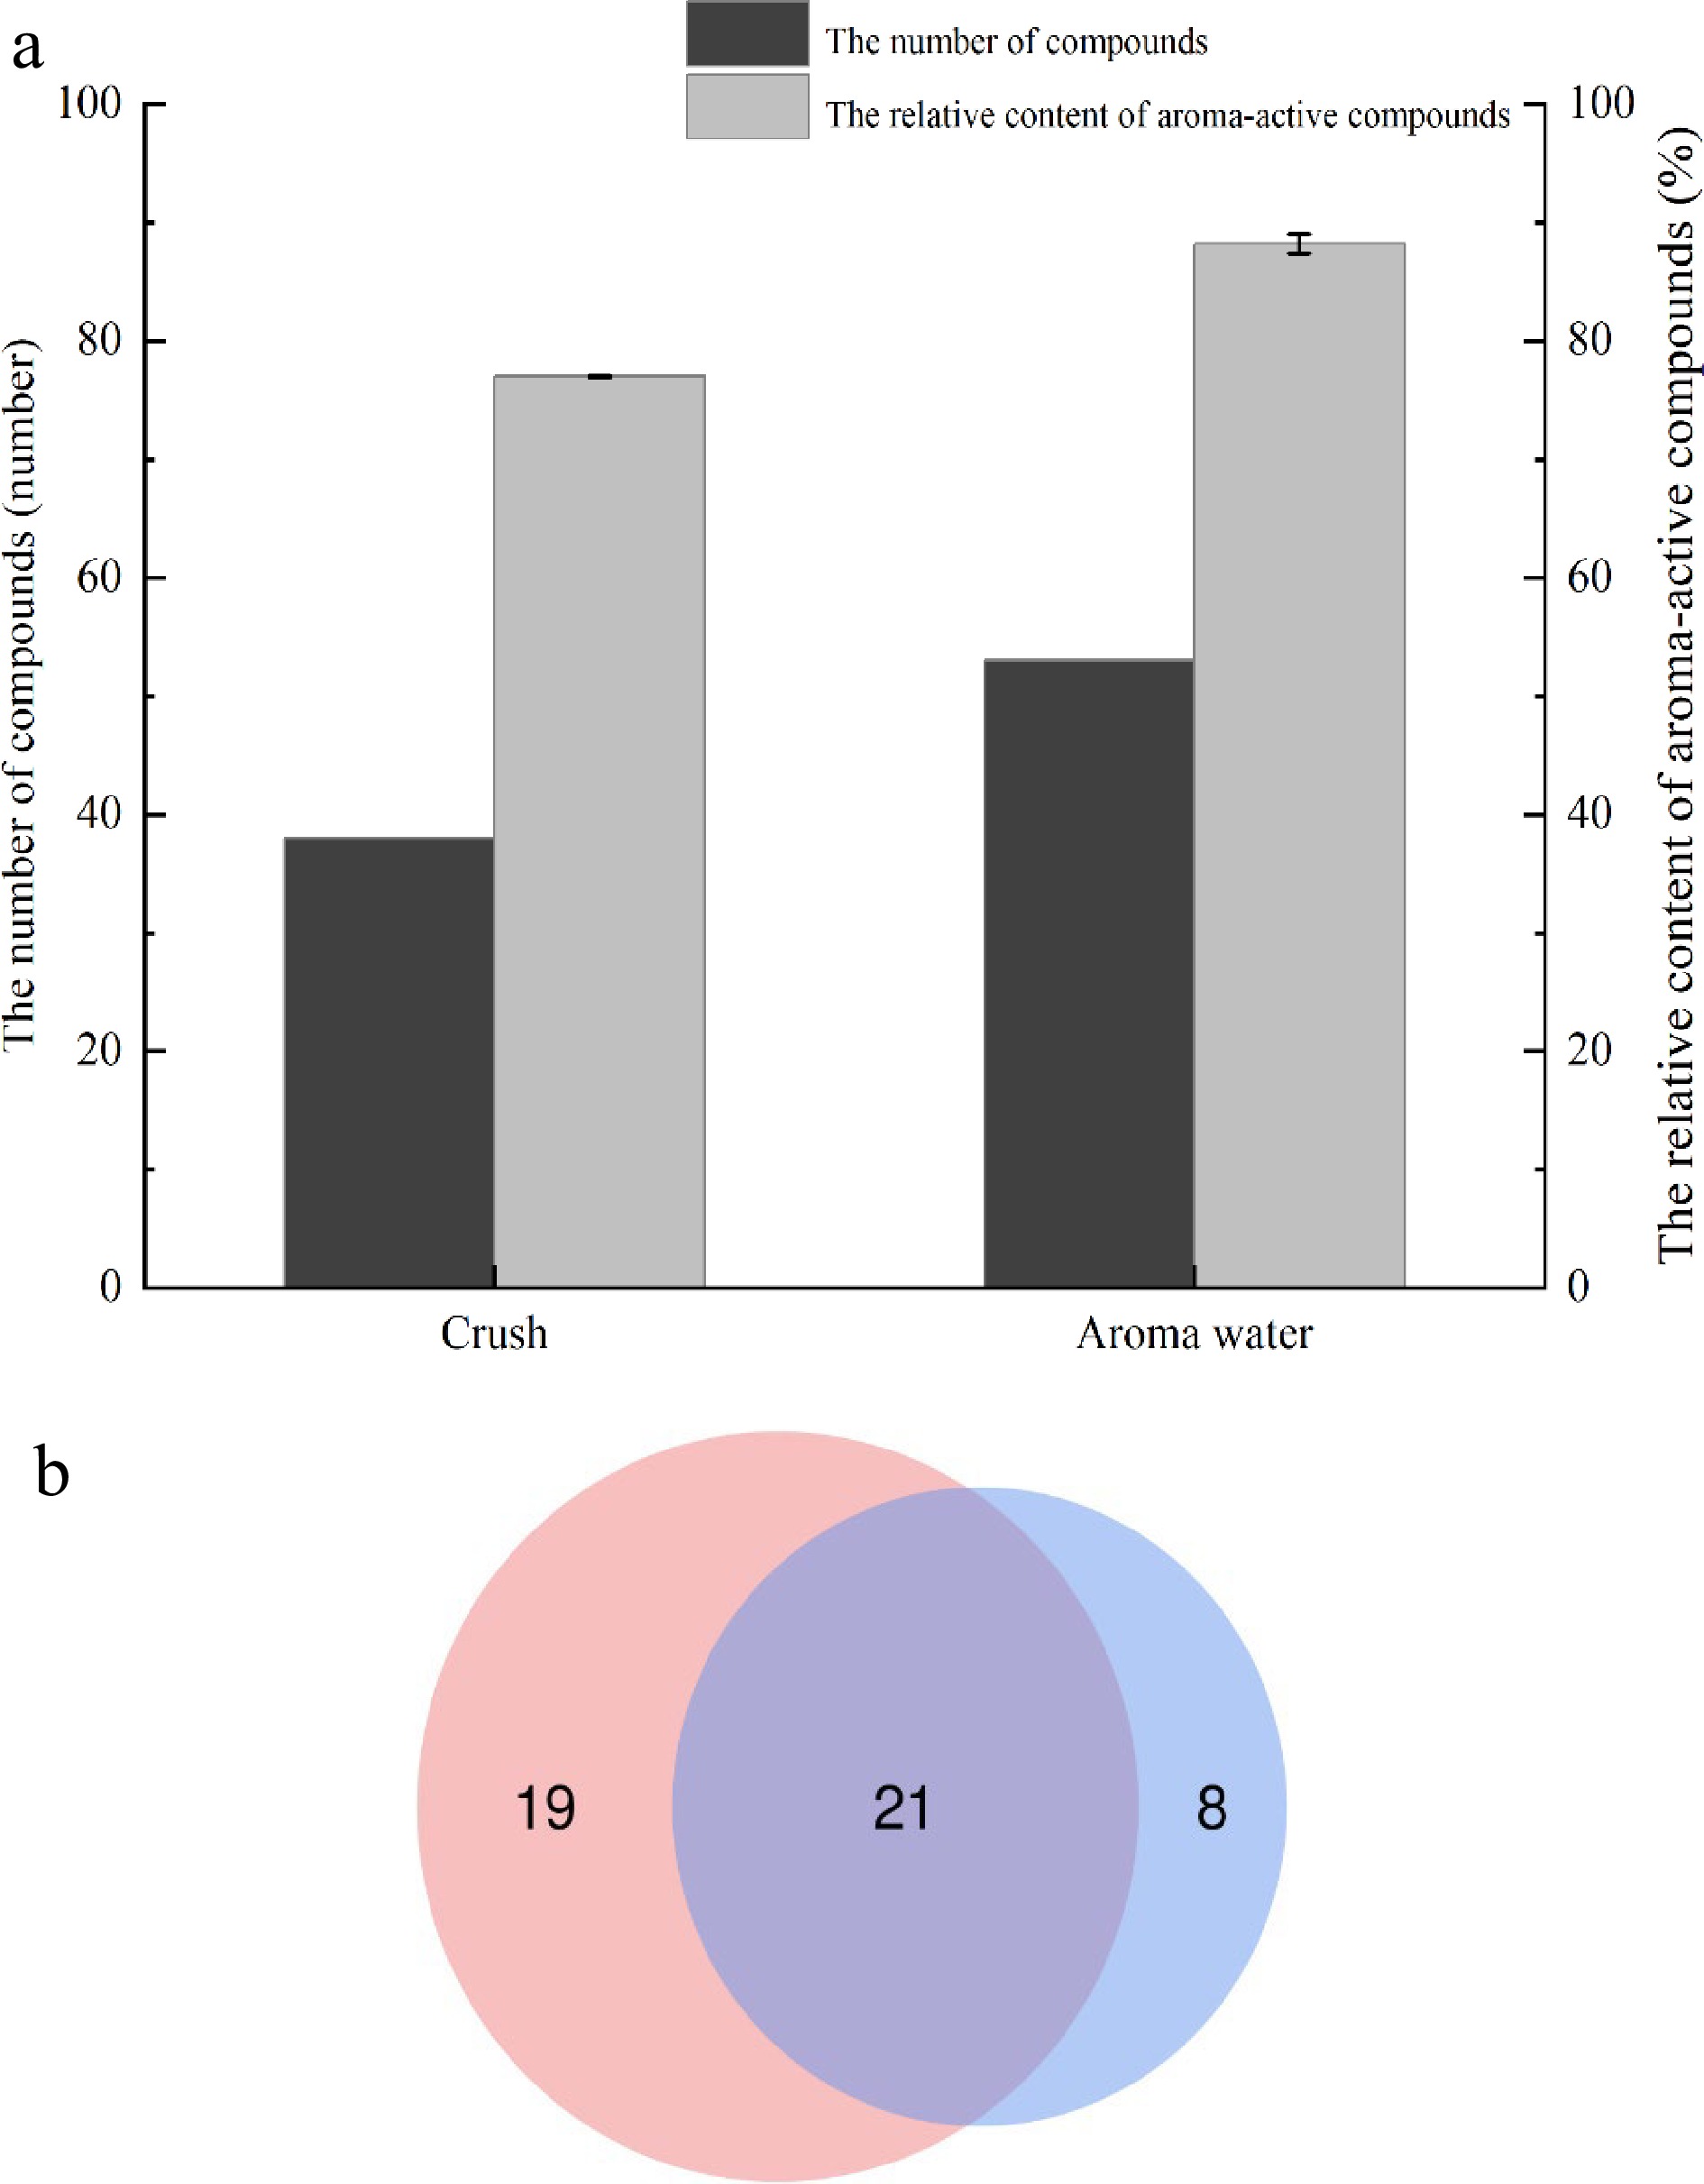
      Figure 3. 

      Comparison of aroma-active compounds in two forms, (a) concentration and number; (b) the number of compounds.

      The relative content of aroma-active compounds was collected using the normalization method. The sum of the relative content of aroma-active compounds in the water sample was greater than that of the crushed sample, and the aroma-active compounds were also more in the aroma water sample. In conclusion, the experimental feasibility of studying the aroma-active compounds of aroma water met expectations, and the aroma-active compounds of the Xinhui Chenpi samples could be characterized in this way.

    • The GC-MS qualitative analysis of the volatile compounds contained in the aroma water detected a total of 24 volatile aroma-active compounds with a matching index greater than 80% compared with the database, including six alcohols, four olefins, three aldehydes, two ketones, one acid, three phenols and three esters, as shown in Table 1. The corresponding standard curves were established for each compound with good linearity (equations of standard curves, where y is the area of the peak of an authentic standard, and x is the concentration of the authentic standard). Among them, d-limonene (3,291.64 mg/kg) showed highest in all compounds, followed by linalool (561.39 mg/kg), 4-terpineol (370.81 mg/kg), γ-terpinene (354.97 mg/kg), furfural (274.80 mg/kg), 2-methoxy-4-vinylphenol (253.67 mg/kg) and α-terpineol (250.54 mg/kg). According to the available literature, compounds such as d-limonene, γ-terpinene, linalool, and myrcene are essential components of the aroma composition of Chenpi[2530], and substances such as 4-terpineol, furfural, 2-methoxy-4-vinylphenol, and p-cymene in the Chenpi aroma-active substances have been rarely reported previously. In the present study, octanal (78.71 mg/kg), thymol (38.18 mg/kg), cymenol (29.62 mg/kg), and myrcene (21.19 mg/kg) were the compounds that contributed significantly to the aroma of Xinhui Chenpi.

      Table 1.  The concentration of volatile compounds detected in aroma water samples.

      NoTime
      (min)
      RICompoundMolecular formulaCalibration curvesR2Linear range
      (mg/kg)
      Content
      (mg/kg)a
      RSD (%)b
      14.12840FurfuralC5H4O2y = 2.08E+09x + 1.76E+06R2 = 0.996592.34-4.62274.8017.64
      27.42983MyrceneC10H16y = 3.55E+11x – 1.25E+07R2 = 0.99391.37-0.0721.1924.52
      37.741002OctanalC8H16Oy = 3.05E+10x – 4.37E+06R2 = 0.9922.34-0.1278.7131.41
      48.191009α-TerpineneC10H16y = 2.73E+11x – 6.85E+06R2 = 0.99190.51-0.033.4727.55
      58.441017p-CymeneC10H14y = 4.27E+11x – 5.02+05R2 = 0.99590.41-0.0212.8513.06
      68.601023d-LimoneneC10H16y = 1.06E+11x + 2.55E+08R2 = 0.9916127.98-6.403291.6428.02
      79.531054γ-TerpineneC10H16y = 1.50E+11x – 3.95E+07R2 = 0.994112.92-0.65354.9726.94
      89.8710711-OctanolC8H18Oy = 1.62E+11x + 6.65E+06R2 = 0.99230.40-0.043.3220.64
      910.911101LinaloolC10H18Oy = 1.37E+11x + 9.32E+08R2 = 0.990233.41-3.34561.3917.00
      1011.081105NonanalC9H18Oy = 1.61E+11x + 4.96E+06R2 = 0.99150.38-0.046.4518.43
      1113.5811681-NonanolC9H20Oy = 1.05E+11x + 3.83E+07R2 = 0.99421.38-0.1410.1021.04
      1213.9011924-TerpineolC10H18Oy = 9.17E+10x + 3.02E+08R2 = 0.990913.14-0.66370.8125.28
      1314.401202α-TerpineolC10H18Oy = 1.08E+11x + 1.66E+08R2 = 0.990819.11-1.91250.5430.68
      1414.701219Octanoic acidC8H16O2y = 2.00E+09x + 1.41E+07R2 = 0.9946--
      1516.521291(-)-CarvoneC10H14Oy = 2.07E+11x + 4.62E+07R2 = 0.9909092-0.096.1824.79
      1616.921304GeraniolC10H18Oy = 2.00E+11x + 4.34E+07R2 = 0.99011.39-0.1416.9928.71
      1718.511358ThymolC10H14Oy = 6.54E+11x + 6.06E+08R2 = 0.99227.88-0.7938.1826.40
      1818.891371CymenolC10H14Oy = 6.14E+11x + 7.10E+07R2 = 0.99160.77-0.0829.6221.95
      1919.4013402-Methoxy-4-vinylphenolC9H10O2y = 3.41E+10x + 2.15E+08R2 = 0.991131.33-3.92253.6730.06
      2021.001360Citronellyl acetateC12H22O2y = 8.53E+11x + 1.20E+07R2 = 0.99070.14-0.011.6826.58
      2121.561380n-Decanoic acidC10H20O2y = 3.55E+11x – 1.42E+07R2 = 0.99240.48-0.057.1731.25
      2222.221385Geranyl acetateC12H20O2y = 1.01E+12x + 6.69E+06R2 = 0.99060.08-0.0080.5430.38
      2323.221453Methyl methanthranilateC9H11NO2y = 1.16E+11x + 7.55E+06R2 = 0.99140.53-0.0515.2010.21
      2426.401486β-IononeC13H20Oy = 5.98E+11x + 3.47E+06R2 = 0.99940.06-0.0071.9423.68
      a: The data of concentration is mean (n = 3 for aroma water sample). b: The RSD is standard deviation (n = 3 for aroma water sample). −: Indicates no detection results.
    • The odor activity of 24 aroma-active compounds detected by GC-MS was characterized by GC-O combined with AEDA and expressed as FD dilution factor, which was used in combination with the OAV value of each aroma-active compounds to verify its contribution to the aroma-active compounds of Xinhui Chenpi[24,31,32]. As shown in Table 2, the FD dilution factors ranged from 2 to 8,192, the higher FD factors, the stronger the odor of the compounds, and the greater the contribution to the aroma of the sample. The compounds with the highest FD factors were linalool (8,192) with sweet, cymenol (8,192) with pungent and refreshing odors, 2-methoxy-4-vinylphenol (8,192) with pungent and flower odors, followed by β-ionone (4,096) with woody odor, 4-terpineol (2,048) with woody and loamy incense odors, α-terpineol (2,048) with woody and flower odors, (−)-carvone (2,048) with mint and spicy odors, geranyl acetate (2,048) with medicinal odor, n-decanoic acid (2,048) with flower odor. The aroma-active compounds of Xinhui Chenpi are mainly alcohols, olefins, esters and aldehydes, and other compounds such as ketones and phenols. Among them, alcohols and olefins accounted for the highest proportion, such as d-limonene and linalool, which mainly show the typical orange and sweet odor of Chenpi, are the most abundant compounds in Xinhui Chenpi, with FD factors of 32 and 8,192, respectively. Aldehydes also contributed to the aroma-active formation of Chenpi, such as octanal, which has a typical orange flavor with an FD factor of 512. Furfural has a nut odor, which has rarely been reported in previous studies of aroma-active compounds of Chenpi.

      Table 2.  The FD factor of aroma-active compounds.

      NoCompoundOdor description*FD**
      1FurfuralNut8
      2MyrcenePungent32
      3OctanalOrange flavor512
      4α-TerpineneWax, orange16
      5p-CymeneRefreshing8
      6d-LimoneneCitrus32
      7γ-TerpineneWoody8
      81-OctanolOily, fruity128
      9LinaloolFlowers, sweet8192
      10NonanalOily, sweet, orange8
      111-NonanolOrange scent2
      124-TerpineolWoody, loamy incense2048
      13α-TerpineolFlowers, woody2048
      14Octanoic acidFruity32
      15(−)-CarvoneMint, spicy2048
      16GeraniolRose512
      17ThymolMedicine1024
      18CymenolPungent, refreshing8192
      192-Methoxy-4-vinylphenolPungent, flowers8192
      20Citronellyl acetateFlowers16
      21n-Decanoic acidFlowers2048
      22Geranyl acetateMedicine2048
      23Methyl methanthranilateOrange, flowers1024
      24β-IononeWoody4096
      * Description of the sniffing results by the sensory evaluator (n = 3 for sensory evaluator).
      ** Maximum dilution of the aroma-active compound.

      To identify the contribution of aroma-active compounds to the aroma of Xinhui Chenpi, the OAV was calculated to verify that each compound's odor threshold was known from the literature. The literature has reported that an aroma-active compound OAV ≥ 1 indicates that the compound contributes to aroma formation[24,33,34]. As shown in Table 3, the compounds have been ranked in order of OAV from largest to smallest. Octanoic acid was not detected in the content; other than that, all 22 aroma-active compounds revealed had OAV > 1 in aroma water. The results showed that d-limonene had the highest OAV (24,027) in all compounds, followed by linalool (20,050), 2-methoxy-4-vinylphenol (13,351), geraniol (1,699), thymol (382), octanal (342), α-terpineol (291), β-ionone (231). The above results show that the most important aroma-active compounds were d-limonene and linalool in Chenpi. Notably, although the contents of geraniol (16.99 mg/kg) and β-ionone (1.94 mg/kg) were not very high, their OAVs were the highest, because the thresholds were low (0.01 and 0.0084 mg/kg).

      Table 3.  The results of OAVs calculation of aroma-active compounds.

      NoCompoundConcentration
      (mg/kg)
      Odor threshold in
      water (mg/kg)
      OAV
      6d-Limonene3291.640.14b24026.58
      9Linalool561.390.03a20049.61
      192-Methoxy-4-vinylphenol253.670.02b13351.10
      16Geraniol16.990.01a1699.27
      17Thymol38.180.10b381.80
      3Octanal78.710.23b342.23
      13α-Terpineol250.540.86b291.32
      24β-Ionone1.940.01c231.49
      18Cymenol29.620.18b164.56
      81-Octanol3.320.02b144.30
      15(-)-Carvone6.180.07a92.26
      1Furfural274.803.00c91.60
      10Nonanal6.450.10a64.50
      124-Terpineol370.816.40a57.94
      21n-Decanoic acid7.170.13b55.19
      23Methyl methanthranilate15.200.35b43.54
      2Myrcene21.190.67a31.63
      111-Nonanol10.101.00a10.10
      7γ-Terpinene354.9755.00c6.45
      22Geranyl acetate0.540.15a3.60
      5p-Cymene12.857.20b1.78
      20Citronellyl acetate1.681.00b1.68
      4α-Terpinene3.472.40b1.45
      14Octanoic acid0.86b
      Odor thresholds in water found in the literature. a: Indicates reference[18]. b: Indicates reference[35]. c: Indicates reference[21]. −: Indicates no detection.
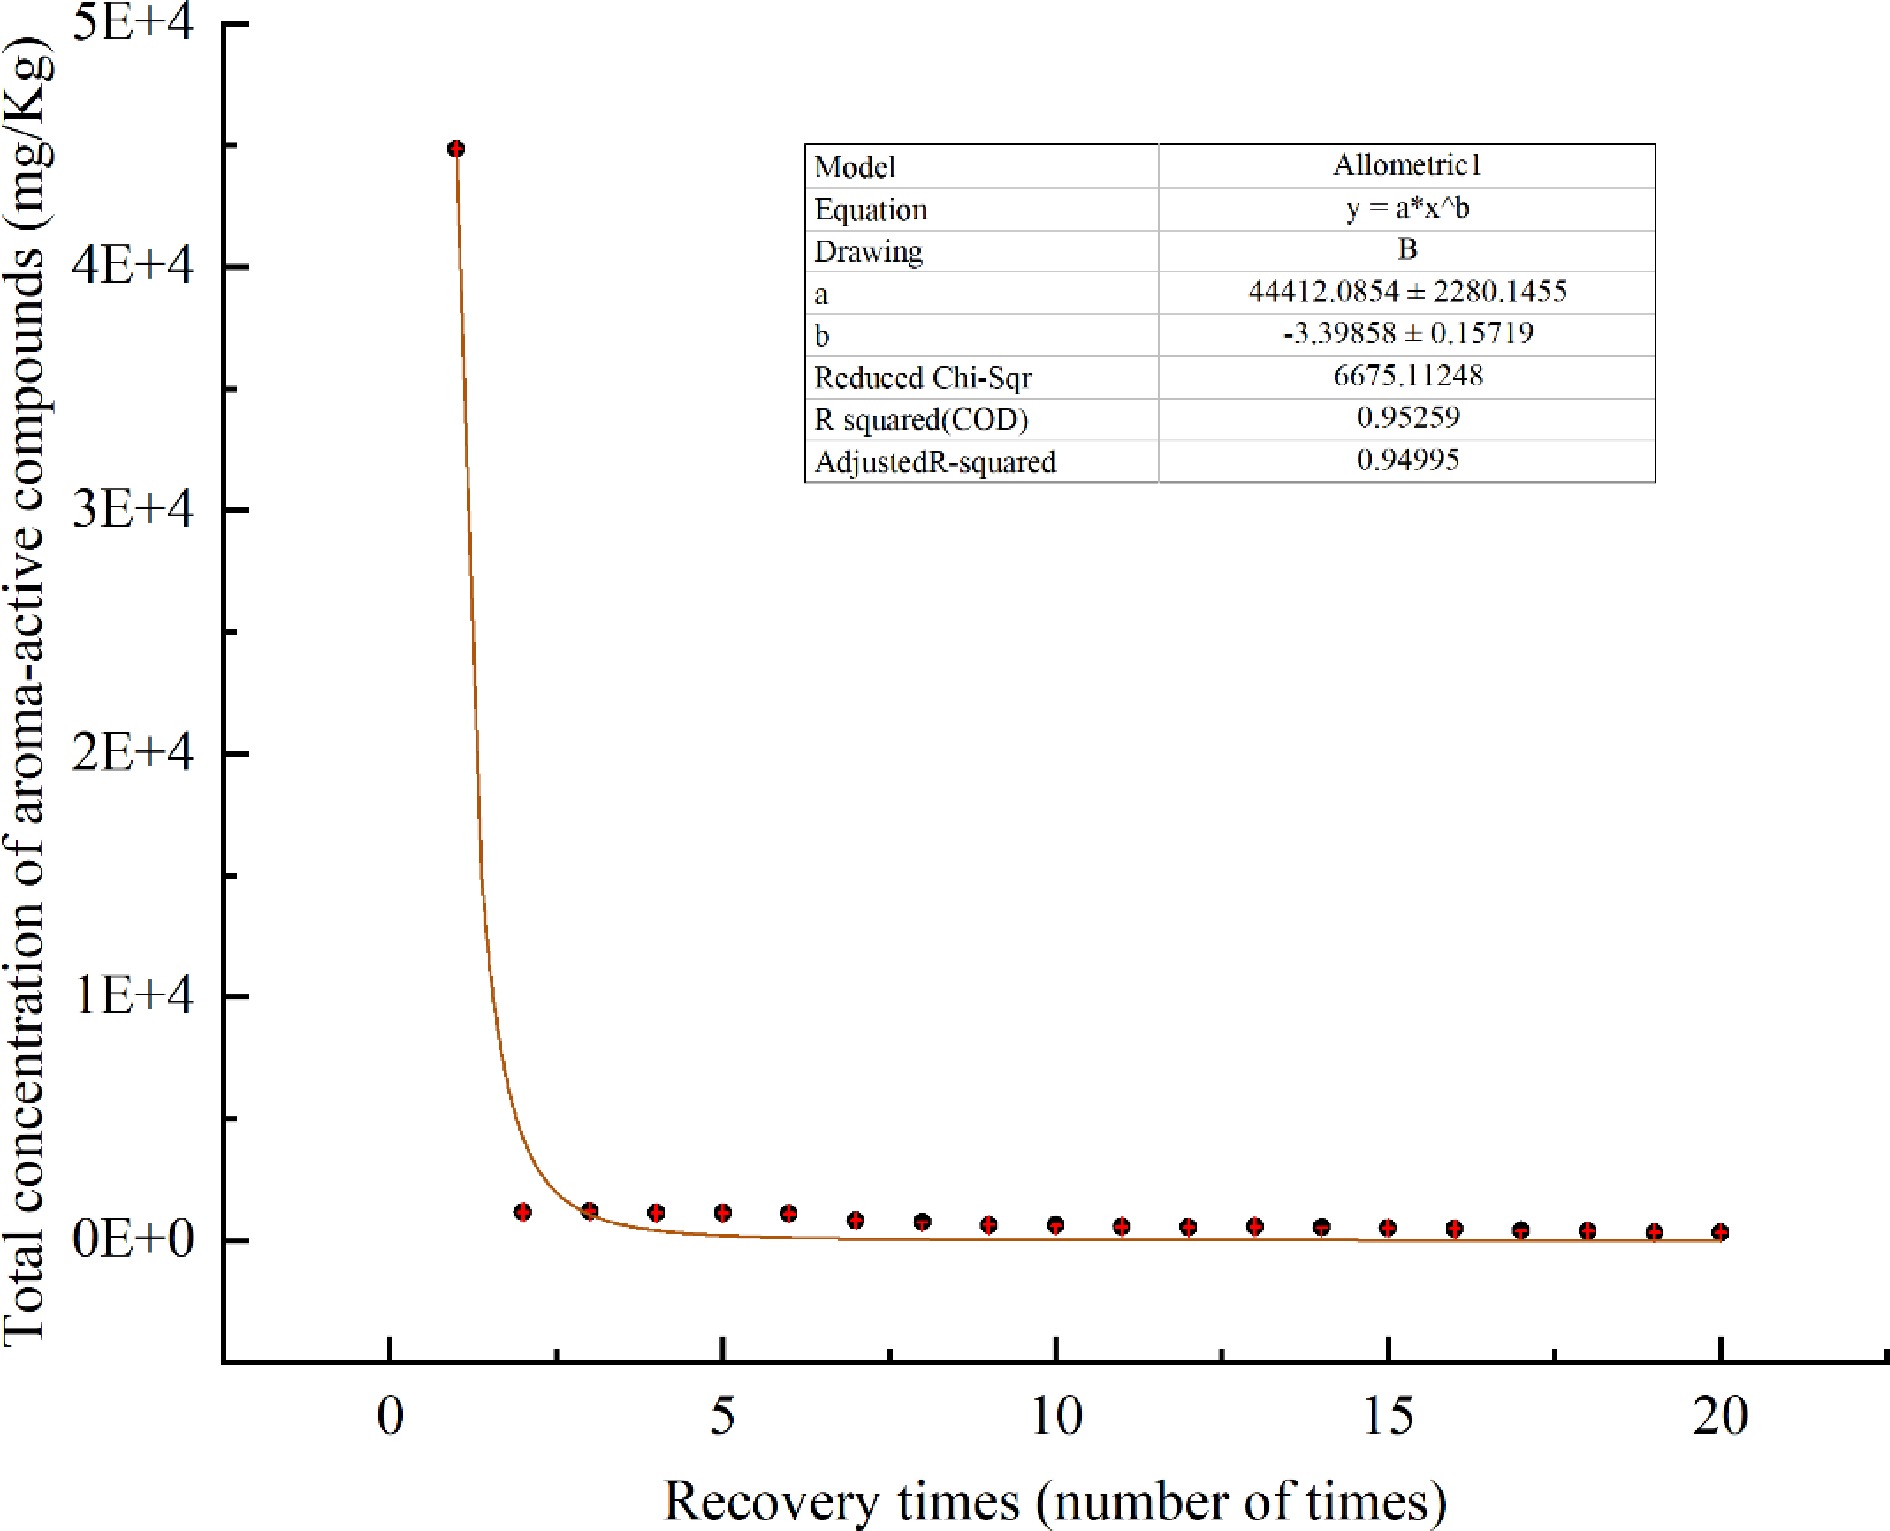
    • The changes of 24 aroma-active compounds with heating time when samples were heated to enrich the aroma-active compounds were averaged over three replicate values. As shown in Table 4 and Fig. 4, a decreasing pattern was seen, with a sharp decrease after the 1st time, and a slight increase from the 2nd to the 3rd time, followed by a slight decrease.

      Table 4.  Changes in the concentration of aroma-active compounds of Chenpi with extraction time.

      Time (min)CompoundConcentration (mg/Kg)
      1234567891011121314151617181920
      4.12Furfural4.072.462.492.482.592.692.712.702.532.412.242.322.632.582.542.662.702.612.512.21
      7.42Myrcene1053.510.370.250.220.310.400.190.510.200.370.350.391.090.440.850.691.200.770.770.98
      7.74Octanal69.184.196.485.876.805.306.975.645.255.565.535.086.294.985.104.965.897.615.994.75
      8.19α-Terpinene114.060.560.590.360.520.510.440.560.500.520.560.420.750.590.780.721.100.970.881.11
      8.44p-Cymene53.161.181.180.891.241.180.881.380.821.161.171.171.341.340.721.711.581.411.331.97
      8.60d-Limonene36762.6620.3020.3321.2420.2921.3218.2344.9220.0032.1830.1533.8045.8236.9142.0830.5020.7921.7929.8426.29
      9.53γ-Terpinene3591.331.631.521.721.811.611.593.731.782.802.763.124.003.053.774.133.674.073.653.33
      9.871-Octanol20.452.862.861.721.871.811.421.081.171.020.881.110.750.580.470.390.450.550.42-
      10.91Linalool1080.19396.41408.52350.55346.02352.47270.33240.68232.30211.12194.25173.38180.08161.11140.28138.62121.05112.0861.1259.41
      11.08Nonanal58.693.083.303.003.723.613.492.962.913.433.593.293.563.283.503.563.543.343.043.39
      13.581-Nonanol16.307.727.627.316.966.806.625.514.713.903.233.293.283.233.293.362.983.002.972.79
      13.904-Terpineol498.61147.36144.59136.17133.69123.46117.43108.56112.45110.63104.22104.54103.89103.29102.11106.1089.2784.6550.5679.04
      14.40α-Terpineol394.39134.60127.01114.39113.81100.9979.6168.7970.1967.8461.1756.7056.0356.1255.6255.0043.9041.6241.0140.69
      14.70Octanoic acid4.284.11
      16.52(−)-Carvone30.1115.9014.4113.3211.479.656.815.314.924.143.342.862.872.101.841.551.040.980.910.78
      16.92Geraniol24.1618.2617.6715.0914.8513.2410.377.848.167.786.635.705.605.284.824.953.853.432.842.66
      18.51Thymol207.17187.75184.75180.91168.43134.25103.7586.0483.9574.1057.6454.9951.6047.0840.0638.6728.1923.1318.9317.40
      18.89Cymenol72.98152.32175.42189.58198.40198.78116.7182.0820.8720.1520.0120.9321.0327.2430.9424.918.897.4914.3213.62
      19.402-Methoxy-4-vinylphenol22.9723.2131.7062.0368.2271.4954.0653.2151.4550.4650.3450.1049.7248.8548.5349.5449.7044.4344.7239.54
      21.00Citronellyl acetate21.935.325.305.205.555.263.653.401.731.521.481.411.731.671.481.441.561.461.862.09
      21.56n-Decanoic acid12.0514.5214.5215.4516.5812.0510.008.037.427.317.737.307.335.275.735.615.115.725.50
      22.22Geranyl acetate7.131.121.161.291.161.291.201.181.181.161.161.151.161.041.161.171.091.091.181.13
      23.22Methyl methanthranilate5.126.935.655.024.894.844.823.102.822.522.161.981.681.541.491.431.050.890.73
      26.40β-Ionone7.726.955.234.884.883.823.213.022.852.622.362.232.061.841.721.661.461.090.990.99
      Total concentration44839.781155.541187.931138.381132.861081.40826.57743.90641.10615.12562.88537.87554.55521.93498.49483.52400.94373.74326.45310.42
      - indicates no detection.

      Figure 4. 

      Changes of total concentration of aroma-active components in Chenpi with heating time.

      As shown in Table 4, the nine compounds including furfural, myrcene, octanal, α-terpinene, p-cymene, d-limonene, γ-terpinene, nonanal, and geranyl acetate showed a pattern of rapidly decreasing to a minimum and then being continuously maintained; the 10 compounds including 1-octanol, linalool, 1-nonanol, 4-terpineol, α-terpineol, (−)-carvone, geraniol, thymol, citronellyl acetate, β-ionone showed a gradually decreasing pattern; cymenol, 2-methoxy-4-vinylphenol, n-decanoic acid, and methyl methanthranilate showed a pattern of increasing first, reaching a maximum value, and then gradually decreasing; octanoic acid was detected only in the 2nd and 3rd times.

      The alcohols and ketones in the aroma-active compounds of Xinhui Chenpi mainly showed a gradually decreasing pattern. For example, among the alcohols, linalool (1,080.19 mg/kg), 4-terpineol (498.61 mg/kg), α-terpineol (394.39 mg/kg) are of the highest proportion, linalool decreased from 1,080.19 mg/kg to 59.41 mg/kg; 4-terpineol decreased from 498.61 mg/kg to 79.04 mg/kg; α-terpineol decreased from 394.39 mg/kg to 40.69 mg/kg. This indicates that the alcoholic compounds of Xinhui Chenpi are persistent in aroma and slow in release.

      The olefins and aldehydes mainly showed a pattern of rapidly decreasing at the lowest level and then being continuously maintained. Among the olefins, d-limonene (36,762.66 mg/kg), γ-terpinene (3,591.33 mg/kg), myrcene (1,053.51 mg/kg) and α-terpinene (114.06 mg/kg) are of the highest proportion, and d-limonene decreased from 36,762.66 mg/kg to 20.30 mg/kg in the 2nd and maintained since then; The γ-terpinene decreased from 3,591.33 mg/kg to 1.63 mg/kg in the 2nd and maintained since then; Myrcene decreased from 1,053.51 mg/kg to 0.37 mg/kg in the 2nd and maintained since then; α-terpinene decreased from 114.06 mg/kg to 0.56 mg/kg in the 2nd and maintained at a consequent level after that. It indicates that the olefins of Xinhui Chenpi are easily soluble and released extremely fast.

      Other compounds, such as thymol gradually decreased from 207.17 mg/kg to 17.40 mg/kg; cymenol gradually increased from the initial 72.98 mg/kg, reaching a maximum value of 198.78 mg/kg at the 6th pass, and then started to decrease to 13.62 mg/kg; 2-methoxy-4-vinylphenol gradually increased from the initial 22.97 mg/kg to a maximum of 71.49 mg/kg at the 6th time and then started to decline to 39.54 mg/kg. This indicates that the aroma was persistent and remained in the release phase during the heating extraction.

      Furfural differed from the other substances, with a small amount of 4.07 mg/kg initially, which decreased to 2.46 mg/kg in the 2nd and then continued to be maintained, indicating that Furfural is more difficult to volatilize than the other substances.

    • Aroma water obtained by heating and enrichment has obvious advantages. The aroma water of Xinhui Chenpi was comprehensively analyzed using the methods of GC-MS, GC-O and AEDA. It was concluded that linalool, d-limonene, 2-methoxy-4-vinylphenol, and α-terpineol were the four aroma-active compounds with high content and high contribution to the aroma formation, which were identified as the essential aroma substances of Xinhui Chenpi, and mainly presenting orange, sweet, spicy, woody and floral aromas. The heat release pattern was studied, and the results showed that the content of the aroma-active compounds generally showed a decreasing pattern with the heating time in the process of heating enrichment. In particular, the overall content decreased sharply after the 1st time, and it was speculated that this occurred because the Chenpi samples were soaked in heated water before being enriched by heating and distillation. However, this conclusion needs to be further verified. Although the overall content changed significantly after the 1st time, and combined with the respective emission pattern of 24 aroma-active compounds, it is difficult to volatilize all the aroma-active compounds in a short time, so this experiment recommends that the first 10 times of aroma water can be collected to achieve a shorter time and enrichment of the most aroma-active compounds.

      • This work was supported by Youth Top Talents Project in Tianjin Special Support Program, the Science and technology Project of Tianjin (Grant No. 21ZYCGSN00410), and the Science and technology Project of Tianjin (Grant No. 21YDTPJC00910). This work was supported by the National Natural Science Foundation of China [32102004]; the Project funded by China Postdoctoral Science Foundation [2021M701169, 2022T150206], the China Agriculture Research System of MOF and MARA; the Construction of World Big-leaf Tea Technology Innovation Center and Industrialization of Achievements [202102AE090038]; and the Scientific and Technological Talents and Platform Plan (Academician Expert Workstation) [202104AC100001-B01].

      • The authors declare that they have no conflict of interest.

      • Copyright: © 2023 by the author(s). Published by Maximum Academic Press, Fayetteville, GA. This article is an open access article distributed under Creative Commons Attribution License (CC BY 4.0), visit https://creativecommons.org/licenses/by/4.0/.
    Figure (4)  Table (4) References (35)
  • About this article
    Cite this article
    Yang D, Wu X, Shi H, Zhang J, Wang C. 2022. Essential aroma substances and release pattern of Xinhui Chenpi. Beverage Plant Research 2:22 doi: 10.48130/BPR-2022-0022
    Yang D, Wu X, Shi H, Zhang J, Wang C. 2022. Essential aroma substances and release pattern of Xinhui Chenpi. Beverage Plant Research 2:22 doi: 10.48130/BPR-2022-0022

Catalog

  • About this article

/

DownLoad:  Full-Size Img  PowerPoint
Return
Return