


-
Lilium spp., the perennial plant belonging to the family Liliaceaeas, is a cherished ingredient with the homology of medicine and food. L. davidii var. unicolor is famous for its delightful sweet taste[1]. The bulbs, the main edible portion of lily, are frequently consumed for their health-promoting properties. Lily bulbs have been reported as a rich resource of nutrients containing amino acids, dietary fiber, proteins, and so on. They are rich in bioactive phytochemicals as well, such as polyphenolics, polysaccharides, and steroid alkaloids[2].
However, fresh lily bulbs are perishable and difficult to supply all year round due to the harvest season restrictions[3]. Drying technologies, including hot air drying (HD), vacuum freeze drying (FD), microwave drying (MD), far infrared drying and so on, have been long utilized as the vital processing technique to dehydrate fresh lily bulbs for long-term preservation. Up to now, the effects of different drying technologies on the characteristics of lily bulbs have been reported from the perspective of physicochemical properties such as texture, viscosity, drying kinetics, rehydration performance[4], specific phytochemicals (regaloside, chlorogenic acid p-coumaric acid, and so on), antioxidant, and antiproliferative activity[5,6]. Zhang et al. studied the influences on the rehydration, spatial structure, and physiochemical properties of lily starch with HD, FD, and MD[4]. Quan et al. explored the color, phytochemicals, antioxidant activities, antiproliferation, and cytotoxicity of dried lily bulbs after MD combined with HD, and the content of regaloside A, regaloside B, regaloside C, regaloside E, chlorogenic acid, and p-coumaric acid was determined by HPLC-DAD[5].
With the advancement of omics techniques, metabolomic analysis has been applied to study the impact of processing technologies on the phytochemical profiles of foods, especially fruits and vegetables[7]. Lou et al. assessed the variation of chemical composition of Lithocarpus with different processing methods using GC-MS and LC-MS[8]. Wang et al. identified 15 differential markers between freshly squeezed and pasteurized orange juices based on metabolomics using LC-QTOF[9]. To our knowledge, several studies have sprung up to differentiate phytochemicals of lily bulbs from varieties using metabolomic techniques[10,11]. Chiang et al. analyzed the profile of volatile constituents of raw and roasted lily bulbs using GC-MS and found the odorants decreased during the roasting process accompanied by the formation of new odorants[12]. Besides, Zhang et al. also studied the dried lily bulbs from the perspective of volatile compounds and activities processed by HD and FD using GC-MS, identified 110 volatile compounds and the most abundant differential compounds (hexanal, 2-hexenal, and (E)-2-nonenal)[6]. As far as we know, limited studies have investigated the drying processing of lily bulbs using LC-MS-based omics tools.
This study was conducted to compare the appearance properties and phytochemicals profiles of dried lily bulbs processed by three technologies (HD, FD and MD) using UHPLC-QTOF-MS-based untargeted metabolomics. The principal component analysis (PCA) model was performed to distinguish different methods, subsequently, the markers were annotated and discussed. The selected marker was verified and quantified using ultra-performance liquid chromatography-triple quadrupole mass spectrometry (UPLC-QQQ-MS) with reference standard.
-
Methanol was purchased from Merck KGaA (Darmstadt, Germany) and acetonitrile was sourced from Thermo Fisher Scientific (Massachusetts, USA), the standard of eleutheroside E was procured from Yuanye Bio-Technology Co., Ltd (Shanghai, China), and formic acid was purchased from DiKMA Technologies (Beijing, China). Distilled water was purchased from Watsons (Guangzhou, China).
Lily bulb samples and drying procedures
-
The triennial lily bulbs (L. davidii var. unicolor), derived from the same local orchard in Qilihe District, Lanzhou City, Gansu Province, were harvested in October 2021 and selected for the drying process. All samples were preserved in a 4 °C chamber with a relatively humidity of 65%, and processed within 5 d. The parameters of the drying procedure were determined based on the results of a preliminary experiment (data not shown). The 20 g lily bulbs were weighed and spread on a glass petri dish in a single layer for drying by HD, MD, and FD. During HD, the samples were placed in a 60 °C electric thermal dryer and dried for approximately 22 h. For MD, samples were put into a microwave oven (MO-2270M1, Haier Microwave Products Co., Ltd, Qingdao, China) operated for 10 min at a microwave power density of 20 W/g. The FD group was carried out in a vacuum drying oven (LYO-3, Beijing Boyikang experimental instrument Co., Ltd, Beijing, China). After pre-freezing treatment, the samples were dried in 12−14 Pa at −50 °C for 12 h. The endpoint of processing was determined by the moisture contents of final products (below 12%) according to group standard for dried bulbs of L. davidii var. unicolor (T/GSWS 002—2022). Each drying technology was carried out in six replicates.
Appearance properties
-
Color measurements were performed using a high-quality colorimeter (3nh NR60CP, Shenzhen 3NH Technology Co., Ltd., Shenzhen, China), and the CIE color parameters including L*, a*, and b* were recorded. The difference of L*, a*, and b* between dried and fresh samples was recorded as ΔL*, Δa*, and Δb*. The color difference (ΔE) compared with fresh samples was calculated using Eqn (1)[9]. Meanwhile, the appearance and color of both dried and fresh samples were documented through photographs.
$ \Delta E=\sqrt{(\Delta L^{\mathrm{*}})^2+(\Delta a^{\mathrm{*}})^2+(\Delta b^{\mathrm{*}})^2} $ (1) Phytochemical profiles
Phytochemicals extraction
-
Dried lily bulbs were frozen in liquid nitrogen and ground into powder. Referring to the previous study with some modifications[13], the 200 mg sample was placed in a 1.5 mL centrifuge tube. Then, 600 μL cold methanol with 0.125% formic acid was added, followed by vertexing for 15 s, and the samples were ultrasound-treated at 20 °C for 15 min, subsequently centrifuged at 4 °C and 12,000 r/min for 10 min. The supernatant was filtered through a 0.22 μm filter before analysis. The quality control (QC) sample comprised 5 μL of every individual sample.
Data acquisition
-
The acquisition was performed using a UHPLC system and Triple TOF 6600 mass spectrometry equipment (AB-SCIEX, Redwood City, CA, USA) according to a previous study[14]. Preliminary separation was operated by the reversed-phase chromatography Acquity UPLC HSS T3 (1.8 μm, 2.1 mm × 100 mm, Waters, MA, USA) with a flow rate of 0.4 mL/min and injection volume of 2 μL. The autosampler was kept at 4 °C, and the column was kept at 40 °C. Mobile phases comprised of 0.2% formic acid aqueous solution (A) and acetonitrile (B). The solvent gradient samples were eluted was: 0−11.50 min, 5%-30% B; 11.50−11.51 min, 30%−100% B; 11.51−15.00 min, 100% B; 15.00−15.01 min, 100%−5% B; and 15.01−18.00 min, 5% B.
The MS data was captured in both positive and negative ion modes using the information-dependent acquisition (IDA) mode. The scan m/z range was set as 50−1,000 Da. The cycle time of IDA-MS was 545 ms, comprising 50 ms of a TOF MS scan and 30 ms of product ion scans. The collision energy (CE) of MS was 10 eV/−10 eV. The CE and collision energy spread (CES) of MS/MS was 35 eV/−35 eV, and 15 eV, respectively. QC was used to monitor the reproducibility of each analytical run.
Data treatment and differential phytochemicals selection
-
The converted ABF files were imported to MS-DIAL for noise filtration, peak detection, alignment, and identification. In peak detection, the minimum peak height was 1,000 amplitudes, and the tolerance for retention time and MS1 were 0.1 min and 0.015 Da. During alignment, the tolerance for MS1 and MS2 of data collection were set to 0.01 and 0.025 Da, respectively. The accurate mass MS1 and MS2 tolerance of identification were set to 0.01 and 0.05 Da. Features were removed based on the ratio of maximum in the samples and mean in the blank samples at least five times. According to the exported list of peak area, the features with relative standard deviation (RSD) of QC greater than 30% and detection rate (DR) lower than 80% were removed. Subsequently, the features were selected based on the quality of MS2, average area, and DR, and those with missing MS2 data, and DR lower than 80% in each drying technology were eliminated. Then, the fold change (FC) and the student's t-test were performed using Excel 2019 (Microsoft Corporation, USA).
Based on the retention time, accurate mass, isotope ratios, and the spectrum of MS2, the phytochemicals were annotated by matching with online databases. PCA and correlation heatmaps were conducted using the online platform MetaboAnalyst 5.0[15]. The compounds with an absolute value of FC greater than 1.5 and a p-value (t-test) lower than 0.05 were identified as potential differential markers.
The selected marker verification
-
The extraction of eleutheroside E was adapted from previous published study slightly[16]. The 200 mg dried lily bulb sample was extracted with 1 mL 50% ethanol solution, subsequently ultrasonic extraction was carried out at 40 °C for 30 min, centrifugation at 4 °C, and 10,000 r/min for 15 min. The supernatant was collected and filtered through a 0.22 μm syringe filter before analysis.
The quantitative analysis of eleutheroside E was conducted using UPLC-QQQ-MS and the external standard method. The UPLC condition was consistent with untargeted metabolomics analysis (2.4.2). The condition of QQQ-MS was optimized using reference standards. Eight different concentration (1, 2, 5, 10, 20, 50, 100, and 200 μg/L) standards of each analyte were run separately. Multiple reaction monitoring (MRM) mode and operated in negative mode (m/z 787.2, with subsequent determination of daughter ions at m/z 1579.3 and 741.3). The optimized CE was −22/−16 V. The optimized DP was −70/−73 V. The injection volume was 2 μL.
-
Appearance is a critical quality parameter influencing consumer acceptance and market value of dried products. Fig. 1 shows the appearance of fresh and dried lily bulbs with three different drying technologies. The FD samples were white and had scarcely any shrinkage in volume compared to fresh samples. For HD and MD samples, the appearance presented varying degrees of brownish-yellow coloration and shrinkage. The color attributes are evaluated in terms of the value of L*, a*, b*, and ΔE, the highest L* and the lowest ΔE are considered to be the benchmarks for the color quality of food[17]. As shown in Table 1, in agreement with the above morphology results, an increase of 9.67% in L* was observed in FD samples, while decreases of 35.95% and 15.09% occurred in HD and MD samples compared to fresh ones. Meanwhile, the highest ΔE was observed in HD samples (26.79 ± 1.75), which was significantly higher than that of MD (14.00 ± 1.35) and FD samples (7.39 ± 1.05), indicating that HD samples bore the worst deterioration in quality.
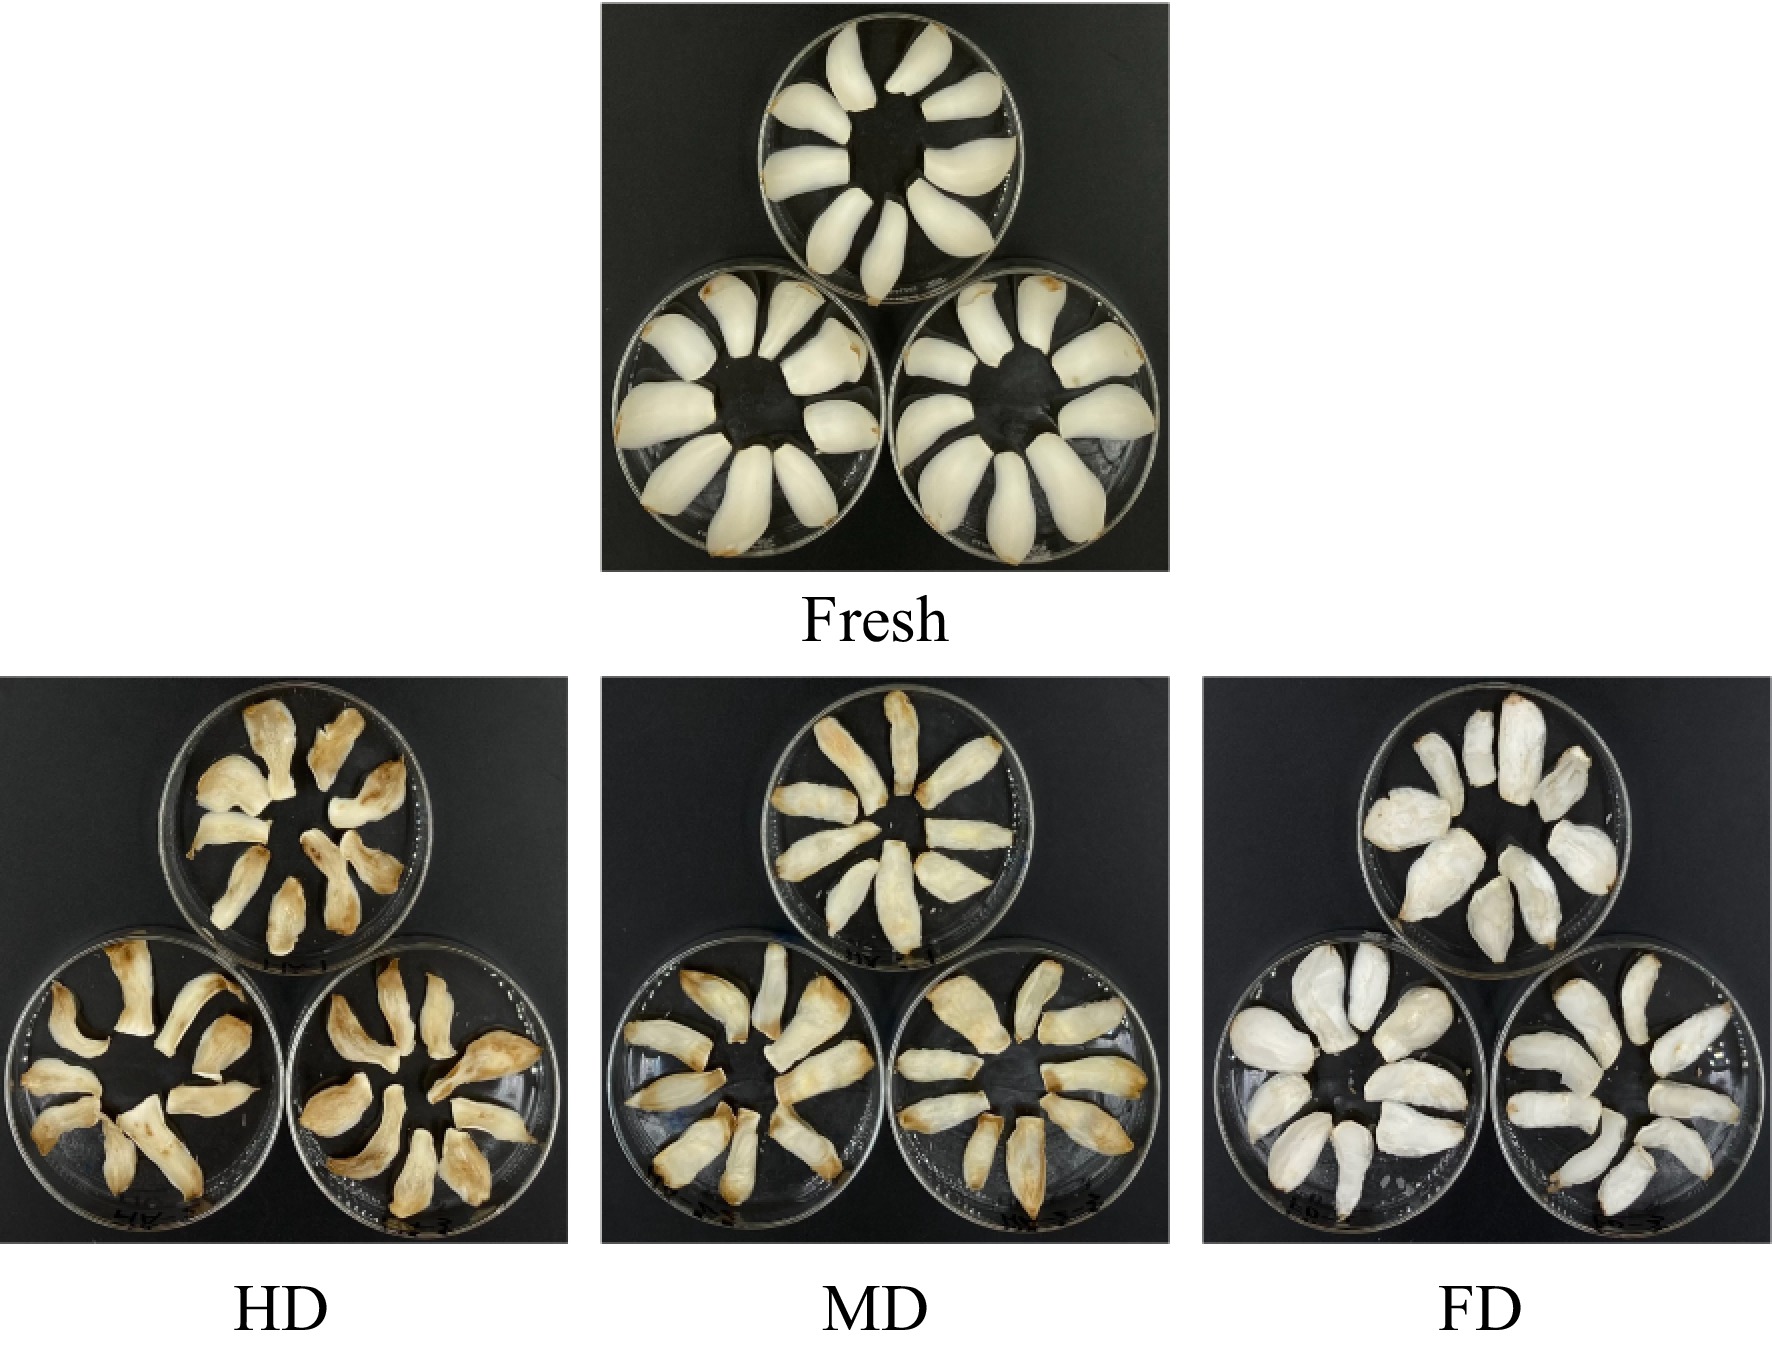
Figure 1.
The appearance of dried bulbs processed by different drying methods.
Table 1. The color index of dried bulbs processed by different drying methods.
Drying
methodsΔL* Δa* Δb* ΔE HD −23.60 ± 2.37c 4.06 ± 0.77a 11.69 ± 2.15a 26.79 ± 1.75a FD 6.22 ± 1.57a 0.48 ± 0.10c 3.75 ± 0.73b 7.39 ± 1.05c MD −9.58 ± 1.92b 2.71 ± 0.32b 9.55 ± 1.71a 14.00 ± 1.35b ΔL*, Δa*, and Δb* represent the difference between dried bulbs and fresh samples. Values followed by lowercase letters indicate the significant difference at the 0.05 level in the same column. The browning during drying is mainly related to enzymatic and Maillard reaction[18]. In addition, the oxygen-free environment inhibited the occurrence of enzymatic browning to maintain the appearance of FD samples[19]. Additionally, the threshold activation energy of non-enzymatic browning kinetics was higher than that of HD, reducing the Maillard reaction[20]. Higher temperature aggravated the occurrence of Maillard reaction resulting in non-enzymatic browning in both MD and HD samples. Besides, polyphenol oxidase (PPO) and peroxidase (POD) in lily bulbs can maintain activity at the initial stage[21], and promote the enzymatic browning of polyphenol substrates in fresh bulbs in HD samples.
The shrinkage after drying was mainly caused by shrinkage stress[22] and internal thermal stress[23]. During the FD process, due to the principle of ice crystal sublimation and low temperature, the shrinkage stress and thermal stress do not generate. In the HD process, the sample's surface temperature is greater than the internal temperature due to uneven heat conduction, leading to the rapid diffusion of external water and difficulty in the escape of internal water[23,24]. Therefore, the shrinkage stress and internal thermal stress easily result in the shrinkage phenomenon. While in the MD group, polar molecules, such as water molecules, move with the change of external electromagnetic field, and generate heat energy by friction and collision with each other at the same speed as the microwave frequency, so the inside of the material heats up rapidly in a short time[25]. Too fast mass transport by microwave may cause a 'puffing' influence[26], thus exhibiting little expansion, and the shrinkage was less than HD samples due to shorter time.
Phytochemicals profiles
-
The total ion chromatograms of the QC and PCA score plot of samples showed that the untargeted data acquisition was stable enough for further analysis (Supplemental Fig. S1). The UHPLC-QTOF-MS data contained 3383 features in positive mode and 2158 features in negative mode. As illustrated in Fig. 2a and Supplemental Fig. S2a, in positive mode, there were 2,311 features detected in HD, 1,772 features in MD, and 1,611 features in FD. In negative mode, there were 2,060 features detected in HD, 1,788 features in MD, and 1,726 features in FD. Compared with HD, the detected features of MD decreased by 25.5% and 13.2%, and the detected features of FD decreased by 30.3% and 16.2%, in positive and negative modes respectively, indicating that HD may contain more components, possibly resulting from the destruction of components and/or the creation of intermediates. Among them, 1,718 features were shared between HD and MD, 1,569 features were shared between HD and FD, and 1,455 features were shared between MD and FD. The influence of different drying technologies on compounds was explored by comparing them in pairs.
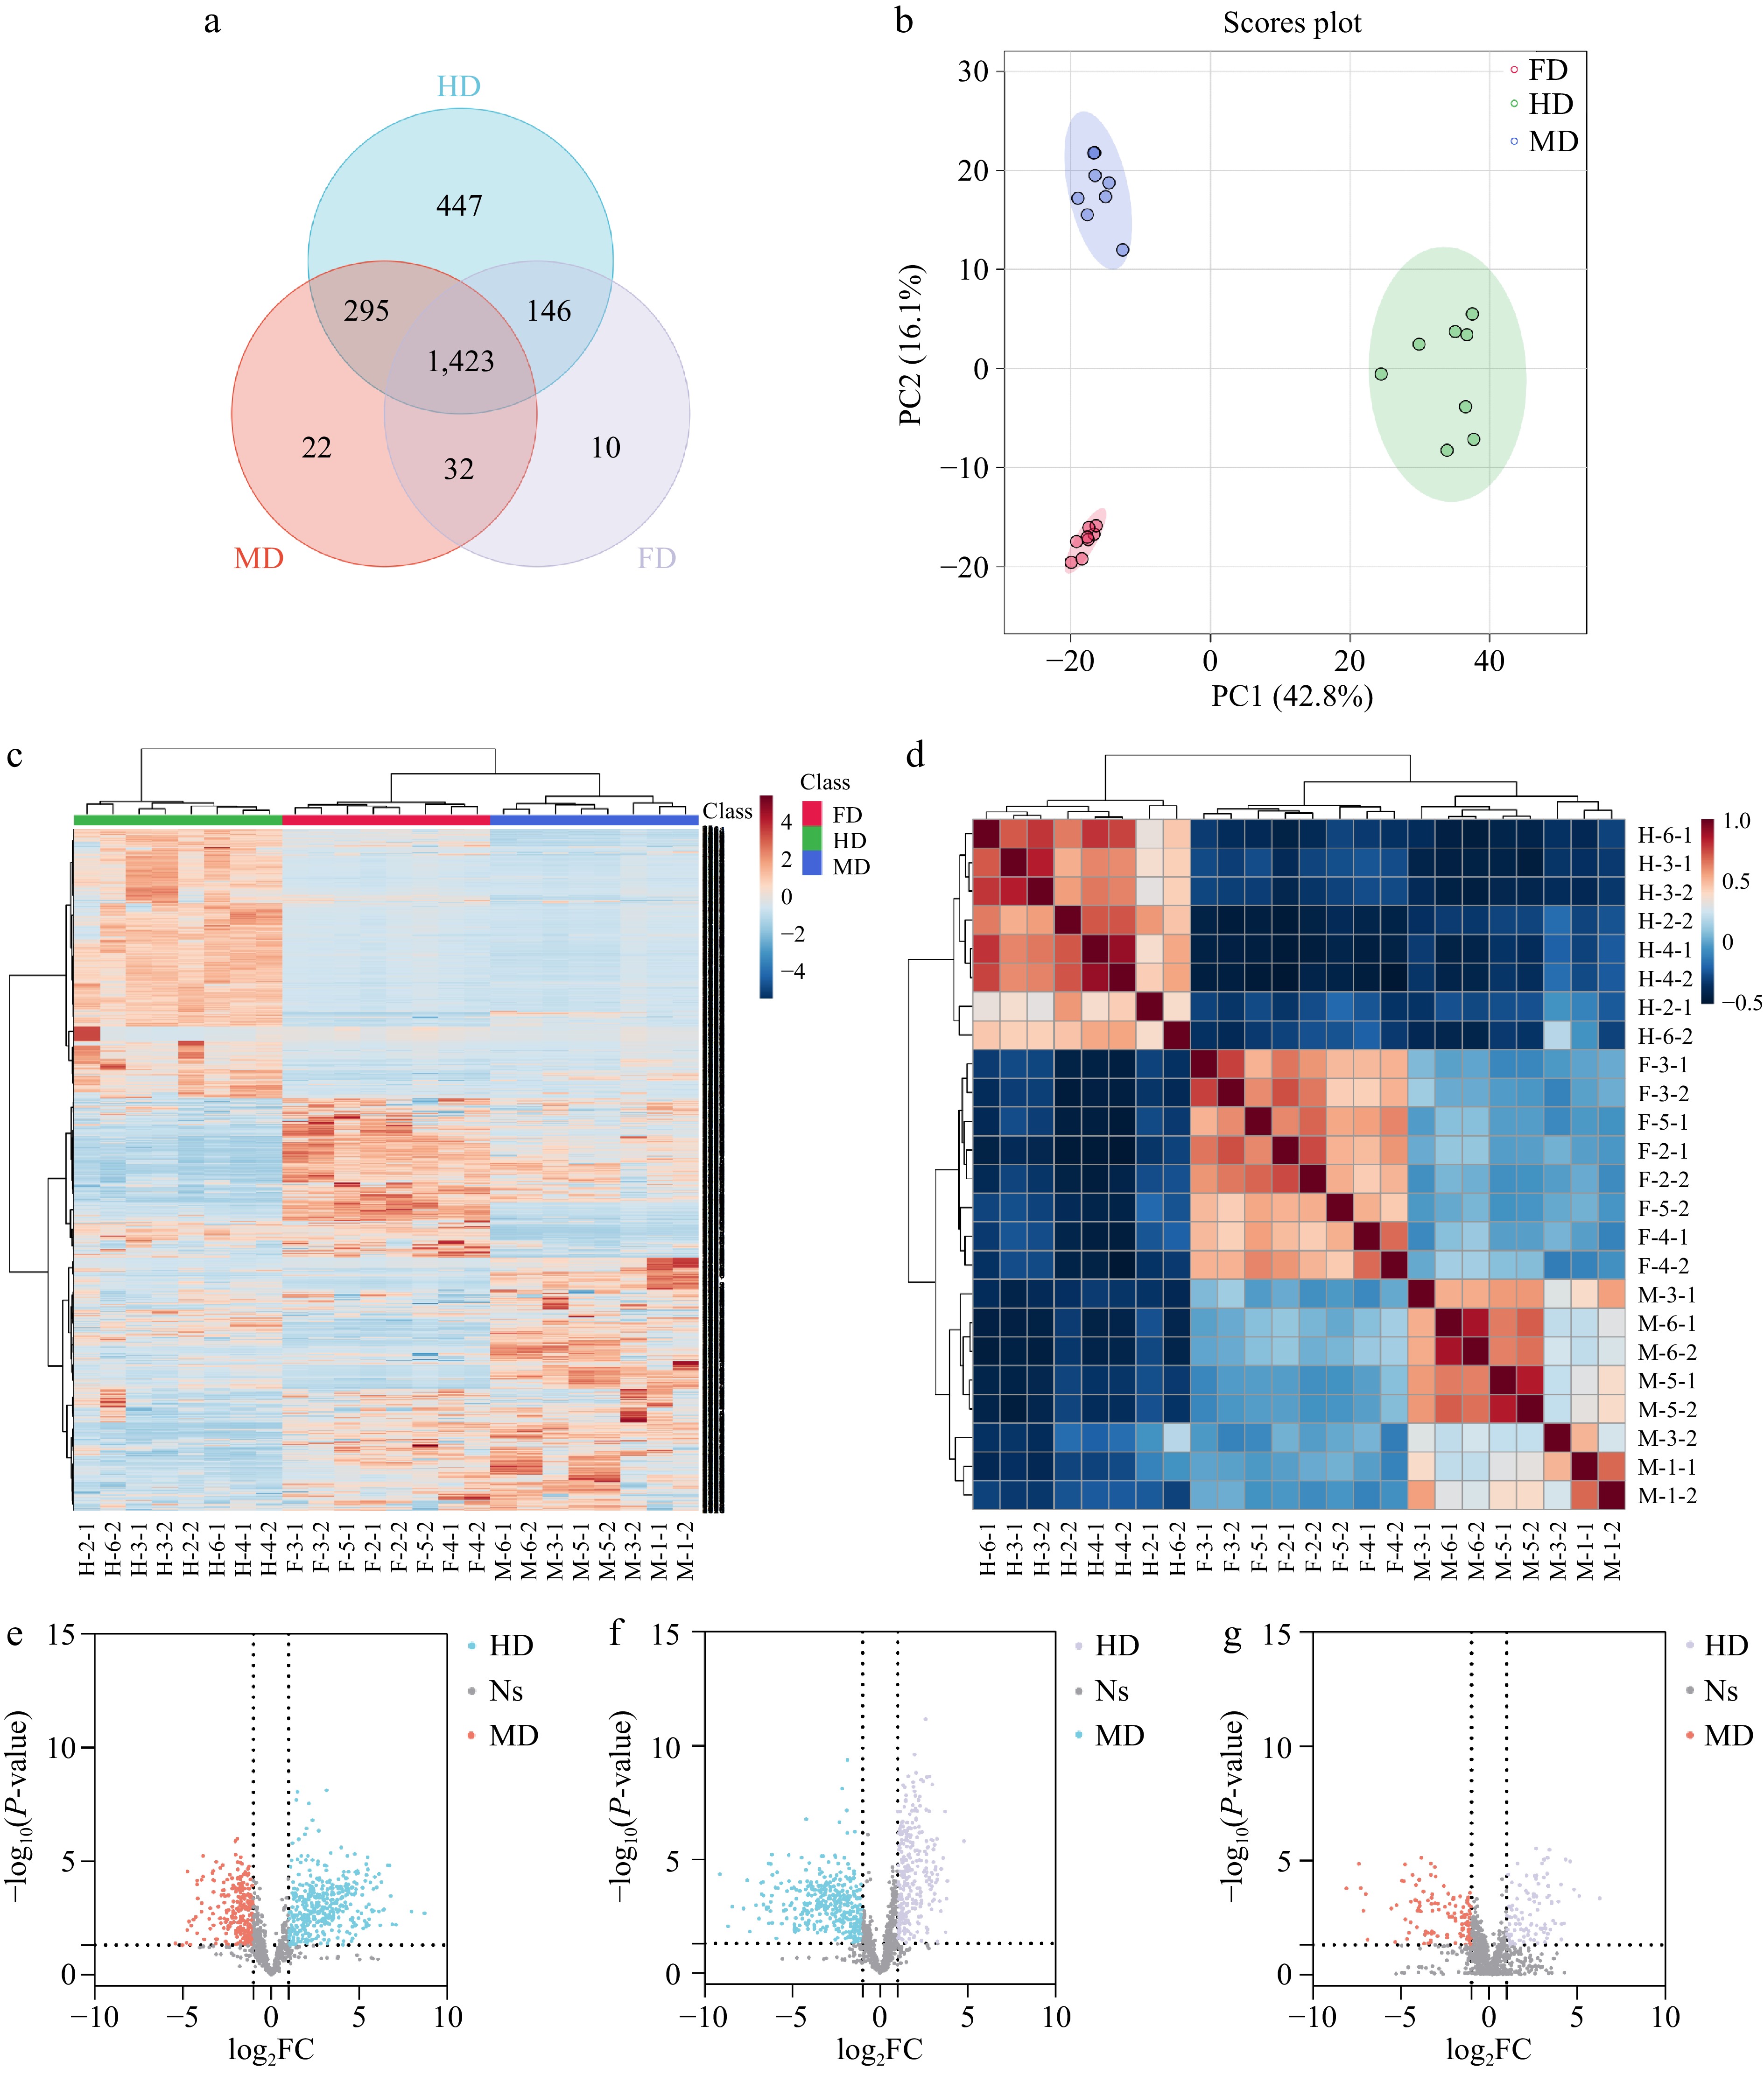
Figure 2.
Differentiation of different dried lily bulbs in positive mode. (a) Venn plot. (b) PCA scores plot. (c) heatmap. (d) Pearson correlation. (e), (f) Volcano plot of features in dried bulbs processed by different drying methods: HD & MD, FD & HD, FD & MD.
In the PCA scores plot, the PC1 and PC2 accounted for 42.8% and 16.1% of the total variance in positive mode, and 38.4% and 13.5% in negative mode (Fig. 2b & Supplemental Fig. S2b). The sum of the variations explained by PC1 and PC2 was more than 50%, indicating the significant variations. The heatmap illustrated the similarity among replicate samples and differences between different drying methods (Fig. 2c & Supplemental Fig. S2c). Similarly, Pearson correlation analysis showed good uniformity among samples within each group (Fig. 2d & Supplemental Fig. S2d).
Differential compounds of drying processing
-
After the feature screening and multivariate analysis, 690 features were determined as a differential between HD and FD, 714 features between HD and MD, and 227 features between FD and MD (Fig. 2e−g). Due to the complexity of the spectrum and incomplete phytochemical database, 127 compounds were potentially identified between HD and FD, 89 compounds between HD and MD, and 67 compounds between FD and MD. Special attention was paid to the features whose MS2 spectra matched well with the databases, i.e., the total score and dot product score both were higher than 80. Compounds that were higher in each group compared with others were considered as markers, the detailed information of markers are listed in Table 2. In total, 19 potential markers were identified. The markers of HD included seven amino acids and peptides, two phenolic acids and one natural vitamin. Eight compounds were considered as markers of FD, which included one amino acid, one coumarin, one phenolic acid, and five kinds of free fatty acids. A triterpenoid saponin, eleutheroside E was annotated as the marker of MD.
Table 2. Tentative markers in dried lily bulbs processed by different methods.
No Compounds Classification m/z Ionization model Retention
time (min)Formula Error
(ppm)HD 1 Tryptophan Amino acid 205.0970 [M+H]+ 4.187 C11H12N2O2 −1.511 2 Phenylalanine Amino acid 166.0877 [M+H]+ 2.769 C9H11NO2 8.550 3 Val-val Dipeptide 217.1554 [M+NH4]+ 2.461 C10H20N2O3 −0.092 4 Glu-Leu Dipeptide 259.1283 [M-H]− 3.375 C11H20N2O5 −2.933 5 Gly-Tyr Dipeptide 239.1032 [M+H]+ 2.313 C11H14N2O4 −3.179 6 Asp-Phe Dipeptide 281.1137 [M+H]+ 4.294 C13H16N2O5 −4.802 7 N−Fructosyl phenylalanine Other 328.1412 [M+H]+ 2.692 C15H21NO7 7.344 8 Rosmarinic acid Hydroxycinnamic acid 163.0411 [M+H-C9H10O5]+ 8.453 C18H16O8 8.280 9 Caffeic acid Hydroxycinnamic acid 181.0450 [M+H]− 4.599 C9H8O4 4.748 10 (-)-Riboflavin Vitamin 163.0411 [M+H]+ 6.514 C17H20N4O6 −1.538 FD 11 Glutamine Amino acid 147.0757 [M+H]+ 7.208 C5H10N2O3 −5.031 12 Coumarin Coumarin 147.0443 [M+H]+ 10.316 C9H6O2 1.700 13 p−Coumaric acid Hydroxycinnamic acid 147.0459 [M+H]+ 8.393 C9H8O3 10.677 14 Palmitic acid Free fatty acid 255.2360 [M-H]− 14.792 C16H32O2 11.558 15 Heptadecanoic acid Free fatty acid 269.2468 [M-H]− 15.208 C17H32O2 −5.868 16 γ−Linolenic acid Free fatty acid 277.2164 [M-H]− 13.868 C18H30O2 −3.319 17 Vaccenic acid Free fatty acid 281.2472 [M-H]− 14.873 C18H34O2 −5.653 18 Stearic acid Free fatty acid 283.2637 [M-H]− 15.754 C18H36O2 −2.048 MD 19 Eleutheroside E Triterpenoid saponin 787.2607 [M+FA-H]− 8.024 C34H46O18 −7.520 Amino acids and peptides
-
In HD, two amino acids and four dipeptides were found in higher concentrations. Tryptophan and phenylalanine in HD were 10.12-fold, and 2.79-fold higher compared to FD, and 6.37-fold, and 2.39-fold higher compared to MD, respectively (Fig. 3a, b). In addition, a couple of dipeptides, Val-Val, Glu-Leu, Gly-Tyr, and Asp-Phe, were more abundant in HD samples (Supplemental Fig. S3). The content of Val-Val, Glu-Leu, Gly-Tyr, and Asp-Phe in HD was 10.57-fold, 4.24-fold, 4.32-fold, 4.06-fold compared to FD, and 47.50-fold, 5.86-fold, 4.27-fold, 19.67-fold compared to MD, respectively. Notably, glutamine was higher in FD, being 2.18-fold and 2.13-fold higher compared to HD and MD, respectively (Fig. 3c).

Figure 3.
The annotated markers among different drying methods. The left part are mirror plots and chemical structures, and the right part are box-plots. (a) Tryptophan, (b) phenylalanine, (c) glutamine (d) N-fructosyl-phenylalanine, (e) riboflavin, (f) rosmarinic acid, (g) caffeic acid, (h) coumarin, (i) p-coumaric acid, and (j) eleutheroside E.
During the drying process, the structure and stability of proteins in lily bulbs could be influenced by the relatively higher temperature[27], leading to the degradation of proteins as well as the production of amino acids and peptides in HD and MD, so higher contents of tyrosine, tryptophan, phenylalanine, Val-Val, Glu-Leu, Gly-Tyr, and Asp-Phe were observed in both groups compared to FD. In our research, the higher content of L-pyroglutamic acid was observed in HD and MD with 15.34-fold and 15.19-fold compared to FD, likely due to rapid cyclization of glutamine to L-pyroglutamic during the thermal treatment. Besides, the presence of L-pyroglutamic led to the increment of low molecular colored compounds involved in the Maillard reaction[28]. Unexpectedly, the intermediate product of the Maillard reaction, N-fructosyl phenylalanine, was identified with its content being 409.15-fold and 14.63-fold higher in HD compared to FD and MD (Fig. 3d). It indicated the intensified non-enzymatic browning in HD, which was accordance with the result of appearance. The bulbs of L. davidii var. unicolor have plentiful endogenous sugar including sucrose, glucose and fructose[13], and sucrose could be hydrolyzed into glucose, and fructose subsequently, the increment in substrate concentrations and temperature can intensify the Maillard reaction. The by-product, N-fructosyl phenylalanine, was likely derived from fructose and phenylalanine. Notably, the abundance of phenylalanine was still higher in HD, suggesting that the proteins in lily bulbs did degrade.
It is well-known that free amino acids in natural food are vital for sensory, and the flavor of amino acids is determined by the hydrophobicity of side chain R groups to some extent[29]. The amino acids that were more abundant in HD were known as bitter amino acids, and may negatively affect the taste of dried lily bulbs. Conversely, glutamine is perceived to have umami and desirable taste due to its hydrophilic property[30], the higher content of glutamine in FD may improve the taste of dried lily bulbs. Similarly, the taste of peptides is closely associated with their structure, Val-Val was also found to impart bitter taste and existed in 100 °C samples of thermally treated yeast extract[31]. As opposed to this, the acidic amino acid residues in peptides might be related to its umami taste, Glu-Leu can exhibit kokumi and umami taste[32]. The specific properties of Gly-Tyr and Asp-Phe are yet to be explored.
Free fatty acids
-
The fluctuation in fatty acids among different drying methods was observed. Saturation fatty acids (SFA), such as palmitic acids, heptadecanoic acid, stearic acid and monounsaturated fatty acid (MUFA) vaccenic acid, and polyunsaturated fatty acid γ-linolenic acid were found in significantly higher concentrations in FD samples (Supplemental Fig. S4). γ-Linolenic acid, a principal PUFA, is known to be affected by drying techniques[33], which is consistent with our findings. High temperature during HD facilitates the destruction of double bonds in MUFA and PUFA, leading to the oxidation of lipids[34]. The oxidation and degradation of free fatty acids may be partially mitigated by the cold and vacuum conditions of FD, showing its superiority in preserving free fatty acids.
Vitamin
-
The content of riboflavin was higher in HD with 5.89-fold compared to FD and 11.46-fold compared to MD (Fig. 3e). It is well-known that riboflavin is susceptible to light rather than heat[35]. The shading treatment was not conducted and thus the light-sensitive compounds were not especially protected in the present experiment. During the process of drying, HD retained more riboflavin due to the darker environment in the lab oven, on the other hand, the radiation between radio waves and ultraviolet wavelengths produced by microwave was responsible for the degradation of riboflavin[36]. The difference in riboflavin content came from the condition of an experiment rather than processing factors, suggesting that FD, conducted in a dark operation, might better preserve light-sensitive compounds.
Polyphenols
-
Four polyphenol compounds were identified as markers of different drying methods, including rosmarinic acid, caffeic acid and p-coumaric acid, as well as coumarin. Coumarin without hydroxy is usually classified into polyphenol compounds due to their similar characteristics. Because of their tolerance to heat, rosmarinic acid, and caffeic acid were more abundant in HD compared to FD and to MD (Fig. 3f, g). The content of thermosensitive coumarin and p-coumaric acid were higher in FD. Compared to HD, the contents of coumarin and p-coumaric acid were 3.05-fold and 5.01-fold higher in FD, and their contents were 2.77-fold and 1.52-fold higher in MD, respectively (Fig. 3h, i).
Rosmarinic acid is a plant-derived high-temperature resistance polyphenolic compound with neuroprotective effects[37]. Caffeic acid has potential anti-oxidant and anti-neoplastic activities, and is distributed in plants[38]. Rosmarinic acid is synthesized enzymatically by the phenylalanine and tyrosine[39]. Caffeic acid, dihydroxyphenyllactic acid, and caffeic ester rosmarinic acid are important intermediate products in the biosynthetic process of rosmarinic acid, and the key enzyme rosmarinic acid synthase (RAS) is heat-stable at 180 °C[40]. The higher substrates and suitable conditions of enzyme led to the accumulation of rosmarinic acid and caffeic acid in HD samples[37]. Quan et al. found the content of p-coumaric acid in 100 W/300 W of MD for 2 min was lower than in fresh samples[5].
During the drying process, the differences in phenolic compound content could be attributed to process parameters, thermal procedures, and so on[41]. The sealed vacuum chamber of FD provided an oxygen-free environment, the moisture was removed from the lily bulbs under low temperature[42], which may restrain the oxidation and thermal degradation of polyphenols during the FD process. Additionally, the ice crystals formed during dehydration within the plant tissues may foster the extraction of polyphenols due to the collapse of cell structure[43].
Triterpenoid saponin
-
A triterpenoid saponin, eleutheroside E, was identified as the marker of MD, whose peak area was 2.13-fold compared to FD and 29.31-fold compared to HD (Fig. 3j). Researchers have noted that eleutheroside E possesses numerous pharmacological effects including anti-fatigue, and improvement in peripheral blood circulation and memory[44]. During the microwave drying process, polar molecules such as water in the bulbs of L. davidii var. unicolor release energy by oscillating under the action of an electromagnetic field. Simultaneously, intense heat may produce a sudden high pressure inside the plant matrix, leading to its destruction[43]. The continuous vapor flow might form more 'channels' in the more porous structure of a cell[45]. The morphology of MD samples changed and local swelling was observed, indicating the cell structure was changed under microwave. In the case of the plant matrix being broken down by microwave radiation, bioactive compounds will be released[46], which might lead to the elevation of eleutheroside E in MD samples. Ice crystal and vacuum conditions contributed to the highly porous structure of cells during the process of FD[4], the low temperature also protected the structure of eleutheroside E. The threats of oxidation and thermal degradation of eleutheroside E in HD were elevated due to higher temperature over a long period. It has been reported that almost no pores and channels were observed in dried lily bulbs[4], thus the mass transfer of eleutheroside E was affected. Unlike HD, the shorter drying time could reduce eleutheroside E from thermal degradation in MD.
In summary, as shown in Fig. 4, non-thermal processing technology, like FD, could provide dried lily bulbs with a quality closer to that of fresh bulbs compared to HD and MD. From FD to HD, the compounds of dried lily bulbs degraded, producing by-products and decomposition products, leading to an increase of components from non-thermal to thermal technology. The bitter amino acids, bitter peptides, and the Maillard intermediate were higher in the HD group, which may be influenced by protein degradation, aggravated Maillard reaction, and increased related reaction products resulting from the thermal process. The markers of the FD group were characterized by glutamine, coumarin, p-coumaric acid and unsaturated fatty acids, proving that vacuum and low temperature effectively inhibited enzymatic reactions, and ice crystal was beneficial to releasing intracellular components. The marker of MD group was eleutheroside E, which benefited from shorter processing time, intense heat, and sudden high pressure inside the matrix due to the electromagnetic field. The variation of phytochemicals among the three drying methods confirmed the alteration in quality and influenced the appearance of dried lily bulbs.
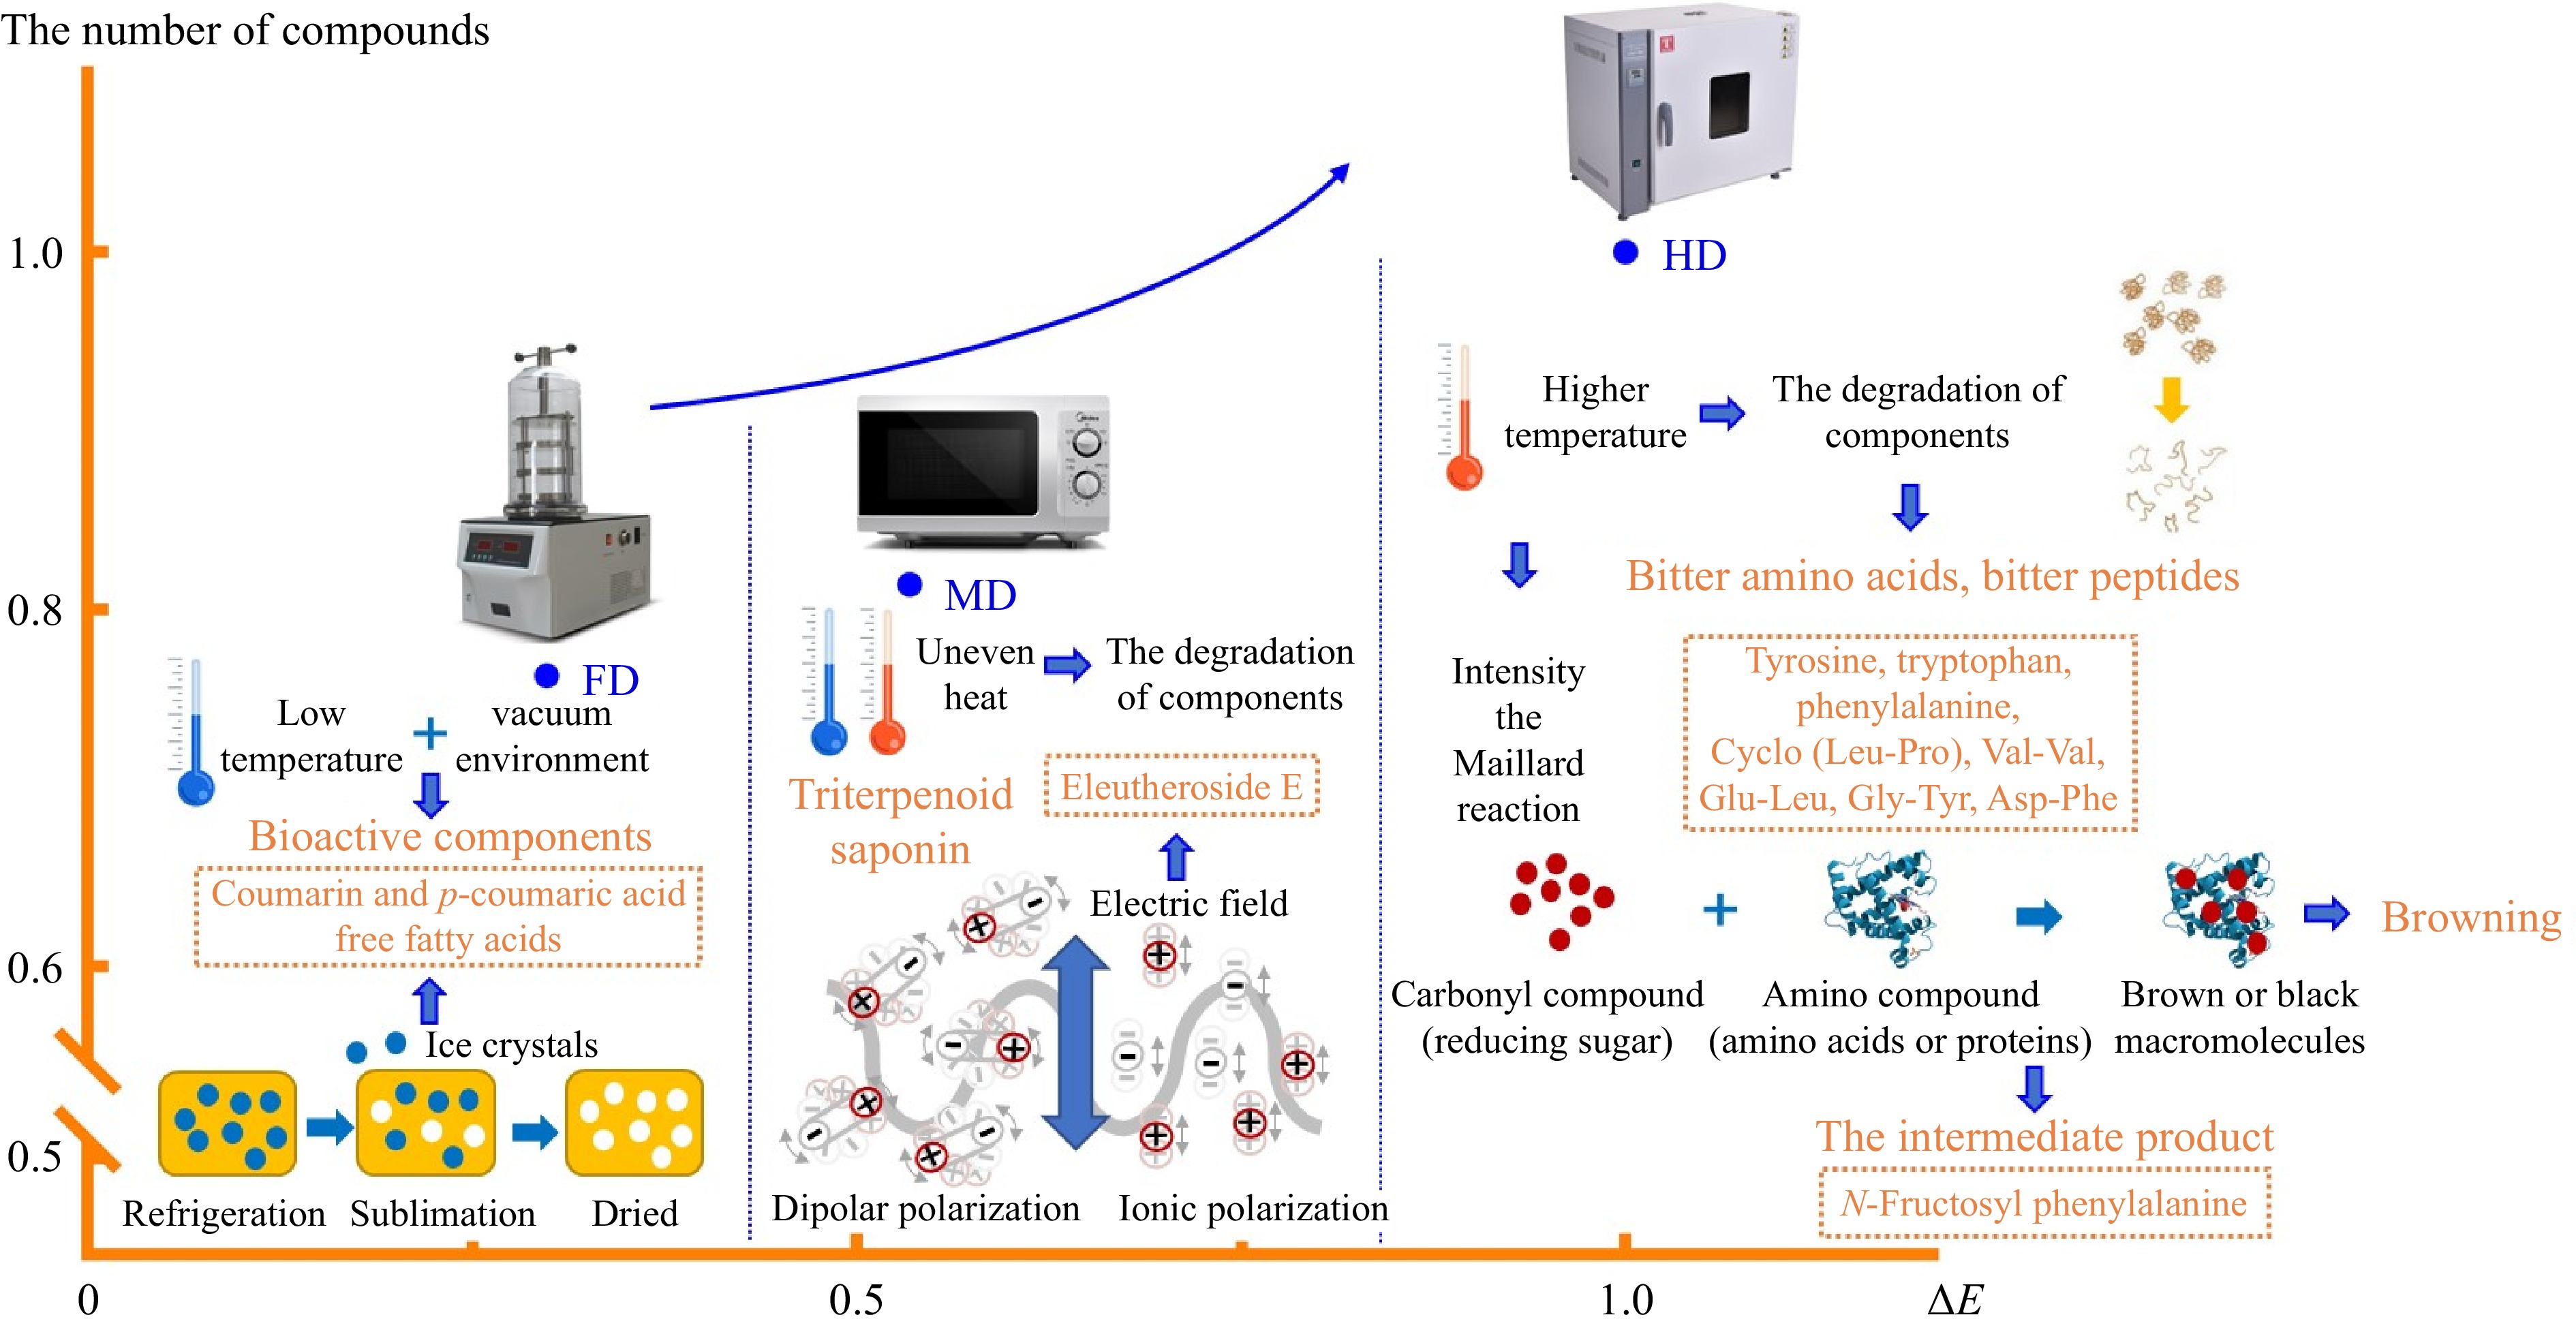
Figure 4.
The tentative mechanism of markers in different drying methods. Note: The number of compounds and ΔE of HD were considered as 1, and the values of FD and MD were compared with HD.
Verification of selected marker
-
Given that eleutheroside E has not been reported in lily bulbs previously, verification and quantitative analysis were conducted using the reference standards. The extraction ion chromatogram of eleutheroside E at the qualitative ion pair 787.2/579.3 was shown in Fig. 5a, confirming the presence of eleutheroside E in the bulbs of L. davidii var. unicolor. It was the first time that eleutheroside E was confirmed in lily bulbs. In Fig. 5b, eleutheroside E had the highest content in MD samples (160.54 ± 25.55 μg/100g DW), followed by FD samples (106.13 ± 8.07 μg/100g DW), and the lowest content in HD samples (25.95 ± 2.47 μg/100g DW). The content of eleutheroside E in HD was significantly lower than fresh samples (63.48 ± 3.52 μg/100g DW) due to the heat-induced degradation. The content of eleutheroside E in MD was 1.51-fold compared to FD and 6.19-fold compared to HD. However, the relative quantitative analysis of eleutheroside E based on the untargeted metabolomics show that the FC of MD compared to FD, and HD was 2.13-fold and 29.31-fold. The discrepancy between absolute and relative quantification might be associated with the extraction solvent, temperature, and other factors. Moderate concentration (40%−50%) ethanol is usually used as the solvent for eleutheroside E[47], and the reference standards were usually dissolved in water, thus the 50% ethanol was a more suitable solvent for the extraction of eleutheroside E compared to 0.125% formic acid methanol. Additionally, the peak area of eleutheroside E in HD was only 4639, far lower than that in FD and MD, potentially affected by noise from the complex matrix, influencing the relative quantitative result. And QQQ-MS is considered the 'gold standard' for quantitative measurement due to its high sensitivity and specificity[48]. Thereby, it was necessary to conduct the targeted extraction and verification test to overcome the limitation of relative quantitation and ensure accuracy.
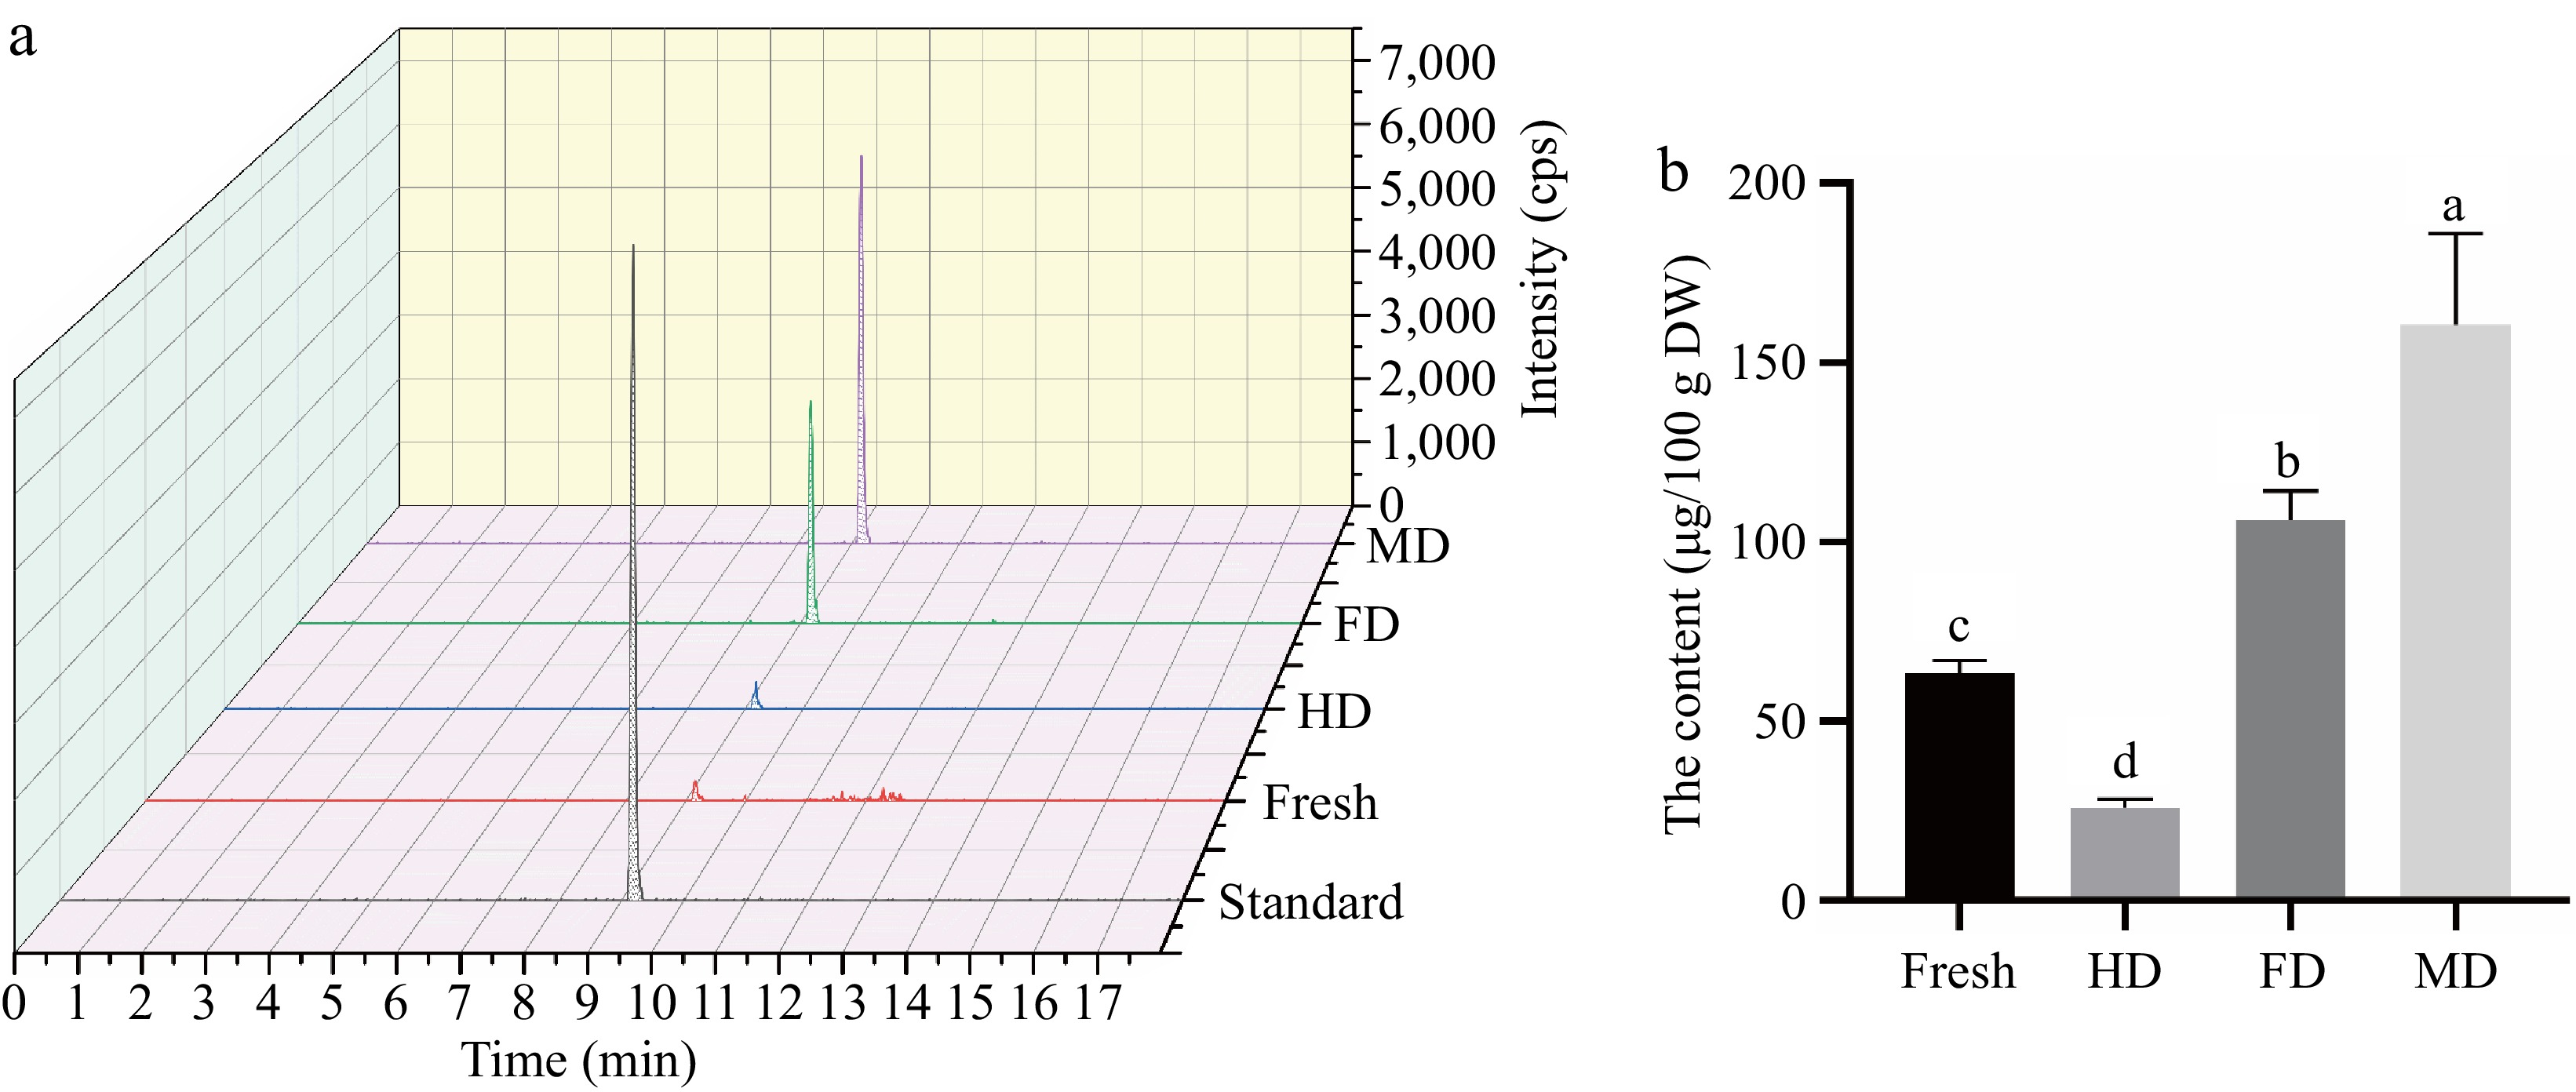
Figure 5.
Extracted ion chromatogram of (a) standard and samples and (b) the content of eleutheroside E in samples. Note: The precursor ion and the product ion of eleutheroside E were 787.2/579.3 Da.
In addition, the content of eleutheroside E in MD and FD was 2.53-fold and 1.67-fold compared to fresh lily bulbs, it was speculated that MD and FD did not merely promote the release of eleutheroside E with free state from inside the cell. It has been reported that secondary metabolites normally occur in plants in the free or cell wall-bound form[49]. It was speculated that MD and FD not only promoted the release of free-state eleutheroside E from inside the cell but also facilitated the mass transfer of cell wall-bound compounds. However, further investigations on the distribution of eleutheroside E in plants are required. Moreover, the content of eleutheroside E in MD samples was significantly higher than FD, which might be influenced by the additional electrical effects, such as magnetic effect of microwave, thus promoting the release of eleutheroside E.
Eleutheroside E is a natural product abundant in Eleutherococcus species, and the rhizome and root of E. Senticosus was reported to possess higher content ranging from 35.67 to 81.29 mg/100g DW along ages of plants[50]. In our study, eleutheroside E was found in lily bulbs at low abundance, making it a less suitable source for eleutheroside E compared to E. Senticosus. However, it was necessary to investigate the distribution of eleutheroside E in other organs of lily. Considering the renewable and preciousness of perennial medical plants, the extraction of the main active constituents have been studied over the past decades. Wang et al. utilized microwave-assisted extraction technique to enhance the yield of eleutheroside E from naturally dried E. Senticosus stem, acquired approximately 165.84 mg/100g DW of eleutheroside E which was higher than Bączek et al.[47,50]. Therefore, it was encouraging that the microwave drying method might have the potential to enrich bioactive compounds before extraction, as microwave was beneficial for the extraction of eleutheroside E.
-
In conclusion, the present study provides a comprehensive analysis of the effects of different drying technologies on dried lily bulbs, from external appearance to internal phytochemical profiles. The FD method resulted in the best external appearance, with minimal browning and wrinkling, while the HD method led to the most significant browning and wrinkling. Through untargeted metabolomics, 19 phytochemical markers were potentially identified to differentiate the drying methods. The HD method increased the levels of bitter amino acids, peptides, and Maillard intermediates, likely due to protein degradation and an intensified Maillard reaction. In contrast, the FD method preserved glutamine, coumarin, p-coumaric acid, and unsaturated fatty acids, attributed to the low-temperature, oxygen-free conditions, and the assistance of ice crystals. Notably, the MD method emerged as a promising technique for enriching bioactive compounds, particularly eleutheroside E, which was found in lily bulbs for the first time in our study. The MD method achieved the highest content of eleutheroside E, suggesting that the disruption of cell structure during drying and the non-thermal effects of microwaves might enhance the release of this bioactive compound. Future research should further investigate the mechanisms underlying the release of bioactive compounds during MD. The present study contributes valuable insights into the impact of drying technologies on the quality of dried lily bulbs and paves the way for the development of processing techniques that preserve and enhance their nutritional and medicinal properties.
-
The authors confirm contribution to the paper as follows: study conception and design: Mi L, Xu Z, Yang SM; experimental processing: Mi L, Wang X, Lin Y; data collection and validation: Mi L, Yang SN; analysis and interpretation of results: Mi L; draft manuscript preparation: Mi L, Yang SN, language editing, manuscript revision: Xu Z, Xu L. All authors reviewed the results and approved the final version of the manuscript.
-
The datasets generated during and/or analyzed during the current study are available from the corresponding author on reasonable request.
This work was supported by the National Natural Science Foundation of China (NSFC) (Grant No. 3222 2067), and the project of Department of Agriculture and Rural Affairs of Gansu Province (Grant No. SDWJ2021-03).
-
The authors declare that they have no conflict of interest.
- Supplemental Fig. S1 The total ion chromatograms of the QC (A) and PCA scores plot of samples and QC (B).
- Supplemental Fig. S2 Differentiation of different dried lily bulbs in negative mode. A) Venn plot. B) PCA scores plot, indicating discrimination between HD, FD and MD. C) heatmap D) Pearson correlation.
- Supplemental Fig. S3 The peptides markers in HD. The left part was mirror plots and chemical structures, and the right part was the box-plots. A) Val-Val, B) Glu-Leu, B) Gly-Tyr, D) Asp-Phe.
- Supplemental Fig. S4 The free fatty acids markers in FD. The left part was mirror plots and chemical structures, and the right part was the box-plots. A) palmitic acid, B) heptadecanoic acid, C) stearic acid, D) vaccenic acid E) γ-linolenic acid.
- Copyright: © 2024 by the author(s). Published by Maximum Academic Press on behalf of China Agricultural University, Zhejiang University and Shenyang Agricultural University. This article is an open access article distributed under Creative Commons Attribution License (CC BY 4.0), visit https://creativecommons.org/licenses/by/4.0/.
-
About this article
Cite this article
Mi L, Yang S, Wang X, Xu L, Lin Y, et al. 2024. Comparing the appearance and phytochemical characterization of dried lily (L. davidii var. unicolor) bulbs processed by different drying technologies. Food Innovation and Advances 3(3): 212−221 doi: 10.48130/fia-0024-0020 

Comparing the appearance and phytochemical characterization of dried lily (L. davidii var. unicolor) bulbs processed by different drying technologies
- Received: 24 April 2024
- Revised: 23 May 2024
- Accepted: 30 May 2024
- Published online: 05 July 2024
Abstract: Lily bulbs are valued for their health benefits, and drying is a common method for their preservation. This study employed untargeted metabolomics using UHPLC-QTOF-MS to analyze the phytochemical profiles of lily bulbs dried by hot air (HD), microwave (MD), and vacuum freeze (FD) methods. In terms of appearance, FD samples exhibited minimal browning and wrinkling, while HD bulbs showed the most severe changes. Nineteen potential markers were identified, with HD samples showing higher levels of bitter amino acids, peptides, and N-fructosyl phenylalanine. The markers of FD samples were glutamine, coumarin, and p-coumaric acid. Notably, eleutheroside E was detected in lily bulbs for the first time and confirmed as an MD marker, with levels 1.51-fold and 6.19-fold higher than in FD and HD samples, respectively. MD method shows promise for enriching bioactive compounds in dried lily bulbs.
-
Key words:
- Lilium davidii var. unicolor /
- Metabolomics /
- Phytochemicals /
- Markers /
- Eleutheroside E /
- Drying technology