


-
With the advance of high-throughput long-read sequencing and the development of effective genome assembly algorithms, the community of genomics has constructed a wealth of high-continuity genome assemblies, frequently in the form of chromosome-level pseudomolecules, of individuals from a wide variety of species[1,2]. Such genome assemblies provide fundamental resources for the identification of genomic variation, including single nucleotide polymorphisms, small insertion and deletion, and structural variation[3,4]. Genomic computational tools have been developed to facilitate genome alignments and variant discovery. For example, NUCMER and minimap2 are two effective sequence aligners that could handle alignments between genome sequences[5,6]. For alignments between complex genomes with large structure variation, AnchorWave was designed for improved alignment accuracy[7]. Genomic alignment results can be further processed to identify genomic polymorphisms[8]. Such analyses are frequently conducted for global genomic comparisons although the process is computationally intensive.
Genomic variation in and around genes is of particular interest. Without knowing homologous genes across genomes, extracting data related to single genes and their homologs from the genome-wide comparative results among multiple genomes is not straightforward. In a scenario where genes of all genomes are well annotated, genic comparison could be directly conducted by aligning sequences of gene models at the DNA and protein levels. However, complete and precise gene annotation is a daunting task, and alternative splicing of a gene complicates such analysis. In addition, with substantial resources of genome assemblies, multiple rounds of sequence retrieval, homolog search, variant identification, and annotation are needed for examining a gene of interest and its homologs. The process also typically involves manual examination and judgment. Therefore, a handy computational pipeline is needed for an efficient process. An online tool, BridgeCereal, represents one such effort to discover structural variation among multiple genomes[9]. Homotools, including a suite of scripts was developed to ease sequence retrieval of homologs and comparisons among them from multiple genomes. Comprehensive genomic variation can be uncovered, annotated, and visualized by Homotools.
-
Maize genomes of 28 inbred lines, including A188, B73, Mo17, and other 25 parents of the Nested Association Mapping (NAM) population, were used for analysis[10−12]. All data can be downloaded from
https://download.maizegdb.org .Development of Homotools
-
The majority of scripts were developed using Shell scripting and Perl. Plotting was implemented through R. Bioinformatics tools frequently used include Bedtools[13], BLAST+[14,15], and NUCMER[5].
Plant materials and herbicide treatment
-
Maize inbred lines were provided by the North Central Regional Plant Introduction Unit, USDA, USA. Ten seeds per inbred line were sown in 10.8 cm × 10.8 cm × 9.5 cm pots. The plants were cultivated in greenhouse conditions under 28/21 °C day/night (d/n) temperature and a 16/8 h d/n photoperiod, supplemented with 600 μmol m−2 s−1 illumination provided by sodium vapor lamps. Seedlings at the 3−5 leaf stage (2- to 3-weeks old) were used for herbicide treatment. At least two seedlings from each inbred line were sprayed with nicosulfuron (Accent Q®, DuPont, Wilmington, USA) at a dose of 137 g active ingredient per hectare. Herbicide application was performed using a bench-track sprayer (DeVries Manufacturing, Hollandale, MN, USA) equipped with a flat-fan nozzle (8002 TeeJet® tip, Spraying Systems, Wheaton, IL, USA), calibrated to deliver 187 liters per hectare at a speed of 4.85 km h−1 at 207 kPa pressure[16]. Two weeks after treatment, the plants were phenotyped and photographed.
-
Homotools includes five major modules, geneseq, homocomp, homograph, homostack, and homomine (Fig. 1). Module geneseq can extract gene sequences, including sequences of genes, transcripts, and coding regions based on a query gene name and related databases. Module homocomp implements homologous searching and visualization of the comparison between the query and the target sequences. A homologous gene could be found if a related gene annotation is supplied. The alignment between the two homologous sequences is plotted. Module homostack can stack input sequences and visualize alignments between two neighboring sequences. Module homograph visualizes alignments of multiple homologous sequences, determines the number of haplotypes, and views the haplotype alignment graph. All scripts are publicly available in GitHub (liu3zhenlab/homotools).
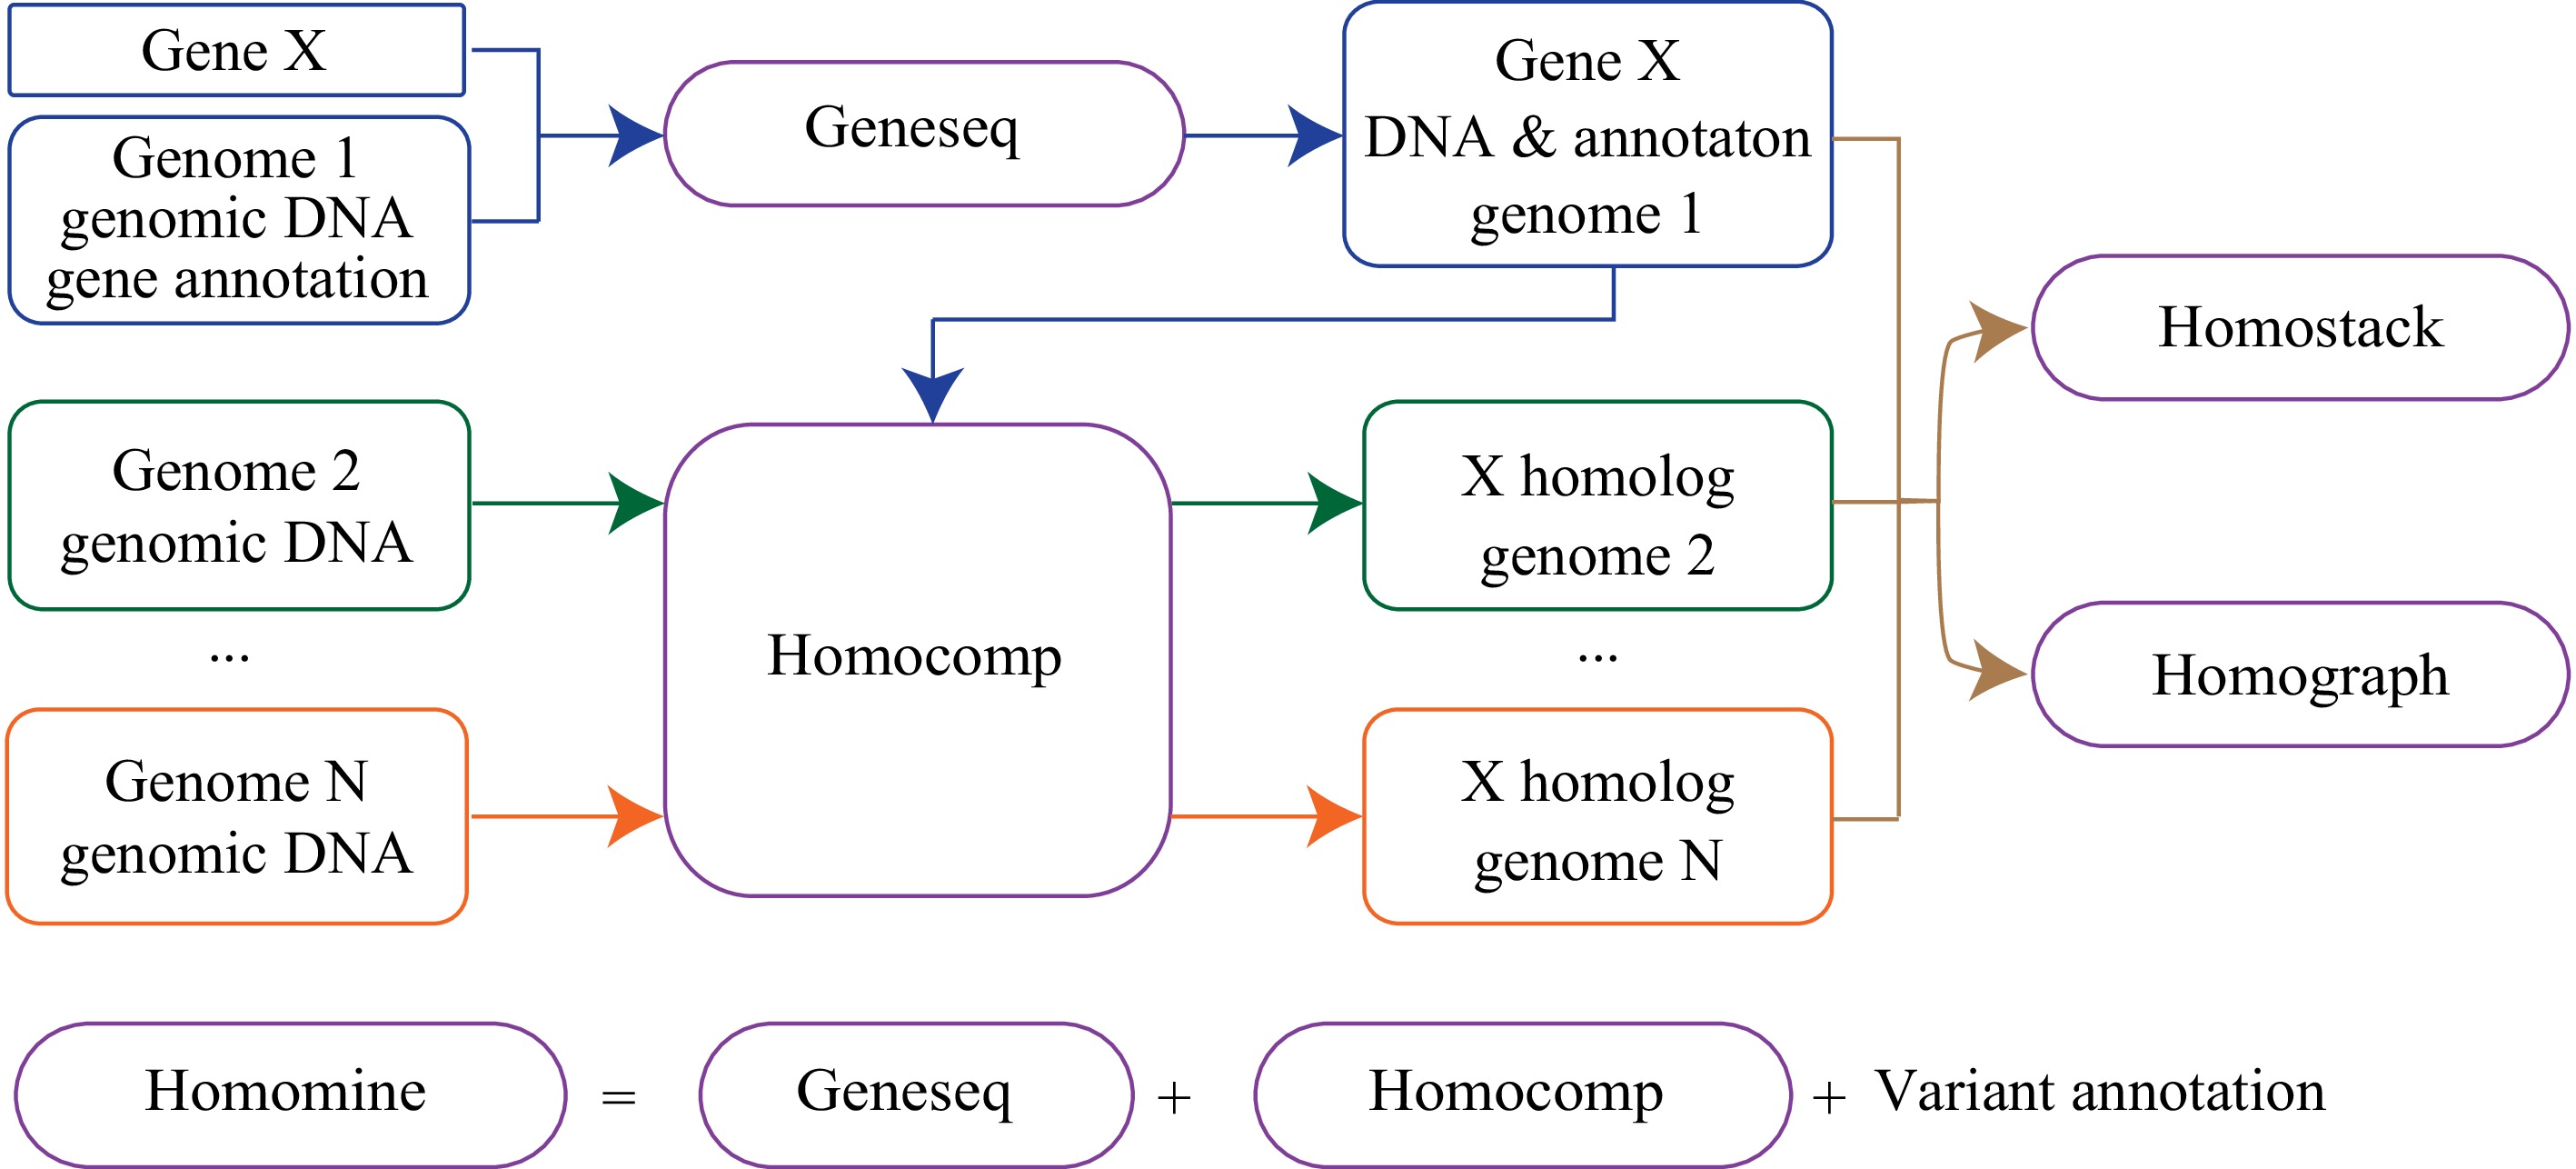
Figure 1.
Overview of Homotools. Module geneseq extracts sequences and related information from databases for a gene (e.g., gene X); homocomp implements homolog searching for gene X and visualizes the comparison of two homologs; homograph determines haplotypes of multiple homologs, and displays an alignment graph of a set of homologs; and homostack stacks input sequences and shows alignments; Module homomine is a pipeline implementing modules geneseq and homocomp for homologous searching and annotating all variants between the query sequence and the resulting homolog.
These modules can be combined. For example, module geneseq is typically run first to extract genomic and related sequences for an input gene from a reference genome, with which module homocomp can be run multiple times to extract homologs from other genomes. For an easier implementation, module homomine was developed to combine geneseq and homocomp for sequence retrieval, homologous search, and annotation of variants, including nucleotide substitutions, small insertion, small deletion, and large structural variation. In this manuscript, example codes to illustrate the usages of these modules are provided (Supplemental File 1).
An application example of geneseq, homocomp, and homostack
-
Here, homologous genes of Zm00001eb001720 (knox1 encoding a homeobox protein) from the inbred line B73 in the other four inbred lines A188, CML333, Ki3, and P39 were examined[17]. First, the genomic sequence of the gene and the annotation were extracted from the B73 reference genome through module geneseq. The lengths of sequences flanking the gene can be set based on the purpose. Through implementing homocomp, the knox1 sequence was then used to find a homologous sequence in other genomes. The alignments between the knox1 sequence and a homologous sequence from the A188 genome are visualized in an alignment connection format (alnplot) (Fig. 2a) and in a dotplot view (Fig. 2b). From the alnplot output figure, both structural variation and polymorphic levels of alignments can be informed.
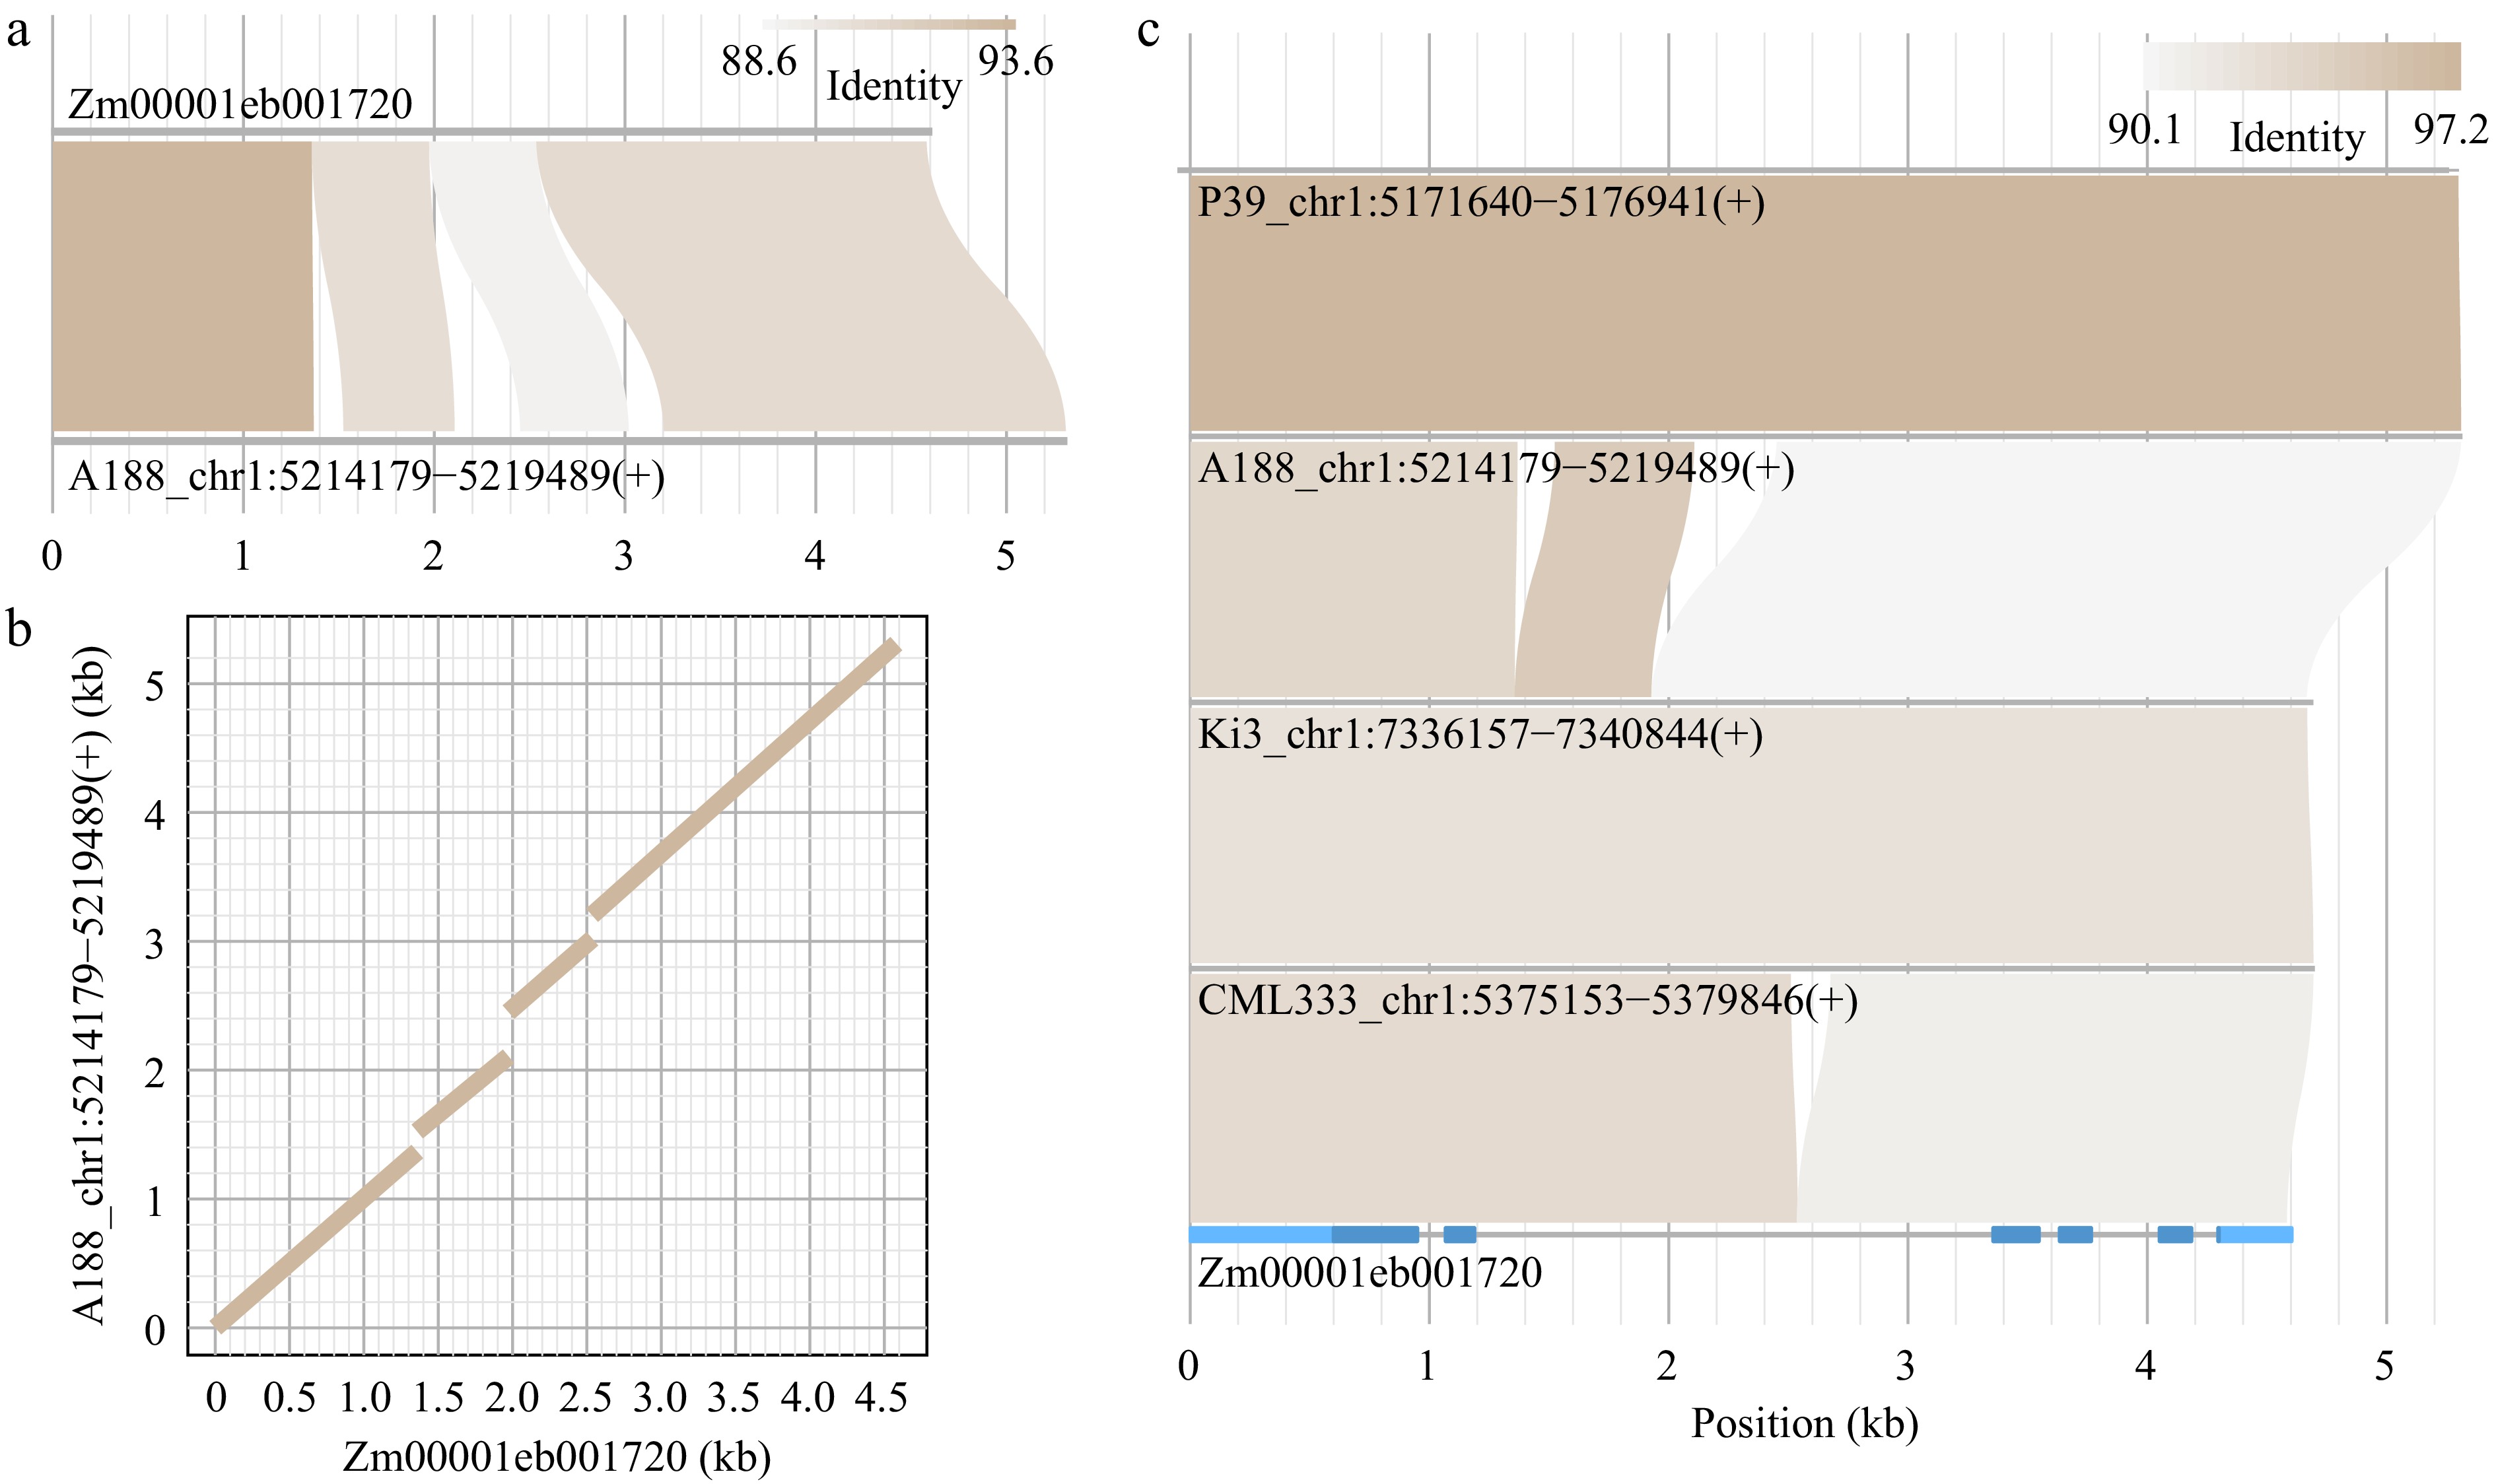
Figure 2.
Alignment visualization via homocomp and homostack. (a), (b) A target homologous sequence of the query sequence (Zm00001eb001720) was identified in the A188 genome using module homocomp. (a) An alignment plot, and (b) a dotplot were output. (c) Multiple sequences retrieved by homocomp, along with the query sequence, were supplied to homostack to show the sequential alignments. The gene structure of Zm00001eb001720 was plotted, in which light and dark blue represent untranslated exon regions and coding regions, respectively.
In module homocomp, BLAST+ is used for an initial alignment search for the query sequence in a targeted genome[14]. The genomic region with the highest alignment score (bit score) with the query is anchored and then the region is expanded from both sides to identify the alignment start and end sites. Alignments in repetitive regions could be excluded for the identification of the highest-score alignment if the corresponding parameter is specified. The sequence in the alignment range identified by BLAST+ is then compared with the query sequence using NUCMER, which identifies pairs of sequence blocks and reports their similarities[5].
Multiple sequences retrieved using homocomp from the other genomes of the four inbred lines, along with the query sequence, can be used for sequential sequence comparisons via module homostack (Fig. 2c). The order of these sequences is based on the input order of these sequences. Sequence regions of any sequences can be highlighted with additional annotation inputs. The gene annotation, including exon and coding regions, of knox1 is color-highlighted (Fig. 2c). From the homostack result, P39 and A188 alleles are similar; Ki3 and CML333 alleles are structurally similar but the identity is relatively low; and three presence and absence variations (PAV) were observed among these five alleles from the five maize inbred lines.
Homograph for clustering and sequence block analysis
-
To provide detailed polymorphisms among multiple sequences, the module homograph was developed. The homograph algorithm starts with multiple sequence alignment (MSA) with input DNA sequences (or taxa), including a reference sequence. Three MSA software packages are available: Clustal Omega[18], MUSCLE[19], or MAFFT[20]. All sequences are clustered with cd-hit based on the user-defined clustering criteria[21]. The non-gap consensus sequences of MSA are then split into blocks at all transitions between a gap and a nucleotide base at the end of an alignment. In each block, the number of polymorphisms and the number of haplotypes are determined. An informative block graph is plotted to represent MSA (Fig. 3a). Blocks are color-coded to indicate the sequence conservation and the polymorphic levels as compared to the consensus sequence. The haplotype sequence of each block is named and stored in a FASTA output (Fig. 3b) and the genotyping result per block in each taxon is output (Fig. 3c).
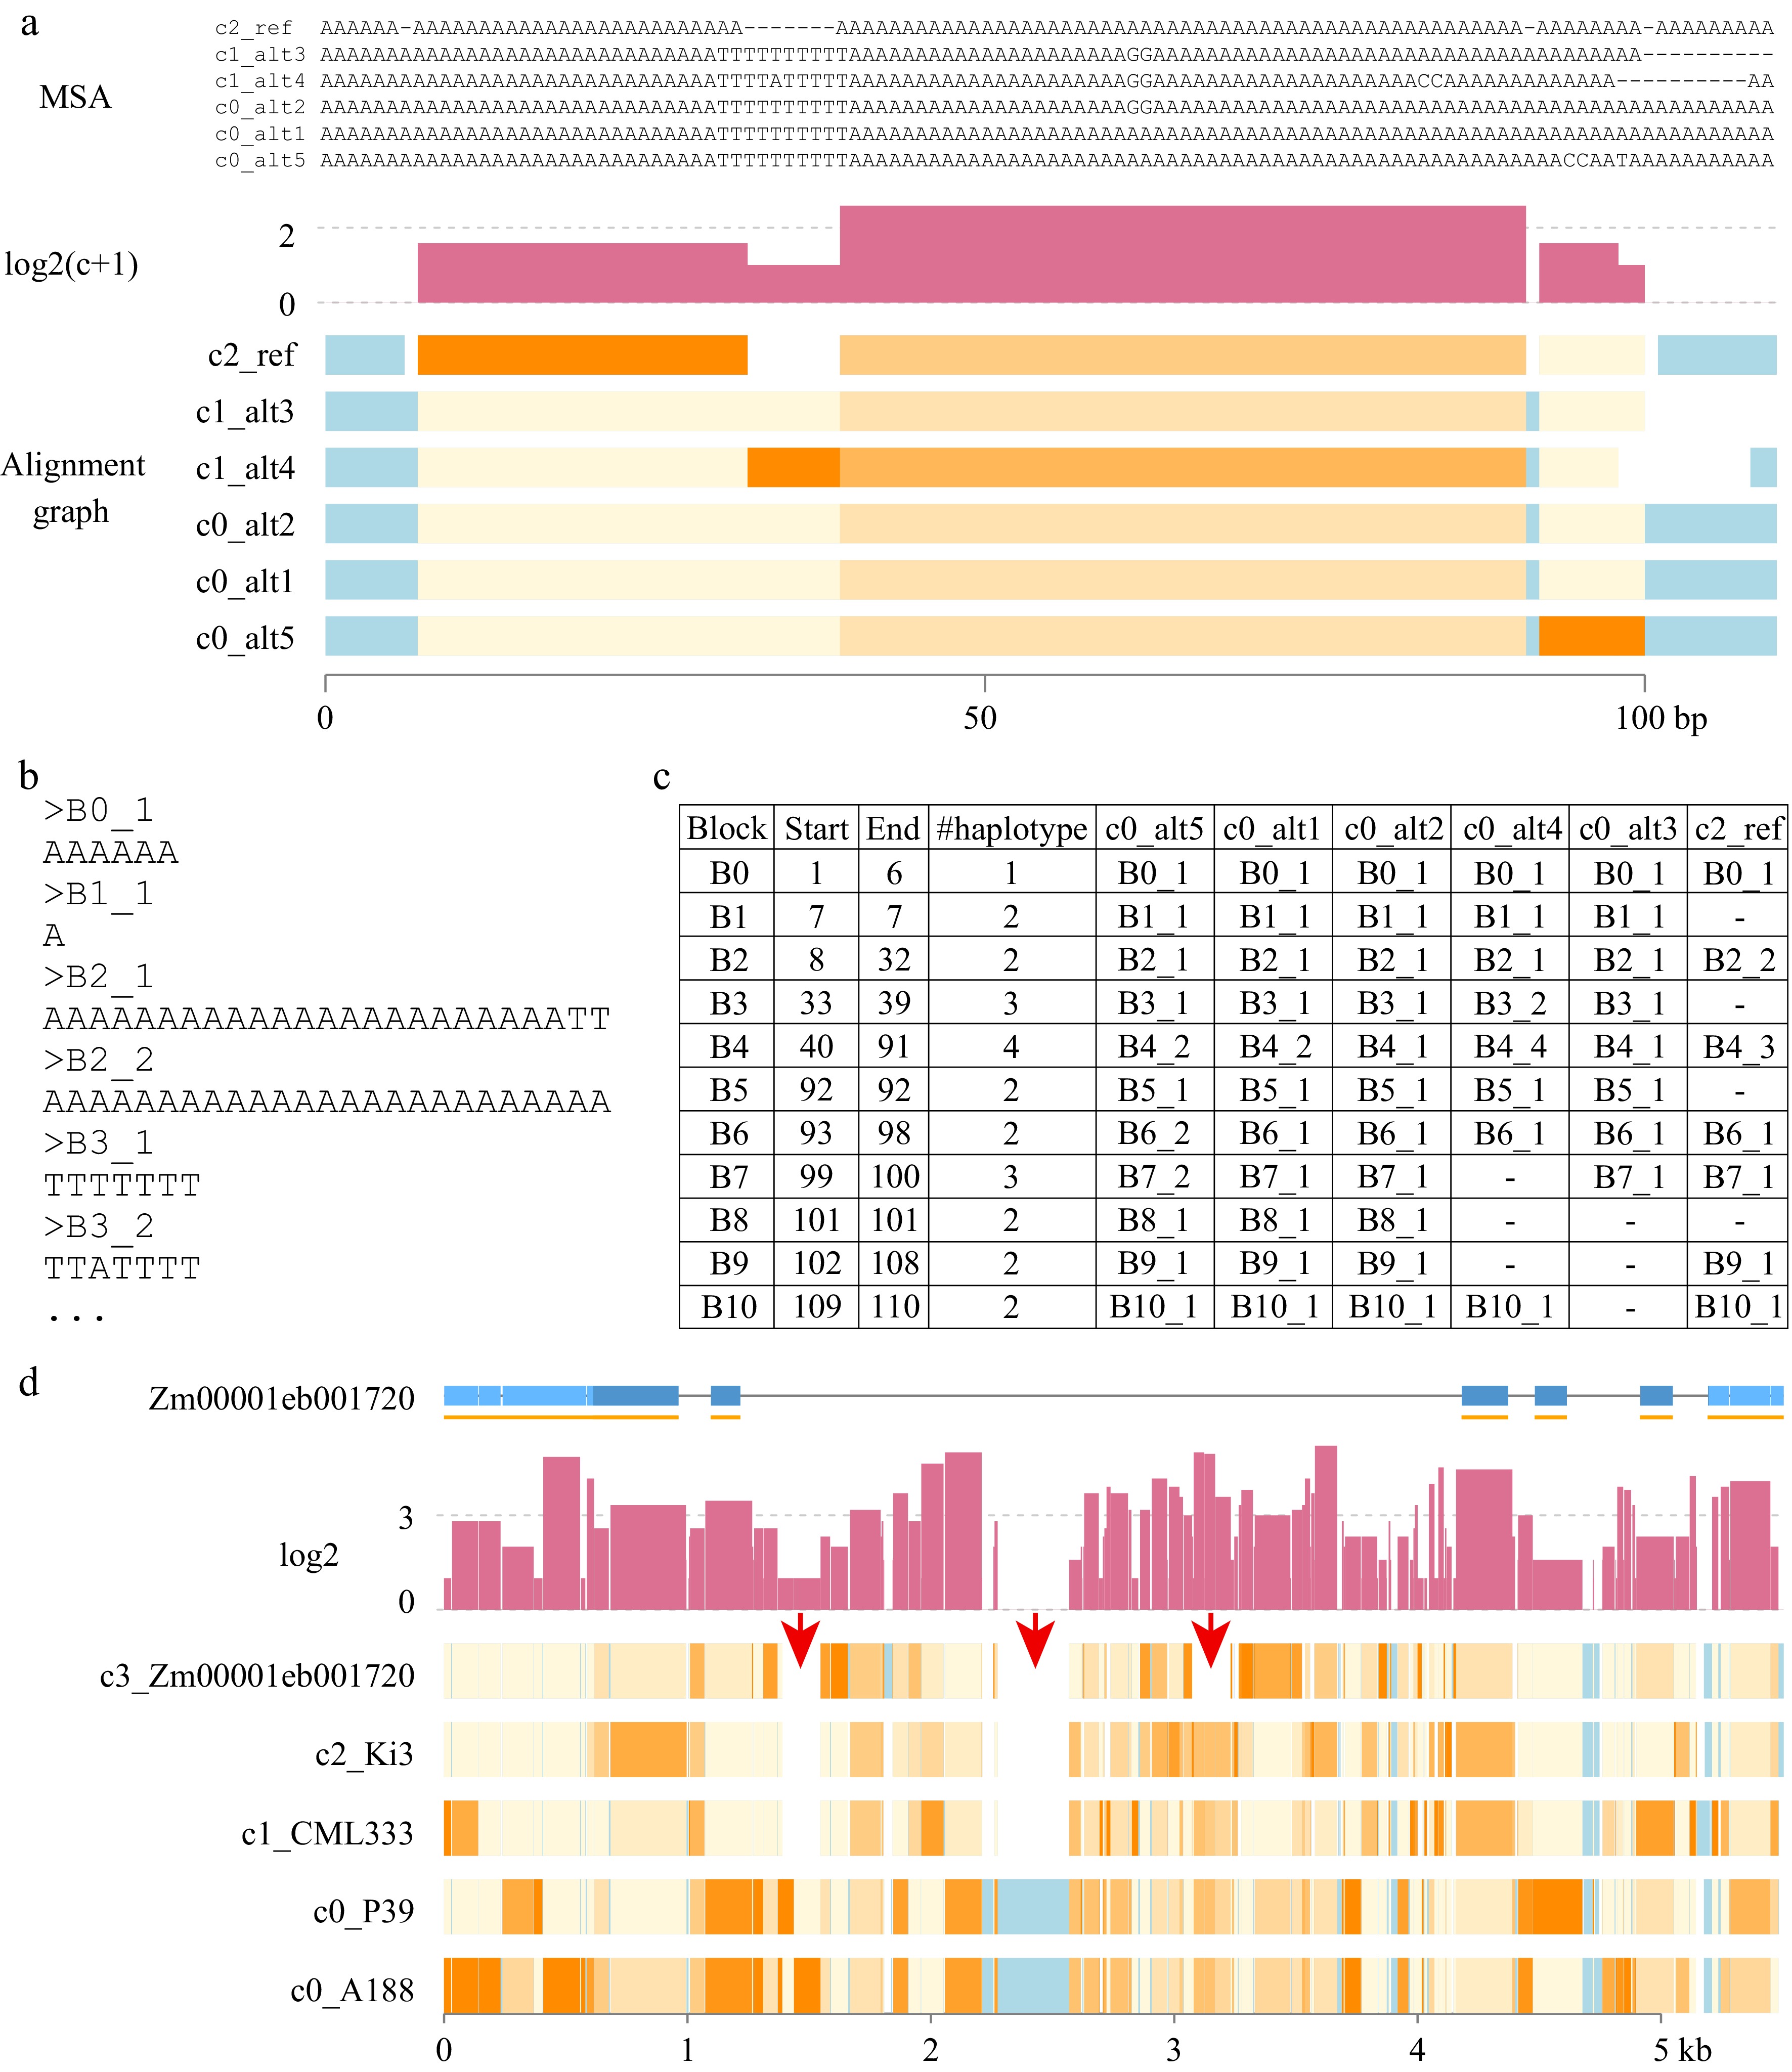
Figure 3.
Homograph outputs. (a) Three parts are included: MSA, log2(c+1), and Alignment graph. MSA displays a graphic view of multiple sequence alignment (MSA) for helping understand the alignment graph. The MSA was divided into blocks at the transition between a gap ('-') and a nucleotide base. For each block, the single nucleotide substitution sites, excluding gaps, were counted. The Y-axis unit is at the scale of log2 of (c) the substitution count, which is adjusted by adding 1. In the alignment graph, each rectangle represents an alignment block without a gap. Light blue represents conserved regions with no substitution polymorphisms. The gradient colors from light yellow to orange indicate the divergent levels from the consensus sequences, from low divergence to high divergence, respectively. Names of taxa are prefixed with cluster groups (e.g., c0). (b) The allele sequence of each block is stored in a FASTA file. (c) A table output lists the allele type of each taxon at each block. The Start and End coordinates are the MSA alignment positions. The number of haplotypes (#haplotype) specifies the number of alleles of a block, which includes the allele of a gap if it exists. (d) A graphic output of homograph analysis of knox1 homologs. Red arrows point at regions with presence and absence variation. The gene structure of Zm00001eb001720 was plotted, in which light and dark blue represent untranslated exon regions and coding regions, respectively. Each orange line under the gene structure indicates an exon, which could be split by alignment gaps.
Using sequences from the previous knox1 case, the five sequences were grouped into three clusters using the default criteria: c1, c2, and c3. The alleles of A188 and P39 were grouped to c1, the CML333 and Ki3 alleles were grouped to c2, and the B73 allele was in c3. Consistently with the homostack alignment output, three PAV were observed among these five alleles. As compared with the homostack output, more details related to DNA substitution polymorphisms and small insertions or deletions (INDELs) are provided in the homograph output (Fig. 3d). Briefly, DNA substitution polymorphisms spread in most regions. Only a few small regions are conserved across all five sequences, and interestingly, most of the conserved sequences are not in coding regions. No INDELs were observed in the protein-coding regions.
The integrated pipeline homomine discovers and annotates genomic variants
-
An integrated module, homomine, was developed to simplify the procedure for sequence retrieval, homologous searching, variant calling, and annotation of variants, including structural variants. For the example of Zm00001eb001720, the input gene name was used to retrieve genomic DNA sequence data and the gene annotation in the query genome (e.g., B73) first. The homologous region and the homologous gene will then be identified in a target genome (e.g., A188). In the result, alignments between two homologous regions will be visualized (Fig. 4a), and the coordinates of detailed alignments are provided (Fig. 4b). To discover variants, including large insertions and deletions, a script to convert alignments using an MSA algorithm to genomic variants was developed. All genomic variants were annotated using SNPEff[22]. In particular, genomic variants annotated to cause moderate or high impacts on the gene function were extracted and reported in the outputs (Fig. 4c). These genomic variants, particularly high-impact variants, likely contribute to form a functionally divergent allele. The homomine outputs are extracted to produce a HTML report for overviewing the major results (Supplemental Dataset 1).
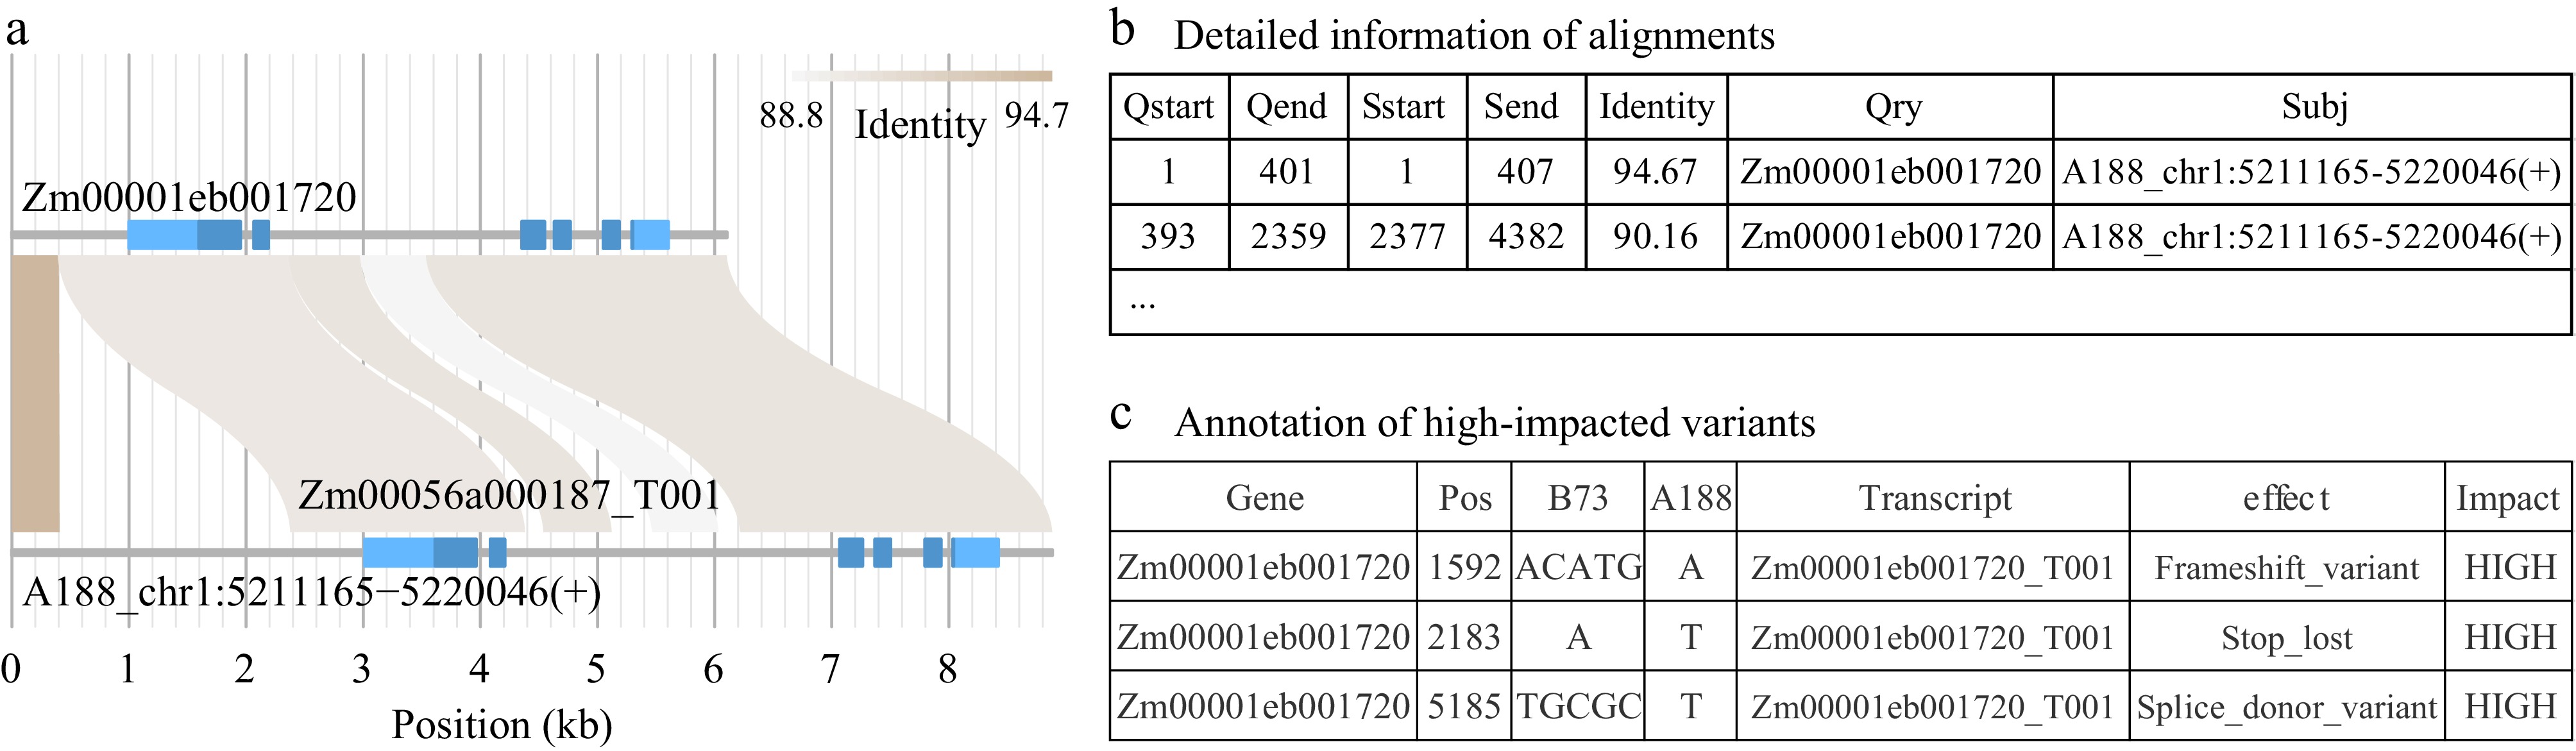
Figure 4.
Partial outputs from module homomine. (a) Homomine searches homologous sequences of a query gene Zm00001eb001720 in a targeted genome (A188). The flanking 1 kb on the 5’ end and 500 bp on the 3’ end are included. Homomine identifies the matching region that harbors Zm00056a000187 in the A188 genome. Light and dark blue in gene structures represent untranslated exon regions and coding regions, respectively. (b) In the homomine output, detailed alignments between the two homologs are provided. (c) The homomine output lists variants identified between the two homologs, including structural variation. Variants are annotated and moderate- and high-impacted variants are highlighted in the output. The table shows the annotation of variants with a high impact.
To facilitate the application of homomine, a web-based Shiny application for homologous retrieval and variant annotation for maize genes from the B73 reference genome was developed. The webpage (129.130.89.83:3838/maizeHM) is publicly available. Each B73 gene can be input to find homologs in 27 other maize genomes[10−12]. A HTML report is generated for each of the 27 genomes.
Genomic variation of nicosulfuron tolerance gene in multiple genomes
-
The maize gene, nsf1 or ben1, encoding a cytochrome P450 monooxygenase (CYP81A9) confers tolerance to a herbicide nicosulfuron[23−26]. The B73 allele (Zm00001eb214410) is a functional allele that contributes to the tolerance (Fig. 5a). Nineteen maize inbred lines were tested, including B73, for their sensitivity to nicosulfuron (Supplemental Table S1). Three sensitive lines were identified, namely, A188, CML228, and Il14H (Fig. 5b−d). Homomine analysis using the B73 allele as a query found that the A188 allele contains an insertion of 392 bp at the end of the first exon and that the CML228 allele contains an insertion of 5512 bp in the middle of the same exon (Fig. 5e, 5f). Both insertions were associated with the Gypsy retrotransposon and predicted to cause shifts of the open reading frames, presumably disrupting the gene function of herbicide tolerance. As compared with the B73 allele, multiple structural variation events were found in the Il14H allele, including a 120-bp insertion, a 297-bp insertion in the upstream of the transcription start site, and the absence of the partial 3’ untranslated regions (3'UTR) (Fig. 5g, Supplemental Table S2). These structural variants can also be found between at least a nicosulfuron tolerance inbred line and B73, indicating they may not be the causal variants causing the loss of herbicide tolerance (Supplemental Table S2). Two variants of Il14H exhibiting moderate impacts on the gene function are not in any of 16 herbicide tolerant lines: a SNP causing a missense alteration and a 6-bp insertion introducing a 2-amino-acid inframe insertion (Supplemental Table S2). One of the two variants is likely the causal variant for herbicide sensitivity. In this case, through using homomine, pangenome data were leveraged for exploring the genomic variation of genic regions, facilitating the association of all types of genomic variants with phenotypic data.
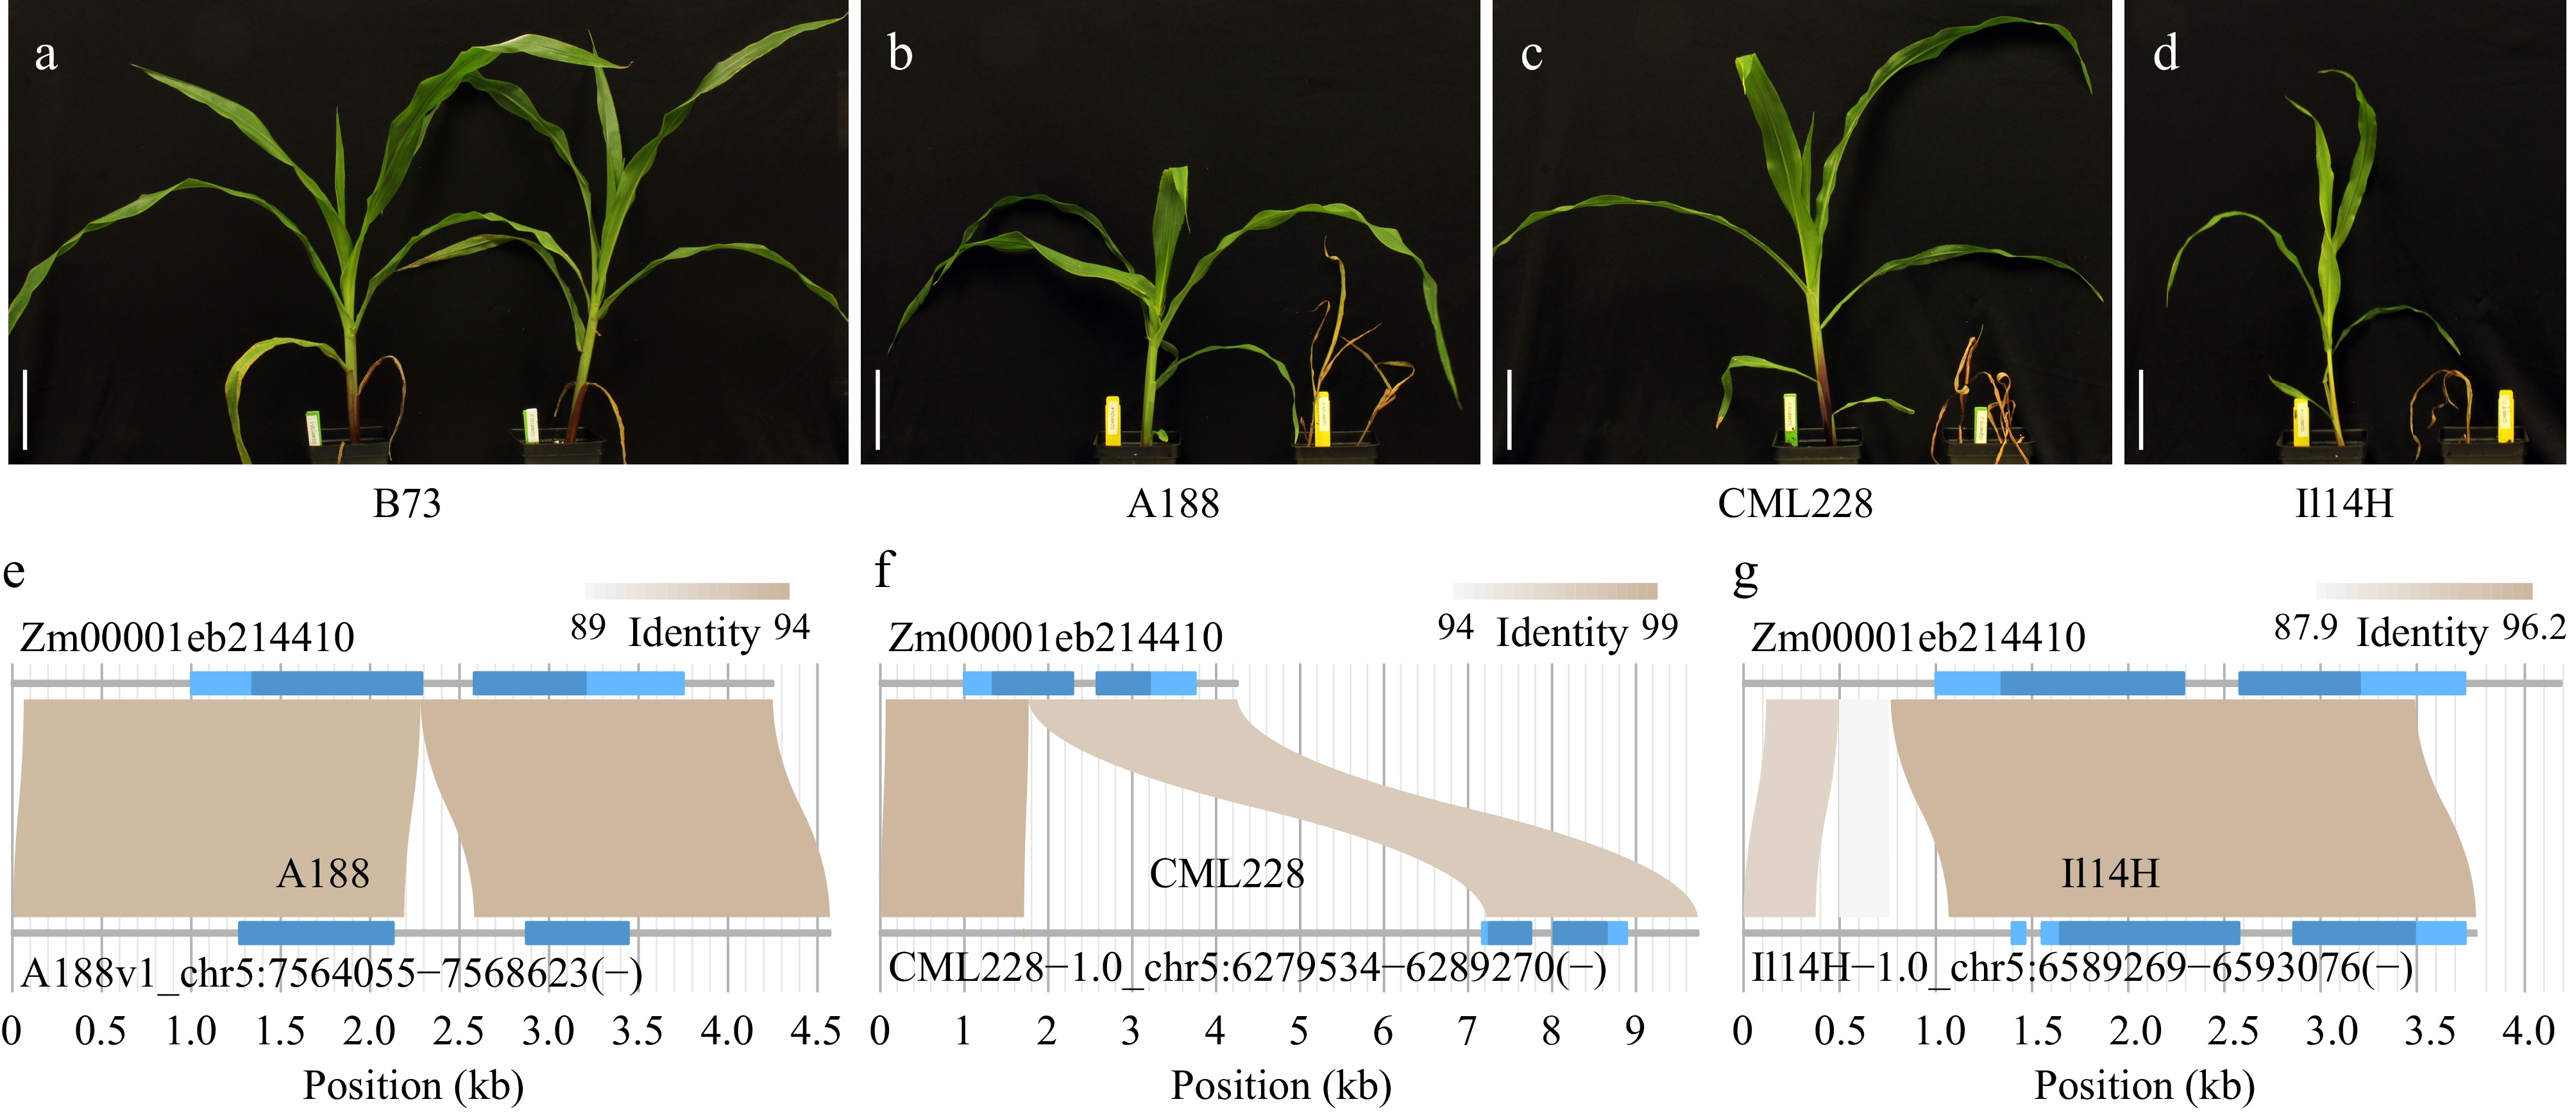
Figure 5.
Phenotypic results of nicosulfuron treatments and allelic comparisons. (a)−(d) Maize plants with nicosulfuron treatment at a dose of 137 gram active ingredient per hectare (right) and a mock treatment (left). Bar = 10 cm. (e)−(g) The structural comparison between each allele of A188, CML228, and Il14H with the B73 allele of gene Zm00001eb214410. Light and dark blue in gene structures represent untranslated exon regions and coding regions, respectively.
-
The development of Homotools was motivated by the tedious procedure for retrieving sequence data and related information of a gene from a reference genome and homologous genes from other genomes. Multiple modules have been developed to simplify identification and comparison of homologs. The tools are particularly useful for single-gene genomic studies of a species with multiple genome sequences. Genomic databases with standard formats (e.g., FASTA and General Transfer Format, GTF) are required. Therefore, the tools can be used for genomic analysis for any species. With Homotools, pangenomic data related to an input gene can be readily collected and related genomic variation, including structural variation, can be accurately identified and annotated. In addition, publishable high-resolution figures are output from Homotools. Specifically, module geneseq can extract sequences of genomic DNA, coding regions, proteins, and related transposable elements as long as databases are supplied. Modules homocomp and homomine facilitate homologous retrieval, structural comparison, and variant identification. Modules homostack and homograph graphically visualize sequential alignments and multiple sequence alignments, respectively. Because many software dependencies are required, guidance for creating a Conda environment is provided.
Modules of Homotools could be further improved to enhance computational effectiveness and efficiency. First, the mapping of a query gene to a genome and identification of homologous genes in the homocomp and homomine modules could fail due to repetitive sequences. Approximately 3% of genes are subject to this issue in highly repetitive maize genomes. The issue may be mitigated by specifying the target chromosome and/or a rough target region. Alternatively, a sophisticated algorithm such as the algorithm of CHOICE (Clustering HSPs for Ortholog Identification via Coordinates and Equivalence), for identifying homologous regions in a genome could be adapted in the future[9]. Second, the variant annotation in module homomine relies on the software SNPEff, which groups variants into high, moderate, low, and modifier impacts[22]. Most moderate-impacted variants are missense polymorphisms for which the functional impacts can be further quantified using other annotation tools including artificial intelligence (AI) based approaches developed to assess the functional impacts of missense polymorphisms[27,28]. Third, homostack performs alignments and plotting based on the order of DNA sequences that users input. Users may be uncertain about the order to input. An algorithm could be added to enable automatic ordering by determining pairwise similarities of input sequences. Fourth, homologous sequences of a gene collected using Homotools from pangenomes could be used to build a pangenome graph of genic sequences[29]. Module homograph visualizing alignments of MSA is capable of tackling simple structural variations such as insertion and deletion. Inversion and translocation would be better represented in more complex graphical structures[30]. In addition, the development of algorithms aiding in hypothesizing evolutionary trajectories, events of mutation and recombination among homologous genes would be highly valuable.
In summary, it has been shown that Homotools can be useful for readily identifying best-hit homologous genes and genomic polymorphisms at the gene level. An online application has been developed that is tailored for the maize community, with the potential to extend similar platforms to a wide range of species. As the Homotools package continues to be refined and enhanced to ensure greater reliability and efficiency, community feedback will play a vital role for future improvement. We look forward to collaborative efforts to further advance the utility of this tool.
-
The authors confirm contribution to the paper as follows: herbicide tolerance experiment design and conduction: Liu H, Adesina O, Singh R, Jugulam M; Homotools use and test: Liu H, Adesina O, Bika R; Homotools package development: Liu S; draft manuscript preparation: Liu H, Liu S. All authors reviewed and revised the manuscript.
-
All related scripts have been deposited at GitHub (liu3zhenlab/homotools).
We thank Jinliang Yang at the University of Nebraska-Lincoln and Won Yim at the University of Nevada for valuable suggestions. We thank funding provided by the USDA NIFA award (2018-67013-28511 and 2021-67013-35724), the NSF awards (1741090, 2011500, and 2311738) and the Department of Energy award (DE-SC0023138). This is a contribution 25-016-J from the Kansas Agricultural Experiment Station, Manhattan, Kansas (USA).
-
The authors declare that they have no conflict of interest. Dr. Sanzhen Liu is the Editorial Board member of Genomics Communications who was blinded from reviewing or making decisions on the manuscript. The article was subject to the journal's standard procedures, with peer-review handled independently of this Editorial Board member and the research groups.
- Supplemental Table S1 Sensitivity of various maize inbred lines to nicosulfuron.
- Supplemental Table S2 Genotypes of genomic polymorphic sites in and around Zm00001eb214410 between Il14H and B73 in other inbred lines%.
- Supplemental Dataset 1 Homomine report of Zm00001eb001720.
- Supplemental File 1 Example codes to illustrate the usages of five modules.
- Copyright: © 2024 by the author(s). Published by Maximum Academic Press, Fayetteville, GA. This article is an open access article distributed under Creative Commons Attribution License (CC BY 4.0), visit https://creativecommons.org/licenses/by/4.0/.
-
About this article
Cite this article
Liu H, Adesina O, Bika R, Singh R, Jugulam M, et al. 2024. Homotools: a suite of genomic tools for homologous retrieval and comparison. Genomics Communications 1: e002 doi: 10.48130/gcomm-0024-0002 

Homotools: a suite of genomic tools for homologous retrieval and comparison
- Received: 07 August 2024
- Revised: 04 September 2024
- Accepted: 04 September 2024
- Published online: 19 September 2024
Abstract: Genome sequencing and assemblies offer fundamental data for comprehensively exploring genomic variation among individuals. Genomic variation in genic regions is of particular interest. However, identifying homologous genes or sequences and DNA variation, including structural variation, from multiple genomes is a tedious process. Here we present the software package Homotools which includes multiple modules for retrieval of best-hit homologs, variant discovery, variant annotation, and visualization of structural comparison. These modules facilitate all these processes and leverage genomic resources for single-gene studies. The tools can be used for any species as long as assembled genomes and their genome annotations are available. In a case study using Homotools, it is shown that tolerance to the herbicide nicosulfuron is associated with multiple independent genomic variants found in various maize inbred lines, including structural variants due to insertions of transposable elements. The results from Homotools generate valuable testable hypotheses for further examination. Scripts of all modules are publicly available in GitHub (liu3zhenlab/homotools).
-
Key words:
- Comparative genomics /
- Genome variation /
- Structural variation